Submitted:
07 August 2024
Posted:
08 August 2024
You are already at the latest version
Abstract
Senolytic and senomorphic therapies gain more and more attention in the last decade. This kind of therapy is based on the killing of cellular senescent cells without harming the “normal” cells. Ageing is not a disease. Clinical studies on healthy people will be difficult to conduct. Therefore, one possibility is to draw on the large repertoire of medicinal plants and use their sneolytic properties to provide mild, anti-ageing therapies. Chamomile, goldenrod, reishi and green tea were tested for their ability to trigger senolysis quercetin was used as control substance. Cellular senescence was induced with 25µM etoposide in human dermal fibroblasts and established for at least 14 days. The plant extracts were tested for their antioxidant potential (DPPH assay) and their polyphenol content. Senolysis was determined by presto blue assay of young and etoposide-induced senescent cells, and ß-Gal assays were also performed. The senomporphic properties of the plants were investigated using IL-6 ELISA and qPCR. It turned out that chamomile triggers a kind of cytokine storm and causes the cytokine values in the Elisa and in the qPCR to rise extremely, and other senescence-associated phenotype (SASP) markers were also elevated. Goldenrod and quercetin tend to have a senolytic and senomorphic effect respectively. Regarding the senolytic and senomorphic properties of herbs, we have found that all tested herbs can have a senolytic effect, and a senomorphic effect of quercetin has also been uncovered. With regard to the effect of chamomile, however, we can say that seemingly harmless tea products may have harmful effects, especially in combination with chemotherapy, at least in cell culture experiments.
Keywords:
inflammation
; herbal extracts
; senolytics
; senomorphics
; chamomile
; etoposide
1. Introduction
Cellular senescence is a state in the fate of cells first discovered by Hayflick and Morehead [1,2]. Originally, cellular senescence was described as an irreversible growth arrest, which appears to serve as a mechanism to prevent cancer. Cells enter this state when exposed to oncogenic stimuli, telomere shortening or (sublethal) stress [3]. This growth arrest is primarily induced by two tumor suppressor pathways, p53/p21 and p16INK4a/pRB. Additionally, there are extensive changes in chromatin organization and gene expression. Furthermore, these cells exhibit a distinct phenotype characterized by enlarged and flattened morphology and increased senescence-associated β-galactosidase (SA-β-gal) activity [4].
One notable change is the senescence-associated secretory phenotype (SASP), characterized by the secretion of numerous proinflammatory cytokines, chemokines, growth factors, and proteases. The SASP is not only involved in the development of cancer but also in its prevention[5]. Additionally, the SASP contributes to a systemic inflammatory state of aged humans and aging associated diseases.
Cellular senescence can also be seen as a stress response involving at least three interacting signaling pathways: Firstly, ongoing DNA damage response (DDR), which can be triggered by shortened telomeres, for example. Secondly, senescence-associated mitochondrial dysfunction (SAMD), activated by the DDR and characterized by reduced respiratory activity, decreased membrane potential, and increased mitochondrial ROS production and finally, the senescence-associated secretory phenotype (SASP), as mentioned previously [6].
Senescent cells persist within the organism and maintain the potential to modulate the tissue microenvironment [7]. Additionally, senescent cells exhibit increased resistance to apoptotic stimuli compared to their non-senescent counterparts [8]. This enhanced survival capacity of senescent cells is mediated by the upregulation of anti-apoptotic pathways, which allow them to persist within the tissue microenvironment [9].
There is strong evidence that senescent cell burden correlates with aging associated diseases [10,11]. In response to the endurance of senescent cells and their potential detrimental effects, a new pharmacological strategy has emerged, known as senolytics. Senolytics are agents that selectively eliminate senescent cells by targeting the anti-apoptotic pathways that confer their resistance to cell death [12]. By selectively clearing senescent cells, senolytics aim to mitigate the adverse consequences associated with the accumulation of these cells during aging and in age-related diseases [13].
The development of senolytic drugs represents a promising approach for the treatment of various age-related pathologies [14], as the selective elimination of senescent cells has been shown to alleviate disease symptoms and improve tissue function in preclinical models [15]. By targeting the underlying cellular mechanisms that contribute to the persistence of senescent cells, senolytics offer a novel therapeutic strategy to address the complex challenges posed by age-related diseases [16].
A second approach is the prevention of the negative effects of the senescent cells. Here medicines that target the SASP is one approach to alleviate the detrimental influence of senescent cells. These medicines are called senomorphics. Senomorphics are a class of agents that can modulate the phenotypes of senescent cells to resemble those of young cells without inducing apoptosis [17]. Unlike senolytics, which selectively eliminate senescent cells, senomorphics aim to sup-press the harmful effects of the senescence-associated secretory phenotype (SASP) by inter-fering with senescence-related signaling pathways [18,19].
Senomorphics target various signaling cascades involved in cellular senescence, such as: Mitogen-activated protein kinases (MAPKs), Nuclear factor-kappa B (NF-κB), Mammalian target of rapamycin (mTOR) and Interleukin-1α (IL-1α). By modulating these pathways. As already mentioned, senomorphics can suppress the pro-inflammatory SASP without causing senescent cell death [19,20]. This approach may be particularly useful in situations where complete senescent cell clearance is undesirable or impractical.
Researchers are developing new clinical trial paradigms to evaluate the efficacy of senolytics and other interventions targeting fundamental aging processes. Traditional trials rely-ing on long-term endpoints like lifespan or health span are often infeasible due to extend-ed timelines and logistical challenges. Unfortunately, elderly subjects are generally excluded from clinical trials [21].
Examining the impact on the development and progression of multiple age-related dis-eases can provide insights into the broader effects on overall health and resilience. Accelerated aging models like progeria syndromes enable studying rapid manifestation of age-related phenotypes to potentially slow or reverse underlying aging mechanisms. Focusing on diseases characterized by localized senescent cell accumulation allows investigating the ability of senolytics to selectively eliminate senescent cells and mitigate their detrimental effects. Trials are exploring the use of these interventions in potentially fatal dis-eases closely linked to senescent cell accumulation, aiming to improve outcomes and ex-tend lifespan in affected individuals. Measuring functional capacity, physical performance, and resilience can provide insights into the potential of these therapies to maintain quality of life and independence in older adults. These emerging paradigms represent a shift in evaluating interventions targeting fundamental aging mechanisms. By assessing a range of age-related outcomes and conditions, researchers can gain a more comprehensive understanding of the potential benefits and applications of these innovative therapies [21].
Apart from this, one further possibility is, searching for senolytic activity within medi-cines that have been used by humans for a long time. An example might be the applica-tion of herbal medicines that might have senolytic and or sneomorpic effect and a positive effect for health span. Substances derived from herbs like quercetin or fisetin are intensive-ly studied in this regard [22,23,24], but it makes also sense to use extracts of parts of plants or the whole plant. These herbal medicines are evaluated for hundreds of years, there is a lot of experience regarding medical herbs and their dosage and application, and they are easier to apply regarding regulatory requirements because of this long use.
Some extracts do already have proven effect on aging organisms like green tea [25] and goldenrod [26]. A further often consumed tea is chamomile tea which has known anti-inflammatory effects [27,28,29,30,31,32] Also reishi mushroom, the mushroom of eternal life, is used for treating elderly people in traditional medicine [33]. Active molecules include glycoproteins, polysaccharides, triterpenoids, steroids, and alkaloids, amongst many others. Apart form this, literature lacks systematic investigations regarding senolytic and senomorpic effects of these extracts. We used commonly available herbal preparations, bought in a drug store for our investigations. We aim to test everyday usage of extracts on primary cells (human dermal fibroblast cells) which are the most frequently used models for cellular aging.
2. Results
2.1. Definition of Reagents
2.1.1. Herbal Extracts and Solvents
Anti-oxidative potential of different extracts was evaluated by DPPH assay and compared to antioxidants ascorbic acid (vitamin C), TEMPO and gallic acid. As expected, the reishi mushroom shows the least anti-oxidative potential followed by the goji berry also turmeric is a little less anti oxidative than chamomile. Goldenrod and even more green tea have an antioxidant potential comparable to TEMPO. Ascorbic acid and gallic acid show a response at very low concentrations (Figure 1 a.)
EC50 values are for reishi 1569 µg/ml, goji berry 1083 µg/ml, goldenrod 57.89 µg/ml, turmeric 714 µg/ml, TEMPO 19.82 µg/ml, vitamin C 4.039 µg/ml, green tea 21.87 µg/ml, chamomile 285.2 µg/ml, and gallic acid 1.688 µg/ml see Figure 1 b.
Polyphenol content was assayed by the Folin–Ciocalteu method green tea has a polyphenol content of 66.50 +/- 6.308 mg gallic acid equivalents (GE)/g (herb or mushroom used for preparing the extract) and chamomile 12.09 +/- 1.615 mg GE/g furthermore reishi has least content with about 2.947 +/- 0.08622 mg GE/g finally goldenrod 16.97 +/- 2.638 mg GE/g Figure 1 c.
Additionally, the optimal solvent concentration was determined by serial dilutions of purified water and ethanol (100%) in culture medium by a XTT assay. So, we determined the maximum concentration of solvent added to the cells in our experiments. These concentrations were: for ethanol 1,5 % and for water 10%
2.1.2. Cell Lines and Establishment of the Senescent State
Growth curves of cell lines were established for CL1 (EverCyte HDF164) and CL2 (ATCC) published in Kühnel et. al [34] all experiments were performed at, at least 50% before the end of their replicative lifespan (replicative senescence (RS)). CL1 was growing faster than CL2 which has a quite low doubling rate both cell lines were passaged for about 40 population doublings, CL2 did not reach RS in the time it was cultivated (Figure 1 a).
The etoposide induced senescence (ES) was investigated with a XTT assay to show growth arrest. While growth control continued to grow up to an absorption of above 2 and reached confluence, the etoposide (25 µM) treated HDF-cell line stopped to grow after a treatment for 48 h. Data presented are form CL1 but growth curves and XTT assays were also performed with CL 2 with the same results [34]. Detailed evaluation of etoposide premature senescence model can also be found in our previous work [34].
2.2. Toxicology of Herbal Extracts
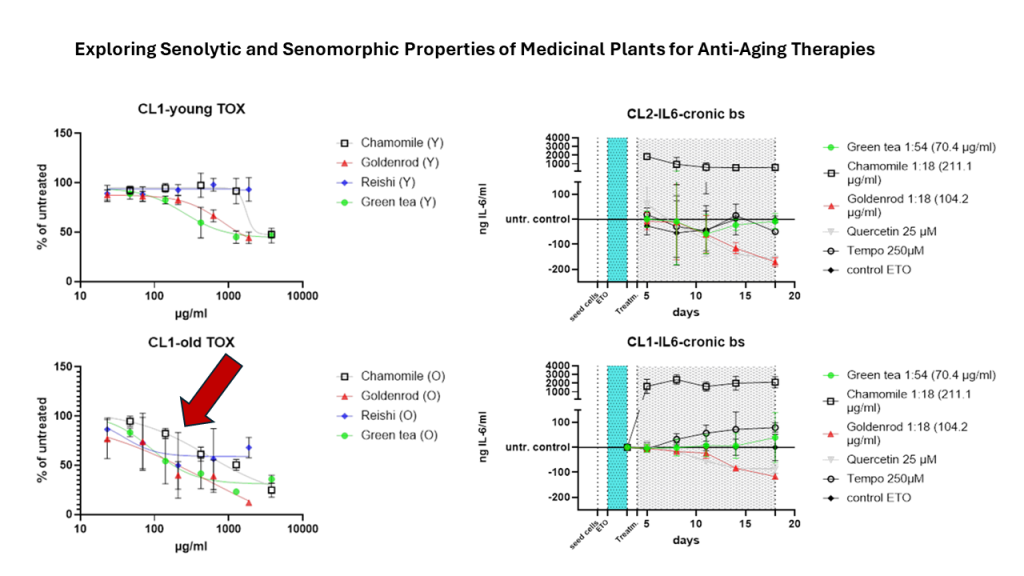
Toxicology was assayed by presto blue assay. Cells with low passage number (Y) were seeded in a 24 well format and 6 different concentrations were tested in duplicates in three independent experiments. Control cells that were untreated were set as 100 % and the rest of the samples was related to that (% of untreated = value of treated / value of untreated * 100). Young cells were affected by herbal extracts but reishi showed no effect (Figure 3 a). Figure 3 b is showing the same experiment with etoposide induced senescent cells. Cells were treated with extracts 12 days after end of etoposide treatment (two days) and extracts were left on cells for 48 h. A clear shift to the lower left can be seen, indicating higher toxicity at lower concentrations.
Looking at each herbal extract separately Figure 3 c-f are uncovering a slight senolytic effect of all extracts. Concentrations for further treatment were determined by looking at the least nontoxic condition in young cells marked by a dotted line at the corresponding concentration level.
Figure 3 g is presenting the IC50 values in a column graph. Same treatment was also performed with SA-ß-Gal staining as final readout. This analysis showed that young cells, as expected, have a lower percentage of SA-ß-gal positive cells. At higher concentrations some of the old cells died. For this reason, some of the lines (old and young cells) were not continued at higher concentrations. Interestingly the mushroom extract shows decreasing percentage of senescent cells. We will look at these effects in a further study investigating the effects of reishi in more detail.
What clearly can be seen is that IC50 values decrease when old cells are treated with herbal extracts and mushroom extract there is a clear window opening (EC50 (Y) – EC50 (O)) up between young and old cells. The largest window is formed by chamomile treatment (1185,2 µg/ml) but also goldenrod is having a senolytic effect with 311,1 µg/ml difference between young and old green tea is showing a difference between old and young of 158,13 µg/ml which is the lowest senolytic effect what can also be seen in Table 1.
2.3. Chronic Extract Treatment Cell Line 1
2.3.1. IL-6 Secretion (SASP Formation)
IL-6, the most prominent and dominant protein of the SASP for human dermal fibroblasts according to our own data [34], was tested by ELISA. IL-6 values expressed in ng IL-6/ml.
The course of treatment can be seen in Figure 4. The following treatments in Figure 5 a were carried out: green tea in a concentration of 70.4 µg green tea /ml, which corresponds to a dilution of the original extract of 1:54. Furthermore, chamomile was used, here 211.1 µg chamomile flowers /ml were used, which corresponds to a dilution of 1:18. Goldenrod with a concentration of 104.2 µg/ml (also 1:18). A 25 µM quercetin solution was tested as a positive control and pure substance, and Tempo with 250 µM was tested as a control for antioxidant effects. As a control, cells were treated only with etoposide and received no extract or substance treatment (instead of herbal extracts only the vehicle (water a concentration of 10%) was added) to this control was normalized in Figure 5 b.
Green tea (green dots) shows almost no difference to the control (black angled cubes) without plant extract. The chamomile (black cubes without filling), however, shows a massive increase in IL-6 concentration in the supernatants of the cell culture. The goldenrod (red triangles) shows a decrease in IL-6 concentration, but this seems to be due to a senolytic and not a senomorphic effect, as can be clearly seen from the reduced cell density on days 11 and 18 in Figures 7 & 8. Quercetin (gray triangles) has a senomorphic effect in our set up and decreases IL-6 concentration compared to control without extracts.
To make the effects more visible (Figure 5 b), the treatments were related to the control at each timevpoint that was not treated with extracts or pure substances. The effects are more visible here. You can clearly see that the chamomile (squares without filling) triggers a massive IL-6 reaction. a slight increase in IL-6 is also caused by the antioxidant (circles without filling). In this illustration you can also see better that the green tea (green dots) hardly reacts differently than if no extract is used, only the value after 18 days is increased. the effects of goldenrod and quercetin have already been described in detail in the abstract above, but are also better recognizable in this illustration. All experiments were confirmed with a second cell line (CL2) and the data can be found in Figure 6 a and b. The patten of timecourse looks a little different but the main outcome is the same: chamomile is massively inducing IL-6 (SASP). Quercetin has a senomorpic effect on the CL2 as well.
2.3.2. Cell Confluency and Morphology
Figure 7 shows shape, density and morphology of cells in representative images. Cell line 1-control, which was treated with etoposide but did not receive any herb or pure substance treatment, is in the uppermost row. Cells are arrested in growth and do not get dense in the time period of 18 days, while confluency of cells stays nearly the same. In contrast, row two (cells treated with goldenrod), shows a clear decrease in density on day 11 and 18. This explains the reduction in IL-6 measured by ELISA as mentioned in the section before. All the other treatments chamomile, quercetin, green tea and tempo show the same morphology, shape and confluency like the control cells. All experiments were confirmed with a second cell line (CL2) and the images can be found in Figure 8.
2.3.3. qPCR Investigations of SASP Related mRNA Expression
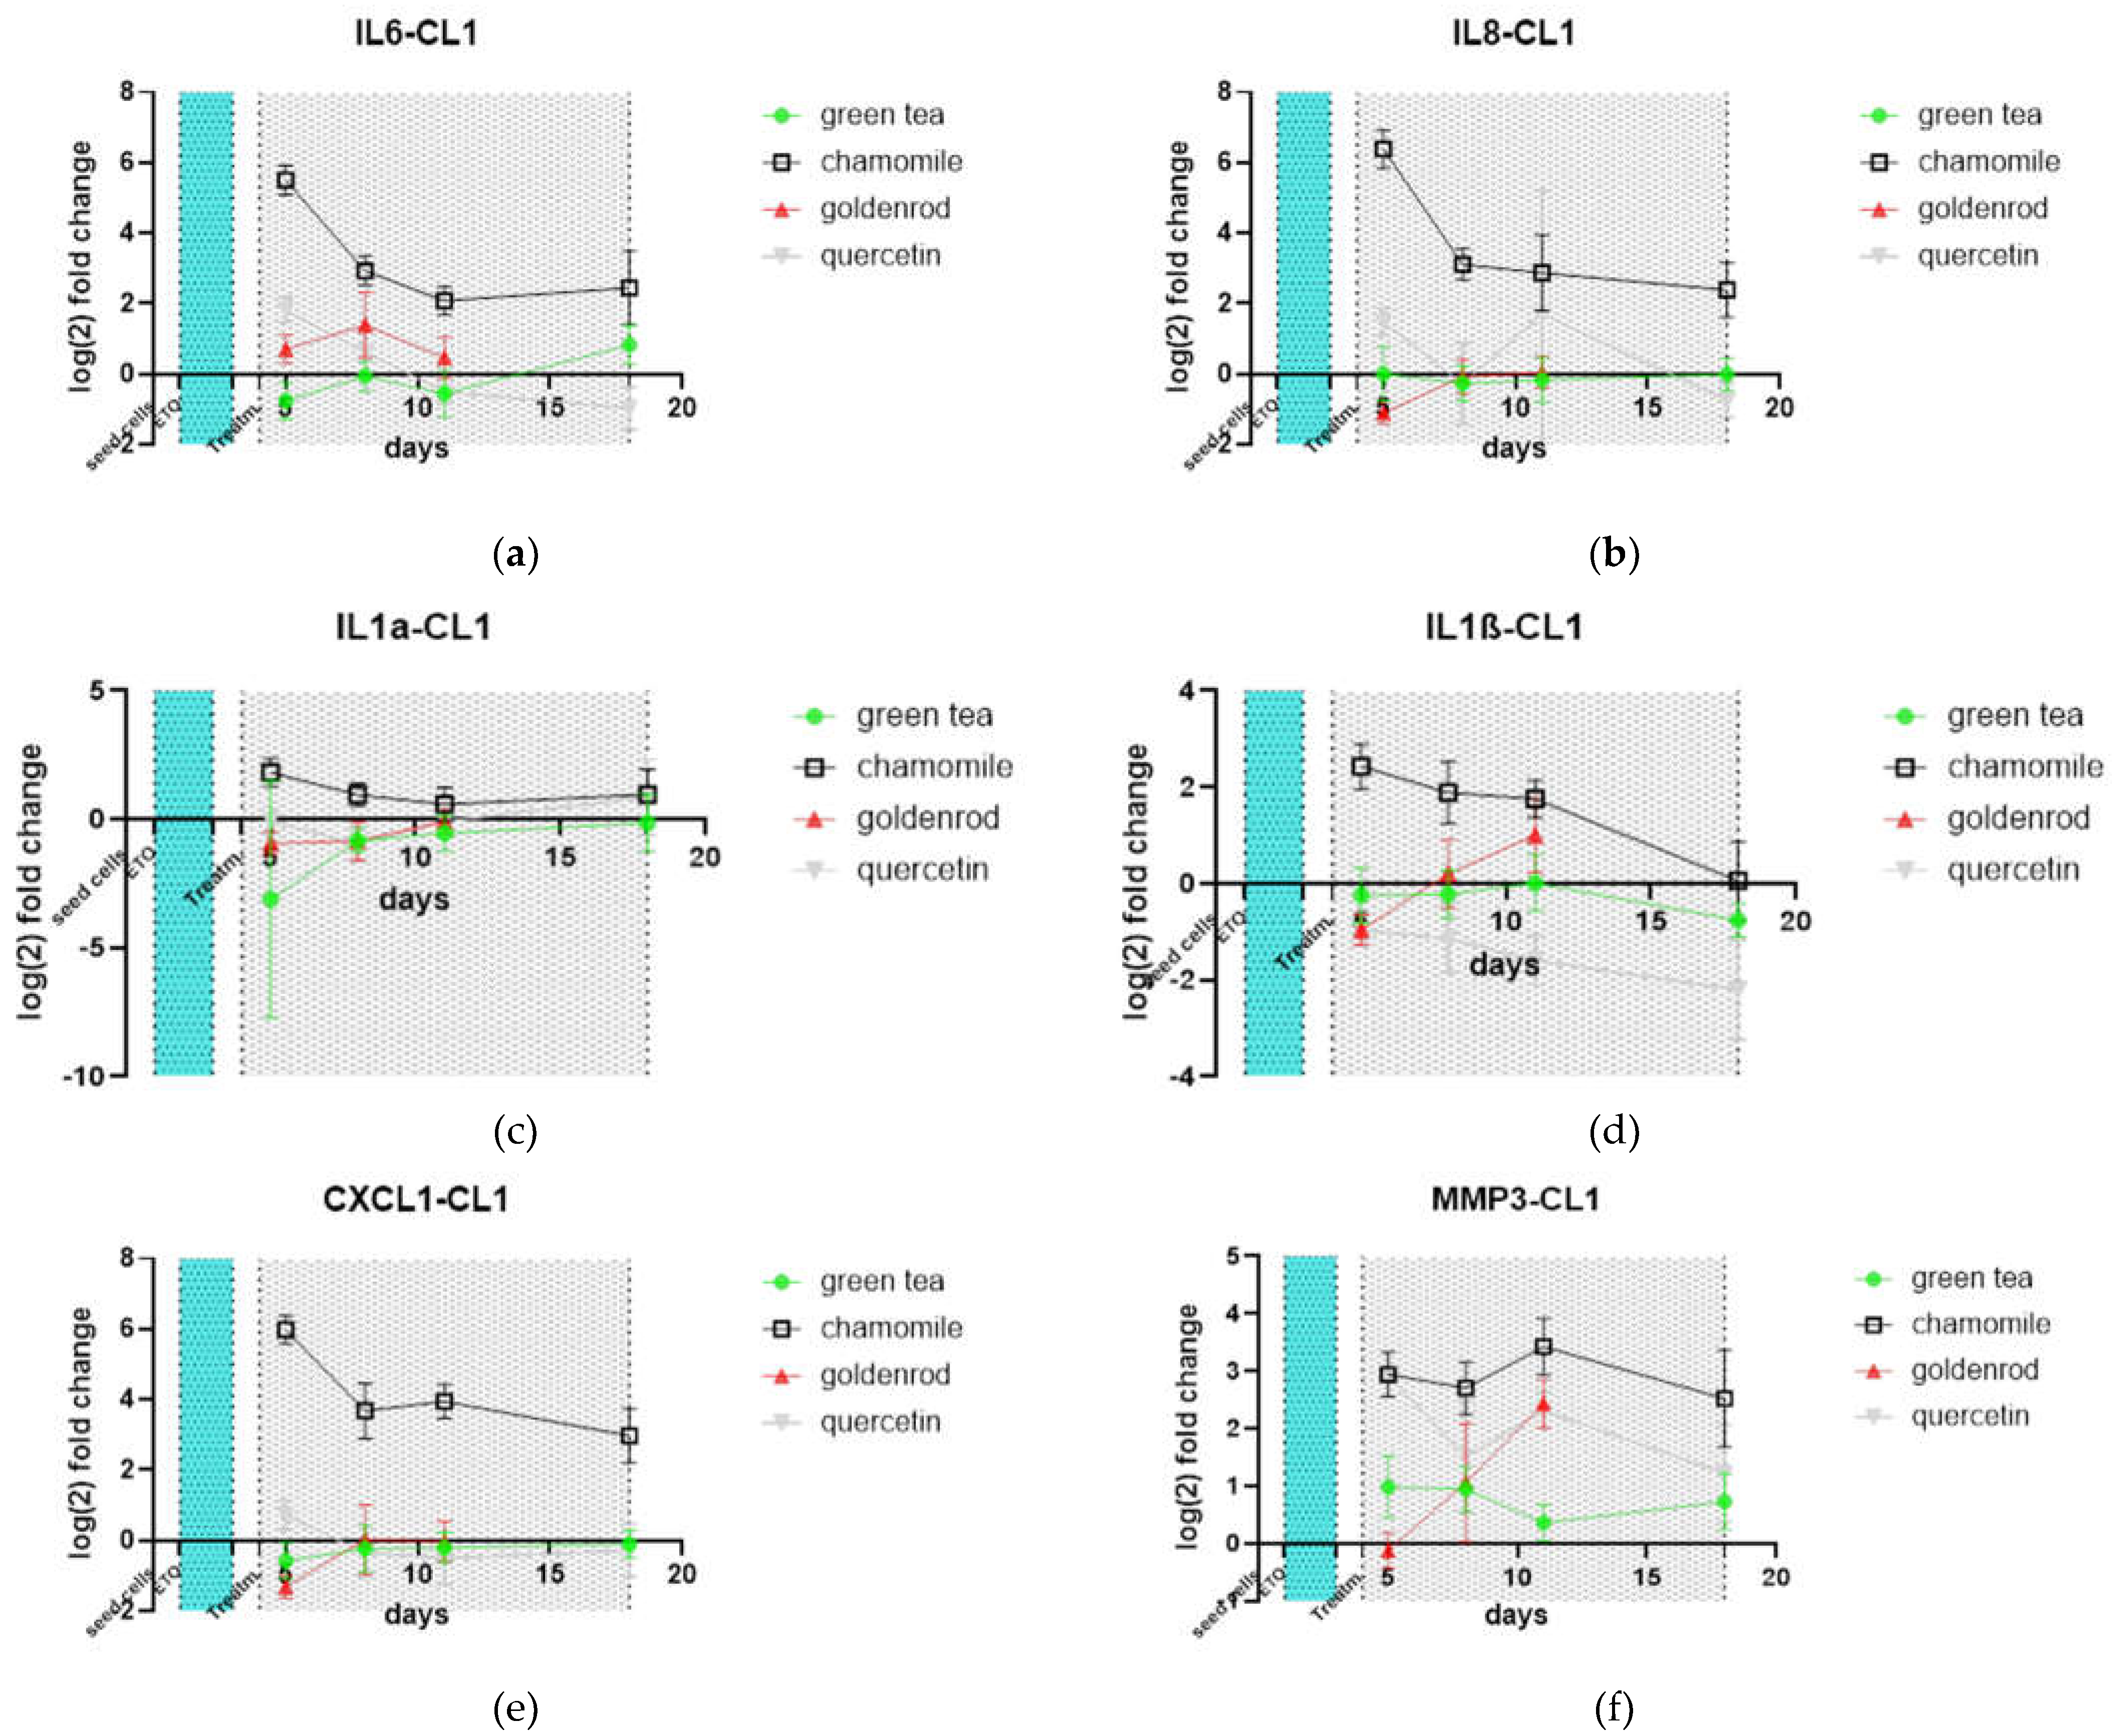
Important molecules of the SASP were investigated by qPCR on mRNA expression level. Levels of SASP factors were normalized to control (not extract treated) to make effects more visible. IL-6 is upregulated also on the mRNA level by chamomile treatment, as expected (Figure 7 a). Furthermore, IL-8, IL-1a and ß and CXCL-1 are also increased (Figure 7 b-e). MMP3 as a representative of Metalloproteases is also increased by chamomile treatment. For the other herbs and pure substance there is no pronounced difference to control treatment except quercetin, which also shows an induction of expression of this metalloprotease. The quercetin treated group shows decreased Il-1ß expression at all timepoints. The late timepoints of goldenrod were not plotted because of little cell number by their senolytic effect as can be seen in Figure 7 and Figure 8.
Figure 9.
SASP factors determined by mRNA qPCR: (a) IL-6; (b) IL-8; (c) IL-1a; (d) IL-1ß; (e) CXCL1; (f) MMP3. Values are normalized to control (not extract treated). Day 18 of goldenrod was not included because of not reliable data according to little cell number.
Figure 9.
SASP factors determined by mRNA qPCR: (a) IL-6; (b) IL-8; (c) IL-1a; (d) IL-1ß; (e) CXCL1; (f) MMP3. Values are normalized to control (not extract treated). Day 18 of goldenrod was not included because of not reliable data according to little cell number.
2.3.4. Cell Line 1 Receptors
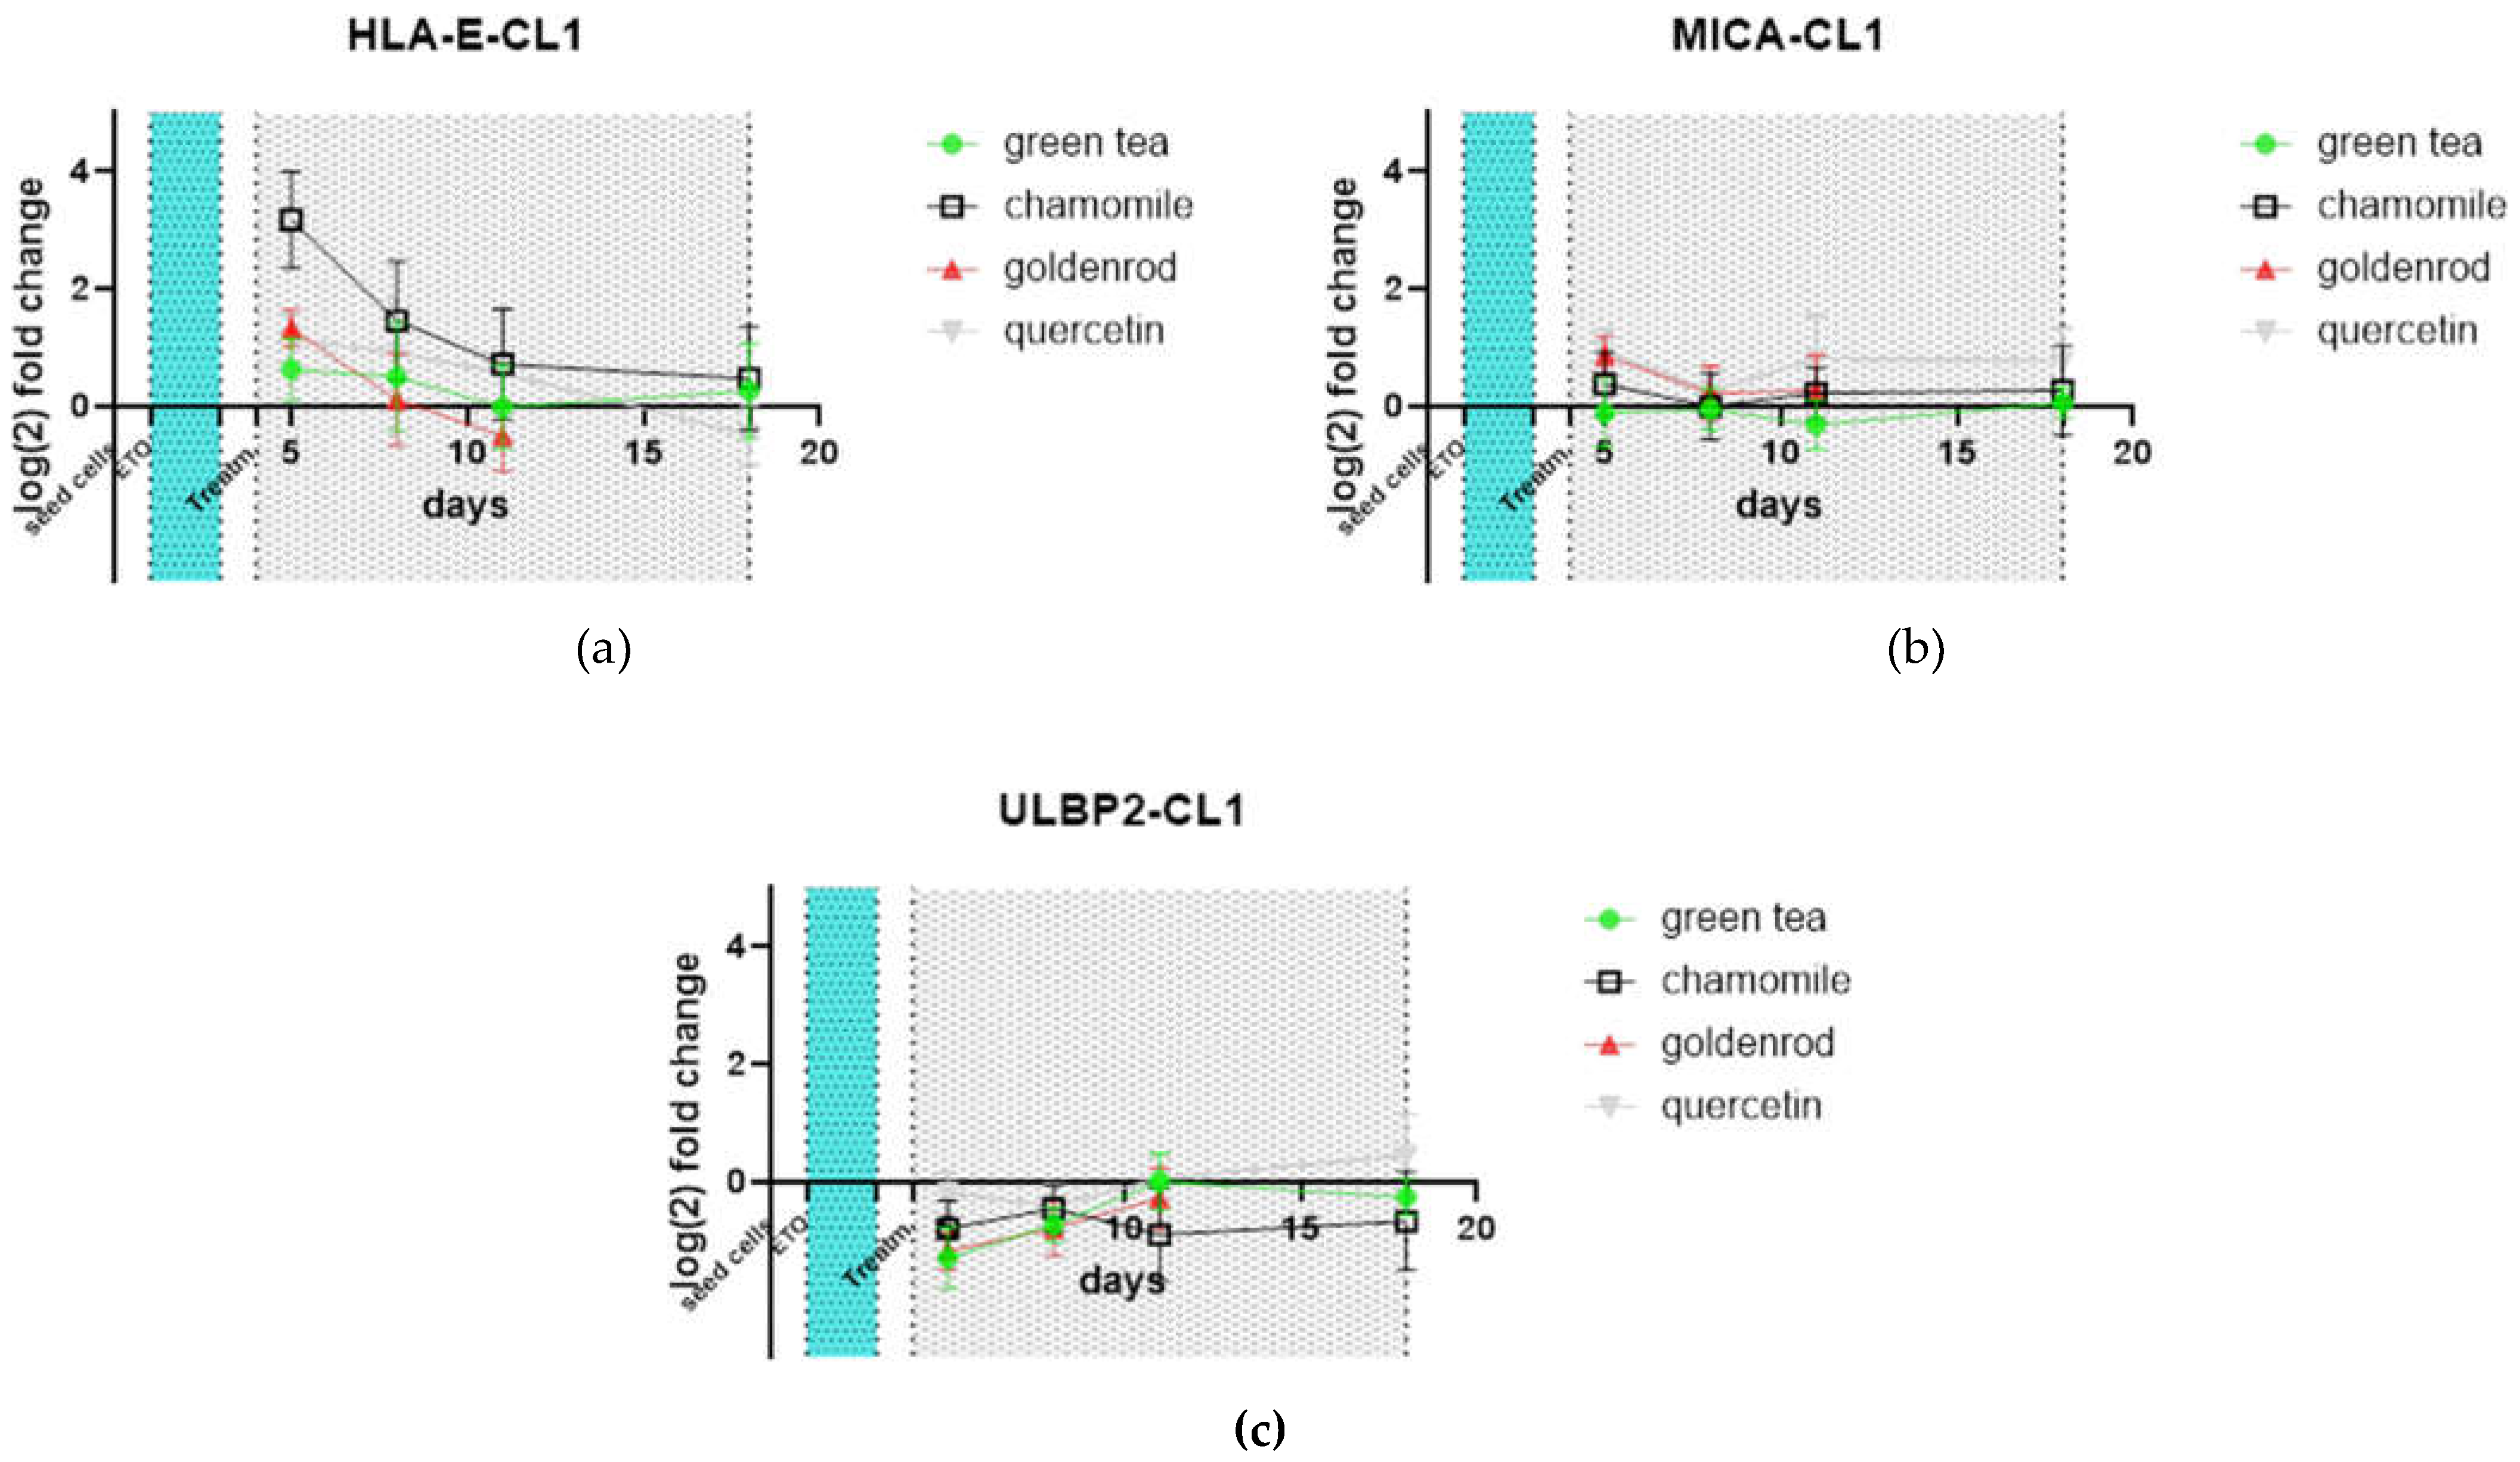
Relevant receptors for immune surveillance and NK-cell degradation were also tested by qPCR. HLA-E is upregulated by chamomile treatment, the other extracts do not show any pronounced reaction. All treatments did not alter the expression of MICA and ULBP2 compared to non-extract-treated control. All values were again normalized to non -extract-treated control.
Figure 10.
Receptor expression of mRNA analyzed by qPCR: (a) HLA-E; (b) MICA; (c) ULBP2.
2.3.5. Senescence Related Genes (CL1)
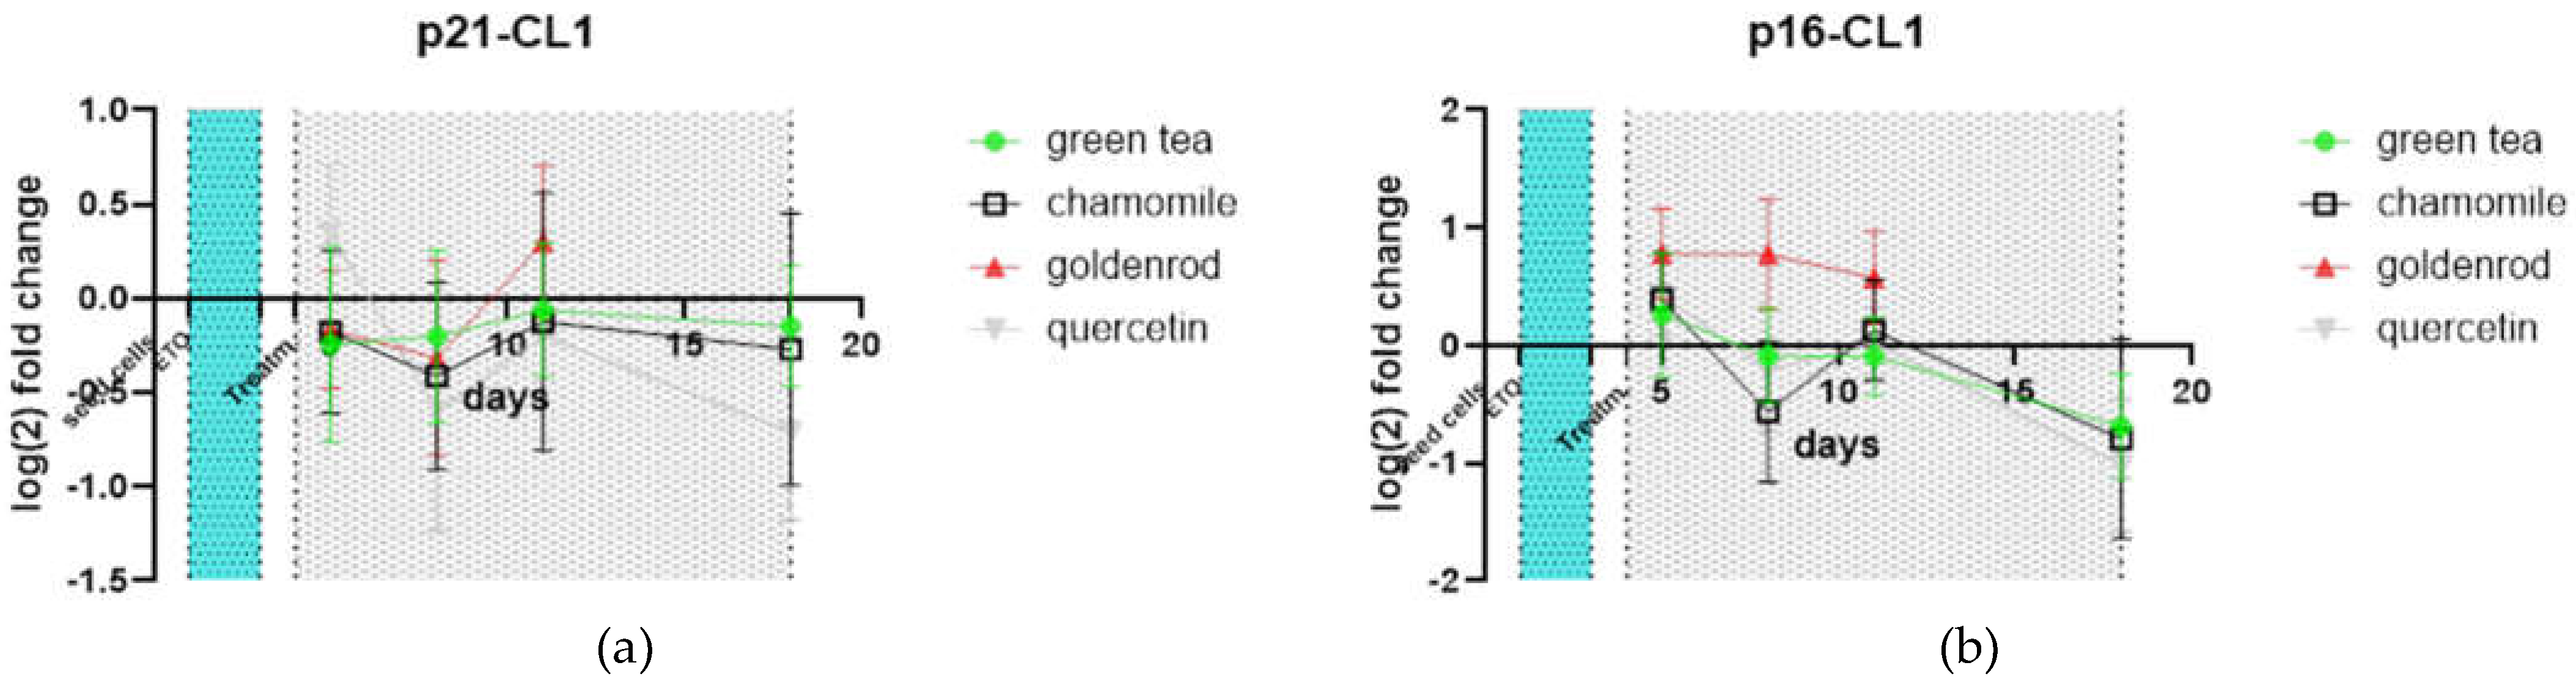
There is nearly no difference to non-extract-treated control in p21 and p16. All treatments show a comparable expression of this cell cycle related genes.
Figure 11.
Senescence related genes (a) p21 and (b) p16 values were normalized to non-extract-treated control.
Figure 11.
Senescence related genes (a) p21 and (b) p16 values were normalized to non-extract-treated control.
2.4. Early and Late Treatment with Herbal Extracts
Additional treatments were performed. non-chronical extract treatment was done with an early pulse of extracts for 3 days after etoposide treatment (light blue area in Figure 12 a). Chamomile treatment upregulates IL-6 protein expression again, both dilutions (1:9 and 1:18) 211.1 µg/ml and 422.2 µg/ml respectively are increasing the IL-6 value measured by ELISA above 1000 ng IL-6/ml in both cases. The IL-6 concentration of the 1:18 treatment returns to the level of the other treatments after 18 days, the 1:8 treatment stays a little bit higher. The other herbal treatments show a similar behavior like the water control (non-extract-treatment). Here, we included an ethanol control where we treated the cells with the same ethanol concentrations as we did in the goldenrod treatment. For better visualization of effects, we subtracted the non-extract-treated control (water control) as can be seen in Figure 12 b. All extracts except chamomile are in the region of control treatment and do not show notable senomorphic effect by this type of treatment.
The late treatment in Figure 12 c which shows the reaction of already senescent cells was performed only once in triplicate, but chamomile also showed increased values of IL-6 also in this kind of treatment but with a huge standard deviation.
3. Discussion
Definition of reagents was done by DPPH assay and Folin-Ciocalteu assay for better understanding of herbal and fungal properties. DPPH assay experiments have given an impression of the antioxidant potential of plant and mushroom extracts. Antioxidants can act as senomorphics, i.e. they can modulate the senescence phenotype, including the SASP. Antioxidants such as enzymes, mitochondria-targeting compounds, vitamins, carotenoids, organosulfur compounds, nitrogen-containing non-protein molecules, minerals, flavonoids and non-flavonoids have been studied for their potential to counteract oxidative stress-induced senescence and modulate the SASP [35]. We used the antioxidant Tempo as an antioxidant-control in our experiments to study this effect. In our study, however, Tempo showed hardly any senomorphic activity.
Polyphenols are important substances in the fight against cellular senescence. For this reason, we have measured the polyphenol content of our extracts. As expected, the Folin-Ciocalteu assay shows hardly any reaction in the mushroom extract, but in green tea there are a lot of polyphenols present, but here too no direct correlation can be found between polyphenol content and senolytic or senomorphic effect. Herbal preparations with high polyphenol content can also harm normal cells [36], especially in organs which are exposed to higher concentrations of extracts like the skin or the digestive system.
We used two primary human dermal fibroblast cell lines for checking the senolytic and senomophic effects of extracts. HDF164 obtained from EverCyte (CL1) were used in a patent (EP3643305A1) and the HDF form ATCC (CL2) were described in our former publication in detail [34]. Fibroblast cells of the skin are the most investigated model for cellular senescence and are used in this regard since 1961 [1,2]. Because of the extremely long period of passaging the cells to induce replicative senescence we were stressing the cell with chemotherapeutic etoposide to induce premature senescence. Etoposide is a topoisomerase II inhibitor and a known inducer of senescence [37] and SASP [38]. Studies on replicative senescent cells and extract treatment would be very interesting but were out of focus of this work. The effect of freshly damaged cells and the development of the SASP was in focus of this work. This research can also shed light on effect that might occur during and after chemotherapy [39].
Therefore, we tested tree different treatments the chronical treatment which we laid most focus on, an early and a late treatment.
The chronical treatment was performed with two cell lines and in three independent experiments, each. These time-consuming experiments were performed this way because we think that establishment of senescent state needs some time like it was realized in the study of Lämmermann et al.[40]. Often, studies on “senescent” cells are performed 1-3 days after exposure to damaging treatment [41,42]. We do not think that is appropriate and especially the SA-ß-Gal assay is often false positive when applied short time after damaging treatment (for example with hydrogen peroxide) [43]. For this reason, we try to prolog the time for establishment of senescence to at least 14 days. Unfortunately, we did not measure exact cell numbers in our chronic treatment experiment but the images in Figure 7 and Figure 8 are representative and reflect the confluency and shape of the cells at the timepoints indicated. Furthermore, we well defined the process of getting senescent after etoposide treatment in our former study [34].
For interaction of etoposide with herbal extracts there is known that herbal extracts can also increase the toxicity of chemotherapeutics like etoposide [44]. Some polyphenols found in herbal extracts can modulate etoposide-induced apoptosis. For example, resveratrol increases etoposide-induced apoptosis in certain cancer cell lines [45]. Some polyphenols like quercetin can inhibit etoposide-induced Checkpoint kinase 1 (Chk1) phosphorylation [45], which is part of the DNA damage response as well as etoposide induces cell death via mitochondrial-dependent actions. Some herbal extracts may interact with these pathways, potentially enhancing or modulating the effects of etoposide [46]. These effects may influence “young”-cells differently to “old”-cells, leading to senolytic and senomorpic properties reflected in our toxicity studies. In this toxicity study we compared low passage cells to etoposide induced cellular senescent cells. All extracts we tested showed some senolytic effect which confirms the data of Lämmermann et al. who investigated the potential of goldenrod ethanolic extract [26]. Green tea and its ingredients is also known as a herbal extract with protective effect on skin [47,48] and the aging brain [49,50] as well as having chemoprotective effects [51]. A study shows that doxorubicin-induced senescent fibroblasts develop a SASP and exhibit increased autophagy. Quercetin induces autophagy, increases ER stress and partially triggers the death of senescent fibroblasts [52].
The effect of chamomile instead is something that was not seen in former studies. Except one study which performed treatments of Sage (Salvia officinalis) extracts and chamomile (both 50µg/ml) in combination with IL-1ß treatment of human mature adipocytes after 4 h, where IL-6 excretion raised significantly compared to just IL-1ß treated cells. Sage even increased MCP-1, IL-6, IL-8 and ICAM-1 highly significant in neuroblastoma (SK-N-SH) cells in non-IL-1ß treated group in 4h treatment as well as MCP-1 and ICAM-1 in 24h treatment. In combination with IL-1ß treatment inflammatory markers decreased mainly [53].
The massive upregulation of all tested SASP factors by chamomile following etoposide treatment is an effect that needs further investigations. The literature is full of antioxidative, anti-inflammatory or antifibrotic properties of herbal extracts but we could not find any hint to what we observed neither with conventional literature search nor with KI supported search (perplexity). In the meantime, we have found a second herb with the same effects (Sutherlandia frutescens (L.)) but we were not able to understand the mechanism of their effect yet. By finding already two herbs that induce this phenomenon we concluded that it might be a not so uncommon effect. The effect of SASP factors secreted by fibroblast cells might have influence on cancer cells that grow near them.
Additionally, MICA is not induced compared to not-herb treated control by our treatment with chamomile (and all the other herbal treatments). In the human organism, MICA binds to NKG2D, an important activating receptor on the surface of NK cells. Also, ULBP-2, that decreases susceptibility to natural killer cell–mediated cytotoxicity is unaffected by the chamomile treatment. These two receptors would lead to removal of senescent fibroblast cells [54] Interestingly, the mediator of the opposing effect HLA-E was induced in chamomile treatment.
To sum it up, we observed an effect of an herbal aqueous extract that is inducing massive SASP protein production following a chemotherapeutic senescence induction. We do not know the mechanism yet, but we think it is worth further investigations. Regarding senolysis and senomorphic properties of herbs we found that herbs and mushroom tested can have a senolytic effect and also a senomorphic effect of quercetin was confirmed in our model. But regarding the effect of chamomile, we can say that seemingly harmless tea products can also have detrimental effects maybe especially in combination with chemotherapy what must be confirmed in in vivo studies.
4. Materials and Methods
4.1. Cells
Primary cell line 1 (CL1), HDF164 human fibroblasts from dermal tissue at a population doubling level (PDL) of 20 were provided by Evercyte. Primary cell line 2 (CL2), human dermal fibroblasts cell from ATCC at initial PDL of 7. All the cells were cultured in Growth medium (Dulbecco’s modified Eagle’s medium, prepared and sterile filtrated (0,2 µm)) containing 10% fetal calf serum (FCS), 100 U/ml streptomycin and 100 U/ml penicillin in a humified incubator at 37 °C and 5% CO2. The cells were grown until they reached 90 to 95% confluency and passaged every 3 to 4 days. The total cell count, and the viable cell count measurement was performed by Spark® Tecan microplate reader and trypan blue exclusion assay. Cell cultures were tested for mycoplasma using a MycoSPY® (Biontex) PCR detection kit. Cells were passaged three times to obtain the cell bank for experiments. For all treatments cells were seeded in density 3500 cells / cm2 in all well plate and flask formats.
Etoposide weas purchased from Sigma Aldrich (Art. E1383-25MG). The stock solutions were prepared as follows: 25 mg Etoposide were dissolved in 850 µl with a final concentration of 50 mM, aliquoted into 50 µl tubes, and was stored at -20˚C. For experiments etoposide was diluted 1:2000 to obtain a final treatment concentration of 25 µM. The cells were treated for 48 hours to initiate senescence process, after treatment etoposide containing medium was removed and cells were washed with PBS.
4.1.1. Toxicity Testing and SA-ß-Gal Assay
Young cells were seeded in 24 well plates (3500 cells / cm2, 1000µL medium per well). Aqueous herbal extracts (Chamomile and green tea) were diluted 1:3 in water 100 µl of these dilutions were added to 900µl Medium in a 24 well plate. The goldenrod extract and the reishi extract were diluted 1:3 in 40% ethanol 37,5 µl of these extracts were added in 962,5 µl medium in the 24 well plate. The extract treatment for 48 hours was started, beginning with 1:1, then 1:3, 1:9, 1:27 and 1:81 (i.e. 1:3 dilutions each), row 6 were blanks (purified water and EtOH 40%):
Presto Blue staining was performed on day tree: 500 µl old medium out, 500 µl fresh medium back in, 50 µl Pres-to Blue per well added, placed in the incubator for 30 min, then 100 µl each added to a black 96-well plate and fluorescence measured. Presto blue does not harm the cells so same 24 well plates were stained for SA-ß-Gal the day after (day 4). Treatments representing the young treatment group.
The old treatment group was terminated as follows: Young cells were seeded in 24 well plates (3500 cells / cm2, 1000µL medium per well). Next day the cells were treated with etoposide for 48 hours. After removal of Etoposide cells were incubated 12 d with regular media change. Then the extract treatment was started, row 6 were blanks (purified water and EtOH 40%); the first dilution step was 1:1, then 1:3, 1:9, 1:27 and 1:81 (i.e. 1:3 dilutions each).on day 14 after etoposide treatment: Presto Blue staining. The day after SA–ß-Gal staining.
4.1.2. Main Experiment Chronical Extract Treatment for IL-6 Elisa and pPCR Investigations
Young cells were seeded in 75 cm2 flasks (3500 cells / cm2, 20mL medium per flasks). One day after the seeding, the cells were treated with etoposide to induce senescence. After 2 days etoposide was removed, and fresh media was added. The day after the removal of etoposide, the first extract treatment took place and supernatant was collected for the first time. From this point on, one flask per extract was harvested at each media change / extract treatment and both the RNA and supernatants were collected for further investigation. The process is explained in Figure 4.

Table 2.
dilutions and concentrations used for 24 well and 75 cm2 flask assays:.
| Chamomile | Green tea | Goldenrod | Reishi |
| 1:1 means 3,8 mg/mL | 1:1 means 3,8 mg/mL | 1:1 means 1.875 mg/mL | 1:1 means 1.875 mg/mL |
| 1:3 means 1,2666 mg/mL | 1:3 means 1,2666 mg/mL | 1:3 means 0.6250 mg/mL | 1:3 means 0.6250 mg/mL |
| 1:9 means 0,4222 mg/mL | 1:9 means 0,4222 mg/mL | 1:9 means 0.2083 mg/mL | 1:9 means 0.2083 mg/mL |
| 1:18 means 0.2111 mg/mL | 1:27 means 0,1407 mg/mL | 1:18 means 0.1042 mg/mL | 1:27 means 0.0694 mg/mL |
| 1:27 means 0,1407 mg/mL | 1:54 means 0.0704 mg/mL | 1:27 means 0.0694 mg/mL | 1:81 means 0.0231 mg/mL |
| 1:81 means 0,0469 mg/mL | 1:81 means 0.0469 mg/mL | 1:81 means 0.0231 mg/mL |
4.2. Preparation of Extracts
Ethanol (EtOH) was the solvent of choice for all drugs except the green tea and the chamomile extracts where purified water was used. To prepare the aimed concentration of 40%, 300 mL of purified water was measured and mixed with 200 mL of Ethanol absolute 99,9% p.A. to obtain 500 mL of 40% EtOH, stored in a brown bottle to prevent exposure to light as far as possible at room temperature. To rule out any effect (positive or negative) of the solvents, cells were treated with solvents without extracts in each experimental setup.
Green Tea from Kottas Pharma GmbH was purchased at a local pharmacy store (Schubert Apotheke Arndtstraße 88 1120 Wien (www.schubertapotheke.at )). Two teabags (3.8 g) were steeped in 100 mL of purified water to simmer for 5 minutes, covered with aluminum foil to prevent heavy loss of liquid through evaporation. After steeping, the tea was filtered using a 0.45 µm syringe filter and sterile filtered afterwards. Aliquots were then frozen at -20 °C at a stock concentration of 38g/L.
Dried chamomile flowers (Matricaria chamomilla) were purchased at a local pharmacy store (Schubert Apotheke Arndtstraße 88 1120 Wien (www.schubertapotheke.at )) 3.8 g were weighed out and simmered gently with 100 ml of purified water for 5 minutes, covered with alumi-num foil to prevent heavy loss of liquid through evaporation. After steeping, the extract was filtered using a 0.45 µm syringe filter and sterile filtered afterwards. Aliquots were then frozen at -20 °C at a stock concentration of 38g/L.
Dried goldenrod herb (Solidago Virgaurea) was purchased at a local pharmacy store (Schubert Apotheke Arndtstraße 88 1120 Wien (www.schubertapotheke.at )) 2.5 g were weighed out, 50 mL of EtOH 40% were added and ground in a mixer. This mixture was left to infuse overnight at 4 °C. After steeping, the extract was filtered using a 0.45 µm syringe filter and sterile filtered afterwards. Aliquots were then frozen at -20 °C at a stock concentration of 50g/L.
Dried powder of the reishi (mushroom of eternal life) was provided by drug store (Schubert Apotheke Arndtstraße 88 1120 Wien (www.schubertapotheke.at )). 2.5 g was weighed out, 50 mL of EtOH 40% were added and ground in a mixer for better dis-persion of the fine powder. This mixture was left to infuse overnight at 4 °C. After steeping, the ex-tract was filtered using a 0.45 µm syringe filter and sterile filtered afterwards. Aliquots were then frozen at -20 °C at a stock concentration of 50g/L.
2.0 g of dried curcumin powder (Schubert Apotheke Arndtstraße 88 1120 Wien (www.schubertapotheke.at)) were weighed out, 40 mL of EtOH 40% were added and ground in a mixer for better dispersion of the fine powder. This mixture was left to infuse overnight at 4 °C. After steeping, the extract was filtered using a 0.45 µm syringe filter and sterile filtered afterwards. Aliquots were then frozen at -20 °C at a stock concentration of 50g/L.
Dried goji berries (Lycium barbarum) (Schubert Apotheke Arndtstraße 88 1120 Wien (www.schubertapotheke.at)) were purchased at a drugstore. 2.5 g were weighed out, 50 mL of EtOH 40% were added and ground in a mixer. This mixture was left to infuse overnight at 4 °C. After steeping, the extract was filtered using a 0.45 µm syringe filter and sterile filtered afterwards. Aliquots were then frozen at -20 °C at a stock concentration of 50g/L.
4.3. DPPH-Assay
DPPH, (2,2-diphenyl-1-picrylhydrazyl) assay three different standard solutions were prepared, Vitamin C (prepared out of a 1000x stock solution in 40 % EtOH), Tempo (prepared out of a 100x stock solution in RO water) and Gallic acid solution (prepared in RO water). DPPH was dissolved in methanol to obtain a stock solution with a concentration of 25 mM. 100 µl Sample solutions were diluted with an equal volume of 0,25mM stock solution and 100µl sample were mixed and incubated in the dark at room temperature for 30 minutes. The absorbance of the reaction mixture was measured at 517 nm using a photometer. The decrease in absorbance indicates the extent of the DPPH radical scavenging activity.
4.4. Folin-Ciocalteu Assay
Folin-Ciocalteu assay was performed as follows: To measure the extract samples, a 1:3 dilution series was prepared. Standard curve was prepared with gallic acid. A volume of 25 µL of each extract in the respective dilution stage, 125 µL of Folin–Ciocalteu phenol reagent and 100 µL of sodium carbonate (20 % Na2CO3 w/v in water) were prepared in a 2mL tube, incubated for 5 minutes at 50 °C and cooled in ice water afterwards for another 5 minutes. 100µL were transferred from the tubes to a 96-well microplate. Afterwards the absorbance was measured at 760 nm. A calibration curve was prepared using standard solutions of gallic acid. The absorbance was plotted against the concentration of gallic acid to create a standard curve. The total phenolic content in the sample was determined by comparing the absorbance of the sample to the calibration curve. Results were expressed in mg gallic acid equivalents per g of weighted-in herbal substances.
4.5. XTT (2,3-Bis-(2-Methoxy-4-nitro-5-sulfophenyl)-2H-tetrazolium-5-carboxanilide) Assay
The effect of solvent controls on cell viability and growth was evaluated 3 days after treatment by performing an XTT Assay according to the manufacturer’s instructions. In brief, the XTT working solution was prepared mixing XTT labelling reagent and electron-coupling reagent at a ratio of 5:0.1 immediately before application. Of the 100 µL volume per well, 50 µL were discarded, and 50 µL XTT working solution were added to each well. Plates were incubated under standard cultivation conditions for 4 hours. The absorption signal was measured at a wavelength of 450 nm using 650 nm as a reference. The absorption signal of the untreated control was set at 100% and the relative signal of solvent-treated replicates was calculated as a measure of viable cell number per well.
4.6. Senescence Associated ß Galactosidase (SA-ß-gal) Assay
The cells were washed twice with PBS and fixed with a 4% formaldehyde fixation solution for 10 minutes at room temperature, washed again twice with PBS and once with staining buffer (citric acid 0,1 M phosphate buffer pH 6.0) and incubated with the X-gal staining solution (5 mM K4[Fe(CN)6], 5 mM K3[Fe(CN)6], 2 mM MgCl2, 1 mg/ml X-Gal in staining buffer) for a minimum of 6 hours at 37˚C. The staining solution was removed, and the cells were then covered with 70% glycerol and stored at 4 °C for longer storage. To determine the percentage of β-Gal positive cells, approximately 50 cells were counted per well in three to four different sections in the well’s center since cells tend to be more likely to cluster in the center of a well than to migrate to the edge. This was carried out threefold to minimize counting errors.
4.7. IL-6 ELISA
For the measurement of IL-6 content in cell-conditioned media, an ELISA kit (Human IL-6 CytoSet™ from Invitrogen™), was used. An anti-Human IL-6 antibody (0.125 mg/0.125 ml) was used as the coating antibody. For detection, an anti-Human IL-6 Biotin antibody (0.25 mg/0.125 ml) was em-ployed, with Streptavidin-HRP facilitating detection. Recombinant human IL-6 was used for calibration. The IL-6 ELISA was carried out following the supplier’s instructions.
4.8. Presto Blue Assay
The PrestoBlue™ assay is a cell viability assay used to measure the metabolic activity of cells. It is based on the reduction of a resazurin-based reagent to a red fluorescent and colorimetric product, resorufin, by metabolically active cells. It enables the measurement of cell proliferation and serves as a reference for the cell count in each well. The intensity of the fluorescence or color is directly pro-portional to the number of viable cells. PrestoBlue™ Cell Viability Reagent from Invitrogen™ was purchased. The dye was diluted 1:20 in me-dium, 1 mL (10% v/v) of this mixture was added to each well of the 24-well plates. The Plates were incubated at 37°C for 30 minutes. The fluorescence was measured at 560 nm.
4.9. RNA Extraction, cDNA Synthesis and qPCR
Total RNA was extracted from HDF and HDFK cells using the AurumTM Total RNA Mini Kit (BIORAD), following the instructions for cultured cell lines.
The cells were harvested, washed in PBS and spun down in a microcentrifuge tube; the pellet from the cell culture flask was mixed with lysis buffer and 70% EtOH. This homogenized lysate was pipet-ted in an RNA binding column standing in a capless wash tube and centrifuged for 30 seconds. After washing, the RNase-free DNase I and DNase dilution solution were added and incubated for 15 minutes at room temperature to allow the digest. After two more washing steps, the RNA binding column was transferred to a capped microcentrifuge tube and eluted after 1 minute by centrifuging it for another 2 minutes. The tubes were then frozen at -20 °C for later use.
The cDNA synthesis was performed according to the iScriptTM cDNA Synthesis Kit purchased from by BIORAD. The total RNA collected in 4.4.1.1 was reverse transcribed with iScript Reverse Transcriptase and iScript reaction mix using the kit’s standard protocol and run in a thermal cycler: Priming 5 min at 25 °C; Reverse transcription 20 min at 46 °C; Reverse Transcriptase inactivation 1 min at 95 °C; The total amount of 40µL per sample were frozen at -20 °C.
The cDNA samples from step before were diluted 1:3 with nuclease-free water. A primer mix consisting of forward and reverse primer in nuclease-free water with a desired final concentration of 400 nM. Each qPCR reaction consisted of a total volume of 10 μL containing 5µL iTaq Universal SYBR Green super mix, 1µL PCR primer mix, and 2 μL cDNA template and 2 µL of nuclease-free water. Hose keeping genes Actin ß and GAPDH were used. All samples were analyzed in duplicate. The PCR thermal cycle protocol consisted of the following: 1 cycle of 95°C for 30 seconds, 40 cycles of 95°C for 5 seconds, and 60°C for 30 seconds at the end of the run a melting curve was performed
Table 3.
Primer sequences and source.
| Name | Forward (5’-3’) | Reverse (5’-3’) | Ref |
| p16INK4a | GAGCAGCATGGAGCCTTC | CGTAACTATTCGGTGCGTTG | [55] |
| p21 | GGCAGACCAGCATGACAGATTTC | CGGATTAGGGCTTCCTCTTGG | [56] |
| IL-1a | GGTTGAGTTTAAGCCAATCCA | TGCTGACCTAGGCTTGATGA | [55] |
| IL-1b | ACAGATGAAGTGCTCCTTCCA | GTCGGAGATTCGTAGCTGGAT | [57] |
| IL-6 | GCCCAGCTATGAACTCCTTCT | GAAGGCAGCAGGCAACAC | [55] |
| IL-8 | AGACAGCAGAGCACACAAGC | ATGGTTCCTTCCGGTGGT | [55] |
| CXCL1 | GAAAGCTTGCCTCAATCCTG | CACCAGTGAGCTTCCTCCTC | [58] |
| GAPDH | CGACCACTTTGTCAAGCTCA | TGTGAGGAGGGGAGATTCAG | [59] |
| Actin ß | CCAACCGCGAGAAGATGA | CCAGAGGCGTACAGGGATAG | [60] |
| MMP-3 | CAAAACATATTTCTTTGTAGAGGACAA | TTCAGCTATTTGCTTGGGAAA | [55] |
| HLA-E | TGCGCGGCTACTACAATCAG | TGTCGCTCCACTCAGCCTTC | [61] |
| MICA | ATGGAACACAGCGGGAATCA | GCACTTTCCCAGAGGGCAC | [54] |
| ULBP2 | TCCAGGCTCTCCTTCCATCA | AGAAGGATCTTGGTAGCGGC | [54] |
Author Contributions
For research articles with several authors, a short paragraph specifying their individual contributions must be provided. The following statements should be used “Conceptualization, H.K and M.I..; methodology, H.K.; investigation, M.I.; Z.V. and H.K. resources, M.M. and H.K.; data curation, H.K and M.I..; writing—original draft preparation, H.K and M.I..; writing—review and editing, H.K.; M.I.; Z.V. and M.M. visualization, H.K and M.I..; supervision, M.M. and H.K.; project administration M.M. and H.K.; funding acquisition, M.M. and H.K.; All authors have read and agreed to the published version of the manuscript.
Funding
Please add: This research was funded by internally by FH Campus Vienna, Department of Applied life science, Anschubfinanzierung and Publikationsscheck. No Funding number was assigned.
Institutional Review Board Statement
Not applicable commercial cell lines were used.
Informed Consent Statement
Not applicable commercial cell lines were used.
Data Availability Statement
We encourage all authors of articles published in MDPI journals to share their research data. In this section, please provide details regarding where data supporting reported results can be found, including links to publicly archived datasets analyzed or generated during the study. Where no new data were created, or where data is unavailable due to privacy or ethical restrictions, a statement is still required. Suggested Data Availability Statements are available in section “MDPI Research Data Policies” at https://www.mdpi.com/ethics.
Acknowledgments
We thank Roya Gholami for performing the ELISA assays and Michaela Schmidt for prove reading of the manuscript.
Conflicts of Interest
The authors declare no conflicts of interest.
References
- Hayflick, L. The Limited in Vitro Lifetime of Human Diploid Cell Strains. Exp Cell Res 1965, 37, 614–636. [CrossRef]
- Hayflick, L.; Moorhead, P.S. The Serial Cultivation of Human Diploid Cell Strains. Exp Cell Res 1961, 25, 585–621. [CrossRef]
- Campisi, J.; Di d’Adda Fagagna, F. Cellular Senescence: When Bad Things Happen to Good Cells. Nat Rev Mol Cell Biol 2007, 8, 729–740. [CrossRef]
- Sharpless, N.E.; Sherr, C.J. Forging a Signature of in Vivo Senescence. Nat Rev Cancer 2015, 15, 397–408. [CrossRef]
- Campisi, J. Aging, Cellular Senescence, and Cancer. Annu Rev Physiol 2013, 75, 685–705. [CrossRef]
- Short, S.; Fielder, E.; Miwa, S.; Zglinicki, T. Senolytics and Senostatics as Adjuvant Tumour Therapy. EBioMedicine 2019, 41, 683–692. [CrossRef]
- Muñoz-Espín, D.; Serrano, M. Cellular Senescence: From Physiology to Pathology. Nat Rev Mol Cell Biol 2014, 15, 482–496. [CrossRef]
- Childs, B.G.; Baker, D.J.; Kirkland, J.L.; Campisi, J.; van Deursen, J.M. Senescence and Apoptosis: Dueling or Complementary Cell Fates? EMBO Rep 2014, 15, 1139–1153. [CrossRef]
- Yosef, R.; Pilpel, N.; Tokarsky-Amiel, R.; Biran, A.; Ovadya, Y.; Cohen, S.; Vadai, E.; Dassa, L.; Shahar, E.; Condiotti, R.; et al. Directed Elimination of Senescent Cells by Inhibition of BCL-W and BCL-XL. Nat Commun 2016, 7, 11190. [CrossRef]
- Baker, D.J.; Wijshake, T.; Tchkonia, T.; LeBrasseur, N.K.; Childs, B.G.; Sluis, B. van de; Kirkland, J.L.; Deursen, J.M. van Clearance of P16Ink4apositive Senescent Cells Delays Ageingassociated Disorders. Nature 2011, 479, 232. [CrossRef]
- Baker, D.J.; Childs, B.G.; Durik, M.; Wijers, M.E.; Sieben, C.J.; Zhong, J.; A. Saltness, R.; Jeganathan, K.B.; Verzosa, G.C.; Pezeshki, A.; et al. Naturally Occurring P16Ink4a-Positive Cells Shorten Healthy Lifespan. Nature 2016, 530, 184–189. [CrossRef]
- Zhu, Y.; Tchkonia, T.; Pirtskhalava, T.; Gower, A.C.; Ding, H.; Giorgadze, N.; Palmer, A.K.; Ikeno, Y.; Hubbard, G.B.; Lenburg, M.; et al. The Achilles’ Heel of Senescent Cells: From Transcriptome to Senolytic Drugs. Aging Cell 2015, 14, 644–658. [CrossRef]
- Kirkland, J.L.; Tchkonia, T. Cellular Senescence: A Translational Perspective. EBioMedicine 2017, 21, 21–28. [CrossRef]
- Jeon, O.H.; Kim, C.; Laberge, R.M.; Demaria, M.; Rathod, S.; Vasserot, A.P.; Chung, J.W.; Kim, D.H.; Poon, Y.; David, N.; et al. Local Clearance of Senescent Cells Attenuates the Development of Post-Traumatic Osteoarthritis and Creates a pro-Regenerative Environment. Nat Med 2017, 23, 775–781. [CrossRef]
- Xu, M.; Pirtskhalava, T.; Farr, J.N.; Weigand, B.M.; Palmer, A.K.; Weivoda, M.M.; Inman, C.L.; Ogrodnik, M.B.; Hachfeld, C.M.; Fraser, D.G.; et al. Senolytics Improve Physical Function and Increase Lifespan in Old Age. Nat Med 2018, 24, 1246–1256. [CrossRef]
- Kirkland, J.L.; Tchkonia, T. Senolytic Drugs: From Discovery to Translation. J Intern Med 2020, 288, 518–536. [CrossRef]
- Park, J.; Shin, D.W. Senotherapeutics and Their Molecular Mechanism for Improving Aging. Biomol Ther (Seoul) 2022, 30, 490–500. [CrossRef]
- Senolytics and Senomorphics: Natural and Synthetic Therapeutics in the Treatment of Aging and Chronic Diseases - ScienceDirect Available online: https://www.sciencedirect.com/science/article/abs/pii/S0891584921002847 (accessed on 13 July 2024).
- Lagoumtzi, S.M.; Chondrogianni, N. Senolytics and Senomorphics: Natural and Synthetic Therapeutics in the Treatment of Aging and Chronic Diseases. Free Radic Biol Med 2021, 171, 169–190. [CrossRef]
- Birch, J.; Gil, J. Senescence and the SASP: Many Therapeutic Avenues. Genes Dev 2020, 34, 1565–1576. [CrossRef]
- Kirkland, J.L. Translating the Science of Aging into Therapeutic Interventions. Cold Spring Harb Perspect Med 2016, 6, a025908. [CrossRef]
- Yousefzadeh, M.J.; Zhu, Y.; McGowan, S.J.; Angelini, L.; Fuhrmann-Stroissnigg, H.; Xu, M.; Ling, Y.Y.; Melos, K.I.; Pirtskhalava, T.; Inman, C.L.; et al. Fisetin Is a Senotherapeutic That Extends Health and Lifespan. EBioMedicine 2018, 36, 18–28. [CrossRef]
- Zoico, E.; Nori, N.; Darra, E.; Tebon, M.; Rizzatti, V.; Policastro, G.; De Caro, A.; Rossi, A.P.; Fantin, F.; Zamboni, M. Senolytic Effects of Quercetin in an in Vitro Model of Pre-Adipocytes and Adipocytes Induced Senescence. Scientific Reports | 123AD, 11, 23237. [CrossRef]
- Hwang, H. V; Tran, D.T.; Rebuffatti, M.N.; Li, C.-S.; Knowlton, A.A. Investigation of Quercetin and Hyperoside as Senolytics in Adult Human Endothelial Cells. [CrossRef]
- Kumar, R.; Sharma, A.; Kumari, A.; Gulati, A.; Padwad, Y.; Sharma, R. Epigallocatechin Gallate Suppresses Premature Senescence of Preadipocytes by Inhibition of PI3K/Akt/MTOR Pathway and Induces Senescent Cell Death by Regulation of Bax/Bcl-2 Pathway. Biogerontology 2019, 20, 171–189. [CrossRef]
- Lammermann, I.; Terlecki-Zaniewicz, L.; Weinmullner, R.; Schosserer, M.; Dellago, H.; de Matos Branco, A.D.; Autheried, D.; Sevcnikar, B.; Kleissl, L.; Berlin, I.; et al. Blocking Negative Effects of Senescence in Human Skin Fibroblasts with a Plant Extract. NPJ Aging Mech Dis 2018, 4, 4. [CrossRef]
- Srivastava, J.K.; Shankar, E.; Gupta, S. Chamomile: A Herbal Medicine of the Past with a Bright Future (Review). Mol Med Rep 2010, 3, 895–901. [CrossRef]
- Singh, O.; Khanam, Z.; Misra, N.; Srivastava, M.K. Chamomile (Matricaria Chamomilla L.): An Overview. Pharmacogn Rev 2011, 5, 82–95. [CrossRef]
- Mihyaoui, A. El; Esteves Da Silva, J.C.G.; Charfi, S.; Castillo, M.E.C.; Lamarti, A.; Arnao, M.B. Chamomile (Matricaria Chamomilla L.): A Review of Ethnomedicinal Use, Phytochemistry and Pharmacological Uses. Life 2022, 12. [CrossRef]
- Avonto, C.; Rua, D.; Lasonkar, P.B.; Chittiboyina, A.G.; Khan, I.A. Identification of a Compound Isolated from German Chamomile (Matricaria Chamomilla) with Dermal Sensitization Potential. Toxicol Appl Pharmacol 2017, 318, 16–22. [CrossRef]
- McKay, D.L.; Blumberg, J.B. A Review of the Bioactivity and Potential Health Benefits of Chamomile Tea (Matricaria Recutita L.). Phytotherapy Research 2006, 20, 519–530. [CrossRef]
- De Cicco, P.; Ercolano, G.; Sirignano, C.; Rubino, V.; Rigano, D.; Ianaro, A.; Formisano, C. Chamomile Essential Oils Exert Anti-Inflammatory Effects Involving Human and Murine Macrophages: Evidence to Support a Therapeutic Action. J Ethnopharmacol 2023, 311, 116391. [CrossRef]
- Shevchuk, Y.; Kuypers, K.; Janssens, G.E. Fungi as a Source of Bioactive Molecules for the Development of Longevity Medicines. Ageing Res Rev 2023, 87, 101929. [CrossRef]
- Kühnel, H.; Pasztorek, M.; Kuten-Pella, O.; Kramer, K.; Bauer, C.; Lacza, Z.; Nehrer, S. Effects of Blood-Derived Products on Cellular Senescence and Inflammatory Response: A Study on Skin Rejuvenation. Curr Issues Mol Biol 2024, 46, 1865–1885. [CrossRef]
- Varesi, A.; Chirumbolo, S.; Irene Maria Campagnoli, L.; Pierella, E.; Bavestrello Piccini, G.; Carrara, A.; Ricevuti, G.; Scassellati, C.; Bonvicini, C.; Pascale, A. The Role of Antioxidants in the Interplay between Oxidative Stress and Senescence. 2022. [CrossRef]
- Kuhnel, H.; Adilijiang, A.; Dadak, A.; Wieser, M.; Upur, H.; Stolze, K.; Grillari, J.; Strasser, A. Investigations into Cytotoxic Effects of the Herbal Preparation Abnormal Savda Munziq. Chin J Integr Med 2015. [CrossRef]
- Petrova, N. V; Velichko, A.K.; Razin, S. V; Kantidze, O.L. Small Molecule Compounds That Induce Cellular Senescence. Aging Cell 2016, 15, 999–1017. [CrossRef]
- Odeh, A.; Dronina, M.; Domankevich, V.; Shams, I.; Manov, I. Downregulation of the Inflammatory Network in Senescent Fibroblasts and Aging Tissues of the Long-Lived and Cancer-Resistant Subterranean Wild Rodent, Spalax. Aging Cell 2020, 19, e13045. [CrossRef]
- Bientinesi, E.; Lulli, M.; Becatti, M.; Ristori, S.; Margheri, F.; Monti, D. Doxorubicin-Induced Senescence in Normal Fibroblasts Promotes in Vitro Tumour Cell Growth and Invasiveness: The Role of Quercetin in Modulating These Processes. Mech Ageing Dev 2022, 206. [CrossRef]
- Lammermann, I.; Terlecki-Zaniewicz, L.; Weinmullner, R.; Schosserer, M.; Dellago, H.; de Matos Branco, A.D.; Autheried, D.; Sevcnikar, B.; Kleissl, L.; Berlin, I.; et al. Blocking Negative Effects of Senescence in Human Skin Fibroblasts with a Plant Extract. NPJ Aging Mech Dis 2018, 4, 4. [CrossRef]
- Matos, L.; Gouveia, A.M.; Almeida, H. Resveratrol Attenuates Copper-Induced Senescence by Improving Cellular Proteostasis. Oxid Med Cell Longev 2017, 2017, 3793817. [CrossRef]
- Matos, L.; Gouveia, A.; Almeida, H. Copper Ability to Induce Premature Senescence in Human Fibroblasts. Age (Dordr) 2012, 34, 783–794. [CrossRef]
- Severino, J.; Allen, R.G.; Balin, S.; Balin, A.; Cristofalo, V.J. Is β-Galactosidase Staining a Marker of Senescence in Vitro and in Vivo? Exp Cell Res 2000, 257, 162–171. [CrossRef]
- Tayeh, Z.; Ofir, R. Asteriscus Graveolens Extract in Combination with Cisplatin/Etoposide/Doxorubicin Suppresses Lymphoma Cell Growth through Induction of Caspase-3 Dependent Apoptosis. International Journal of Molecular Sciences Communication. [CrossRef]
- Kluska, M.; Wo´zniak, K.W. Molecular Sciences Natural Polyphenols as Modulators of Etoposide Anti-Cancer Activity. Int. J. Mol. Sci 2021, 22, 6602. [CrossRef]
- Jamil, S.; Lam, I.; Majd, M.; Tsai, S.-H.; Duronio, V. Etoposide Induces Cell Death via Mitochondrial-Dependent Actions of P53. Cancer Cell Int 2015, 15, 79. [CrossRef]
- OyetakinWhite, P.; Tribout, H.; Baron, E. Protective Mechanisms of Green Tea Polyphenols in Skin. Oxid Med Cell Longev 2012, 2012, 560682. [CrossRef]
- Türkoğlu, M.; Uğurlu, T.; Gedik, G.; Yılmaz, A.M.; Süha Yalçin, A. In Vivo Evaluation of Black and Green Tea Dermal Products against UV Radiation. Drug Discov Ther 2010, 4, 362–367.
- Unno, K. Prevention of Brain Aging by Green Tea Components: Role of Catechins and Theanine. J Phys Fit Sports Med 2016, 5, 117–122. [CrossRef]
- Türkoğlu, M.; Uğurlu, T.; Gedik, G.; Yılmaz, A.M.; Süha Yalçin, A. In Vivo Evaluation of Black and Green Tea Dermal Products against UV Radiation. Drug Discov Ther 2010, 4, 362–367.
- Yamamoto, T.; Lewis, J.; Wataha, J.; Dickinson, D.; Singh, B.; Bollag, W.B.; Ueta, E.; Osaki, T.; Athar, M.; Schuster, G.; et al. Roles of Catalase and Hydrogen Peroxide in Green Tea Polyphenol-Induced Chemopreventive Effects. J Pharmacol Exp Ther 2004, 308, 317–323. [CrossRef]
- Bientinesi, E.; Ristori, S.; Lulli, M.; Monti, D. Quercetin Induces Senolysis of Doxorubicin-Induced Senescent Fibroblasts by Reducing Autophagy, Preventing Their pro-Tumour Effect on Osteosarcoma Cells. Mech Ageing Dev 2024, 220, 111957. [CrossRef]
- Russo, C.; Edwards, K.D.; Margetts, G.; Kleidonas, S.; Zaibi, N.S.; Clapham, J.C.; Zaibi, M.S. Effects of Salvia Officinalis L. and Chamaemelum Nobile (L.) Extracts on Inflammatory Responses in Two Models of Human Cells: Primary Subcutaneous Adipocytes and Neuroblastoma Cell Line (SK-N-SH). J Ethnopharmacol 2021, 268, 113614. [CrossRef]
- Sagiv, A.; Burton, D.G.A.; Moshayev, Z.; Vadai, E.; Wensveen, F.; Ben-Dor, S.; Golani, O.; Polic, B.; Krizhanovsky, V. NKG2D Ligands Mediate Immunosurveillance of Senescent Cells. Aging 2016, 8, 328–344. [CrossRef]
- Chinta, S.J.; Woods, G.; Demaria, M.; Rane, A.; Zou, Y.; McQuade, A.; Rajagopalan, S.; Limbad, C.; Madden, D.T.; Campisi, J.; et al. Cellular Senescence Is Induced by the Environmental Neurotoxin Paraquat and Contributes to Neuropathology Linked to Parkinson’s Disease. Cell Rep 2018, 22, 930–940. [CrossRef]
- Velichutina, I.; Shaknovich, R.; Geng, H.; Johnson, N.A.; Gascoyne, R.D.; Melnick, A.M.; Elemento, O. EZH2-Mediated Epigenetic Silencing in Germinal Center B Cells Contributes to Proliferation and Lymphomagenesis. 2010. [CrossRef]
- Cappellano, G.; Ploner, C.; Lobenwein, S.; Sopper, S.; Hoertnagl, P.; Mayerl, C.; Wick, N.; Pierer, G.; Wick, G.; Wolfram, D. Immunophenotypic Characterization of Human T Cells after in Vitro Exposure to Different Silicone Breast Implant Surfaces. 2018. [CrossRef]
- Peng, D.-F.; Hu, T.-L.; Soutto, M.; Belkhiri, A.; El-Rifai, W. Glutathione Peroxidase 7 Suppresses Bile Salt-Induced Expression of Pro-Inflammatory Cytokines in Barrett’s Carcinogenesis. J Cancer 2014, 5, 510–517. [CrossRef]
- Terlecki-Zaniewicz, L.; Lämmermann, I.; Latreille, J.; Bobbili, M.R.; Pils, V.; Schosserer, M.; Weinmüllner, R.; Dellago, H.; Skalicky, S.; Pum, D.; et al. Small Extracellular Vesicles and Their MiRNA Cargo Are Anti-Apoptotic Members of the Senescence-Associated Secretory Phenotype. Aging 2018, 10, 1103–1132. [CrossRef]
- Chhunchha, B.; Fatma, N.; Kubo, E.; Singh, D.P.; Singh, D.P. Aberrant Sumoylation Signaling Evoked by Reactive Oxygen Species Impairs Protective Function of Prdx6 by Destabilization and Repression of Its Transcription. [CrossRef]
- Seliger, B.; Jasinski-Bergner, S.; Quandt, D.; Stoehr, C.; Bukur, J.; Wach, S.; Legal, W.; Taubert, H.; Wullich, B.; Hartmann, A. HLA-E Expression and Its Clinical Relevance in Human Renal Cell Carcinoma; Vol. 7;
Figure 1.
definition of reagents and solvents (a) DPPH assay of different Herbs and Antioxidants representing the antioxidative potential; (b) Bar graph of EC50 values from Figure 2a; (c) Polyphenol content of extracts tested expressed in gallic acid equivalents (mg GE/g); (d) solvent control of purified water and ethanol (concentration expressed in % v/v) determined by a XTT assay absorption values were related to the untreated control (% of untreated = value of treated / value of untreated * 100).
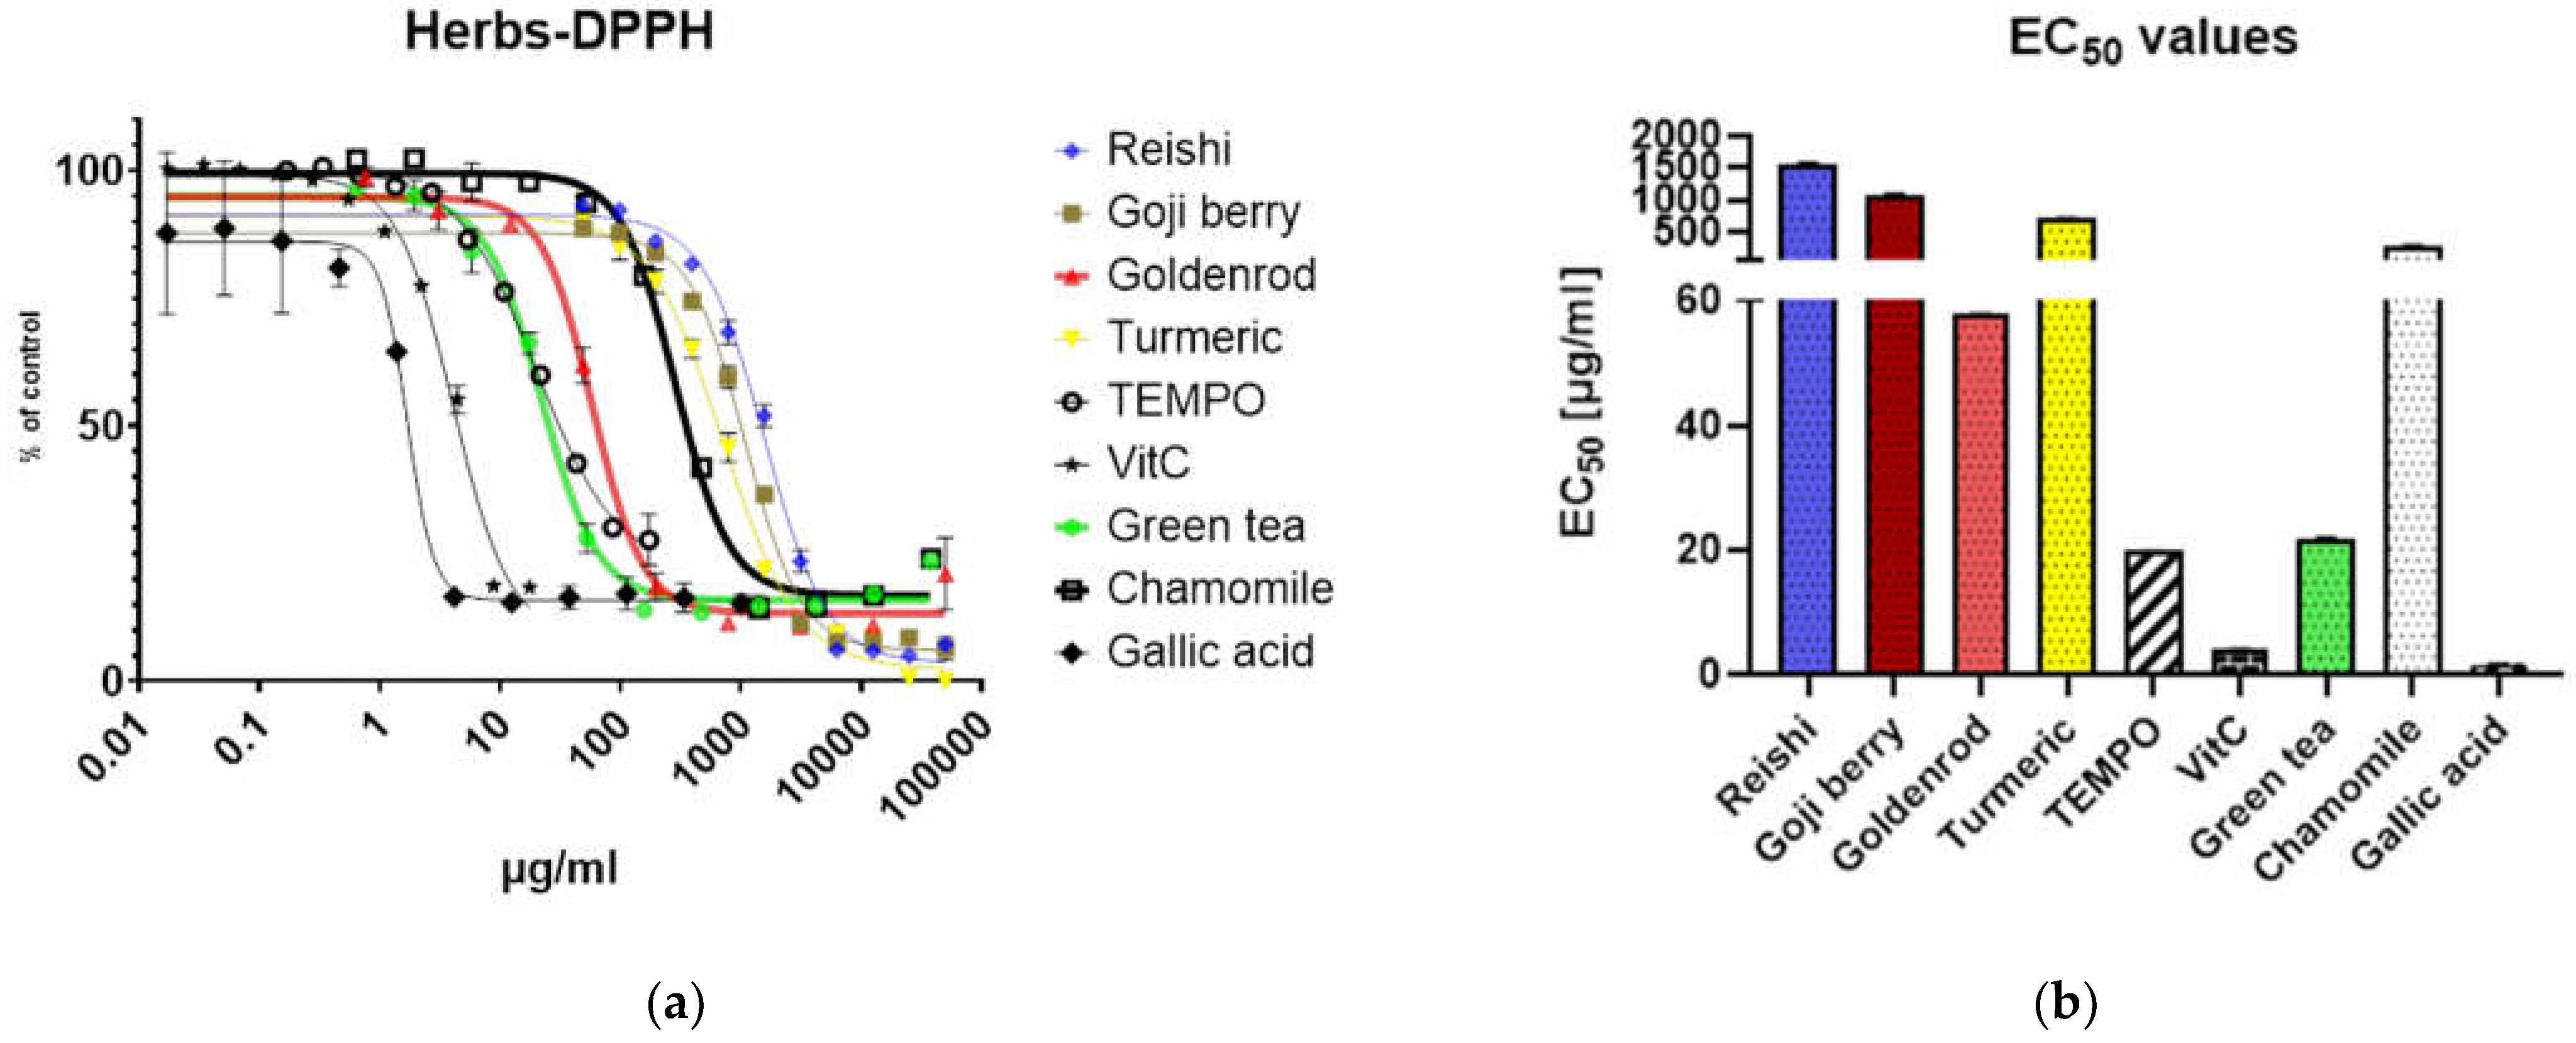
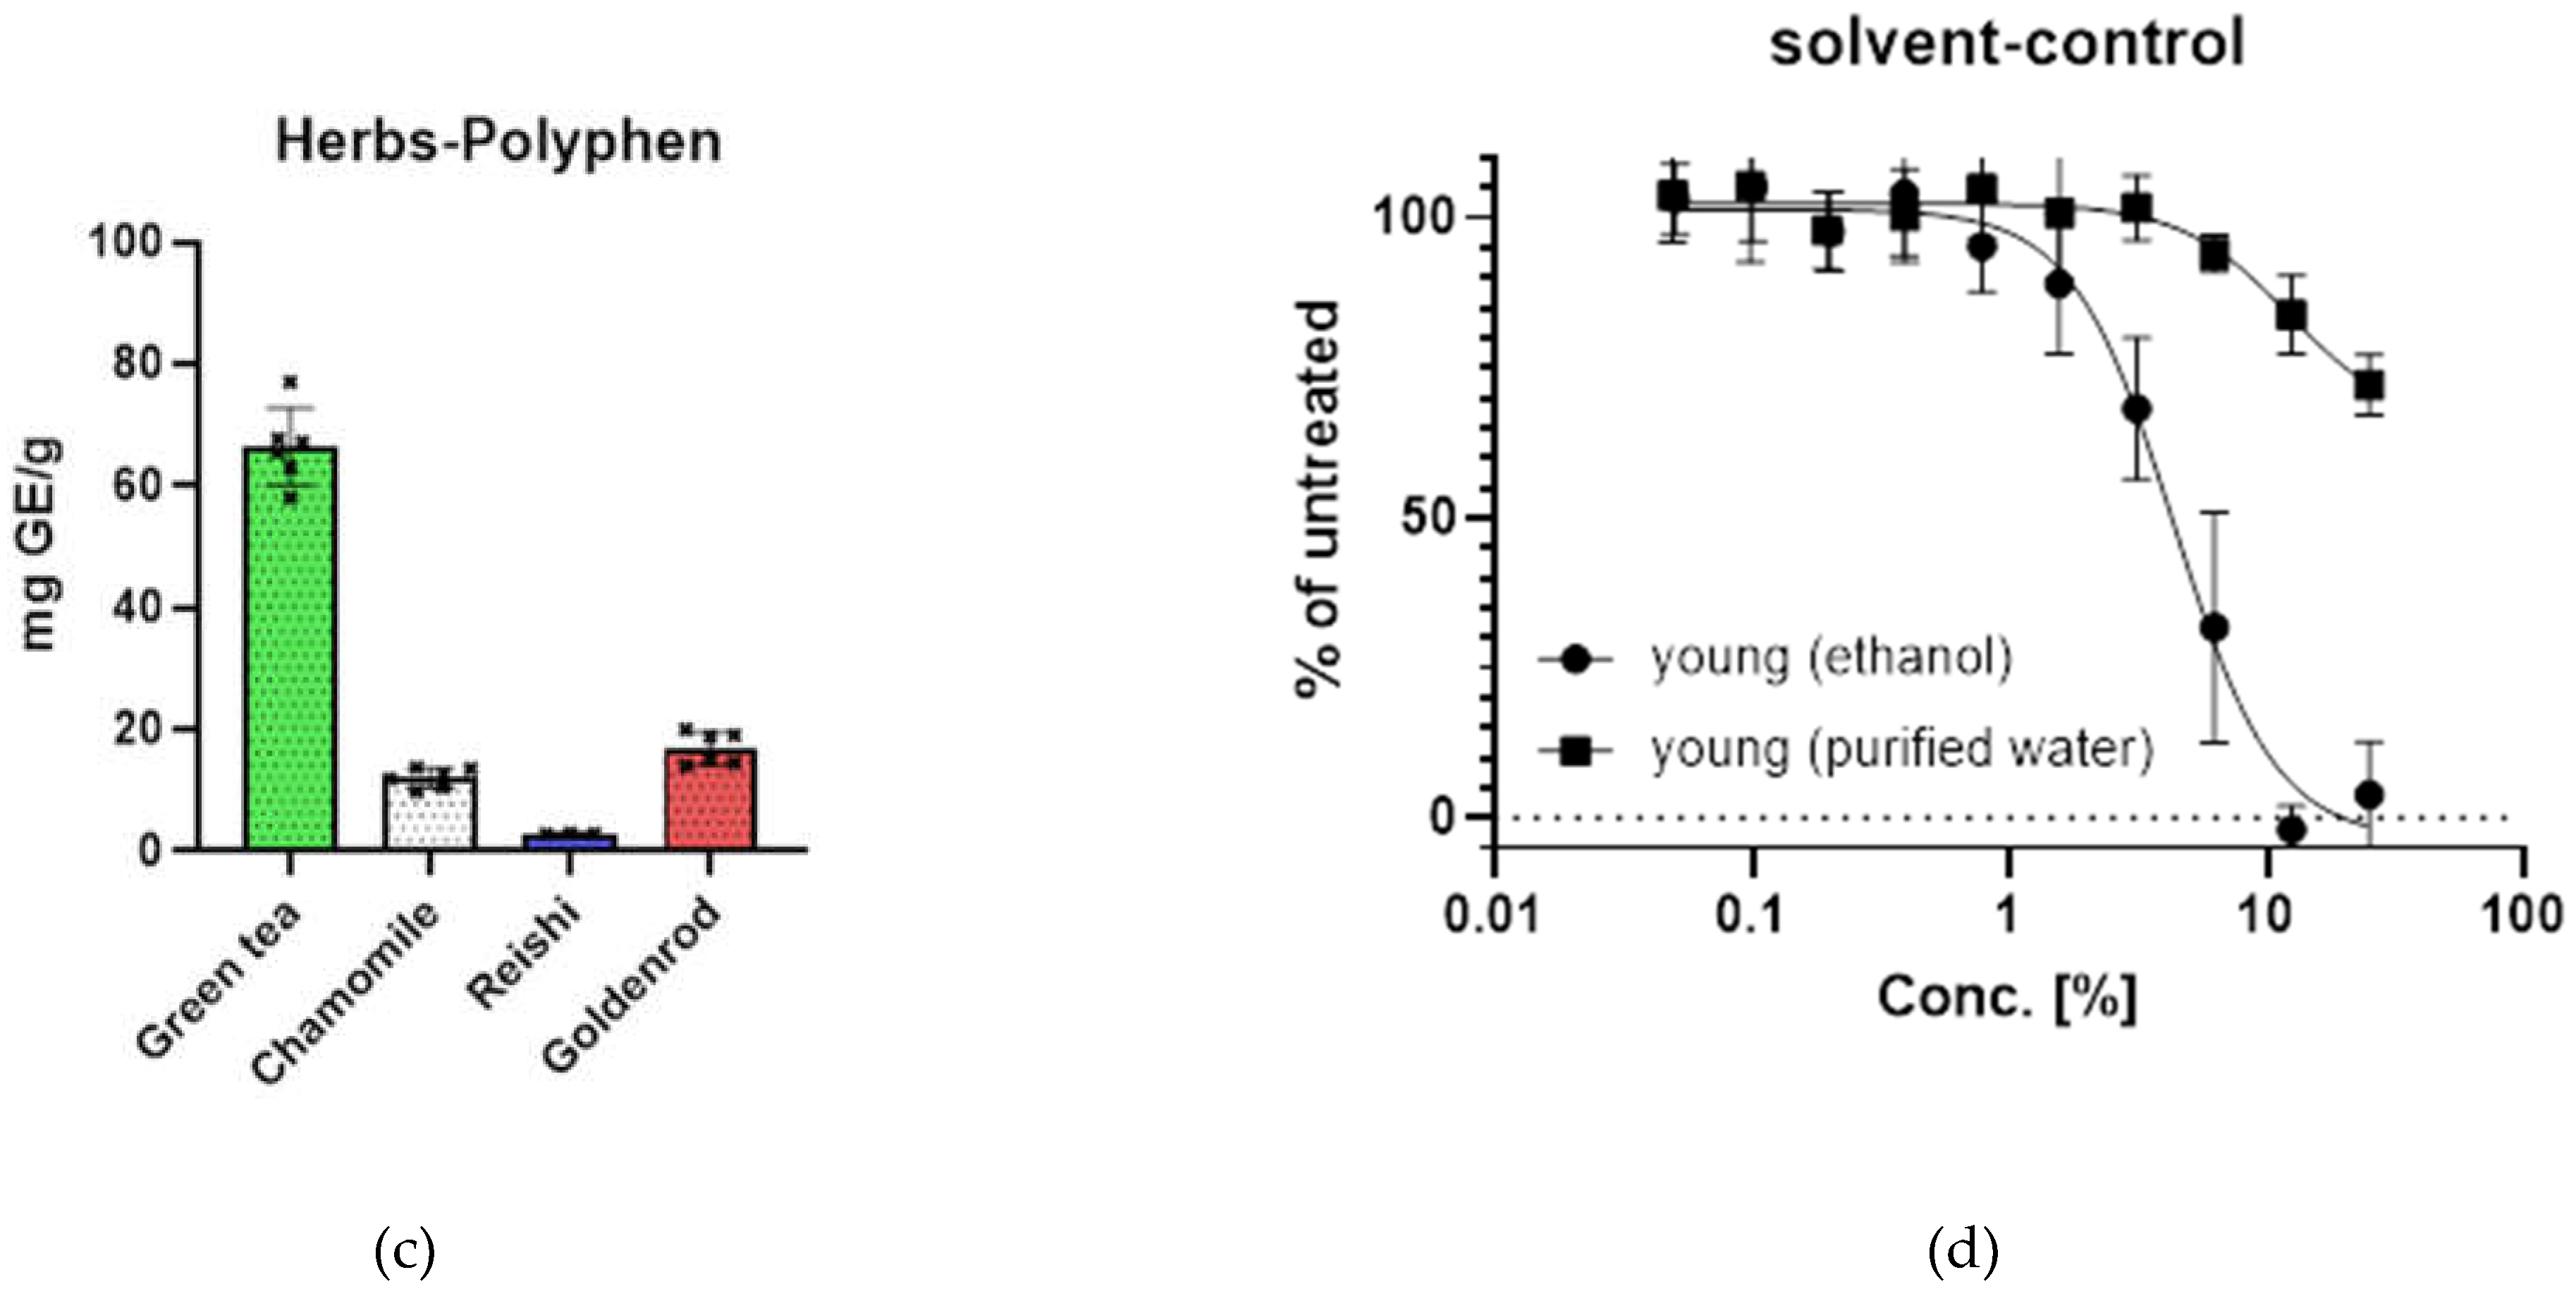
Figure 2.
growth curves (a) serial passaging of CL1 and CL2 (human dermal fibroblast cells from different donors and companies) black line shows cell line with faster growth which reached replicative senescence, gray line shows CL2 which had a lower growth rate and did not reach cellular senescence within the period we passaged the cells; (b) confirmation of growth arrest induced by etoposide treatment by XTT assay ongoing growth of untreated cells can be seen in grey line with boxes and black line with circles shows growth arrest of Etoposide treated cells.
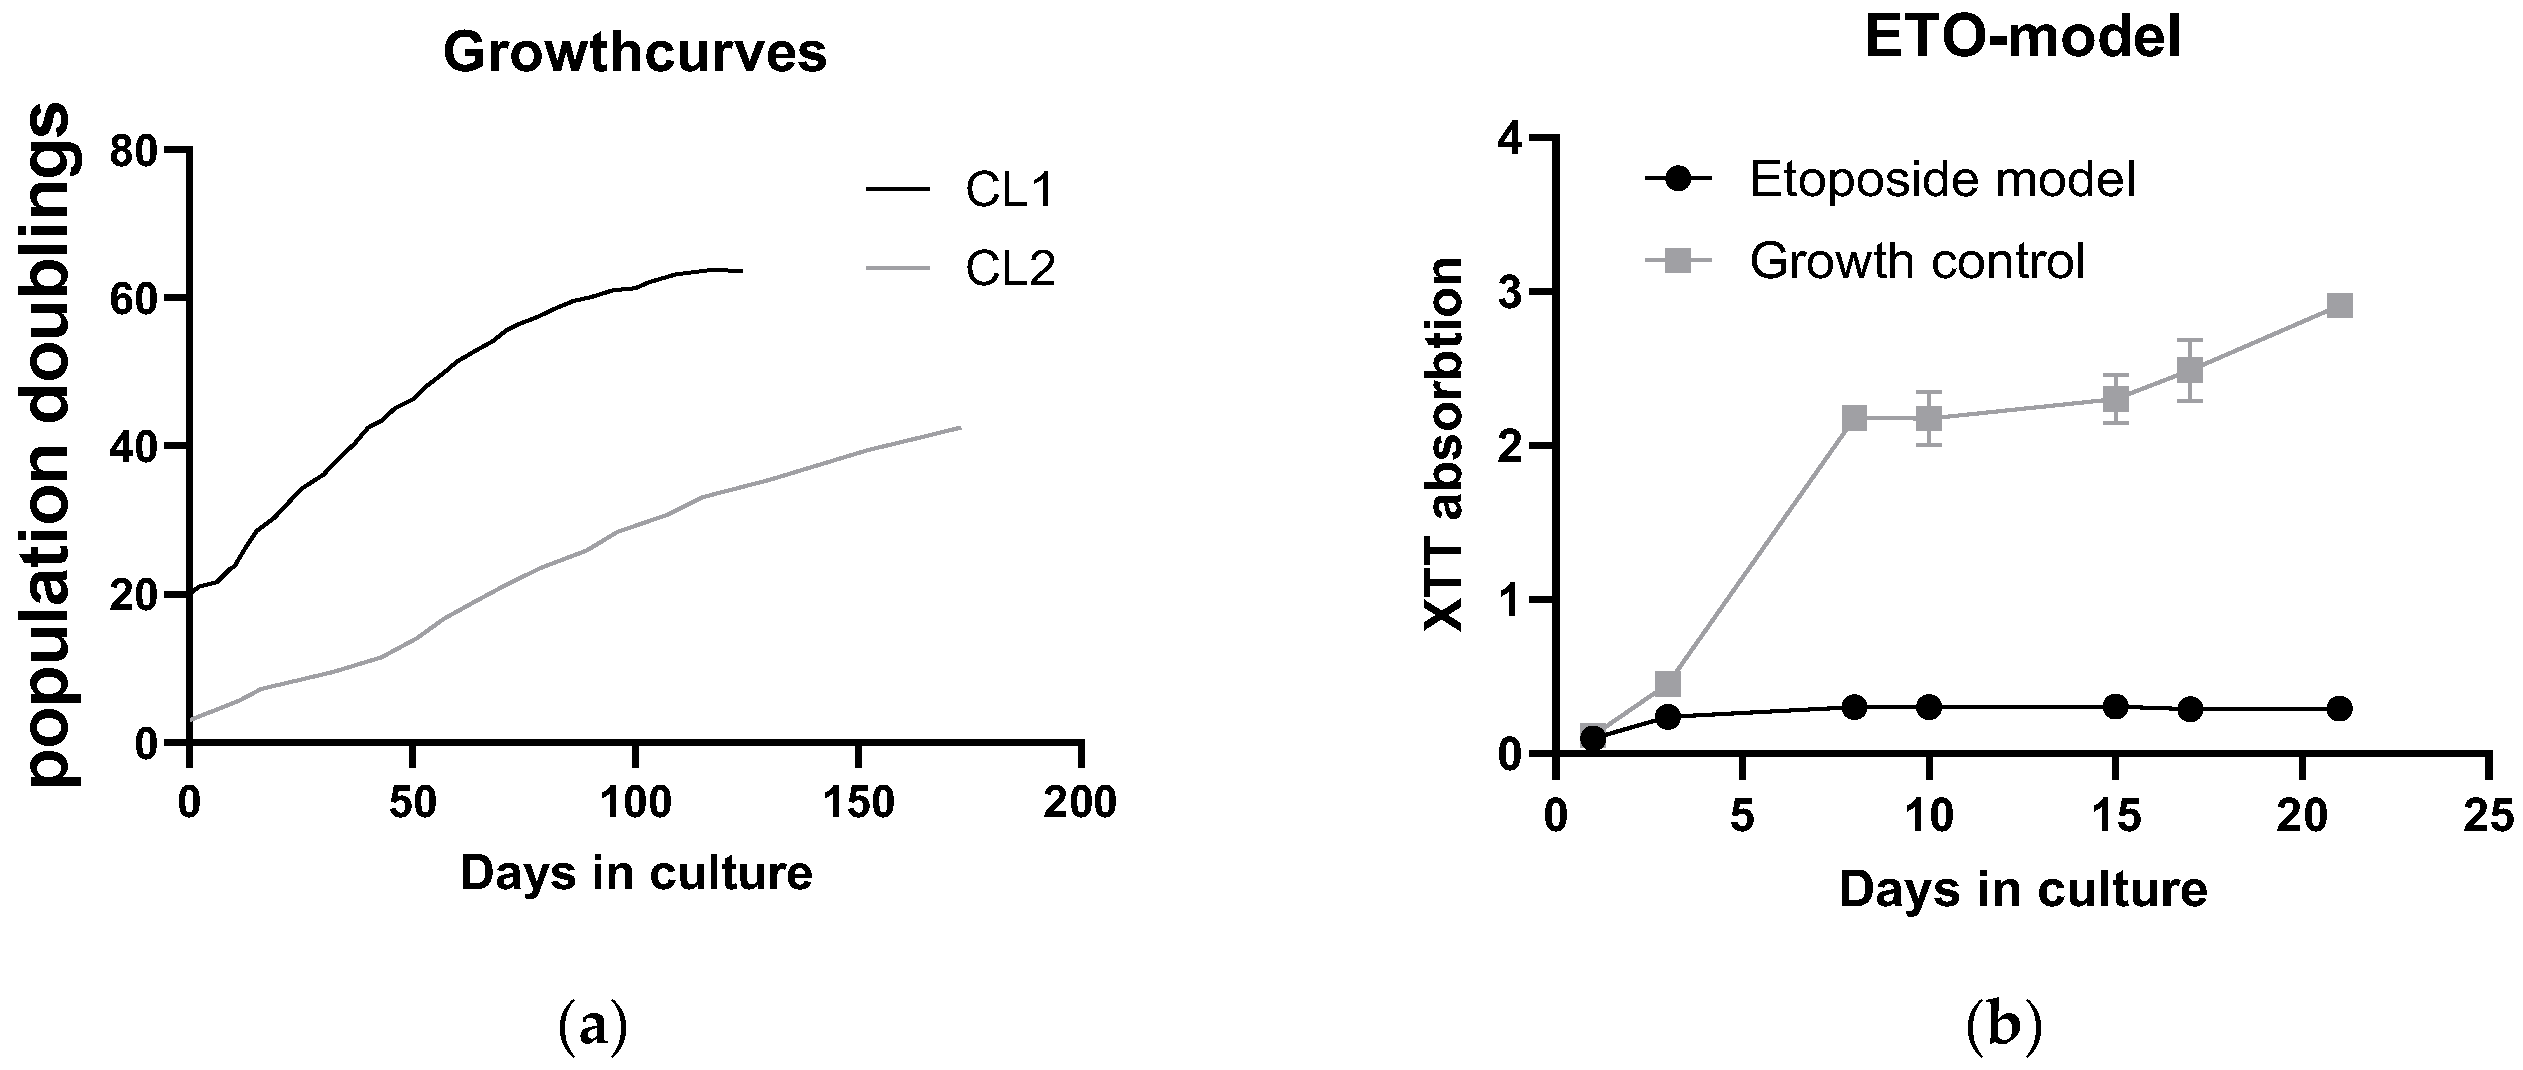
Figure 3.
Toxicity of extracts: (a) young cells of CL1 treated with extracts of chamomile, goldenrod, reishi and green tea; (b) old cells (etoposide treated) with confirmed establishment of cellular senescence treated with the same extracts (c) – (f) single graphs of the extract treatments (c) chamomile, (d) goldenrod, (e) reishi and (f) green tea (g) summary of EC50 values young (Y) and old (O) in a bar graph EC50 are lower in old treatment group (f) SA-ß-Gal positive cell count of young and old treated cells.
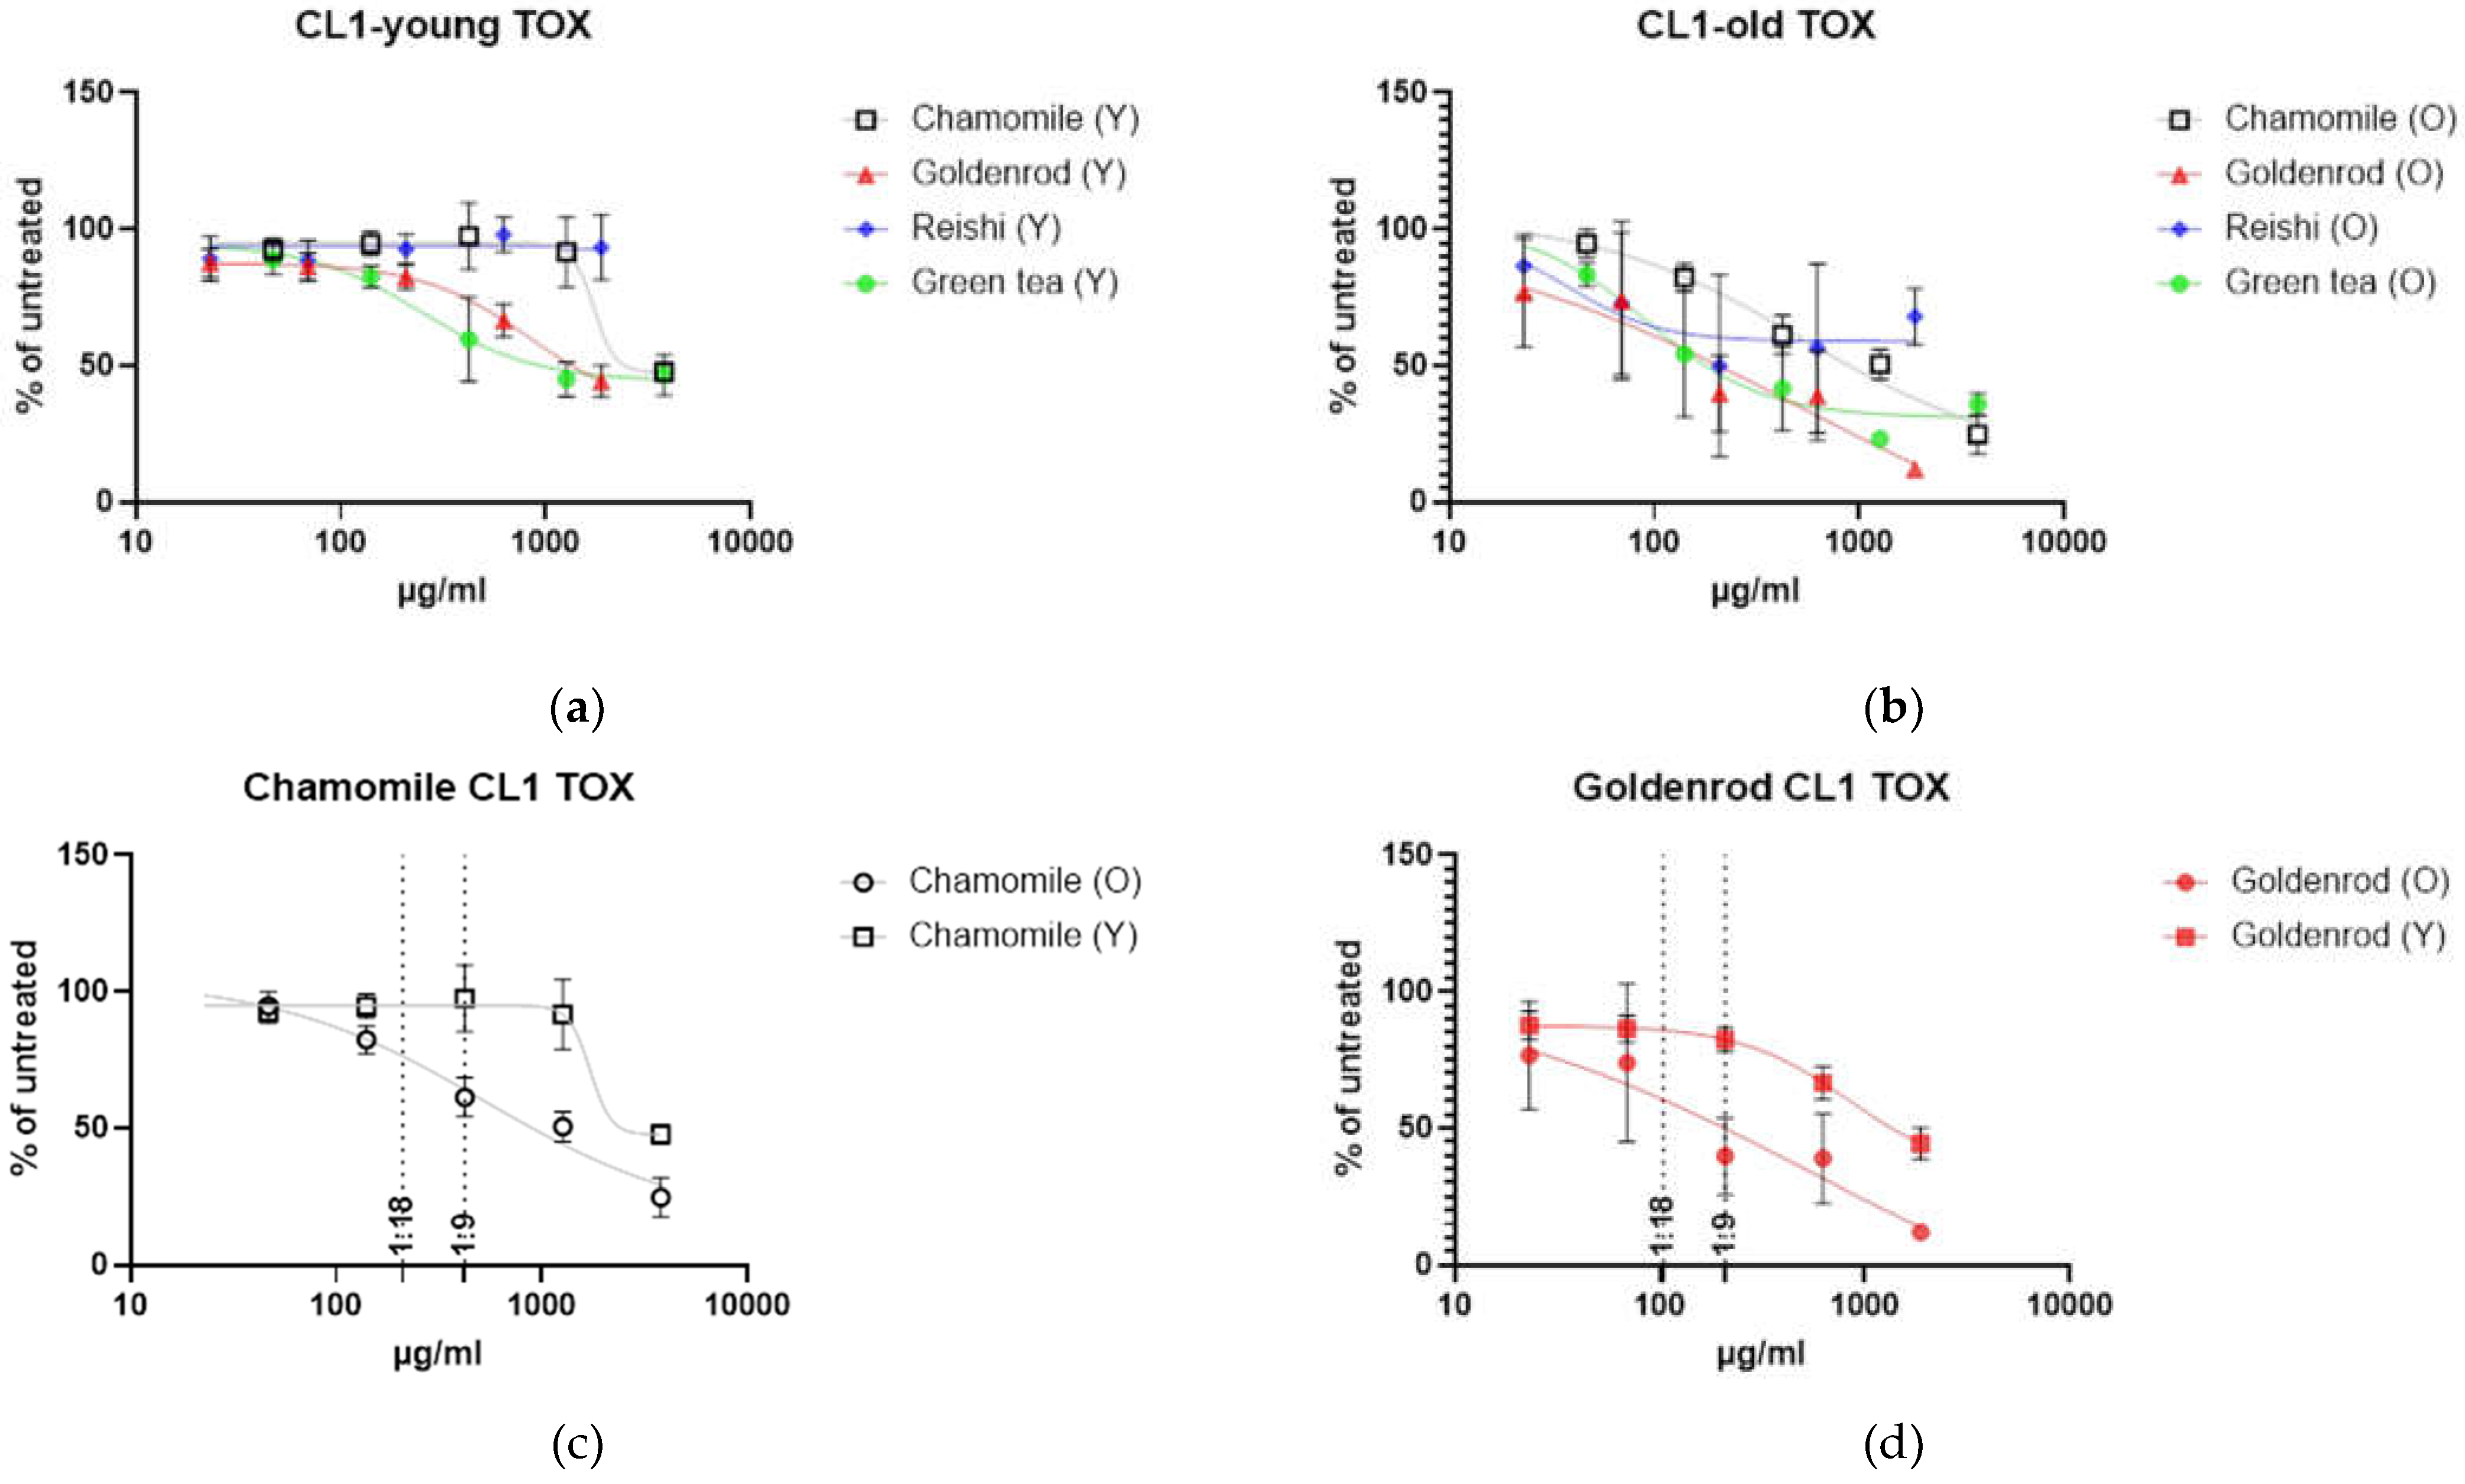
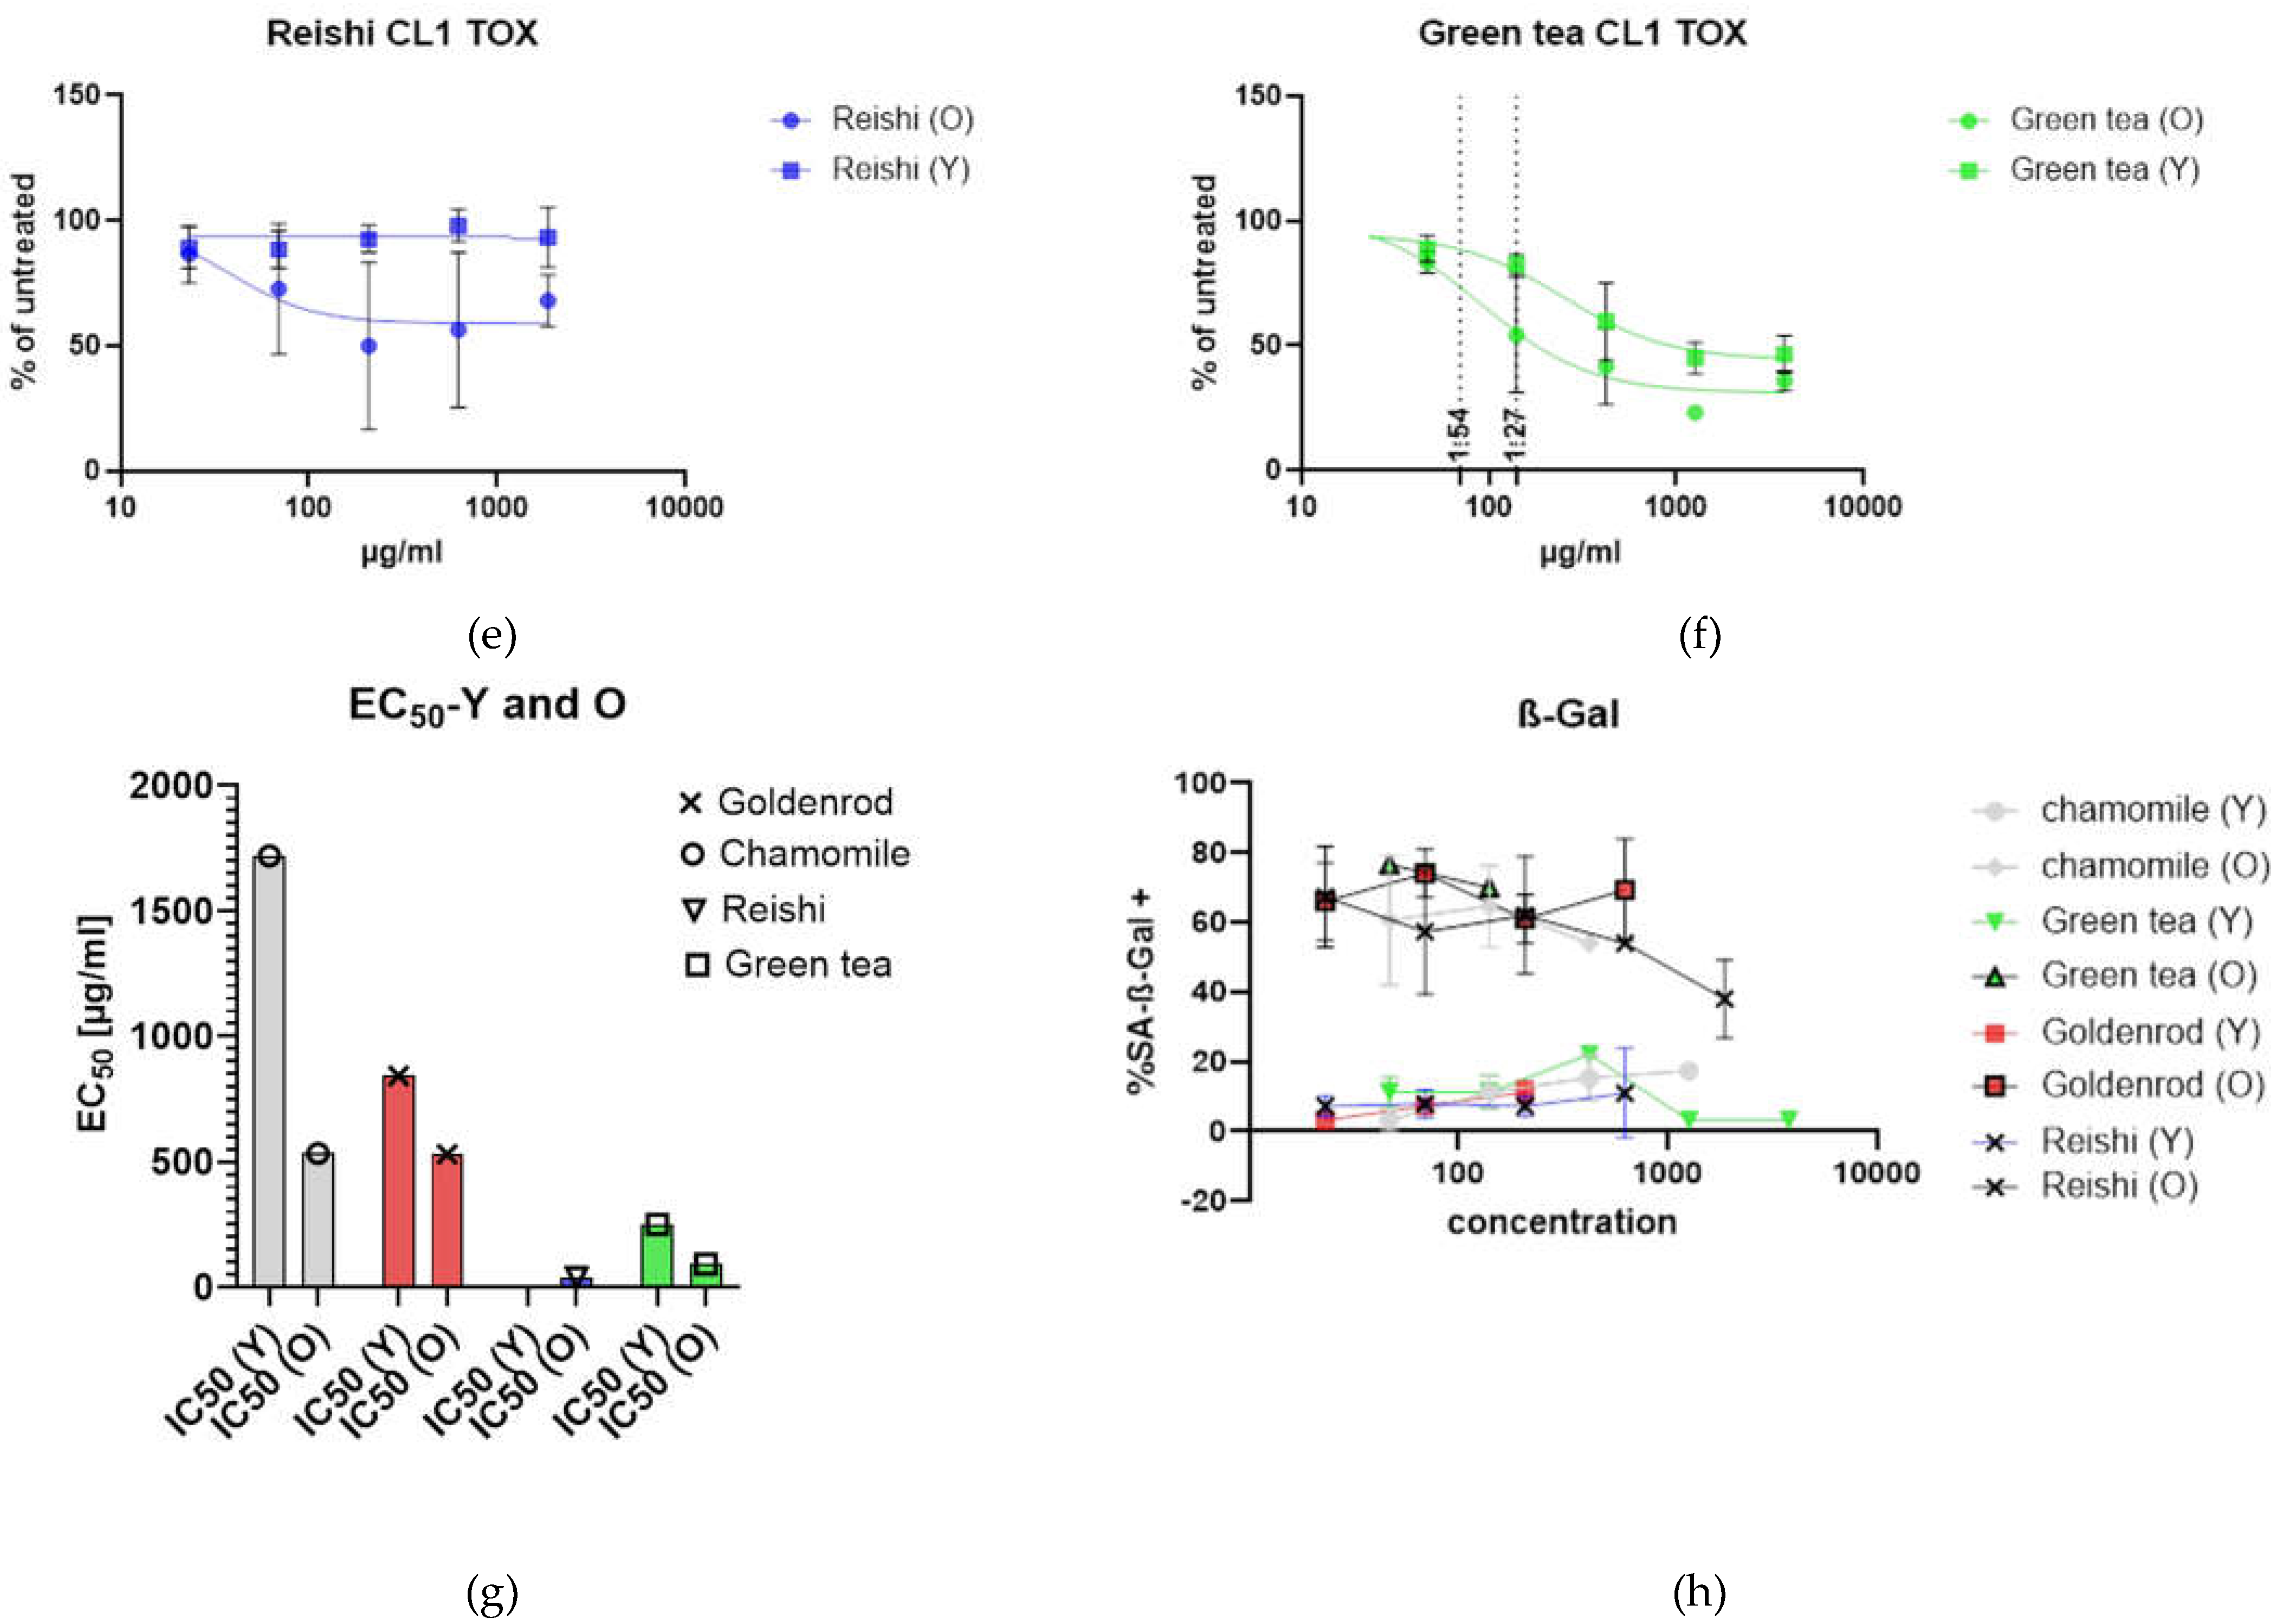
Figure 4.
Chronic treatment of cells: cells were seeded on day 0 and attachment took one day, then cells were treated with etoposide for 2d (48h), after a gap of one day herbal treatment was started and proceeded for 18 d with every media change after 3-5 days there were added fresh extracts.
Figure 4.
Chronic treatment of cells: cells were seeded on day 0 and attachment took one day, then cells were treated with etoposide for 2d (48h), after a gap of one day herbal treatment was started and proceeded for 18 d with every media change after 3-5 days there were added fresh extracts.
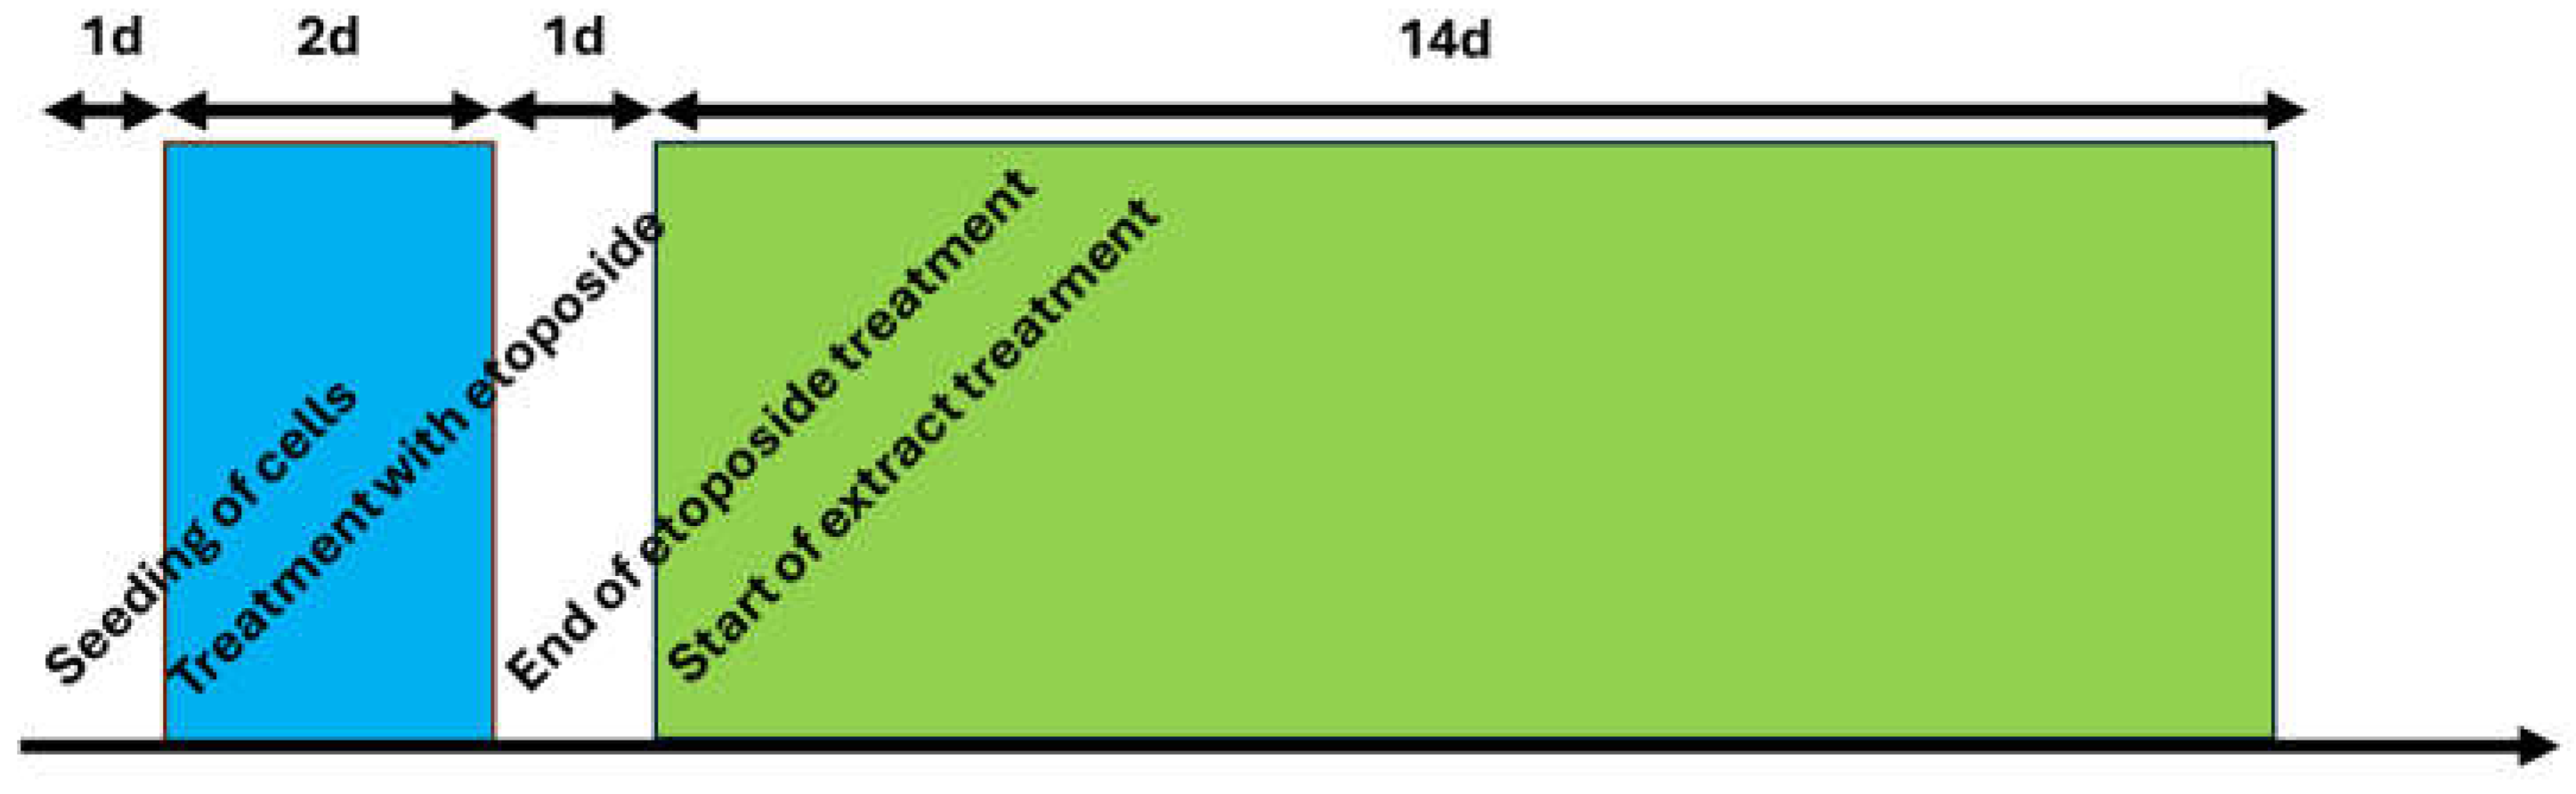
Figure 5.
Time course of chronic treatments of HDF CL1: in both graphs seeding of cells is marked by a dotted line at timepoint zero. Etoposide treatment is presented by a light blue area from day 1 to 3. After one day of regeneration the treatment was started also indicated by a grey area from day 4 to 18 which was the end of this experiment (a) Values as detected by ELISA. Chamomile shows a massive increase in IL-6 excretion quercetin and goldenrod show a decreased IL-6 production for different reasons explained in the text; (b) When normalized to ETO control alleviating and worsening effects of extracts can be seen even better.
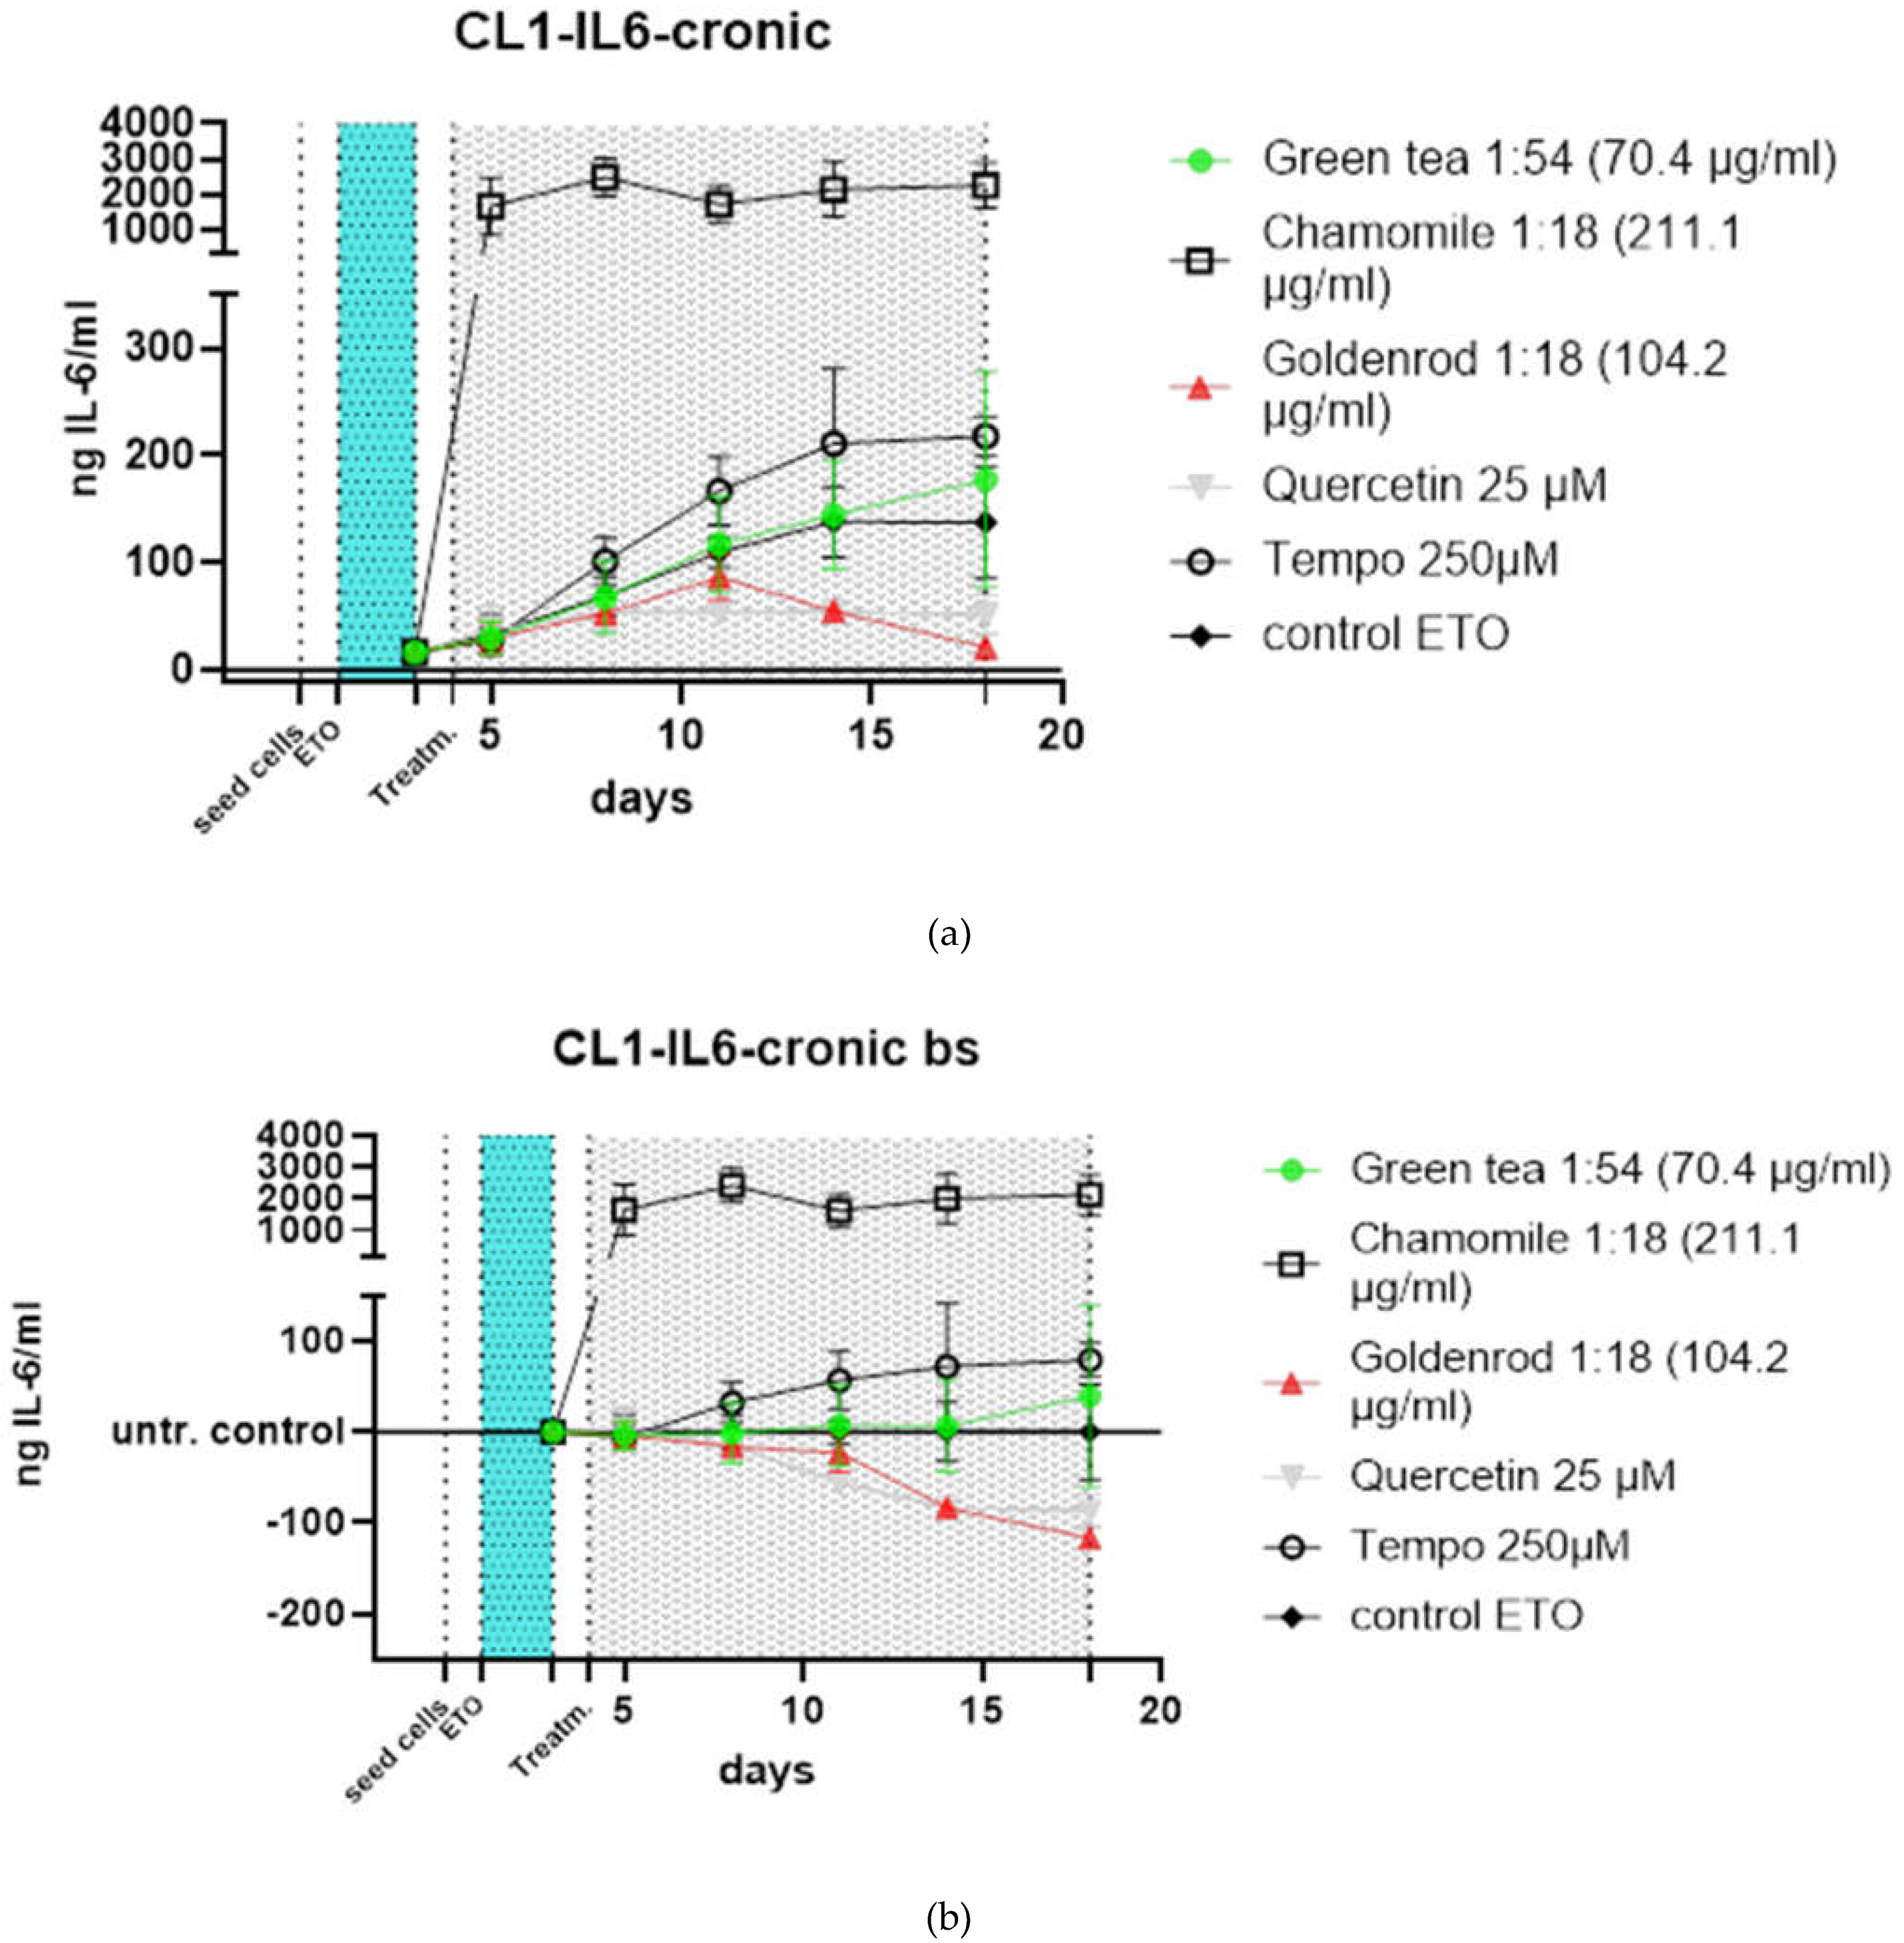
Figure 6.
Time course of chronic treatments of HDF CL2: (a) Values as detected by ELISA. Chamomile shows a massive increase in IL-6 excretion quercetin and goldenrod show a decreased IL-6 production also in CL2 because of senomorpic and senolyic properties respectively ; (b) Data normalized to control (blank subtracted (bs)) treatment illustrate the alleviating effects of quercetin and the massive induction of SASP by chamomile.
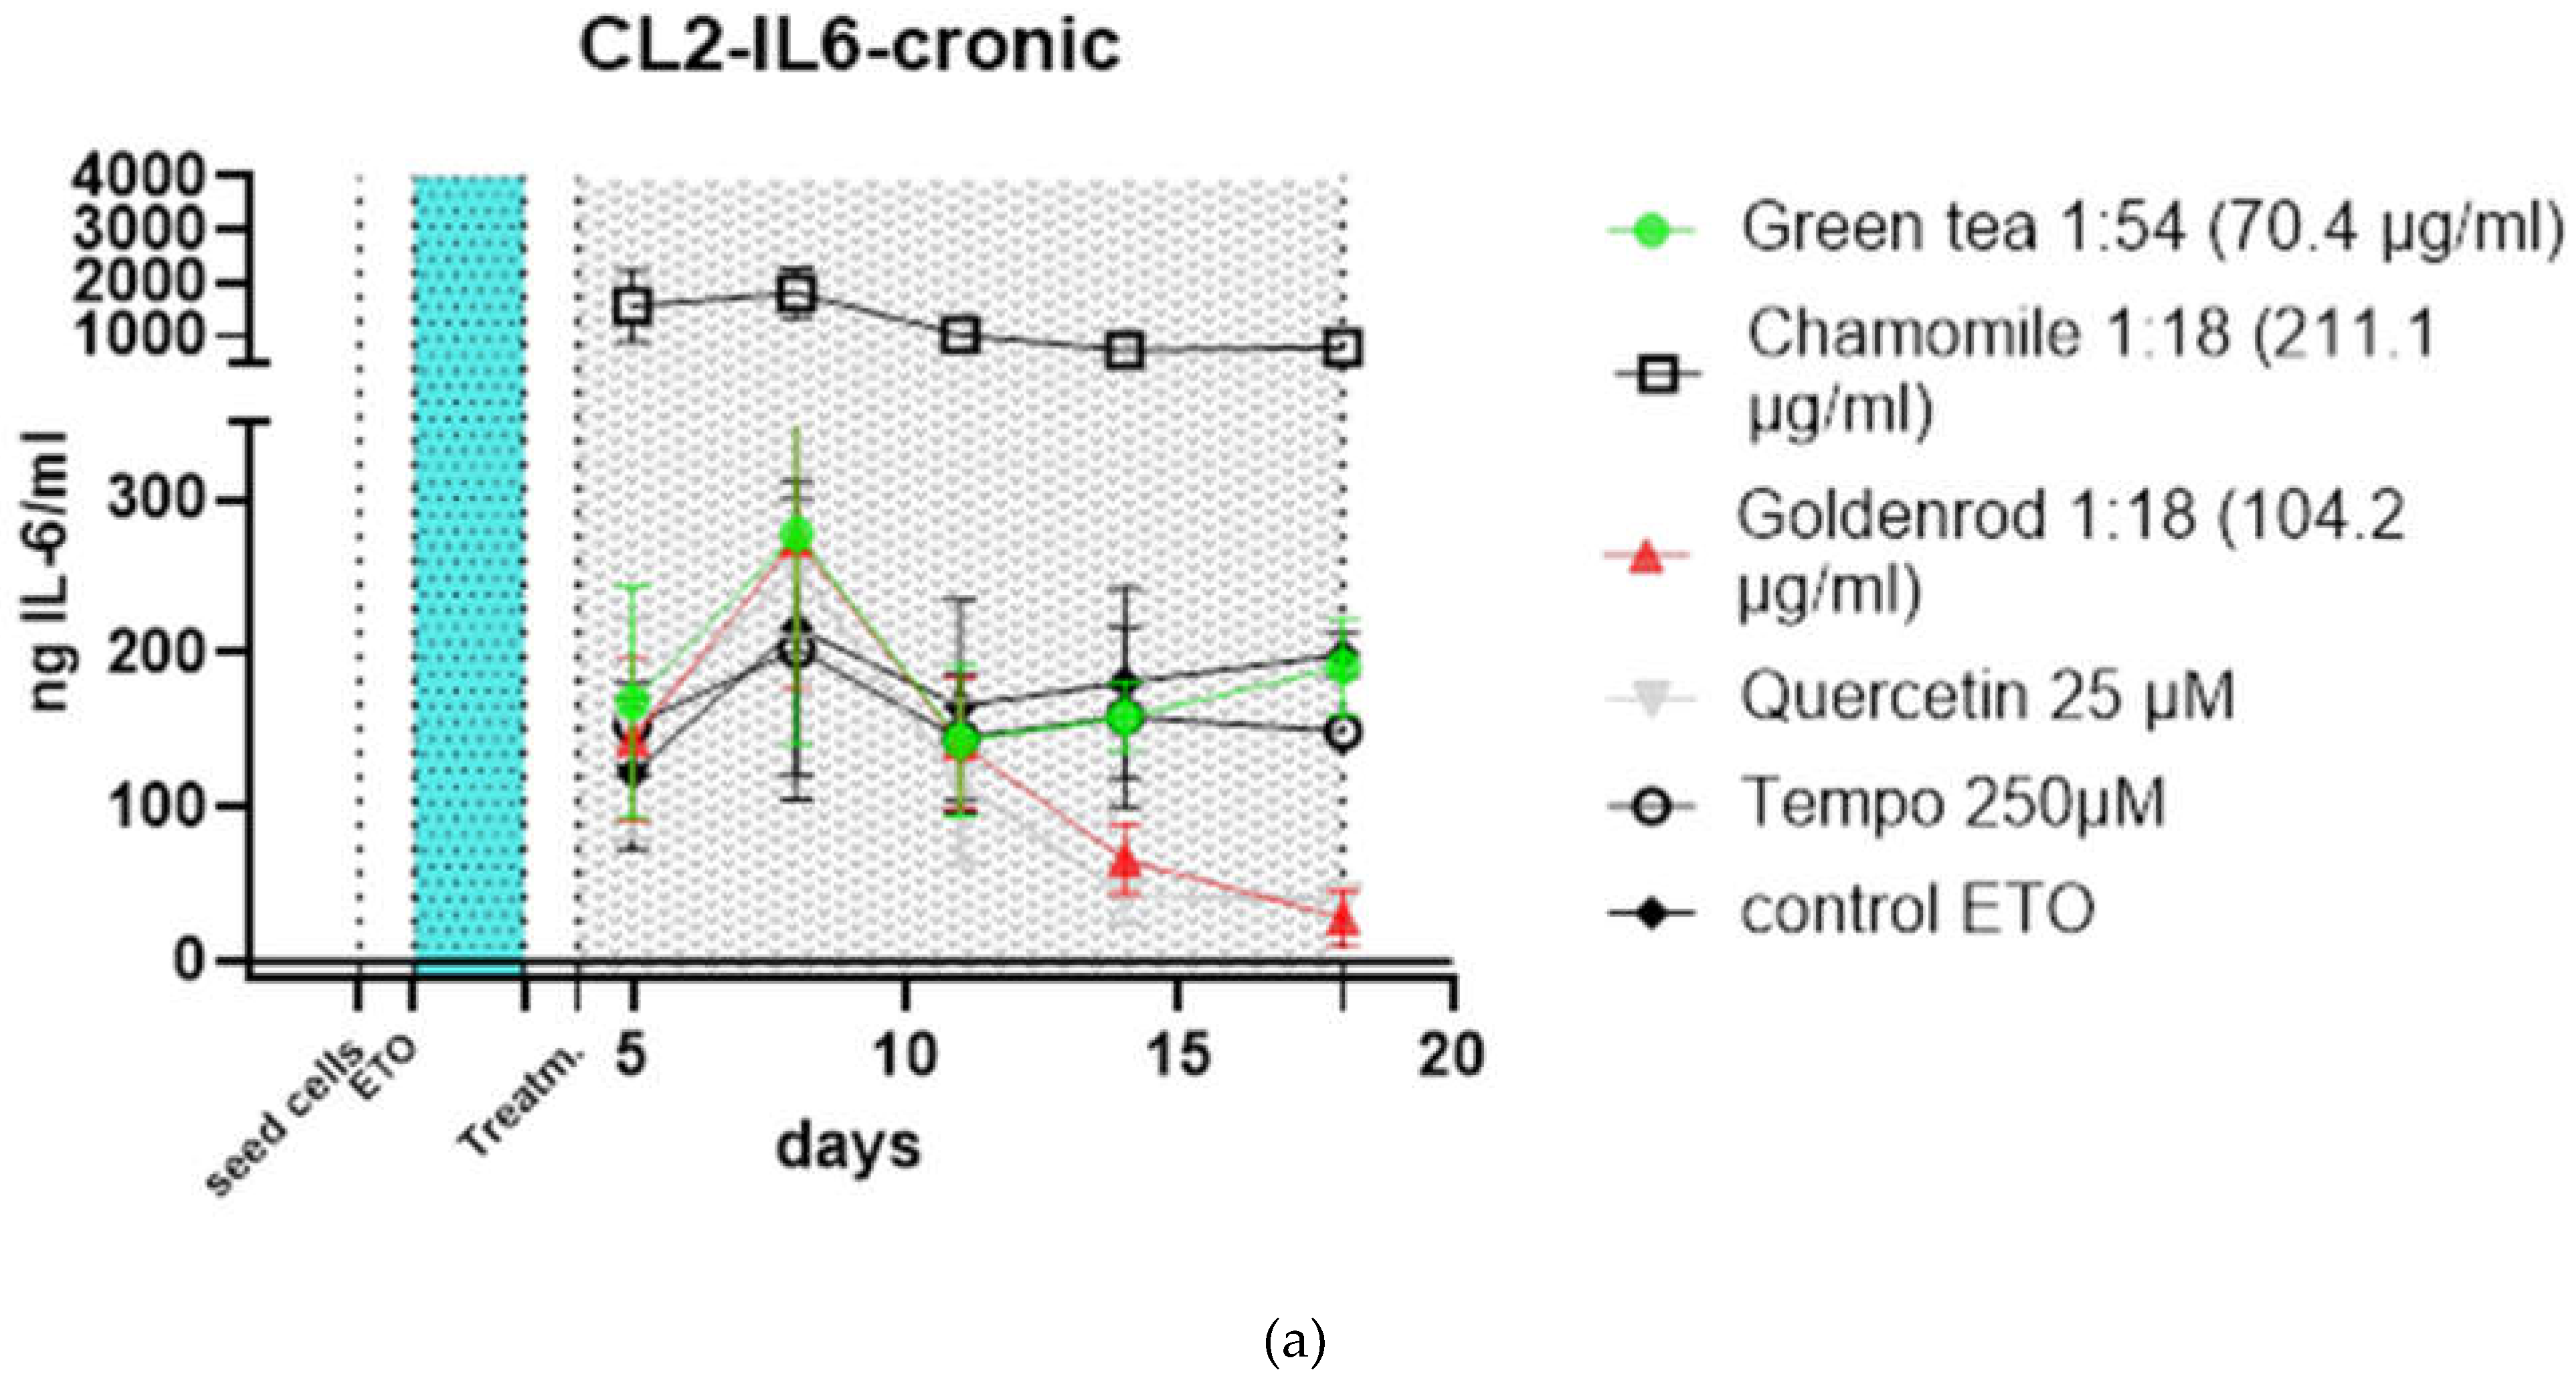
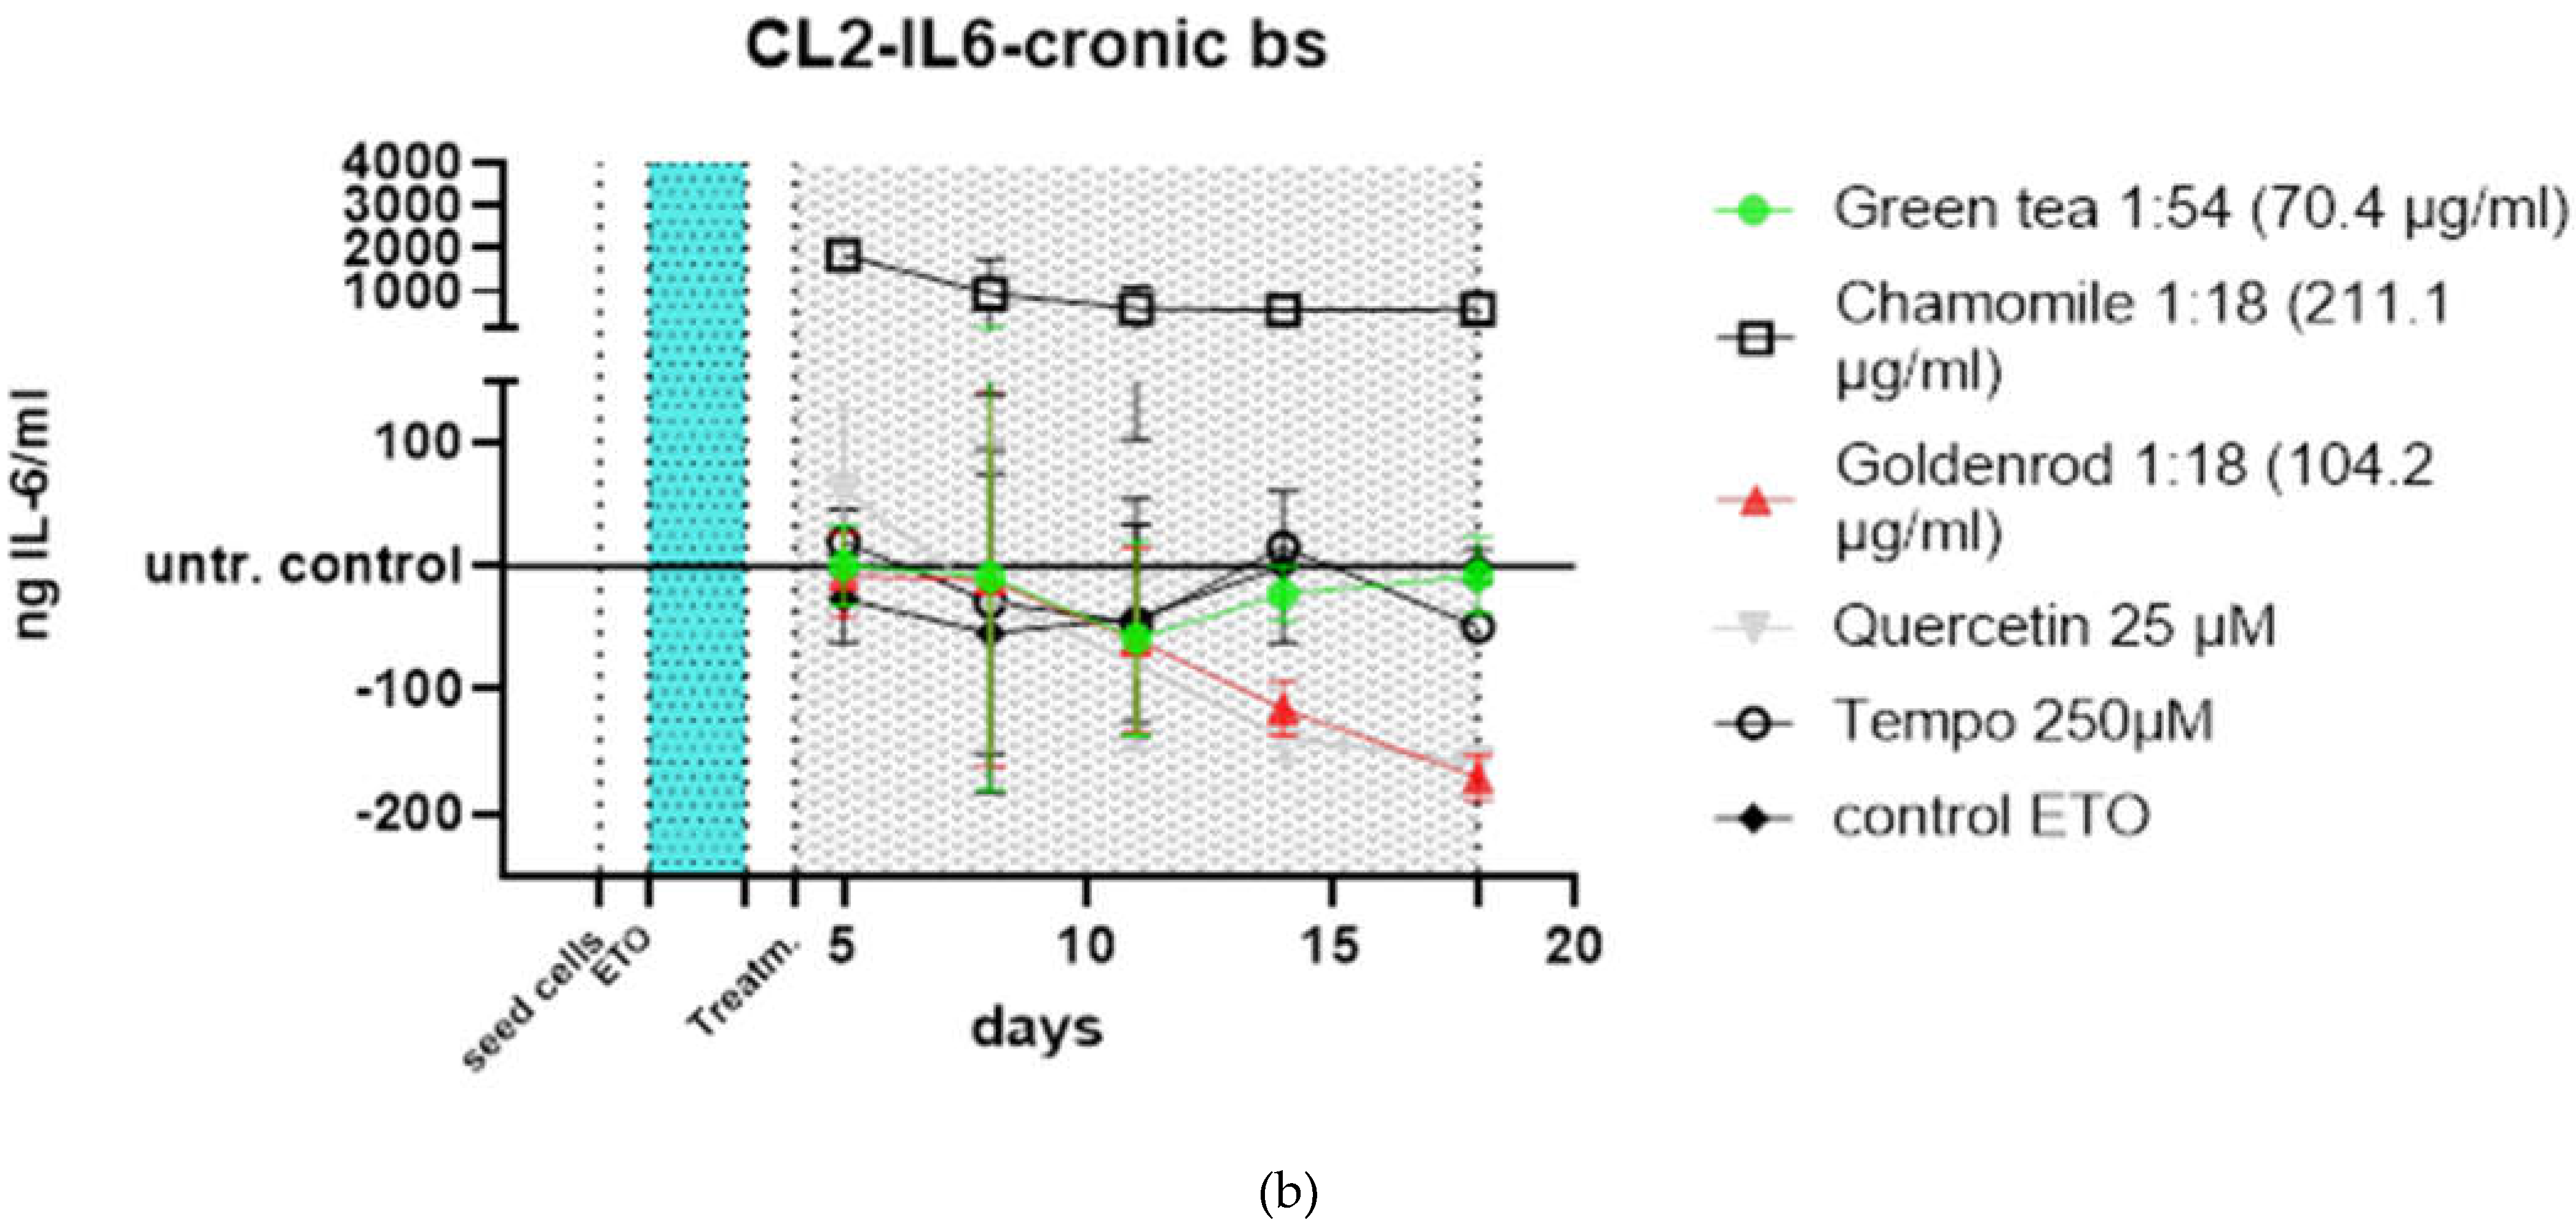
Figure 7.
Images of the cells from experiment described in section 2.3.1. (IL-6 secretion (SASP formation)). Rows show different treatments and columns the days when pictures were taken.
Figure 7.
Images of the cells from experiment described in section 2.3.1. (IL-6 secretion (SASP formation)). Rows show different treatments and columns the days when pictures were taken.

Figure 8.
Images of the cells from experiment described in section 2.3.1. (IL-6 secretion (SASP formation)). Rows show different treatments and columns the days when pictures were taken. Cells have less seeding density than in Figure 7. but induction of senescence worked as can be seen by arrested growth and senescent morphology (flattened appearance and less contrast of cells).
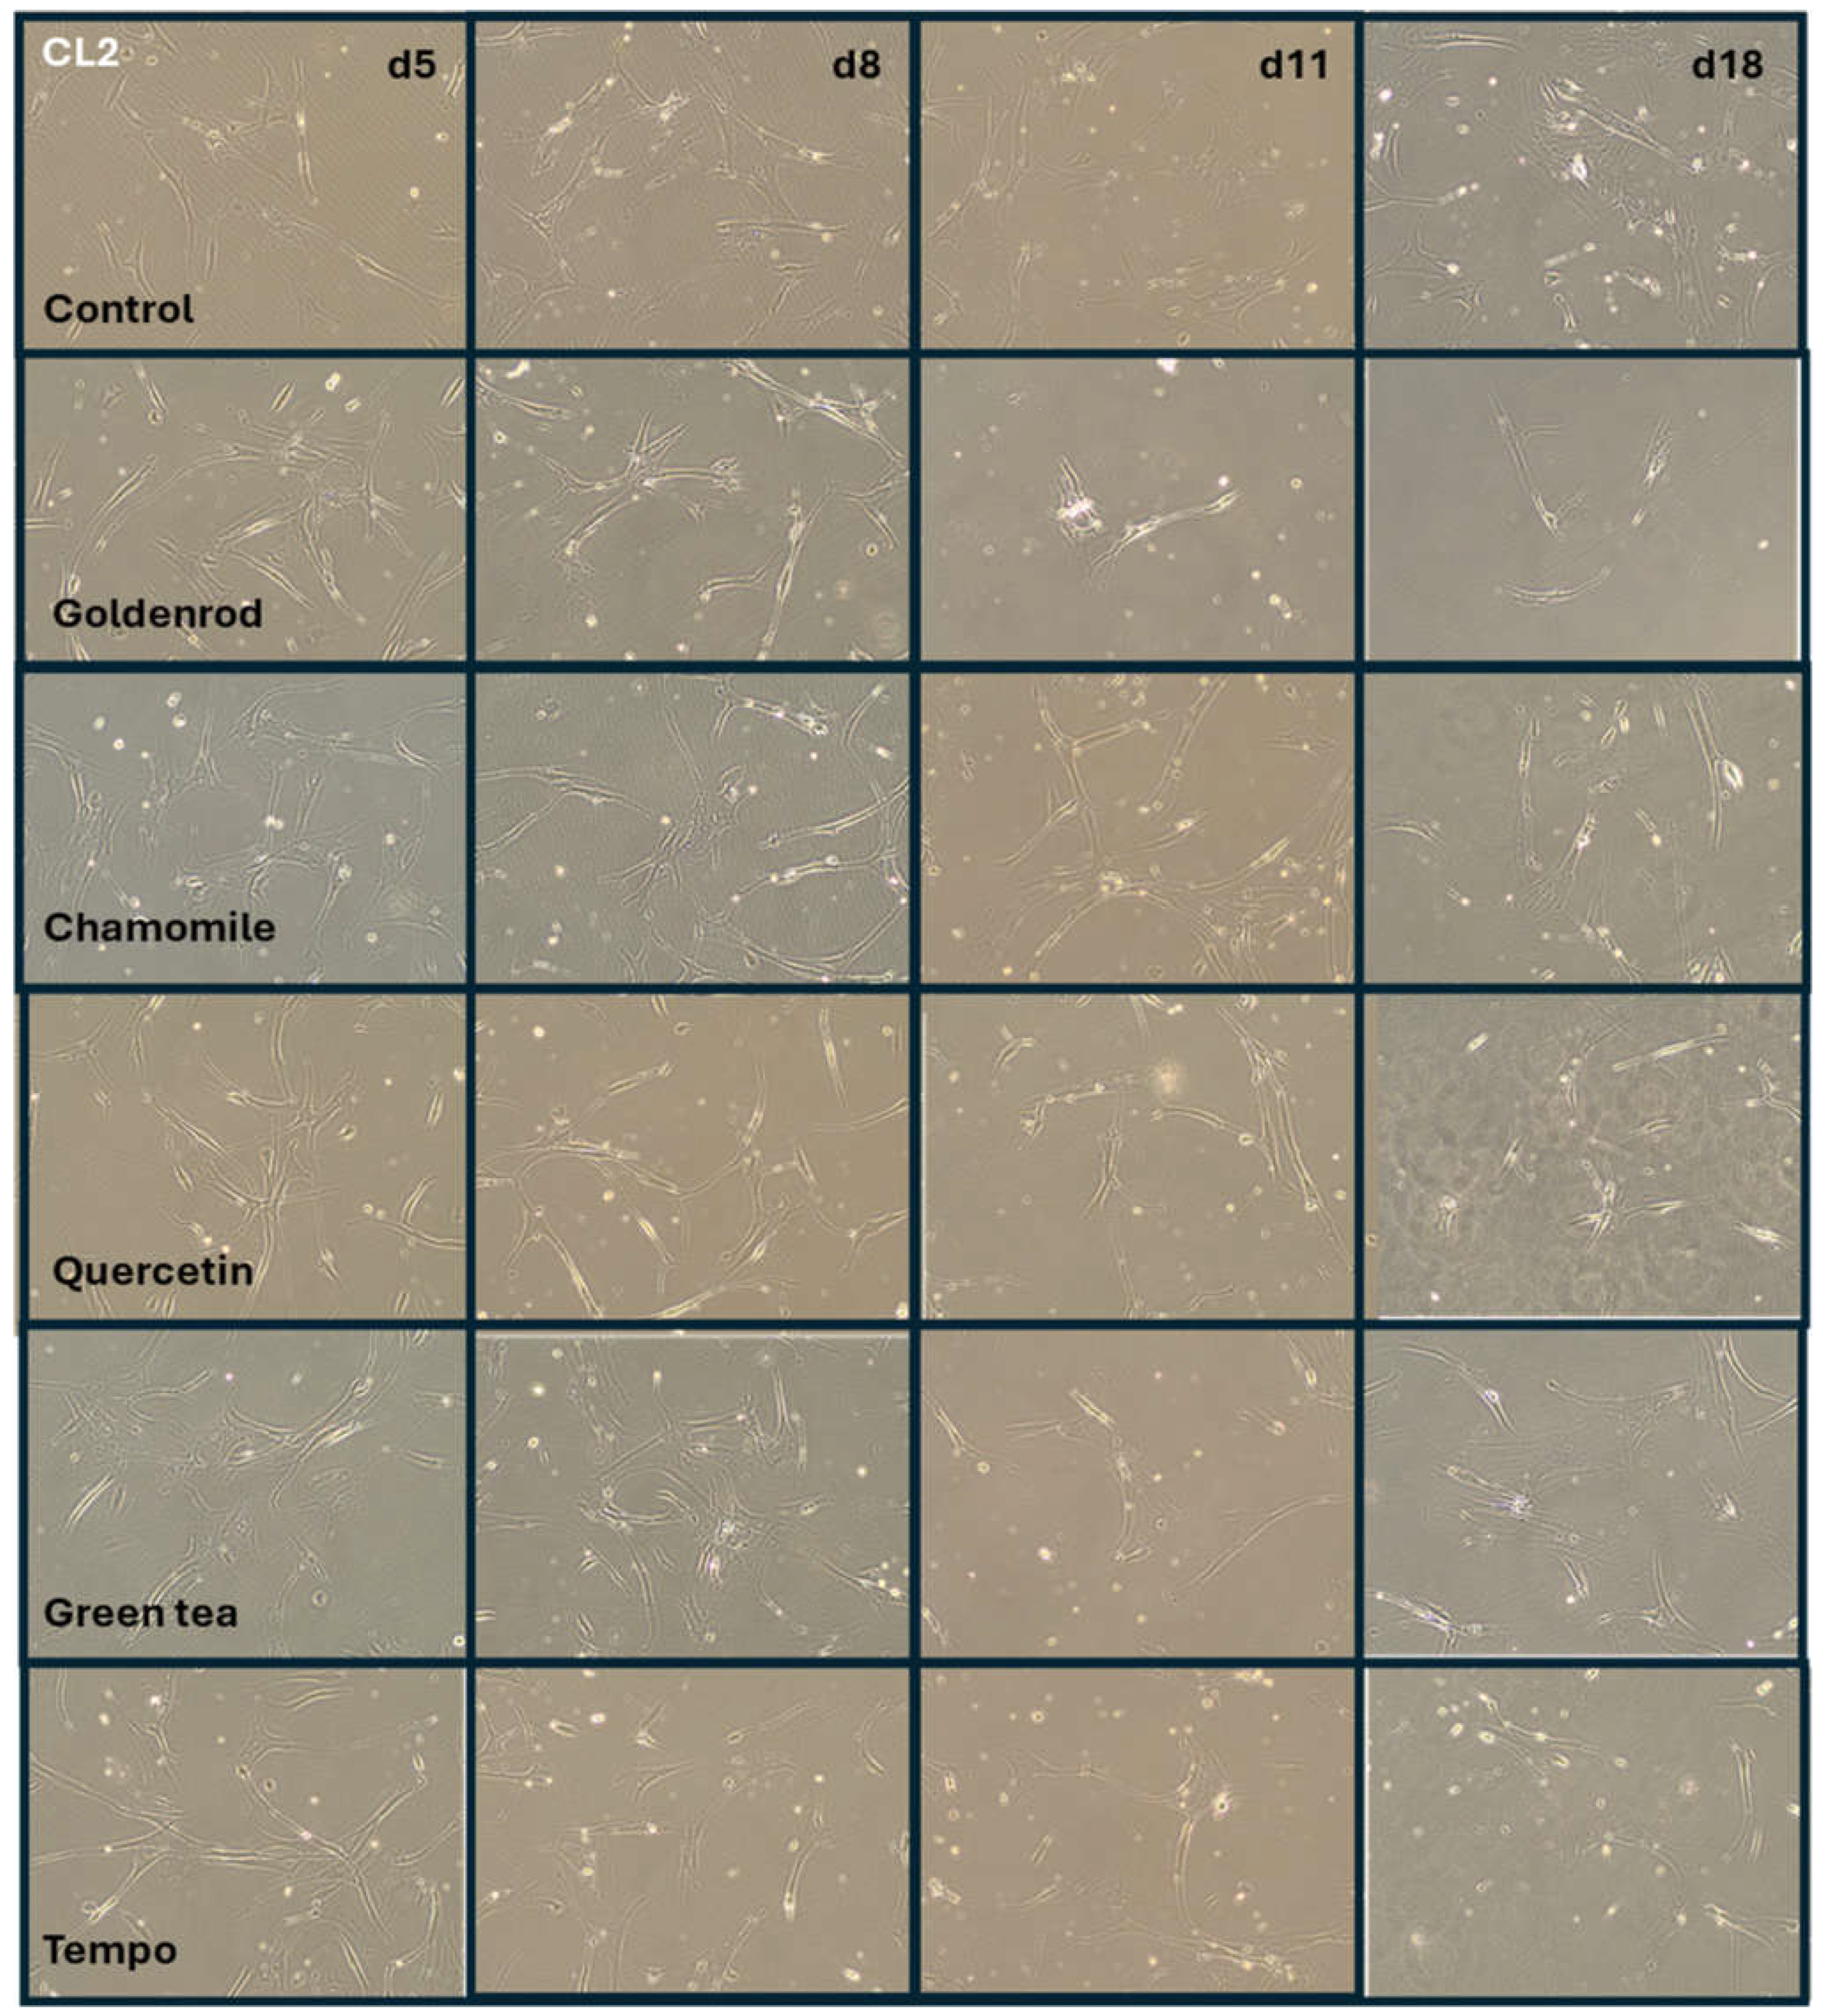
Figure 12.
Treatments, late and early, are showing short time exposure effects on damaged and etoposide induced senescent cells; (a) early treatment was performed after 2d of etoposide treatment 25 µM (light blue area) and one day of regeneration for 3 days (gray area); (b) Water control (non- extract-treatment) subtracted data, showing the differential expression of IL-6 protein compared to control; (c) late treatment (control subtracted) indicates treatment of cells that are already etoposide induced cellular senescent. Here you can see that chamomile is also inducing an IL-6 response but with a profound standard deviation (experiment was done in just one biological replicate.
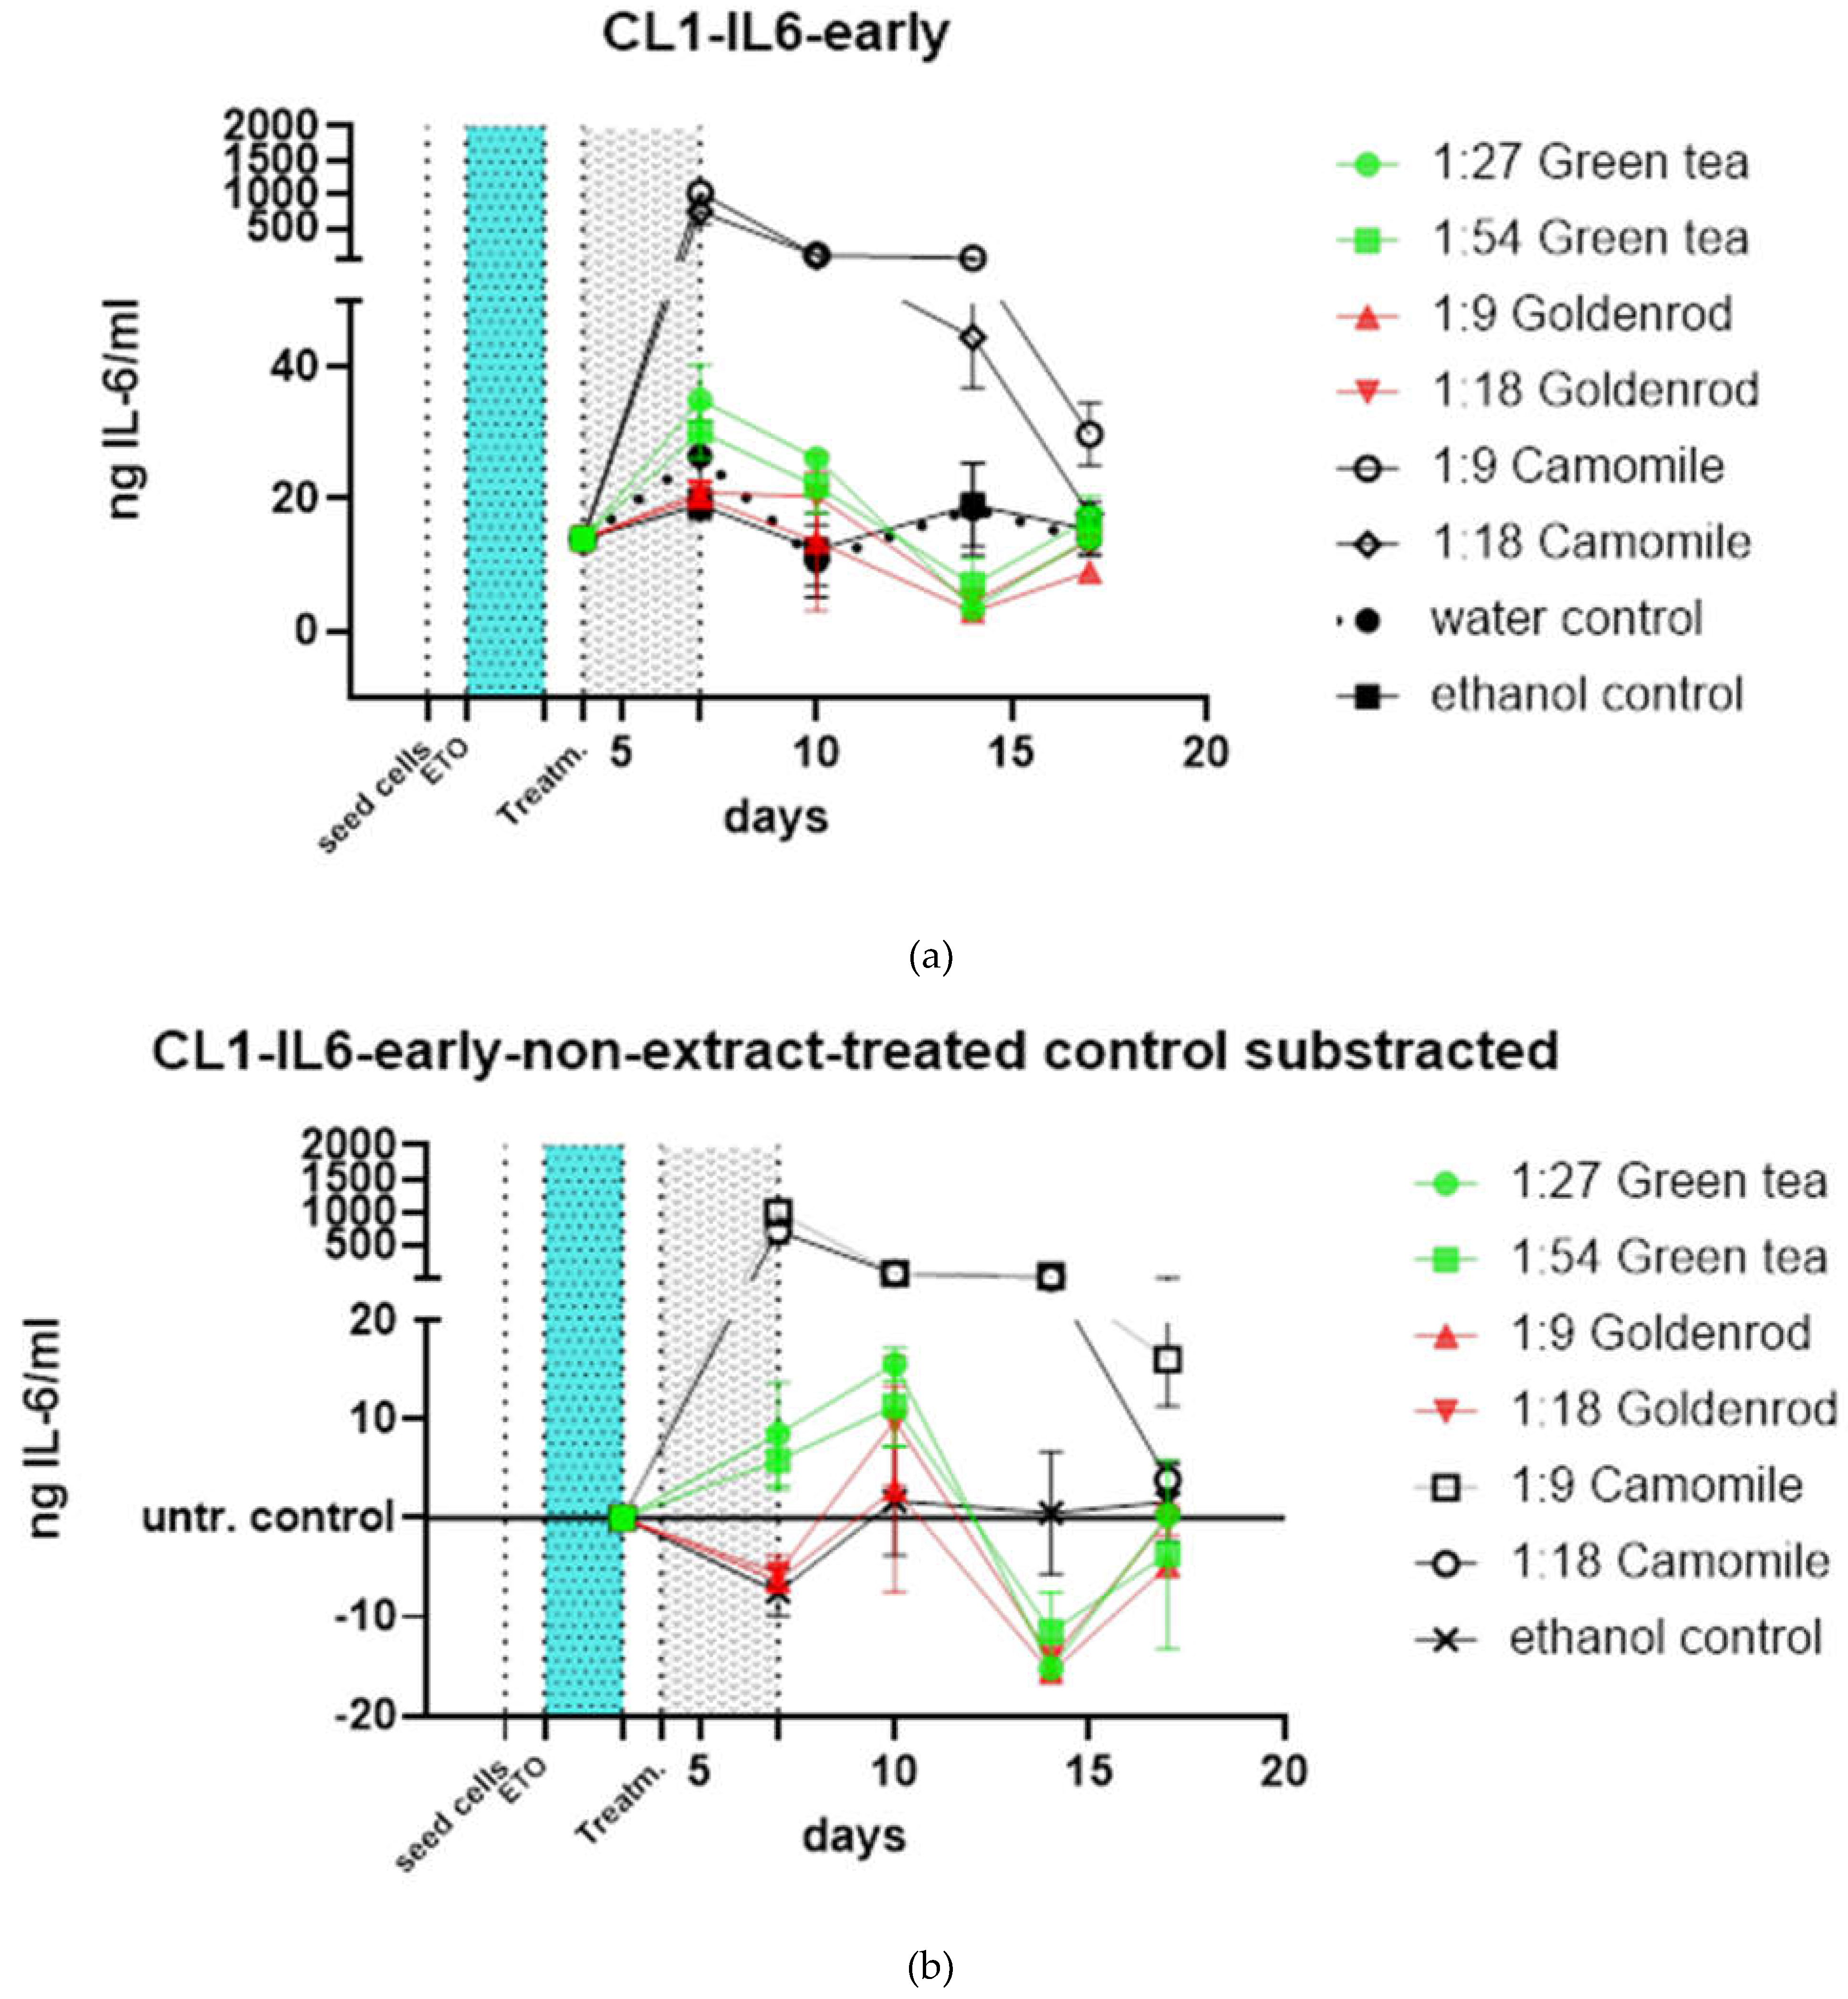
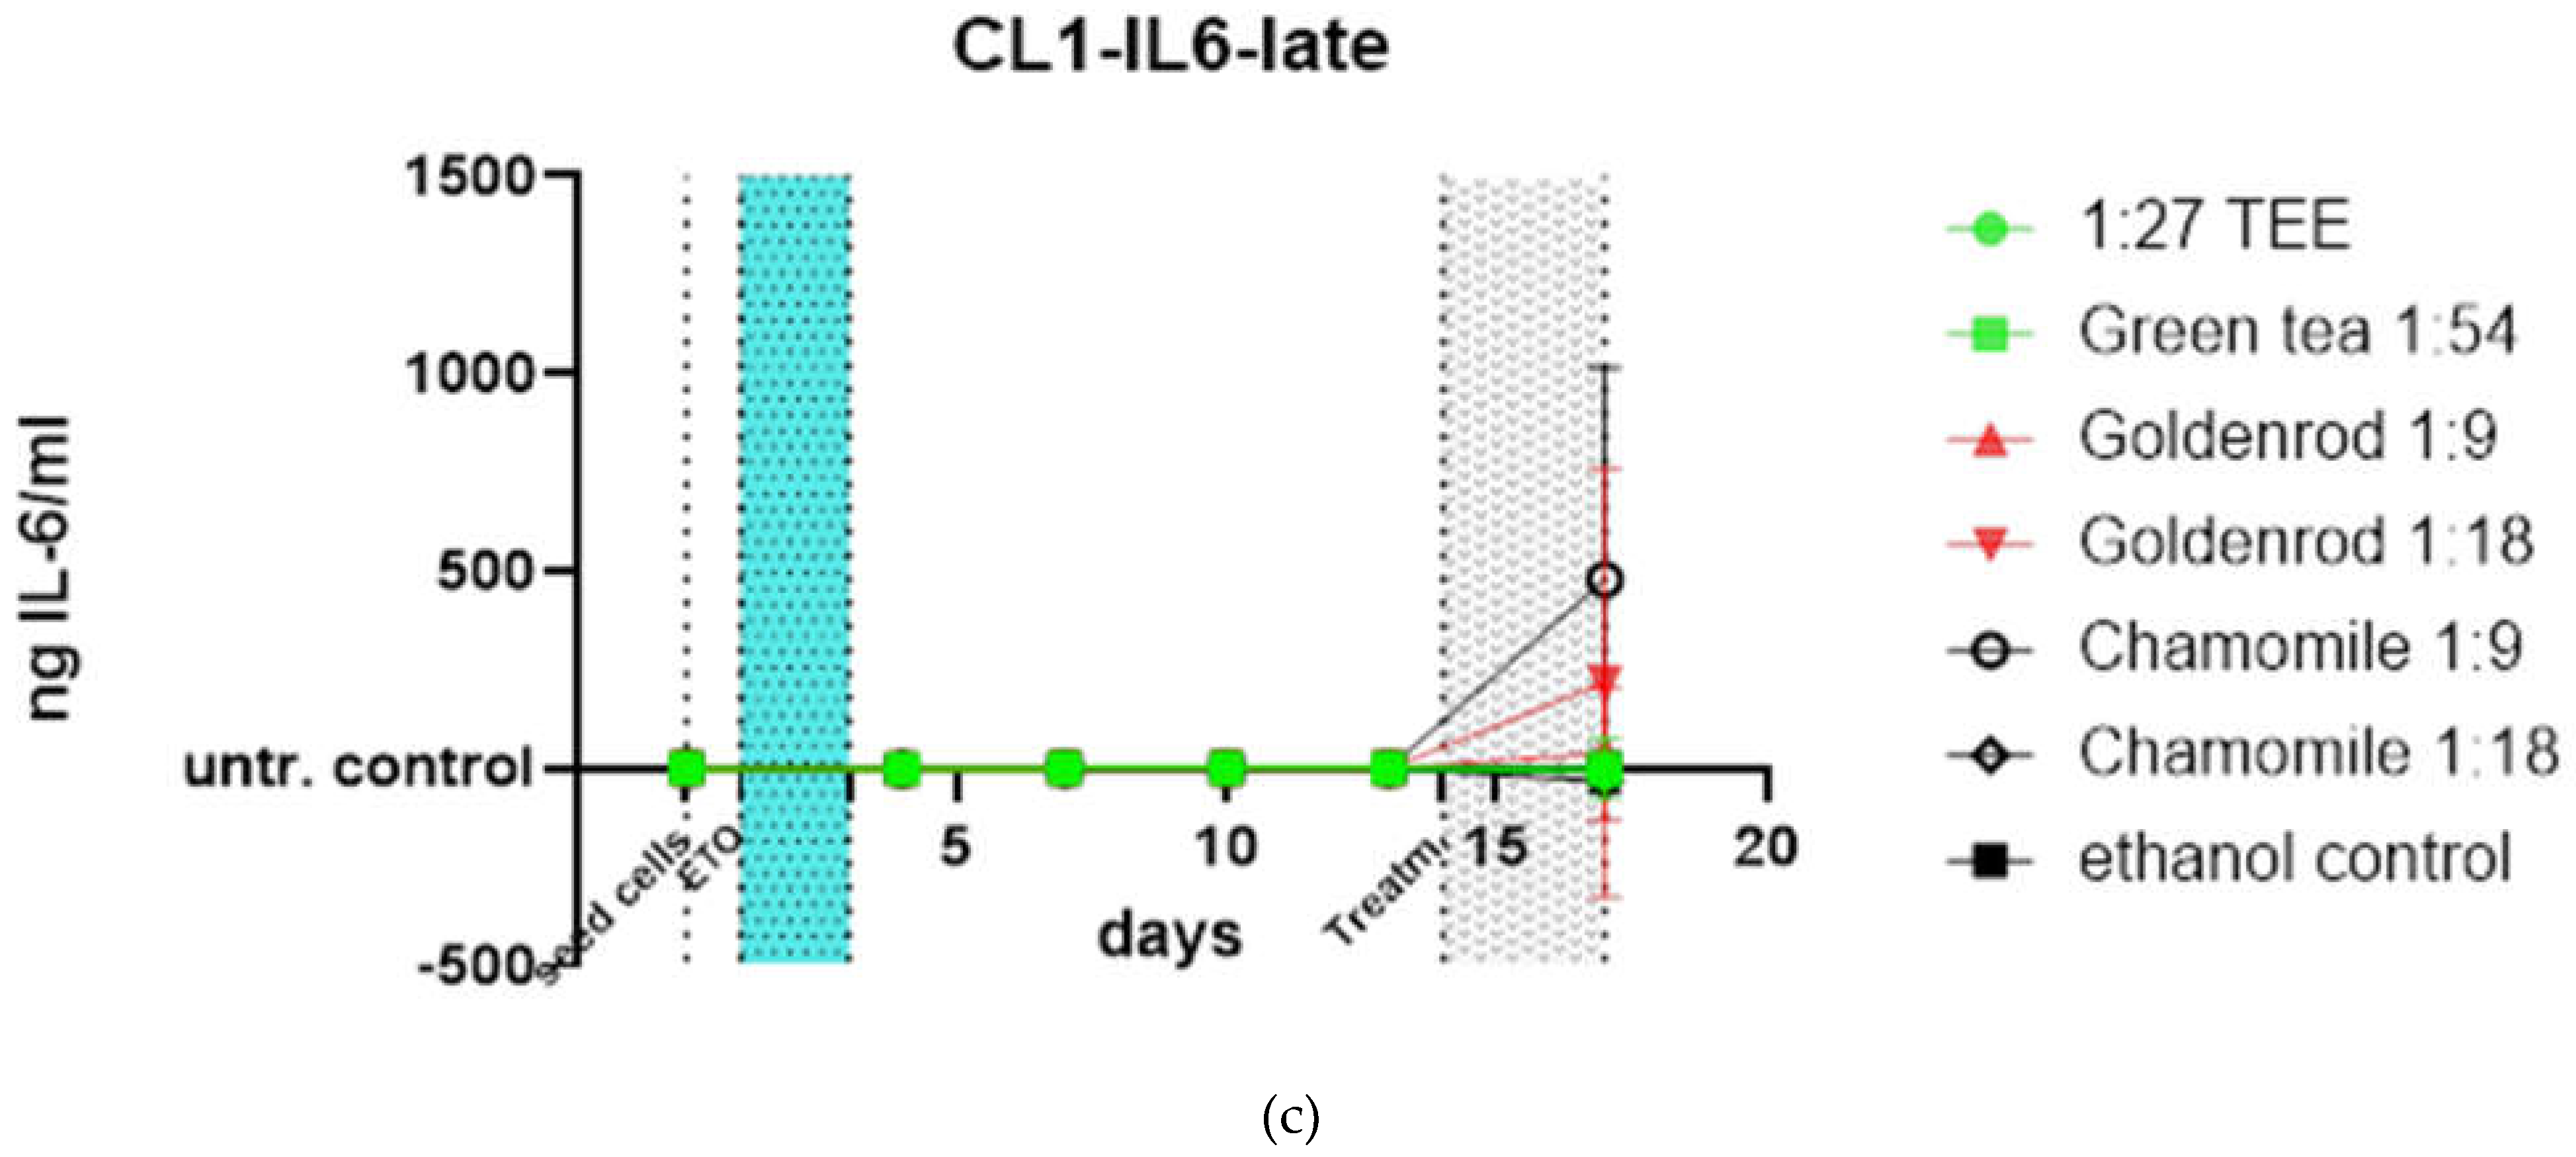
Table 1.
IC50 values of tested substances.
| Chamomile | Goldenrod | Reishi | Green tea | |
|---|---|---|---|---|
| IC50 (Y) | 1719 µg/ml | 841,6 µg/ml | Not stable | 250,1 µg/ml |
| IC50 (O) | 533,8 µg/ml | 530,5 µg/ml | 38,5 µg/ml | 91,97 µg/ml |
Disclaimer/Publisher’s Note: The statements, opinions and data contained in all publications are solely those of the individual author(s) and contributor(s) and not of MDPI and/or the editor(s). MDPI and/or the editor(s) disclaim responsibility for any injury to people or property resulting from any ideas, methods, instructions or products referred to in the content. |
© 2024 by the authors. Licensee MDPI, Basel, Switzerland. This article is an open access article distributed under the terms and conditions of the Creative Commons Attribution (CC BY) license (http://creativecommons.org/licenses/by/4.0/).
Copyright: This open access article is published under a Creative Commons CC BY 4.0 license, which permit the free download, distribution, and reuse, provided that the author and preprint are cited in any reuse.


