
Submitted:
02 August 2024
Posted:
06 August 2024
You are already at the latest version
Abstract
In the realm of physical activity and sports science, motion tracking emerges as an important tool for specialists aiming to analyze movement data, whether for daily life activities or enhancing athletic performance. This study introduces an innovative approach to motion tracking through the development of a fully embedded smart shoe sensor system, which employs an inertial measurement unit (IMU) affixed to the shoe sole, coupled with six pressure sensors, to provide real-time calculation of individual stride lengths along with other vital movement statistics. Traditional motion tracking methods, which typically rely on various body-attached sensors, often necessitate substantial post-processing, delaying the feedback loop. In contrast, our system is designed to overcome these limitations by offering high-accuracy, real-time feedback with a minimal error rate of 1.88% from our experiments. Such prompt data acquisition facilitates immediate interventions by sports performance coaches or healthcare professionals, significantly contributing to injury prevention and performance enhancement. The experimental outcomes of this study underscore the system’s capability to deliver precise stride length measurements instantaneously, marking a significant advancement in motion tracking technology and its application in sports science and healthcare.
Keywords:
biomechanics
; foot sensor
; inertial measurement unit
; stride length calculation
1. Introduction
Shoes have been a vital component of our everyday lives and one of our greatest inventions for millennia. They were initially created to help protect our feet and provide us with safety from harmful environments or harsh conditions. Archaeological findings indicate that the earliest footwear dates back to 30,000 to 40,000 years ago [1,2,3], with discoveries in Upper Paleolithic cave sites across Europe, such as Grotte de Fontanet in France [4,5] and the Sunghir site in Russia [6,7], as well as in Tianyuan cave in China [8,9]. The oldest known footwear recovered, sandals made of grass and woven sagebrush bark, were found in North America around 6,500 to 9,000 years ago at sites like Fort Rock Cave in Oregon [10,11,12,13], and Arnold Research Cave in Missouri [14]. Thousands of years later, in the modern world, shoes have been widely adopted almost everywhere, and their designs have been improved so much to be more comfortable, more durable, and better looking that they are no longer simple pieces of clothing for protection but have been developed into symbols of fashion and a crucial aspect of our lives. Nowadays, in an era characterized by unprecedented advancements in technology, the significance of footwear extends far beyond its traditional roles of providing safety and complementing fashion. Footwear is evolving into a tool with immense potential to enhance human health and well-being. This evolution has given rise to the idea of ’smart shoes’, devices that are capable of tracking your activities and a multitude of health-related metrics.
Smart shoes have the ability to revolutionize the way we interact with our footwear due to their advanced functionality and practical applications. They are often equipped with an array of sensors like pressure sensors, magnetometers, temperature sensors, and gyroscopes [15], which can help us monitor our health, improve our athletic performance, and even prevent injuries. In healthcare, smart shoes can be used to track a patient’s gait and mobility, allowing early detection of diseases such as Parkinson’s [16] and Alzheimer’s [17,18] or identifying anomaly in walking patterns to support for individuals contending with conditions like partial paralysis [19]. Early identification of these issues allows individuals to seek treatment sooner, which may avoid further complications. This is particularly beneficial for patients with mobility disorders or those in rehabilitation, as they provide healthcare professionals with detailed insights into their patients’ progress and needs, offering precise feedback on information such as weight distribution or walking symmetry [20]. Moreover, their applications also encompass the intricate nuances of human locomotion by monitoring and analyzing our gait patterns and balance, which can be key tools in detecting the risk of falls or potential injury [21,22]. They continuously monitor the wearer’s walking patterns and can alert caregivers or medical professionals to any irregularities, thus ensuring timely intervention and care. The utility of smart shoes is not confined to injury prevention alone. This intelligent footwear is versatile and proficient in meticulous movement tracking and calorie expenditure calculation, as shown in [23,24]. In the realm of sports and fitness, smart shoes have become invaluable tools for athletes and fitness enthusiasts, offering data of various parameters like stride length, movement speed, foot strike pattern, and overall performance [25], thereby aiding in enhancing training efficiency and reducing risk of injury. Furthermore, it assumes the role of providing a deeper understanding of human biomechanics for athletes of all sports dedicated to honing their proficiency, facilitating personalized training programs and performance improvement, whether on the golf course, tennis court, or ski slope.
Of all the different metrics that can be tracked through the utilization of smart shoes, stride length calculations play a crucial role in various domains, offering insights into human mobility and its implications for health, sports, and technology. Traditionally, stride length was measured manually or through observational techniques. These approaches, while fundamental and simple, were often limited in their application. For instance, they were commonly used in controlled environments like treadmills, where the consistent, flat surface and the restricted area of movement made observation and measurement more manageable as in the case of [26,27]. However, these traditional methods are less effective in dynamic, real-world scenarios where stride patterns can vary significantly and the area of movement is not constrained to any specific environment. With the rise in technology, modern methods can utilize sophisticated sensors, motion capture systems, and a variety of algorithms to calculate stride length.
At the center of this technological evolution are wearable devices such as smart shoes and fitness trackers. These devices are often outfitted with a variety of sensors, including Global Positioning System (GPS) technology, which is particularly useful in tracking outdoor activities. In [28], a GPS system attached to the body of field hockey players was used to track the total distance covered during the span of a game. However, it is pointed out in [29] that GPS technology itself may not provide sufficient accuracy for high-precision tracking, especially in indoor environments or areas with limited satellite visibility. In such scenarios, Inertial Measurement Units (IMUs) emerge as a more effective alternative, equipped with accelerometers and gyroscopes to collect more precise movement data. By utilizing angular velocity and acceleration data, combined with the use of trigonometry and integration, multiple studies explored measurement of walking speed using an IMU attached to the shank of the users [30,31,32]. Sijobert [33] expanded more on their methods to focus on stride length calculation within a medical context with patients suffering from Parkinson’s disease. All of the four studies introduced a correction term as well to address the drift effect from integration of acceleration data, ensuring more accurate and reliable measurements. However, a notable limitation in these four studies is their assumption that movement occurs primarily on the sagittal plane, leading to an analysis focused solely on this plane. This limited the scope of these studies to linear vertical movement only. Furthermore, their approach to attaching sensors to the participants’ shank presents challenges in integrating the system into footwear, necessitating users to take an extra step to put on the sensors, leading to a less convenient experience. In [34], a different approach for calculating stride length that incorporated rotation matrices was introduced. This method allowed measurement of displacement across all three axes, broadening the applicability of the research to more dynamic movements, such as those encountered in various sports. It also incorporated the use of Kalman filter [35], which effectively estimate the orientation of the IMU in space using the signals from the accelerometer and gyroscope, as also shown in [36,37]. Although their inertial sensor was affixed to the shoe by attaching it to the shoelaces, it lacks complete integration into the footwear. As a result, the sensor might shift during physical activity, potentially compromising data collection accuracy. This also renders the system less practical for users due to its configuration. Beyond the mathematical measurement of stride length, advanced statistical and machine learning methods are also being applied in many different studies including artificial neural network (ANN) [38] and convolutional neural network (CNN) [39,40], which yielded quite accurate results. Other methods without the implementation of wearable devices were also explored. In [41], the authors devised a home sensor system mounted on the wall which could measure the velocity and stride length of people walking within the household using radio signals.
This study proposes a novel implementation of an intelligent footwear system with multiple pressure sensors and an IMU connected to a microcontroller, fully embedded into the sole of the shoe to track the movement of a human subject on a tennis court. Our objective with this system is to gather and analyze data in a way that allows for the real-time calculation of stride length. Additionally, the total distance covered over a given period can be measured as well by taking the summation of the individual stride lengths. This approach represents a significant advancement in the field of gait analysis, offering the potential for more precise and immediate insights into gait patterns and distance of travel covered.
2. Methods
2.1. Experimental Instrumentation
In this study, the Bosch BMI085 IMU sensors [42], which combine a tri-axial gyrometer and a tri-axial accelerometer, are employed to collect precise movement data of the feet. The BMI085 has a dimension of 4.5 mm x 3.0 mm x 0.95 mm, with the accelerometer measurement range of up to ±16 g, and a gyroscope measurement range up to ±2000 °/s. Figure 1 (a) shows the IMU device, along with the orientation of its X, Y, and Z axes. For each foot, a BMI085 was seamlessly integrated into the sole of the shoe and connected to an ESP32 microcontroller in a printed circuit board (PCB), which is shown in Figure 1 (b). The dimension of this PCB is 60 mm x 31 mm x 5 mm. This setup was powered by a 500 mAh battery, capable of sustaining up to two hours of continuous operation. Additionally, the system incorporated six force-sensing resistor sensors, as outlined in [43], to measure the force exerted to various critical pressure points of the foot. The system was further enhanced with a Wi-Fi module, enabling real-time wireless data acquisition and transmission to a computer that managed the collection process. Special attention was given to the shoe sole modification to ensure that the embedded components were imperceptible to the users, thereby maintaining comfort during use.
Figure 2 illustrates both the side and front views of our shoe sensor system, which is fully embedded into the sole of the shoes. This design ensures that the circuitry is mostly concealed and does not intrude on the user’s experience, maintaining the regular functionality and comfort of the footwear while housing the advanced sensor system.
2.2. Calibration
Most IMUs are prone to some level of drift over time, stemming from the limitations of the sensors they contain. The BMI085 IMU, while cost-effective, is no exception and exhibits certain inherent inaccuracies in its accelerometer and gyroscope readings across the X, Y, and Z axes. In a static state, the IMU’s data can significantly deviate from the expected zero values for angular velocity and acceleration, or 9.81 for vertical acceleration, which corresponds to the force of gravity. To correct the zero-rate offsets, calibration of the IMU sensors is essential. This involves collecting data from the IMU in a stationary position, spanning around 500 samples. During this process, the maximum and minimum values recorded are identified. The mean of these extremes is then computed and serves as the offset for the sensor data. Calibration is then achieved by deducting these offsets from the actual sensor readings during post-processing. This step is vital for ensuring the accuracy of the collected data, which is critical for precise stride length calculations.
Figure 3 provides a visual representation of both the frontal and lateral perspectives of the participant outfitted with the shoe sensor systems during the calibration process. This illustration clearly demonstrates that the sensor systems are seamlessly integrated into the footwear, showing the subtlety of the installation.
2.3. Data Collection
Once the IMU is calibrated, the system is ready to begin the data collection process. An Arduino code utilizing the BMI085 library is employed to communicate with the ESP32 microcontroller and read the acceleration and angular velocity signals from the sensors of the IMU. The data gathered are then transmitted wirelessly to a computer system via the user diagram protocol (UDP) by connecting both the computer and sensor systems to the same Wi-Fi network. This transmission is accomplished through the use of a Python script, which also establishes the system’s connection to the Internet.
In the context of our experimental setup, the participant is a 24-year-old male, with a height of 172 cm and a body mass of 62 kg, wearing athletic footwear of size 9.5 in the U.S. measurement scale. The participant was subjected to performing a series of different movements while wearing the shoe sensor systems on both feet including walking, running, squatting, and lunging. For the purpose of this study, the walking movement is mainly focused on to calculate stride lengths. The participant walked a total ground distance of 120 meters, taking exactly a total of 80 steps with each foot. To facilitate easier data gathering and processing, this distance was segmented into ten smaller distinct experiments. In each of these, the participant took eight steps on each foot to precisely cover a distance of 12 meters. The data collection of these activities was conducted at a sampling rate of 50 Hz. This experiment was carried out on the tennis court complex of The University of Alabama.
Figure 4 showcases the participant performing a sequence of walking movements along the baseline of a tennis court. This visual representation captures the systematic progression of the participant’s steps, offering a clear depiction of the shoe sensor system being utilized within the specific context of a tennis court environment.
2.4. Data Preprocessing
The data collected from both feet are saved into a singular comma-separated values (CSV) file. To be able to differentiate the data between the two feet, an identifier is added into the data, where the data from the left foot is represented by the value of ’1’, and the right foot is represented by the value of ’2’. The data is then separated according to this value, dividing the dataset into left foot data and right foot data.
To facilitate the real-time computation of the horizontal displacement for individual steps, the entire data of the continuous walking motion is broken down into separate, identifiable strides using an algorithm. This segmentation is achieved using gyroscope signals around the x-axis and data from force sensors embedded in the shoe. The process involves identifying key gait events within the collected data, such as heel-raise, mid-swing, heel-strike, and foot-flat movements. These events serve as markers to delineate the start and end points of each stride. The beginning of a stride is identified by analyzing the pressure data from the sensor placed under the big toe. A stride starts when the pressure data reaches peak values, with a set threshold of at least 1285. This peak indicates a significant pressure exertion by the big toe, typically seen during the heel-raise phase of a stride. Conversely, the end of a stride is determined by monitoring the pressure data from the back inside sensor of the shoe. The stride concludes when this sensor records peak values, with a threshold of at least 1290. These peaks generally correspond to the heel-strike phase, where the back part of the foot makes firm contact with the ground. The peaks on each sensor need to be at least 20 samples apart from one another so that any minor movements are not counted as a step.
2.5. Filtering
A second-order forward-backward lowpass Butterworth filter with a cutoff frequency of 10 Hz is applied to the acceleration and gyroscope data to smooth out the signals and average out the Gaussian noises. This filtering technique is particularly effective in eliminating high-frequency noises and artifacts from the data, ensuring a cleaner signal for analysis. A filtering cutoff of 10 Hz is shown to be suitable for mid-stance, heel-strike, toe-off, and mid-swing detection and calculation by keeping a low variance and deviation of zero mean for the timing and magnitude of gait events [44], which is crucial for accurate gait analysis. The choice of these filter parameters strikes an optimal balance between removing the unwanted noise and preserving the essential characteristics of the gait signal.
2.6. Stride Length Calculation
To precisely measure the linear displacement of each step, it is crucial to identify the linear acceleration component. This requires transforming the collected raw acceleration data, represented as , into a format that aligns with a reference frame where the Z-axis is in the same direction of gravity, and the Y-axis is along the direction of a forward walking motion. In this study, the key to this transformation lies in the utilization of a rotation matrix, denoted as , which is derived from a quaternion , as detailed in [45]. The use of rotation matrix to calculate stride length is detailed in [34], with the matrix defined as below:
In the above formula, are components of the quaternion mentioned above, which is expressed as:
In our study, the quaternions and rotation matrices were calculated using a Kalman filter sensor fusion algorithm. Once the rotation matrix was established, it was multiplied with the acceleration signals to align the sensor data with the predetermined reference frame. Subsequently, the gravitational acceleration g was subtracted from the transformed acceleration signal, isolating the movement-specific acceleration from the overall influence of gravity. The resultant value represents the horizontal acceleration, denoted as , and is expressed as below:
In the next step, a process of double integration is applied to the linear acceleration data to determine the distance covered by each step. First, the linear velocity was calculated using trapezoidal integration with the initial velocity assumed to be 0 m/s ():
Then, to eliminate the velocity drifts effect from integration of acceleration data, a correction term was introduced to the linear velocity, which corrected the velocity to be 0 m/s at the end of each integration cycle.
where is the linear velocity at the end of the cycle with T being the cycle duration. Afterwards, the movement displacement, denoted as , was calculated by integrating the corrected movement velocity.
Finally, the computation of individual stride length, represented as , was determined to be the root sum squared of the displacement values across all axes.
The total distance covered for each of the experiment is calculated by taking the summation of all the individual stride lengths.
3. Results
Within Figure 5, a detailed graphical representation of the acceleration data, which has undergone a thorough post-processing phase, is presented. This data corresponds to a specific sequence of an eight-step walking movement covering a ground distance of 12 meters. The plot illustrates the variations in acceleration across all three X, Y, and Z spatial axes throughout the duration of the experimental observation. By capturing the dynamic changes in acceleration on each of these axes, the figure provides a comprehensive overview of the movement’s biomechanics, allowing for an in-depth analysis of the intricate patterns and fluctuations in acceleration on each data axis that occur during the walking sequence.
Figure 6, on the other hand, offers a detailed look into the post-processed gyroscope data, where the data around the X-axis, which represents the angular velocity of the foot during a forward walking movement, is the main focus. This data provides a comprehensive view of the rotational dynamics involved in walking, allowing for the observation of distinct phases within each stride, including heel-raise, mid-swing, heel-strike, and foot-flat. From the figures, a repeating pattern can be seen, representing the walking steps taken during the experiment.
The scope of our study is constrained due to the inability to accurately measure the actual length of each stride. As a result of this limitation, ground-truth verification of individual stride lengths remains beyond our capability. To overcome this obstacle, we have opted to estimate the total distance travelled throughout the experiment by taking the summation of all of the individual stride lengths obtained through our algorithm. This methodological adjustment, as applied from [38], allows us to navigate the challenges posed by the lack of direct stride length measurements. The total distance is calculated by the equation:
where is the total calculated distance, is the calculated stride length of the ith step, and n is the total number of strides. This cumulative distance is then compared to the actual total walking distance of 120 meters mentioned above to determine the overall error, as a substitute to finding the mean error in individual stride length. The accuracy of the distance estimation will be a direct indicator of the efficacy of our stride length calculation algorithm. This equation below, also derived from [38], illustrates this relationship in terms of mean error :
where represents the measured stride length, is the calculated stride length, denotes the measured total distance travelled, and stands for the calculated total distance travelled.
Upon conducting post-processing procedures and implementing the aforementioned formulas, we calculated a total walking distance of 117.74 meters. Compared against the measured distance covered of 120 meters, our derived value exhibits an error rate of 1.88%. This small discrepancy highlights the accuracy and reliability of our computational methods. The mean and standard deviation values for each step of the experiments are detailed below in Figure 7 and Table 1, with Figure 7 showing the cumulative distance over the span of eight steps.
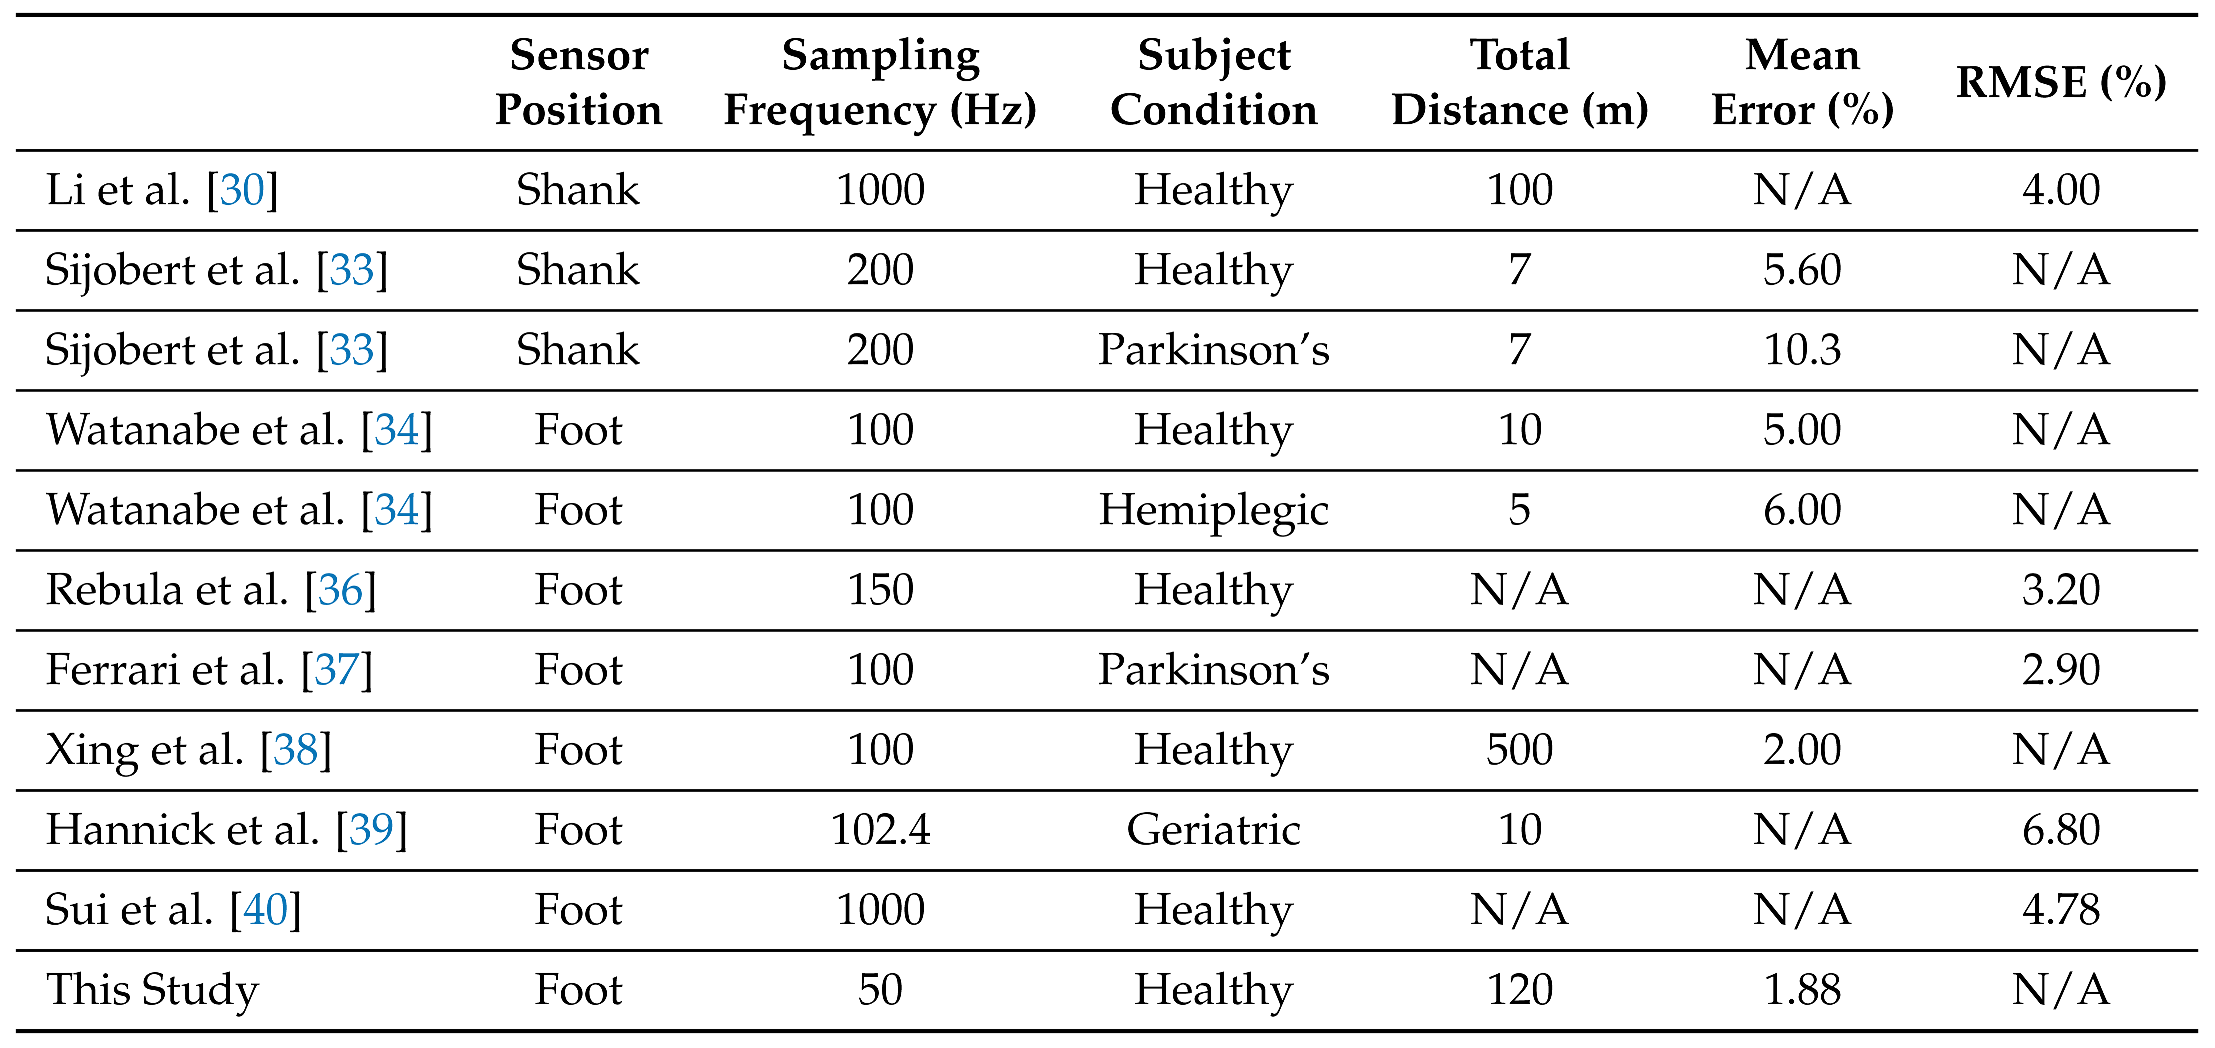
Below, Table 2 presents a comprehensive comparison between the background information and outcomes of various research papers employed in this study alongside our own findings. The table encompasses key details such as sensor placement, sampling frequency, participants’ health conditions, total distance walked, mean error, and root-mean-square error. Notably, our study demonstrates a lower mean error rate in calculating stride length compared to other studies with comparable objectives. This distinction underscores the precision and effectiveness of our methodology in achieving accurate measurements.
4. Discussion
This study has demonstrated the significant potential of smart shoes in accurately calculating stride length. Nonetheless, the precision of these calculations can be further improved by increasing the dataset size. Future research will focus on expanding the dataset to encompass a broader range of shoe sizes and a more diverse population. Several additional shoe sensor PCBs have been designed and fabricated to be incorporated into shoes of different sizes. This will enable a greater number of participants to take part in the study, thereby allowing the stride length calculation algorithm to be refined, enhancing its precision and reliability. Including additional variables such as different terrains, speeds, and environmental conditions will also contribute to a more robust and versatile algorithm.
The scope of our study can also be further explored in different aspects such as different sports or healthcare. The shoe sensor system holds significant potential for track runners by providing detailed insights into stride mechanics through the analysis of movements in the X, Y, and Z axes. This comprehensive data can be used to optimize performance by customizing training regimens and refining techniques, ultimately helping athletes enhance stride efficiency and minimize the risk of injury. Similarly, accurate gait analysis is crucial for effective rehabilitation and injury recovery. The insights gained from this study can help doctors develop more targeted rehabilitation programs. By examining the strides in the different movement axes, specific gait abnormalities can be identified and addressed through customized exercises.
As the use of smart shoes and wearable technology for gait analysis grows, ensuring data security and client privacy is essential. In this study, data was transmitted using Wi-Fi UDP, providing fast, efficient, and real-time monitoring of gait patterns. However, since UDP is connectionless and does not established a secure connection between two end points [46], it is generally considered to be less reliable compared to TCP or HTTPS. Future implementations should adopt these methods to encrypt data through wireless connection and enhance data security, ensuring that sensitive client information remains confidential. Developing robust encryption protocols will be critical to maintain client privacy and trust as smart shoe technology becomes more widely used in both clinical and athletic settings.
5. Conclusions
In this research, an innovative methodology for the real-time measurement of stride length was proposed, leveraging an advanced integration of Inertial Measurement Unit (IMU) technology with force sensors embedded directly into the shoe sole. This approach harnesses the force sensors’ data to identify strides automatically and employs a sophisticated mathematical model, incorporating trigonometry and calculus, to process the acceleration and angular velocity information gathered from the IMU into individual stride length calculation. Our experimental results demonstrate that our algorithm in estimating stride length has a remarkably low error rate of 1.88%, which exhibits superior performance compared to the other studies mentioned in this paper.
Author Contributions
Conceptualization, N.N., Z.C., K.G., and N.J.; methodology, N.N., Z.C., K.G., and N.J.; software, N.N.; validation, N.N., Z.C., K.G., and N.J.; formal analysis, N.N. and N.J.; investigation, N.N. and N.J.; resources, N.N. and N.J.; data curation, N.N.; writing—original draft preparation, N.N.; writing—review and editing, N.N., Z.C., K.G., and N.J.; visualization, N.N., Z.C., and N.J.; supervision, N.J.; project administration, N.J.. All authors have read and agreed to the published version of the manuscript.
Funding
This research received no external funding.
Informed Consent Statement
Informed consent was obtained from all subjects involved in the study which was conducted according to the guidelines of the Declaration of Helsinki and approved by the Institutional Review Board of The University of Alabama protocol ID 20-02-3356, approved on 5 June 2020.
Acknowledgments
The authors would like to acknowledge the contribution of the Capstone College of Nursing of The University of Alabama on this project, who offered much information and help with conducting the experiments.
Conflicts of Interest
The authors declare no conflicts of interest.
References
- DeMello, M. Feet and footwear: A cultural encyclopedia. Bloomsbury Publishing USA, 2009. [Google Scholar]
- Trinkaus, E. Anatomical evidence for the antiquity of human footwear use. Journal of Archaeological Science 2005, 32, 1515–1526. [Google Scholar] [CrossRef]
- Trinkaus, E.; Shang, H. Anatomical evidence for the antiquity of human footwear: Tianyuan and Sunghir. Journal of Archaeological Science 2008, 35, 1928–1933. [Google Scholar] [CrossRef]
- Clottes, J. Les cavernes de Niaux: art préhistorique en Ariège. Éditions Errance, 2021. [Google Scholar]
- Delteil, J.; Durbas, P.; Wahl, L. Présentation de la galerie ornée de Fontanet (Ornolac-Ussat-les-Bains, Ariege). PREHISTOIRE ARIEGEOISE. BULLETIN DE LA SOCIETE PREHISTORIQUE DE L’ARIEGE 1972, 27, 11–20. [Google Scholar]
- Bader, N.O.; Lavrushin, Y. Upper Palaeolithic site Sungir (graves and environment). Scientific World Moscow 1998. [Google Scholar]
- Pettitt, P.B.; Bader, N.O. Direct AMS radiocarbon dates for the Sungir mid Upper Palaeolithic burials. Antiquity 2000, 74, 269–270. [Google Scholar] [CrossRef]
- Tong, H.; Shang, H.; Zhang, S.; Chen, F. A preliminary report on the newly found Tianyuan Cave, a Late Pleistocene human fossil site near Zhoukoudian. Chinese Science Bulletin 2004, 49, 853–857. [Google Scholar] [CrossRef]
- Shang, H.; Tong, H.; Zhang, S.; Chen, F.; Trinkaus, E. An early modern human from Tianyuan Cave, Zhoukoudian, China. Proceedings of the National Academy of Sciences 2007, 104, 6573–6578. [Google Scholar] [CrossRef] [PubMed]
- Cressman, L.S. Western prehistory in the light of carbon 14 dating. Southwestern Journal of Anthropology 1951, 7, 289–313. [Google Scholar] [CrossRef]
- Bedwell, S.F.; Cressman, L.S. Fort Rock report: prehistory and environment of the pluvial Fort Rock Lake area of south-central Oregon. In Proceedings of the Great Basin Anthropological Conference; 1970; pp. 1–25. [Google Scholar]
- Arnold, J.R.; Libby, W.F. Radiocarbon dates. Science 1951, 113, 111–120. [Google Scholar] [CrossRef]
- Connolly, T.J.; Cannon, W.J. Comments on “America’s Oldest Basketry”. Radiocarbon 1999, 41, 309–313. [Google Scholar] [CrossRef]
- Kuttruff, J.T.; DeHart, S.G.; O’Brien, M.J. 7500 years of prehistoric footwear from Arnold Research Cave, Missouri. Science 1998, 281, 72–75. [Google Scholar] [CrossRef] [PubMed]
- Gokalgandhi, D.; Kamdar, L.; Shah, N.; Mehendale, N. A Review of Smart Technologies Embedded in Shoes. Journal of Medical Systems 2020, 44, 150. [Google Scholar] [CrossRef] [PubMed]
- D’Arco, L.; Wang, H.; Zheng, H. A Rapid Detection of Parkinson’s Disease using Smart Insoles: A Statistical and Machine Learning Approach. In Proceedings of the 2022 IEEE International Conference on Bioinformatics and Biomedicine (BIBM); 2022; pp. 2985–2992. [Google Scholar]
- Varatharajan, R.; Manogaran, G.; Priyan, M.K.; Sundarasekar, R. Wearable sensor devices for early detection of Alzheimer disease using dynamic time warping algorithm. Cluster Computing 2018, 21, 681–690. [Google Scholar] [CrossRef]
- Ibrahim Mamun, M.; Rahman, A.; Mridha, M.; Hamid, M. AlziHelp: an Alzheimer disease detection and assistive system inside smart home focusing 5G using IoT and machine learning approaches. In Proceedings of the Recent Trends in Communication and Intelligent Systems: Proceedings of ICRTCIS 2020; 2021; pp. 105–113. [Google Scholar]
- Sudharshan, J.; Goodman, G.; Bourbakis, N. Smart shoes for temporal identification and corrections to assist people with abnormal walking patterns. In Proceedings of the 2020 IEEE 20th International Conference on Bioinformatics and Bioengineering (BIBE); 2020; pp. 929–933. [Google Scholar]
- Eskofier, B.M.; Lee, S.I.; Baron, M.; Simon, A.; Martindale, C.F.; Gaßner, H.; Klucken, J. An Overview of Smart Shoes in the Internet of Health Things: Gait and Mobility Assessment in Health Promotion and Disease Monitoring. Applied Sciences 2017, 7, 986. [Google Scholar] [CrossRef]
- Majumder, A.J.A.; Zerin, I.; Ahamed, S.I.; Smith, R.O. A multi-sensor approach for fall risk prediction and prevention in elderly. ACM SIGAPP Applied Computing Review 2014, 14, 41–52. [Google Scholar] [CrossRef]
- Noshadi, H.; Ahmadian, S.; Dabiri, F.; Nahapetian, A.; Stathopoulus, T.; Batalin, M.; Kaiser, W.; Sarrafzadeh, M. Smart shoe for balance, fall risk assessment and applications in wireless health. In Proceedings of the Microsoft eScience Workshop; 2008. [Google Scholar]
- Fotouhi-Ghazvini, F.; Abbaspour, S. Wearable Wireless Sensors for Measuring Calorie Consumption. J Med Signals Sens 2020, 10, 19–34. [Google Scholar] [CrossRef]
- Kim, E.S.; Lee, Y.W. Smart shoes for the monitoring of gait type and calorie expenditure. Sensor Letters 2015, 13, 650–653. [Google Scholar] [CrossRef]
- Lee, S.-W.; Mase, K. Activity and location recognition using wearable sensors. IEEE pervasive computing 2002, 1, 24–32. [Google Scholar]
- Cavanagh, P.R.; Kram, R. Stride length in distance running: velocity, body dimensions, and added mass effects. Med Sci Sports Exerc 1989, 21, 467–479. [Google Scholar] [CrossRef]
- Supakkul, K. Using positional heel-marker data to more accurately calculate stride length for treadmill walking: a step length approach. arXiv preprint arXiv:1710.09030 2017.
- Macutkiewicz, D.; Sunderland, C. The use of GPS to evaluate activity profiles of elite women hockey players during match-play. Journal of Sports Sciences 2011, 29, 967–973. [Google Scholar] [CrossRef] [PubMed]
- Singh, P.; Esposito, M.; Barrons, Z.; Clermont, C.A.; Wannop, J.; Stefanyshyn, D. Measuring gait velocity and stride length with an ultrawide bandwidth local positioning system and an inertial measurement unit. Sensors 2021, 21, 2896. [Google Scholar] [CrossRef] [PubMed]
- Li, Q.; Young, M.; Naing, V.; Donelan, J.M. Walking speed estimation using a shank-mounted inertial measurement unit. Journal of Biomechanics 2010, 43, 1640–1643. [Google Scholar] [CrossRef] [PubMed]
- Laudanski, A.; Yang, S.; Li, Q. A concurrent comparison of inertia sensor-based walking speed estimation methods. In Proceedings of the 2011 Annual International Conference of the IEEE Engineering in Medicine and Biology Society, 30 August–3 September 2011; pp. 3484–3487. [Google Scholar]
- Yang, S.; Laudanski, A.; Li, Q. Inertial sensors in estimating walking speed and inclination: An evaluation of sensor error models. Medical & biological engineering & computing 2012, 50, 383–393. [Google Scholar]
- Sijobert, B.; Benoussaad, M.; Denys, J.; Pissard-Gibollet, R.; Geny, C.; Coste, C.A. Implementation and validation of a stride length estimation algorithm, using a single basic inertial sensor on healthy subjects and patients suffering from Parkinson’s disease. ElectronicHealthcare 2015, 704–714. [Google Scholar] [CrossRef]
- Watanabe, T.; Miyazawa, T.; Shibasaki, J. A study on IMU-based stride length estimation for motor disabled subjects: A comparison under different calculation methods of rotation matrix. In Proceedings of the 2018 IEEE EMBS International Conference on Biomedical & Health Informatics (BHI); 2018; pp. 70–73. [Google Scholar]
- Valenti, R.G.; Dryanovski, I.; Xiao, J. A Linear Kalman Filter for MARG Orientation Estimation Using the Algebraic Quaternion Algorithm. IEEE Transactions on Instrumentation and Measurement 2016, 65, 467–481. [Google Scholar] [CrossRef]
- Rebula, J.R.; Ojeda, L.V.; Adamczyk, P.G.; Kuo, A.D. Measurement of foot placement and its variability with inertial sensors. Gait & Posture 2013, 38, 974–980. [Google Scholar]
- Ferrari, A.; Ginis, P.; Hardegger, M.; Casamassima, F.; Rocchi, L.; Chiari, L. A mobile Kalman-filter based solution for the real-time estimation of spatio-temporal gait parameters. IEEE transactions on neural systems and rehabilitation engineering 2015, 24, 764–773. [Google Scholar] [CrossRef] [PubMed]
- Xing, H.; Li, J.; Hou, B.; Zhang, Y.; Guo, M. Pedestrian stride length estimation from IMU measurements and ANN based algorithm. Journal of Sensors 2017. [Google Scholar] [CrossRef]
- Hannink, J.; Kautz, T.; Pasluosta, C.F.; Barth, J.; Schülein, S.; Gaßmann, K.-G.; Klucken, J.; Eskofier, B.M. Mobile stride length estimation with deep convolutional neural networks. IEEE Journal of Biomedical and Health Informatics 2017, 22, 354–362. [Google Scholar] [CrossRef]
- Sui, J.D.; Chang, T.S. IMU Based Deep Stride Length Estimation With Self-Supervised Learning. IEEE Sensors Journal 2021, 21, 7380–7387. [Google Scholar] [CrossRef]
- Hsu, C.-Y.; Liu, Y.; Kabelac, Z.; Hristov, R.; Katabi, D.; Liu, C. Extracting Gait Velocity and Stride Length from Surrounding Radio Signals. In Proceedings of the 2017 CHI Conference on Human Factors in Computing Systems; 2017. [Google Scholar]
- Inertial Measurement Unit BMI085. (accessed on 11/09). Available online: https://www.bosch-sensortec.com/products/motion-sensors/imus/bmi085/.
- Choffin, Z.; Jeong, N.; Callihan, M.; Sazonov, E.; Jeong, S. Lower Body Joint Angle Prediction Using Machine Learning and Applied Biomechanical Inverse Dynamics. Sensors 2023, 23, 228. [Google Scholar] [CrossRef] [PubMed]
- Allseits, E.K.; Agrawal, V.; Prasad, A.; Bennett, C.; Kim, K.J. Characterizing the impact of sampling rate and filter design on the morphology of lower limb angular velocities. IEEE Sensors Journal 2019, 19, 4115–4122. [Google Scholar] [CrossRef]
- Kuipers, J.B. Quaternions and Rotation Sequences A Primer with Applications to Orbits, Aerospace and Virtual Reality; Chapter 5. Quaternion Algebra; Princeton University Press, 1999. [Google Scholar]
- Coonjah, I.; Catherine, P.C.; Soyjaudah, K.M.S. Experimental performance comparison between TCP vs UDP tunnel using OpenVPN. In Proceedings of the 2015 International Conference on Computing, Communication and Security; 2015. [Google Scholar]
Figure 1.
(a) The PCB of the sensor system used in this study. (b) Bosch BMI085 IMU.
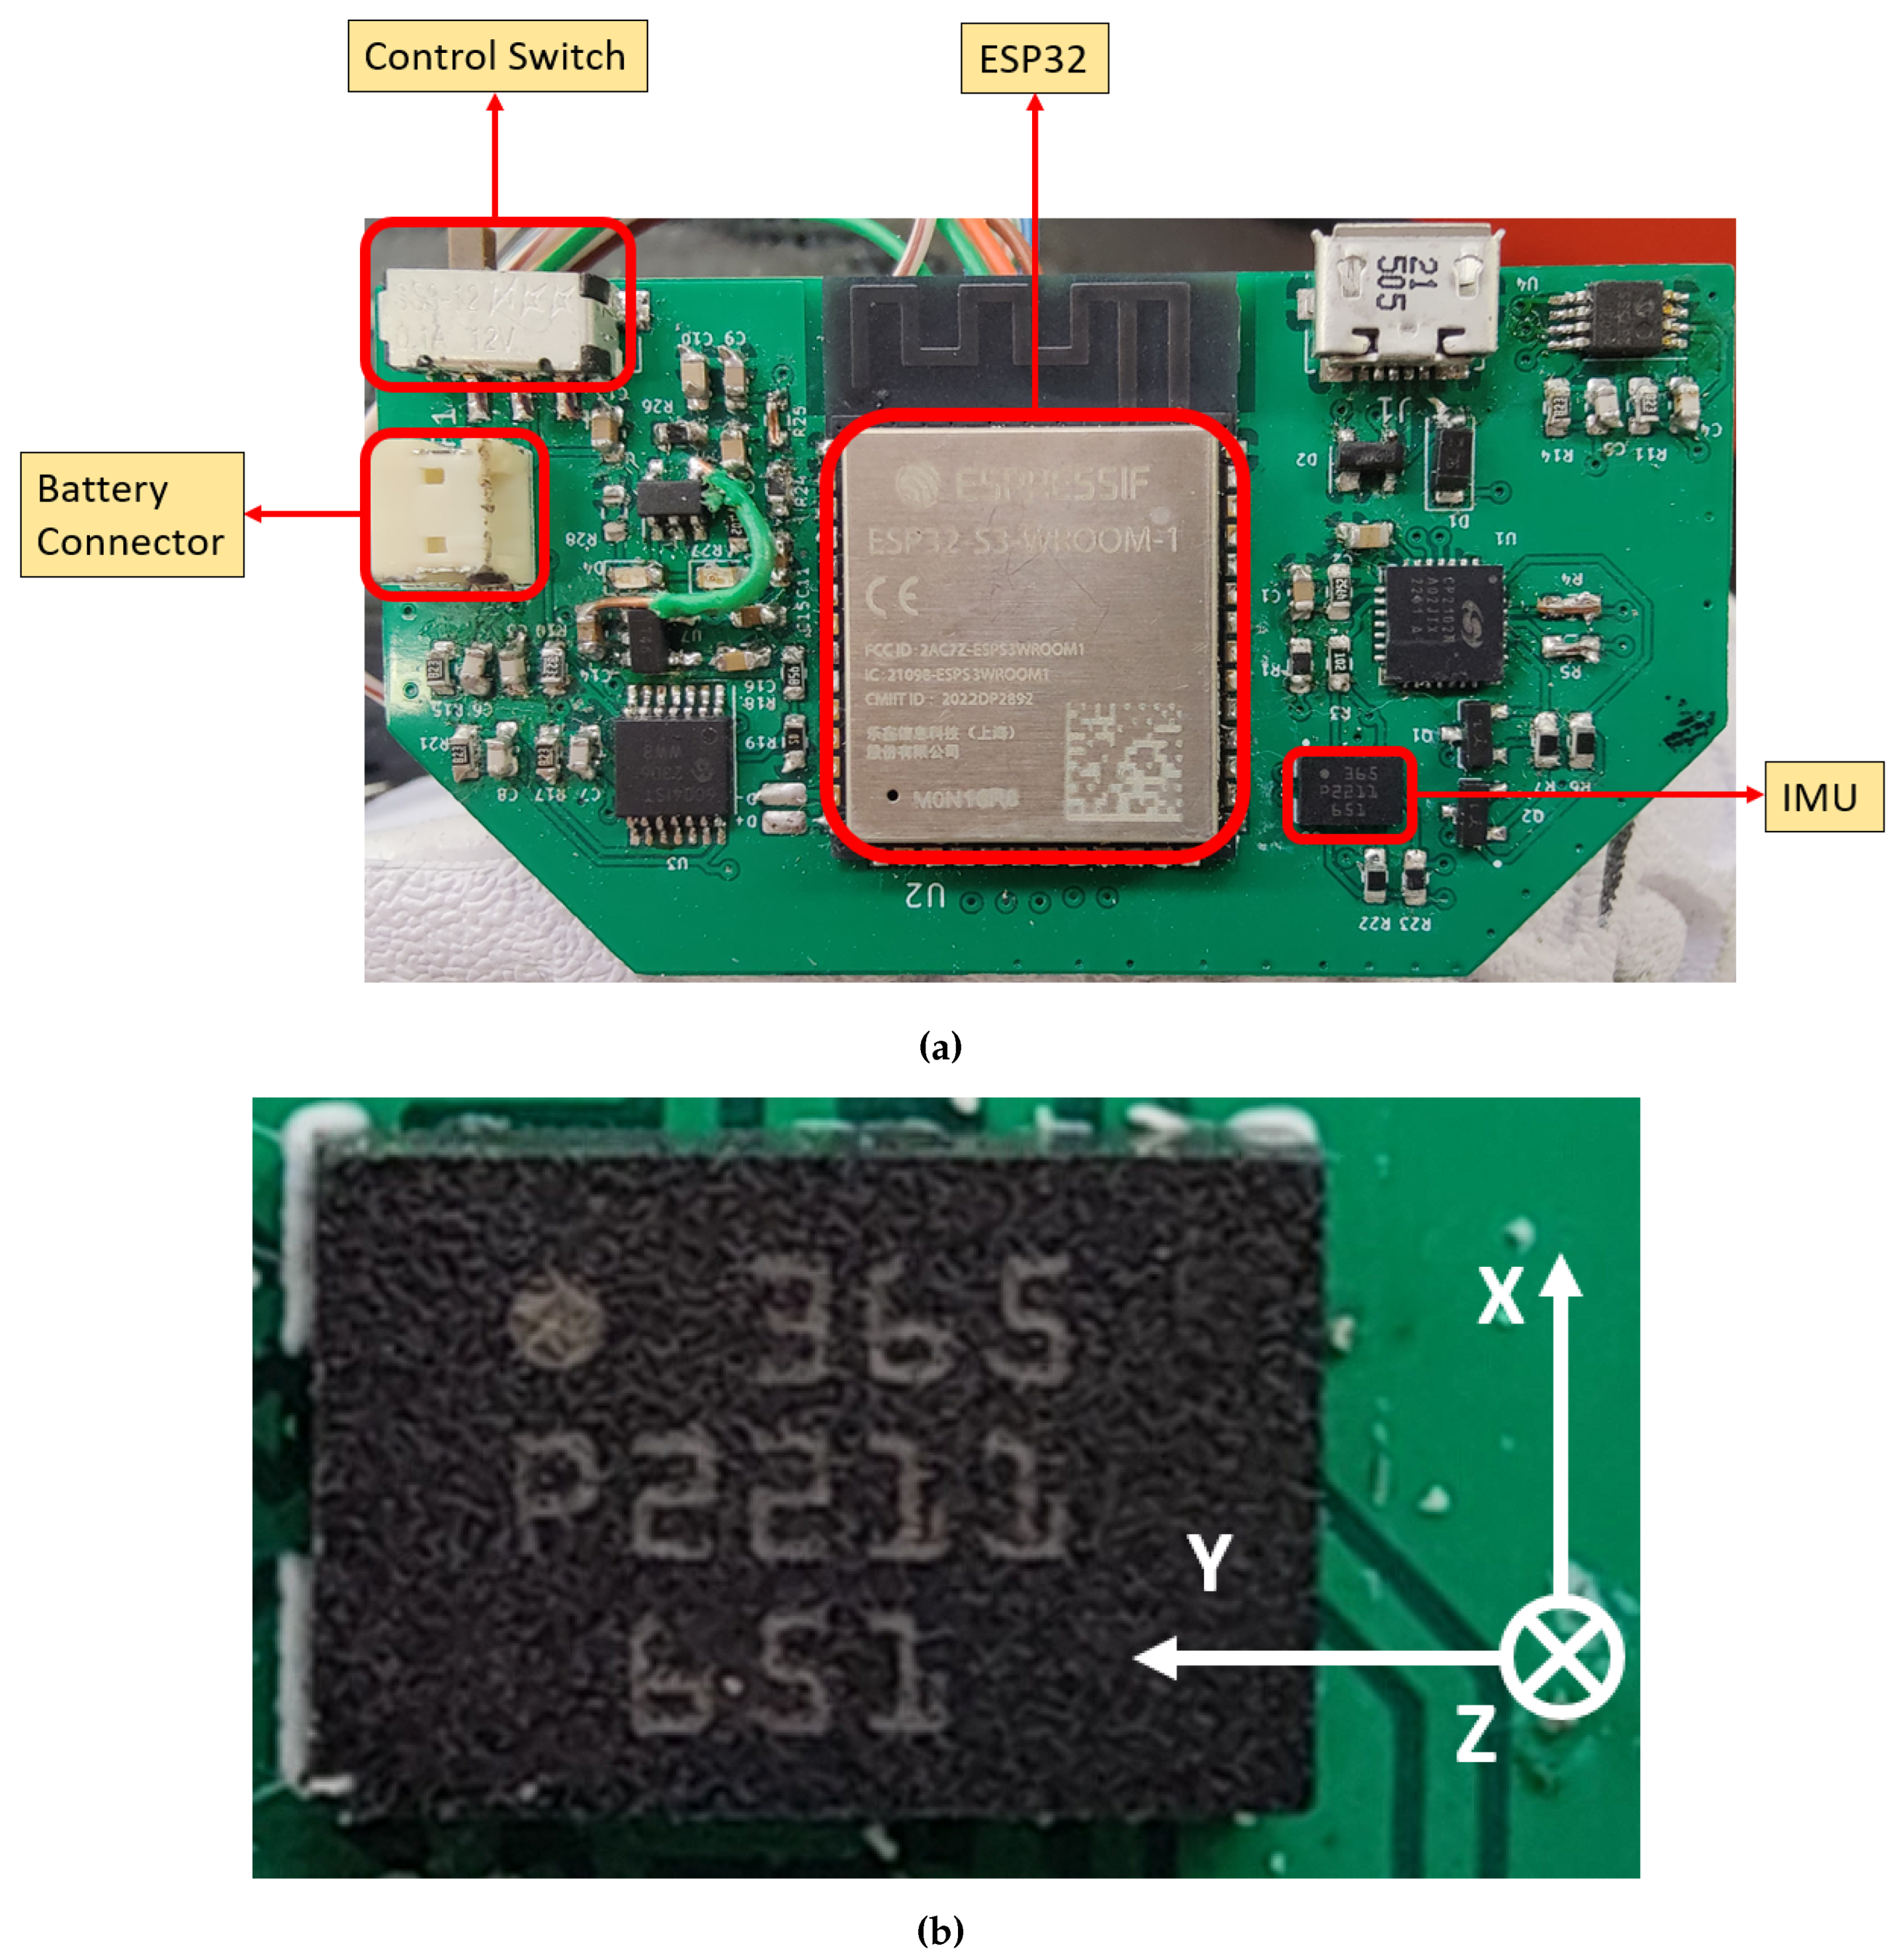
Figure 2.
Shoe sensor systems embedded within the shoe soles. (a) Top view of left shoe. (b) Top view of right shoe. (c) Side view of left shoe. (d) Side view of right shoe.
Figure 2.
Shoe sensor systems embedded within the shoe soles. (a) Top view of left shoe. (b) Top view of right shoe. (c) Side view of left shoe. (d) Side view of right shoe.
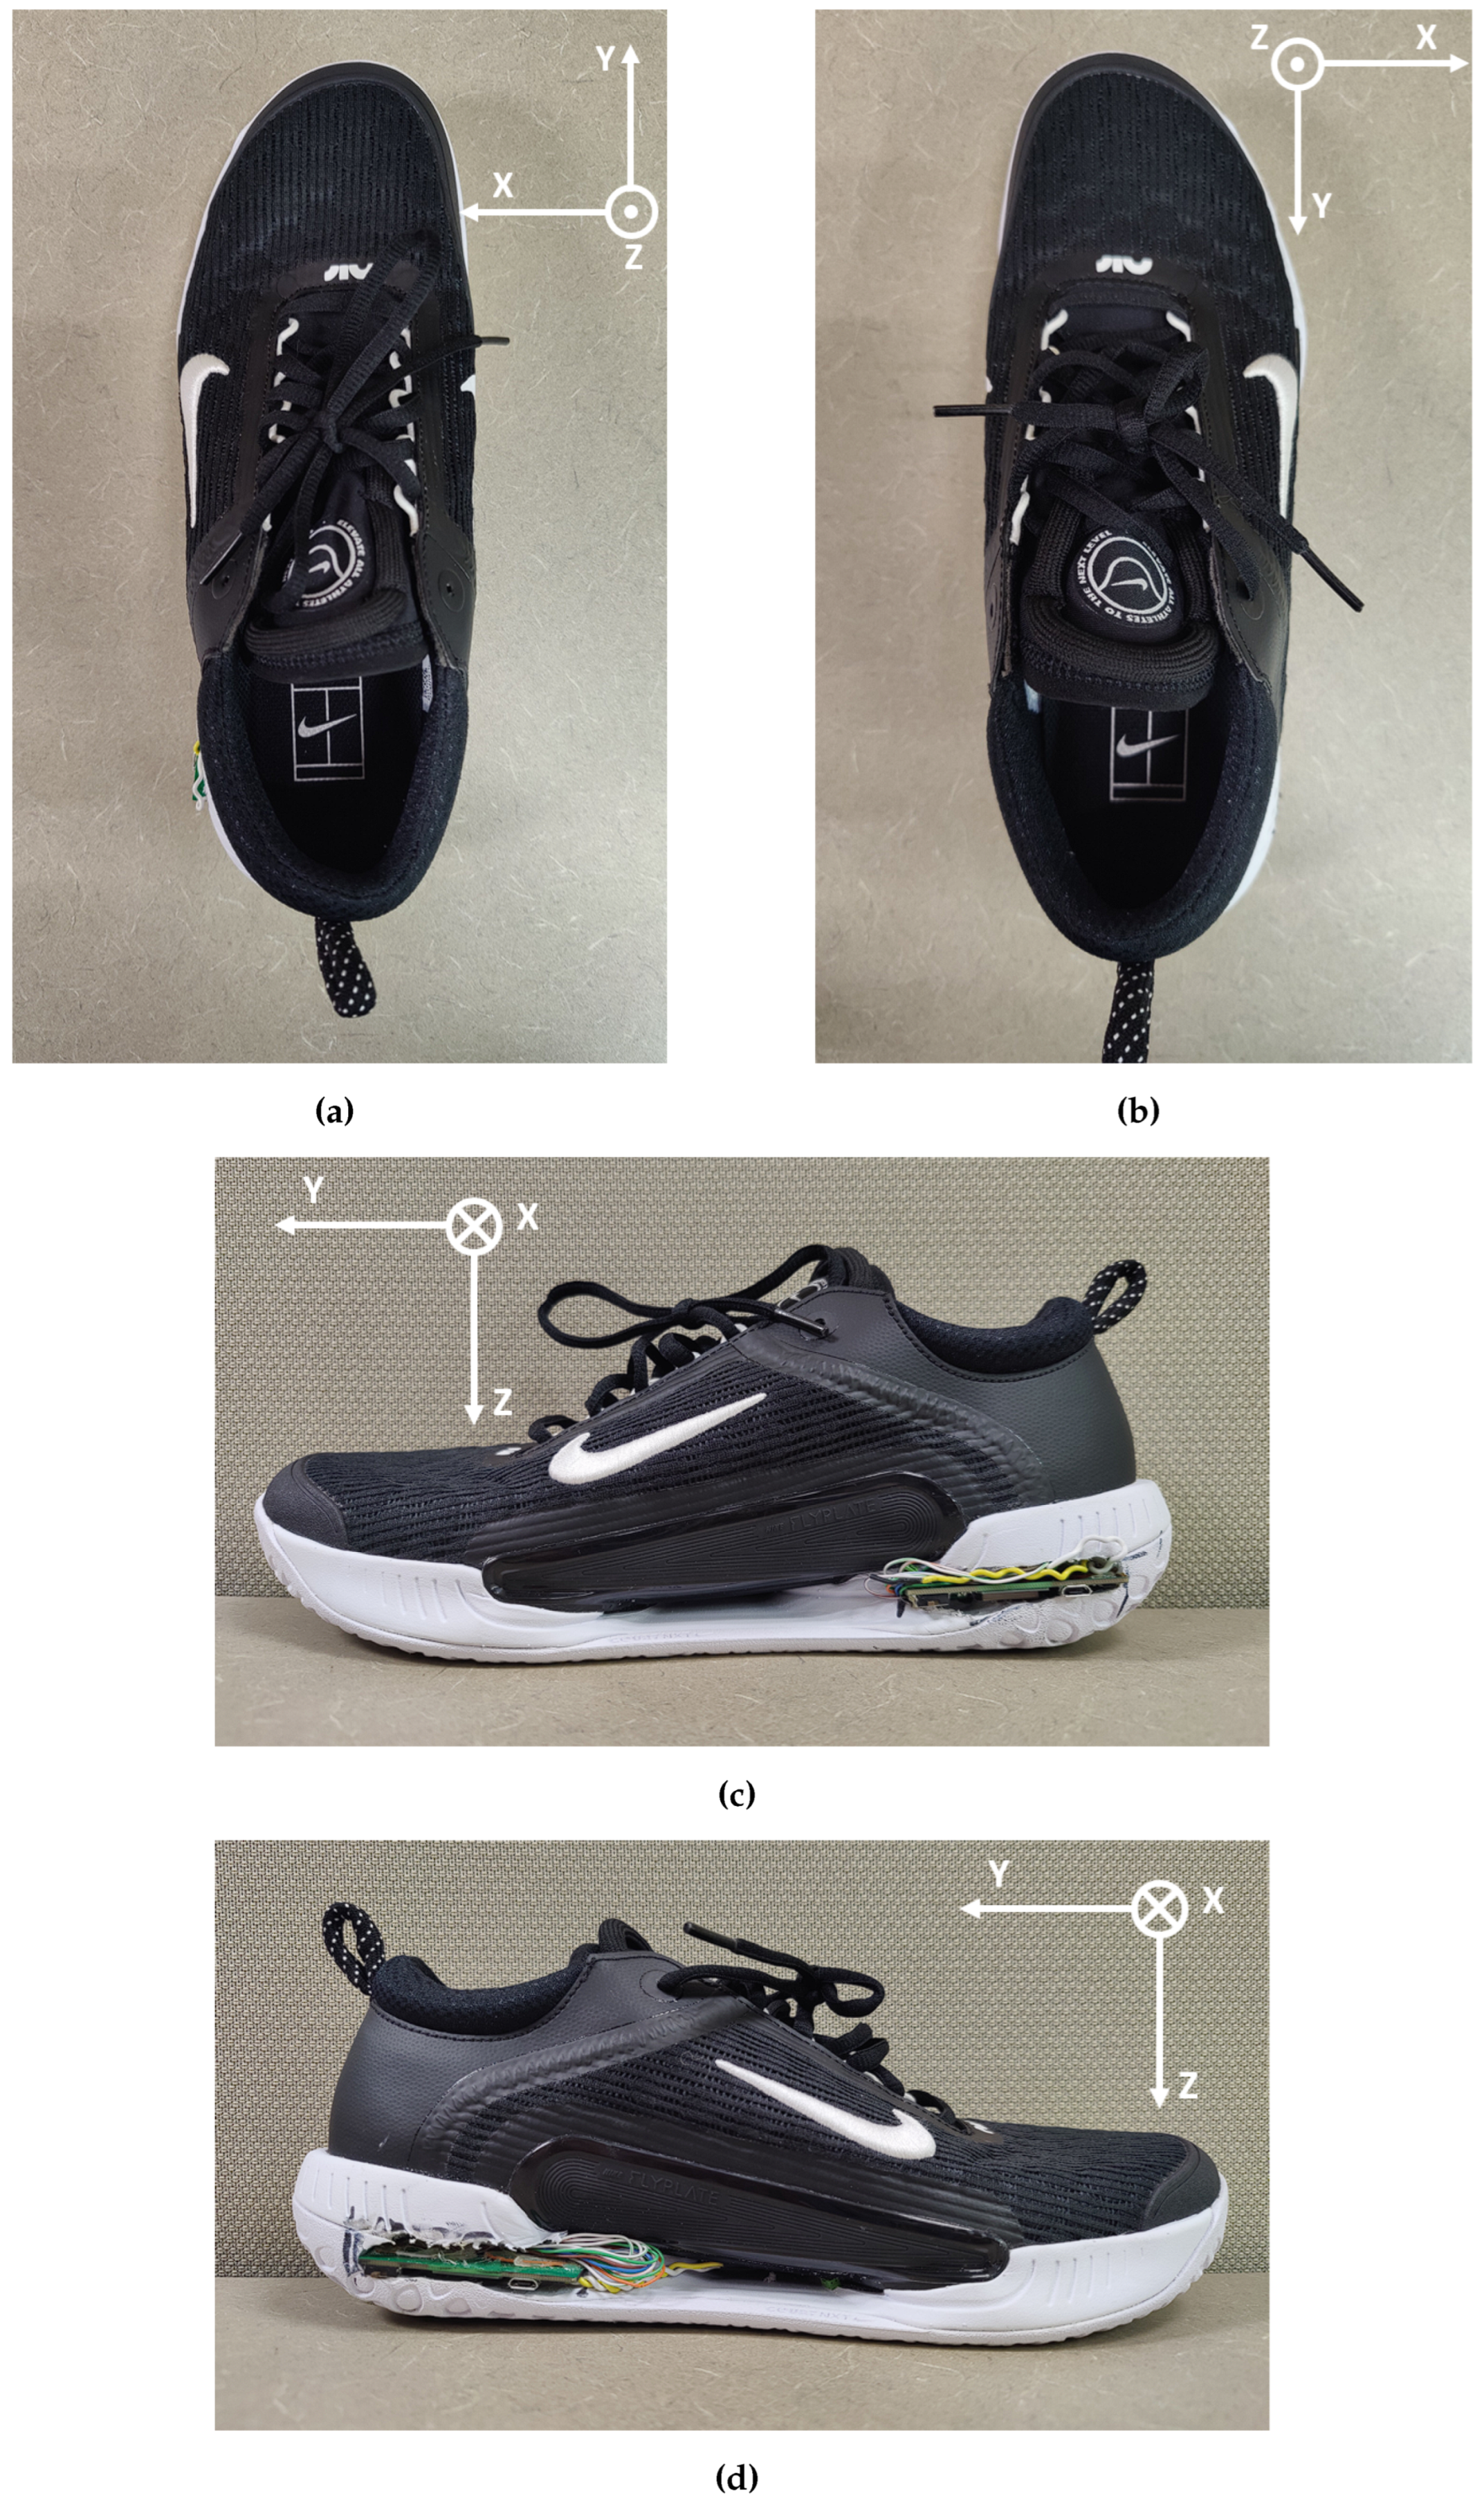
Figure 3.
The participant wearing the shoe sensor systems. (a) Front view of shoe sensor system in use. (b) Side view of shoe sensor system in use.
Figure 3.
The participant wearing the shoe sensor systems. (a) Front view of shoe sensor system in use. (b) Side view of shoe sensor system in use.
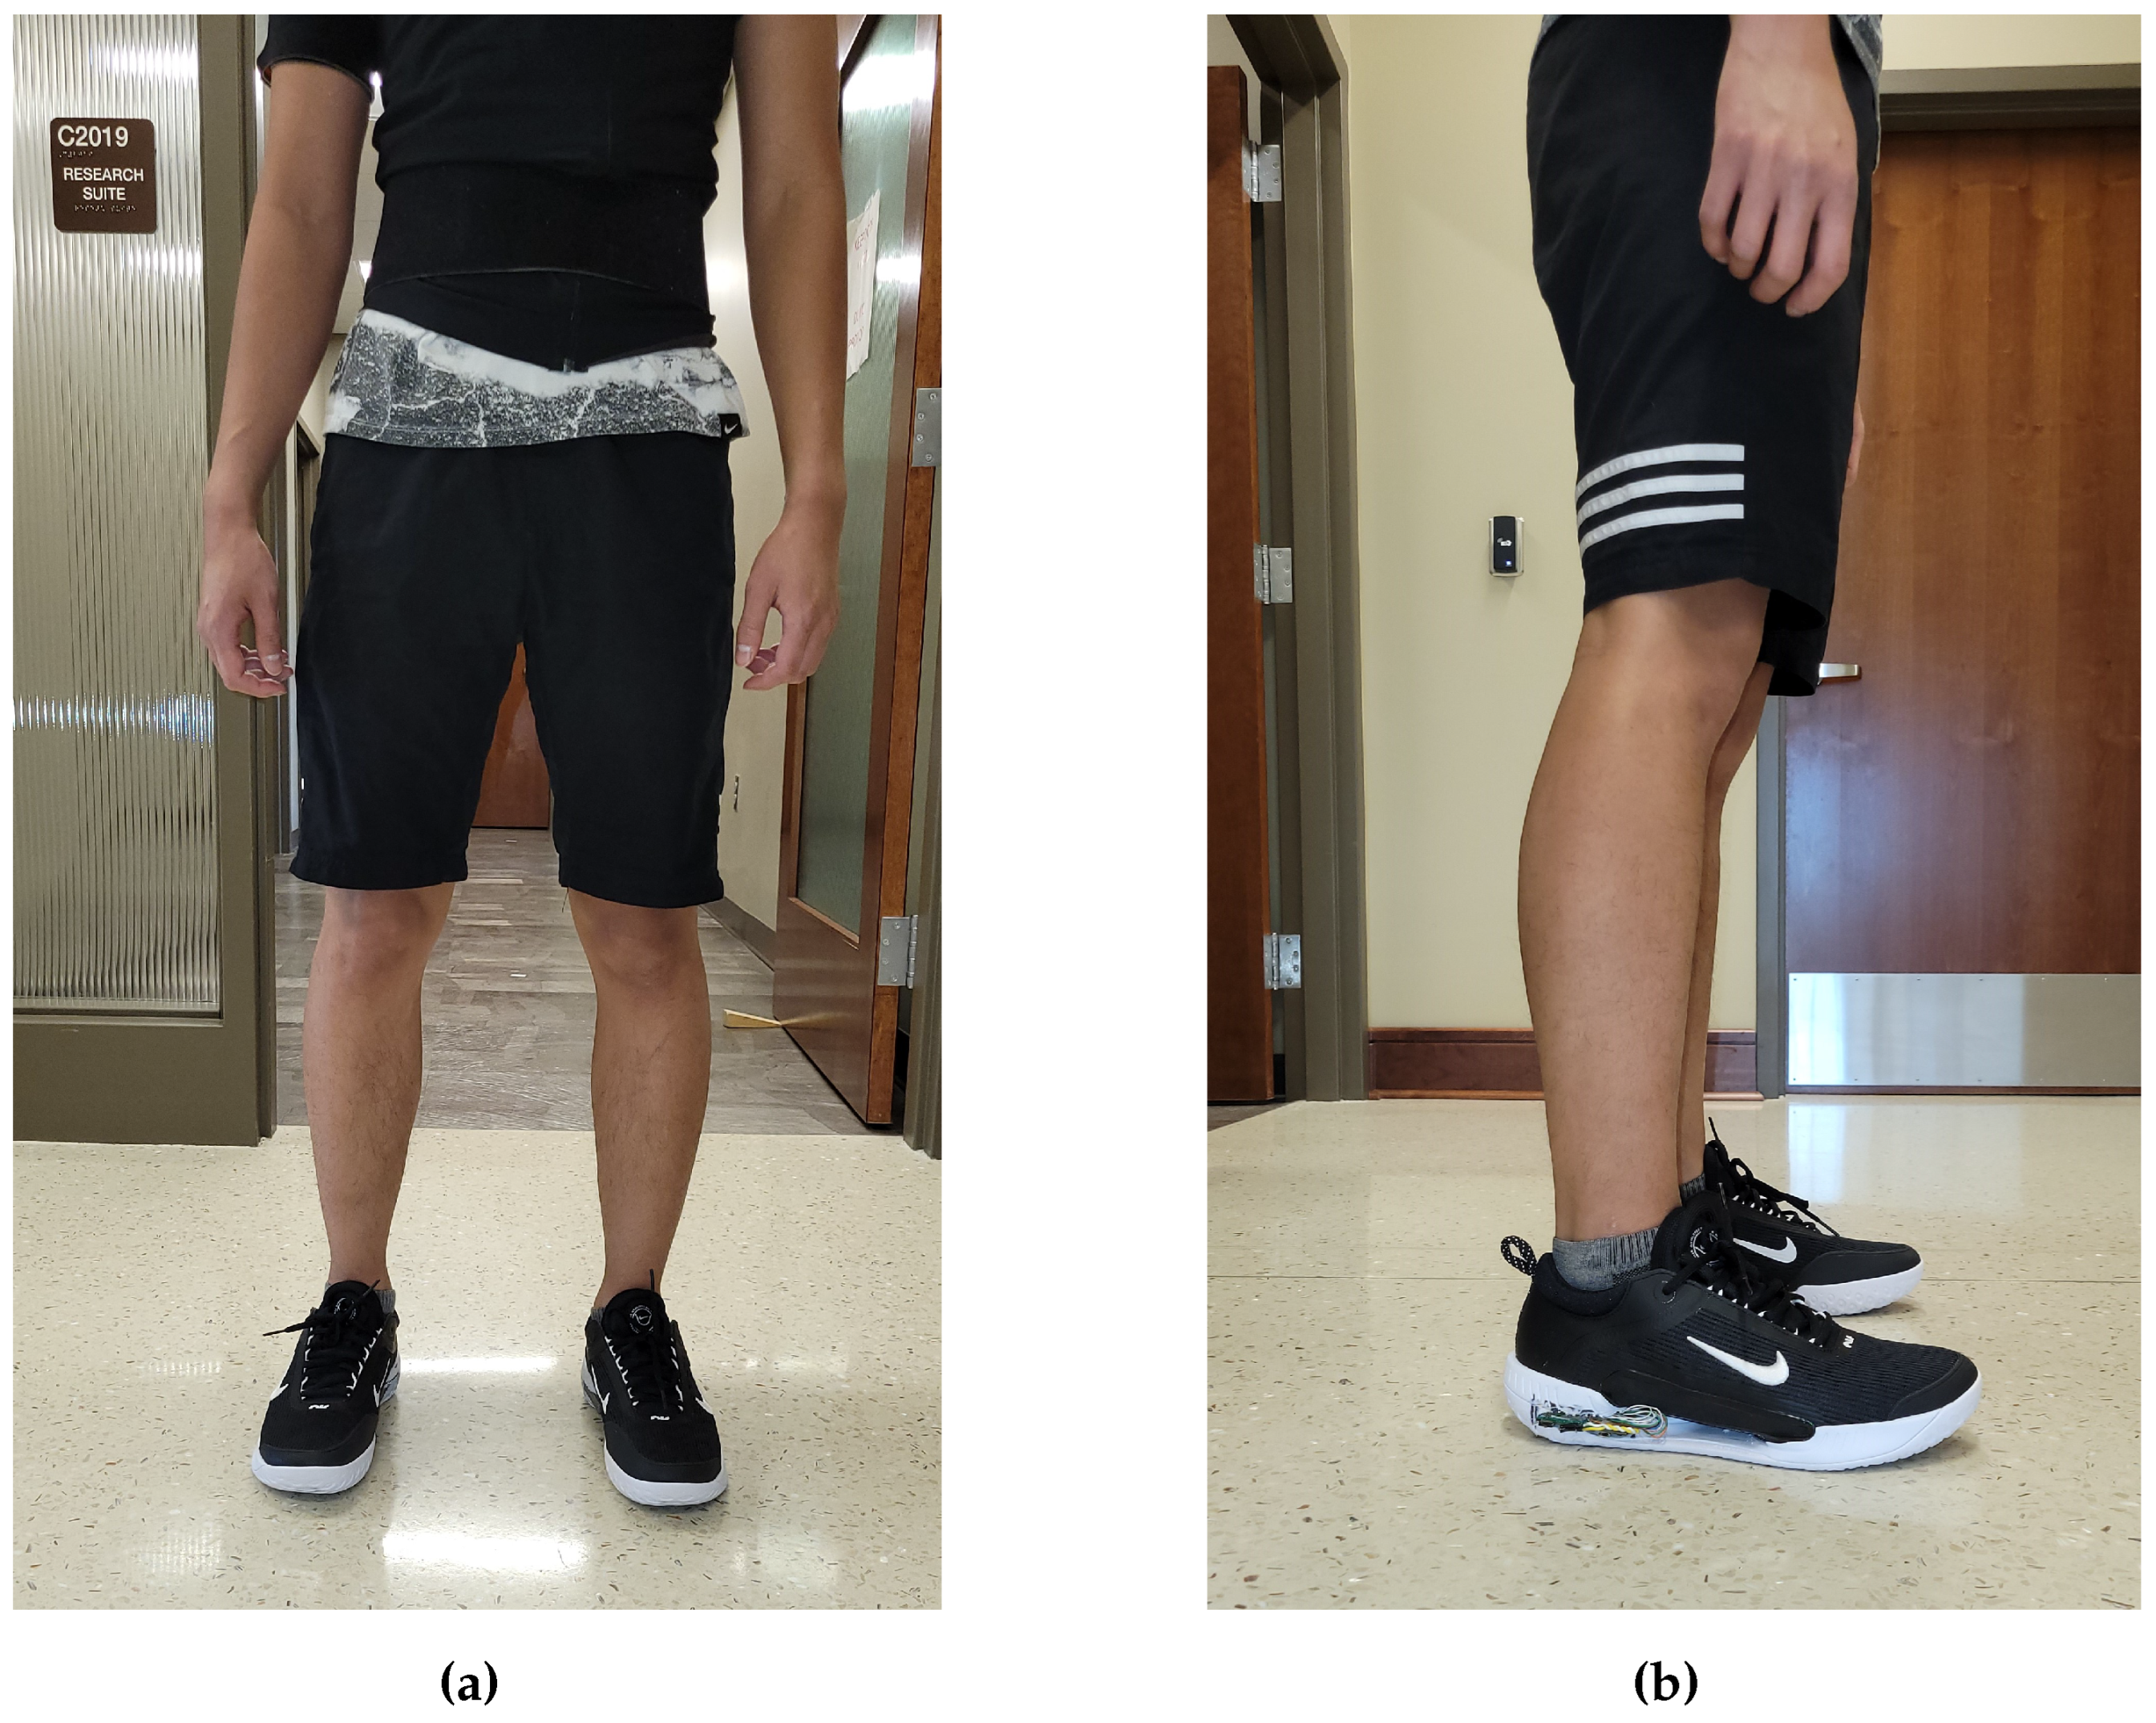
Figure 4.
Shoe sensor systems worn by the participant on a tennis court.
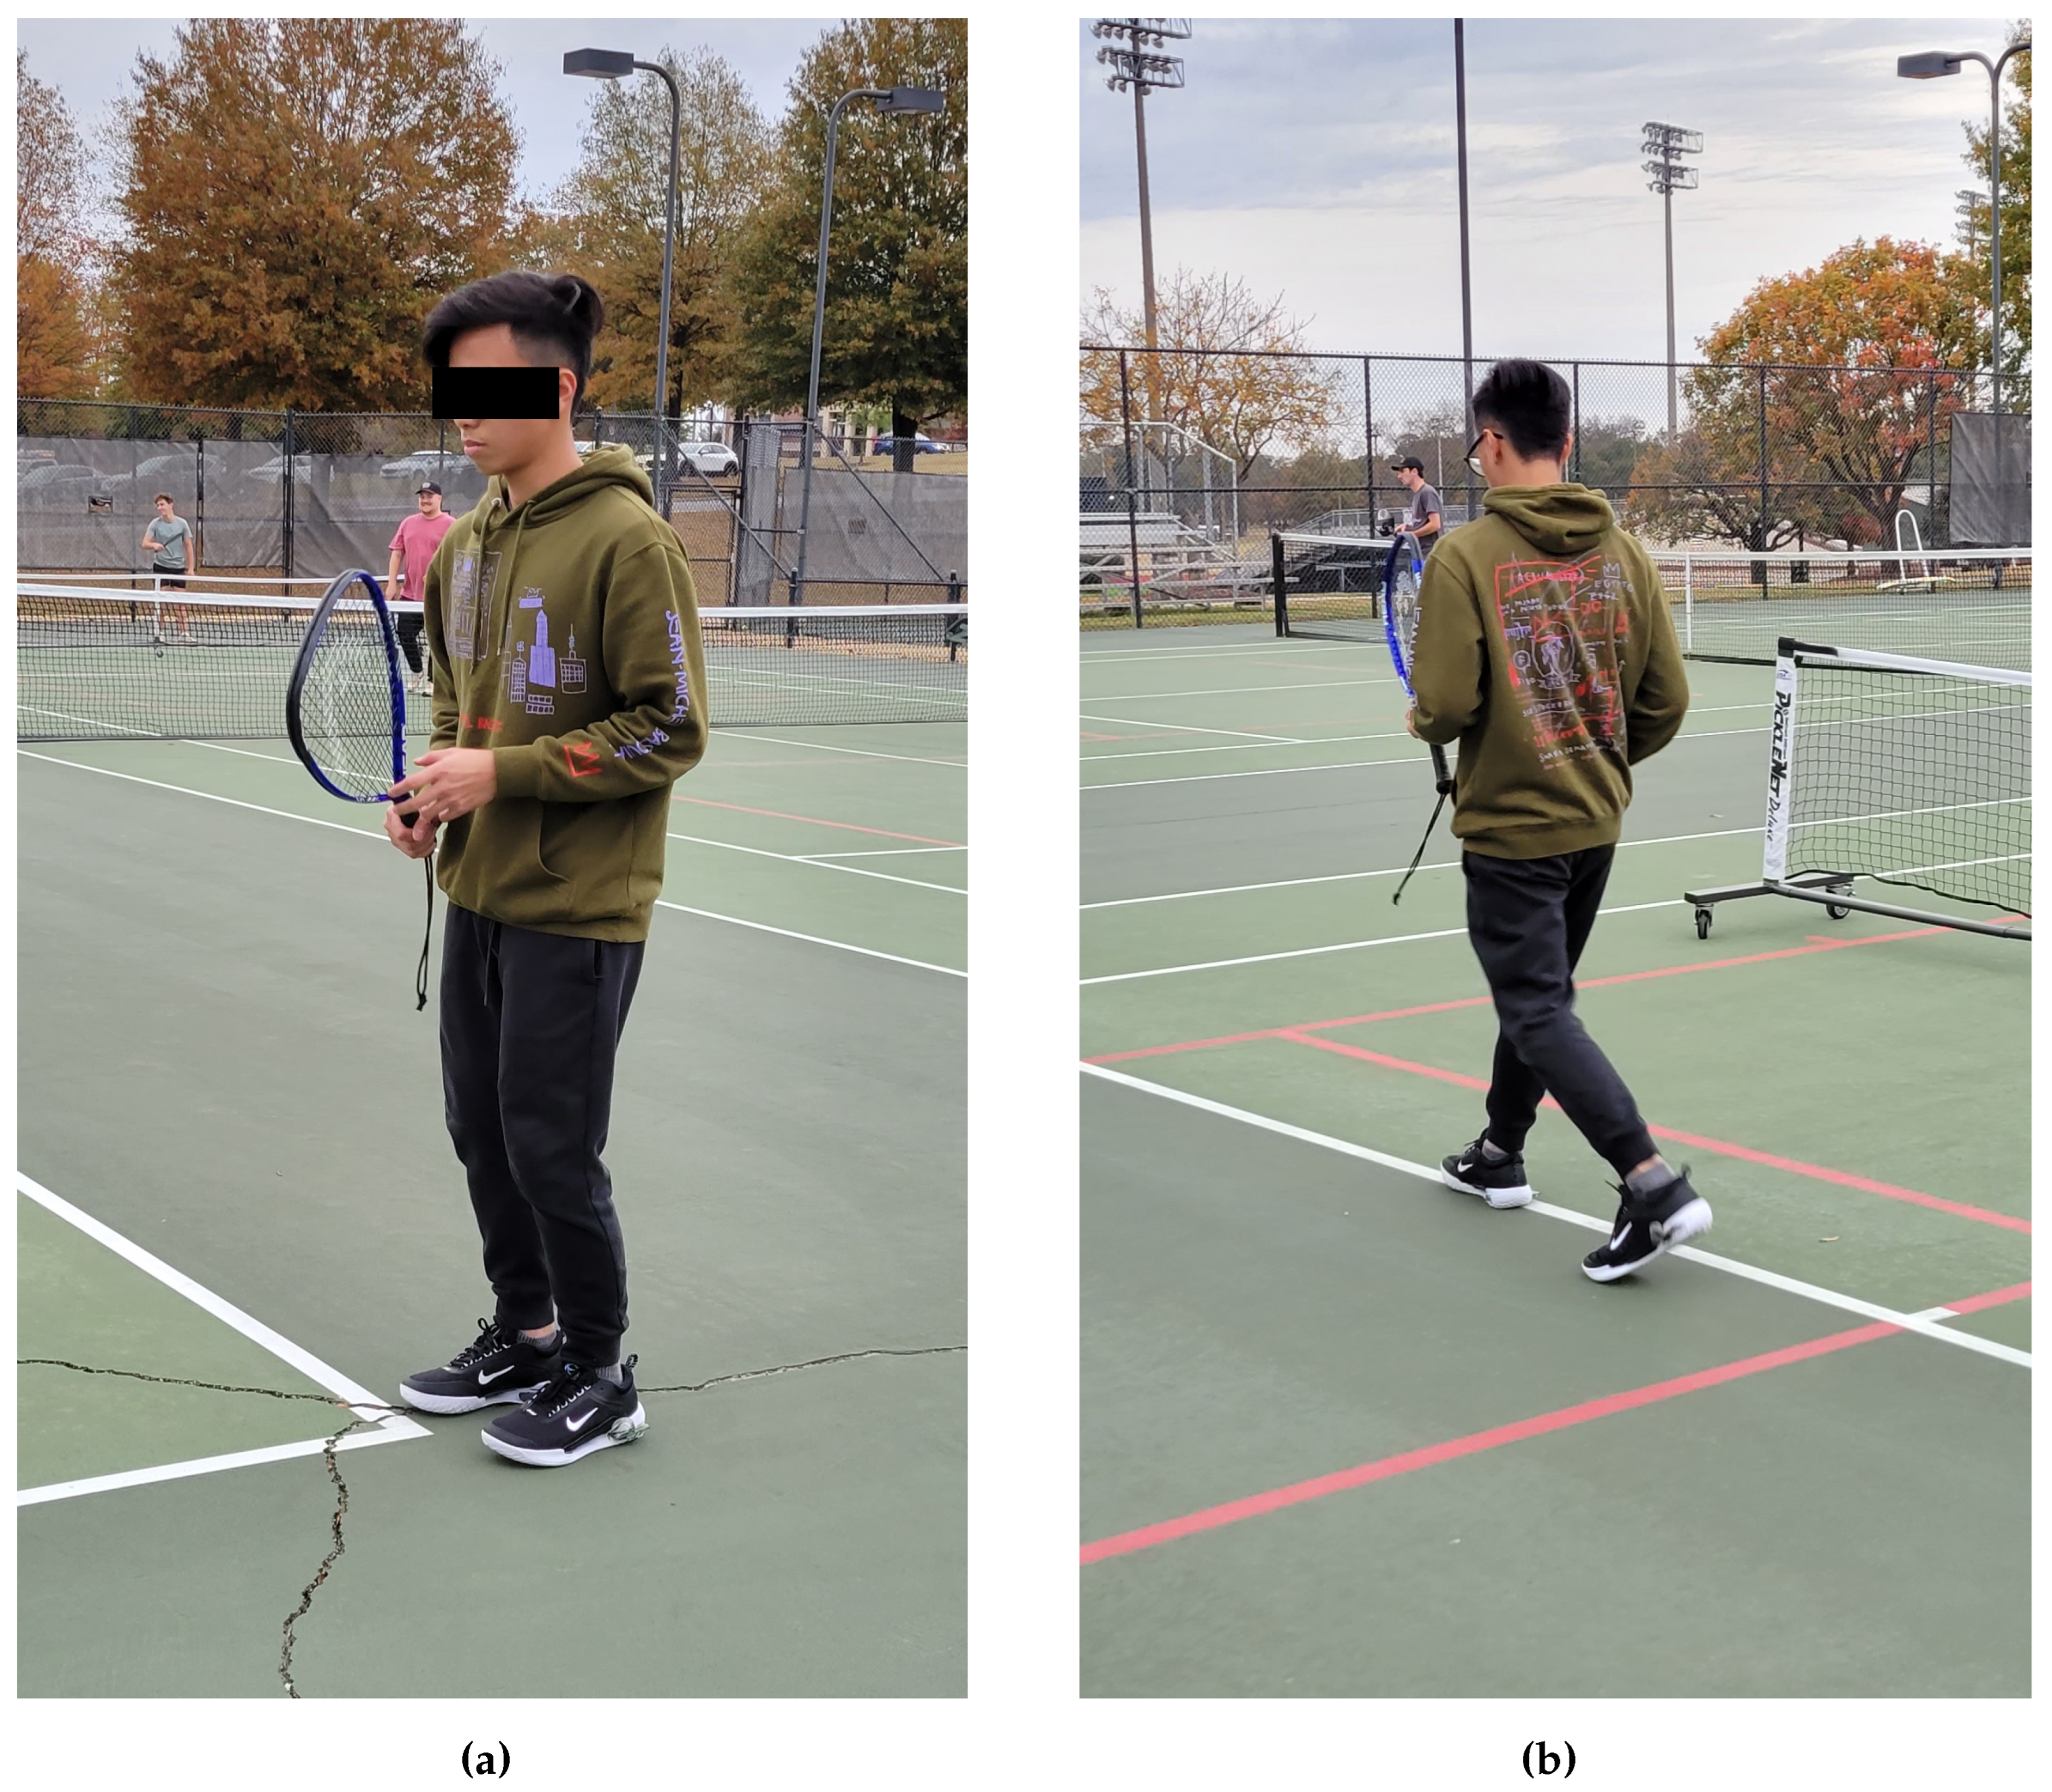
Figure 5.
Acceleration data on X, Y, and Z axes. (a) Acceleration on the X-axis. (b) Acceleration on the Y-axis. (c) Acceleration on the Z-axis.
Figure 5.
Acceleration data on X, Y, and Z axes. (a) Acceleration on the X-axis. (b) Acceleration on the Y-axis. (c) Acceleration on the Z-axis.
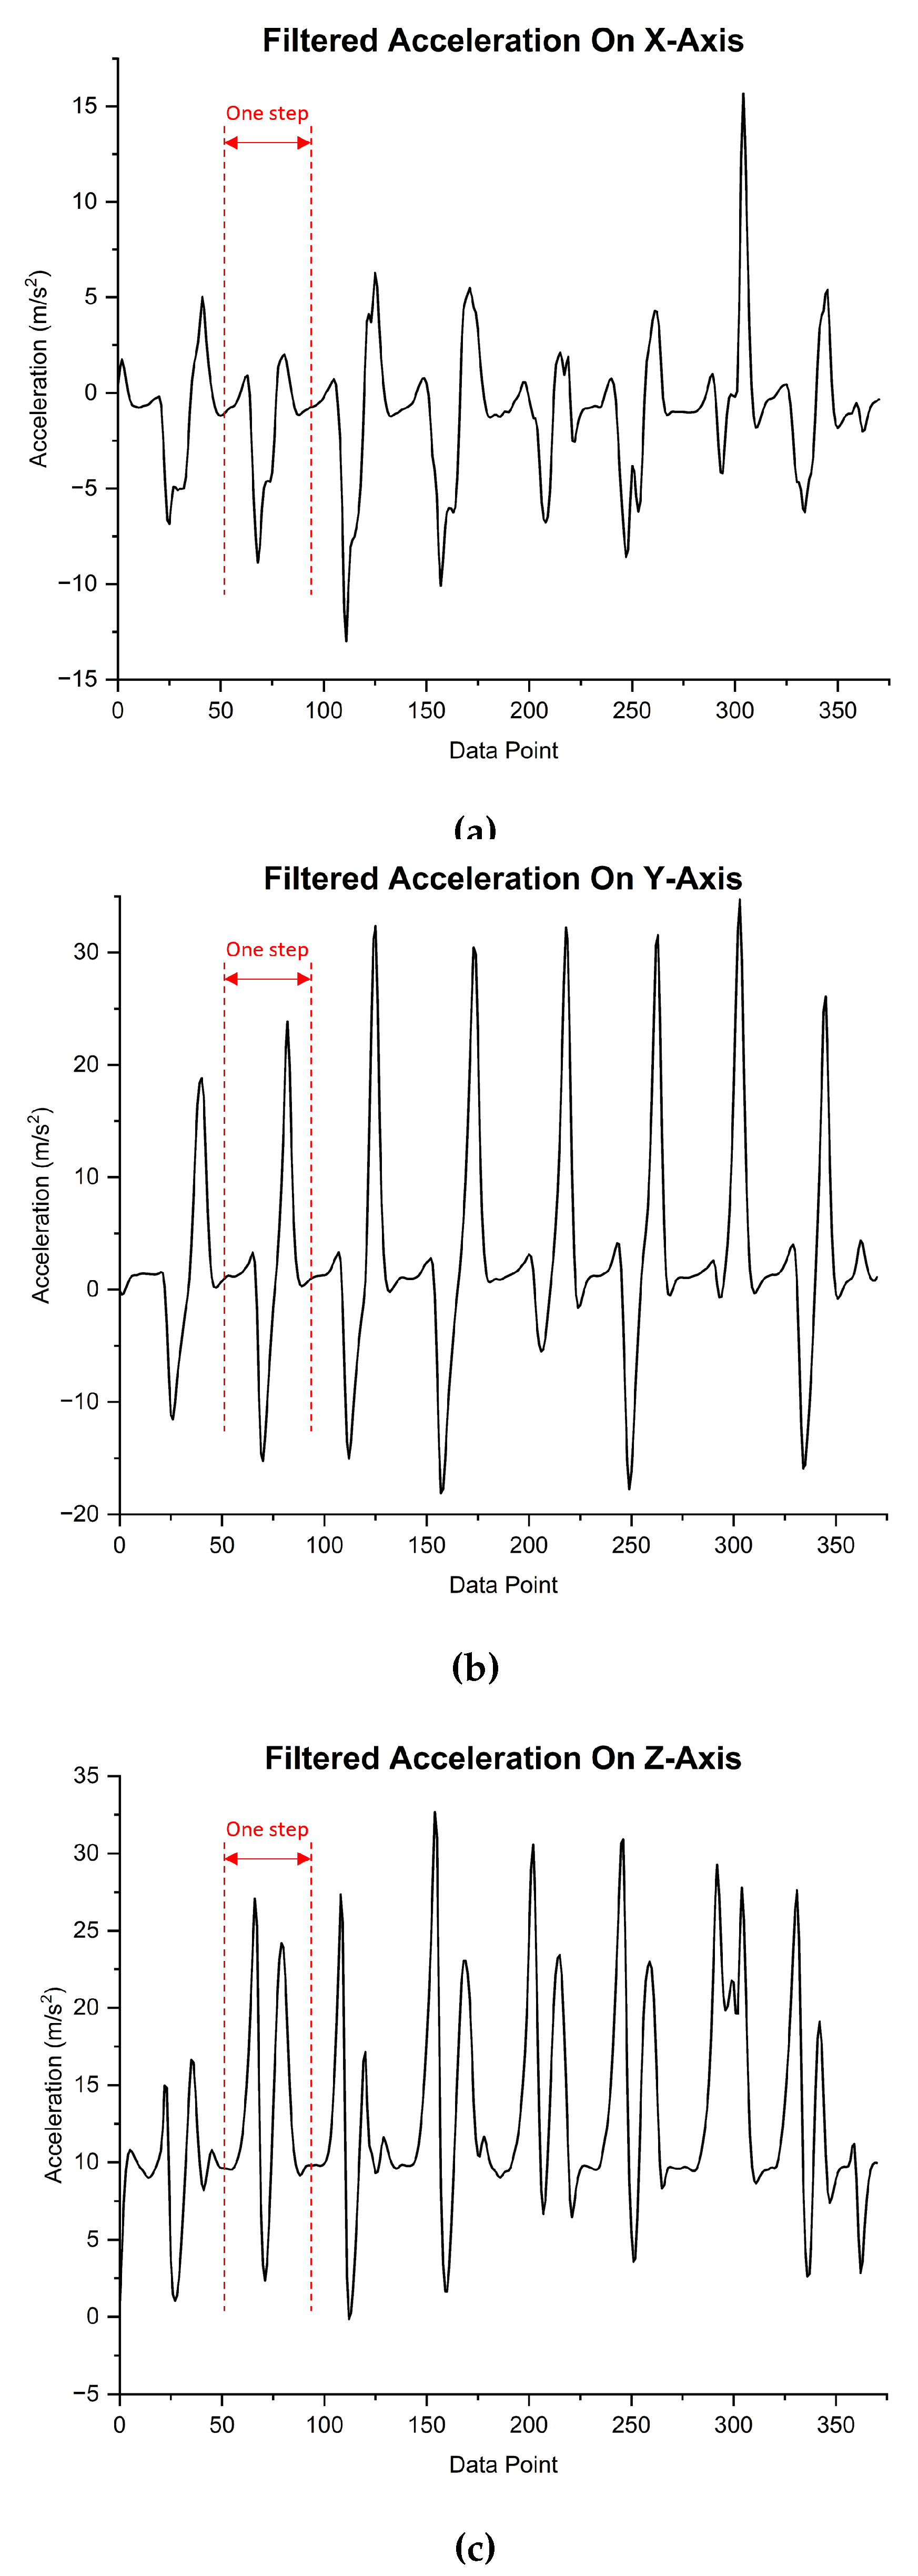
Figure 6.
Gyroscope data on X, Y, and Z axes. (a) Angular velocity on the X-axis. (b) Angular velocity on the Y-axis. (c) Angular velocity on the Z-axis.
Figure 6.
Gyroscope data on X, Y, and Z axes. (a) Angular velocity on the X-axis. (b) Angular velocity on the Y-axis. (c) Angular velocity on the Z-axis.
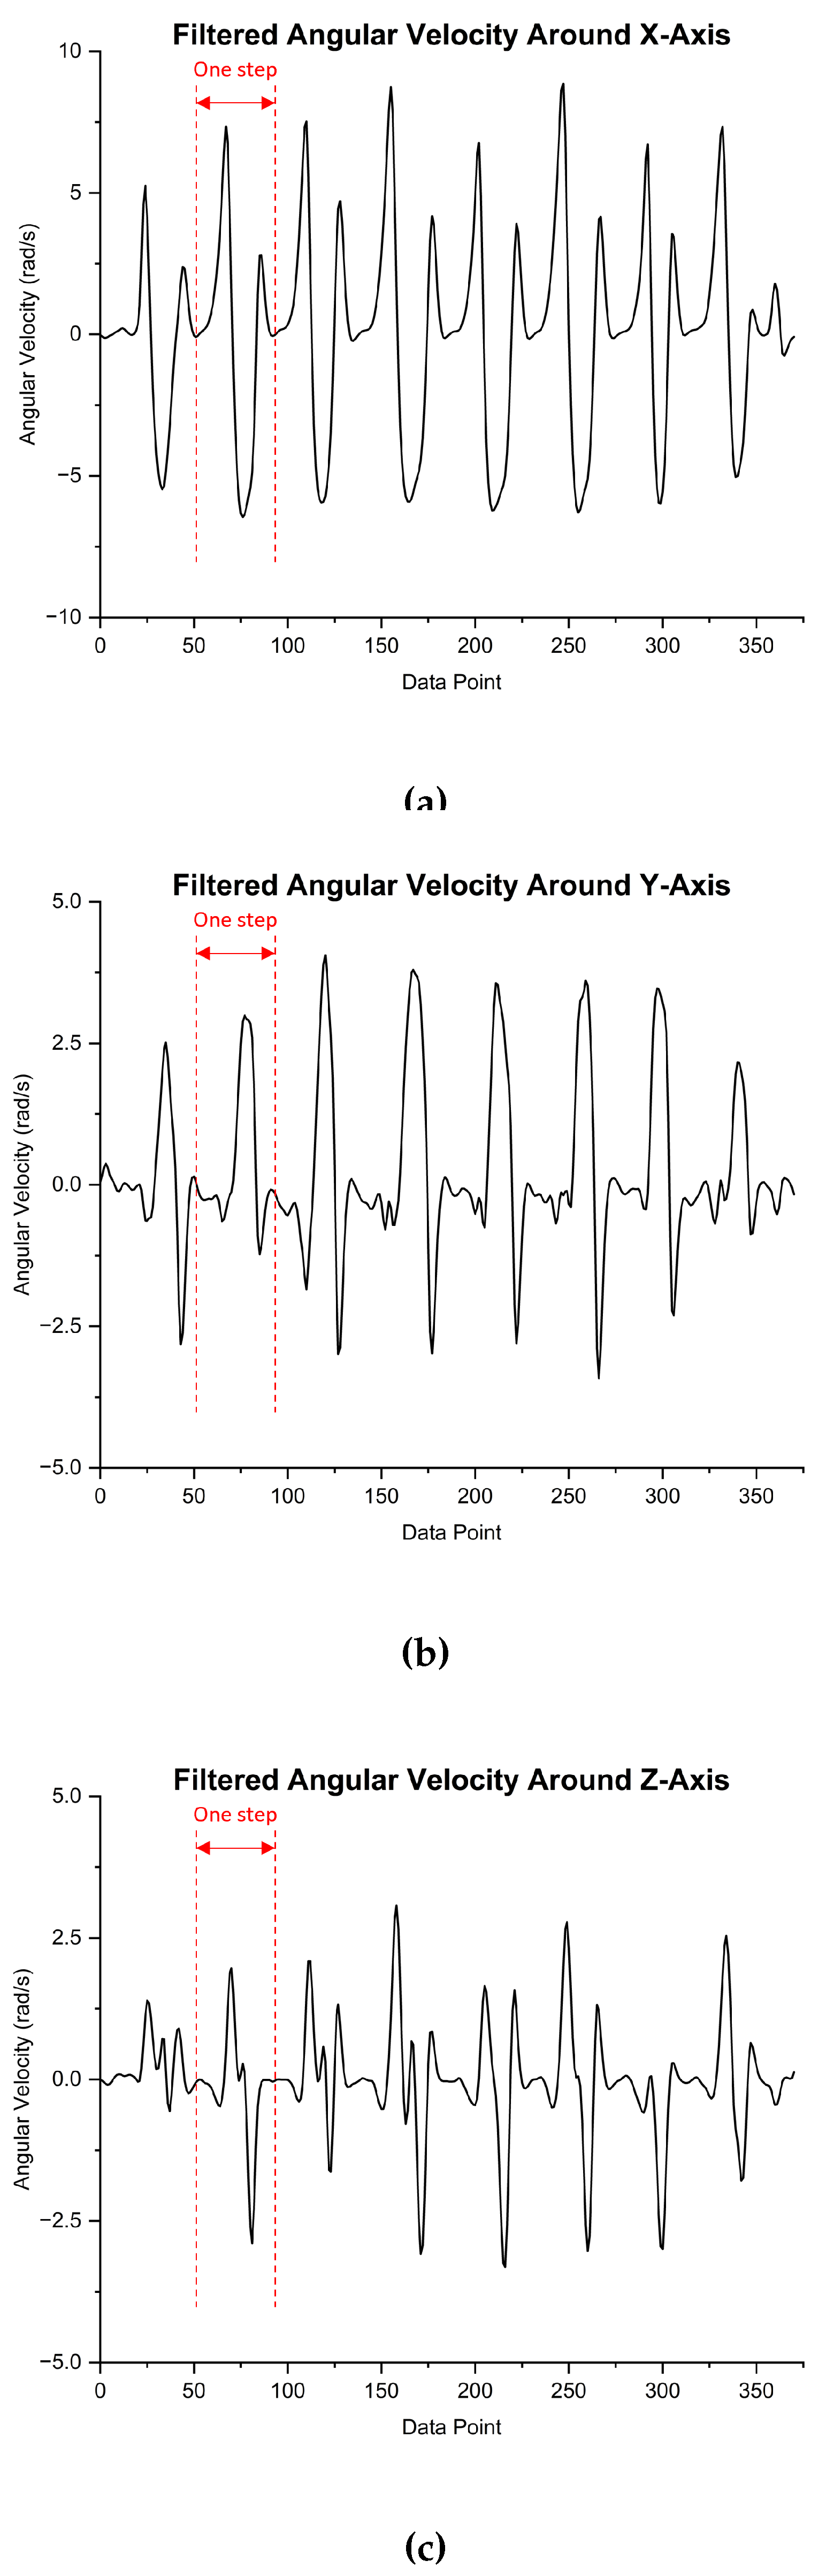
Figure 7.
Cumulative sum of the mean and standard deviation of the total stride length at each individual step.
Figure 7.
Cumulative sum of the mean and standard deviation of the total stride length at each individual step.
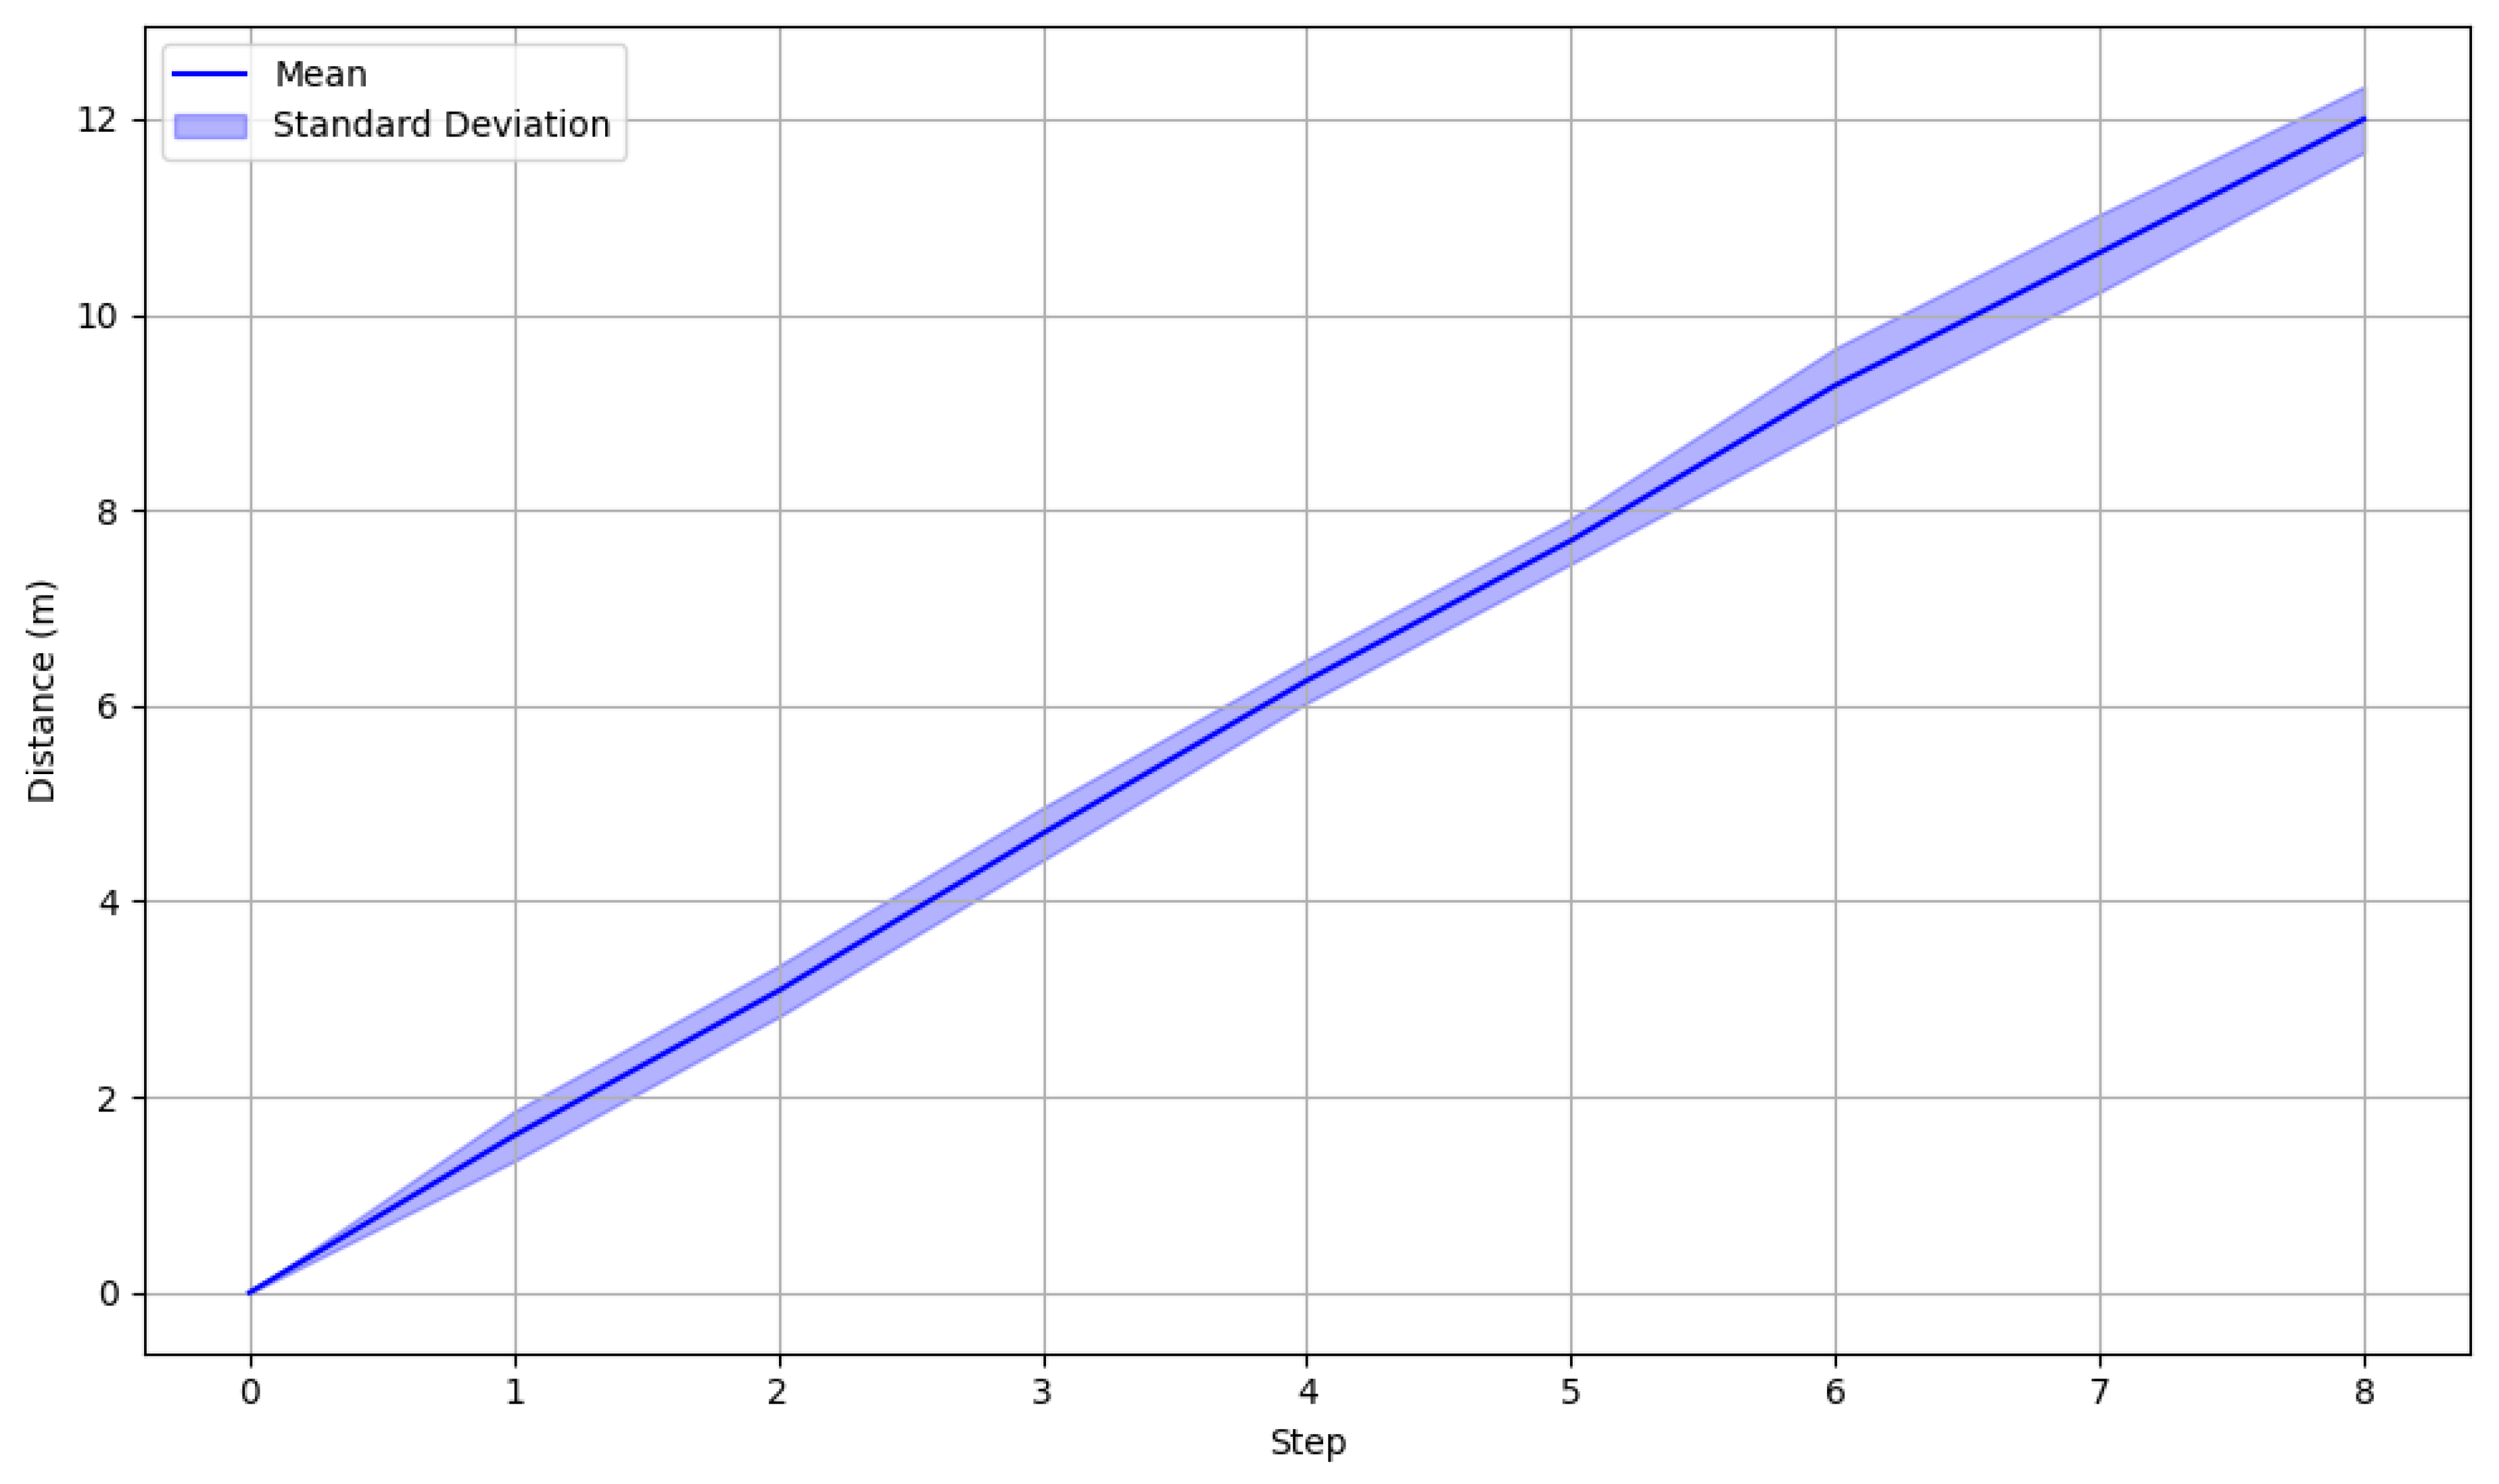

Table 1.
Stride length mean and standard deviation for each step.
| Step 1 | Step 2 | Step 3 | Step 4 | Step 5 | Step 6 | Step 7 | Step 8 | |
|---|---|---|---|---|---|---|---|---|
| Mean | 1.542 | 1.490 | 1.559 | 1.523 | 1.431 | 1.508 | 1.355 | 1.366 |
| STD Dev | 0.254 | 0.261 | 0.269 | 0.222 | 0.231 | 0.386 | 0.396 | 0.336 |
Table 2.
Comparison of different stride length calculation methods.
 |
Disclaimer/Publisher’s Note: The statements, opinions and data contained in all publications are solely those of the individual author(s) and contributor(s) and not of MDPI and/or the editor(s). MDPI and/or the editor(s) disclaim responsibility for any injury to people or property resulting from any ideas, methods, instructions or products referred to in the content. |
© 2024 by the authors. Licensee MDPI, Basel, Switzerland. This article is an open access article distributed under the terms and conditions of the Creative Commons Attribution (CC BY) license (http://creativecommons.org/licenses/by/4.0/).
Copyright: This open access article is published under a Creative Commons CC BY 4.0 license, which permit the free download, distribution, and reuse, provided that the author and preprint are cited in any reuse.


