
Submitted:
04 August 2024
Posted:
06 August 2024
You are already at the latest version
Abstract
The review considers physics and some applications of a new approach that promises to be a breakthrough in efficiency and instrumentation of various methods for nondestructive testing (NDT) of composites. The approach is based on frequency-selective properties of defects which fall into resonance (Local Defect Resonance (LDR)) at certain frequencies. An activation of LDR enables to route the input acoustic energy directly to the defect that dramatically increases its vibration amplitude and thus facilitates defect-selective imaging, rises efficiencies of various derivative acoustic NDT methods (nonlinear, acousto-thermal) and enables to develop some new methodologies, like Resonant Air-Coupled Emission (RACE), machine and remote imaging.
Keywords:
composite defects
; local defect resonance
; resonance acoustic emission
1. Introduction
As market of products and the areas of safety-critical applications of fibre-reinforced composite materials grow steadily, the problems of failure prognosis and damage detection become pressing priorities. Among multitude of methodologies for NDT of composite materials acoustic wave (ultrasonic) techniques feature simple and reliable operation based on relatively inexpensive low-power electronics. However, despite a variety of acoustic NDT apparatus developed, basically all of them use the same fundamental principle: the major implication of wave-defect interaction is considered to be the variation in reflection/scattering of ultrasound from damage in the material in question.
Alternative approaches to use disparity between the intact and soft areas, used in acoustics of air bubbles in water [1] and contrast agents [2], introduce a resonance frequency of the inclusion as a key factor to increase the ultrasonic response of the insonified inclusion.
A similar NDT methodology proposed at the University of Stuttgart [3,4] makes use of mechanical resonance of the defect areas in solids. It is based on the effect of Local Defect Resonance (LDR) which develops if the defect is activated by sonic/ultrasonic excitation whose frequency matches to its natural vibration frequency. The latter is due to the fact that inclusion of a defect leads to a local decrease of rigidity for a certain mass of the material that manifests in a particular characteristic frequency of the defect. Under the frequency match condition, the input energy is delivered and trapped selectively in the defect area that increases dramatically its vibration amplitude.
The increase in local vibration of the damaged area would be also beneficial for enhancing efficiency and sensitivity of the so-called derivative effects in acoustic wave-defect encounter. They include e.g. nonlinear, thermal, acousto-optic, etc. responses also applied for NDT and acoustic imaging of damage. These secondary effects are normally relatively inefficient so that the corresponding NDT techniques require an elevated acoustic power and stand out from conventional acoustic NDT counterparts for their specific instrumentation particularly adapted to high-power ultrasonics.
The LDR approach enhances substantially the efficiency of these NDT techniques based on ultrasonic activation of damage and in recent years has generated much interest in development and applications of the LDR-based techniques for NDT and imaging of defects [5,6,7,8,9,10]. This interest is quantified in the number of the cross-references for LDR topic made over last years (Figure 1).
2. LDR Concept and Simulations: In-Plane Defects
Flat-Bottom Hole Model
The LDR concept is based on the fact that inclusion of a defect leads to a local decrease in stiffness for a certain mass of the material in this area, which should manifest in a particular characteristic frequency () of the defect. We proceed with the interpretation of the LDR concept for defects presented as flat-bottomed holes (FBH), which simulate closely vibrations of typical in-plate defects in composite plates such as delaminations and impacts.
The LDR frequency can be introduced as a natural frequency of the defect with an effective rigidity and mass :. To derive the expressions for and one should evaluate the potential and kinetic vibration energy of the defect [5]. For a circular FBH (radius , thickness ), the expressions obtained are:
while for a square FBH (side and thickness ):
where is the bending stiffness, is Young`s modulus, is Poisson`s ratio, and are the masses of the material with density in the bottom of the defect.
Equations (1-2) are then combined to yield the LDR frequencies for the defects in question:
The expressions for obtained above are applicable to evaluation of the fundamental resonance frequencies of the defects, like FBH as well as laminar defects in rolled sheet metals and delaminations in composites.
The problem in practical use of the analytical approach is concerned with the boundary conditions for the defect edges, which were assumed to be clamped in deriving (3) & (4). This is apparently justifiable for “deep” FBH, however, in a general case the analytical formulation presented above becomes problematic. Instead, the finite element simulation was used to visualize the LDR vibration patterns and to evaluate the LDR frequencies.
The software COMSOL MULTIPHYSICS (physics package “structural dynamics,” “eigenfrequency analysis”) was found to be suitable for analyzing the vibration characteristics of structures with defects and to determine the LDR frequencies. By using eigenfrequency analysis of the model, each possible resonance of vibrations in the plate can be found and the vibration patterns plotted. Figure 2 illustrates the vibration pattern at frequency 8255 Hz, which is readily identified as a fundamental LDR of a square FBH (mm; cm). Note, that the value of obtained is well within the frequency range covered by Eq. (4). A similar “bell-like” vibration pattern reveals a fundamental LDR in a circular FBH at frequency 10.4 kHz (Figure 2 (c)), followed by the higher-order LDR at the higher driving frequency of 23.25 kHz (Figure 2(d)).
Another approach in finding a fundamental natural frequency of a more complicated in-plane system is to use the approximate Rayleigh`s method [11]. It is based on a preliminary assumption for the displacement distribution in the fundamental vibration mode (try-on function) which satisfies the boundary conditions. The function selected is used then in the elastic energy conservation condition by equating the maxima of the strain and kinetic energies of the vibrating body. Since the frequency is always a factor in the kinetic energy term, it is readily found from the energy balance relation. Rayleigh`s method gives a good approximation (within a few percent accuracy) to the correct value of the fundamental frequency. Besides, it provides an additional insight regarding LDR physics by lumping the distributed vibration parameters into equivalent mass and stiffness of the spring-mass model [12]. The case studies to be considered address some basic shapes of the defects to recognize the impact of this factor on LDR frequency for applications in NDT and imaging of planar defects.
Rectangular Delamination
The out-of-plane displacement () try-on function:
satisfies the corresponding boundary conditions at , where and are the defect size (Figure 3), and is used to calculate the maxima of both the potential () and kinetic () energies according to the general expressions given in [11]. For a plate clamped along the edge, these energy relations reduce to the following:
By substituting (5) in (6) after integration the expression for the strain energy takes the form:
The effective rigidity of the vibrating defect is introduced as follows:
where the effective displacement is found by averaging (5) over the plate surface :
Similarly after integration (5) in (7) the maximum kinetic vibration energy becomes:
where is the “rest” mass of the plate.
From (6)–(11) the expressions for the effective rigidity and mass of the vibrating rectangular delamination are calculated. By combining these lump parameters the fundamental LDR frequency is readily derived as:
For one of the defect sizes fixed (in (12) is chosen as an example), this parameter defines the LDR frequency variation as a function of the other defect dimensions. According to (12), the resonance is mainly determined by a smaller defect dimension while its impact becomes negligible as soon as .
Elliptical and Circular Delaminations
These shapes of defects are typical for impact-induced delaminations in anisotropic composite materials of various lay-ups. The analysis starts with a more general case of an elliptical delamination shown in Figure 4. The displacement function satisfies the clamped plate conditions at the elliptical boundary =1 and used for deriving the energy relations. The polar coordinates introduced as: ; make the integration in (6) and (7) comfortable and yield the following expressions for the maximum vibration energies:
The integration in (10) over the area in Figure 4 gives the effective displacement as which is used in (13) & (14) to derive and expressions.
These lump parameters are combined to yield the LDR frequency for an elliptical delamination in the following form:
Comparing equation (15) with (12) indicates that the shape factors for the rectangular and elliptical delaminations are equal, i.e. their LDR frequencies exhibit coherent variations as functions of .
The same conclusion is apparent for a square and a circular delamination which comes as a particular case of (15) at :
Equation (16) written in the numerical form matches the result obtained earlier in [4].
Experimental Verification
A series of experiments was implemented to track the basic outcomes of the theoretical considerations presented. In the experiments, an ultrasonic excitation by a wide-band piezoelectric transducer fed with a chirp signal (1-150 kHz) is combined with a laser vibrometer C-scan of the specimen surface. It enables to indicate all the resonances in every point of the specimen and visualize the defects by a sharp increase in local vibration amplitude. After the LDR frequency range has been identified, the bandwidth was narrowed around the LDR to increase spectral resolution and to measure its frequency response (FR) and the fundamental frequency. The specimens studied included FBH of various shapes in PMMA plates, simulated delamination and real impact damage in carbon fiber-reinforced plastics (CFRP).
Rectangular Shape in-Plane Defects
Figure 5 presents the results of LDR frequency and the vibration pattern for the FBH of rectangular geometry with . The defect FR (Figure 5, b) demonstrates a classical resonance with -factor ~20 that develops over virtually the total defect area (Figure 5, c). The LDR frequency is determined by the maximum of the FR and is found to be Hz. The value calculated from (12) with the defect parameters given in Figure 4 yields Hz, i.e. overshoots the experimental result by slightly less than 7%.
The FR of a square FBH measured in a wideband excitation mode reveals a “double-headed” resonance (Figure 6, b) with lower around the central frequency Hz and a quasi-circular vibration pattern (Figure 6, c). For the defect parameters in Figure 3, from (10) the estimation of the theoretical value gives Hz, i.e. again a few percent higher result. The widening and splitting of the resonance is, possibly, a by-product of the shape of the defect: besides the major resonance axes (along the sides of the square) the FR comprises the resonance components activated along other directions in the defect area at somewhat different frequencies.
This effect becomes even more pronounced in the case of the notch FBH with (Figure 7). The FR observed (Figure 7, c) extends from 80 kHz to more than 100 kHz with the central LDR frequency kHz. A strong rise of the LDR frequency as an impact of confining the width of the defect only (compare with the rectangular FBH case of equal length above) is fairly aligned with the theoretical prediction: Hz from (12) and supports the notion on the resonance being determined by a smaller defect dimension (~).
Elliptical and Circular FBH
Figure 8, a demonstrates a simultaneous activation of LDR for the set of elliptical defects shown in Figure 4 in a wideband excitation mode (chirp input signal 1-100 kHz). By varying the frequency within this band all the resonances were then excited separately and their fundamental LDR frequencies determined. Zoom-in vibration images for a few elliptical FBH shown in Figure 8, b verify continuous vibration distributions over the defect area in accord with the displacement try-on function used in the theoretical description. At higher excitation frequencies the continuous patterns break into the piecewise distributions characteristic of the higher-order LDR (Figure 8, c).
The results of measurements are compared with the values calculated from (15) in Figure 9. It shows that the theoretical estimations overshoot the experimental values for all the defects. This fact already noticed above for the rectangular defects is an intrinsic feature of Rayleigh`s method caused by an approximation in the selection of the trial displacement function [15]. However, according to Figure 9 the deviation of the results virtually does not exceed 5% accuracy of the calculations.
The condition introduces the angular symmetry in a circular defect: all radial in-plane resonance axes inside the defect area are of the same length and therefore activated at the same frequency. This prevents the resonance splitting and broadening effect noted above and normally results in a higher- FR of an accurate shape. Figure 10 illustrates this conclusion for a circular FBH in PMMA plate with the following parameters: mm; mm; mm. For these values, the calculations from (16) confirms the experiment within the accuracy of Rayleigh`s method to yield Hz.
3. LDR Defect Imaging via Laser Vibrometry
The methodology of vibrometry was successfully applied to a search of LDR and imaging of defects in a variety of composite materials. Similar LDR with local resonance “amplification” of the vibration amplitude as high as ~ 20-40 dB were generally measured for other types of realistic defects as illustrated below.
Figure 12 demonstrates imaging of a delamination (c) and heat damaged area (~10x7 mm2) (a, b) in a CFRP plate. The ultrasonic excitation at the LDR frequency (48.5 kHz) clearly visualizes the damage (Figure 12, a) while the image taken at 30 kHz (Figure 12, b) shows no evidence of the defect.
A strong frequency selectivity of LDR implies an opportunity of detecting a certain defect among a multitude of other defects. This feature is illustrated in Figure 13 for two heat damaged areas in CFRP plate shown in Figure 13, a. The ultrasonic excitation at LDR frequencies enables to visualize the defects separately (Figure 13 b, c) while a wideband excitation over the frequency range of both LDR brings a clear image of all the defects (Figure 13, d).
If the bandwidth of the excitation is expanded beyond the range of the fundamental LDR to include the higher-order resonances, the latter are found to contribute considerably to the quality of imaging. The effect is illustrated in Figure 14 for a square insert (2x2 cm2) at 1.2 mm depth in a (300x300x5 mm3) CFRP specimen. While the fundamental LDR vibration pattern (Figure 14, a) is localised mainly in the central part of the defect, the maxima of the higher-order resonances are closer to the contour parts of the inset (Figure 14, b) and gradually fill complete area of the defect (Figure 14, c). As a result, a wideband excitation which covers a number of the higher-order LDR visualizes clearly a total shape of the defect (Figure 14, d).
4. LDR of an Out-of-Plane Crack
Edge Waves Resonance
According to the above, a major type of flaws in composites is concerned with inter-ply delaminations where a resonating layer is approximated by a freely vibrating plate of the size and shape determined by the parameters of the defect [4]. In the classical resonance interpretation, the LDR is, therefore, perceived as an outcome of a standing wave resonance formation for the flexural waves (FW) inside the delaminated plate. A similar approach is valid for the out-of-plane defects, like through thickness cracks. If the crack face is close to a traction-free boundary, the FW is believed to end up with a wave known as an edge wave (EW) propagating along the crack faces. A constructive interference of the EW gives rise to the crack LDR which is readily applied for acoustic NDT and imaging of cracks even in a relatively low frequency domain [13].
The EW is guided by a free end-face of an isotropic plate: the lower stiffness of the free edge slows down the wave motion and introduces the field inhomogeneity along the distance from the edge. At low frequencies, the EW velocity in isotropic materials coincides with that for the FW within (0.1-0.2)% range: [14], (where is the material Poisson`s ratio) and exhibits an identical dispersion law. As the frequency increases, the EW is trapped by the edge and is strongly localized near the 90°-corners of the plate end-face (90°-wedge mode). Its velocity drifts further down from the FW speed, however, still stays within minor deviation from the A0-mode dispersion law.
Similar to a Rayleigh wave guided by a free surface, the EW field consists of exponentially decaying partial waves. In thin plates, one of the constituents dominates, and the EW out-of-plane displacement is weakly inhomogeneous and decays almost exponentially with the distance from the edge () [14].
The following two points must be substantiated to validate the EW-contribution to the crack LDR: the wave dispersion and acoustic field distribution around the crack correspond to the dispersive and decay features indicated in the preceding section; the resonance causes vibration amplitude to rise distinctly at particular LDR frequencies. In the framework of the measurements planned, a minor difference between the FW- and EW-velocities is inessential, so in the experiment one assumes and identical dispersion laws for both waves. The crack LDR is specified by the conditions for constructive interference of the EW propagating along the crack faces (length ) with clamped ends (crack tips) so that the LDR frequencies of order (1, 2, 3 ...) are found as:
where is the frequency dependent EW velocity.
Experimental Methodology and Data
The specimens to be tested include damaged concrete plates having through-thickness cracks each showing cracked hairlines on both surfaces (Figure 15). Despite the crack is closed by compressive internal stress the cracking hairlines are clearly seen. Due to composite material structure (fine aggregate) the cracks (Figure 15) are not homogeneous along the length and actually have some areas of open cracking. Despite a fairly high dissipation, the standing waves in the specimen were observed and enabled to measure and then to plot the wave dispersion curve (Figure 16). The latter is found to be in a compliance with a direct calculation of the curve (dashed line) by using the bulk velocities data measured in the specimen (m/s, m/s).
In the frequency range indicated in Figure 16 a series of the crack resonances was observed. Figure 17 demonstrates an image for a fundamental LDR with characteristic asymmetrical rise-decay manifested for slanted crack N1. The resonance spans over 80 mm (almost a total crack length) and is observed at frequency 4.984 kHz. According to Figure 16, the wave velocity at this frequency is 660 m/s and for =80 mm, =1, from (17) an estimation for an expected value of a fundamental EW LDR is kHz, i.e. in a reasonable fit with the experiment (16% deviation).
Since some areas of the cracks are more open than the others they are, obviously, advantageous for the EW resonances producing so-called partial LDR [15]. The two examples of partial LDR on the opposite crack faces are shown in Figure 18, a, b) for crack N2. The both LDR exhibit a typical slow decay characteristic of the EW. The estimations for the LDR frequencies made by measuring in the images yield a very close compliance with the experiments: kHz (versus 7.063 kHz measured) and kHz for 7.938 kHz LDR (deviation <2% in both cases).
As it was mentioned above, at higher frequencies the EW turns into the 90°-wedge mode which is expected to be strongly localized near the 90°-corners of the crack. This effect is evident from Figure 18, c, d where the high-frequency crack LDR are shown. The wave field is fully different from the EW low-frequency examples and, as predicted, is localized exceptionally at the crack face edge. The frequency of the mode is high enough to excite the higher-order resonances: the third (=3) and the fourth-order (=4) LDR are readily seen in Figure 18, c, d. The calculations of their frequencies for the crack length (87 mm) from (17) give the values =18.1 kHz and =26.5 kHz. The enhanced frequency deviation from the experimental data for the higher-order LDR (12% and 37%, correspondingly) is possibly due to the effect of additional phase shift upon reflection from the crack tip that was not considered in (17). Nonetheless, both partial and the higher-order LDR have an important contribution to resonant imaging of cracks. Indeed, in a wideband mode, all the LDR fields excited are superimposed and must fully recognize a real crack size. The image of crack N2 shown in Figure 18, e is obtained in (1-20 kHz) chirp mode and confirms the applicability of this approach to full-scale imaging of cracks.
5. LDR of 3D Defects: Porosity Air Bubbles
A new NDT task has become apparent recently and is concerned with testing of porosity in composite materials. It is an unavoidable manufacturing problem for lamina structures such as CFRP caused by air released during epoxy cure process. The voids filled with trapped air diminish interlaminar strength and affect other mechanical properties quite strongly so that the 2% porosity level become the nominal acceptance threshold for many composite components [16]. Various complicated NDT techniques, like X-ray computed tomography, X-ray radiography are currently the candidates for inspecting porosity in composite materials. However, a single NDT technique that could provide the information on the level of porosity in a composite laminate independent of pore morphology and the fiber matrix materials is still to be developed.
As a step in this direction, we studies opportunity of LDR [17] in ultrasonic FR of a single air bubble in solid epoxy to be used as an indicator of its porosity. The theoretical fundamentals of acoustic wave interaction with a porous bubble are given followed by experimental results with bubbles of different sizes. The higher harmonic spectra are demonstrated to accompany porous bubble vibrations also indicating an opportunity for nonlinear ultrasonic NDT of porosity.
Theoretical Fundamentals of Air Bubble FR
We assume a spherical coordinate system in the center of an air bubble to consider its vibration in the medium excited by an acoustic wave with the wavelength larger than the size of the bubble (radius ). The spherical standing wave vibration expected in the bubble requires the following relations for the pressure and vibration velocity inside the bubble [18]:
By combining (18), for the impedance of the vibration in the bubble one obtains:
The values and the bubble resonance frequencies allowed are found from the boundary condition at
where is the input acoustic impedance of the wave field in the surrounding medium.
To keep the approach simple, the two specific cases for the surrounding medium are quite easy to consider: freely vibrating bubble (light surrounding medium) and (clamping of surface vibrations by heavy load). These two cases cover the range of the media (and the depth of the bubble) possible and enable to evaluate the expectations for various experimental situations.
In the first case , and Eq. (19) yields resonance frequencies: or (21) , where is the integer. The result for the set of LDR frequencies (21) is easily interpretable: an integer multiple of the wavelengths in air fit into diameter of the bubble for the resonance to happen. The first LDR frequency corresponds to the bubble spherically symmetrical vibration (breathing mode) whose radial displacements are readily observable in experiment. For 1 mm radius bubble and sound velocity in air m/c, this value from (21) is estimated to be in the range of 170 kHz. For evaluation LDR of any bubble radius, it is convenient to keep in mind the product whose value from (21) is .
For the second case (clamped bubble surface), Eq. (19) is reduced to:
The solution to (22) could be illustrated by plotting its both sides as functions of [17].
The first root corresponds to that yields for the resonance frequency of the first LDR kHz for a bubble of 1 mm radius. The LDR frequency for other radii could readily be estimated by using the product in this case. Since shows the number of the wavelengths that fits the radius (), the above value indicates some phase loss in the reflection that impedes a simple interpretation of resonance given in the first case. It also shows that all intermediate cases of require a detailed evaluation of the phase loss reflection to get an LDR frequency. However, the above simplified approach, firstly, indicates that for mm-size bubbles the range of possible values of lies in the high-kHz band and, secondly, could be used for fast verification of the rationality of the values for LDR frequencies obtained in NDT experiments.
Experimental Testing: Linear FR of a Porous Bubble
4.1. Production of Defined Pore Sizes in Epoxy Resin
To produce the porous test specimens, a cylindrical cavity was filled with approximately 20 ml resin/hardener mixture in a first step. An epoxy resin/hardener mixture with an average pot life of 40 minutes was used. The resin-filled cavity was then exposed to a vacuum of 0.1 bar for a period of 20 minutes to prevent an uncontrolled formation of pores in the following curing process. To produce a defined pore, the reacting epoxy resin must have a high viscosity to prevent the air pockets from rising. This condition was met after a reaction time of about 65 minutes. A defined amount of air (~0.005 ml) was then injected into the reacting resin using a syringe. This amount of air creates pores with diameter of 3-4 mm.
Three porous specimens were produced according to the procedure above (Figure 19). A precise characterization of the produced pores was first implemented by using scanned X-ray computed tomography system (FF20, Yxlon International GmbH, Hattingen, Germany). The bubble radius R, the thickness of the specimen and the pore volume were determined based on the analysis of the reconstructed test specimens performed with Avizo (Thermo Fisher Scientific Inc., Waltham, Massachusetts, U.S.).
Methodology of Testing
To excite vibration of the bubbles, piezo-ceramic actuators of longitudinal waves were attached to flat surfaces of the cylindrical specimens of various thicknesses. The fundamental frequencies of the actuators are in the range (7-15 kHz), however, they provide reliable wideband excitation in the frequency range up to 200 kHz.
They are driven by various wideband voltage signals (1kHz-1MHz, periodic chirp signals) generated by the HP 33120A arbitrary waveform generator combined with HVA B100 high-amplitude amplifier (isi-sys) to result in 30-50 V input amplitude for the piezo-actuator. To measure and analyze the FR of the spherically-symmetrical out-of-plane vibrations in the bubble area a scanning laser vibrometer (Polytec 300, bandwidth 1MHz) in the vibration velocity mode was used. To probe the vibration field, the laser beam was mainly aligned through the flat bottom of the transparent epoxy cylinder. This setup version (Figure 20) provided a wide view angle and enabled to measure the field inside the bubble as well as outside it.
Measurement Results of Bubble LDR
The FR measured for pore N1 is shown in Figure 21. An obvious LDR at kHz is clearly observed when the laser beam hits the pore (Figure 20). For the bubble radius mm (Table 1),, therefore, amounts to225 m/s, i.e.. The value measured is well between theoretical expectations: .
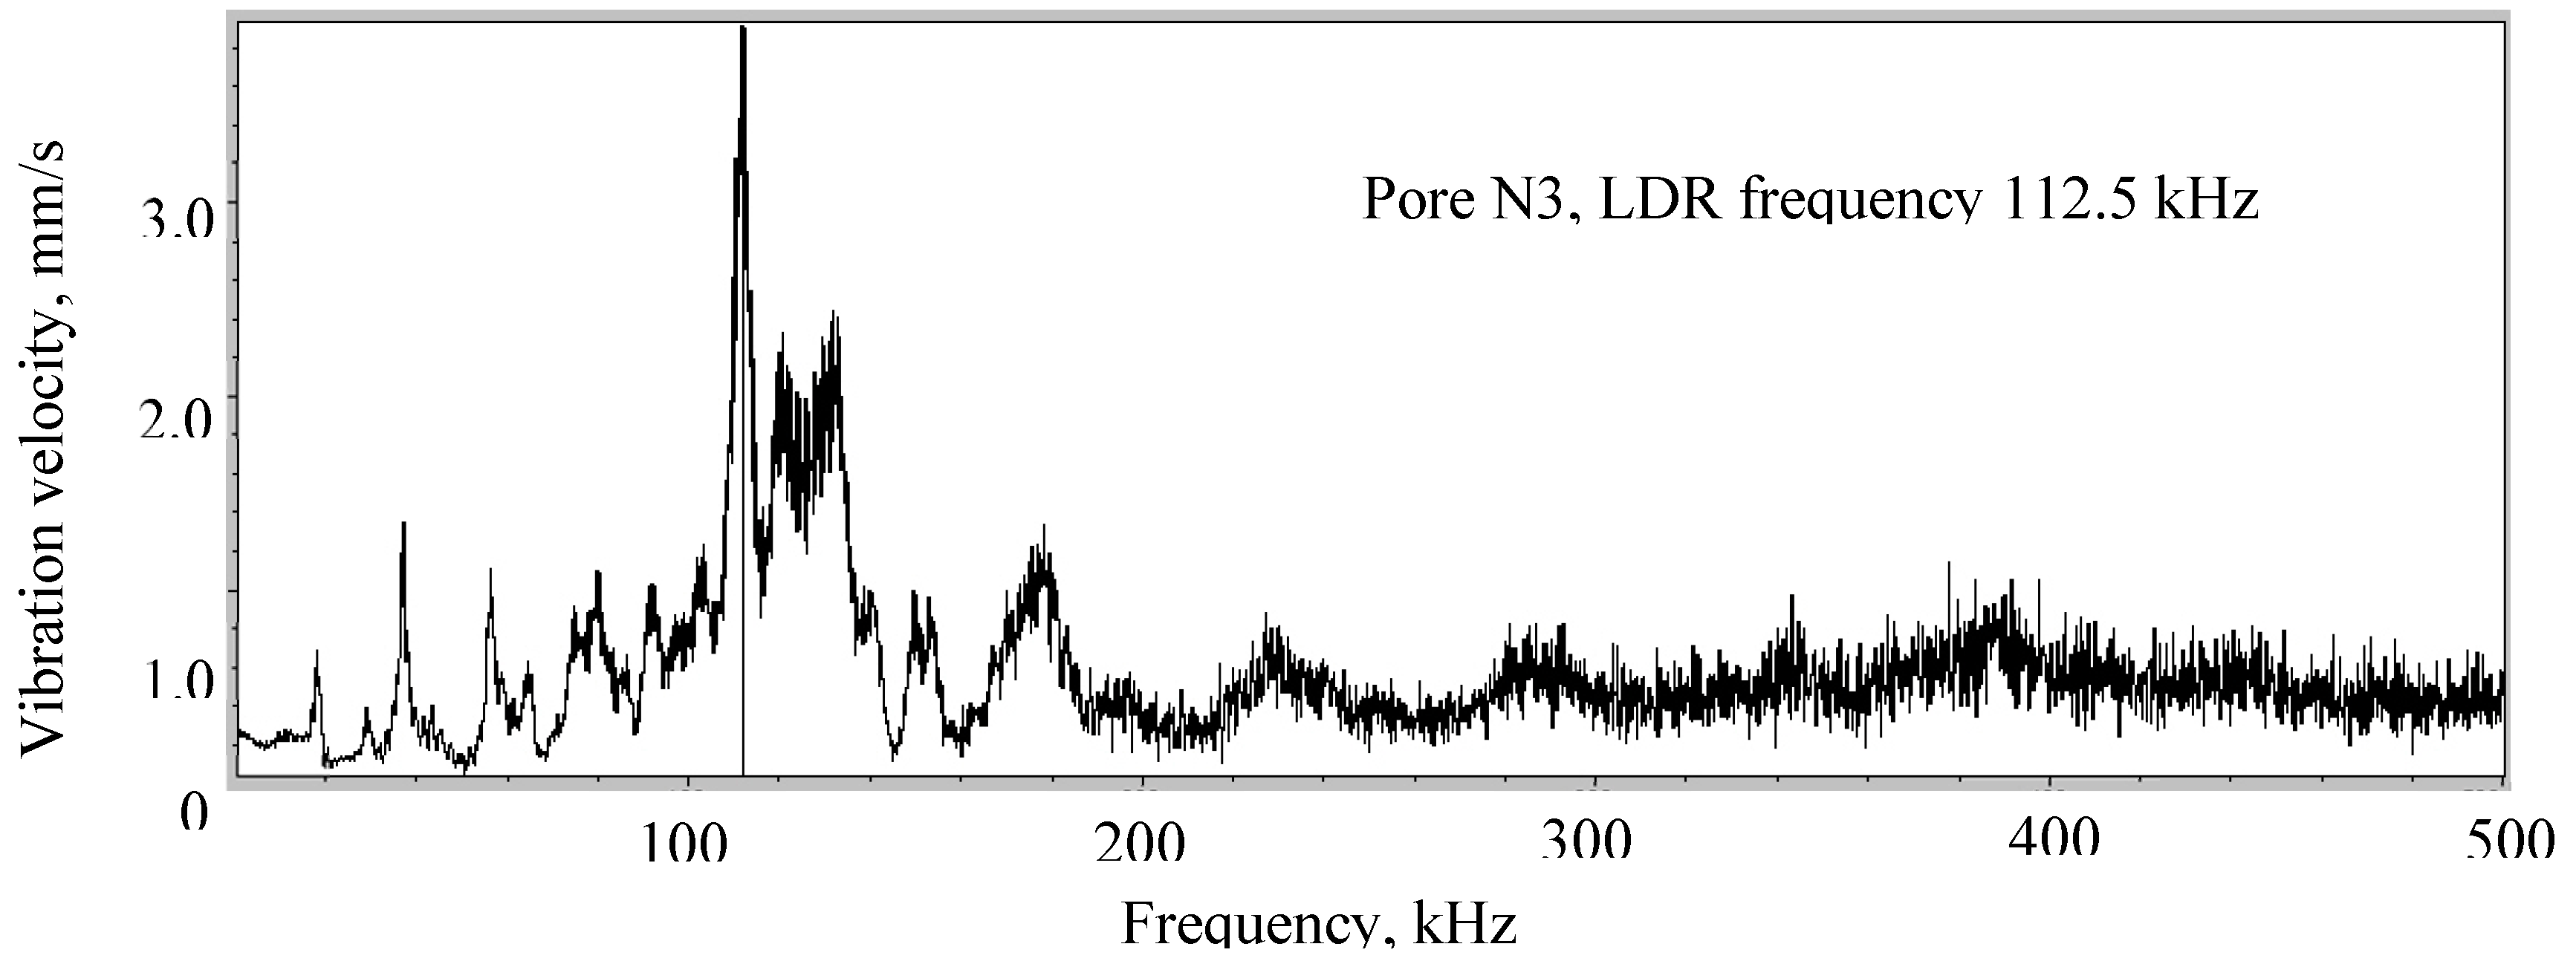
A similar conclusion can be drawn from FR measurements for the other spherical pores e.g. N3 shown in Figure 22. The corresponding LDR frequencies measured and the values of the parameter are summarized for all 3 bubbles in Table 1. All the values obtained are around > that also fits to the range anticipated from the above theoretical analysis.
Figure 23.
LDR FR measured for pore N3.
Nonlinearity in vibrations of porous bubbles vibration
Assume the gas in a spherical bubble to be ideal so that its vibration follows the Poisson`s function [2]:
where the adiabatic index, and are the time-dependent (harmonic) values of the pressure and radius of the bubble: ; . By using these relations in (23) after some algebra one obtains:
By identifying as the bubble strain and as the stress, Eq. (24) is considered as mechanical equation of state. The nonlinearity of this equation could be readily seen from Maclaurin power expansion and written in the form similar to the plane wave nonlinearity:
where and are linear and nonlinear elastic parameters for spherical waves in air.
Their detailed explicit expressions can be readily derived from (24) but within the frame of the present consideration an important deduction is that for initially harmonic vibration Eq. (25) turns into power series of the higher harmonics whose generation is verified in the following experiments.
The linear spectra obtained above show that the pore vibration amplitude increases greatly when the bubble is in resonance i.e. vibrating at the LDR frequency. Therefore, to experimentally observe nonlinear effects of the higher harmonics in pore vibration, the excitation first changed from the wideband to harmonic mode at LDR frequencies. The results for specimen N1 (LDR139 kHz) are shown in Figure 24 a, b for the two laser beam positions, inside and outside the pore, correspondingly.
The higher harmonics increase dramatically as the laser beam probes the pore vibrations in vicinity of the boundary with the solid (Figure 24, a); their non-zero level outside the bubble (Fig, 24, b) is due to the harmonics radiated from this area into the specimen and spurious signals due to clir-factor of the transducer. The efficiency of the higher harmonic generation was found to be extremely high to provide multiple numbers of the harmonics observed in all pores measured. This is obvious from the nonlinear FR of pores N1 and N3 (Figure 24 a, c) obtained for excitation at corresponding LDR frequencies (see the vertical scales).
The higher harmonics generated in the pores are accompanied by a strong amplitude modulation clearly seen in Figure 24 a, c. This effect is associated with a destructive/constructive interference in the reflection of some air harmonics from the bubble boundaries. It emphasizes the resonance character of the pore nonlinearity and is also manifested in strong higher harmonic generation for subharmonic excitation . In this case, the phase matching and constructive interference in the reflection are to take place most likely for the nth harmonic, where n is an integer. This effect is supported by an increase of the selected odd harmonics in the odd LDR subharmonic excitation as illustrated in Figure 25, a, b for specimen N 3.
6. LDR for Nonlinear NDT and Defect Imaging
Classical Nonlinear Modes
As it was demonstrated above, an activation of LDR enables to route the input acoustic energy directly to the defect that dramatically increases its vibration amplitude and shifts into nonlinear regime. Nonlinear acoustics is a promising NDT technology for diagnostics of damage based on the wave frequency conversion (e.g. generation of higher harmonics, mixing frequencies, etc.). Such “classical” nonlinear modes correspond to nonlinear terms in non-Hookian equation of state (type eq. (25)) of the material. They use the excitation at the fundamental LDR frequency while the nonlinear images usually demonstrate a higher contrast than the fundamental LDR image (see Figure 26).
Nonclassical Resonant Modes
The concept of LDR combined with the defect nonlinearity identifies it as a nonlinear oscillator and results in qualitatively new “non-classical” features characteristic of nonlinear and parametric resonances [15]. The resonant boost of the nonlinear spectral components confined within the damaged area, therefore, can be readily applied for efficient high-contrast defect-selective imaging. In a lumped model, the forced vibrations of such a nonlinear oscillator are described the following equation:
where is the dissipation factor, and , , … are the higher-order parameters of nonlinearity.
For a bi-frequency (,) excitation, the combination frequency resonance occurs and the spectrum of the mixed frequency vibrations caused by the -order nonlinearity is determined by the driving force, i.e. contains the frequencies , where . This provides multiple frequency imaging for a single C-scan as illustrated in Figure 27 for an elliptical delamination in GFRP specimen with LDR frequency ~19 kHz.
7. LDR Highly-Efficient and Noncontact Vibro-Thermography
Ultrasonic thermography (vibro-thermography, thermosonics) stands apart from other ultrasonic NDT counterparts for their specific instrumentation. To provide a measurable temperature response, thermosonics traditionally relies on high-power ultrasonic welding equipment, which includes kW-power supply (at fixed frequencies 20 or 40 kHz) and piezo-stack converters combined with ultrasonic boosters and horns [19]. The test specimen is usually pressed against the horn that results in unstable ultrasonic response and highly non-reproducible measurements. The reason for this “specificity” is concerned with a low efficiency of ultrasound-heat conversion that is usually taken for granted without an effort to be optimized. To make ultrasonic thermography compatible with conventional ultrasonic equipment would be a step on the way to extend its applicability in NDT. To this end, an obvious task is to find out a feasibility of ultrasonic thermography in the mW-acoustic power range typical for commercial ultrasonic applications [20].
Heat Generation by LDR Vibrations
In ultrasonic thermography, the defect thermal response is caused by a local dissipation of mechanical energy, which is converted into heat. For viscoelastic materials, this process is described by introducing the internal friction stress proportional to the velocity of strain variation that leads to a complex material elasticity E=E1+jE2 where the imaginary part causes energy dissipation. For low loss materials E2<<E1, the dissipation module E2≈ηE, where η is the material loss factor. The complex material stiffness brings about a hysteretic stress-strain dependence (hysteretic damping model) with an area of the ellipse ΔW=πε02E2 equal to the energy damping in a unit volume of the material per cycle of vibration. The number of cycles per second is ω/2π, so that the heat energy generated per unit time (heat power) is:

According to (27), the heat power generated is proportional to the frequency ω and the square of the strain amplitude ε0 of vibration. Therefore, the use of LDR, which strongly intensifies local vibrations, is beneficial for enhancing the efficiency of ultrasonic thermography.
It is instructive to note, that the polarization of the vibration is not worked out in the hysteretic damping approach. Note thereto that the high amplitude vibrations developed by LDR are polarized predominantly out-of-plane and therefore are readily detected by laser vibrometry as shown e.g. in Figure 10. The heat generation mechanism, however, is concerned with internal friction, which is expected to be related to the in-plane vibration components. The evidence that the out-of-plane component of vibration is not directly involved in local heat generation is seen by comparing the LDR pattern for a FBH and the temperature induced pattern in the same defect (Figure 3). A smooth “bell-like” LDR vibration profile inside the circular FBH (Figure 10) generates a strong local heating in the centre surrounded by a temperature rise ring along the circumference (Figure 29).
The out-of-plane displacement (U(r)) is nonetheless accompanied by the in-plane extension-compression deformation εr: it is zero in the middle plane of the plate and reaches maximal values on its both surfaces [21]:

where d is the thickness of the plate.
For a fundamental resonance, the radial distribution of U(r) in a circular FBH (radius R) is given in [11]:

By substituting (29) in (28) the normalized radial distribution of the in-plane strain is calculated. Under assumption of the internal friction and the hysteretic damping approach (eq. (27)), the temperature profile and a local temperature rise generated by LDR vibrations can then be found by squaring the in-plane strain distribution. To this end, for a given vibration amplitude U(0) (measured by laser vibrometry) the absolute values of a2 and a3 are found from (29) and then used in calculating εr in (28). The values obtained are substituted in (27) to determine the heat energy generated in the defect and thus the temperature rise ΔT(r) in the defect over a certain insonation time t:

where E is Young`s modulus, ρ is the mass density and cH is the specific heat of the material.
Figure 30.
Profiles of LDR vibration pattern measured by laser vibrometry and calculated from Eq. (29).
Figure 30.
Profiles of LDR vibration pattern measured by laser vibrometry and calculated from Eq. (29).
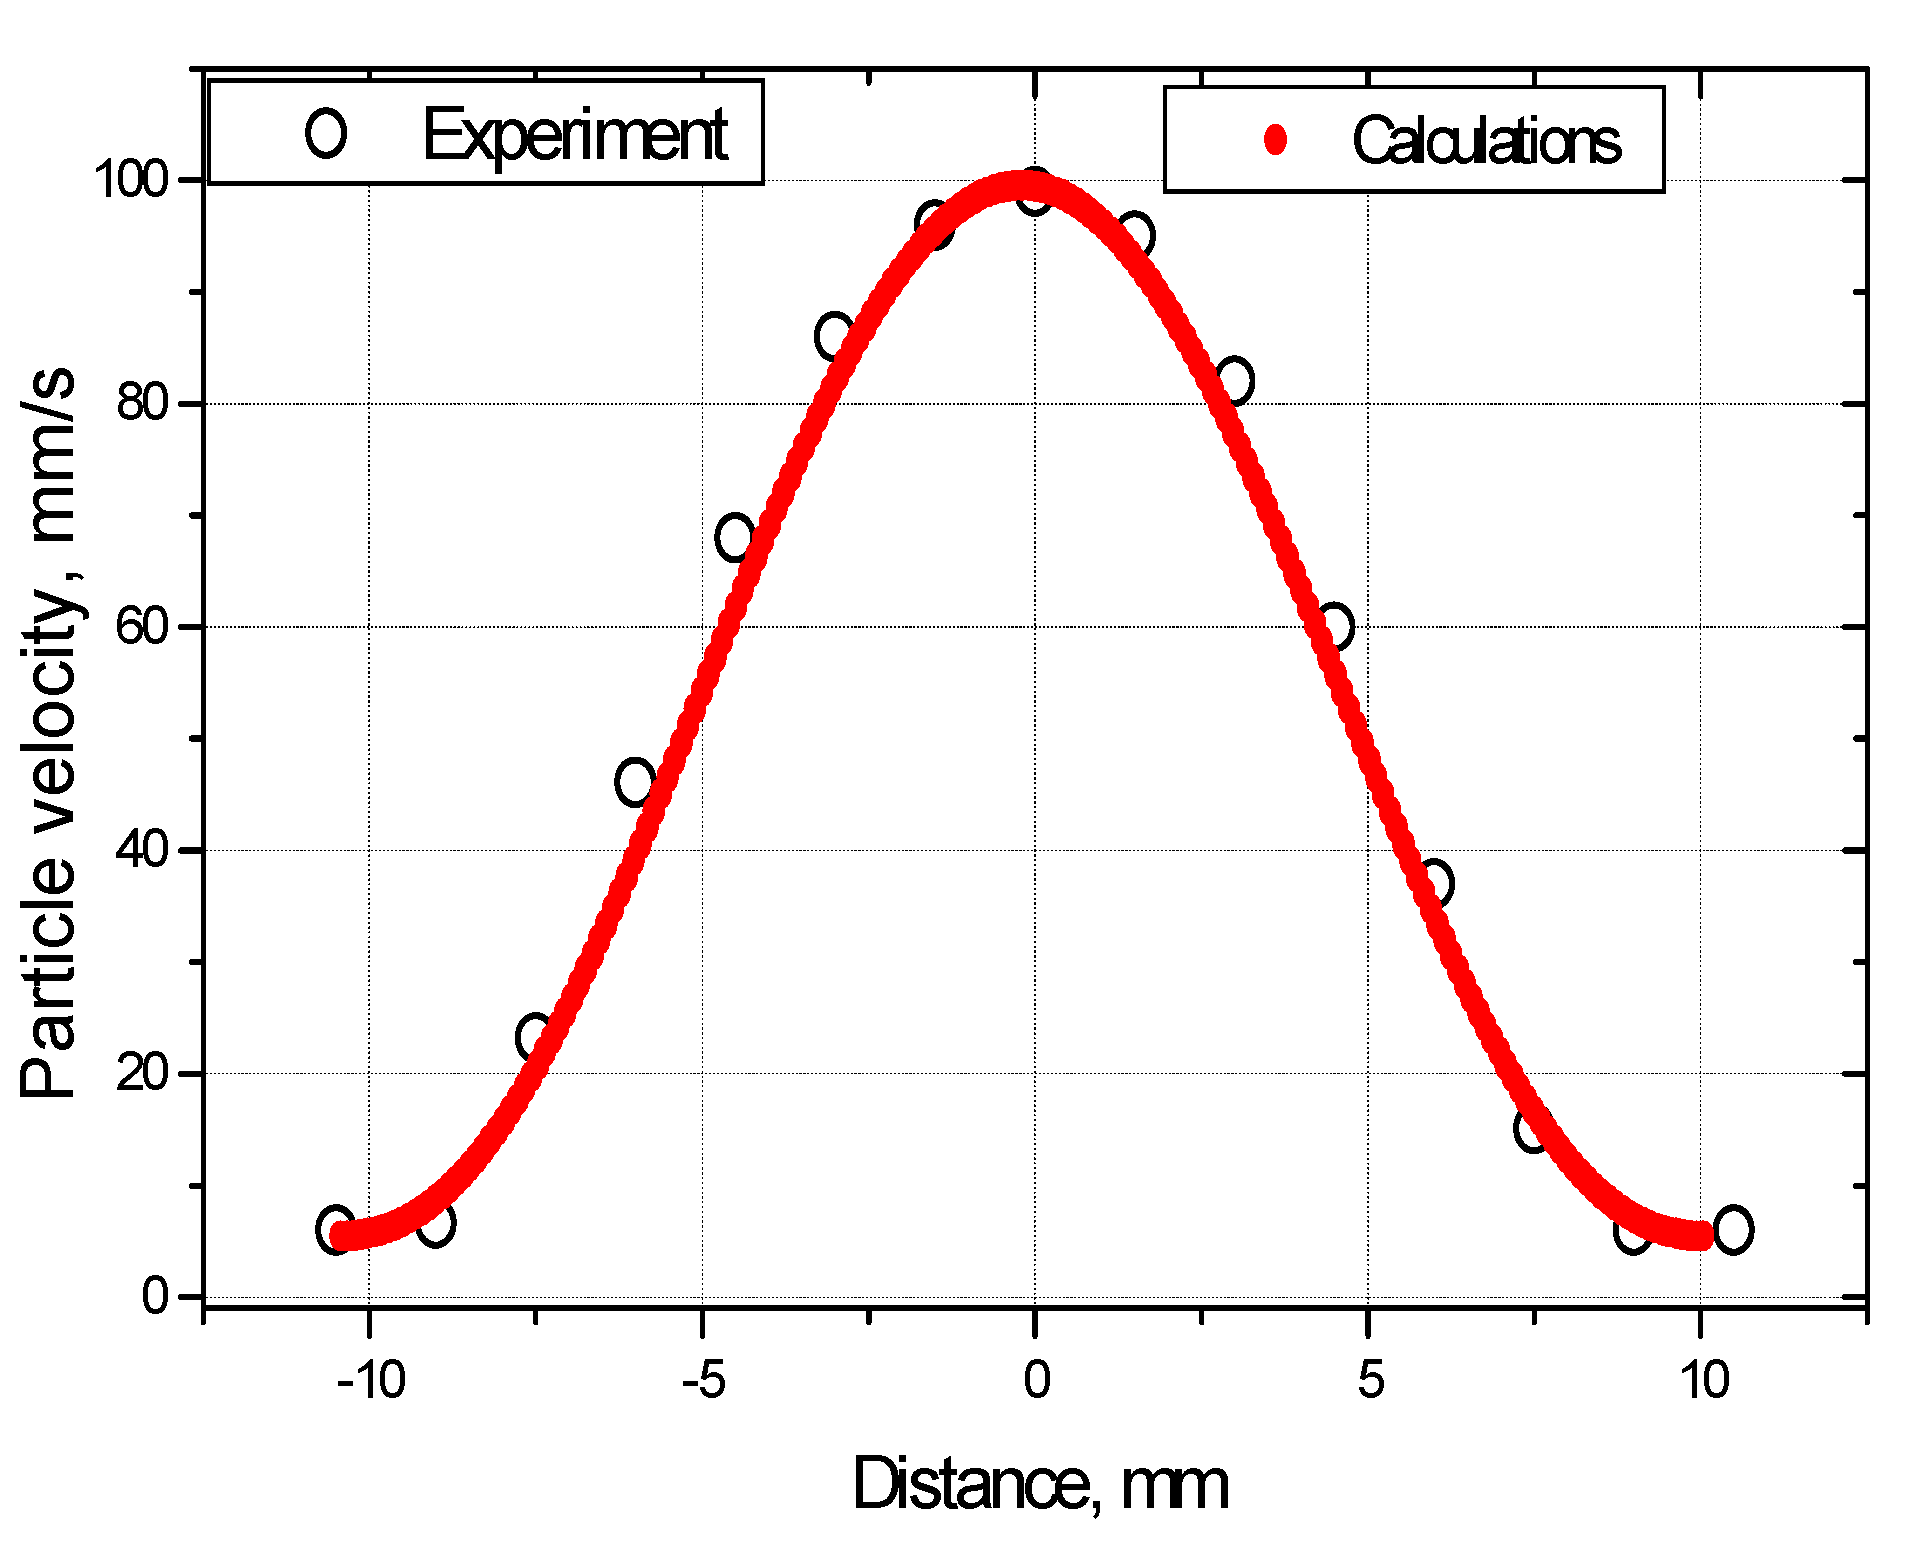
The calculations of the temperature profile inside a circular FBH (LDR frequency 12480 Hz) in PMMA carried out from (28)-(30) for the following experimental parameters: R=1 cm; d= 1 mm; t=10 s; U(0)=8·10−7 m; E=4.8 GPa; η=0.02 are shown in Figure 31 and compared with the experimental data (see Figure 29). A very close fit between the calculations and the results of measurements confirm a validity of the approach developed.
Figure 32 shows the dynamics of the FBH LDR-thermal response: an accurate linear dependence on the input acoustic power agrees fully with theoretical expectations of Eq. (30). The data also reveal an extremely high efficiency of the vibrothermal conversion: at ~200 mW input and 15 s-ultrasonic exposure, the temperature rise in the central part of the FBH amounts to ≈3 K. To quantify the LDR-enhanced acousto-thermal conversion efficiency introduced as N=PQ/Pac , the power required for such heating is calculate as PQ≈5x10⁻³ W and for radiated acoustic power Pac≈200 mW their ratio yields: N≈2.5%.
A crucial contribution of the LDR to the heating effect is clarified by measurements of the temperature rise in the defect area as a function of driving frequency (Figure 33). Even a slight (2-3%) detuning from an exact LDR frequency brings the temperature down to a basically non-measurable level of 10-20 mK and reduces the conversion efficiency by two orders of magnitude to (1-2) x10−4.
LDR Vibro-Thermography Imaging
The enhancement of a defect thermal response by using the concept of LDR demonstrated above is applied to thermosonic imaging of defects. Conventional ultrasonic piezo-ceramic transducers (Conrad Elektronik GmbH) were used for excitation of defects in the strip-like specimens of 10-20 cm length producing a quasi-plane wave field. In larger specimens, the defects were activated by using mobile vacuum attached transducers, which generated cylindrical flexural waves. In all experiments, the acoustic power produced was monitored with a laser vibrometer and kept within mW-range.
Figure 34 and Figure 35 show the results of LDR thermosonic imaging of a rectangular (20x20 mm2) insert at 1.2 mm depth in (300x300x5 mm3) CFRP specimen. Figure 34 demonstrates a crucial role of LDR: At fundamental LDR frequency (8980 Hz) for 15 s insonation and 80 V input, the temperature response (~0.25 K) is by more than an order of magnitude higher than that outside the defect resonance (8000 Hz). The laser vibrometry measurements reveal both the fundamental (Figure 35(a); 8980 Hz) and the higher-order (Figure 35(b); 15600 Hz) LDR with substantially different vibration patterns. The thermal images taken at the corresponding excitation frequencies (Figure 35 (c), (d)) demonstrate the importance of the higher-order resonances for visualization of the defect shape: while the fundamental LDR visualizes the center part, the higher-order LDR are responsible for imaging of the border areas of the defect.
Figure 36 illustrates the application of LDR thermosonics to an aluminum aviation component: (1.8x180x300 mm3) plate with a fatigue crack between the rivet holes (zoomed optical image Figure 36 (a)). The identification of LDR of cracks in metals is complicated due to high mechanical quality factors of the materials and various vibration modes of the cracked defects. One of the LDRs of the fatigue crack measured by laser vibrometry at 11600 Hz is shown in Figure 36(b); the thermosonic image obtained at this frequency (Figure 36(c)) demonstrates the applicability of the LDR methodology to imaging of this kind of defects.
The temperature rise measured in Figure 37 (a) confirms highly efficient LDR thermosonics of the impact damage in CFRP: ΔT = 1.4 K for ~60 mW input acoustic power. Such a temperature variation provides an opportunity for reliable LDR thermosonic imaging in the mW power range (Figure 37 (b)) with a high temperature contrast in the lateral direction (Figure 37 (a)).
The results shown above imply that a strong increase in the defect temperature rise (thermal output signal) at LDR frequency enhances the signal-to-noise ratio (SNR) of thermosonic imaging. An increase of the SNR is also known to occur in the lock-in mode primarily due to diminishing the noise level [22]. By introducing the benefit of LDR in the lock-in approach a resonance thermosonic mode operating at unusually low excitation levels can be projected. To this end, following the general lock-in concept the amplitude of ultrasonic excitation at the LDR frequency was modulated sinusoidally at the lock-in frequency (between 0.01 Hz and 1 Hz). A temperature image sequence of the surface was recorded with the IR-camera and a discrete Fourier transformation at the lock-in-frequency was applied to compress this image sequence into a pair of amplitude and phase images.
The enhancement in sensitivity and the SNR of LDR lock-in imaging are readily seen from Figure 38, where the amplitude lock-in (a) and LDR temperature (b) thermosonic images of the FBH are shown. To have the SNR>1 in the temperature image (Figure 38, b), the input power had to be increased by up to ~2 mW (to generate ΔT~ 100 mK). On the contrary, the LDR lock-in image in Figure 38, (a) was taken when the input was reduced to anomalously low power of ~ 200 W. The background for such an extraordinary performance is a combined action of the lock-in (reduction of noise) and the high thermosonic quality factor (efficient heat generation) in the LDR for this defect. Figs. 38 (a), (b) illustrate the enhancement in sensitivity of thermosonics by combining LDR and lock-in for an impact damage in a CFRP plate: the amplitude lock-in image (a) corresponds to ~1 mW input power while a similar contrast of the temperature image (b) requires ~16 mW of acoustic power.
Non-Contact LDR Thermosonics
Such an efficient ultrasonic activation of defects enables to proceed with a remote thermosonic mode by using air-coupled ultrasonic (ACU) excitation. For this purpose, we used the Ultran ACU transducers whose fundamental frequencies (~50 kHz and ~70 kHz) match the LDR frequencies of defects. The transducers were placed a few cm away from the defect area, while the IR-image was observed from the opposite side of the plate specimen (ACU-IR non-contact “through- transmission” mode) (Figure 40(a)). The AC-radiometer methodology was employed to measure the ACU power (PACU) radiated. The temperature response of a FBH in a PMMA plate was measured for an input ACU power of ~50 mW and 30 s insonation pulse and is shown in Figure 40(b): the temperature rise in the FBH area amounts to ~0.6 K that is far beyond the sensitivities of modern IR-cameras.
An example of ACU imaging of realistic defects is illustrated in Figure 40 for an impact damage (LDR frequency ~69.6 kHz) in a 1.1 mm-thick multi-ply CFRP plate. To improve the sensitivity of thermosonics, the LDR excitation was combined with the lock-in technique. The ACU thermosonic phase images of the circular shape damage (radius ~12 mm) induced on the rear side of the impact are shown in Figure 41 and taken in the lock-in mode for the input ACU power of ~7 mW. The laser vibrometry images are given in Figure 40 for comparison. When the input ACU frequency matches exactly the LDR frequency (69.6 kHz), both techniques reveal the total circular impact area reliably (Figure 41 (a), (b)). The similarity in the frequency behaviour of laser vibrometry and ACU images confirms the practical relevance of non-contact thermosonics.
8. Resonant Air-Coupled Emission (RACE) and Machine Imaging
Another NDT technique is based on detection of airborne waves emitted by the resonating defects. This Resonant Air-Coupled Emission (RACE) method [23] can be 100 % contact free and simply needs an acoustic microphone to detect emitted vibrations. RACE imaging is achieved by using different mechanical scanning units (three-axis-scanning table and industrial robot). A new approach to an instant view of a full field ultrasound imaging is proposed by using a microphone array (acoustic camera). By applying beam forming algorithms to the recorded sound data of each microphone, vibrations are instantly detectable and visualized. Adapting of acoustic cameras to sound field imaging enables to save testing time and to make progress in the development of new fully acoustic methods for NDT of composite materials.
Experimental Evidence for RACE
The experimental evidence for RACE is demonstrated for a resonant acoustic wave interaction with impact damage in CFRP specimen shown in Figure 42. To visualise the airborne field produced by LDR vibrations the reflection scheme of ACU-vibrometry [24] is applied. The technique uses a focused laser beam which propagates through the wave field in air, then bounces back from a fixed reflector and enters a sensitive heterodyne inter- ferometer of the laser vibrometer Polytec 300. Due to photoelasticity of air the optical path length of the beam and its frequency are modulated according to the pattern of the airborne acoustic pressure.
The application of the technique to visualisation of RACE in CFRP specimen with LDR is illustrated in Figure 42. The airborne field in Figure 42, a) is first measured for a 45 kHz plate wave incident on the impact (in the direction of the arrow) whose position is indicated by the white circle. This frequency is clearly outside the range of LDR and, as expected, the pressure field in air above the defect is a phase matched airborne plane wave propagating at an angle defined by the ratio of the sound velocities in air and in the specimen (Figure 42, a).
When the wave frequency corresponds to LDR frequency (61200 Hz) the airborne field changes dramatically (Figure 42, b): the radiation from the defect area dominates and turns into a plane wave at a distance of a few wavelengths from the defect. In the near field zone, a part of the wave front could be considered as a plane wave emitted by the defect in a vertical direction in Figure 42, b. The near field part of radiation is, therefore, preferable for receiving the RACE signal. Depending on the LDR frequency for this purpose one can use either ACU transducers or a microphone positioned in a close proximity to the specimen surface.
In the experiments, for activation of defects was developed by using piezo-actuators with a frequency response extended into 100-200 kHz range. The actuators are vacuum attached to the specimens and can be used for on-site measurements of large components. To identify the LDR frequency the transducers are driven in sweep or chirp modes (bandwidth above 100 kHz, input voltage 10-20 V) generated by the HP 33120A arbitrary waveform generator combined with HVA 3/450 or HVA-B100 amplifis.
The RACE signal is received by a ½ inch condenser microphone (B&K 4130, sensitivity 10mV/Pa) combined with 40 dB preamplifier type B&K 2642 and power supply B&K 2810 positioned at a distance of 2-3 mm above the specimen surface and attached to a 2D scanner (Isel-automation) (Figure 43). The microphone is connected to Airscope TT amplifier and 14bit A/D converter. The C-scan data acquisition system is triggered by the stepped motor encoders and is running under UT-TOFD View-E software by Dasel.
The viability of the RACE imaging system is first tested in inspection of a large CFRP specimen (480x380x7 mm3) with a set of flat-bottomed holes (FBH) of 2 cm diameter and different depths. The laser vibrometry images of the two FBH shown in Figure 44, a, b) reveal different LDR frequencies which are then used as inputs of RACE system. The RACE images clearly visualise the defects and reproduce their size and shape (Figure 44, c, d).
Figure 45 illustrates RACE imaging of an adhesive disbond in H-shaped CFRP spar aviation component (provided by IAI, Tel Aviv) consisting of a CFRP plate (250x180x2 mm3) with two flanges (250x90x4 mm3) and a CFRP rib (155x65x5 mm3) glued to the plate with adhesive (Figure 6, left). The 20x20 mm2 disbond is produced at internal spar-adhesive interface beneath the rib. Vacuum-attached transducer was attached to one of the flanges and driven at LDR frequency of 15250 Hz while a microphone scanned the critical area of the vertical plate behind the rib. The image in Figure 45, right confirms the applicability of RACE for NDT of disbonds in adhesive joints of complicated components.
The RACE cases presented are based on preliminary laser vibrometry measurements of LDR frequency which is then used for a monochromatic resonant activation of defects. Alternatively, one can also consider a different approach which does not require the knowledge of LDR frequency. For this purpose, a wideband acoustic activation by using a noise-like input voltage of a piezo-transducer can be applied instead of a sinusoidal signal at LDR frequency. Provided the acoustic bandwidth includes an LDR frequency, the defect resonance is developed and a RACE signal is generated. The noisy mode of RACE, therefore, should be applicable to simultaneous imaging of any and all defects whose LDR frequencies occur within its bandwidth.
In the experiments below, the noise input voltage for a vacuum attached piezo-transducer is produced by an arbitrary signal generator (Stanford research systems Model DS 345) and covers the range 0-20 MHz. Overall acoustic bandwidth generated by the transducer is, however, limited by its frequency response and demonstrates quite an inhomogeneous spectral distribution mainly within 100 kHz bandwidth (Figure 46).
The two examples illustrating multiple defect imaging via noisy RACE mode are shown in Figure 47 for a set of 4 circular FBH and a set of the square inserts in CFRP plate. A zoom-in picture of one of the square inserts (Figure 48) shows that the noisy RACE mode reproduces fairly well a square shape of the defect unlike a circular pattern observed at LDR frequency in monochromatic mode (Figure 47, a). This effect is concerned with excitation of the higher-order LDR modes. Unlike vibration pattern of the fundamental LDR, the higher-order resonances also support vibrations at the periphery of the defect and thus contribute to full-scale RACE defect imaging.
The excitation bandwidth of around 100 kHz used in the experiments (Figure 46) enabled to visualise the defects of even more complex shapes. Figure 49 shows the results of imaging of a Teflon ring (diameter 50 mm) embedded in a CFRP plate (thickness 2 mm). The quality of the RACE image is quite comparable with that of wideband laser vibrometry (chirp excitation 1-50 kHz).
Robotic RACE Scanning
Unlike the 2D RACE scanning of flat specimens, the use of robots combined with the methods for optometrical analysis of the surface provides fully autonomous detecting and imaging the defect area in arbitrary shape components [25]. In the experiments, the feasibility of robotic scanning is tested by using the six-axis robot IRB 120 from the supplier ABB, Switzerland. In order to use the same ultrasound recorder as for the three-axis-scanning table, the robot control unit IRC 5, ABB, Switzerland was instructed to send pulses over IO-card to emulate encoder signals for virtual y- and z-axis. To detect the RACE signal the microphone in a special holder is attached to the robot flange (Figure 50).
To avoid initial search for LDR frequency via laser vibrometry, the wideband (1-100 kHz, noisy signal) LDR excitation was applied in the robotic scanning mode. As before, the superposition of multiple LDR is known to clearly reproduce the shape of the defects. This is illustrated in Figure 51 for a set of four square (20 mm x 20 mm) Teflon sub-surface inserts positioned at different depths in a CFRP plate (5 mm x 290 mm x 330 mm). The RACE robotic imaging demonstrates a decent quality of visualization for both the positions and the shapes of the defects 24.
RACE Full-Field Imaging with Acoustic Camera
The results obtained, show that the scanning method visualizing of the defects is useful and provides reasonable RACE imaging. However, this process is rather time consuming. For example, in the robotic experiment the scanning speed was 10 mm/s and it took from 10 to 20 minutes to scan the area of the defects. This drawback is avoided in a new full-field RACE imaging method. In this approach an acoustic camera is used for instant detection of the defect [25].
The feasibility of this technique is demonstrated below using the acoustic camera SoundCam by CAE systems, Gütersloh, Germany, provided by Wölfel GmbH, Würzburg, Germany. It contains 64 MEMS-microphones, the data acquisition system with 24-bit resolution, sample rate 48 kHz with an operating frequency range 10 Hz - 24 kHz. The setup to provide full-field RACE imaging is shown in the Figure 52.
To test the acoustic camera operation, first the acoustic field of the piezo-actuator (isi-sys) was visualized first (Figure 53). As one can see from the picture, the active zone of acoustic field of the vacuum attached transducer (diameter 5 mm) is highlighted with a bright spot. This circular spot indicates the position where the sound amplitude is maximal, which matches to the real active zone of the transducer. The vacuum attached transducer was then used for the RACE excitation in a PMMA plate with two FBH (Figure 54, a). The laser vibrometry test reveals LDR frequencies for those holes (Figure 54, b, c). The acoustic camera showed similar results when these FBH are excited at their LDR frequencies. These results are illustrated in the Figure 54, d), e).
The more complicated example of full-field imaging of real defects in composite material is shown in Figure 55 for a barely visible impact defect (BVID). The BVID shown in Figure 55 a) is a result of 20 J impact in non-crimp fabric CFRP sample (150 mm x100 mm x 3 mm). The damage becomes barely visible only because of slight bleaching of the stitching yarn. The acoustic camera image in Figure 55, b) is obviously not as good as the laser vibrometry scan (Figure 55, c), however, indicates the presence and the position of the defect.
Conclusions
In the classical acoustic resonance interpretation, LDR of a planar defect, like a delamination, can be perceived as a resonance of an oscillator activated by a standing wave formation due to constructive interference of the flexural waves. The generic structure of the LDR frequency developed as a function proportional to the defect depth, reciprocal to the square of its size has been validated for various shape delaminations by using closed form calculations via classical Rayleigh’s method.
The flexural wave encounter with an out-of-plane crack is shown to be accompanied by the mode conversion to the edge wave propagating along the crack faces. The latter manifests similar dispersion behaviour to that of the low-frequency A0–mode along with characteristic slow decay as a function of the distance from the crack face. At certain frequencies, the edge waves in the crack interfere constructively and the crack also falls into the LDR with characteristic decay of the wave amplitude as a function of the distance from the edge.
3D-defects, like porous bubbles in solid materials manifest sharp resonances of breathing mode (LDR) in the high-kHz frequency range followed by a periodic series of the higher-order vibration modes. According to the analysis developed, the resonance frequencyfor the breathing mode is reciprocal to the pore radius R so that it can be assessed by the value of the parameter for a particular pore. This product is envisaged and experimentally verified to lie in the range between 0.5 and 0.72, where is the sound velocity in air.
The excitation at the LDR frequency readily moves the pore vibration to the nonlinear regime manifested by wide nonlinear spectra that contain multiple higher harmonics. The bubble nonlinearity combined with their resonance also results in efficient higher harmonic generation for excitation at subharmonics of LDR frequencies (subharmonic resonance).
The experimental methodology of laser vibrometry is successfully applied to a search of LDR and imaging of defects in a variety of composite materials. LDR with local resonance “amplification” of the vibration amplitude as high as ~ 20-40 dB are generally measured for various types of realistic defects in CFRP. A strong frequency selectivity of LDR implies an opportunity of detecting a certain defect among a multitude of other defects. The ultrasonic excitation at LDR frequencies generally enables to visualize only a part of the defect while a wideband excitation which covers a number of the higher-order LDR visualizes clearly a total shape of the defect.
An activation of LDR enables to route the input acoustic energy directly to the defect that dramatically increases its vibration amplitude and shifts into nonlinear regime. Nonlinear acoustics is a promising NDT technology for diagnostics of damage based on the wave frequency conversion (e.g. generation of higher harmonics, mixing frequencies, etc.). Such “classical” nonlinear modes correspond to nonlinear terms in non-Hookian equation of state of the material. They use the excitation at the fundamental LDR frequency while the nonlinear images usually demonstrate a higher contrast than the fundamental LDR image.
The concept of LDR combined with the defect nonlinearity identifies it as a nonlinear oscillator and results in qualitatively new “non-classical” features characteristic of nonlinear (combination frequency, subharmonic) and parametric resonances.
A low ultrasound-heat conversion is a major shortcoming of NDT thermosonic techniques which is usually taken for granted without an effort to be optimized. According to the analysis presented, it is a quadratic function of LDR amplification factor that enables to increase the acousto-thermal efficiency by orders of magnitude. As a result, the case studies of LDR thermosonics for simulated and realistic defects (delaminations, impacts, cracks) confirm the feasibility of high contrast imaging in the mW-power range. Further enhancement of sensitivity and SNR of thermosonic images is achieved by using LDR in the lock-in image mode. This enables to proceed to remote thermosonic imaging by using an ACU excitation of defects.
A local standing wave vibration developed in the defect area via LDR has been also shown to result in the resonant air-coupled emission (RACE) emanating from this area in ambient air. The resonant rise in radiation efficiency enables to reduce an input signal in contact excitation mode and opens an opportunity for remote activation-reception of airborne radiation.
A different experimental approach which does not require preliminary knowledge of LDR frequency is based on a wideband acoustic activation by using a noise-like input signal. Provided the excitation bandwidth includes an LDR frequency the defect resonance is developed and a RACE signal is generated. The noisy mode of RACE is applicable to simultaneous imaging of any and all defects whose LDR frequencies occur within the bandwidth of acoustic excitation.
The case studies confirmed RACE applicability to imaging of serious defects in composites (including BVID) with modest restrictions on the microphone distance from the defect.
Unlike 2D-RACE scanning of flat specimens, the use of industrial robots provides fully autonomous detecting and imaging of the defects in complicated shape components. The robotic RACE scanning combined with wideband noisy excitation proves the feasibility of simultaneous imaging of multiple defects without prior search for LDR frequencies.
A new full-field RACE imaging method with an array of microphones as a receiver avoids the drawback of time-consuming scanning modes and is used for detection and imaging of defects. The case studies of the full-field RACE mode with acoustic camera array validate imaging of various defects in composites. The RACE approach simplifies integration of the proposed NDT imaging system which includes only inexpensive fully acoustic instrumental components.
References
- Minnaert, M. On musical air-bubbles and the sounds of running water. Lond. Edinb. Dublin Philos. Mag. J. Sci. 1933, 16, 235–248. [Google Scholar] [CrossRef]
- Devaud, M.; Hocqet, T.; Bacri, J.-C.; Leroy, V. The Minnaert bubble: an acoustic approach. Eur. J. Phys. 2008, 29, 1263–1285. [Google Scholar] [CrossRef]
- Solodov, I.; Bai, J.; Bekgulyan, S.; Busse, G. A local defect resonance to enhance acoustic wave defect interaction in ultrasonic nondestructive testing. Appl. Phys. Lett. 2011, 99, 211911. [Google Scholar] [CrossRef]
- Solodov, I.; Bai, J.; Busse, G. Resonant ultrasound spectroscopy of defects: Case study of flat-bottomed holes. J. Appl. Phys. 2013, 113, 223512. [Google Scholar] [CrossRef]
- Solodov, I. Resonant acoustic nonlinearity of defects for highly-efficient nonlinear NDE. J. Nondestruct. Eval. 2014, 33, 252–262. [Google Scholar] [CrossRef]
- Hettler, J.; Tabatabaeipour, M.; Delrue, S.; Abeele, K.V.D. Detection and characterization of local defect resonances arising from delaminations and flat bottom holes. J. Nondestruct. Eval. 2017, 36. [Google Scholar] [CrossRef]
- Rahammer, M.; Kreutzbruck, M. Fourier-transform vibrothermography with frequency sweep excitation utilizing local defect resonances. NDT E Int. 2017, 86, 83–88. [Google Scholar] [CrossRef]
- Pieczonka, L.; Zietek, L.; Klepka, A.; Staszewski, W.J.; Aymerich, F.; Uhl, T. Damage imaging in composites using nonlinear vibro-acoustic wave modulations. Struct. Control Health Monit. 2018, 25, e2063. [Google Scholar] [CrossRef]
- Segers, J.; Kersemans, M.; Hedayatrasa, S.; Tellez, J.A.C.; Paepegem, W.V. Towards in-plane local defect resonance for non-destructive testing of polymers and composites. NDT E Int. 2018, 98, 130–133. [Google Scholar] [CrossRef]
- Rahammer, M.; Joas, S.; Kreutzbruck, M. The local defect resonance of elliptically shaped defects. Proc.12th ECNDT, Gothenburg, Sweden, 2018.
- Timoshenko, S.P. Vibration problems in engineering, D. Van Nostrand Company, 4th Ed.; 1956.
- Solodov, I.; Rahammer, M.; Kreutzbruck, M. Analytical evaluation of resonance frequencies for planar defects: Effect of a defect shape. NDT E Int. 2019, 102, 274–280. [Google Scholar] [CrossRef]
- Solodov, I.; Kreutzbruck, M. Local defect resonance of a through-thickness crack. Ultrasonics 2022, 118, 106565. [Google Scholar] [CrossRef] [PubMed]
- Norris, A.N. Flexural edge waves. J. Sound Vib. 1994, 171, 571–573. [Google Scholar] [CrossRef]
- Solodov, I. Nonlinear Acoustic Response of Damage Applied for Diagnostic Imaging, In Nonlinear Ultrasonic and Vibro-Acoustical Techniques for Nondestructive Evaluation; ASA Press, 2019; pp. 301–343.
- Park, S.-J.; Seo, M.-K. Composite Characterization. In Interface Science and Composites; Elsevier: Amsterdam, The Netherlands, 2011; pp. 631–738. ISBN 9780123750495. [Google Scholar]
- Littner, L.; Solodov, I.; Kreutzbruck, M. Local defect resonance and nonlinearity of porosity air bubbles in solids. Ultrasonics 2024, 107373. [Google Scholar] [CrossRef] [PubMed]
- Isakovich, M.A. Obschaya akustika [General acoustics], Nauka Publ. 1973. [Google Scholar]
- Mignogna, R.B.; Green, R.E., Jr.; Duke, J.C.; E. G.; Reifsnider, K.L. Thermographic investigation of high-power ultrasonic heating in materials. Ultrasonics 1981, 19, 159–163. [Google Scholar] [CrossRef]
- Solodov, I.; Rahammer, M.; Derusova, D.; Busse, G. Highly-efficient and noncontact vibro-thermography via local defect resonance. QIRT J. 2015, 12, 98–111. [Google Scholar] [CrossRef]
- L.D. Landau LD, E.M. Lifshitz , Theory of elasticity. Pergamon Press; 1959.
- Rantala, J.; Wu, D.; Busse, G. Amplitude-modulated lock-in vibrothermography for NDE of polymers and composites. Res. Nondestr. Eval. 1996, 7, 215–228. [Google Scholar] [CrossRef]
- Solodov, I.; Dillenz, A.; Kreutzbruck, M. A new mode via resonant air-coupled emission. J. Appl. Phys. 2017, 121. [Google Scholar] [CrossRef]
- Solodov, I.; Döring, D.; Busse, G. Air-coupled laser vibrometry: analysis and applications. Appl. Opt. 2009, 48, 33–C37. [Google Scholar] [CrossRef] [PubMed]
- Bernhardt, Y.; Solodov, D.; Müller; Kreutzbruck, M. Listening for airborne sound of damage: A new mode of diagnostic imaging. Front. Built Environ. 2020, 6, 66. [Google Scholar] [CrossRef]
Figure 1.
Annual citing of LDR topic.
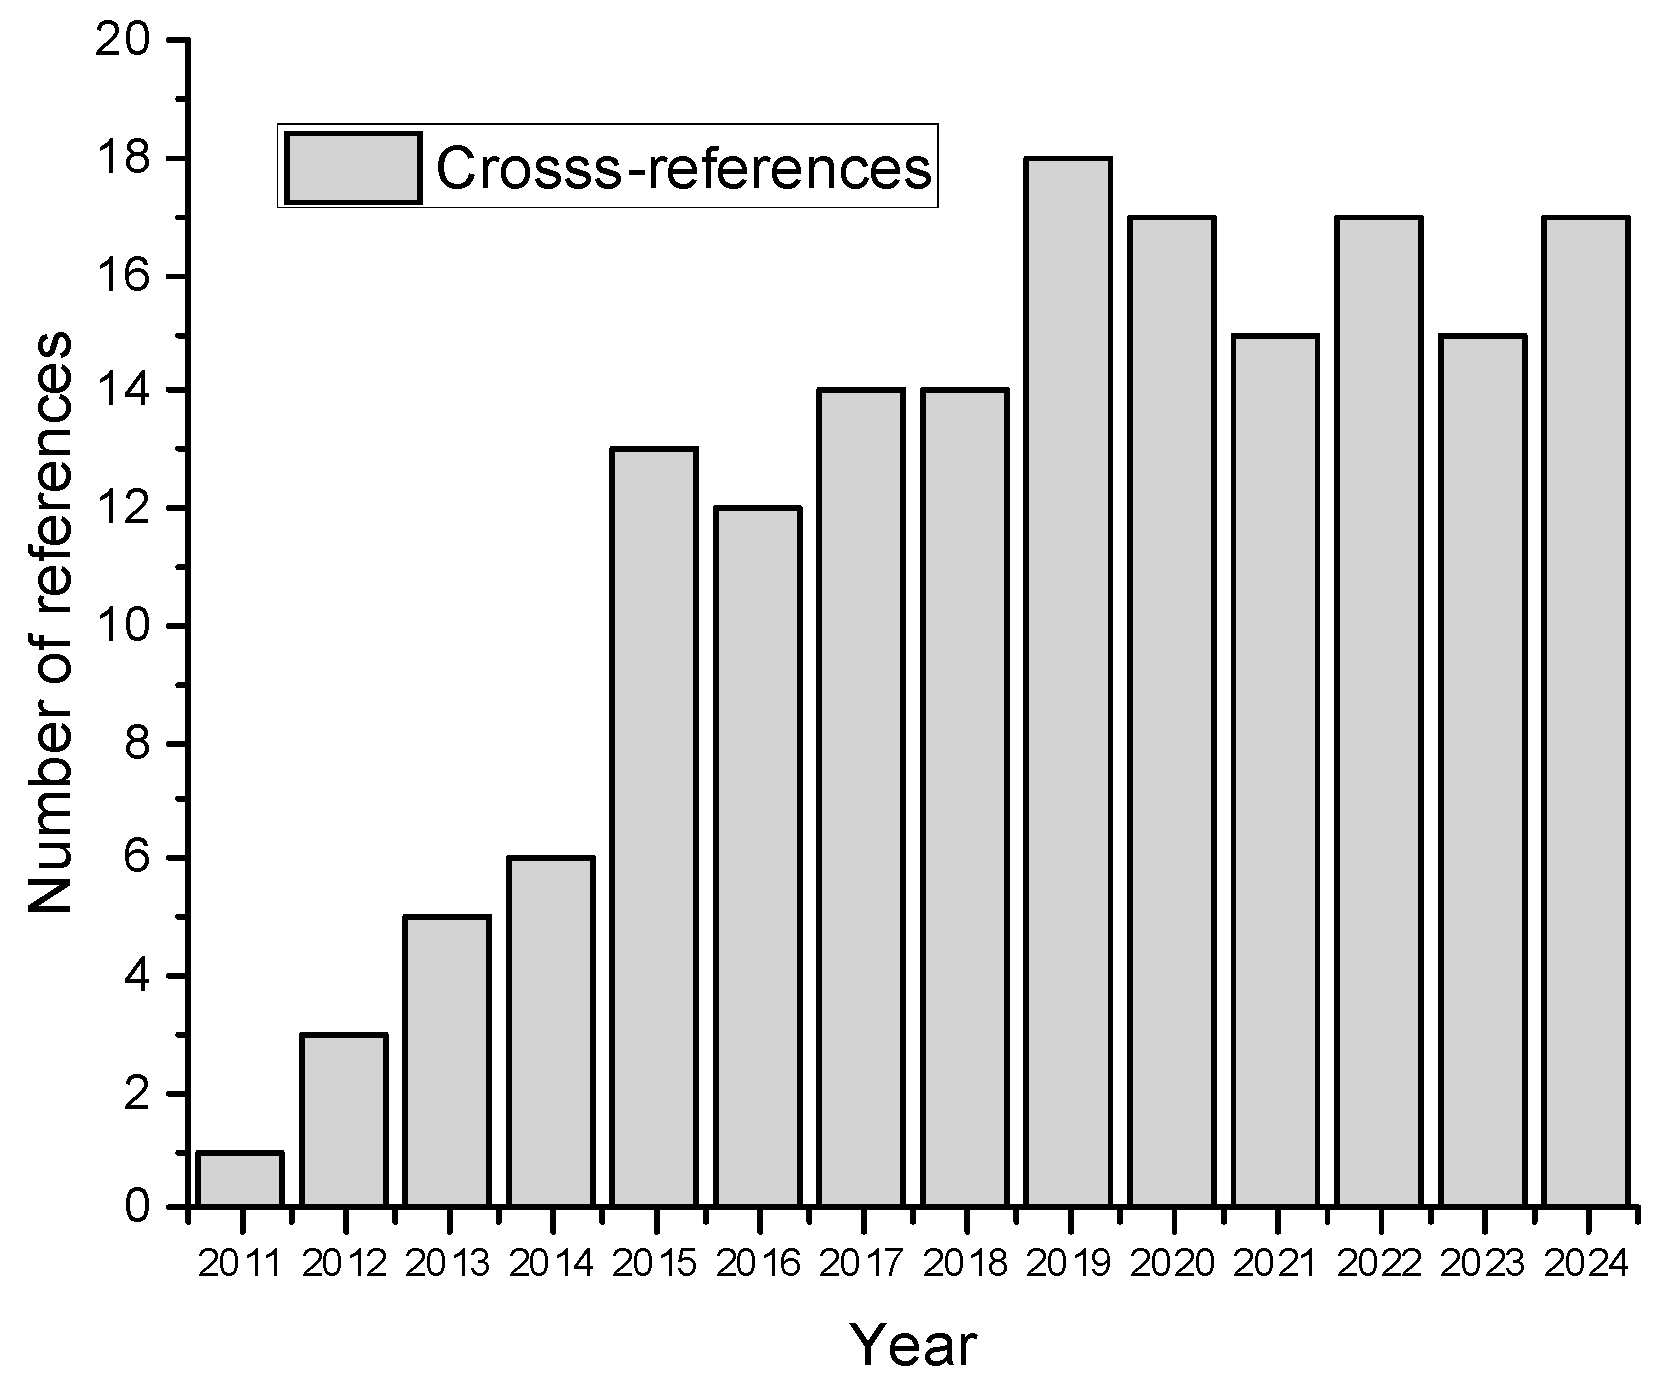
Figure 2.
FEM mesh (a) and fundamental LDR vibration pattern at f0 = 8255 Hz (b) for 2x2 cm2 square FBH in a PMMA plate; A fundamental LDR (10.4 kHz) (c) and higher-order LDR (23.25 kHz) (d) for a circular FBH (radius 1 cm, depth 2 mm) in a PMMA plate (thickness 3 mm).
Figure 2.
FEM mesh (a) and fundamental LDR vibration pattern at f0 = 8255 Hz (b) for 2x2 cm2 square FBH in a PMMA plate; A fundamental LDR (10.4 kHz) (c) and higher-order LDR (23.25 kHz) (d) for a circular FBH (radius 1 cm, depth 2 mm) in a PMMA plate (thickness 3 mm).
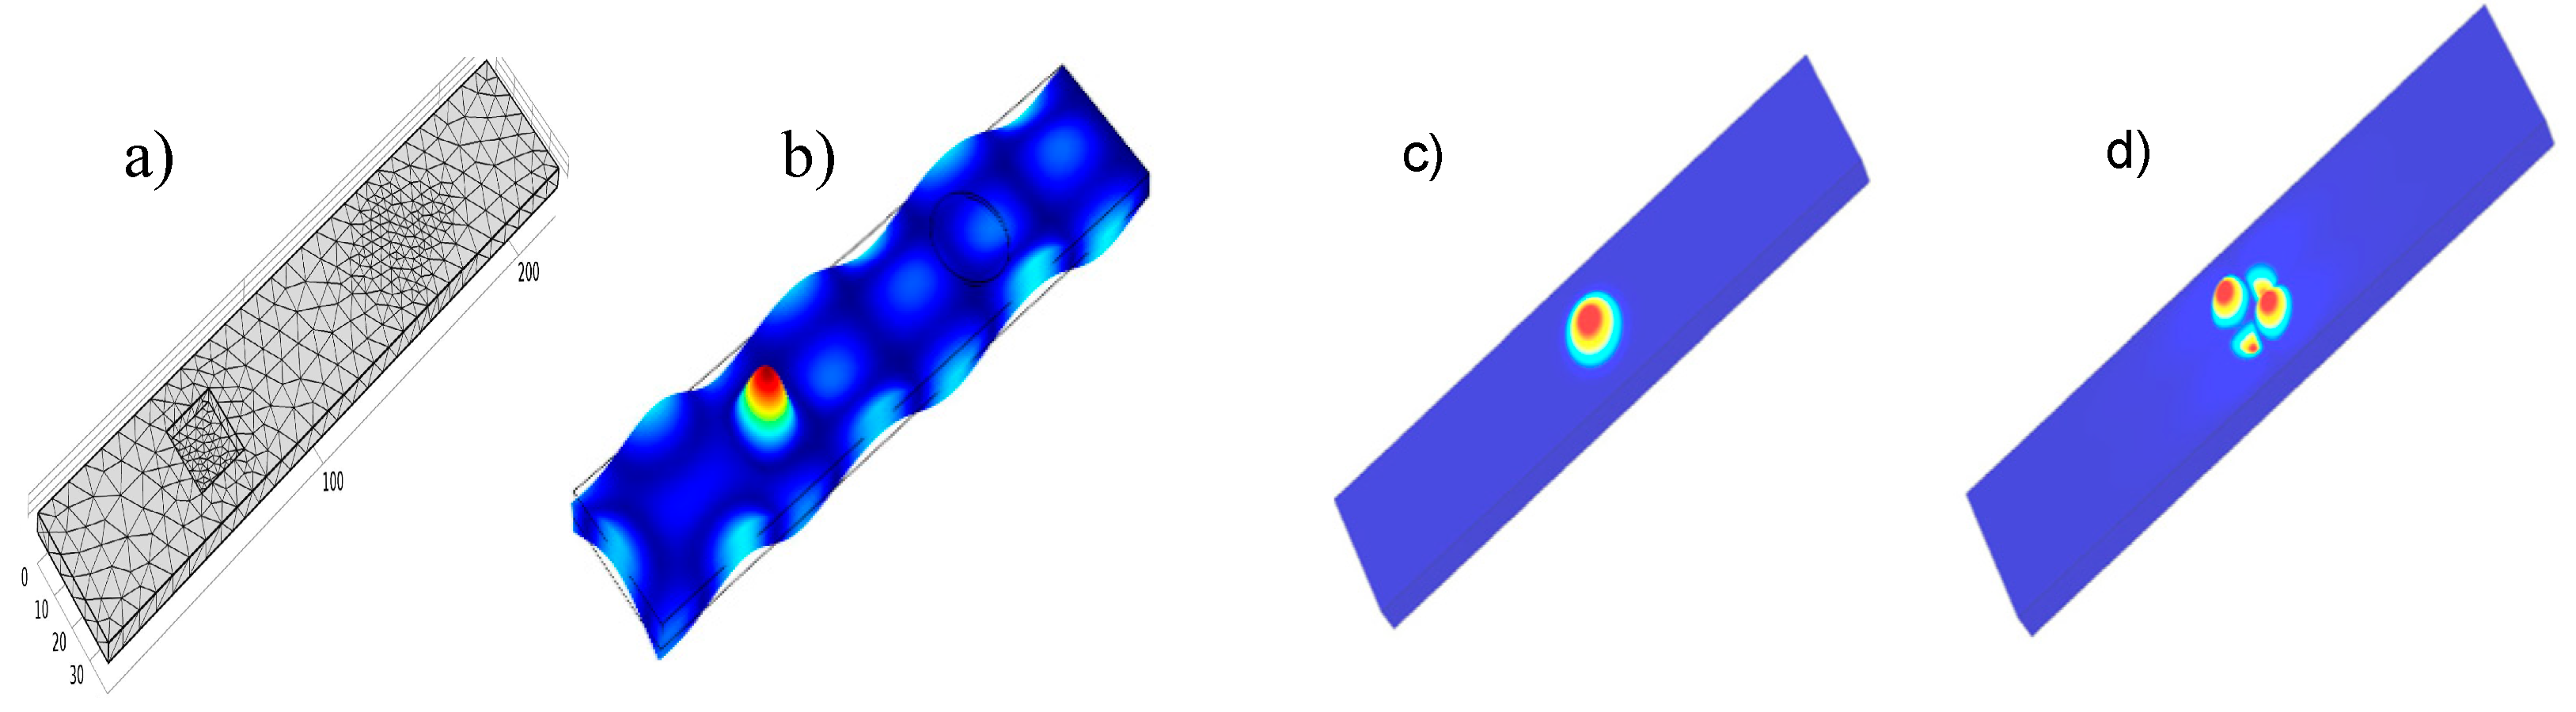
Figure 3.
Layout of rectangular delamination.
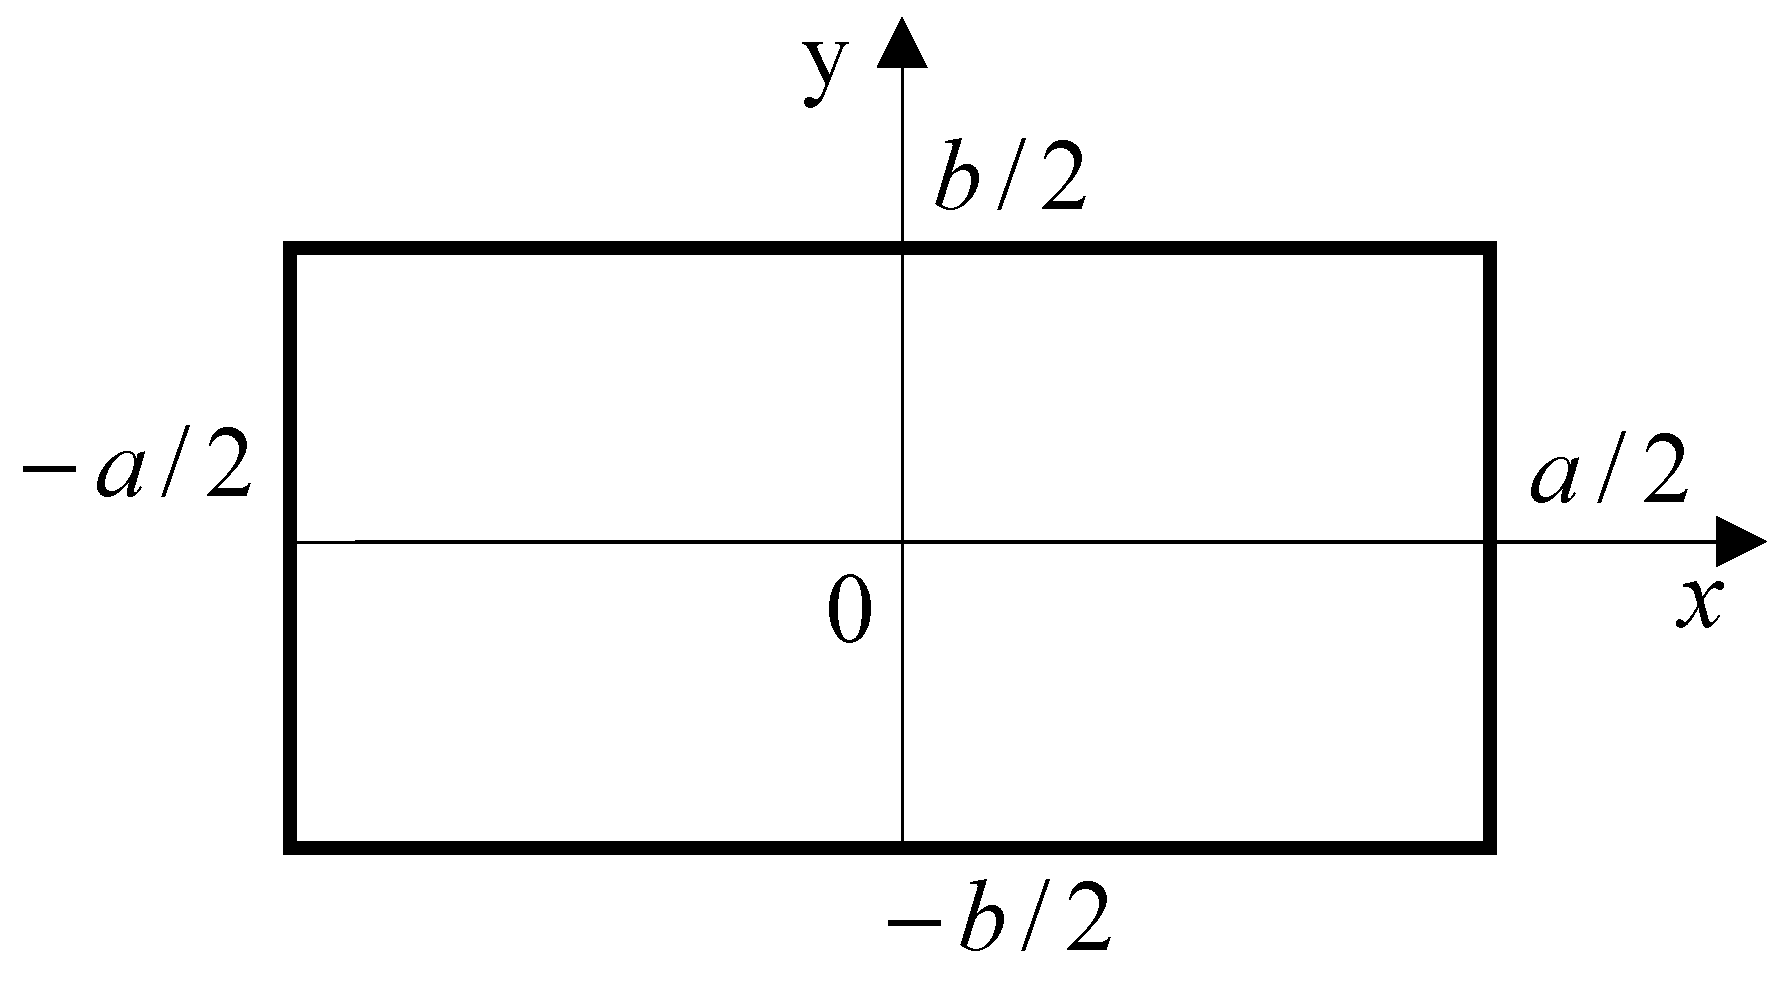
Figure 4.
Layout of elliptical delamination.
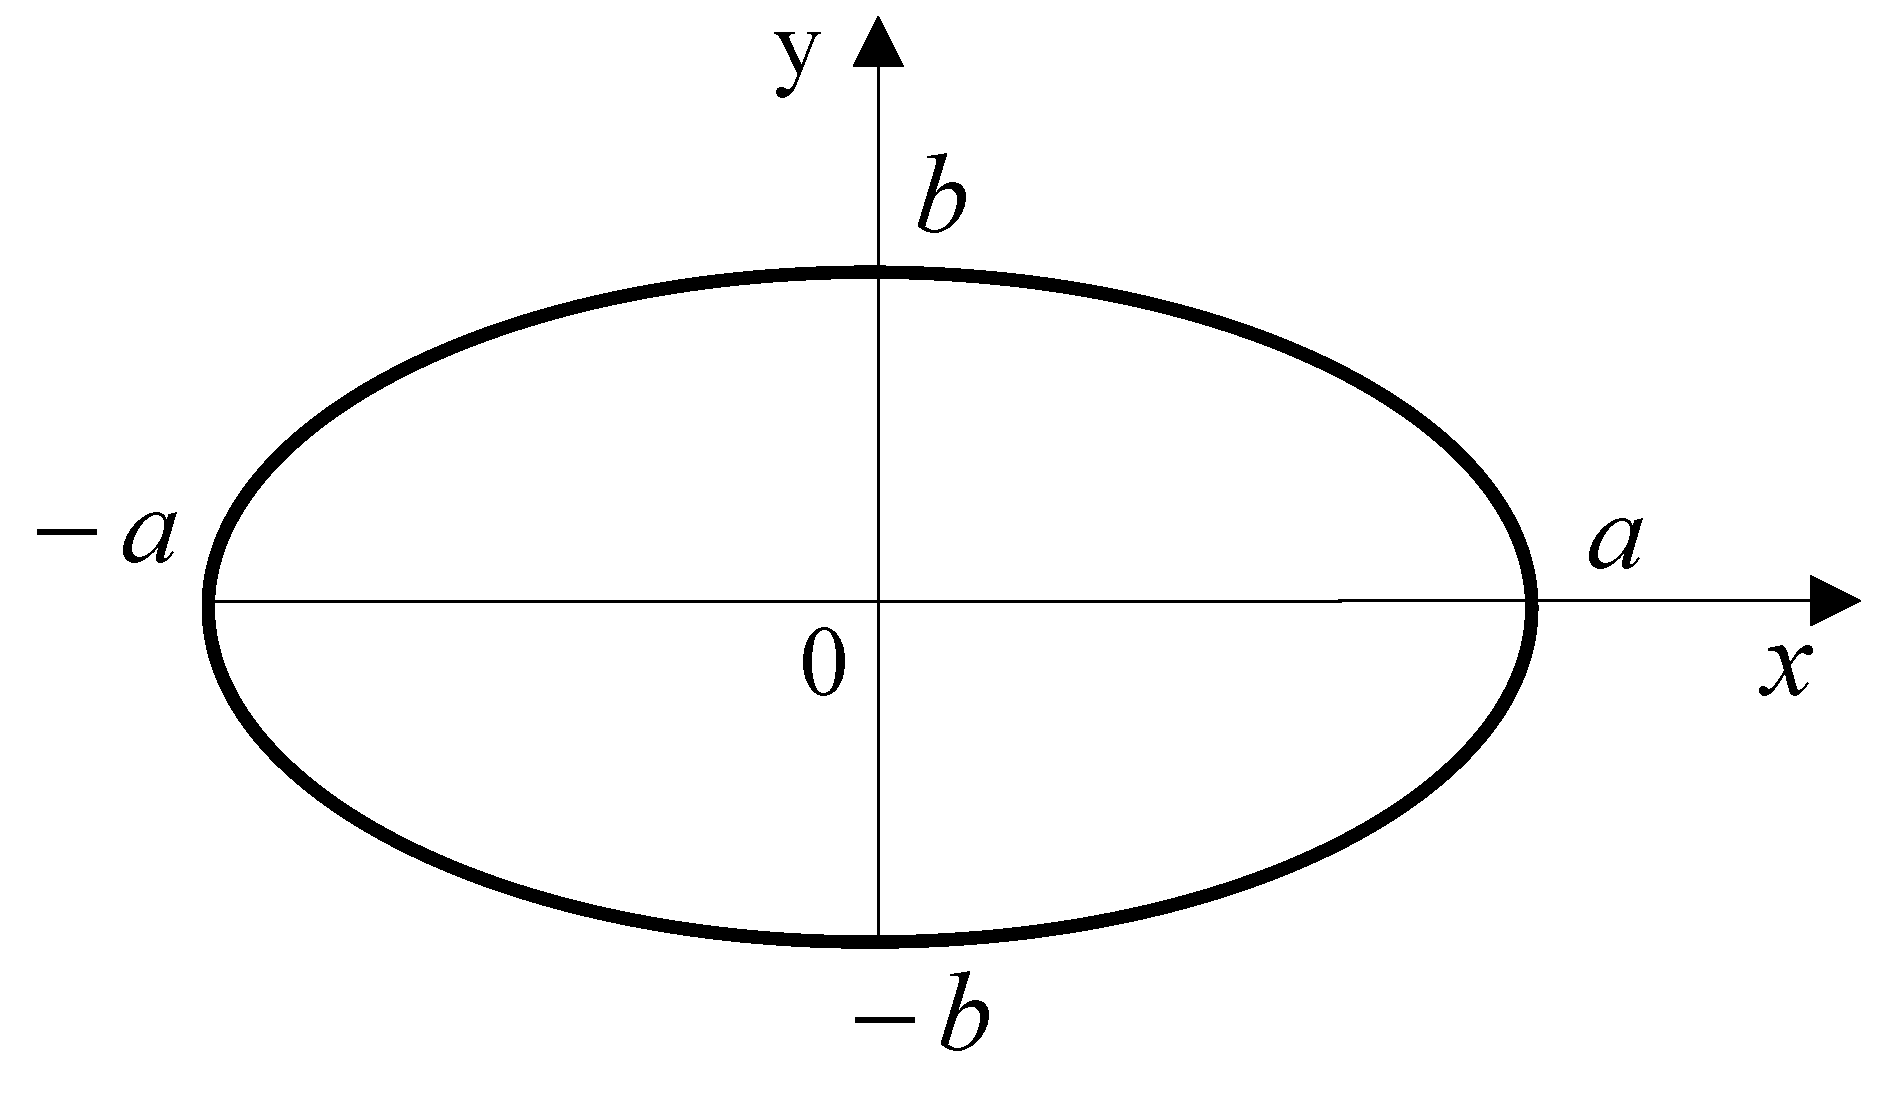
Figure 5.
LDR frequency response (b), vibration pattern at f0=14625 Hz (c) for rectangular FBH in PMMA (a).
Figure 5.
LDR frequency response (b), vibration pattern at f0=14625 Hz (c) for rectangular FBH in PMMA (a).
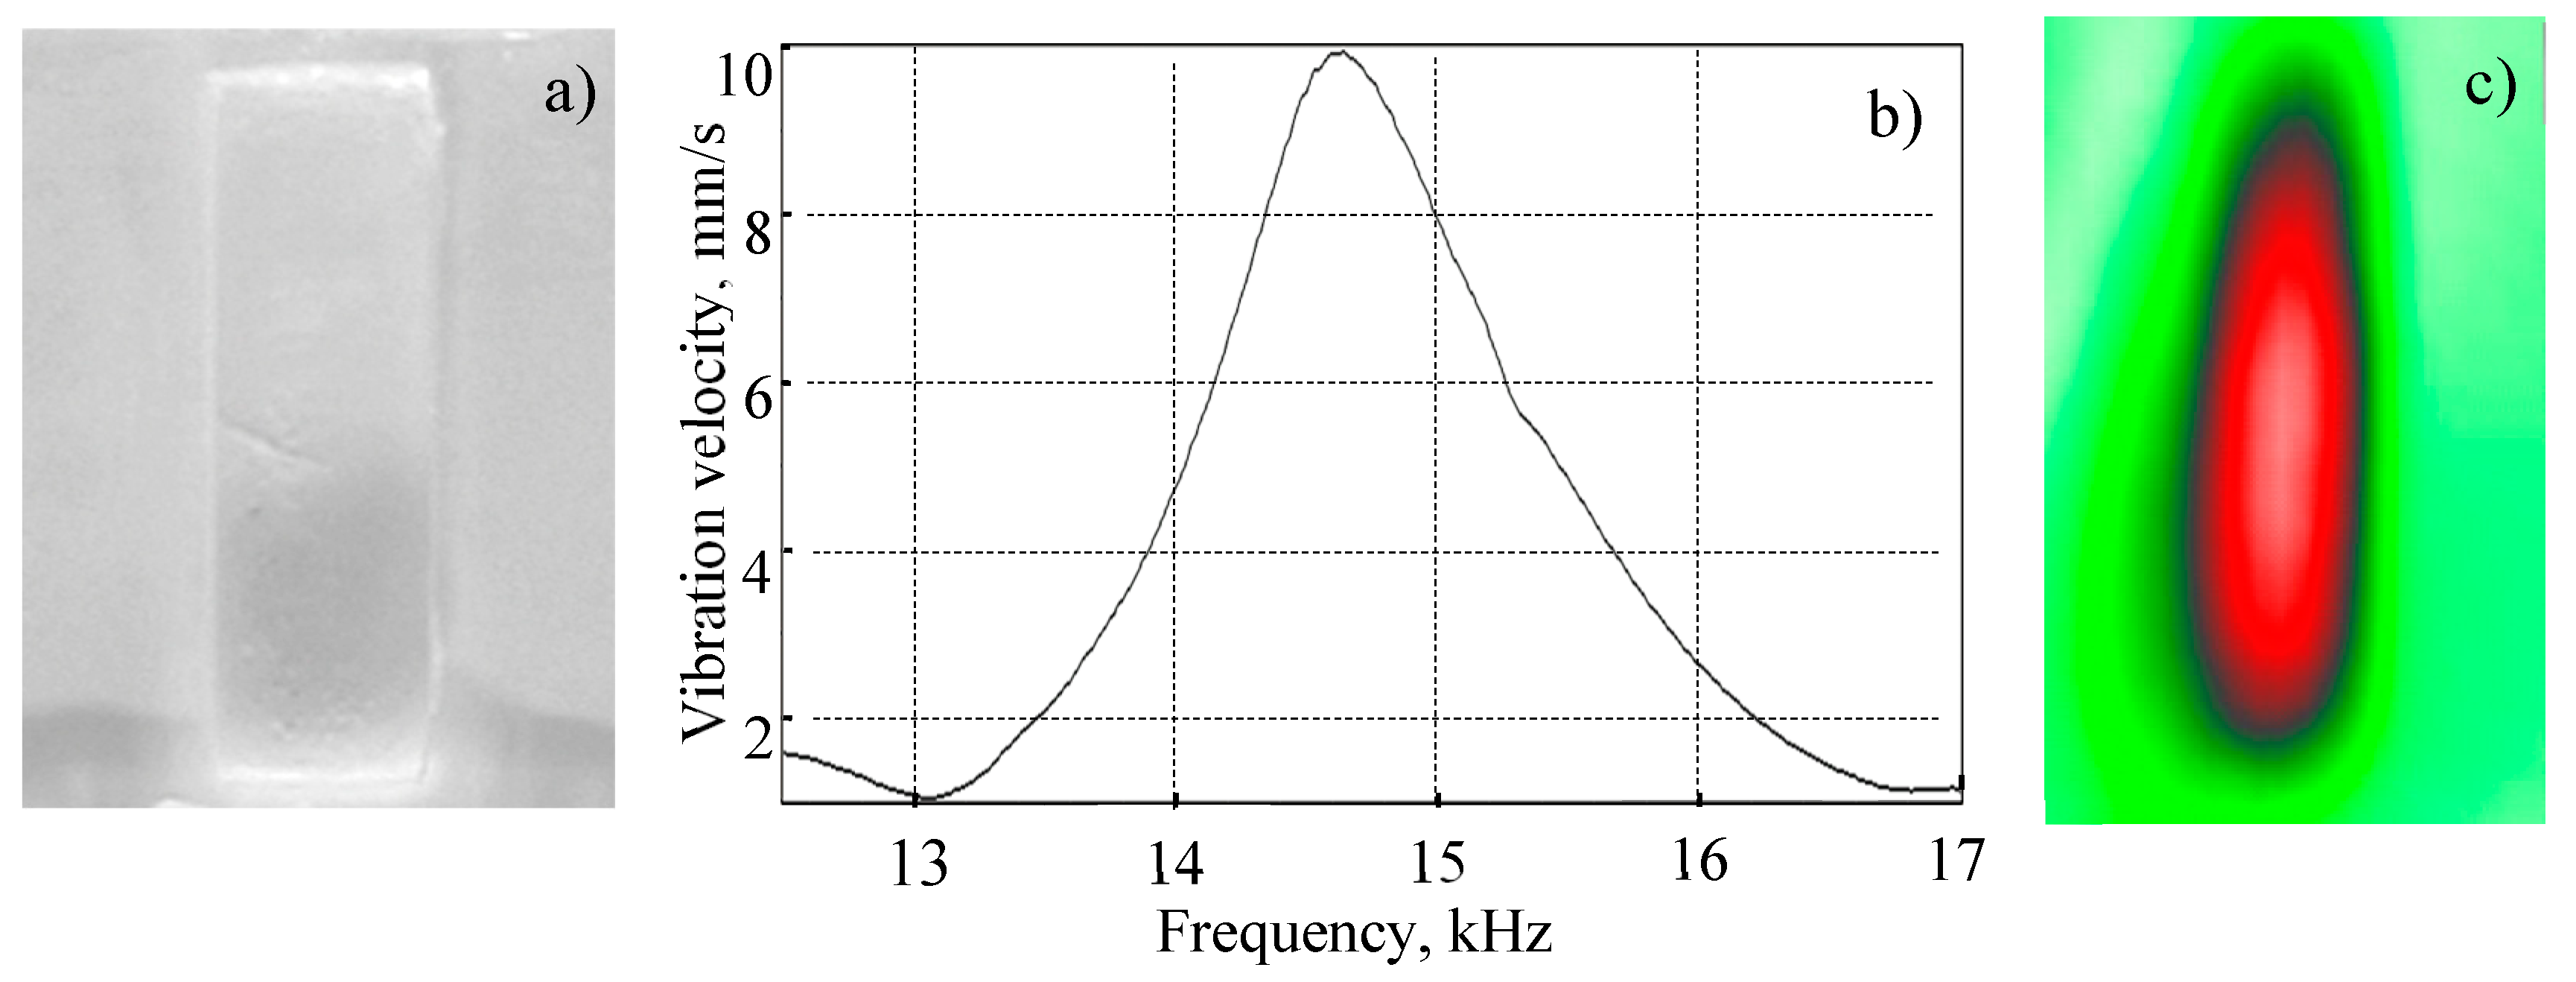
Figure 6.
LDR frequency response (b), vibration pattern at f0=16000 Hz (c) for a square FBH in PMMA PPMMAPMMA (a).
Figure 6.
LDR frequency response (b), vibration pattern at f0=16000 Hz (c) for a square FBH in PMMA PPMMAPMMA (a).
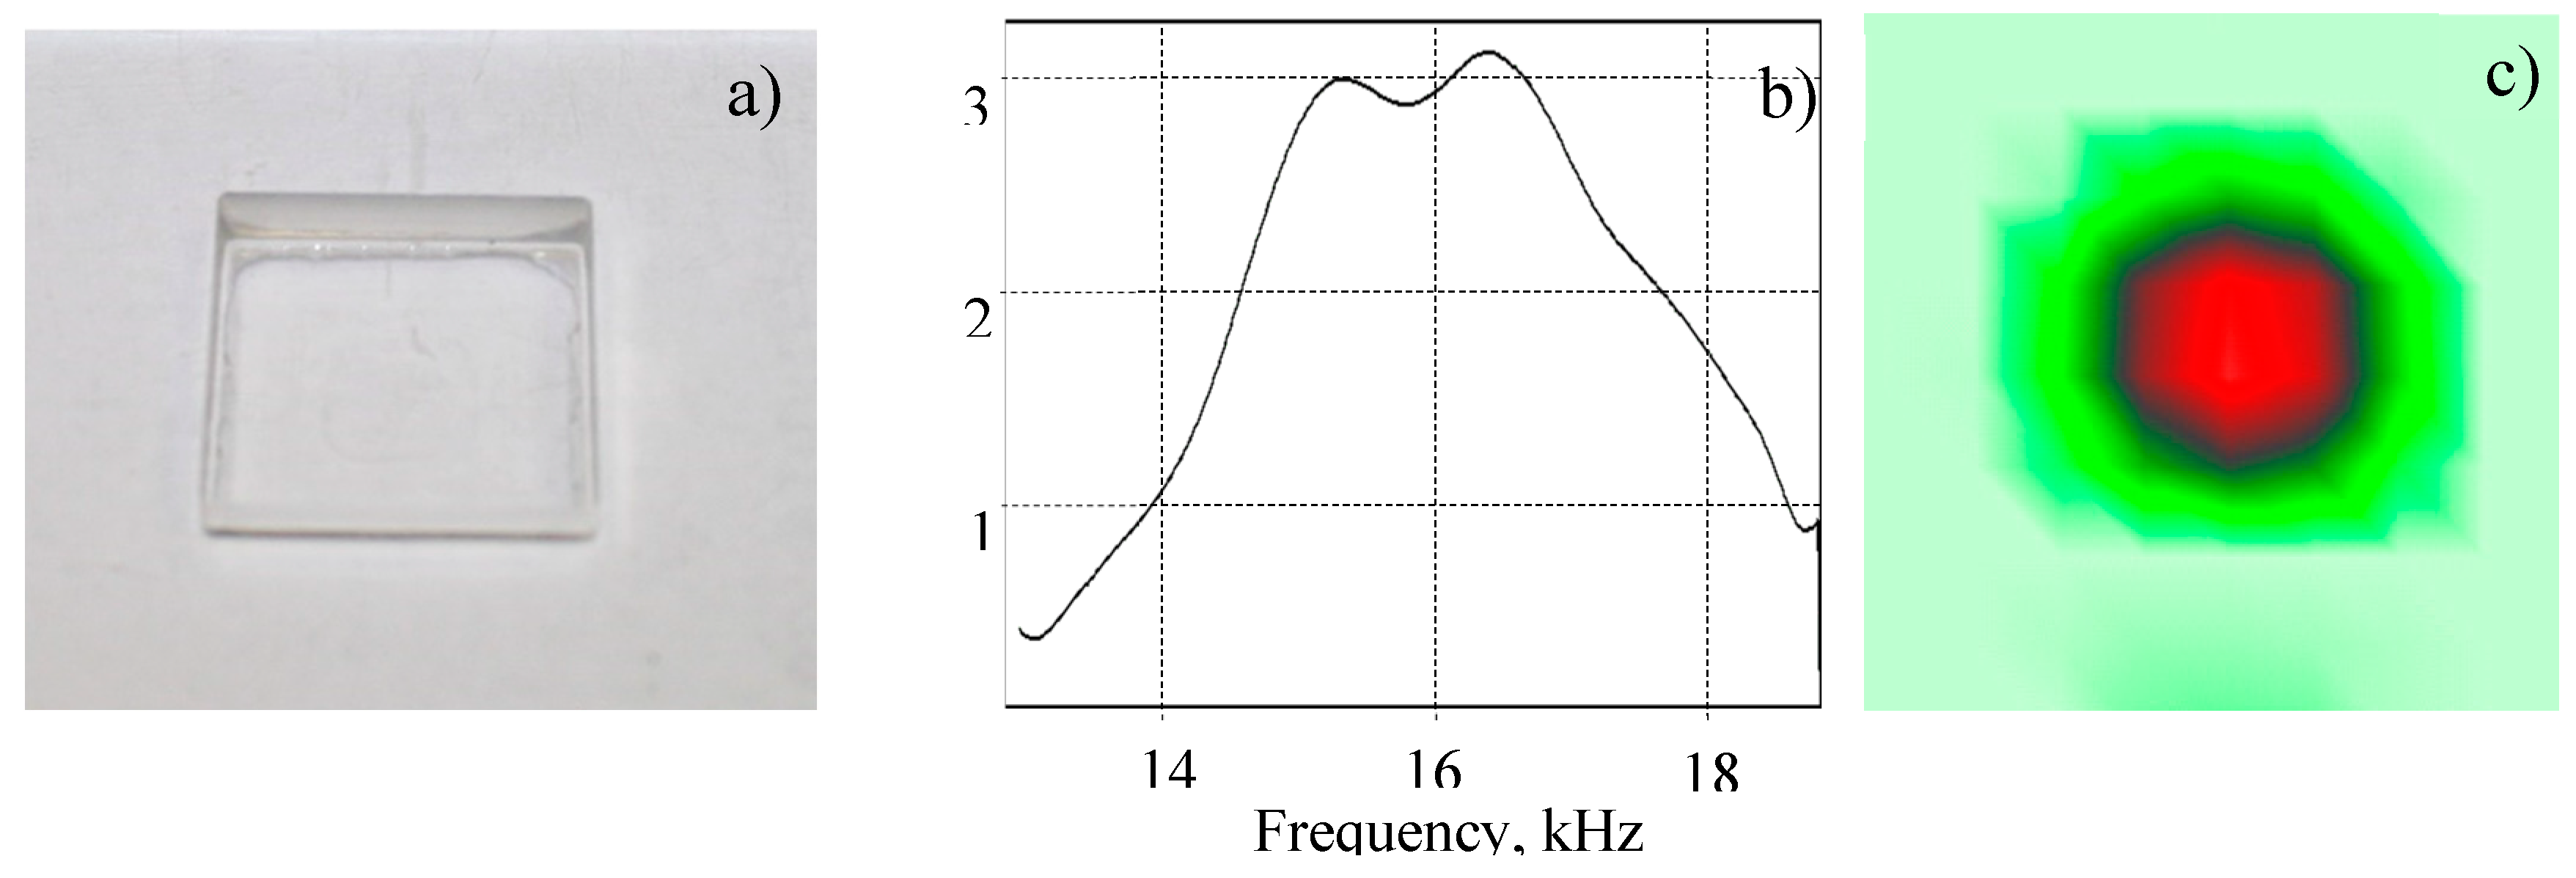
Figure 7.
Notch FBH (a): LDR frequency response (b) and LDR vibration image at f0 = 91000 Hz (c).
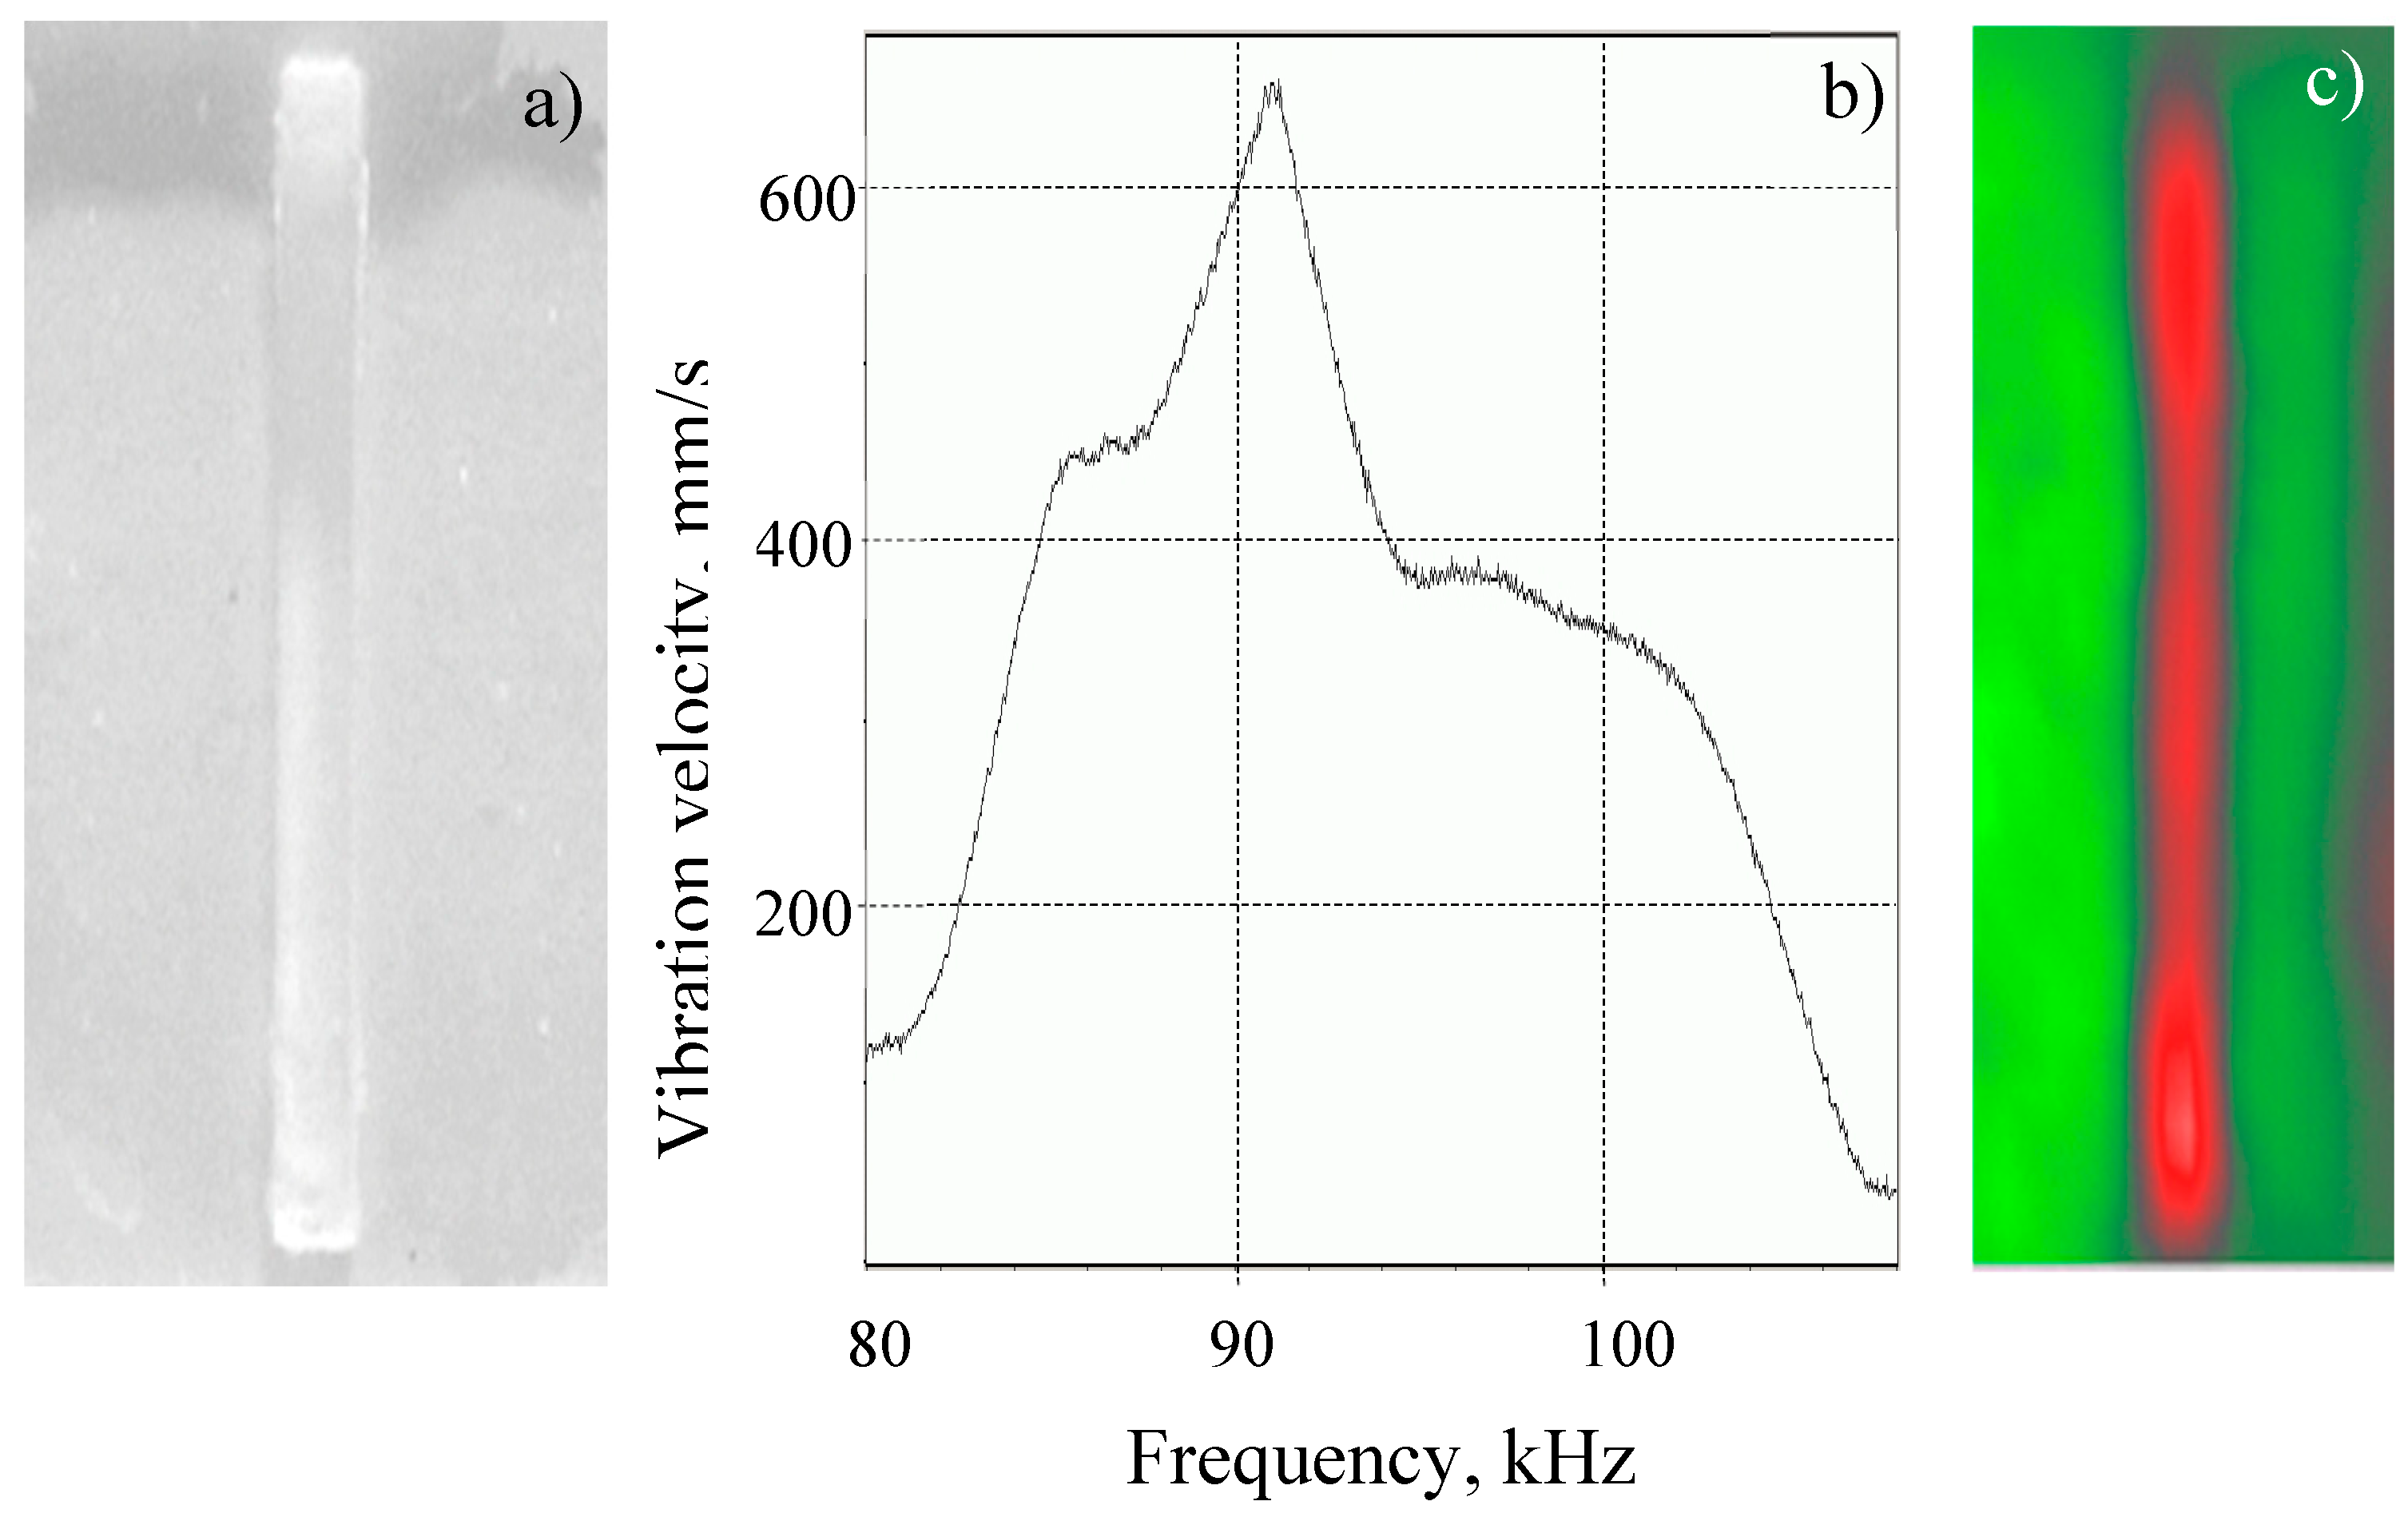
Figure 8.
Vibration images for various modes of LDR excitation in the set of elliptical FBH: Wideband (a), separate fundamental LDR frequencies (b), and higher-order mode excitation for 4 elliptical FBH (c).
Figure 8.
Vibration images for various modes of LDR excitation in the set of elliptical FBH: Wideband (a), separate fundamental LDR frequencies (b), and higher-order mode excitation for 4 elliptical FBH (c).
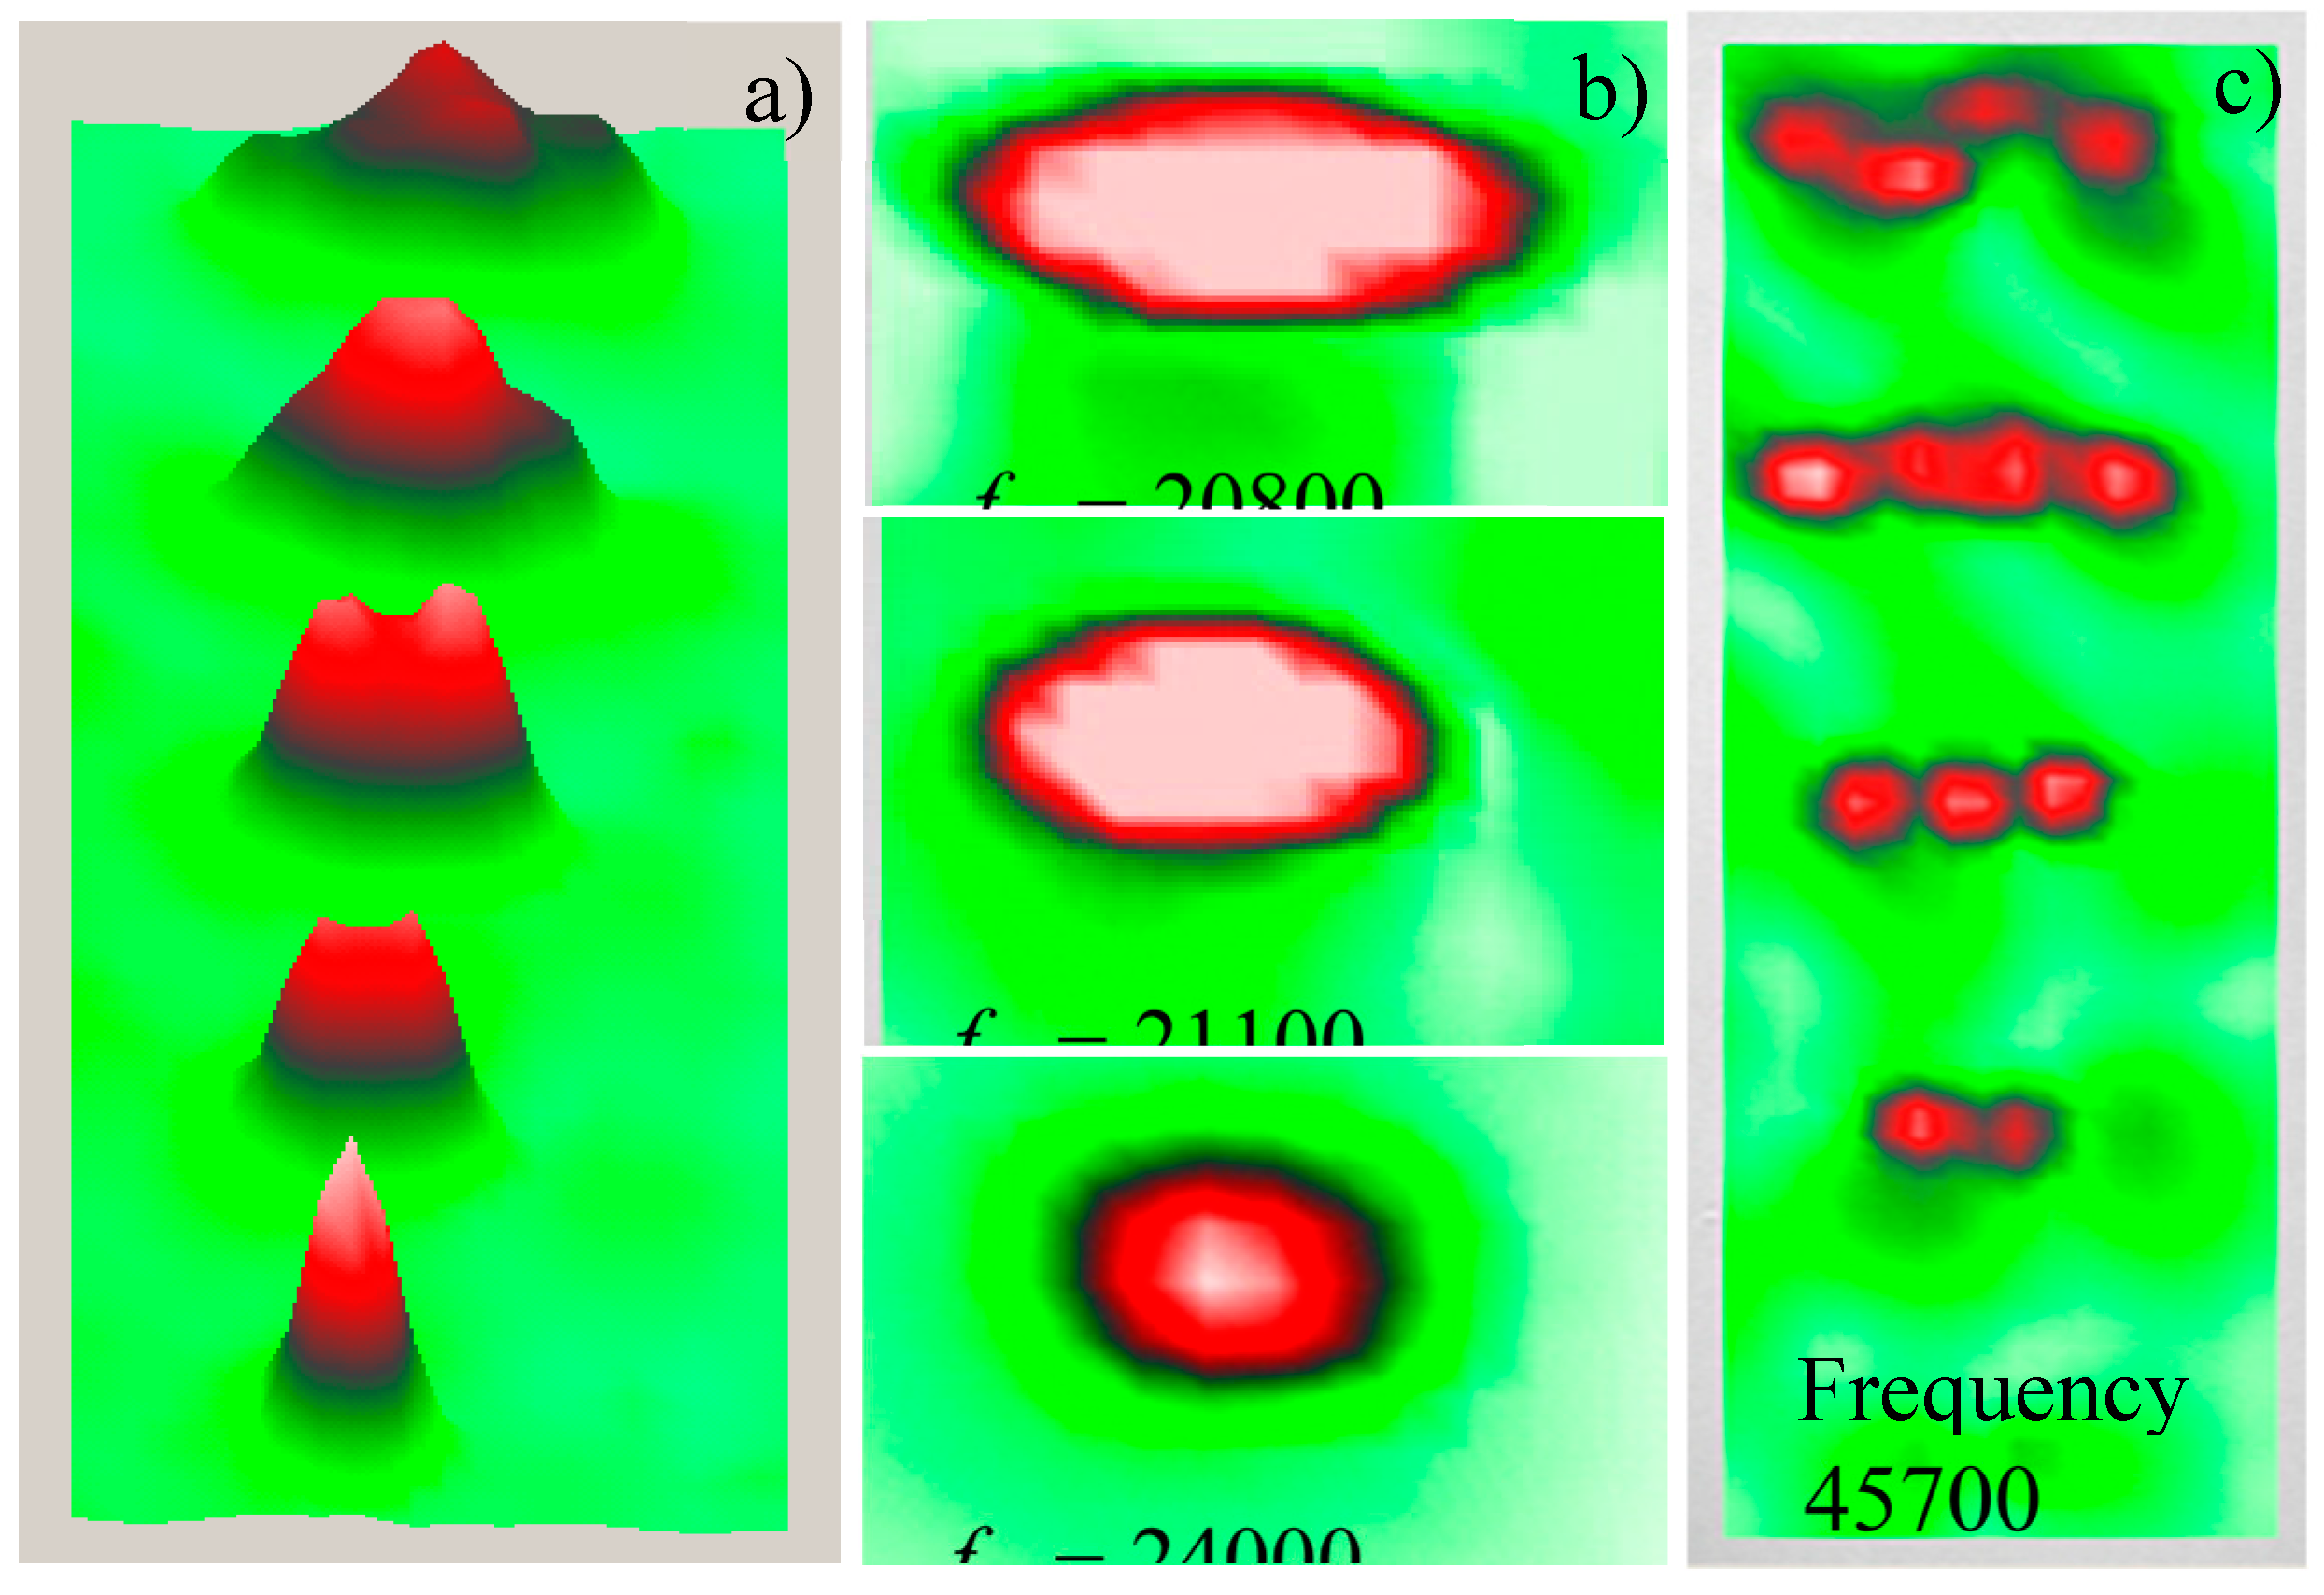
Figure 9.
Measured LDR frequencies of elliptical FBH vs the values calculated from (15).
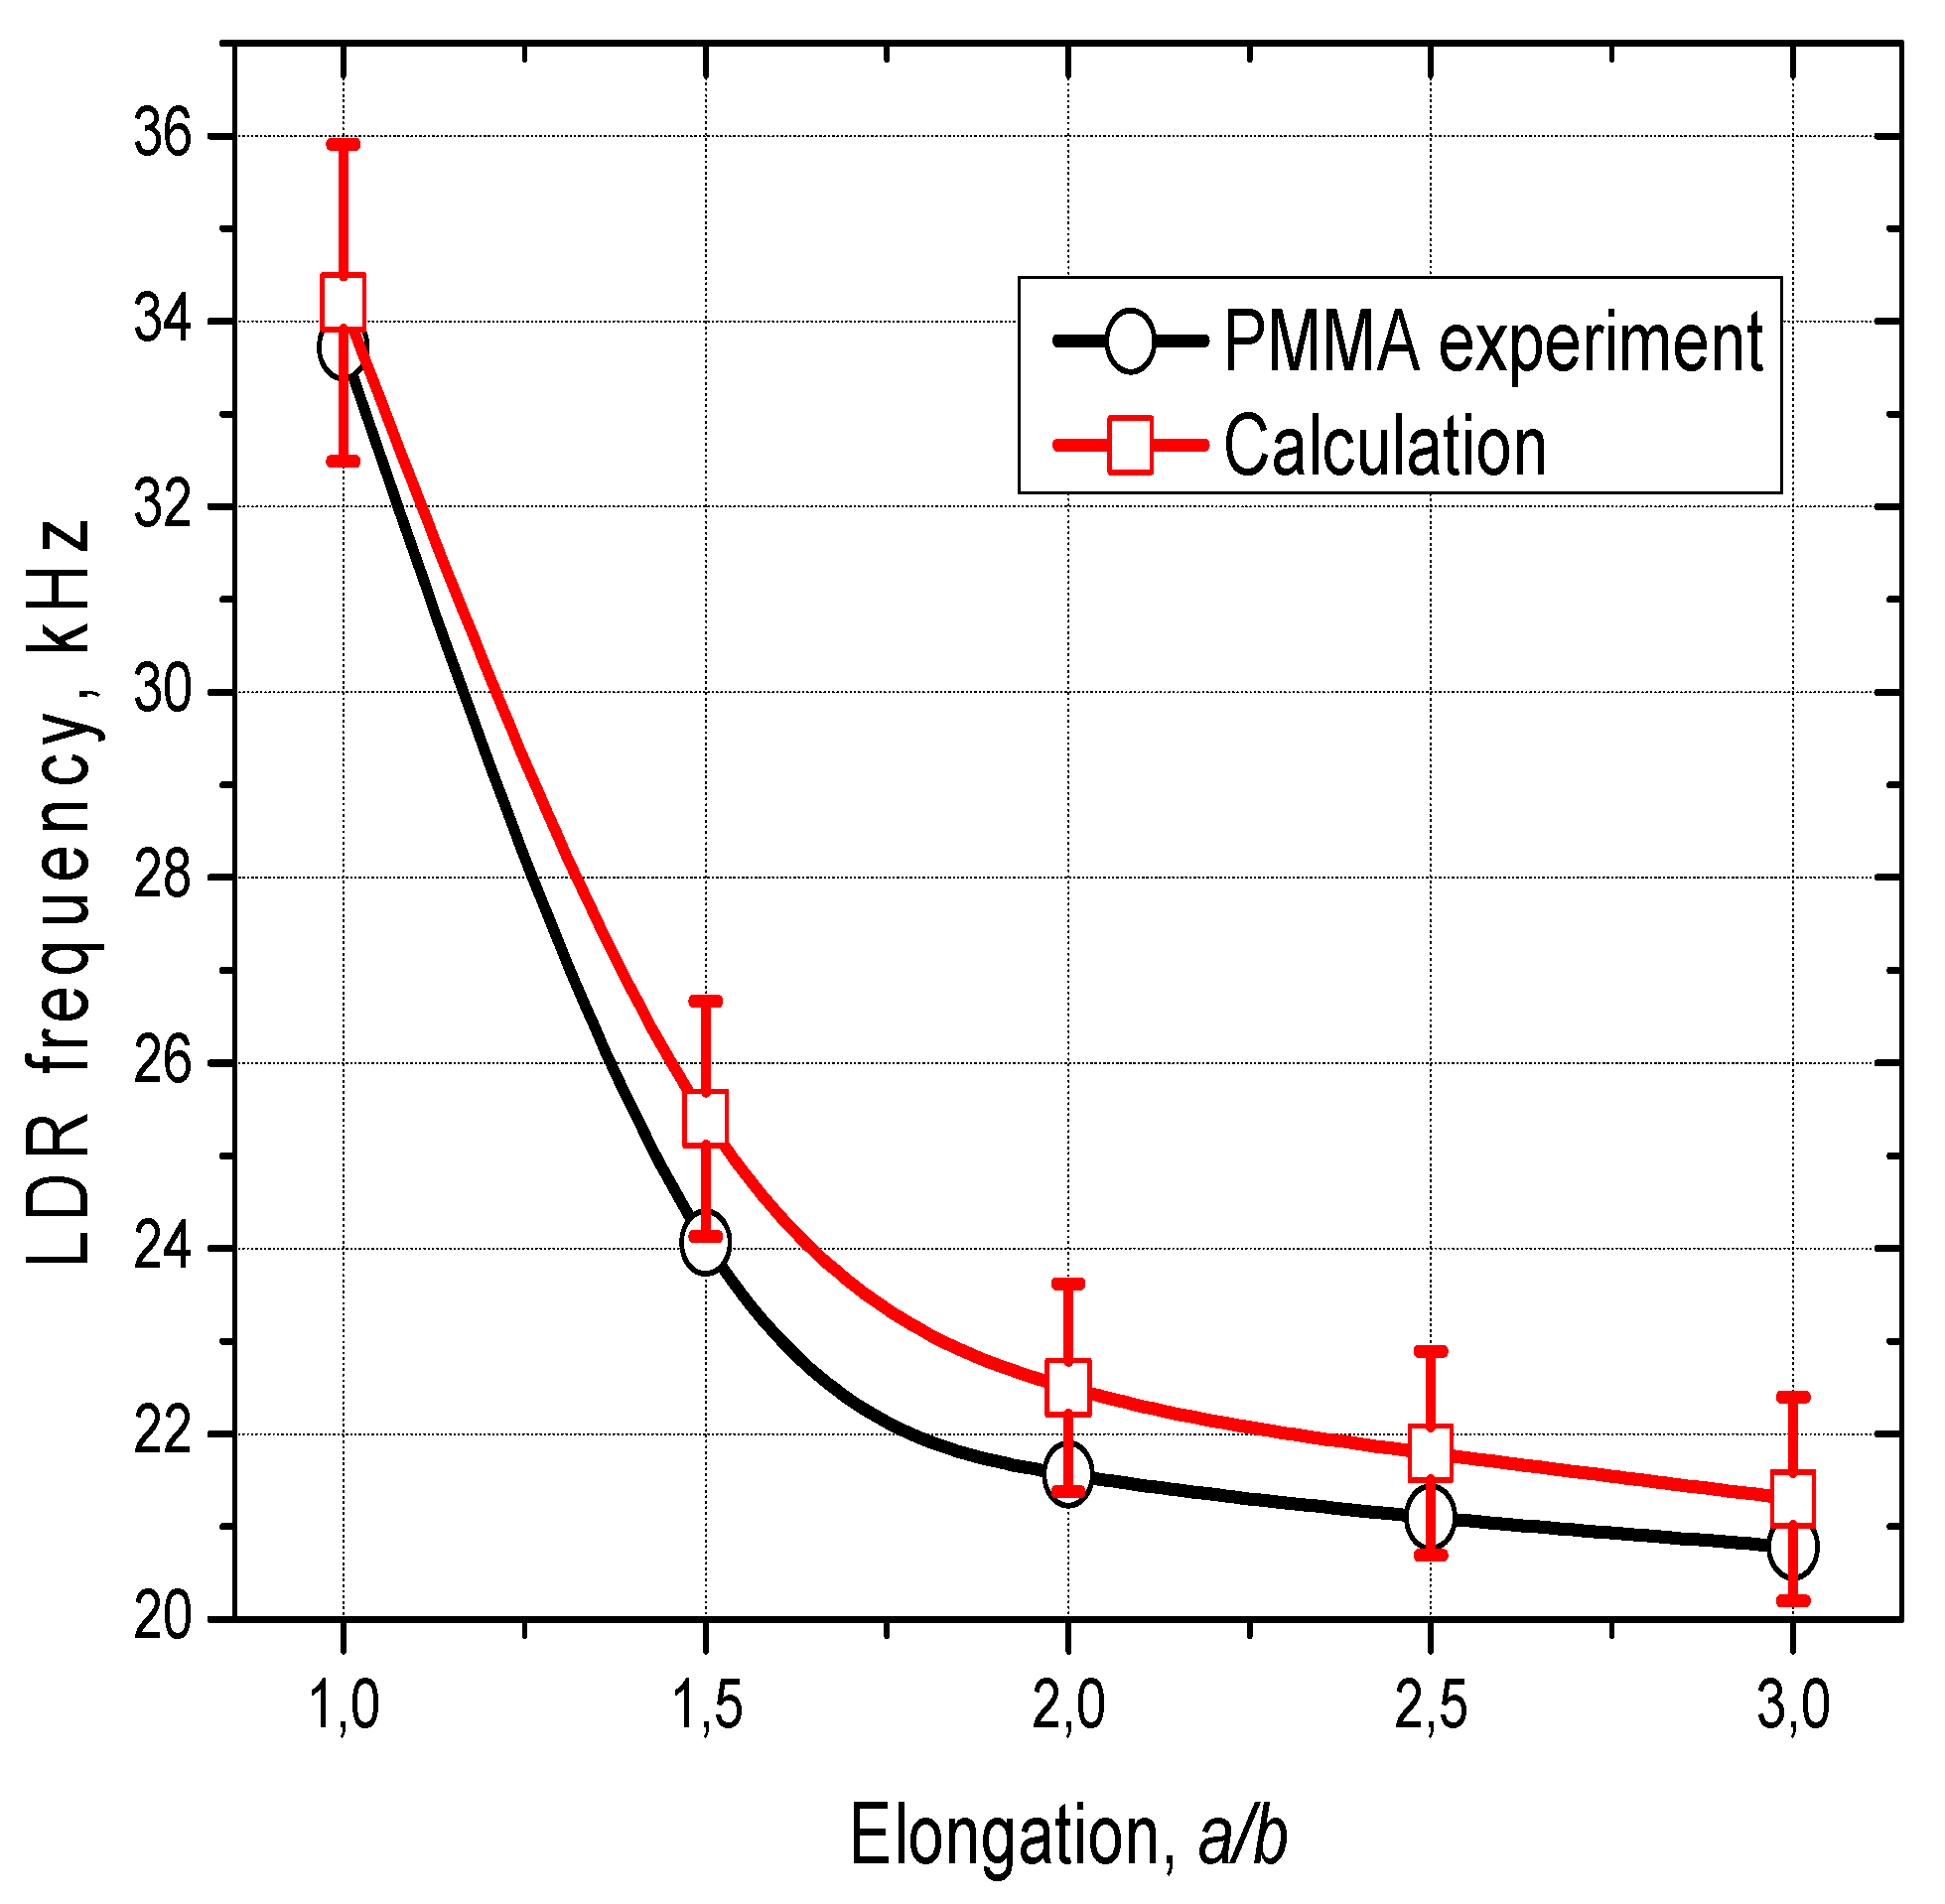
Figure 10.
LDR image (a) frequency response (b) for a circular FBH in PMMA (a).
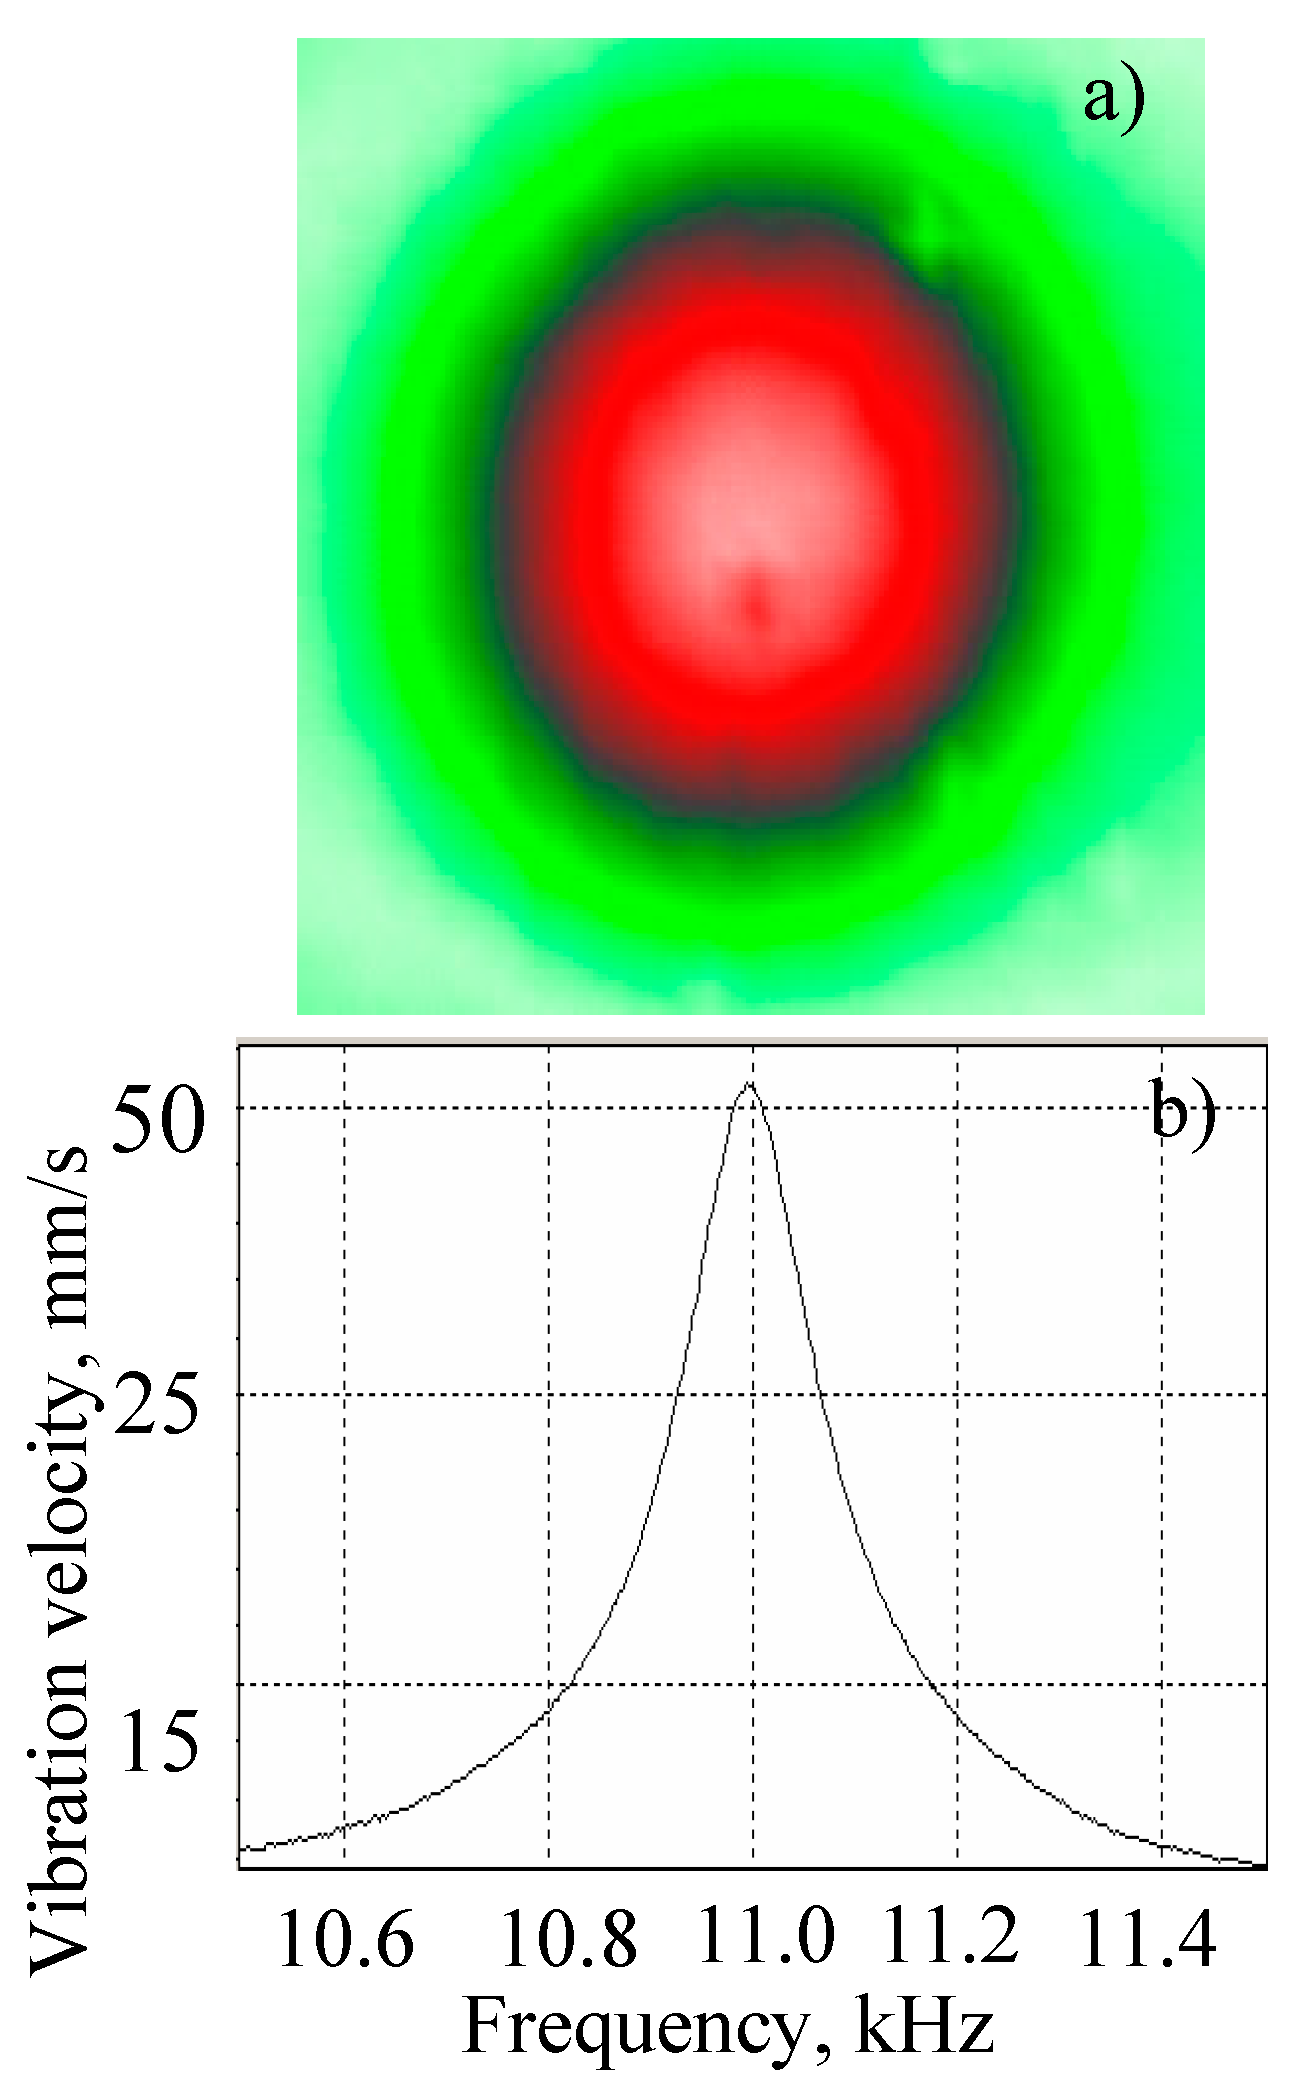
Figure 11.
LDR frequency responses (a) and vibration patterns (b) for two different impact damages in CFRP plates.
Figure 11.
LDR frequency responses (a) and vibration patterns (b) for two different impact damages in CFRP plates.
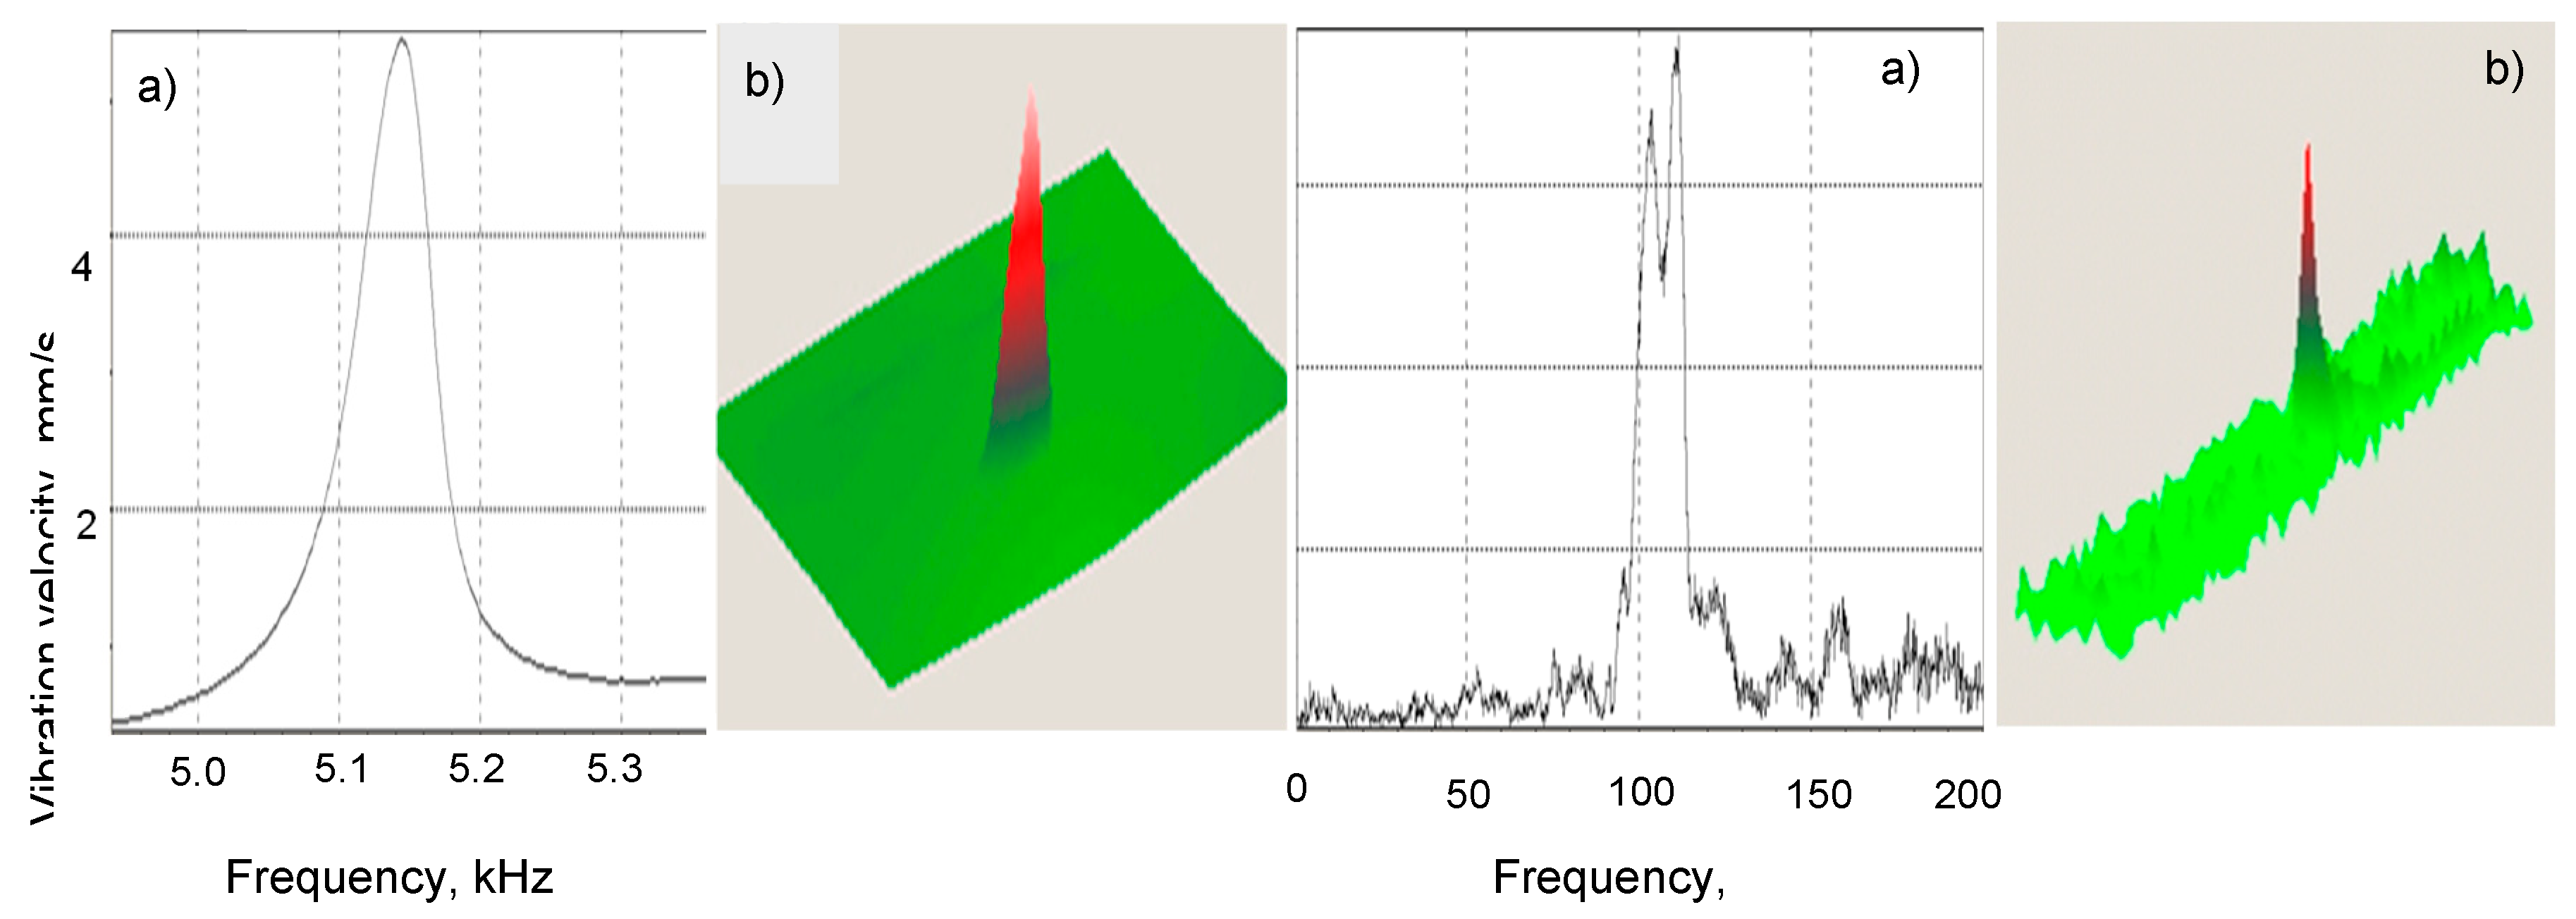
Figure 12.
a, b, c. LDR imaging of heat damage in CFRP: a) excitation matched to LDR frequency (48.5 kHz); b) 30 kHz excitation. c) LDR image (91.16 kHz) of 7x7 mm2 delamination in CFRP plate.
Figure 12.
a, b, c. LDR imaging of heat damage in CFRP: a) excitation matched to LDR frequency (48.5 kHz); b) 30 kHz excitation. c) LDR image (91.16 kHz) of 7x7 mm2 delamination in CFRP plate.
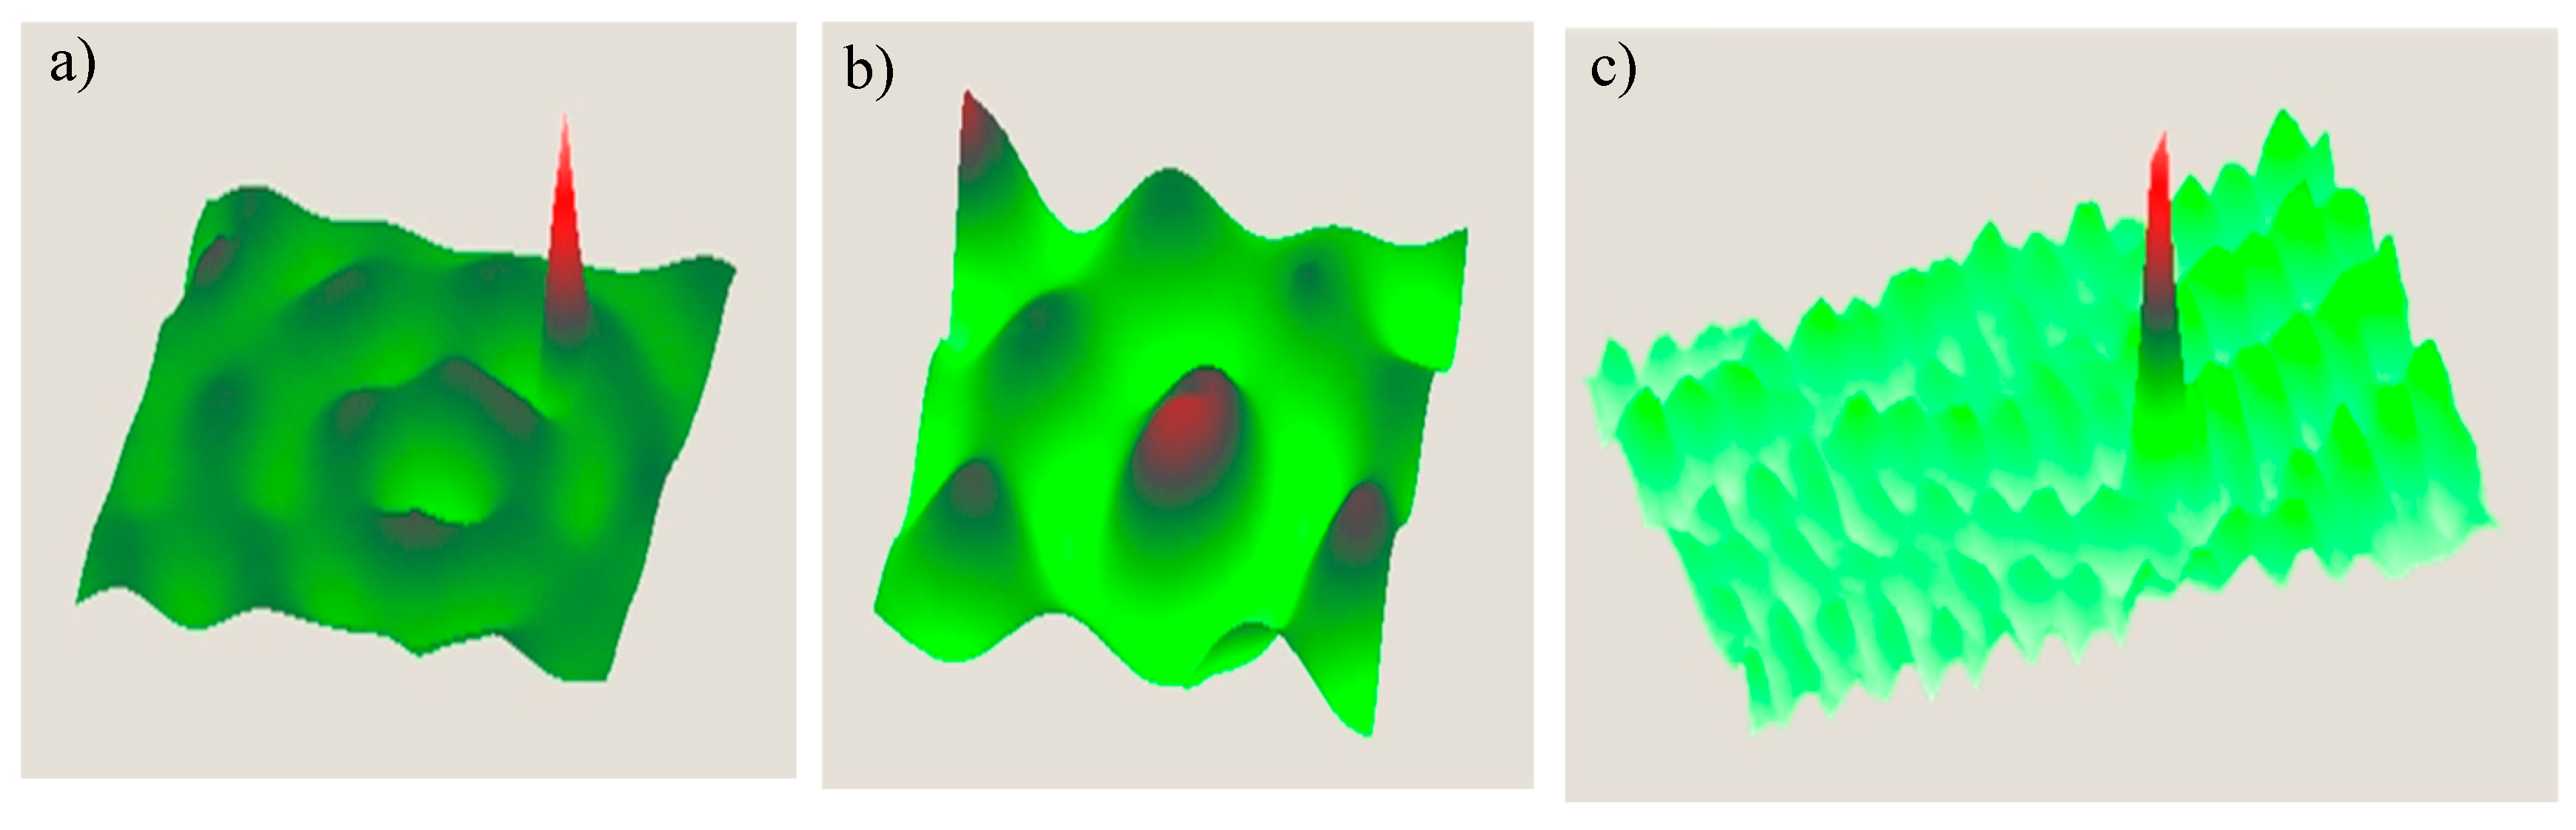
Figure 13.
(a-c). Frequency selective LDR imaging of heat damaged areas in CFRP plate (a): separate imaging of defects by matching their LDR frequencies (b-c); imaging of both defects in a wideband excitation mode.
Figure 13.
(a-c). Frequency selective LDR imaging of heat damaged areas in CFRP plate (a): separate imaging of defects by matching their LDR frequencies (b-c); imaging of both defects in a wideband excitation mode.
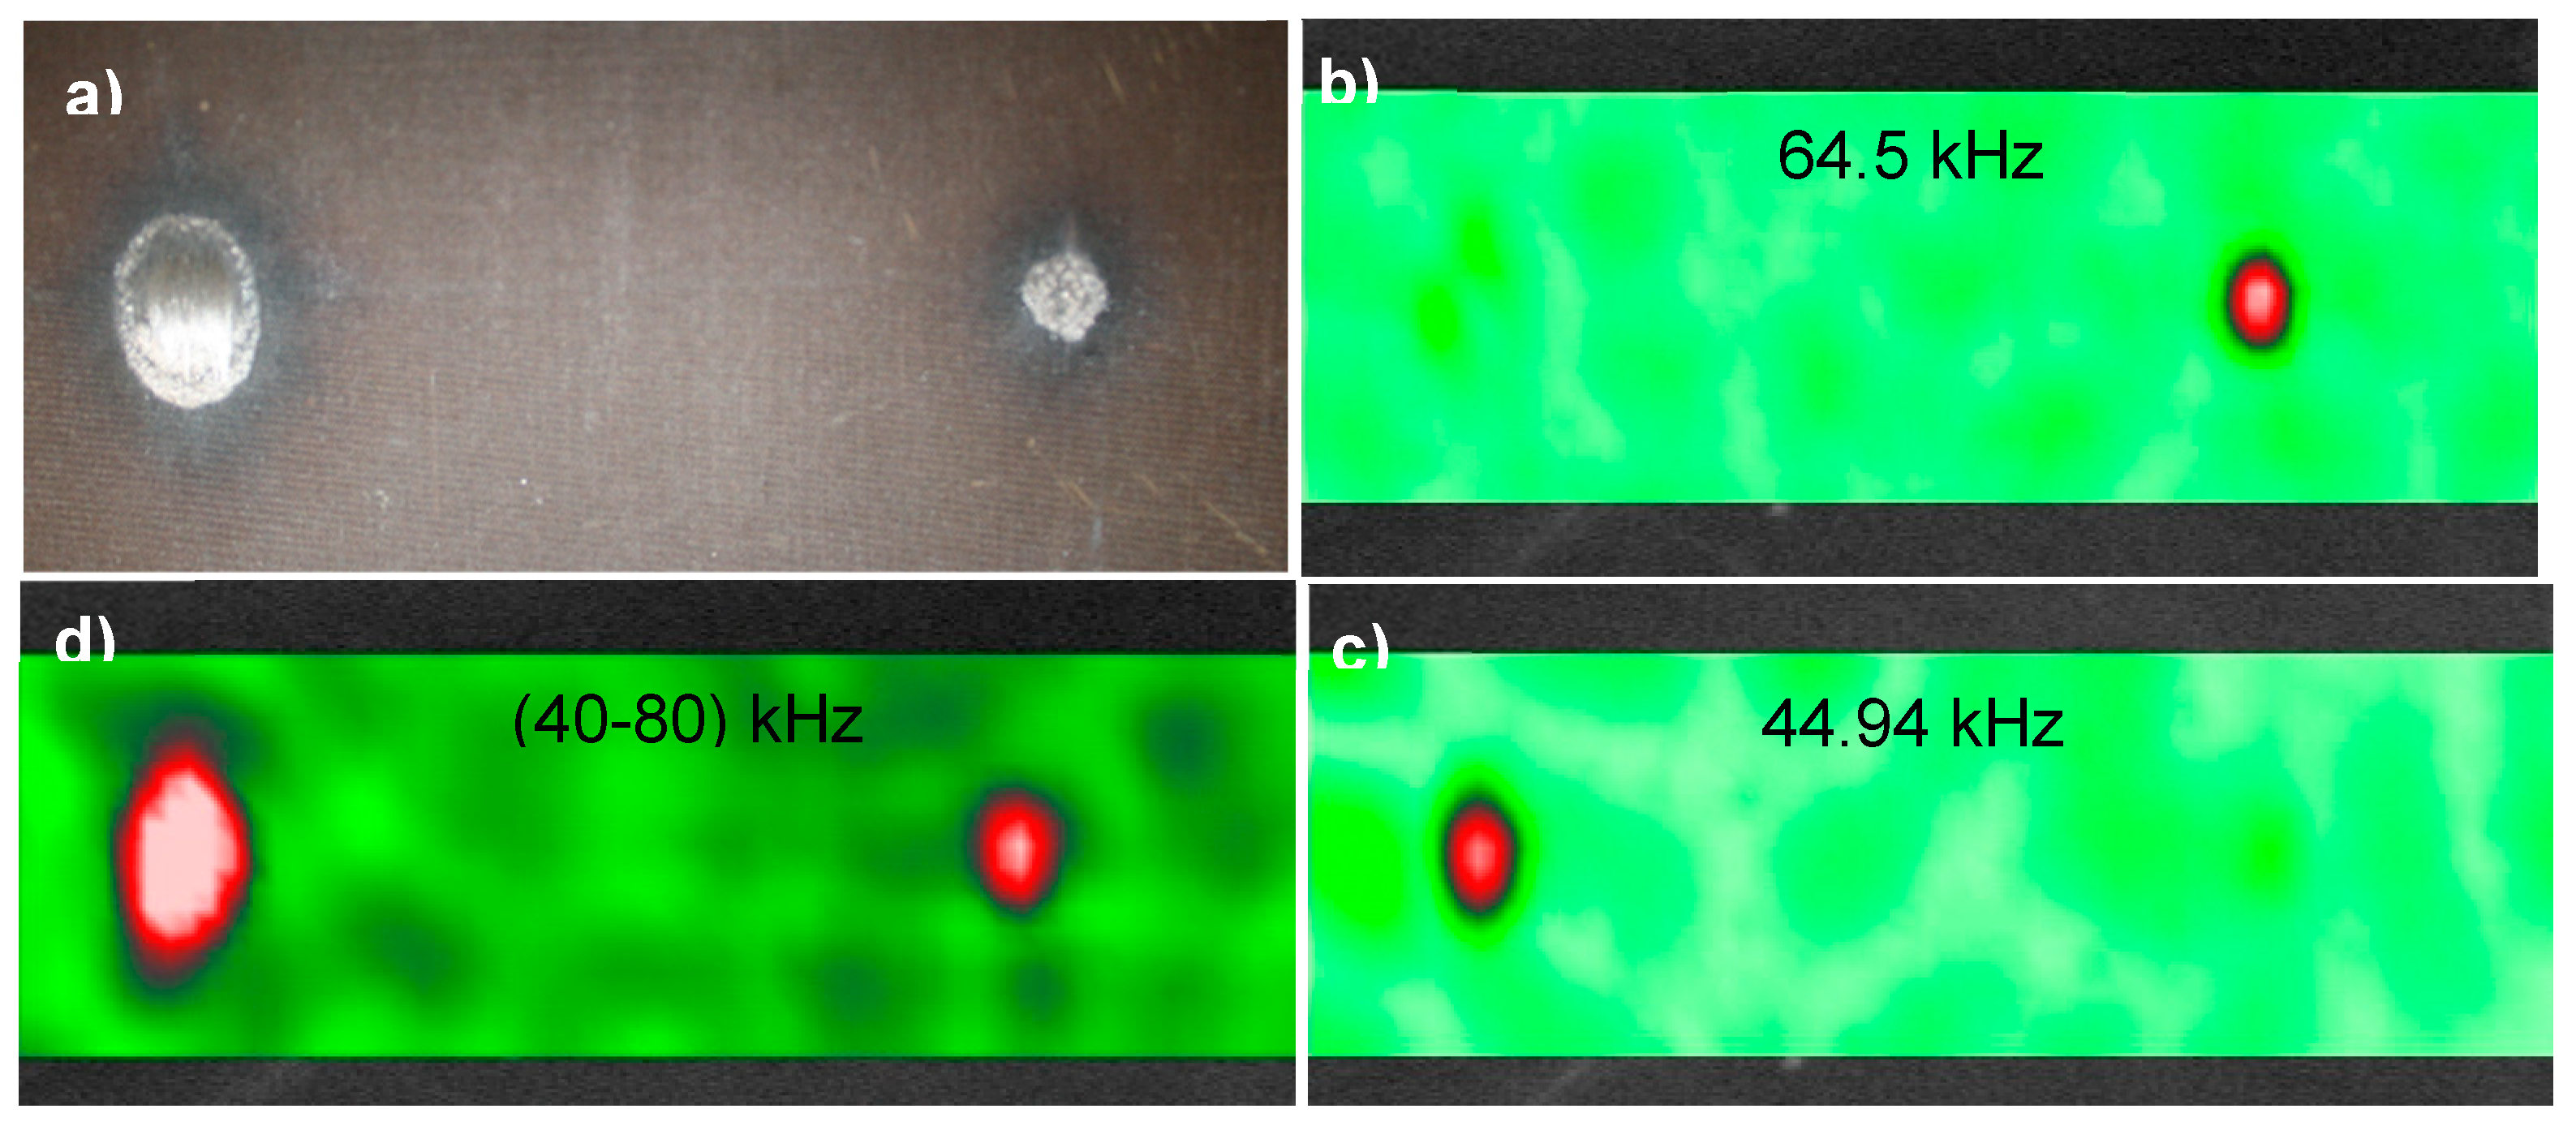
Figure 14.
Effect of the higher-order LDR: image of a square inset in CFRP plate at fundamental LDR (8980 Hz) (a), higher-order LDR (15600 Hz (b)), (27250 Hz (c)), and in a wideband (1-100 kHz) excitation mode (d).
Figure 14.
Effect of the higher-order LDR: image of a square inset in CFRP plate at fundamental LDR (8980 Hz) (a), higher-order LDR (15600 Hz (b)), (27250 Hz (c)), and in a wideband (1-100 kHz) excitation mode (d).
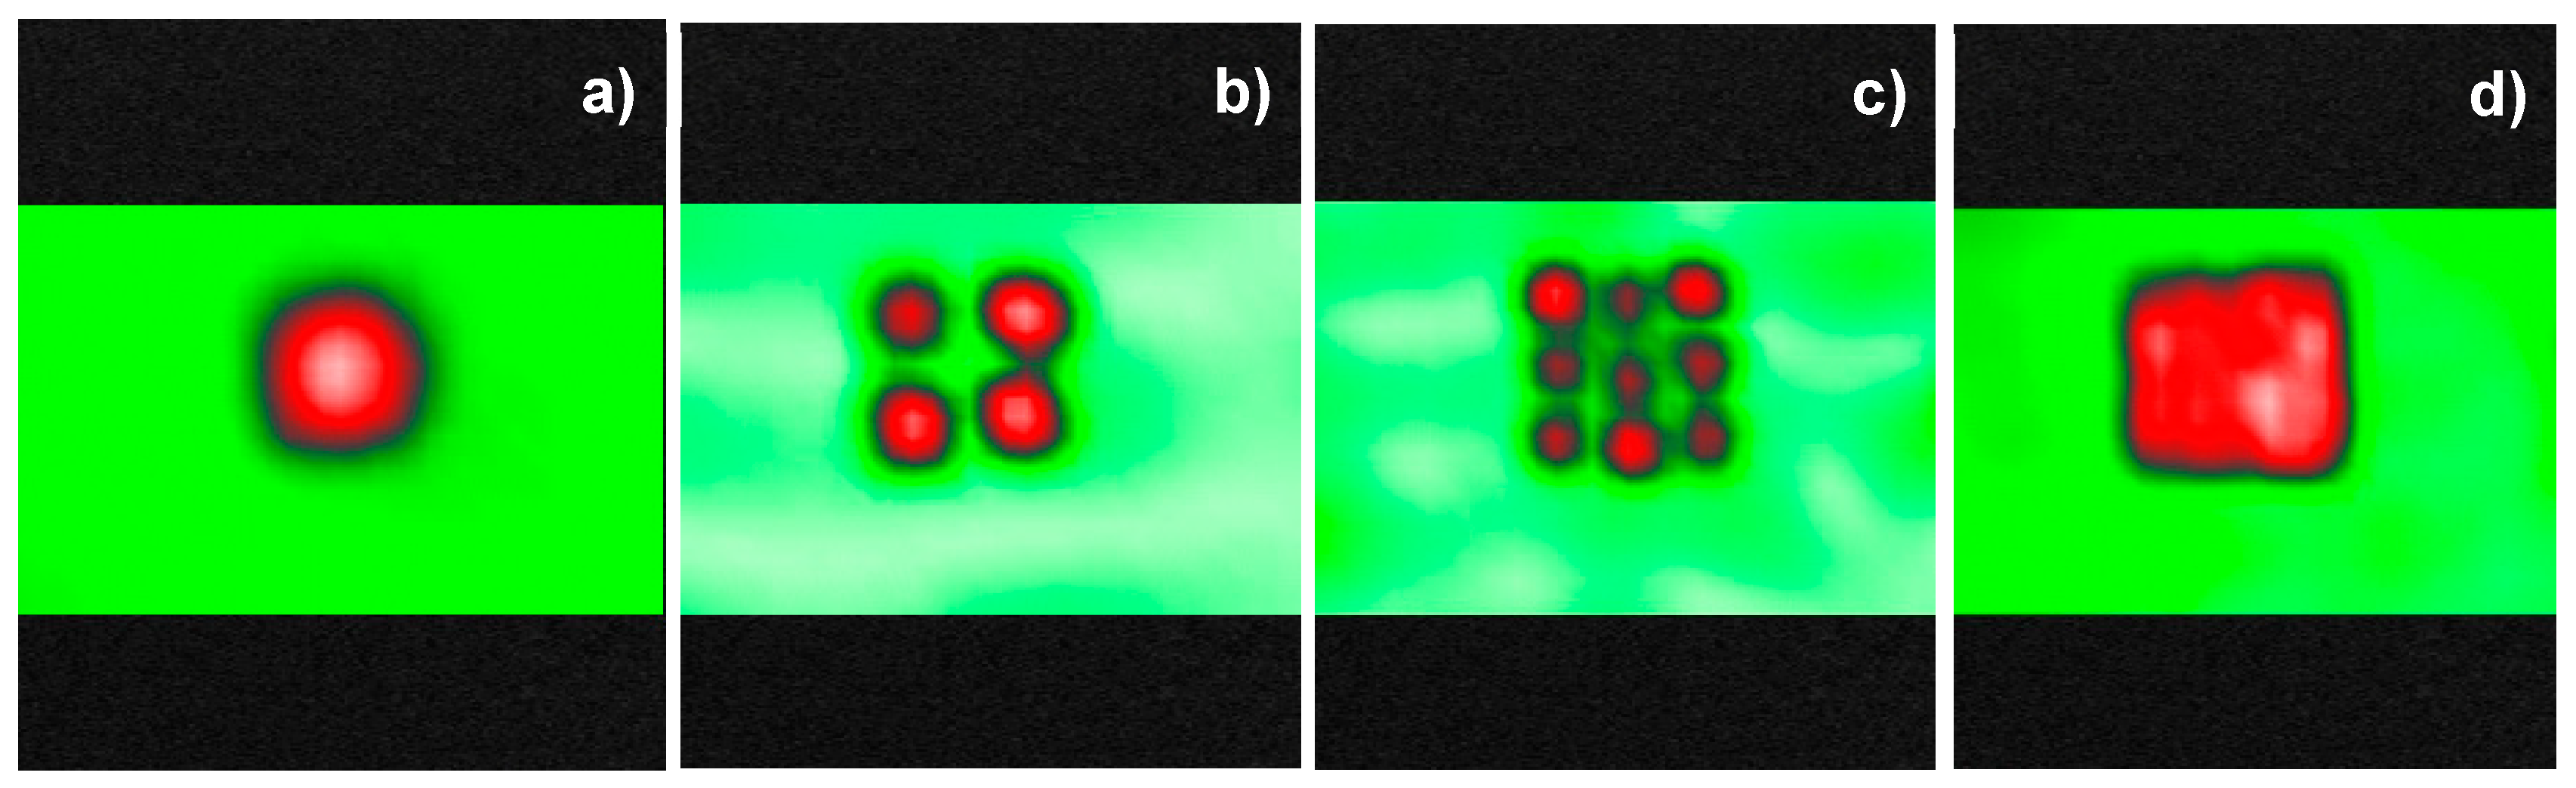
Figure 15.
The cracks tested in concrete plate N1, N2 correspondingly.
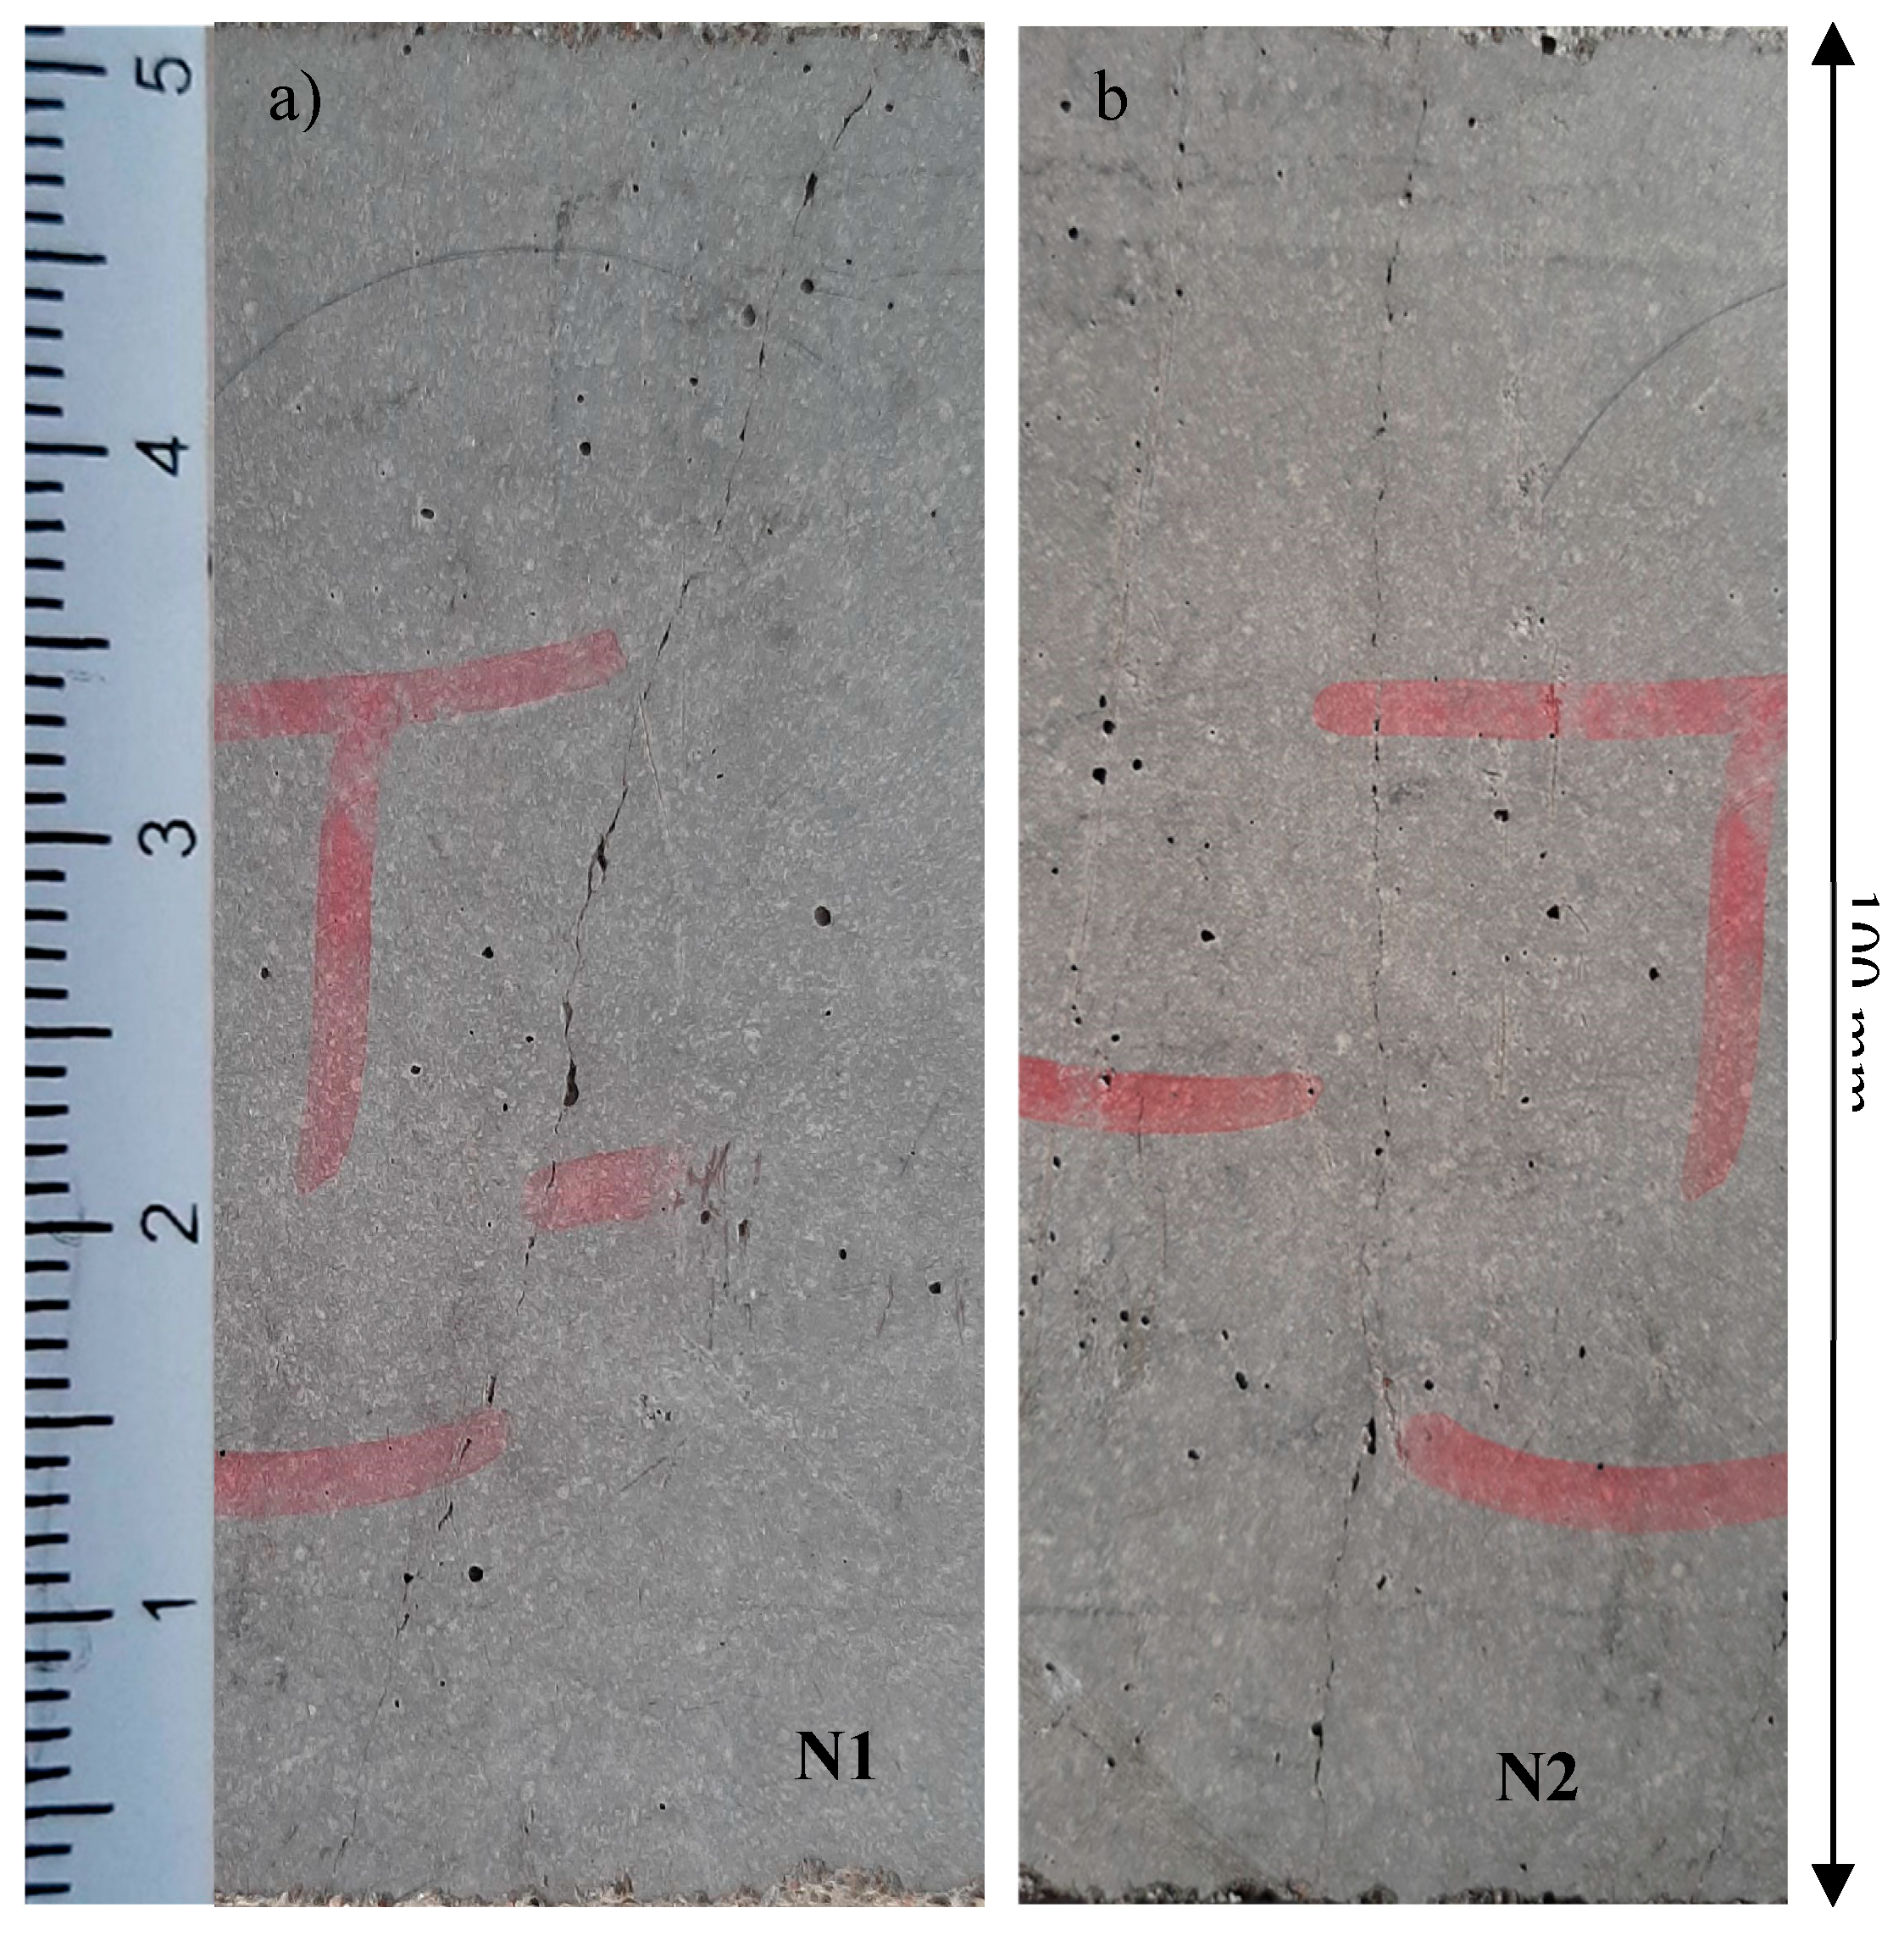
Figure 16.
FW (EW) wavelengths measured and dispersion curves calculated in concrete.
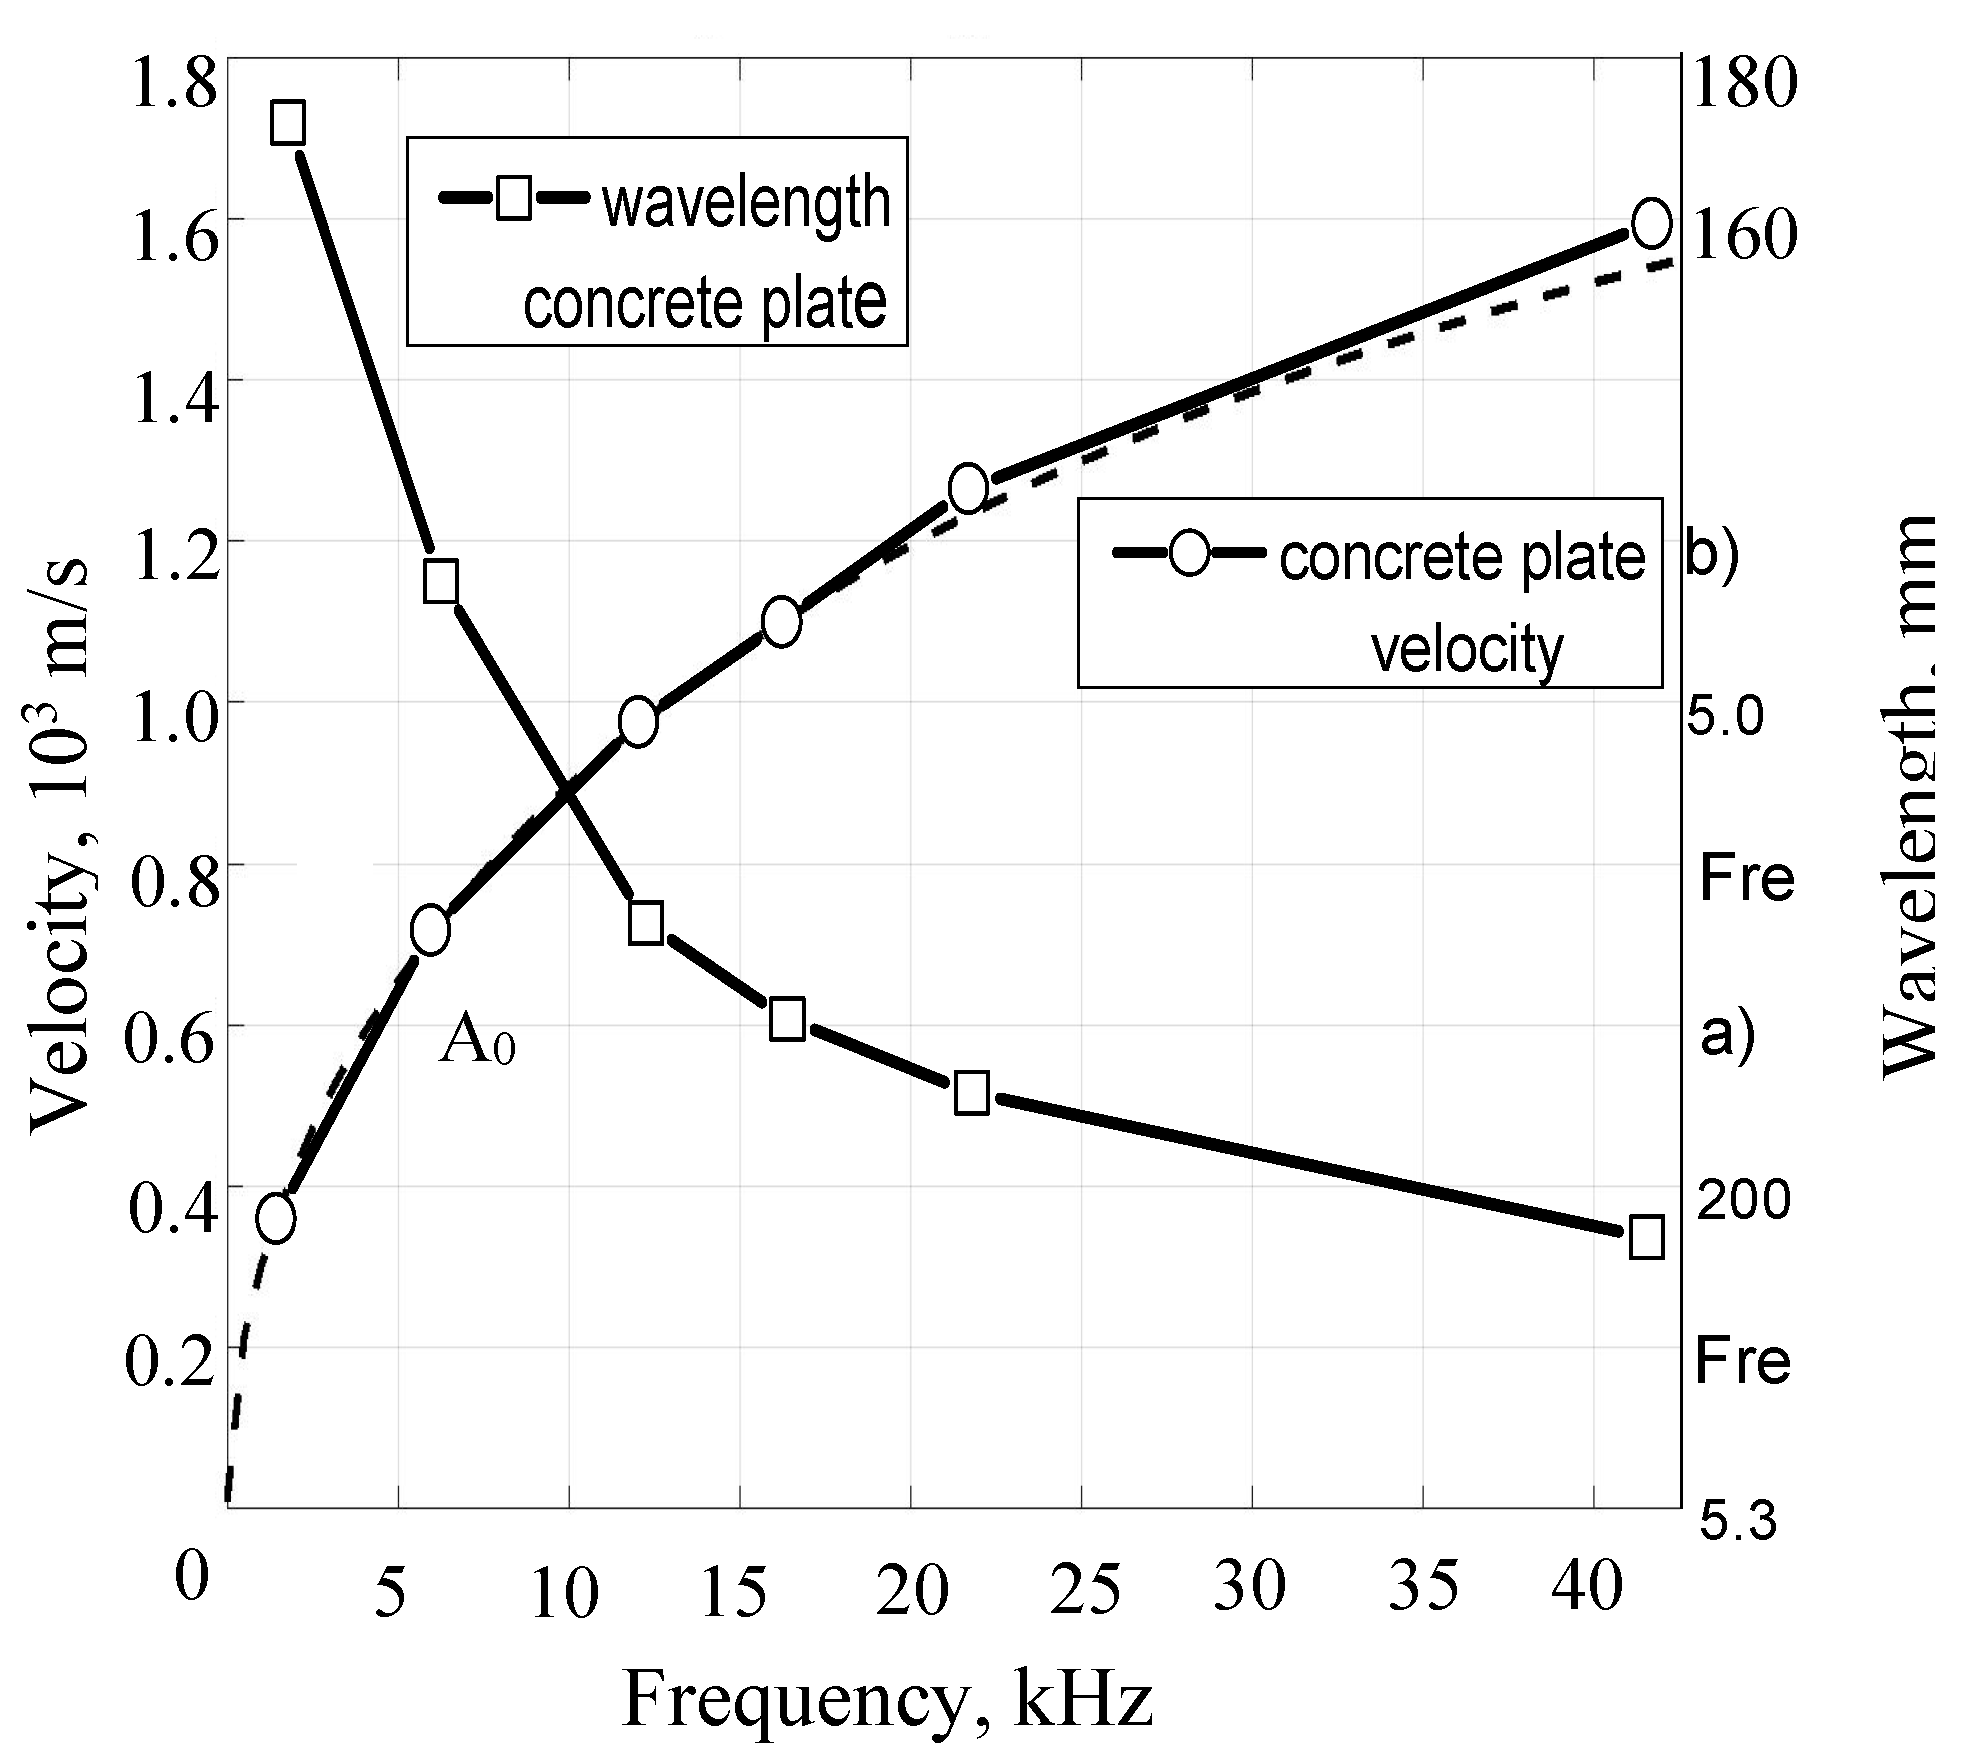
Figure 17.
LDR of EW in concrete crack N1.
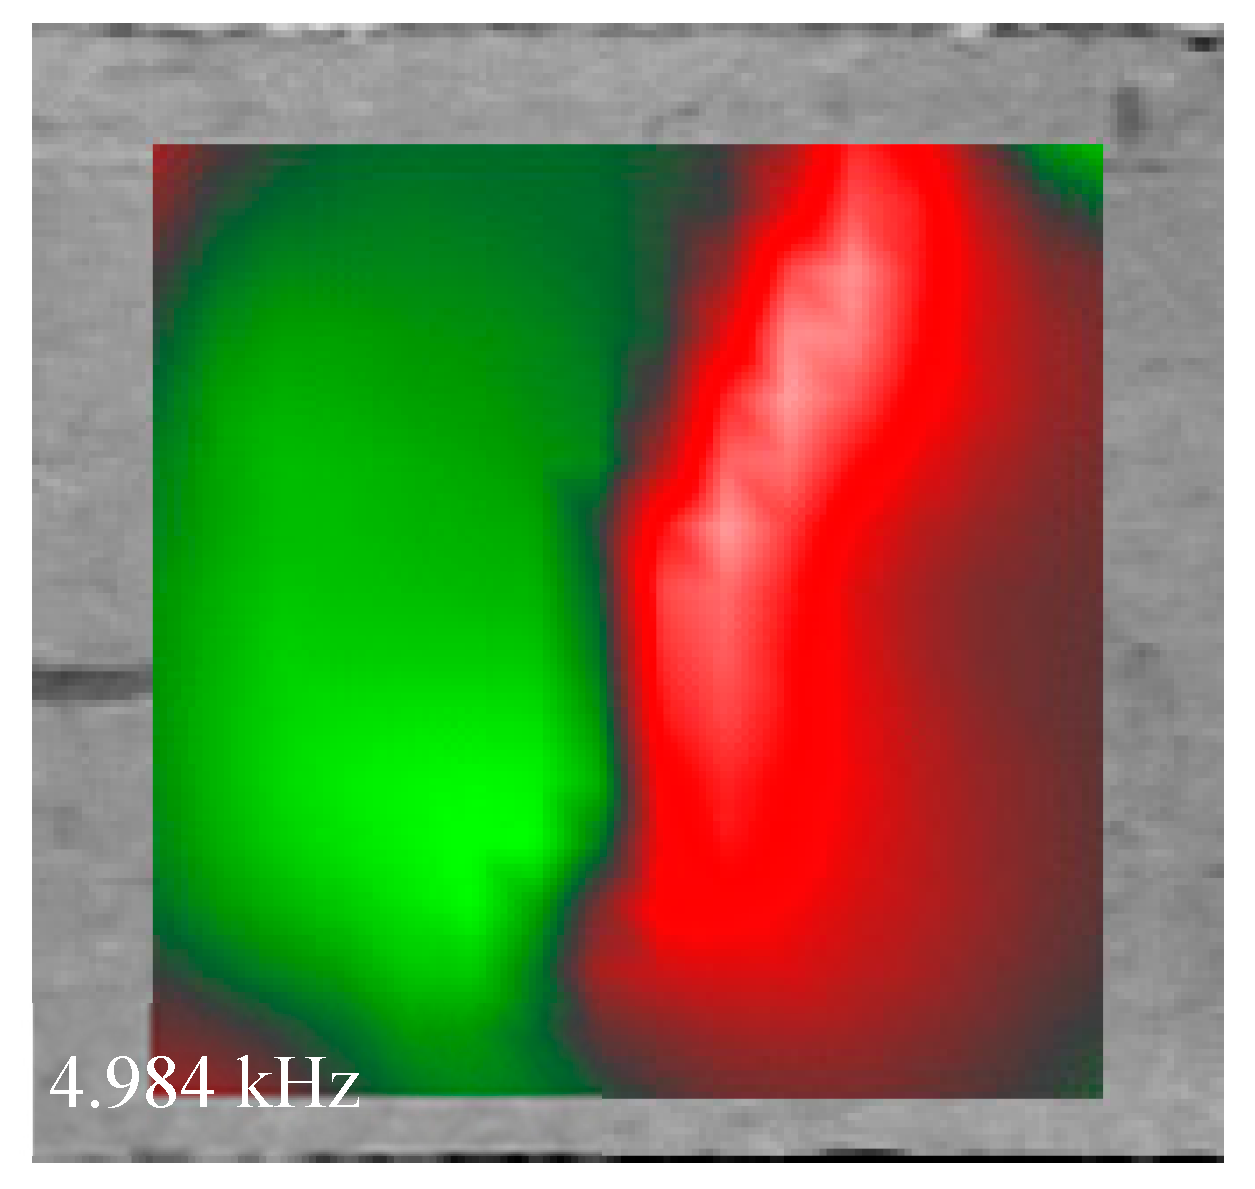
Figure 18.
Various types of LDR for crack N2 in concrete: partial LDR at opposite crack faces (a, b); higher-order LDR (c, d); superposition of the LDR in wideband (1-20 kHz) activation mode (e).
Figure 18.
Various types of LDR for crack N2 in concrete: partial LDR at opposite crack faces (a, b); higher-order LDR (c, d); superposition of the LDR in wideband (1-20 kHz) activation mode (e).
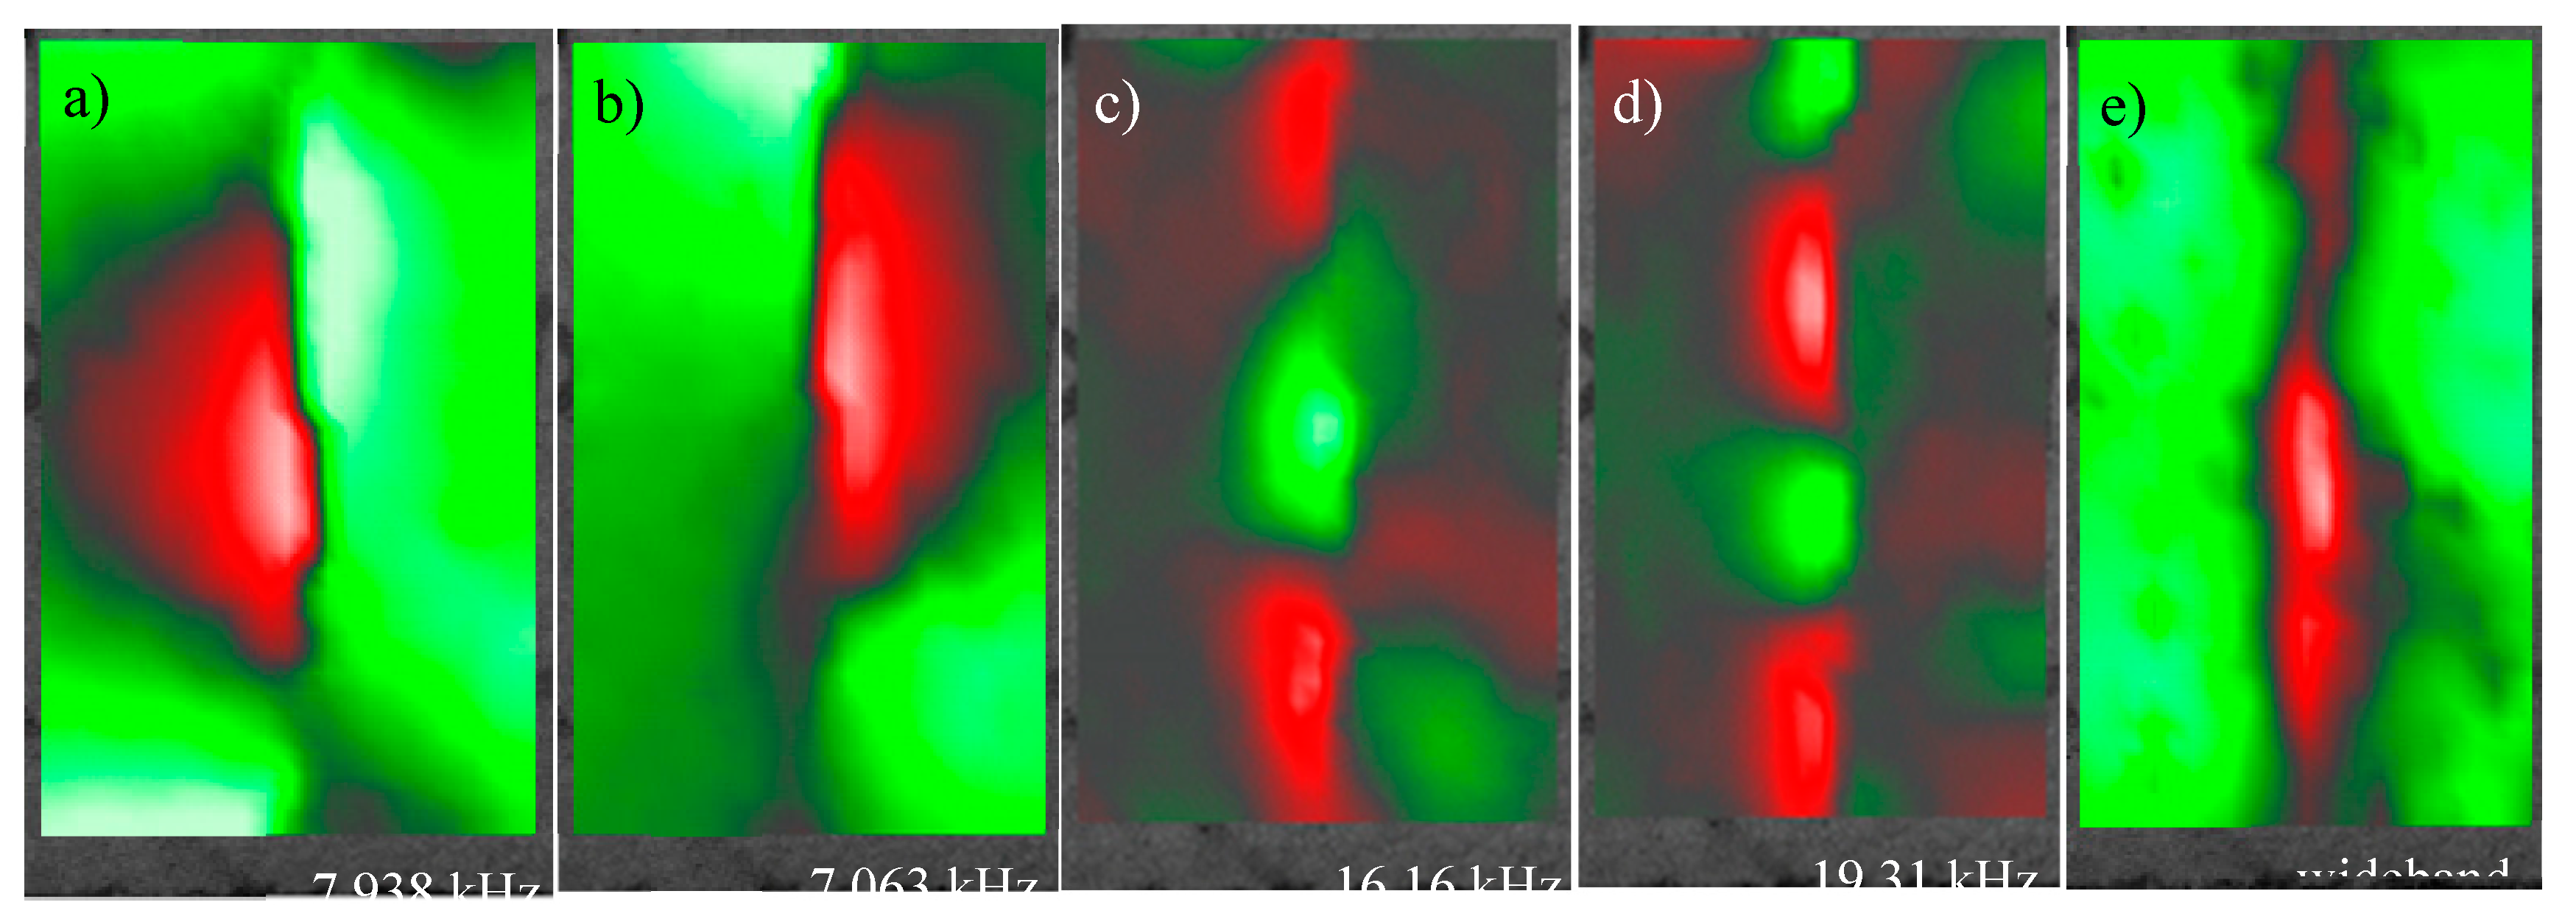
Figure 19.
CT-scans of the specimens with the reconstructed pores N1 – N3 (left) and magnification of pores N2 – N4 (right).
Figure 19.
CT-scans of the specimens with the reconstructed pores N1 – N3 (left) and magnification of pores N2 – N4 (right).
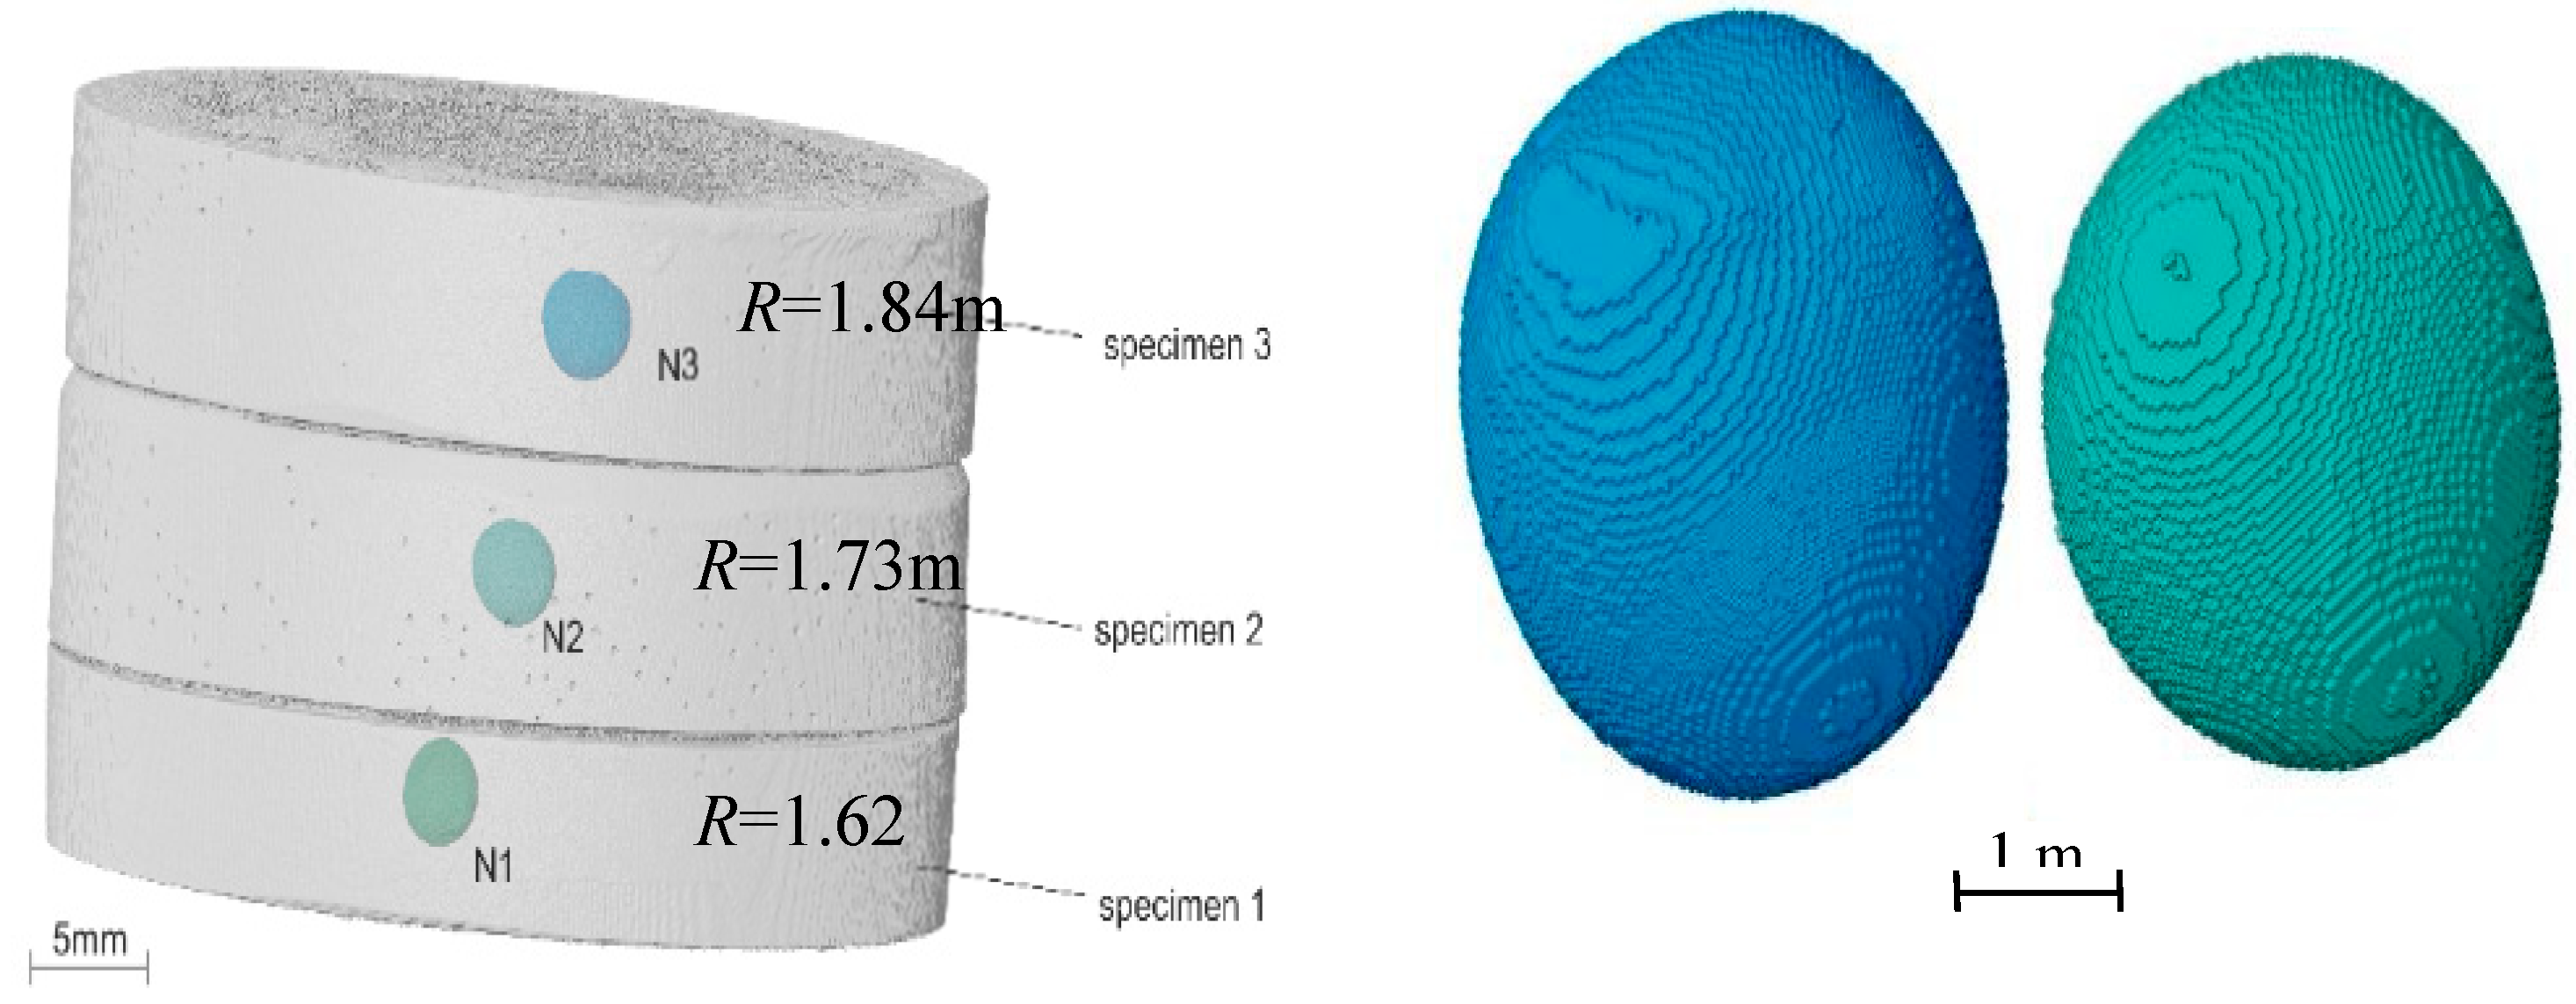
Figure 20.
Laser beam probing of spherical pore vibrations via flat bottom of transparent specimen.
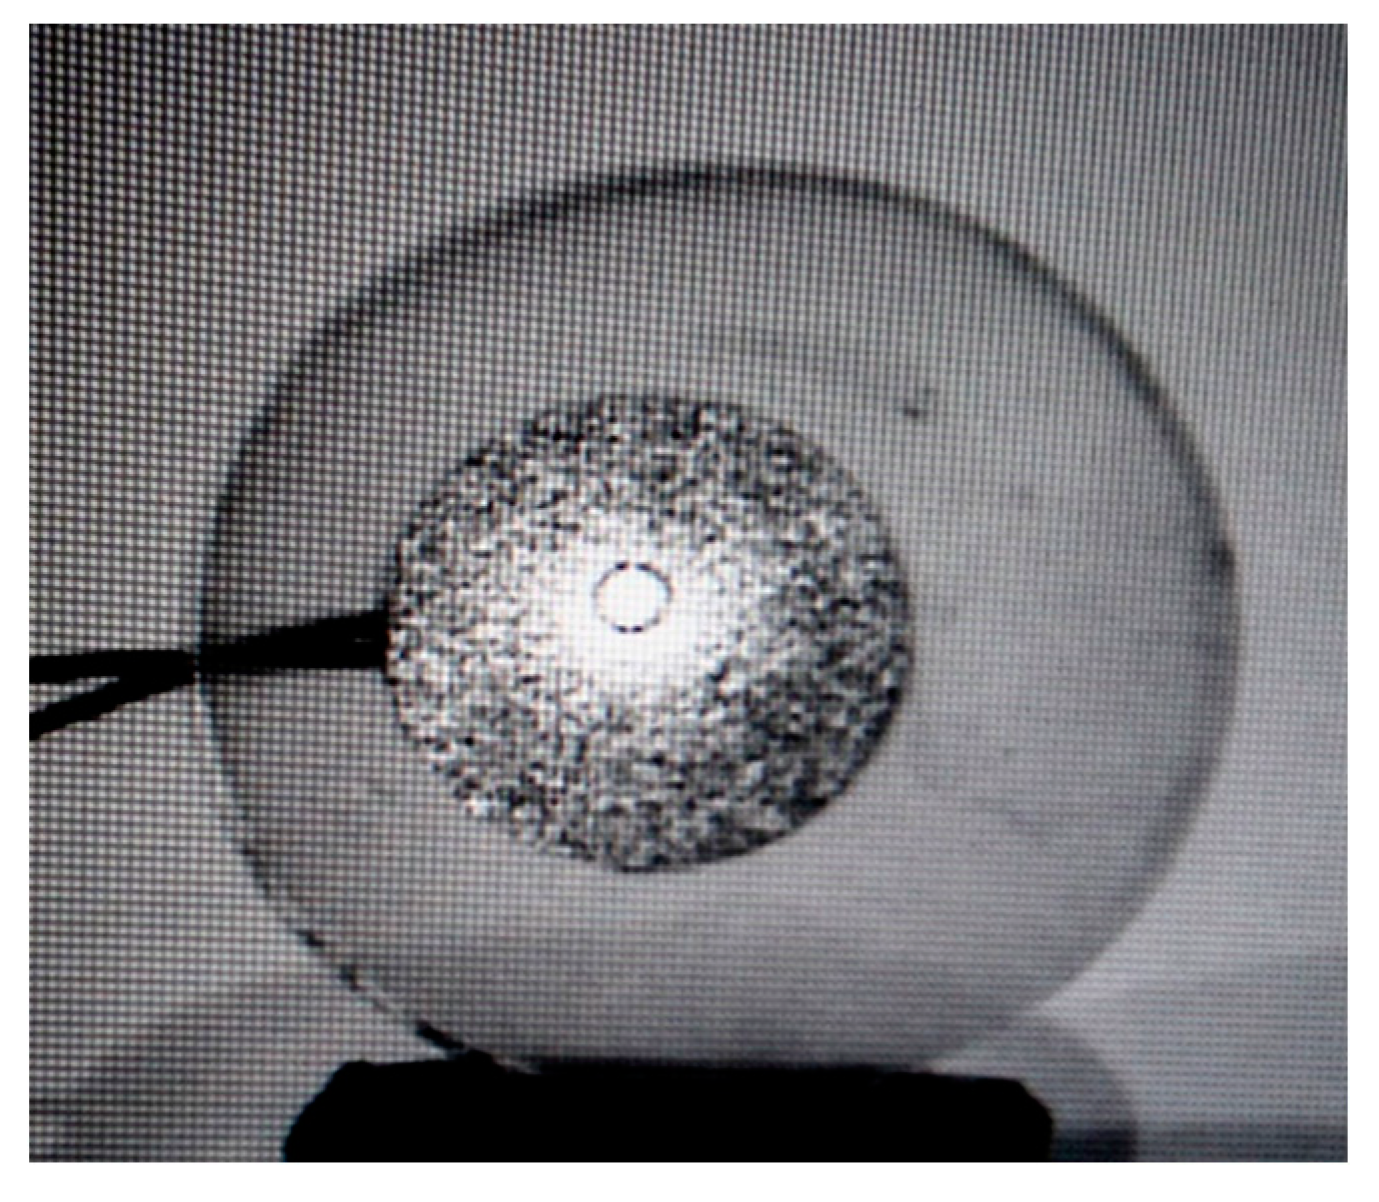
Figure 21.
LDR FR measured for bubble N1.
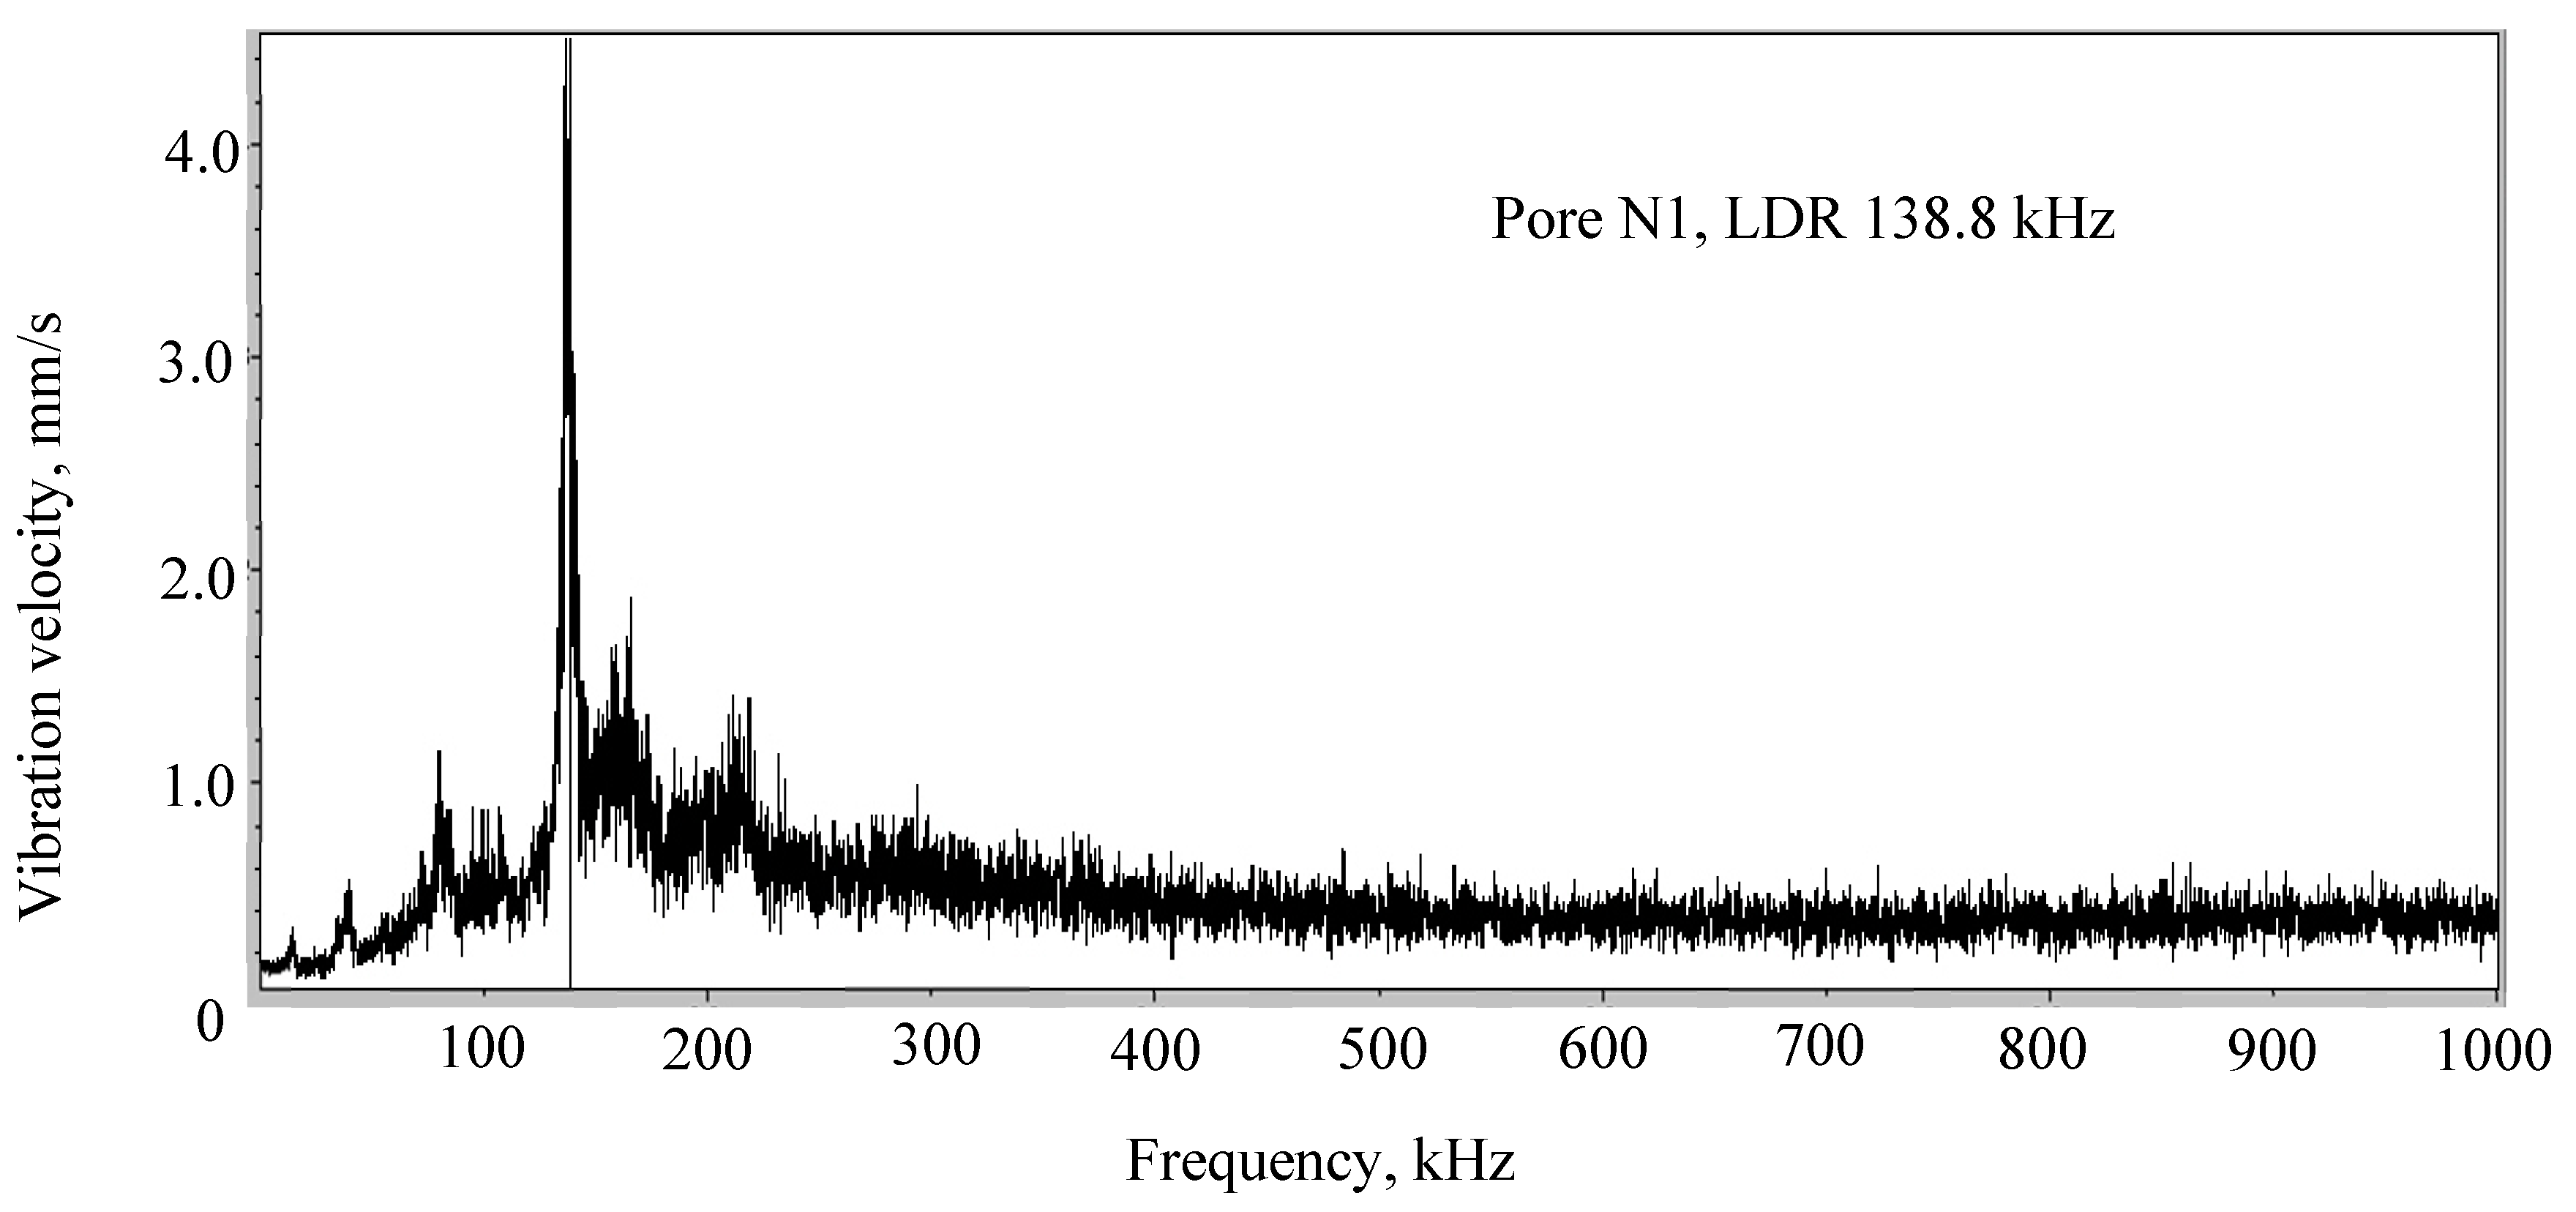
Figure 24.
Higher harmonics inside pore N1 (a); outside pore N1 (b) and in pore N3 (c) for excitations at bubble LDR frequencies.
Figure 24.
Higher harmonics inside pore N1 (a); outside pore N1 (b) and in pore N3 (c) for excitations at bubble LDR frequencies.
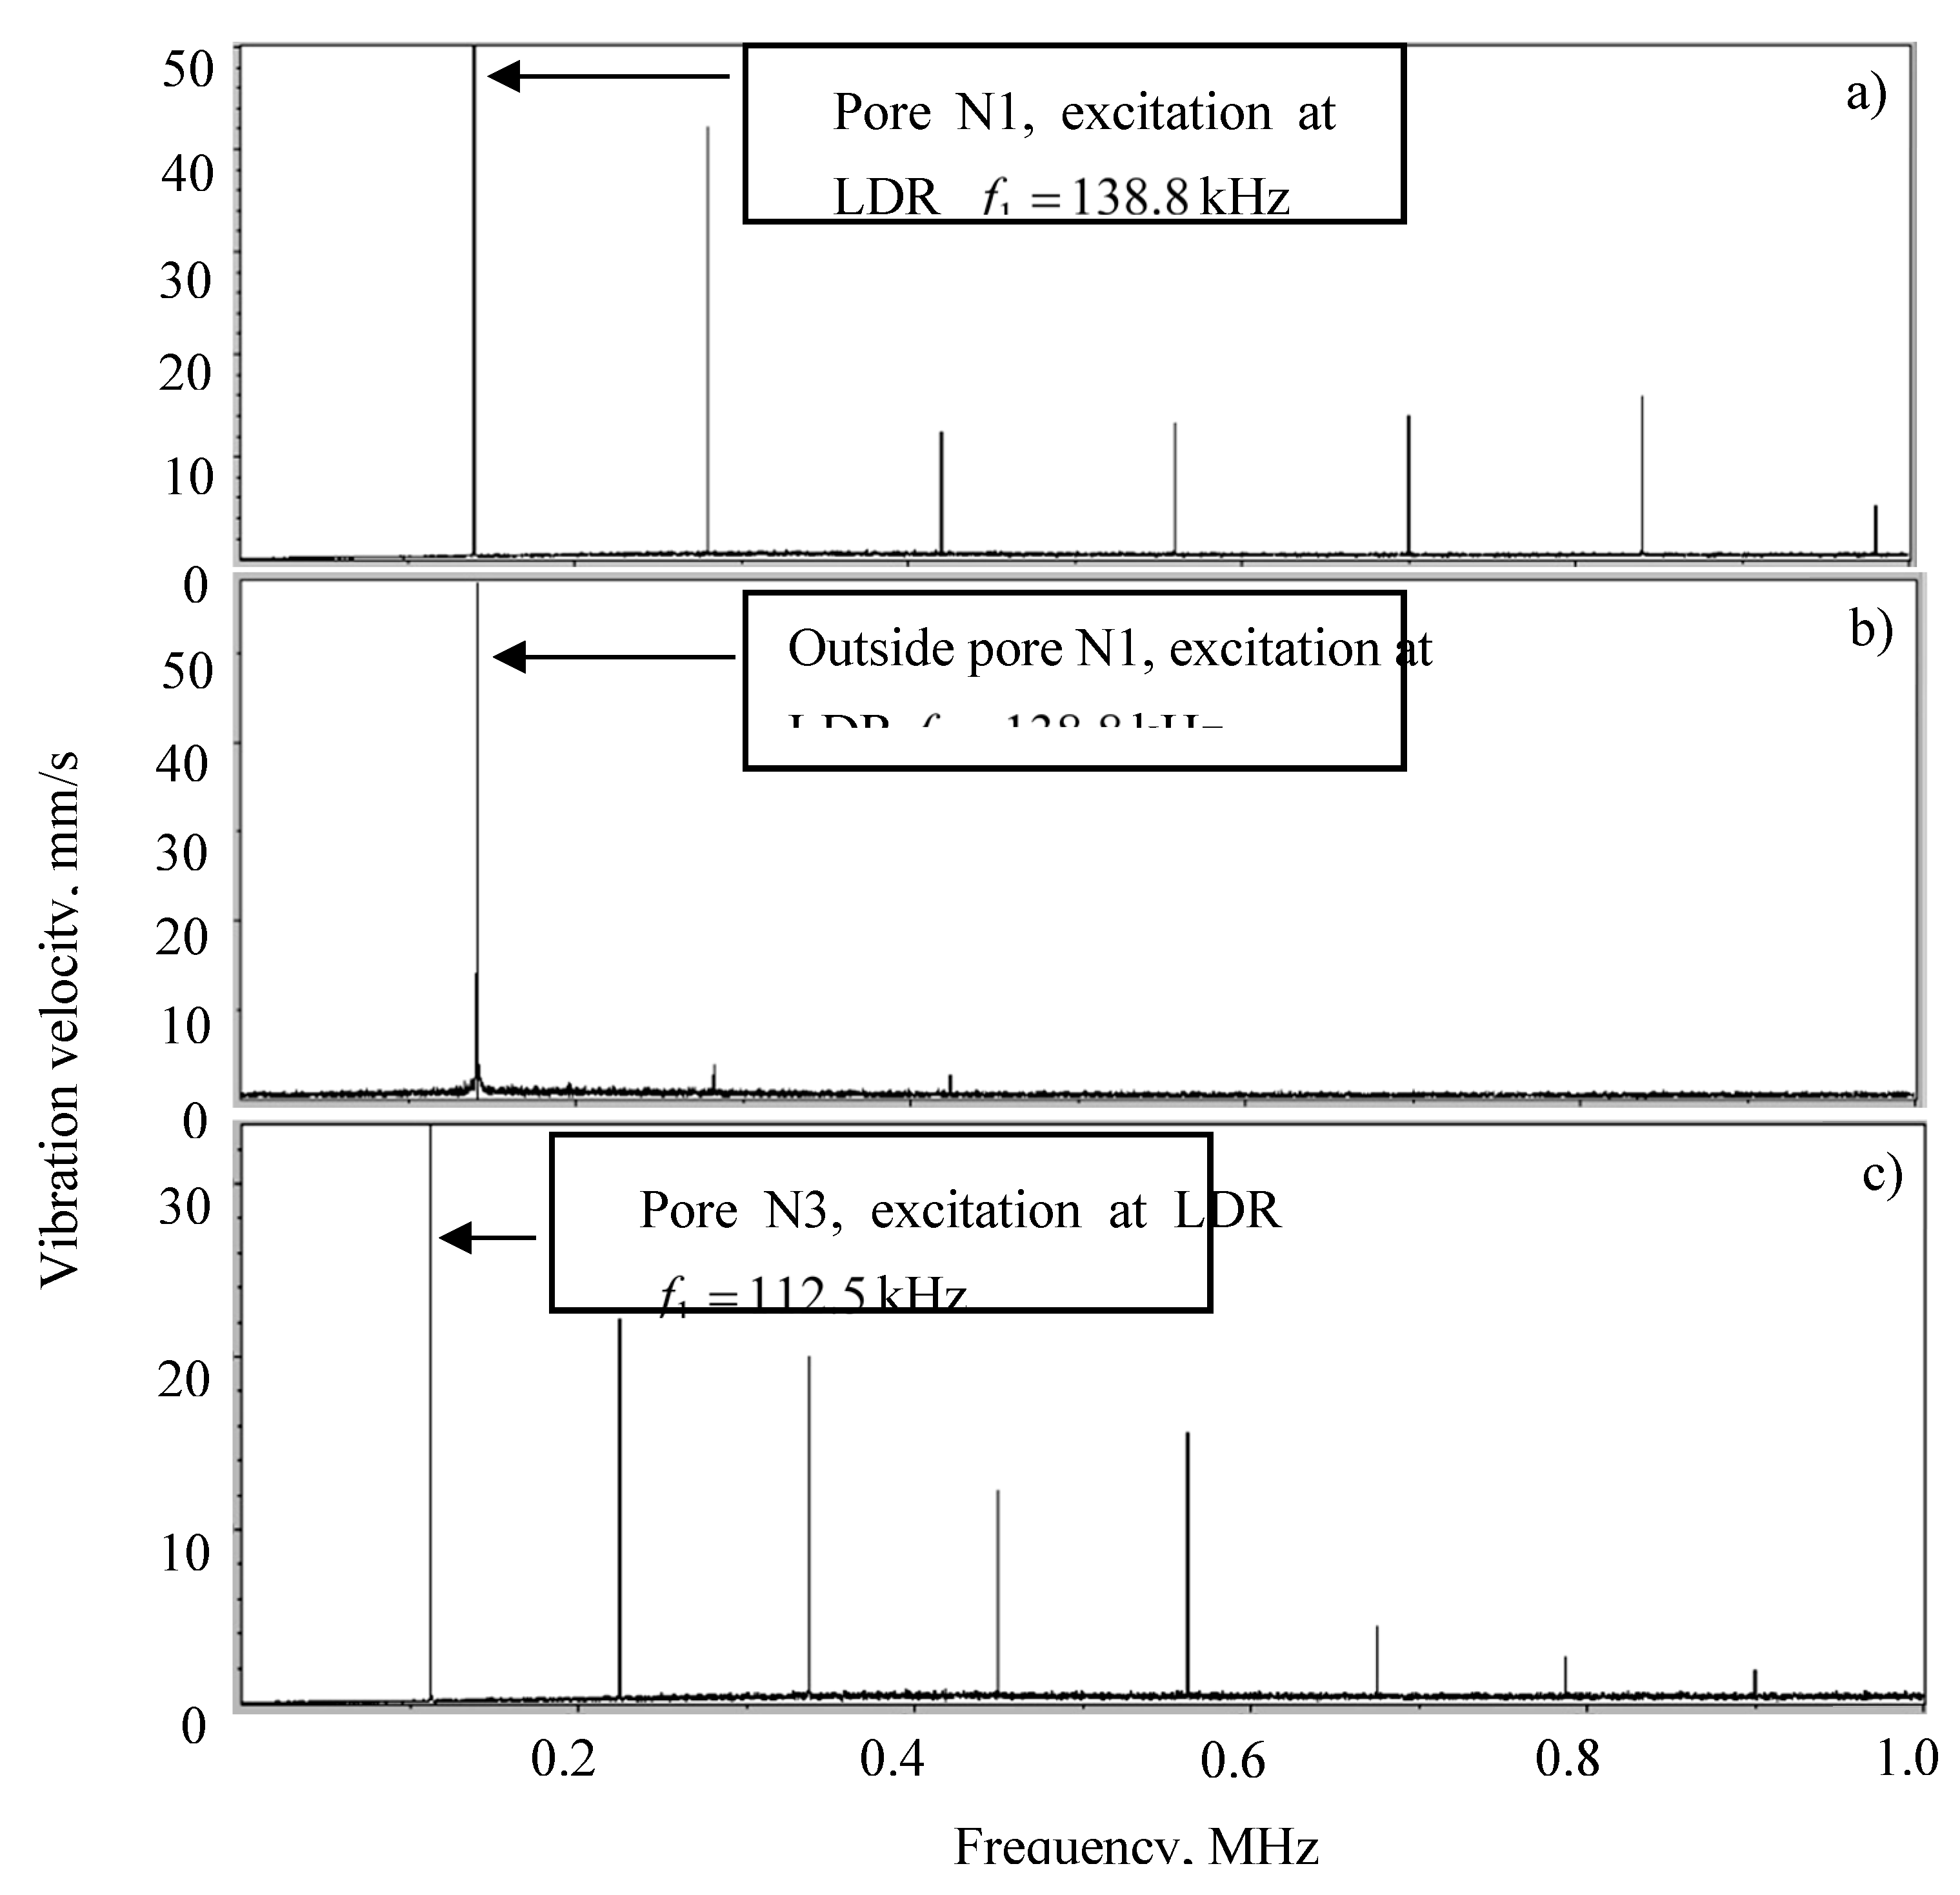
Figure 25.
Effect of subharmonic resonance of selected higher harmonics in specimen N3 excitation at the subharmonic frequency f1/5 (a) and f1/7 (b).
Figure 25.
Effect of subharmonic resonance of selected higher harmonics in specimen N3 excitation at the subharmonic frequency f1/5 (a) and f1/7 (b).
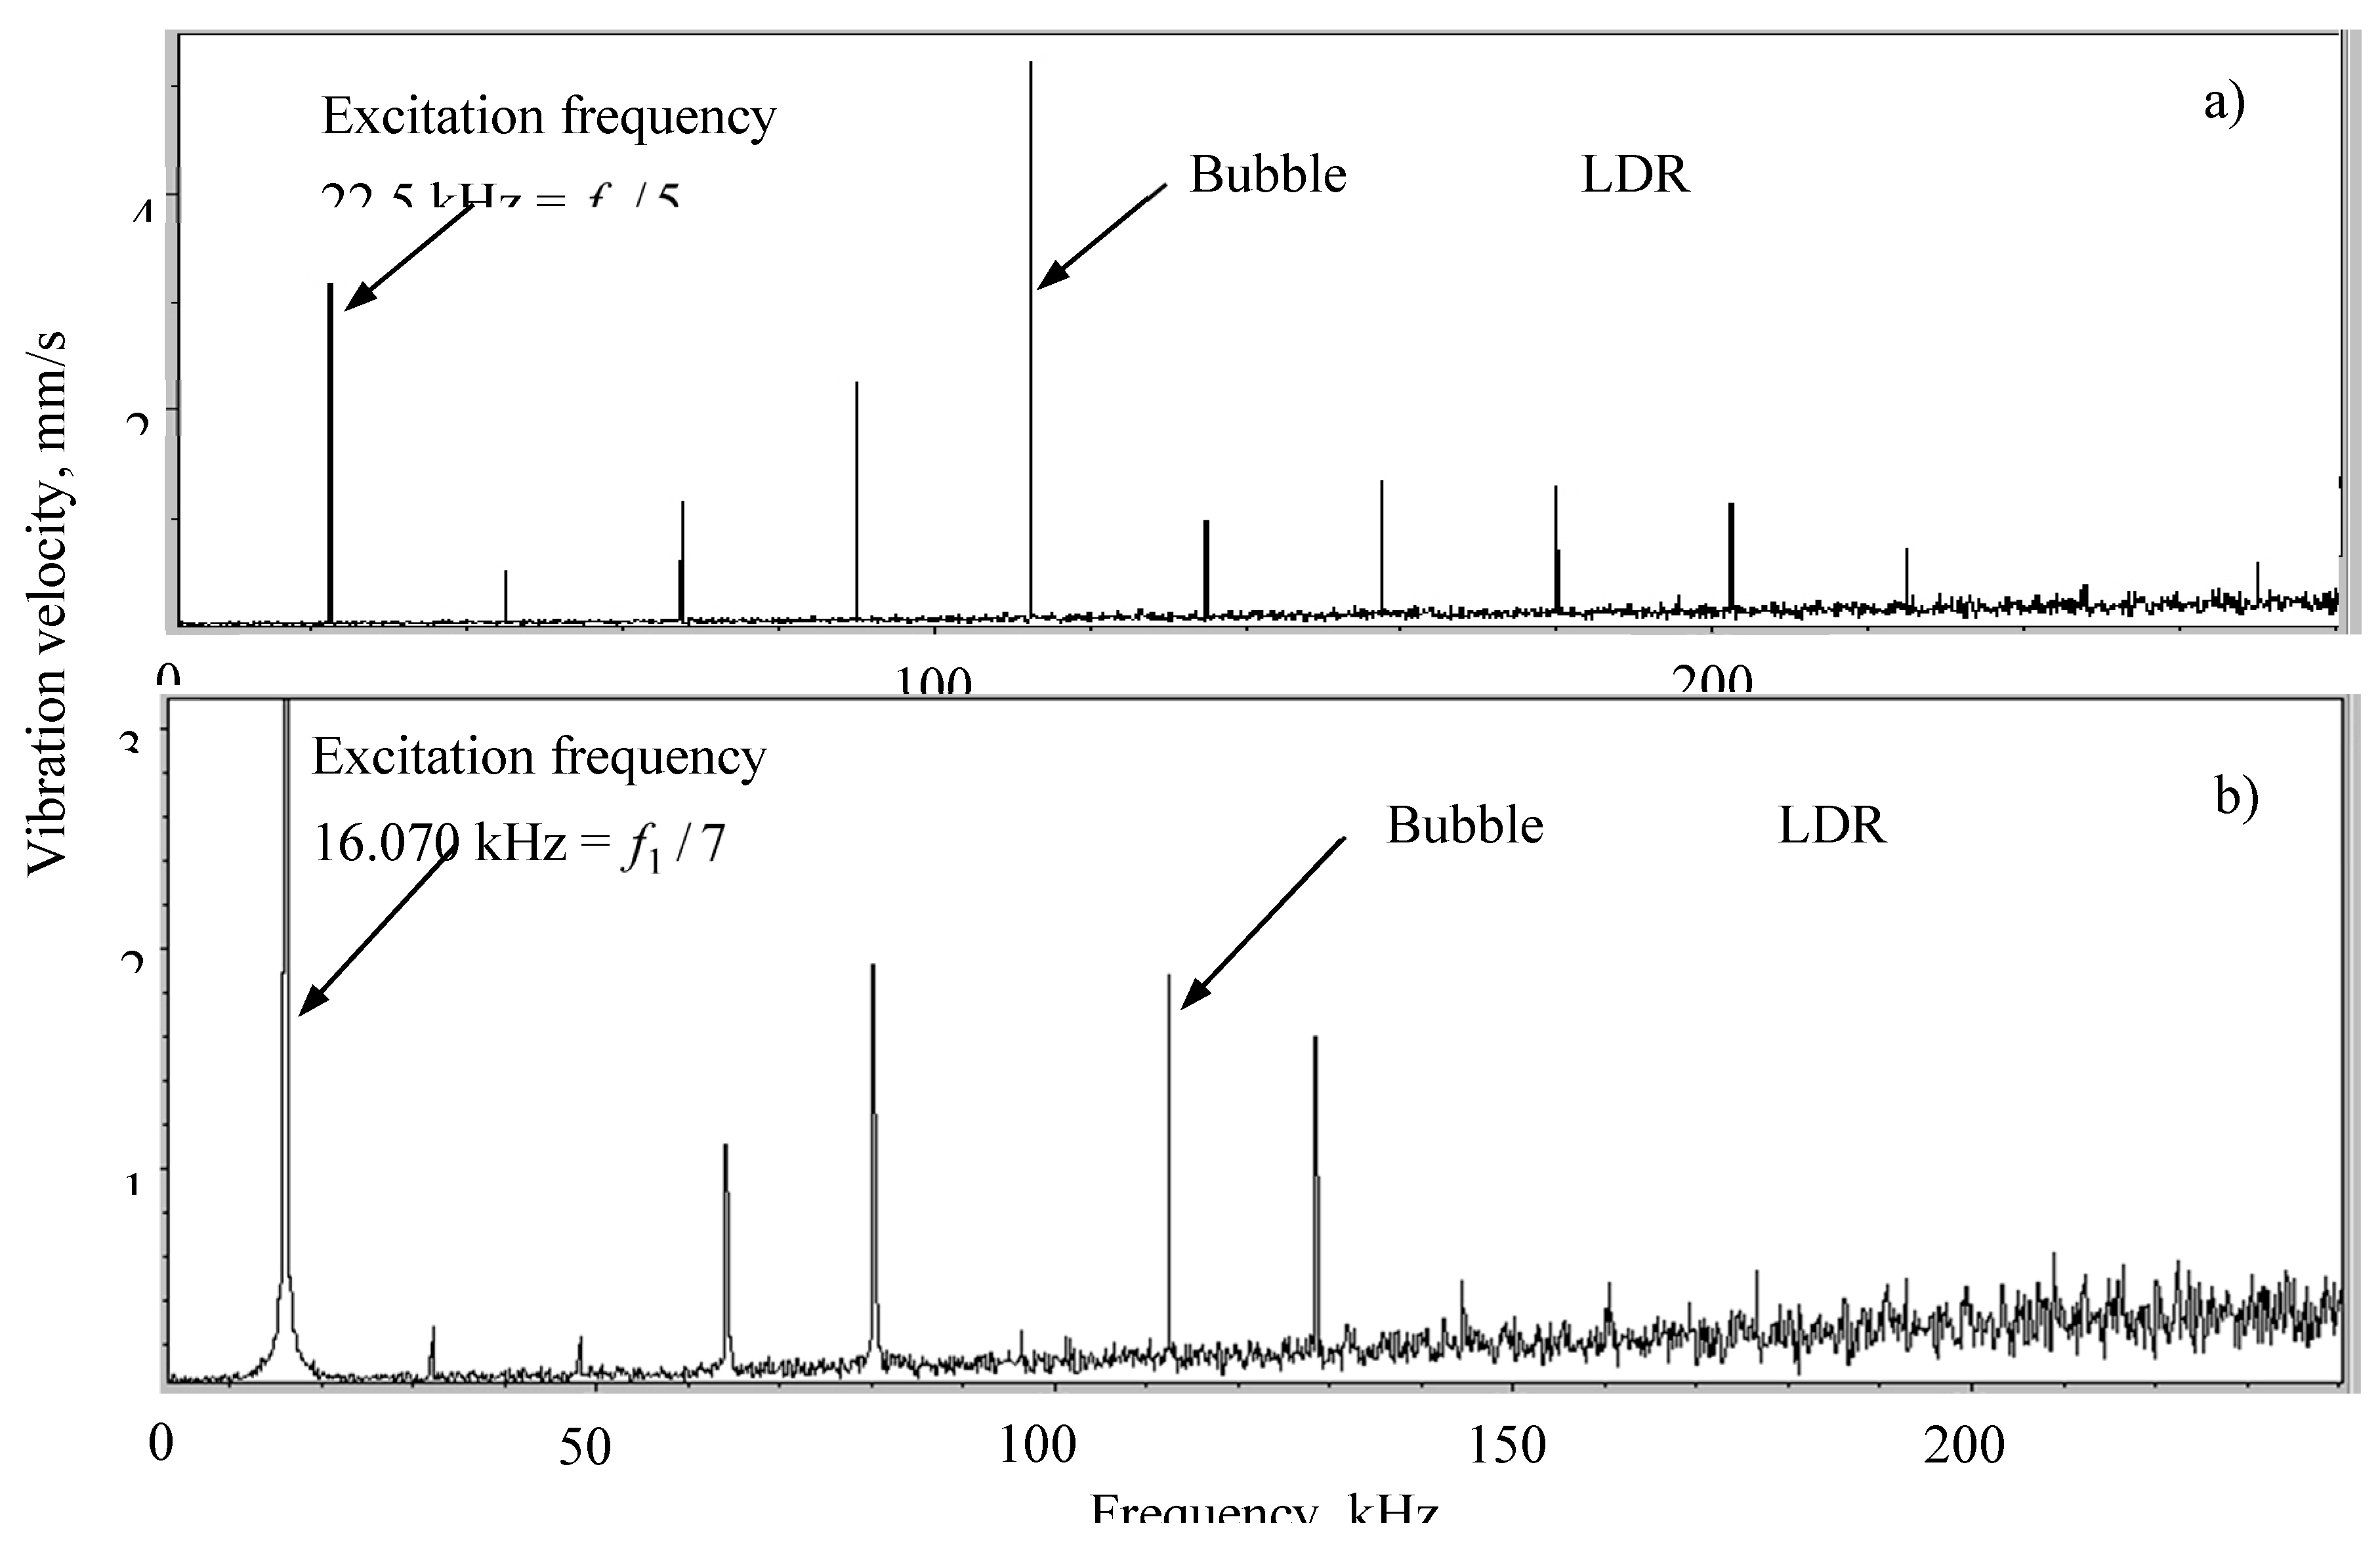
Figure 26.
Nonlinear defect imaging via classical modes: Linear (36.77 kHz, a) and second harmonic (73.53 kHz, b) LDR imaging of a delamination in GFRP specimen; Sum-frequency image of the impact-induced damage (~5x5mm2) in a CFRP plate.
Figure 26.
Nonlinear defect imaging via classical modes: Linear (36.77 kHz, a) and second harmonic (73.53 kHz, b) LDR imaging of a delamination in GFRP specimen; Sum-frequency image of the impact-induced damage (~5x5mm2) in a CFRP plate.
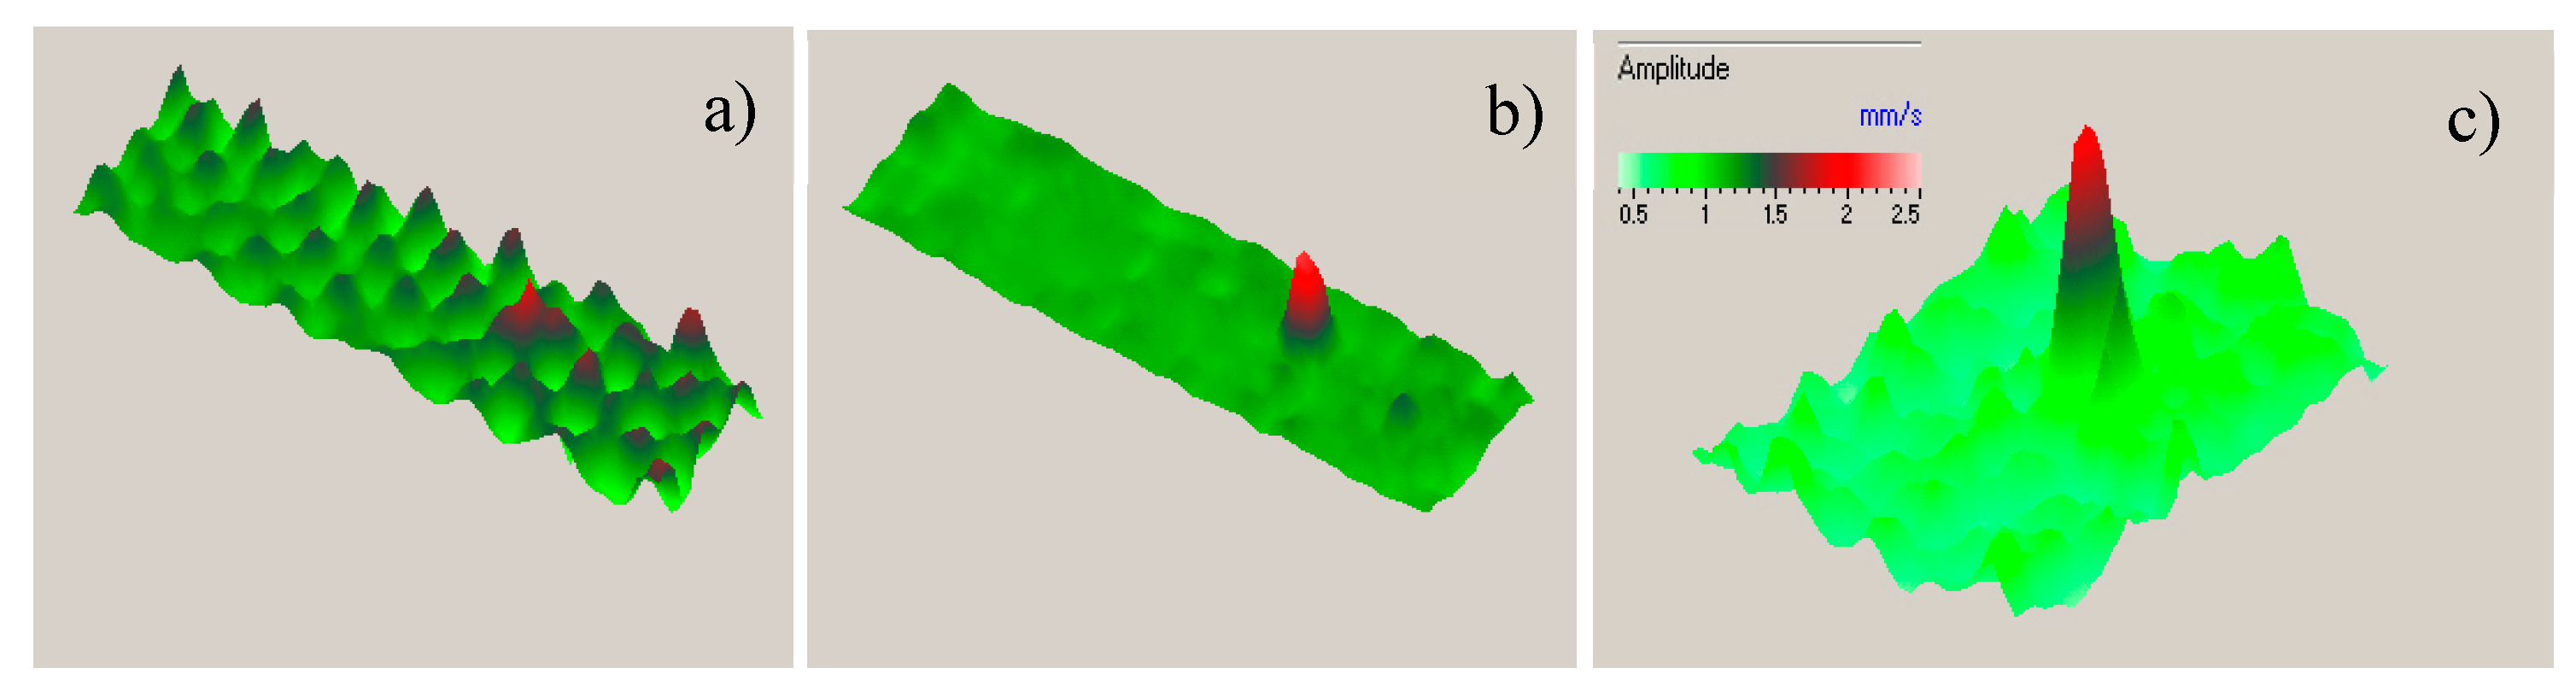
Figure 27.
Imaging of elliptical delamination in GFRP at various-order mixing frequencies for 19 kHz and 20 kHz primary waves.
Figure 27.
Imaging of elliptical delamination in GFRP at various-order mixing frequencies for 19 kHz and 20 kHz primary waves.
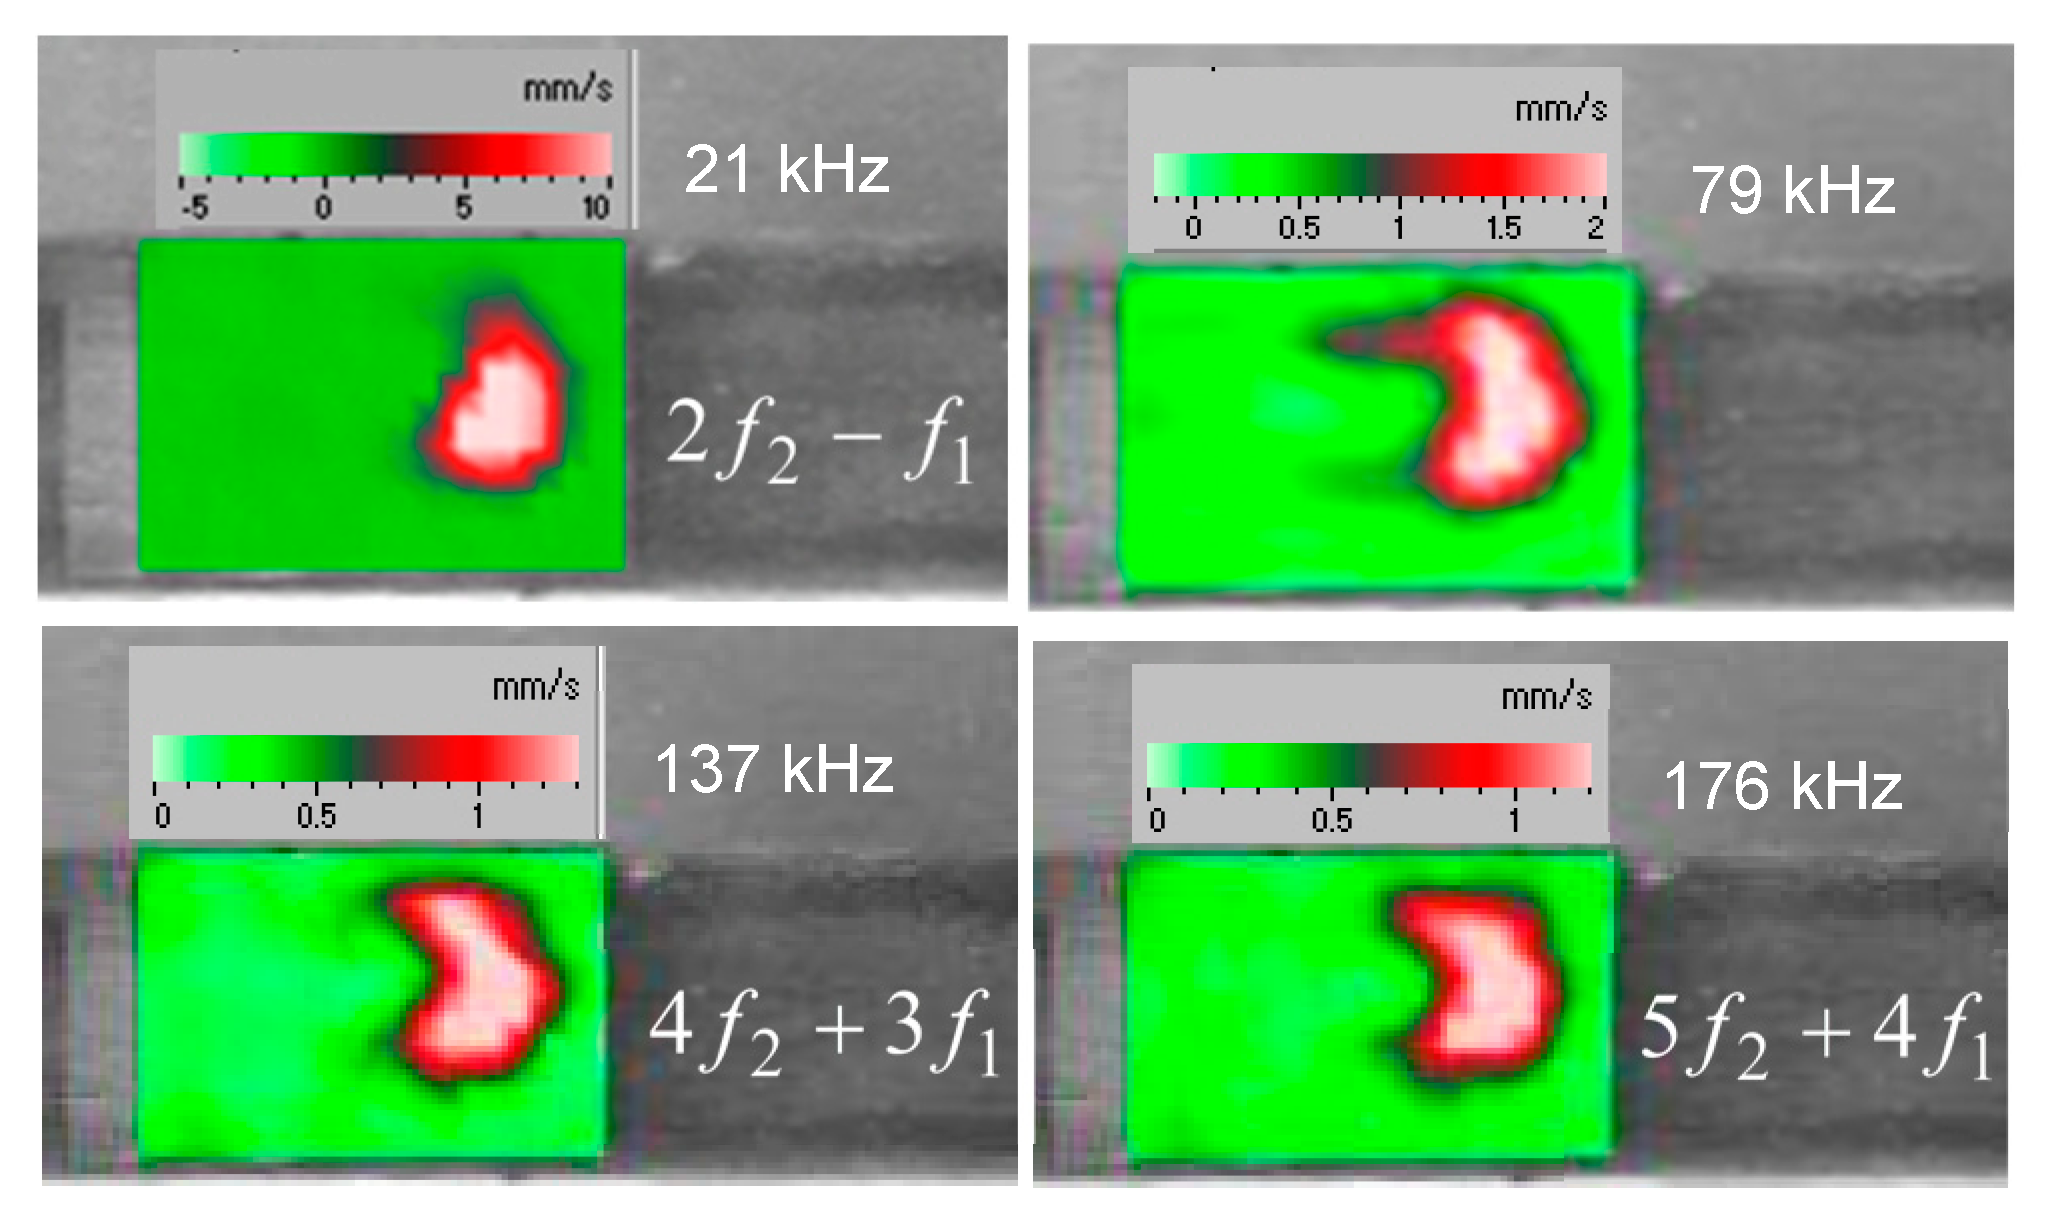
Figure 28.
Subharmonic LDR imaging of impact damage in a CFRP plate: Input 10250 Hz; output 5125 Hz.
Figure 28.
Subharmonic LDR imaging of impact damage in a CFRP plate: Input 10250 Hz; output 5125 Hz.
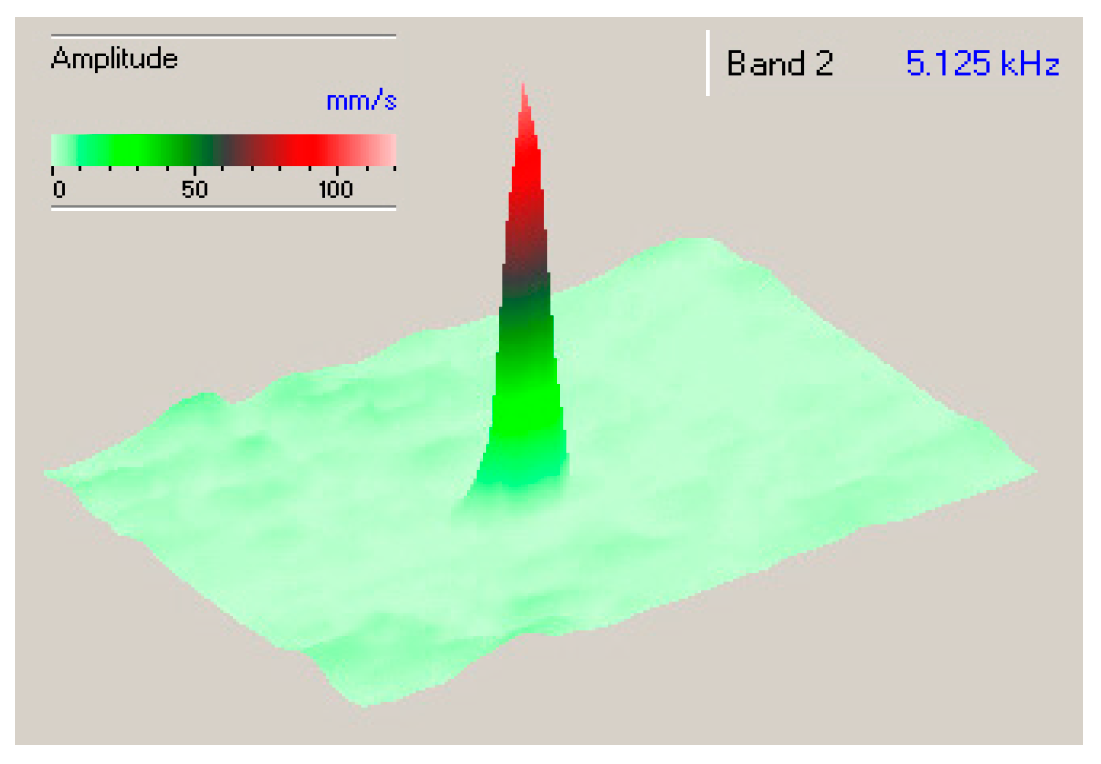
Figure 29.
Temperature pattern generated by LDR vibrations in a circular FBH.
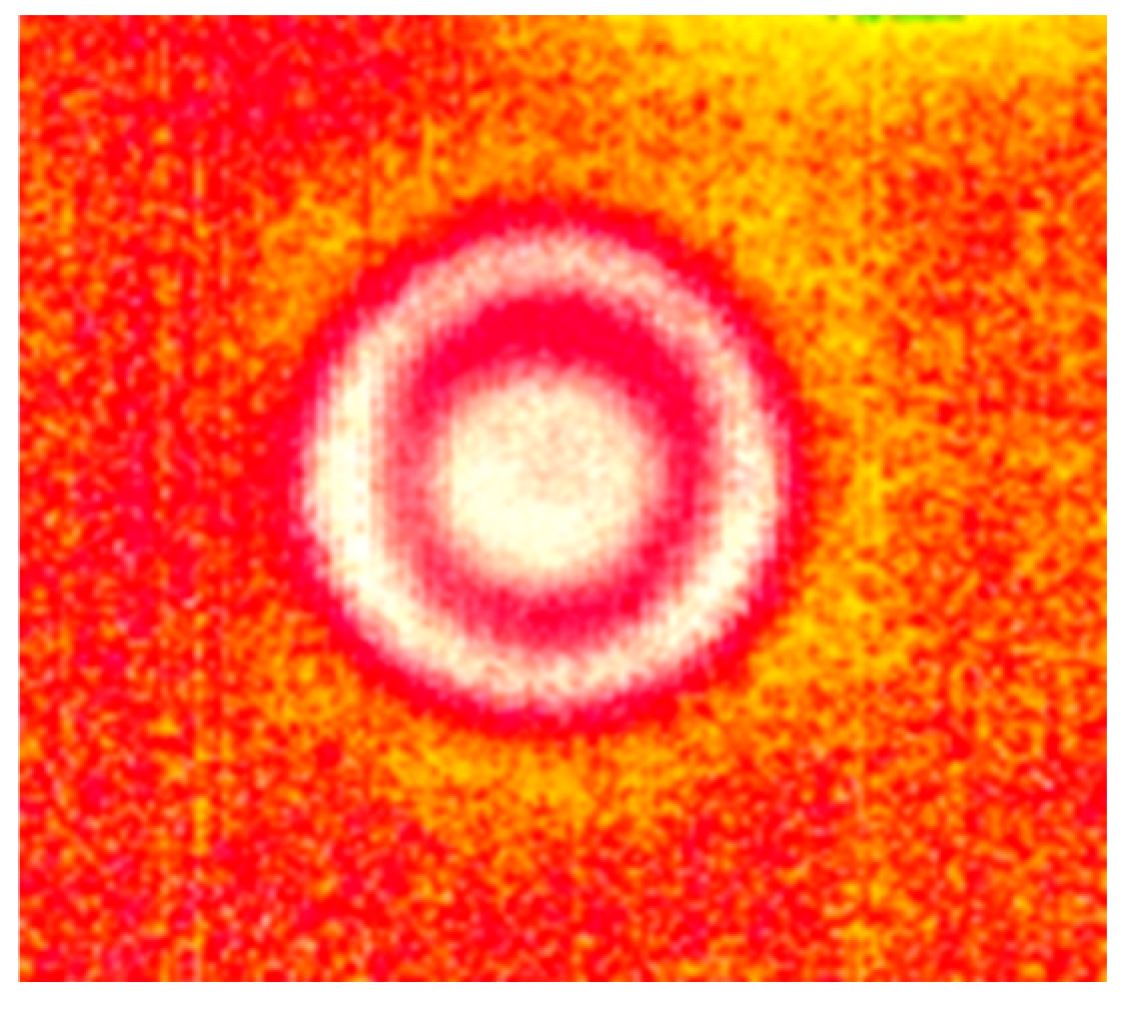
Figure 31.
Temperature patterns generated by LDR vibrations in a circular FBH: measured and calculated from Eq. (30).
Figure 31.
Temperature patterns generated by LDR vibrations in a circular FBH: measured and calculated from Eq. (30).
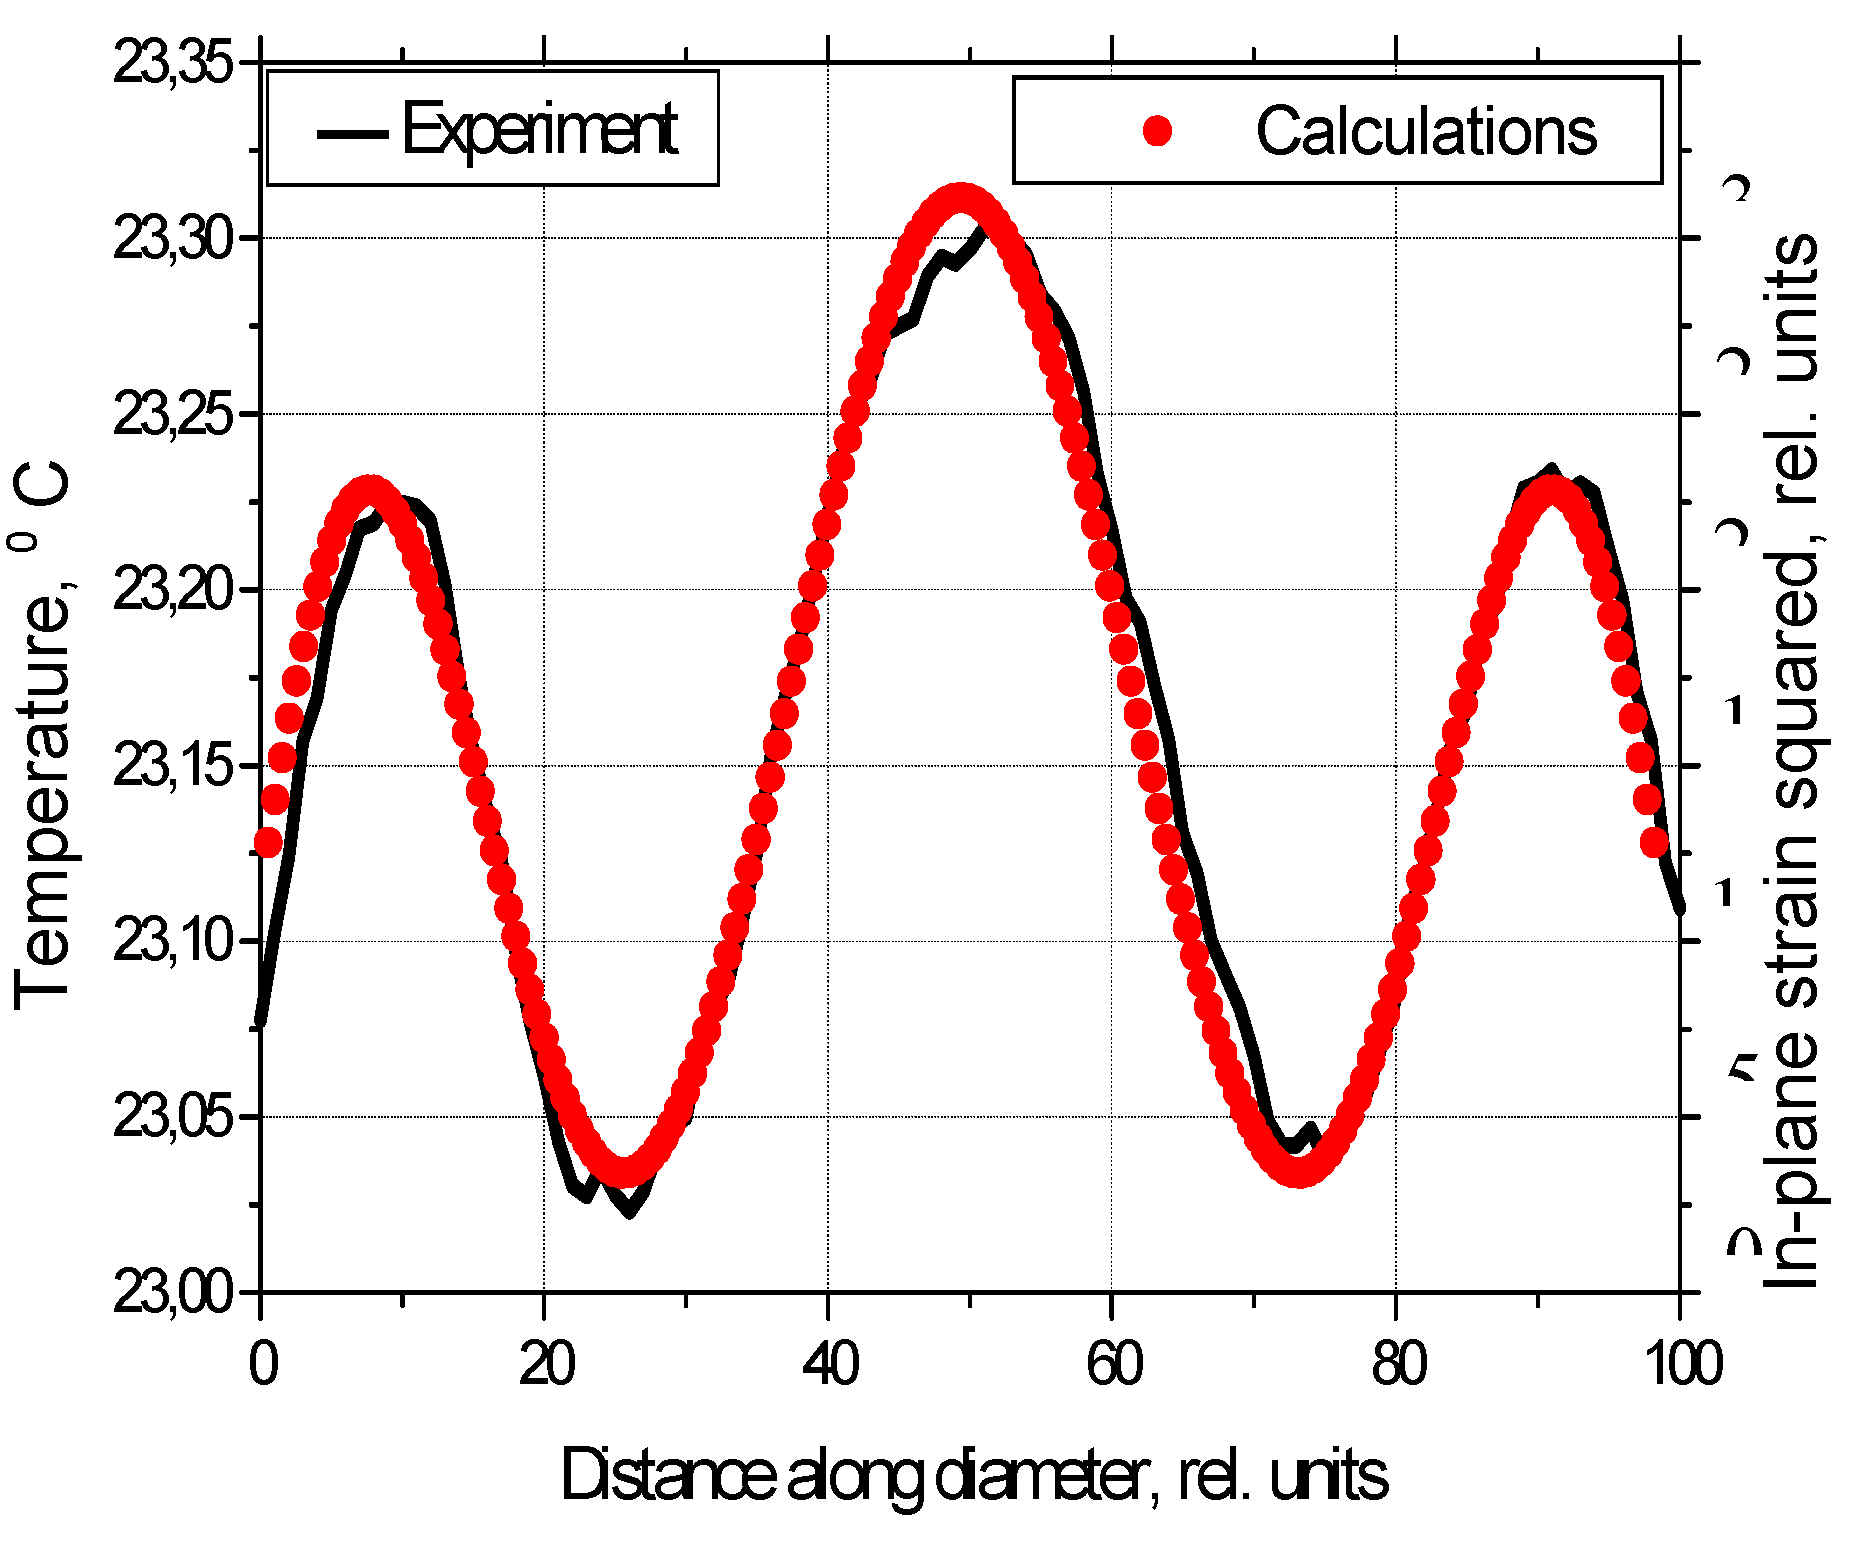
Figure 32.
Temperature response of FBH as a function of input acoustic power at LDR frequency 11 kHz.
Figure 32.
Temperature response of FBH as a function of input acoustic power at LDR frequency 11 kHz.
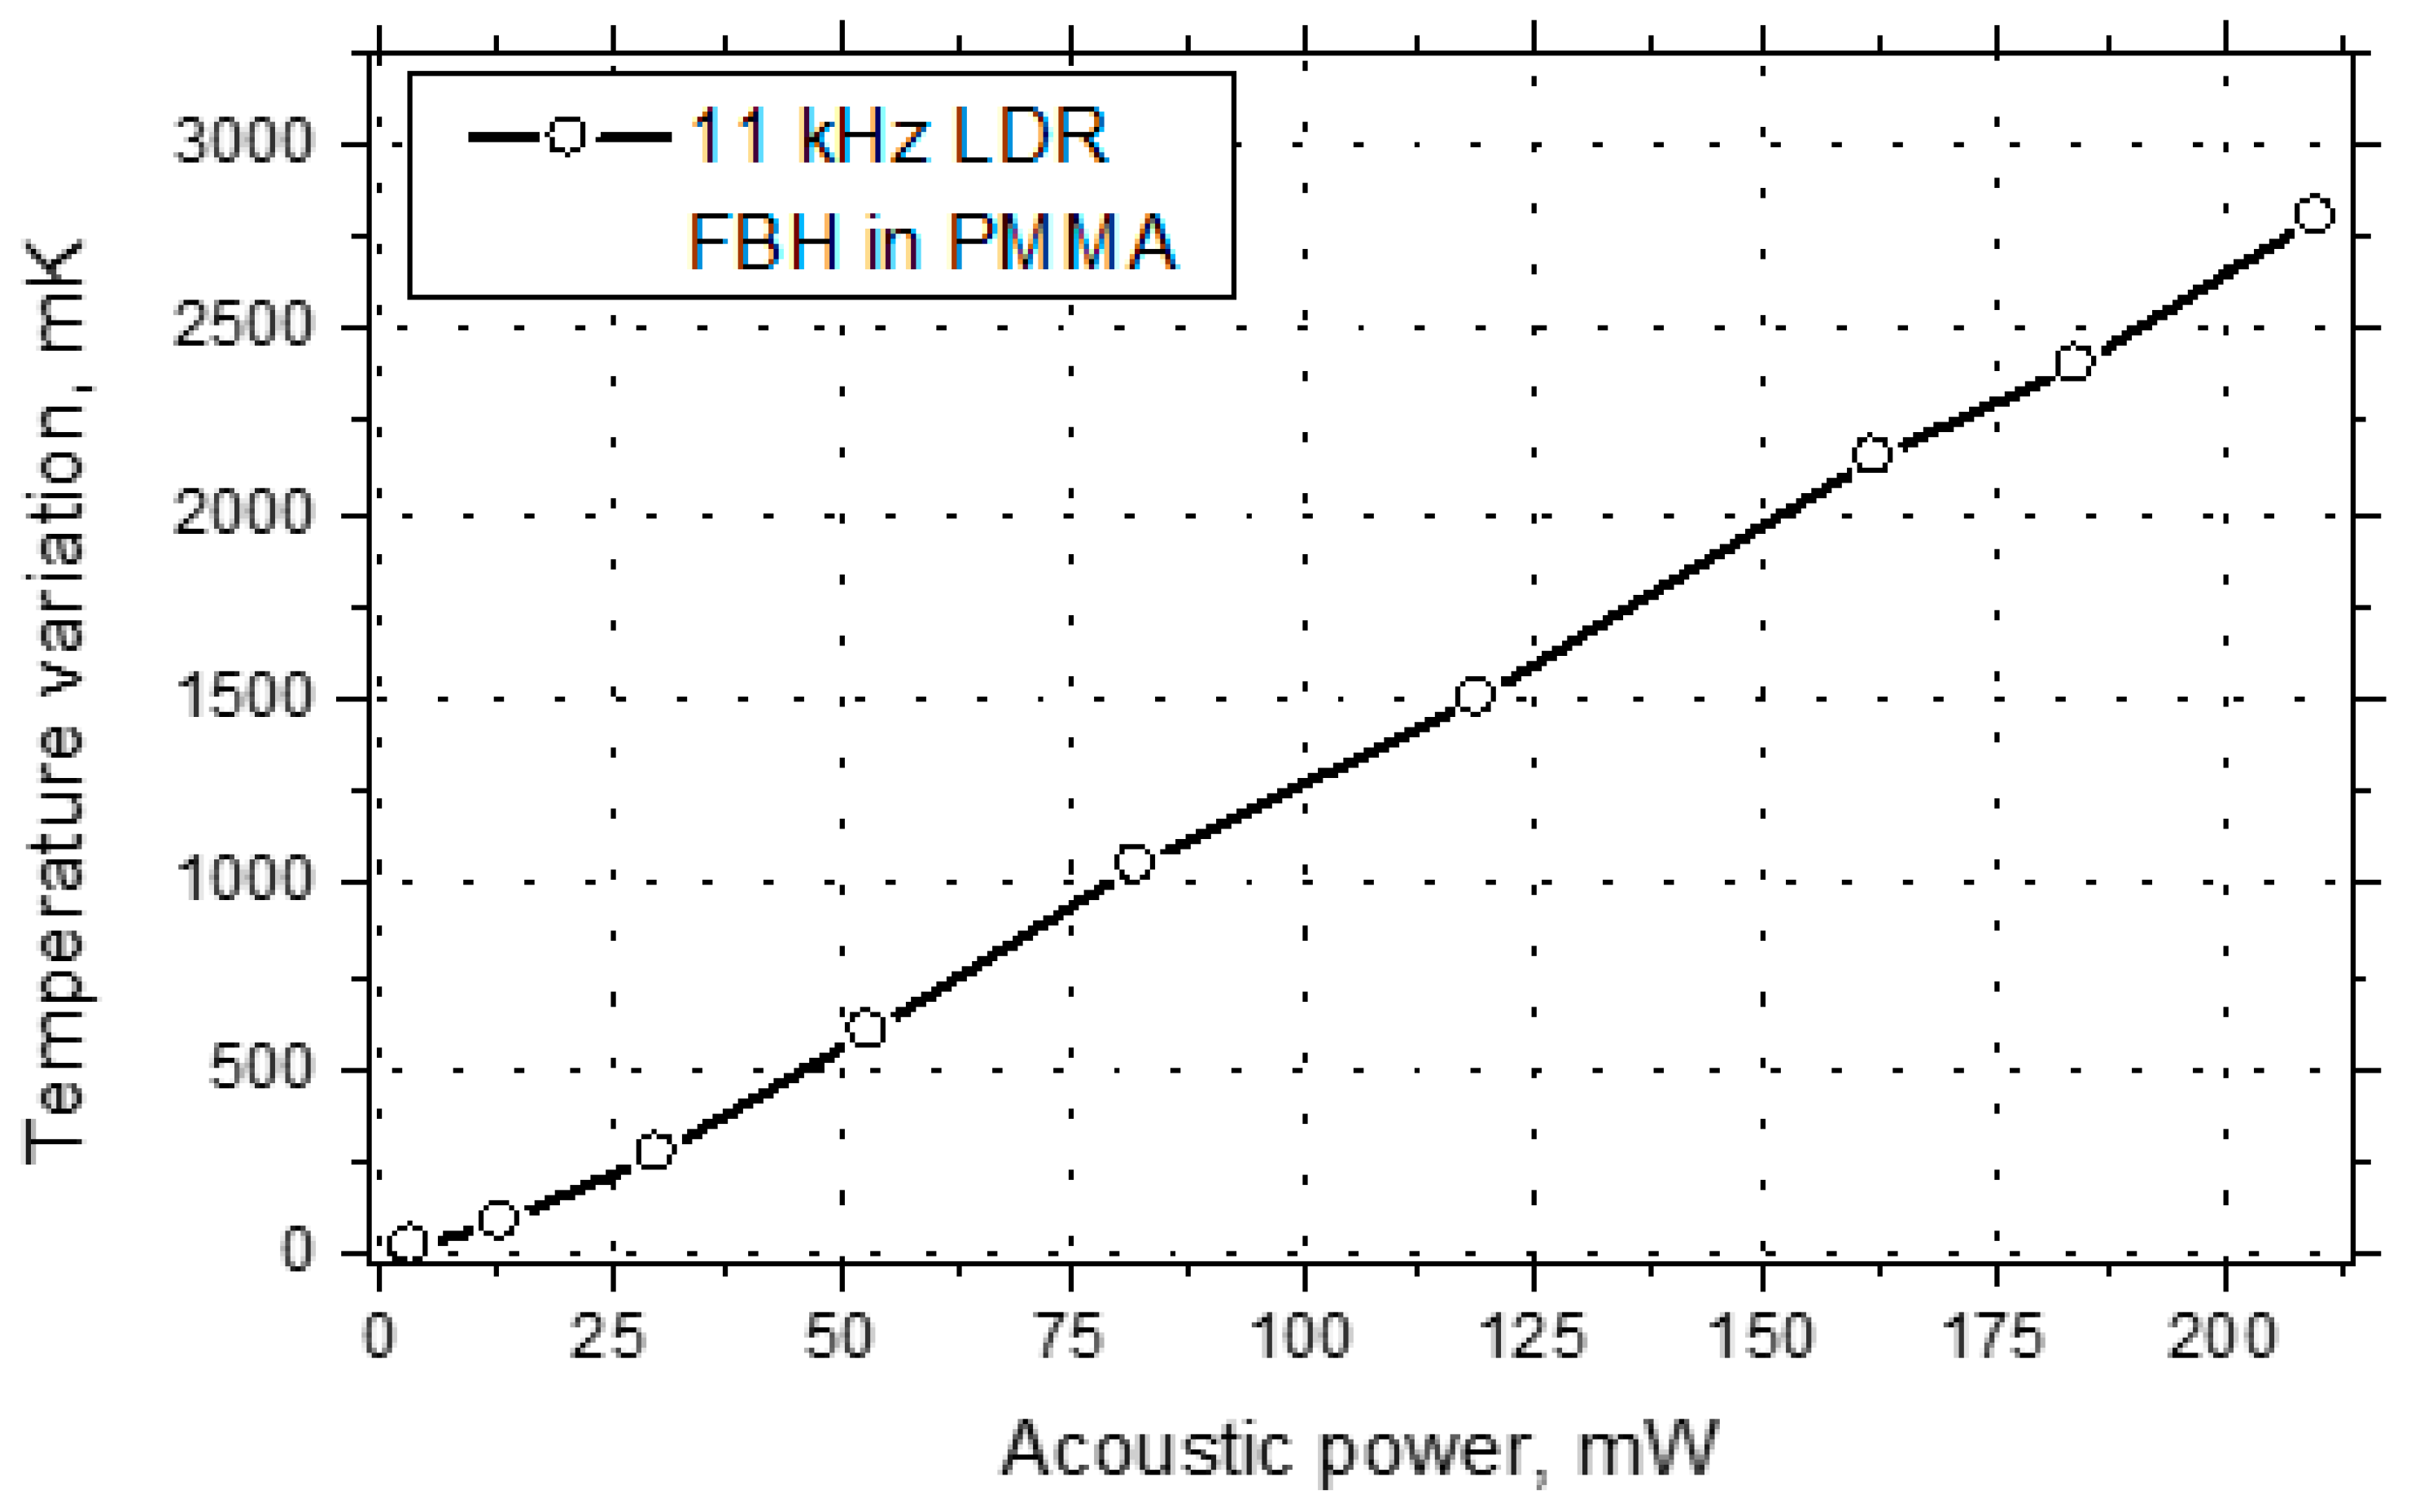
Figure 33.
Temperature and acoustic response squared for FBH as a function of driving frequency.
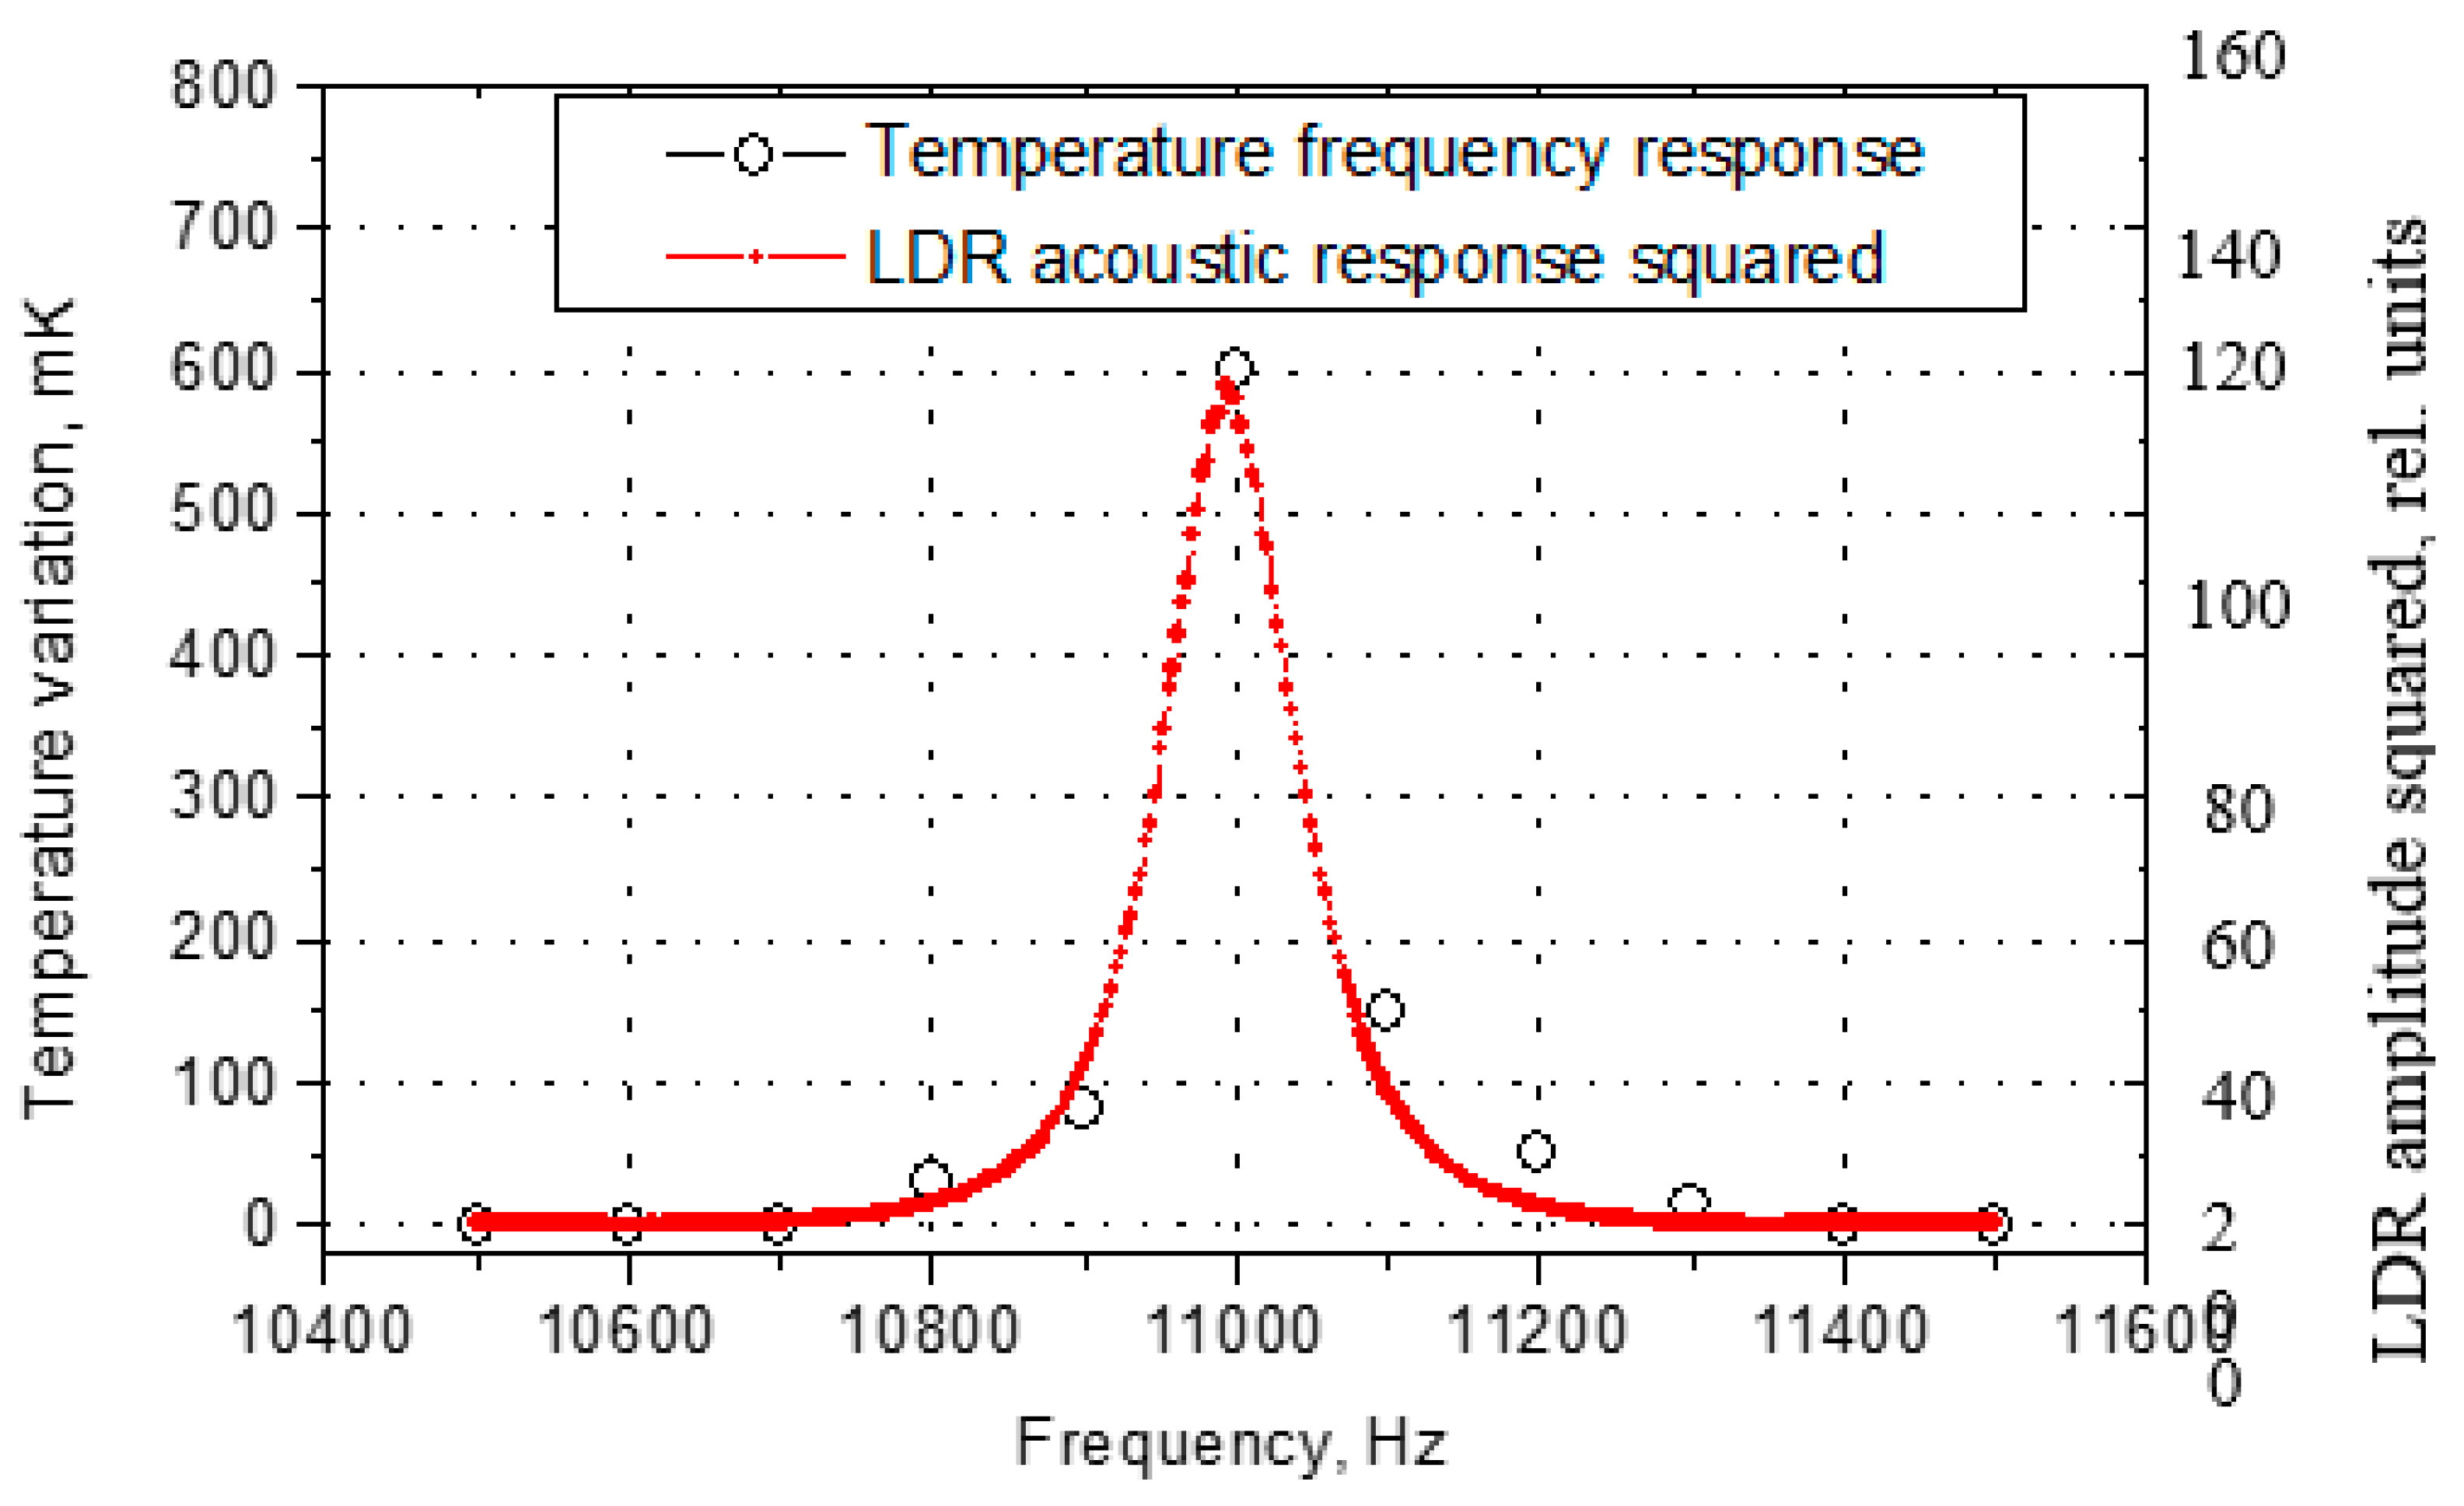
Figure 34.
Temperature response of a rectangular insert in CFRP plate at LDR frequency (8980 Hz, upper curve) and outside LDR (lower curve, 8000 Hz).
Figure 34.
Temperature response of a rectangular insert in CFRP plate at LDR frequency (8980 Hz, upper curve) and outside LDR (lower curve, 8000 Hz).
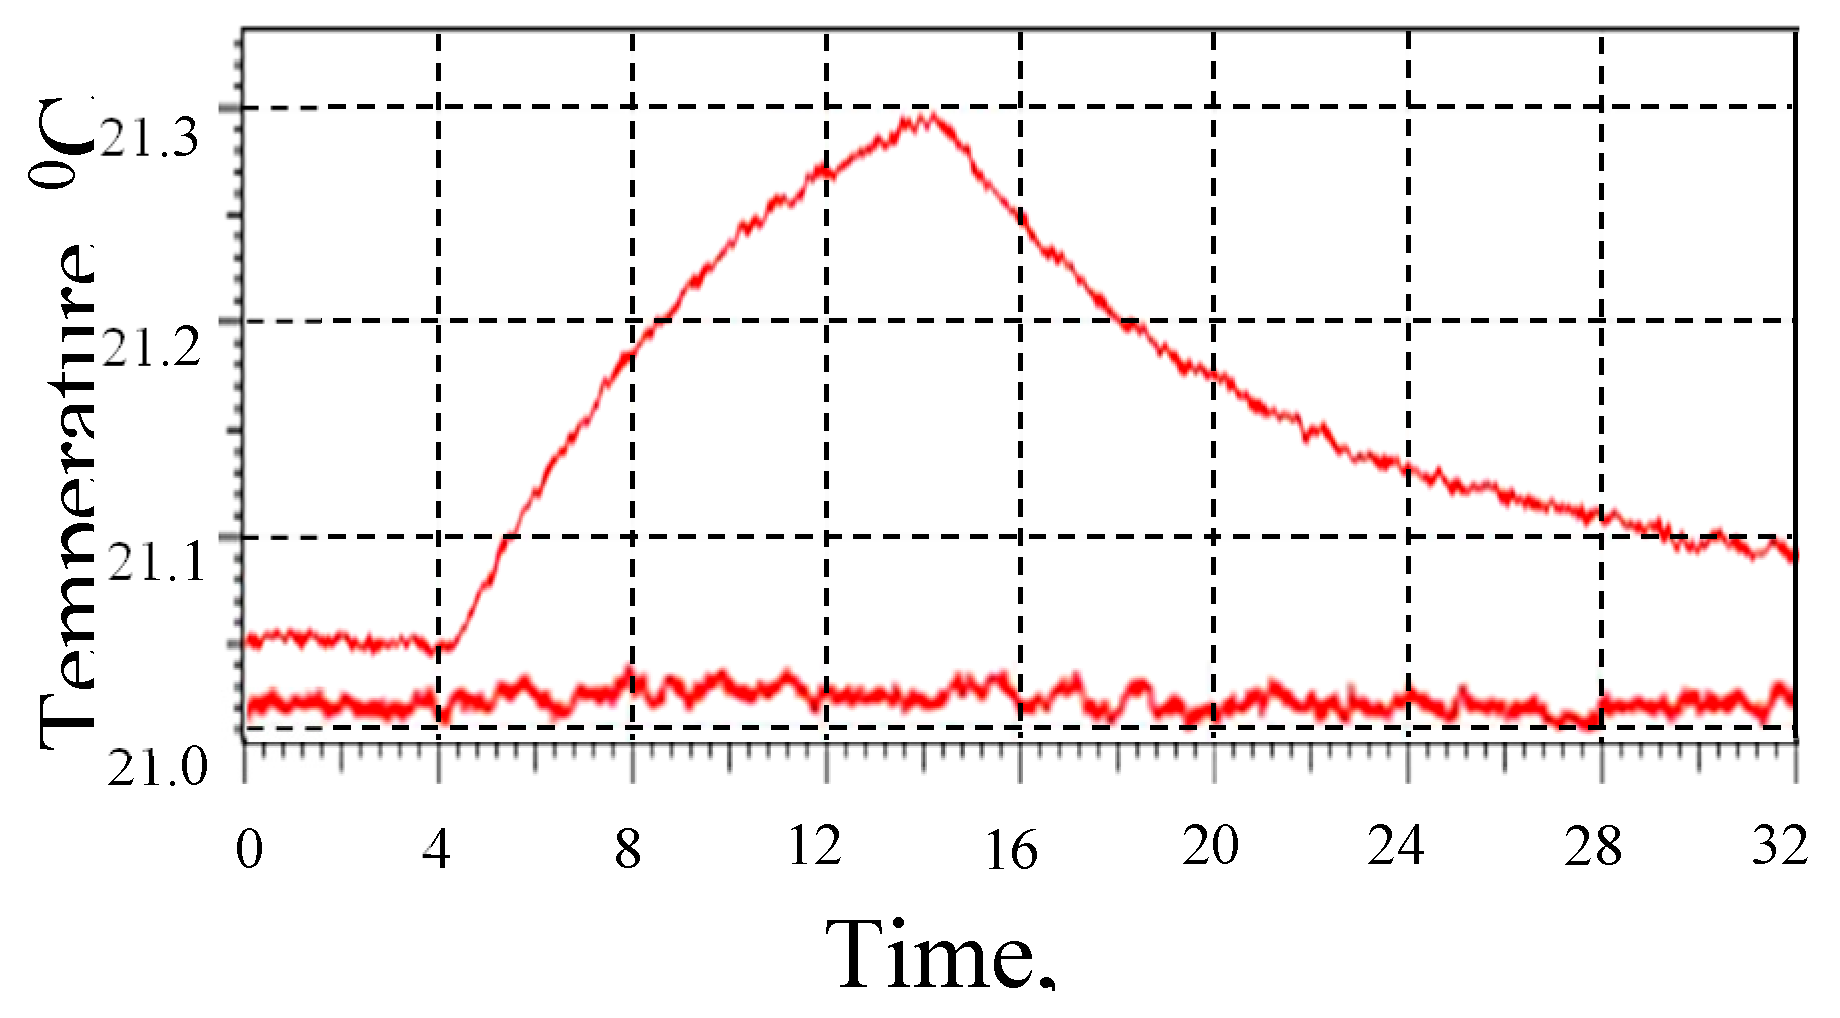
Figure 35.
Laser vibrometry (a, b) and thermosonic (c, d) images of a rectangular insert in CFRP plate at fundamental LDR frequency (8980 Hz, (a, c)) and at higher-order LDR (15600Hz, (b, d)).
Figure 35.
Laser vibrometry (a, b) and thermosonic (c, d) images of a rectangular insert in CFRP plate at fundamental LDR frequency (8980 Hz, (a, c)) and at higher-order LDR (15600Hz, (b, d)).
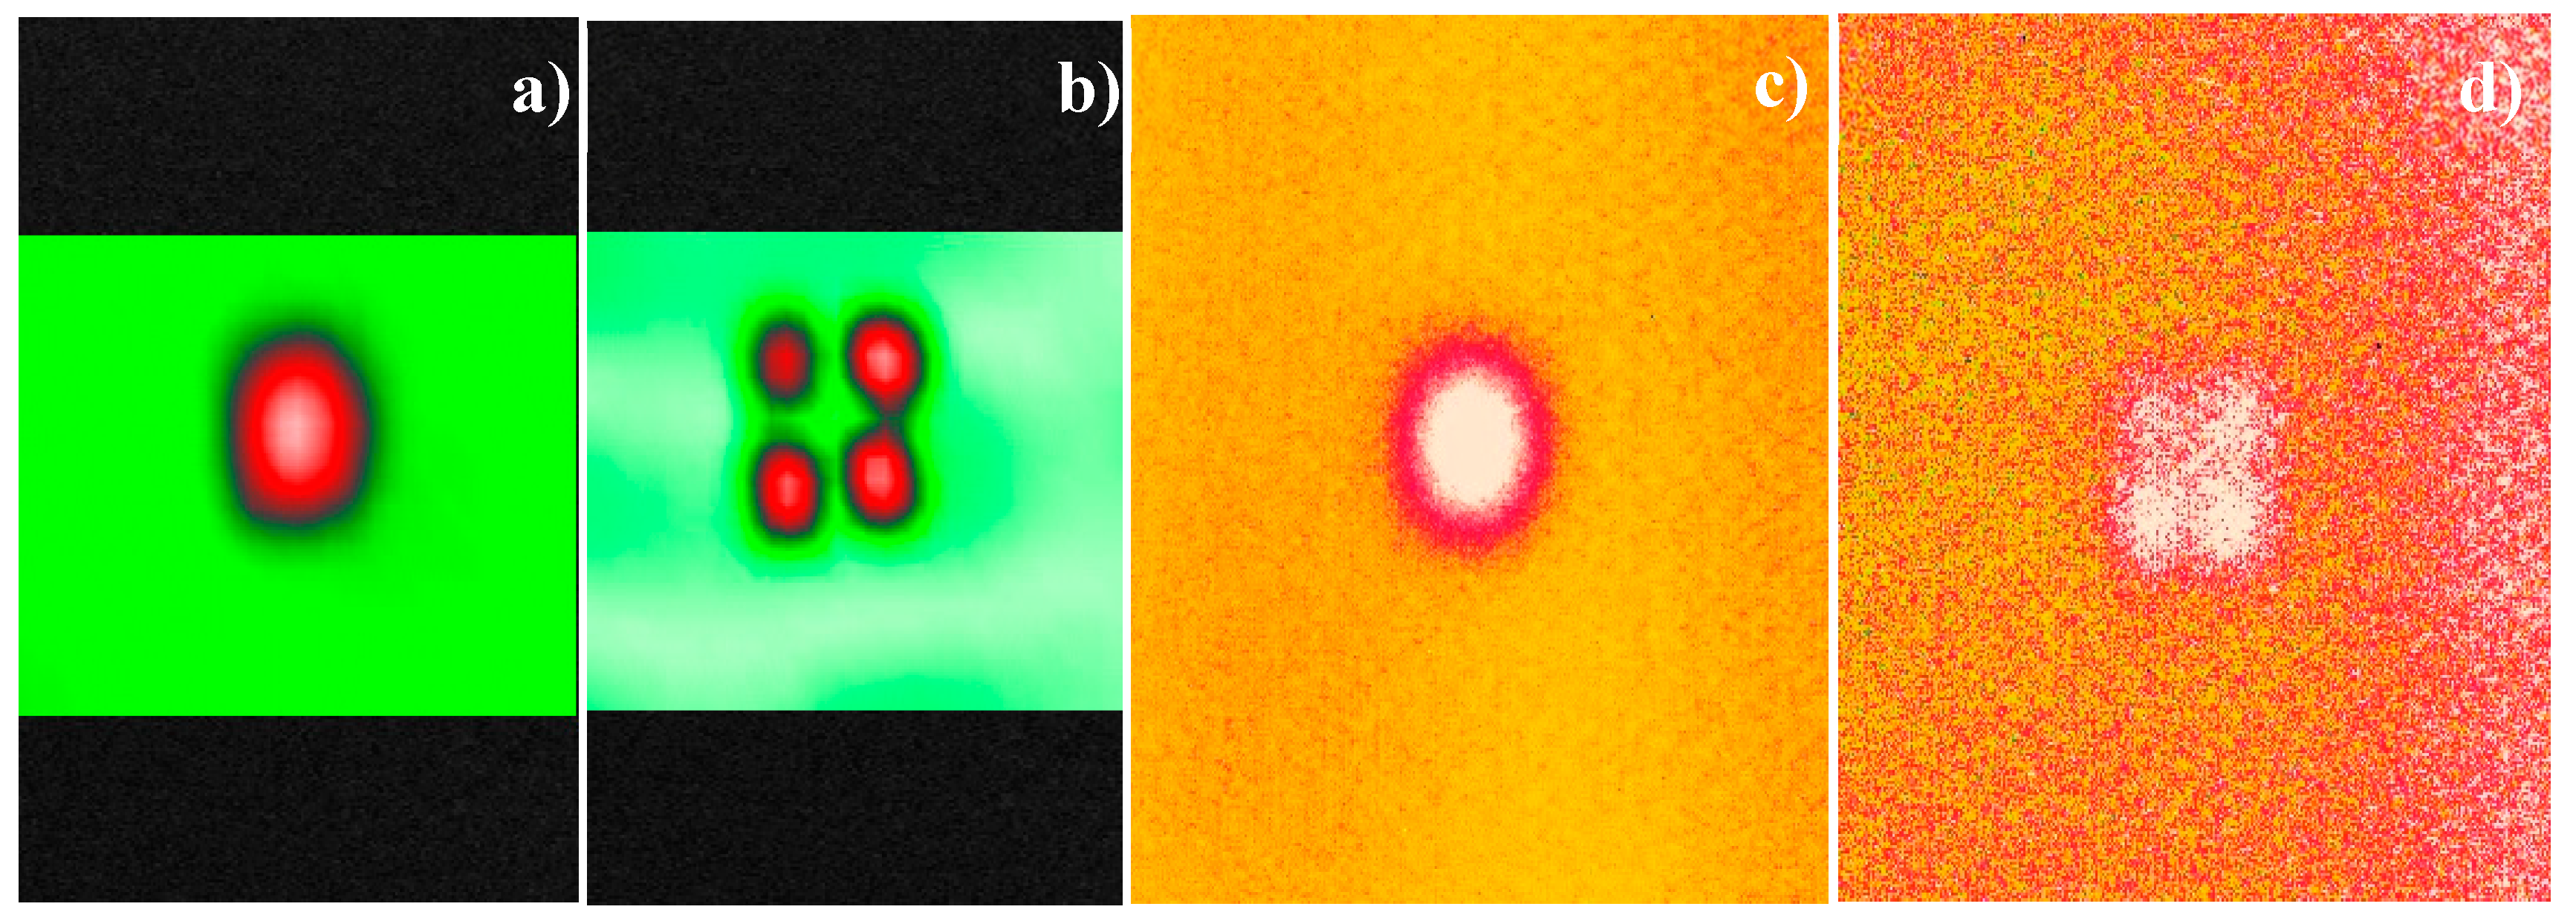
Figure 36.
Laser vibrometry (b) and LDR thermography (c) imaging of fatigue crack between the rivet holes (dotted area in zoomed optical image (a)) in aluminum aviation component.
Figure 36.
Laser vibrometry (b) and LDR thermography (c) imaging of fatigue crack between the rivet holes (dotted area in zoomed optical image (a)) in aluminum aviation component.
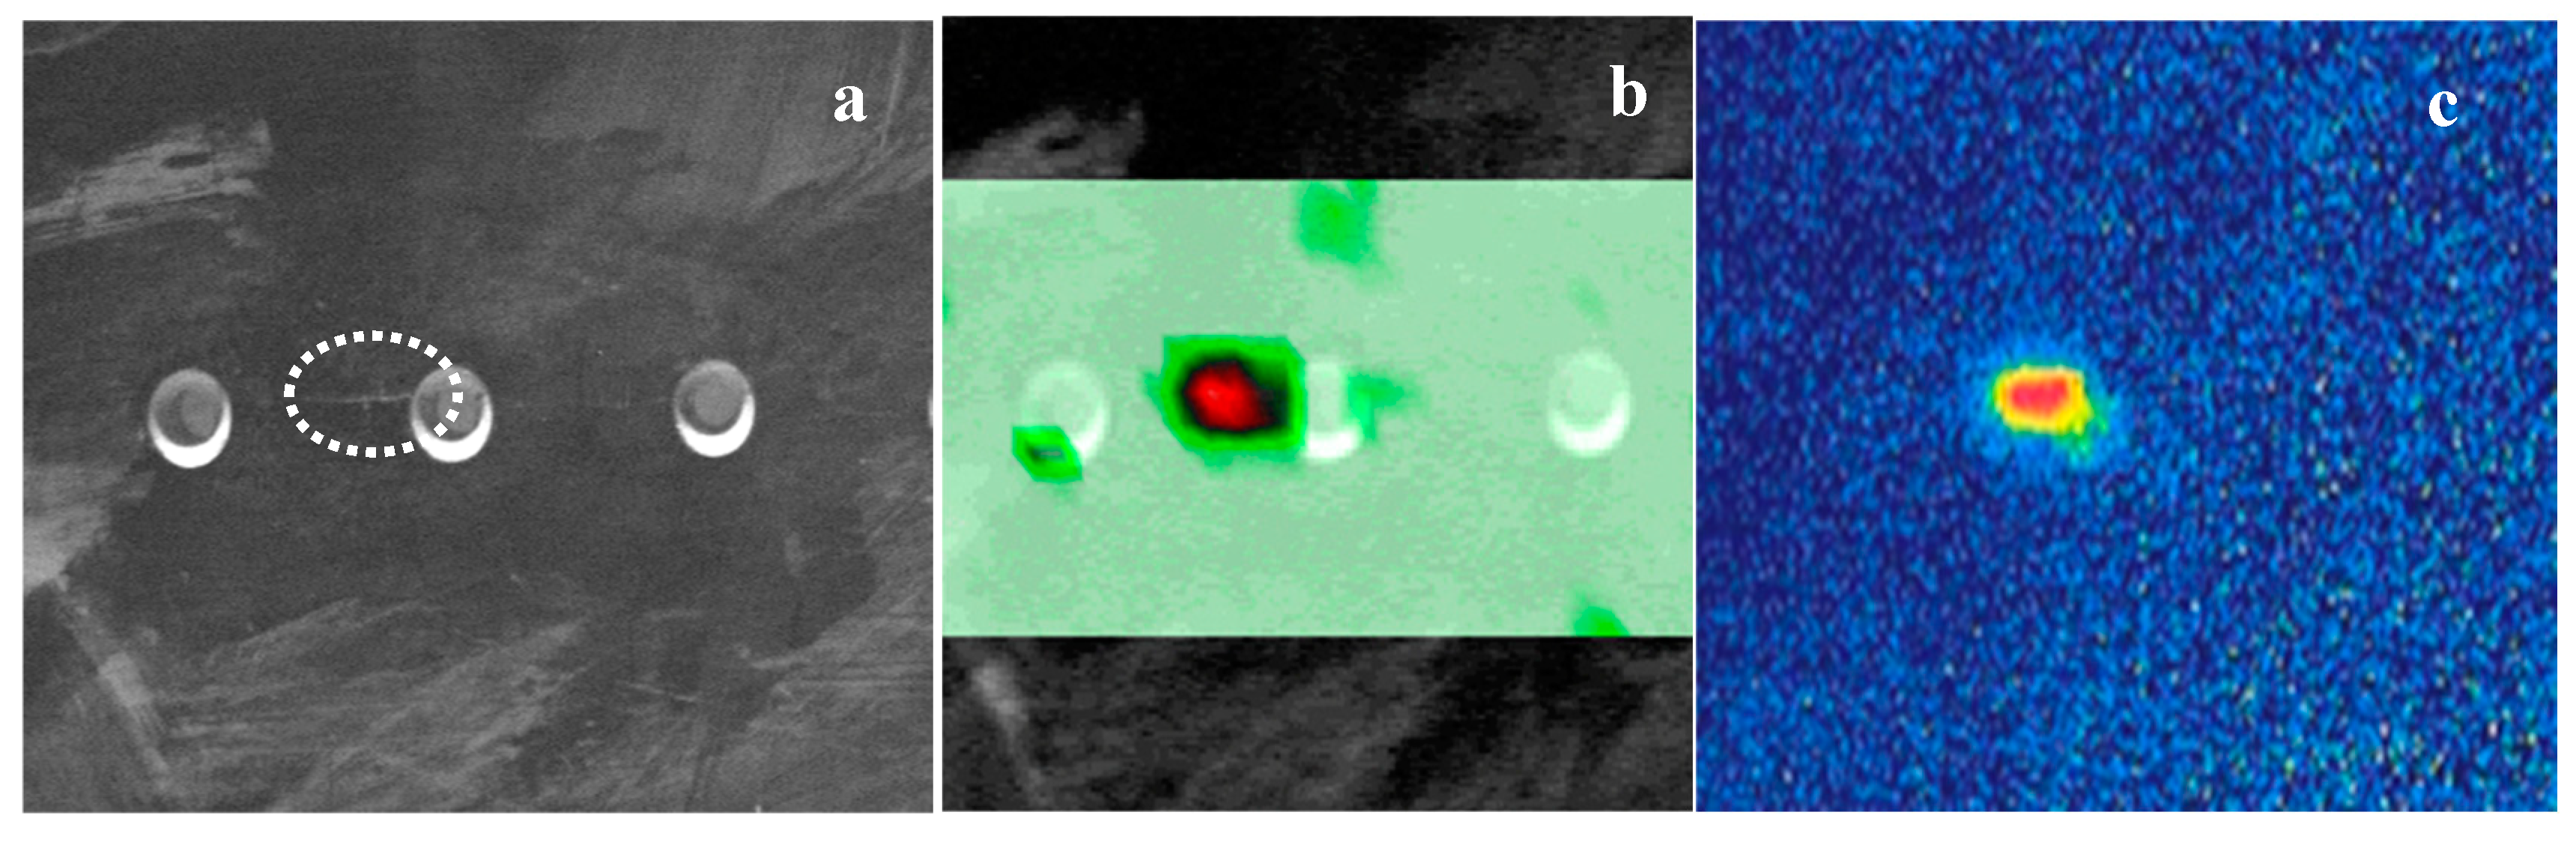
Figure 37.
LDR thermosonic imaging of ~(5x5 mm2) impact damage area in a CFRP plate (b); quantified temperature contrast of the image (a).
Figure 37.
LDR thermosonic imaging of ~(5x5 mm2) impact damage area in a CFRP plate (b); quantified temperature contrast of the image (a).
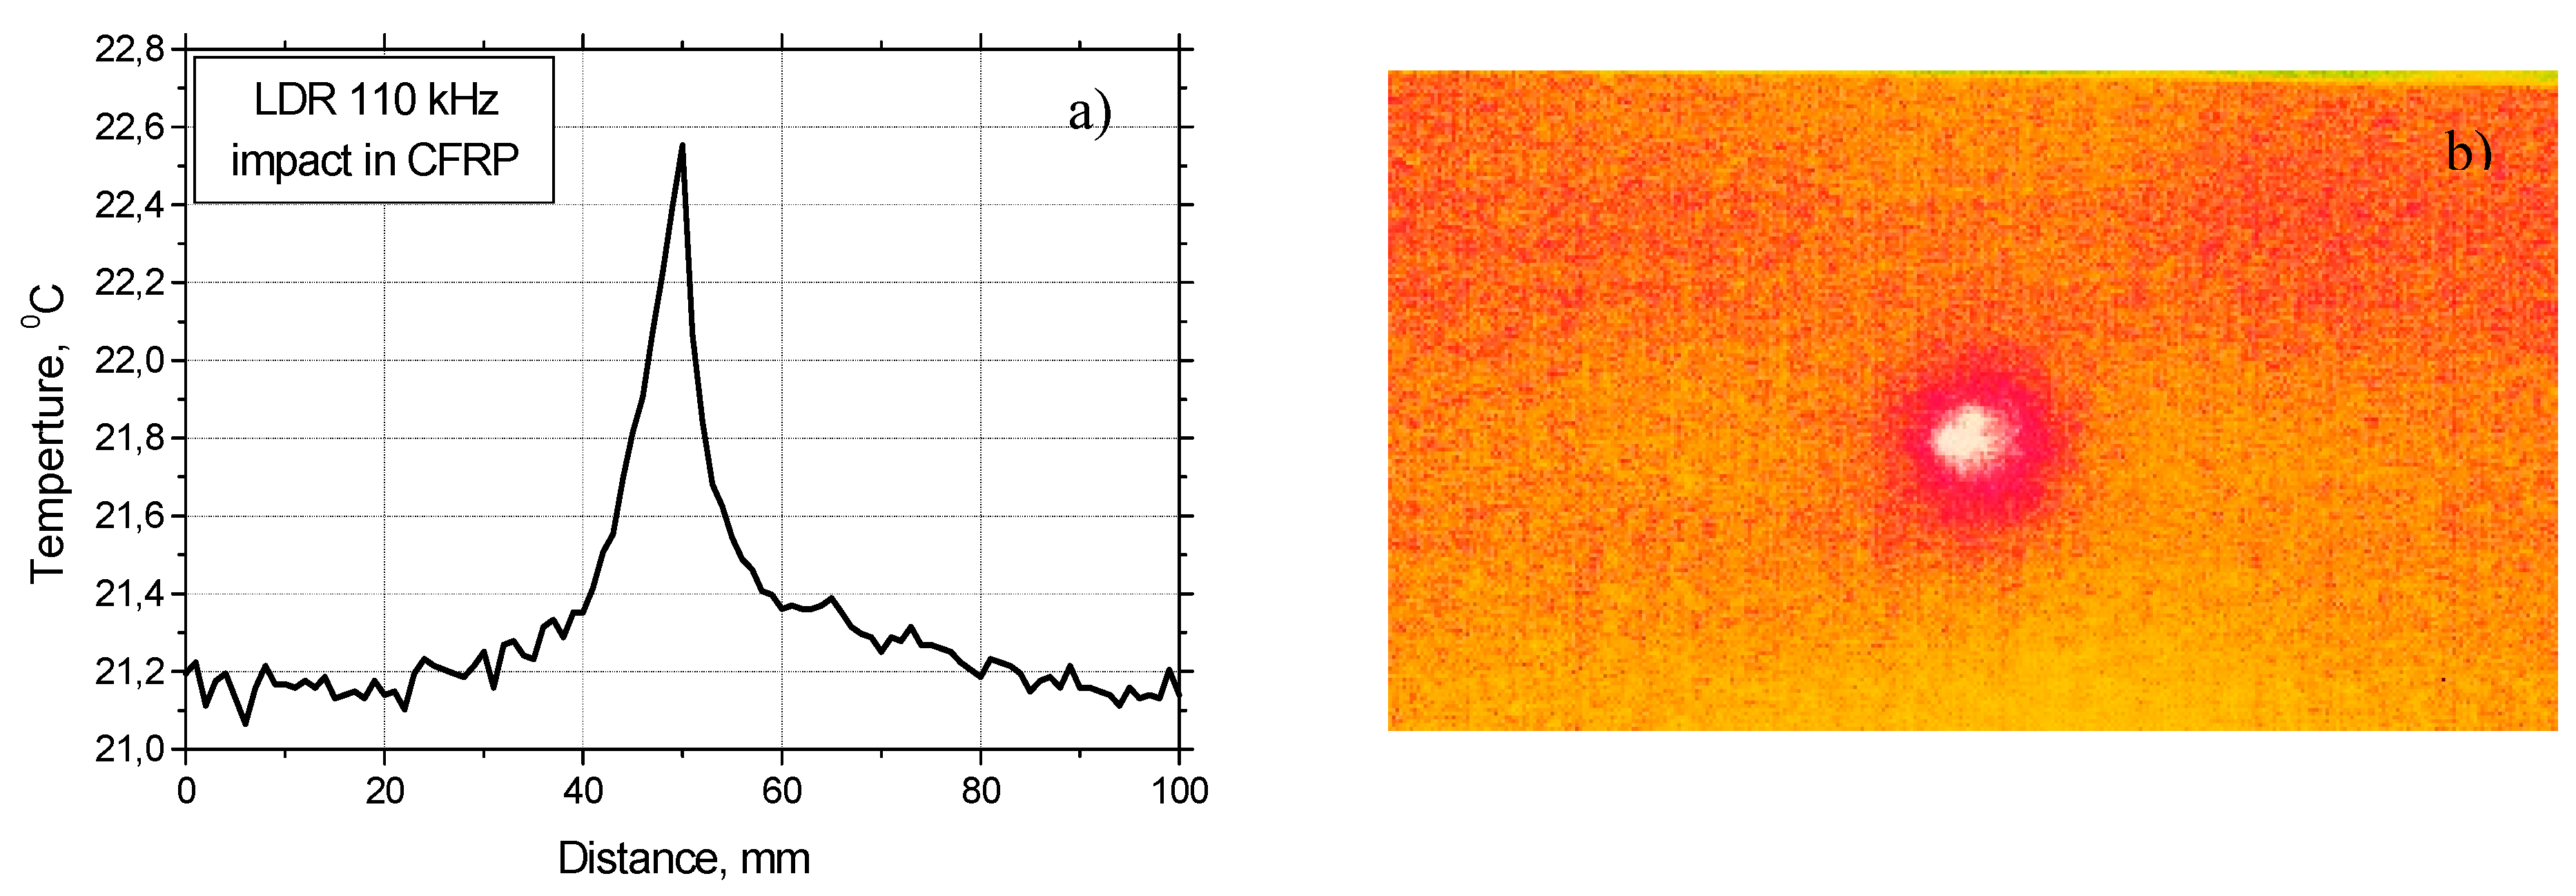
Figure 38.
LDR thermosonic imaging of FBH in PMMA plate at LDR frequency 7670 Hz: (a) - amplitude lock-in (lock-in frequency 0.05 Hz) image (acoustic input ~200 W); (b) – temperature image at input power ~ 2 mW.
Figure 38.
LDR thermosonic imaging of FBH in PMMA plate at LDR frequency 7670 Hz: (a) - amplitude lock-in (lock-in frequency 0.05 Hz) image (acoustic input ~200 W); (b) – temperature image at input power ~ 2 mW.
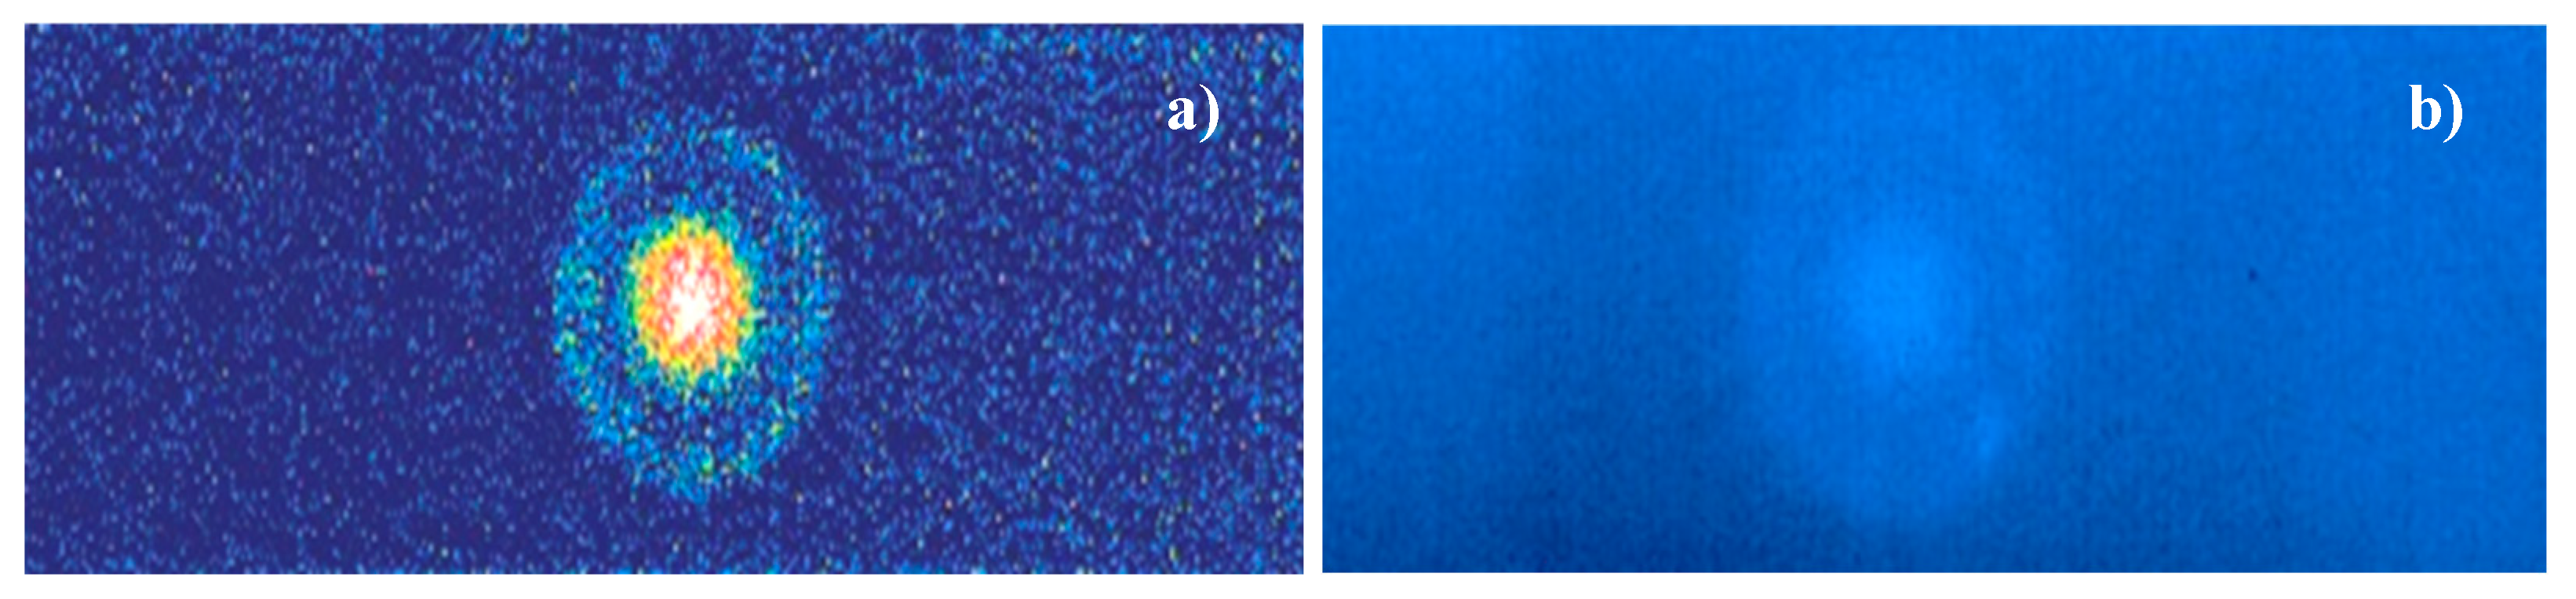
Figure 39.
LDR thermosonic imaging of an impact (~5x5 mm2) in CFRP plate: amplitude lock-in image (a) at ~ 1mW input acoustic power; (b) – temperature image at ~16 mW input power.
Figure 39.
LDR thermosonic imaging of an impact (~5x5 mm2) in CFRP plate: amplitude lock-in image (a) at ~ 1mW input acoustic power; (b) – temperature image at ~16 mW input power.
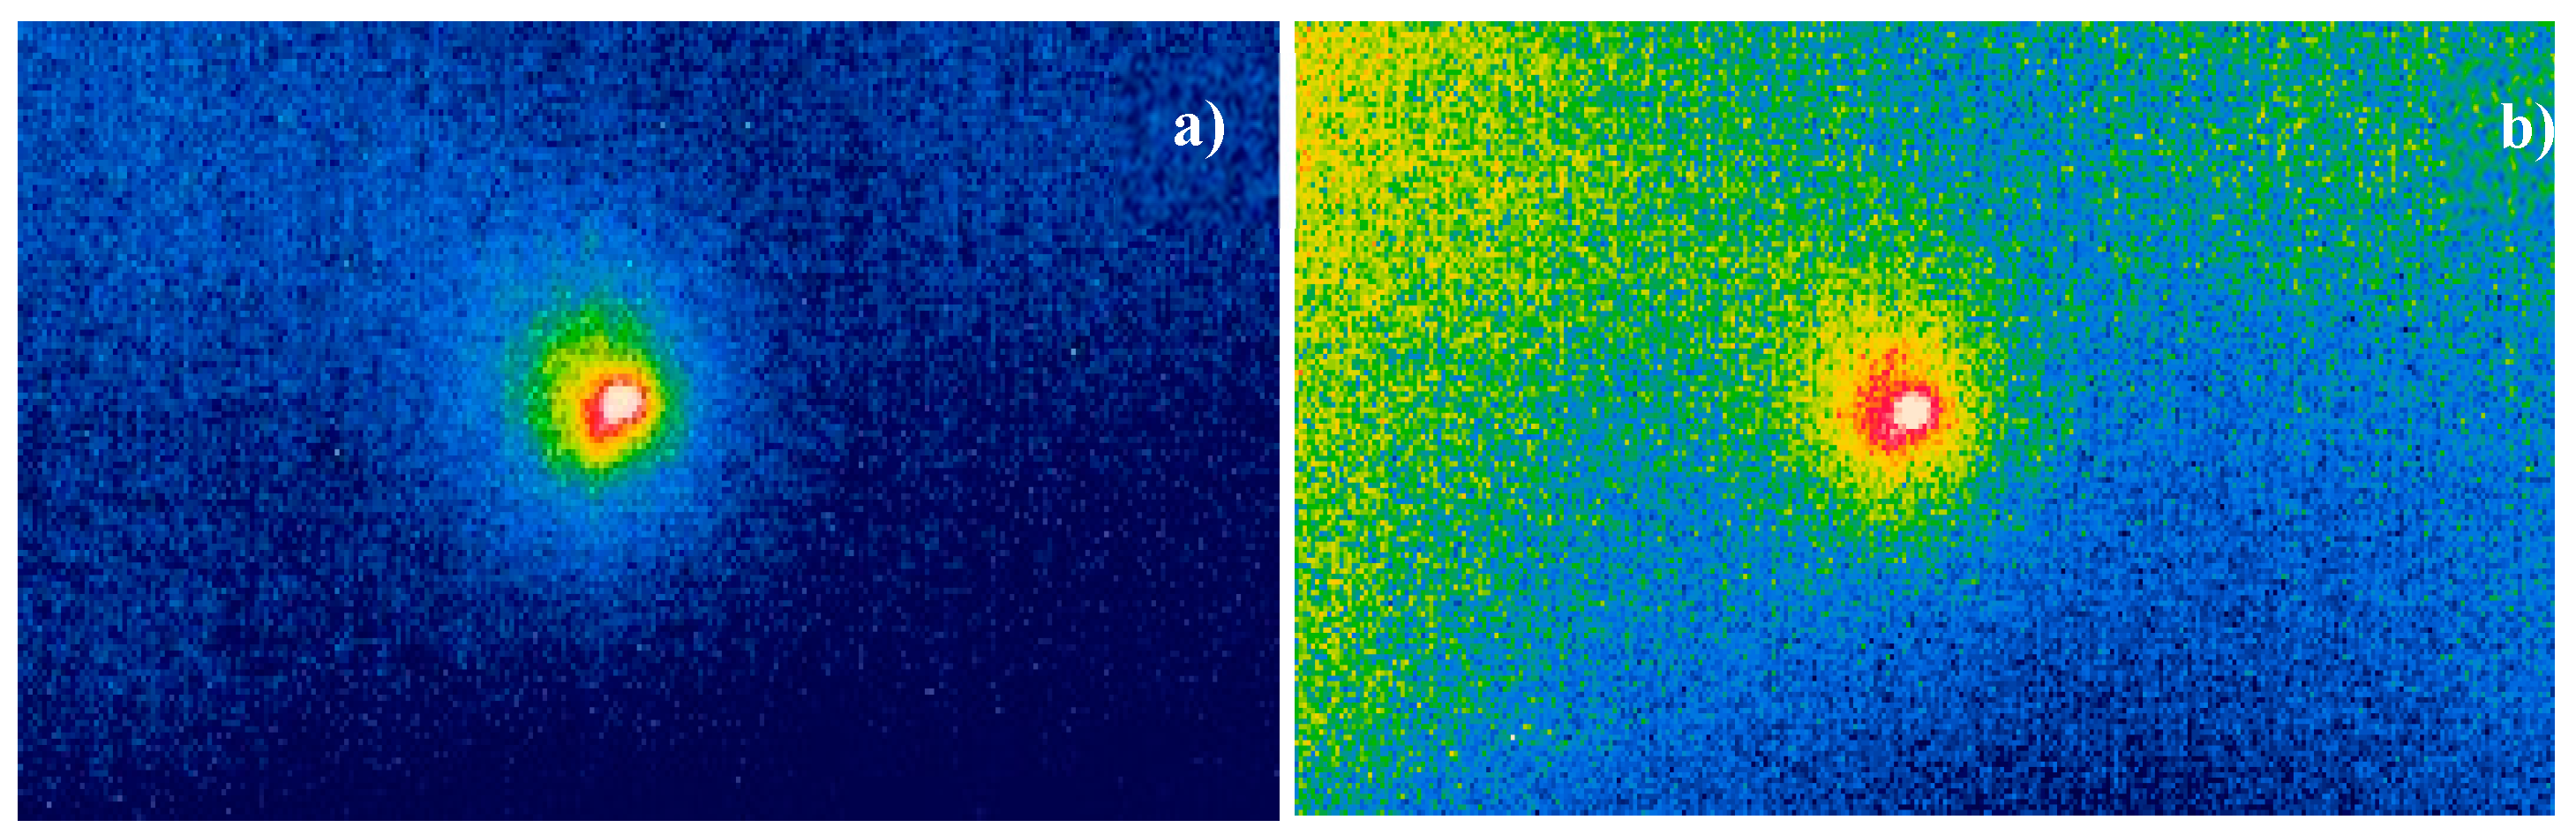
Figure 40.
“Through-transmission” non-contact ACU thermosonics set-up (a); temperature response of FBH to 50 mW ACU excitation at LDR frequency 50.2 kHz (b).
Figure 40.
“Through-transmission” non-contact ACU thermosonics set-up (a); temperature response of FBH to 50 mW ACU excitation at LDR frequency 50.2 kHz (b).
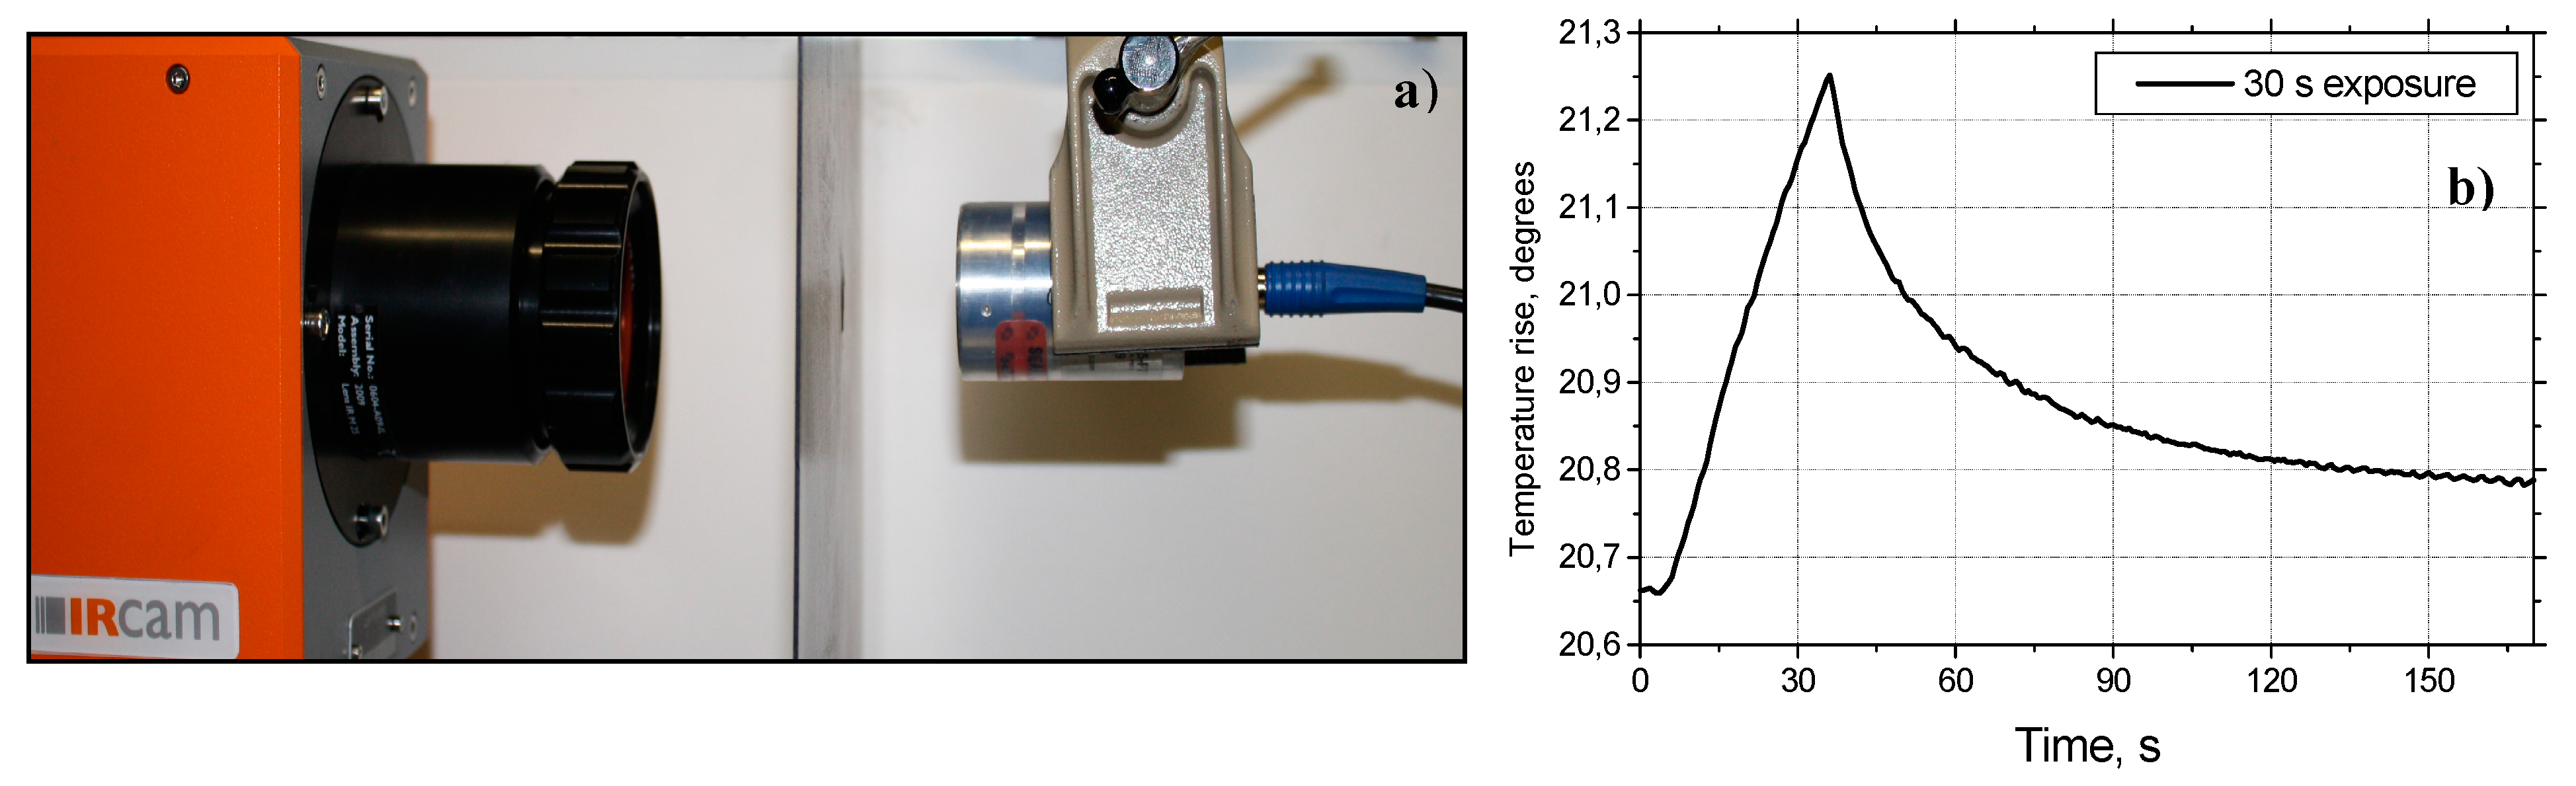
Figure 41.
Noncontact ACU LDR thermosonic (a, c) and laser vibrometry (b, d) imaging of an impact area (~12 mm diameter) in CFRP plate at different frequencies: (a), (b) - ACU excitation at LDR frequency of 69.6 kHz; (c), (d) – ACU frequency 69 kHz.
Figure 41.
Noncontact ACU LDR thermosonic (a, c) and laser vibrometry (b, d) imaging of an impact area (~12 mm diameter) in CFRP plate at different frequencies: (a), (b) - ACU excitation at LDR frequency of 69.6 kHz; (c), (d) – ACU frequency 69 kHz.
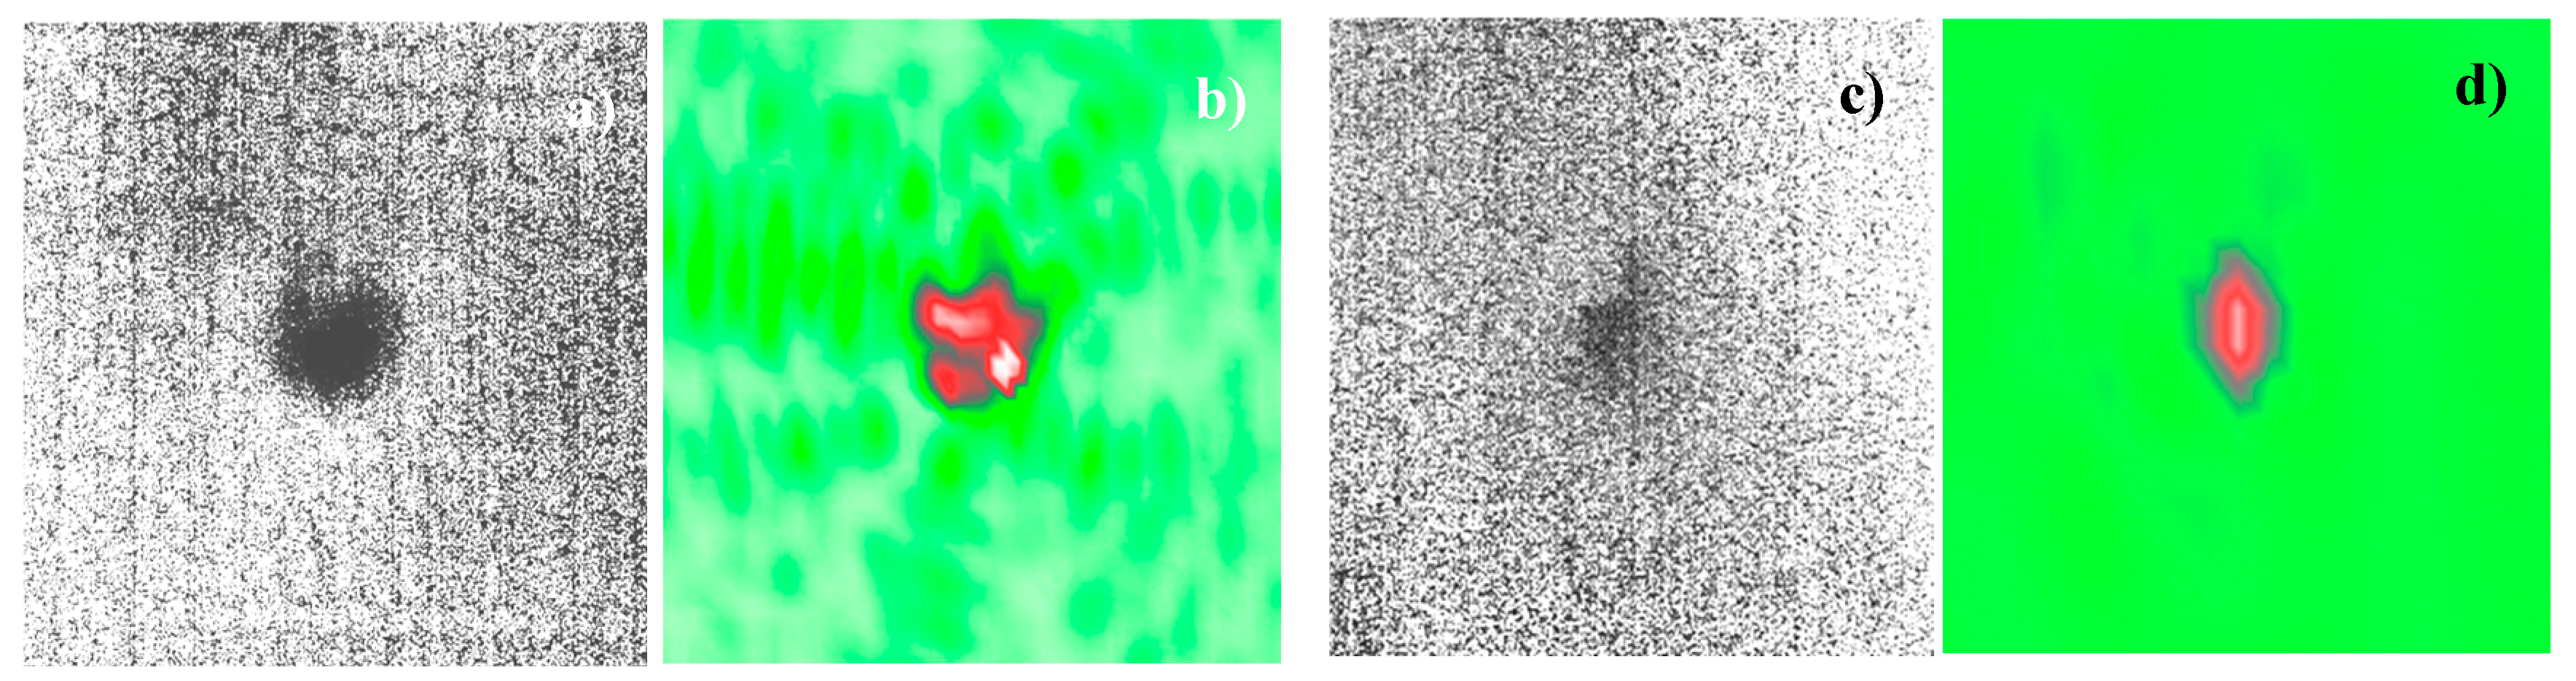
Figure 42.
Airborne field above CFRP specimen with an impact: a) non-resonant case (45 kHz excitation); b) LDR case at 61.2 kHz excitation.
Figure 42.
Airborne field above CFRP specimen with an impact: a) non-resonant case (45 kHz excitation); b) LDR case at 61.2 kHz excitation.

Figure 43.
Experimental setup of RACE imaging system.
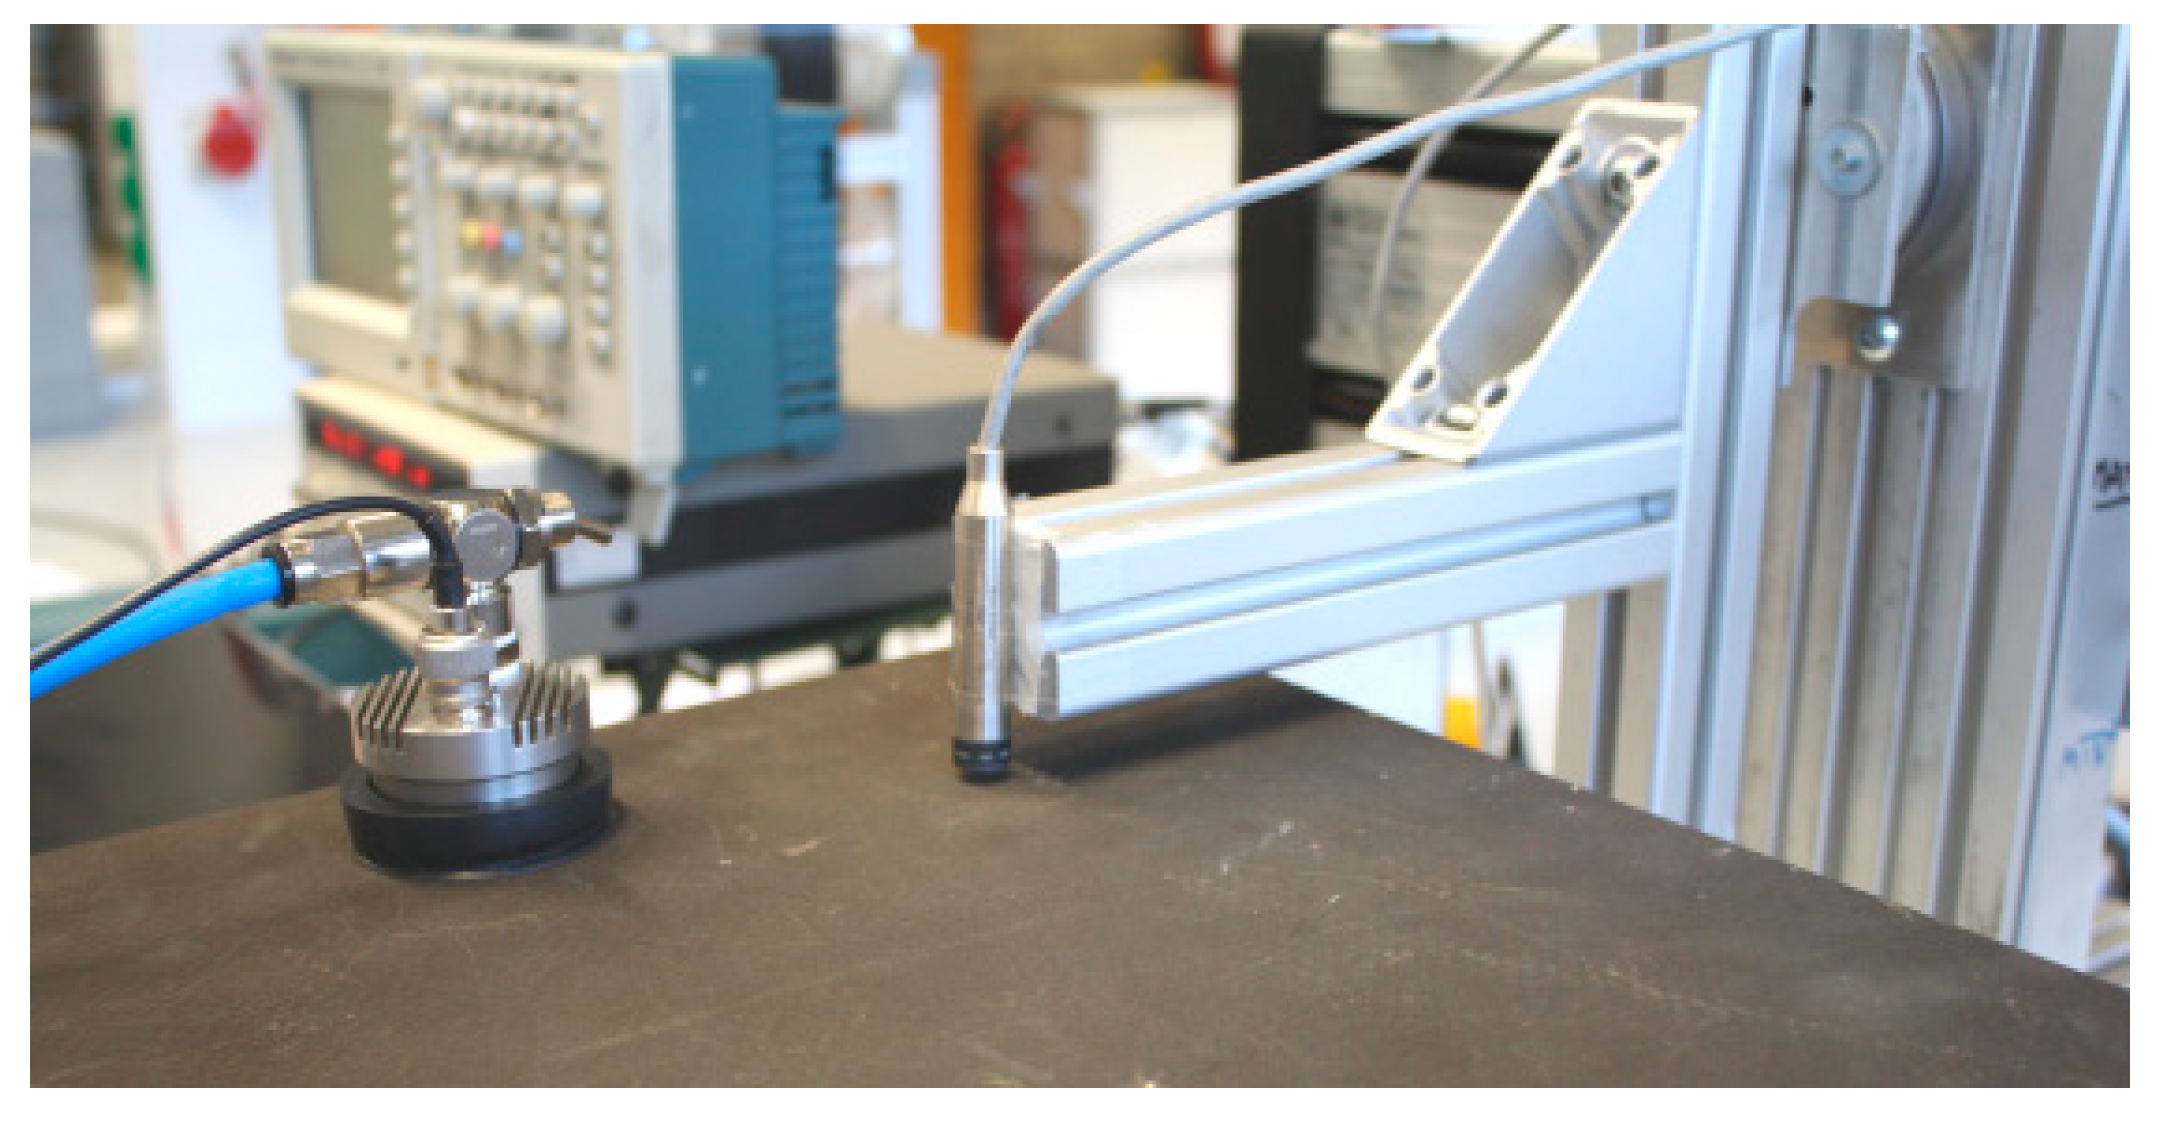
Figure 44.
Laser vibrometry LDR images of FBH in CFRP (a, b) and RACE images at the same frequencies (c, d).
Figure 44.
Laser vibrometry LDR images of FBH in CFRP (a, b) and RACE images at the same frequencies (c, d).
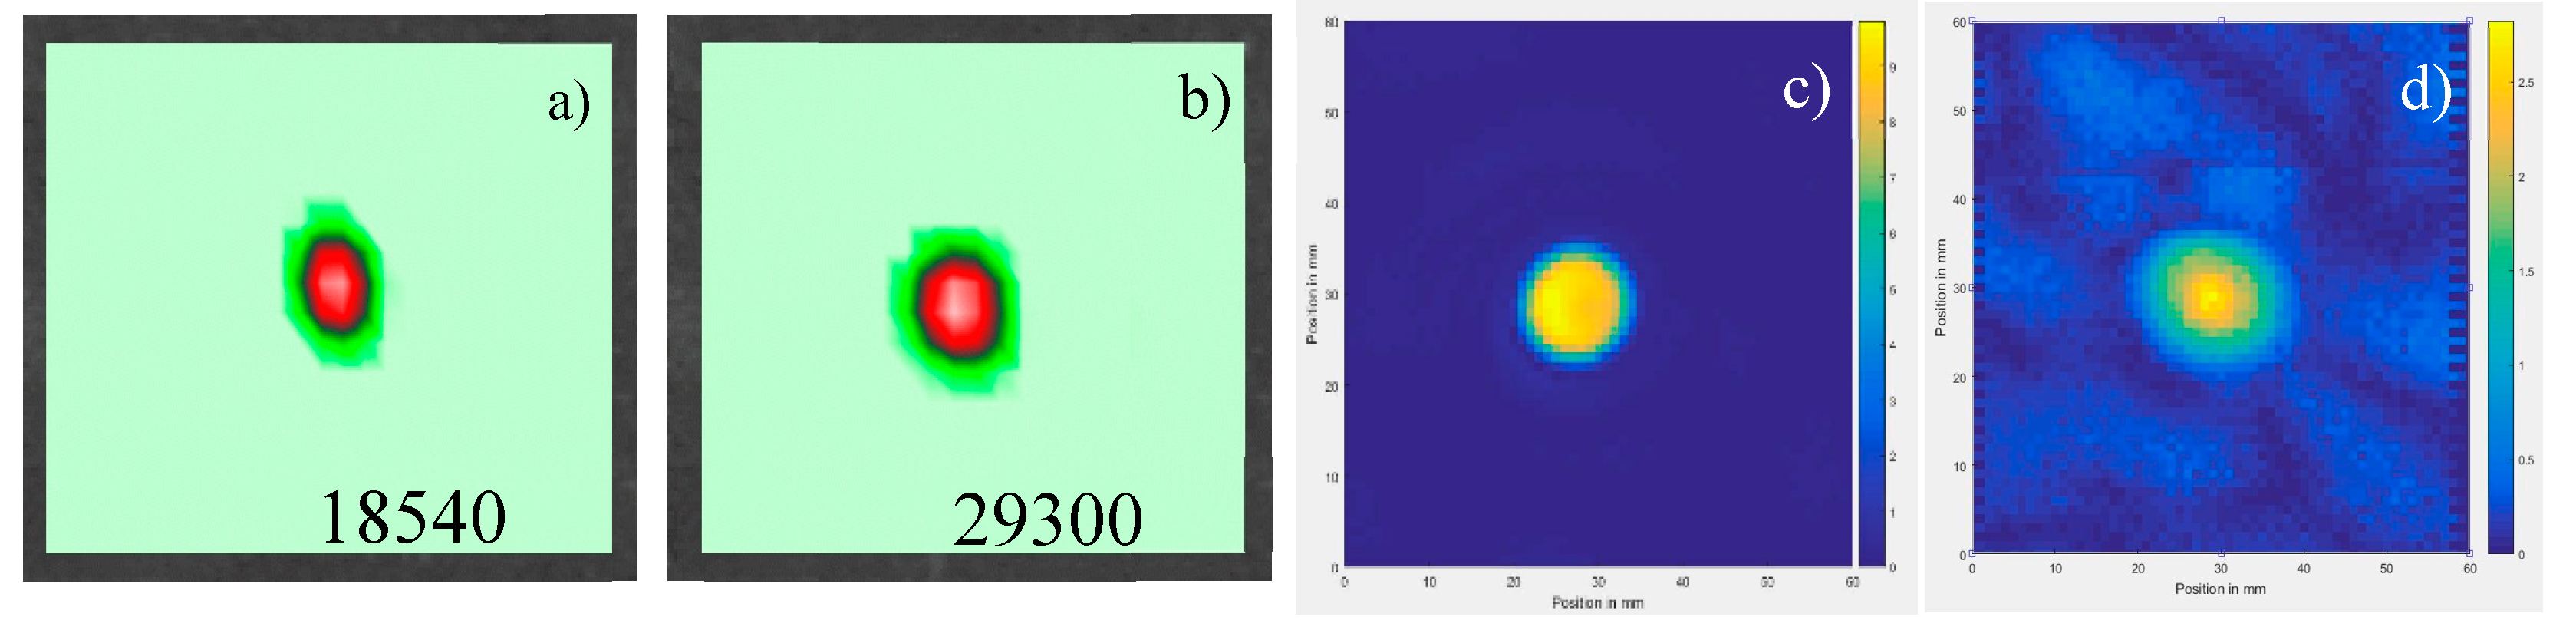
Figure 45.
RACE imaging of 20x20 mm2 disbond in adhesive joint (right) of CFRP spar specimen (left). LDR frequency of the defect is 15250 Hz.
Figure 45.
RACE imaging of 20x20 mm2 disbond in adhesive joint (right) of CFRP spar specimen (left). LDR frequency of the defect is 15250 Hz.
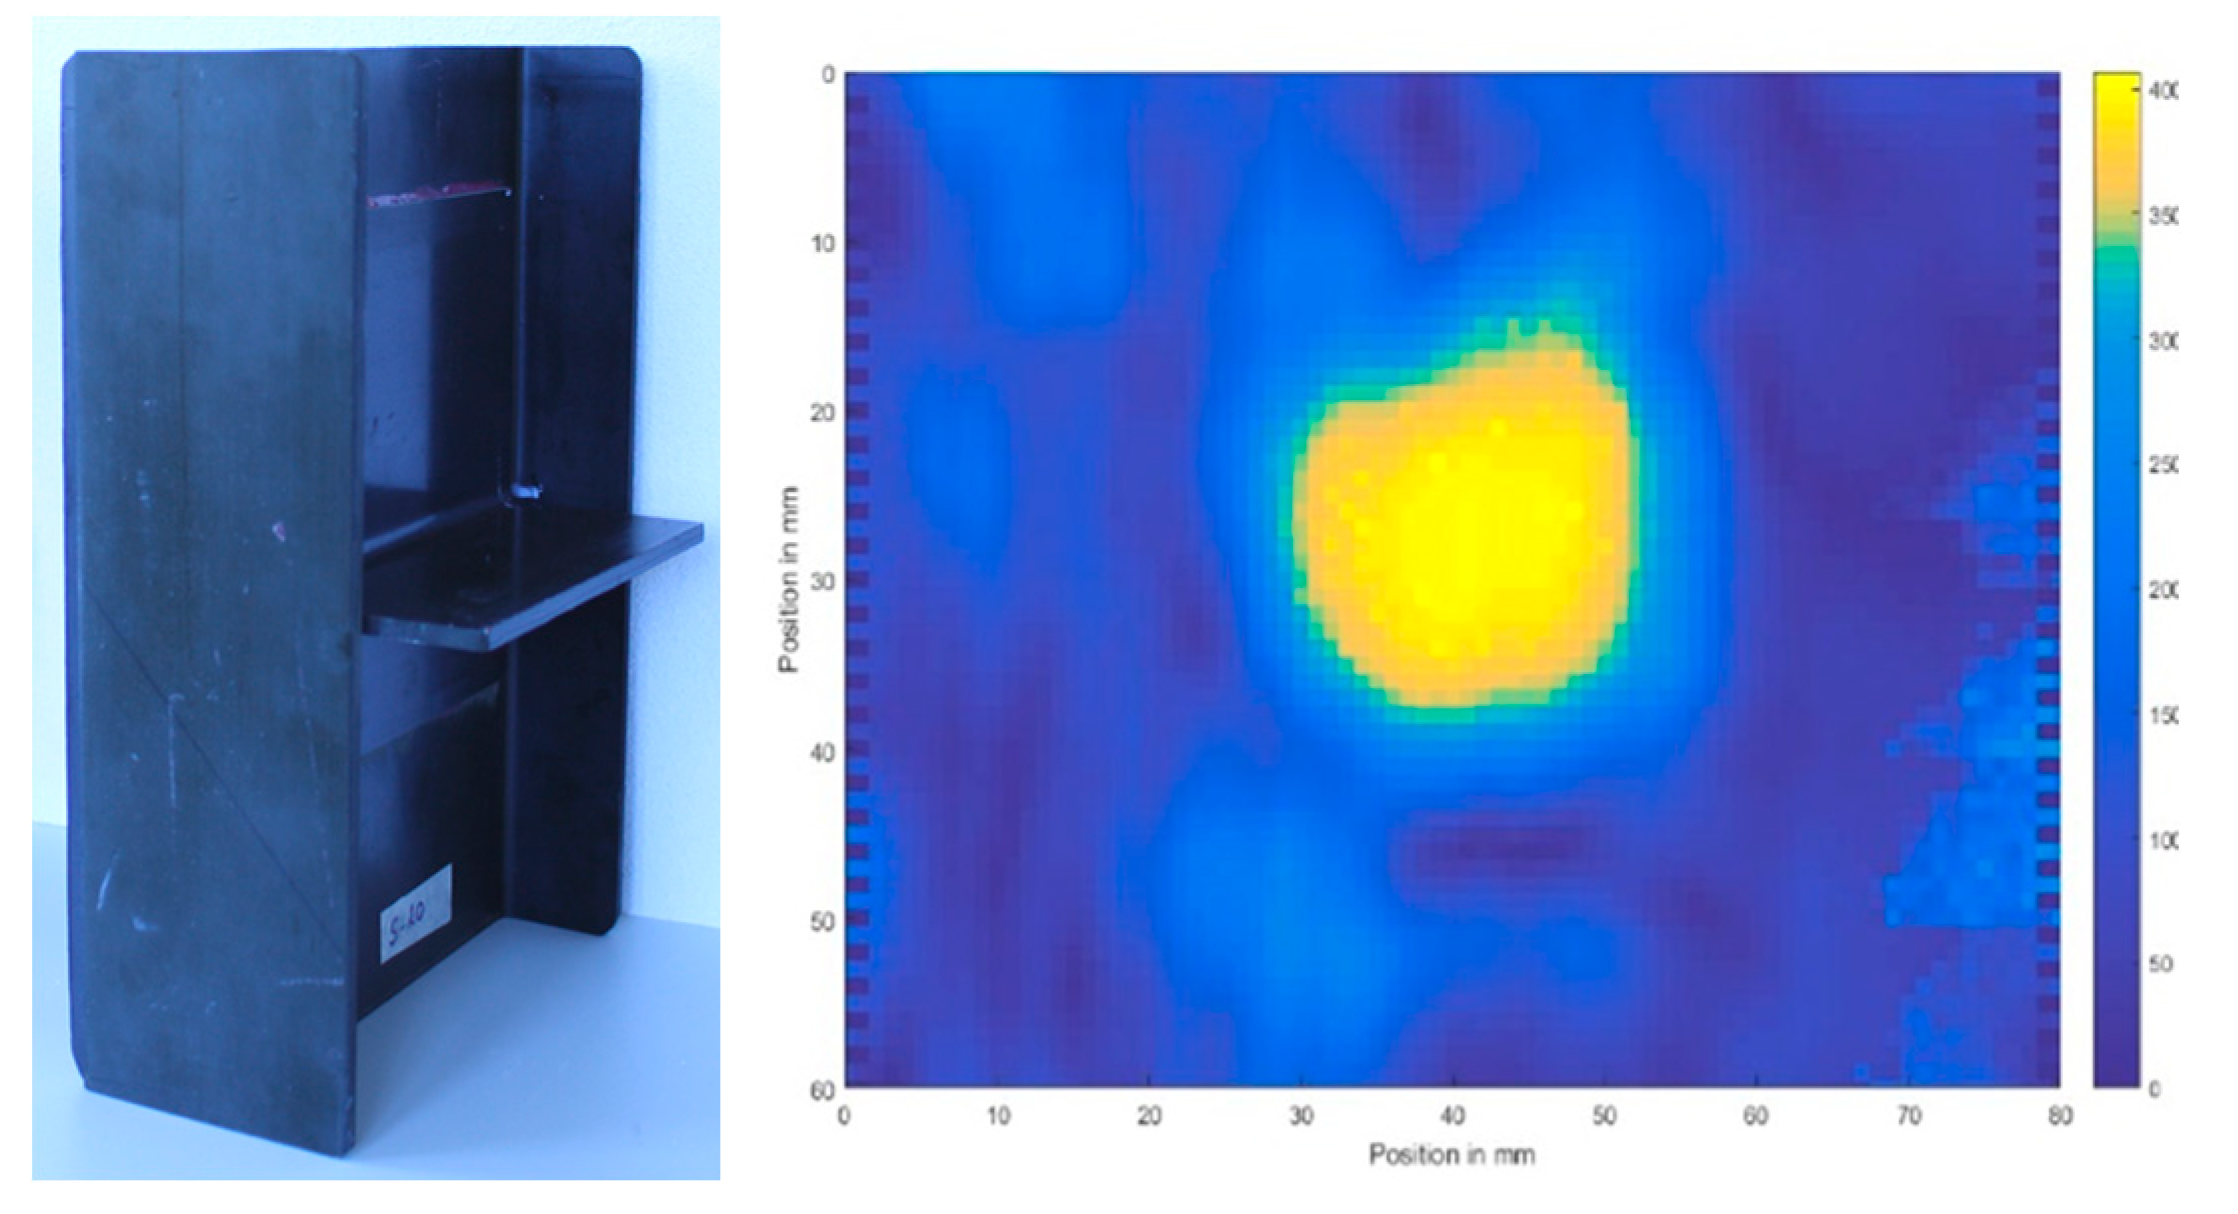
Figure 46.
Acoustic spectrum generated by a piezo-transducer for a noise input voltage.
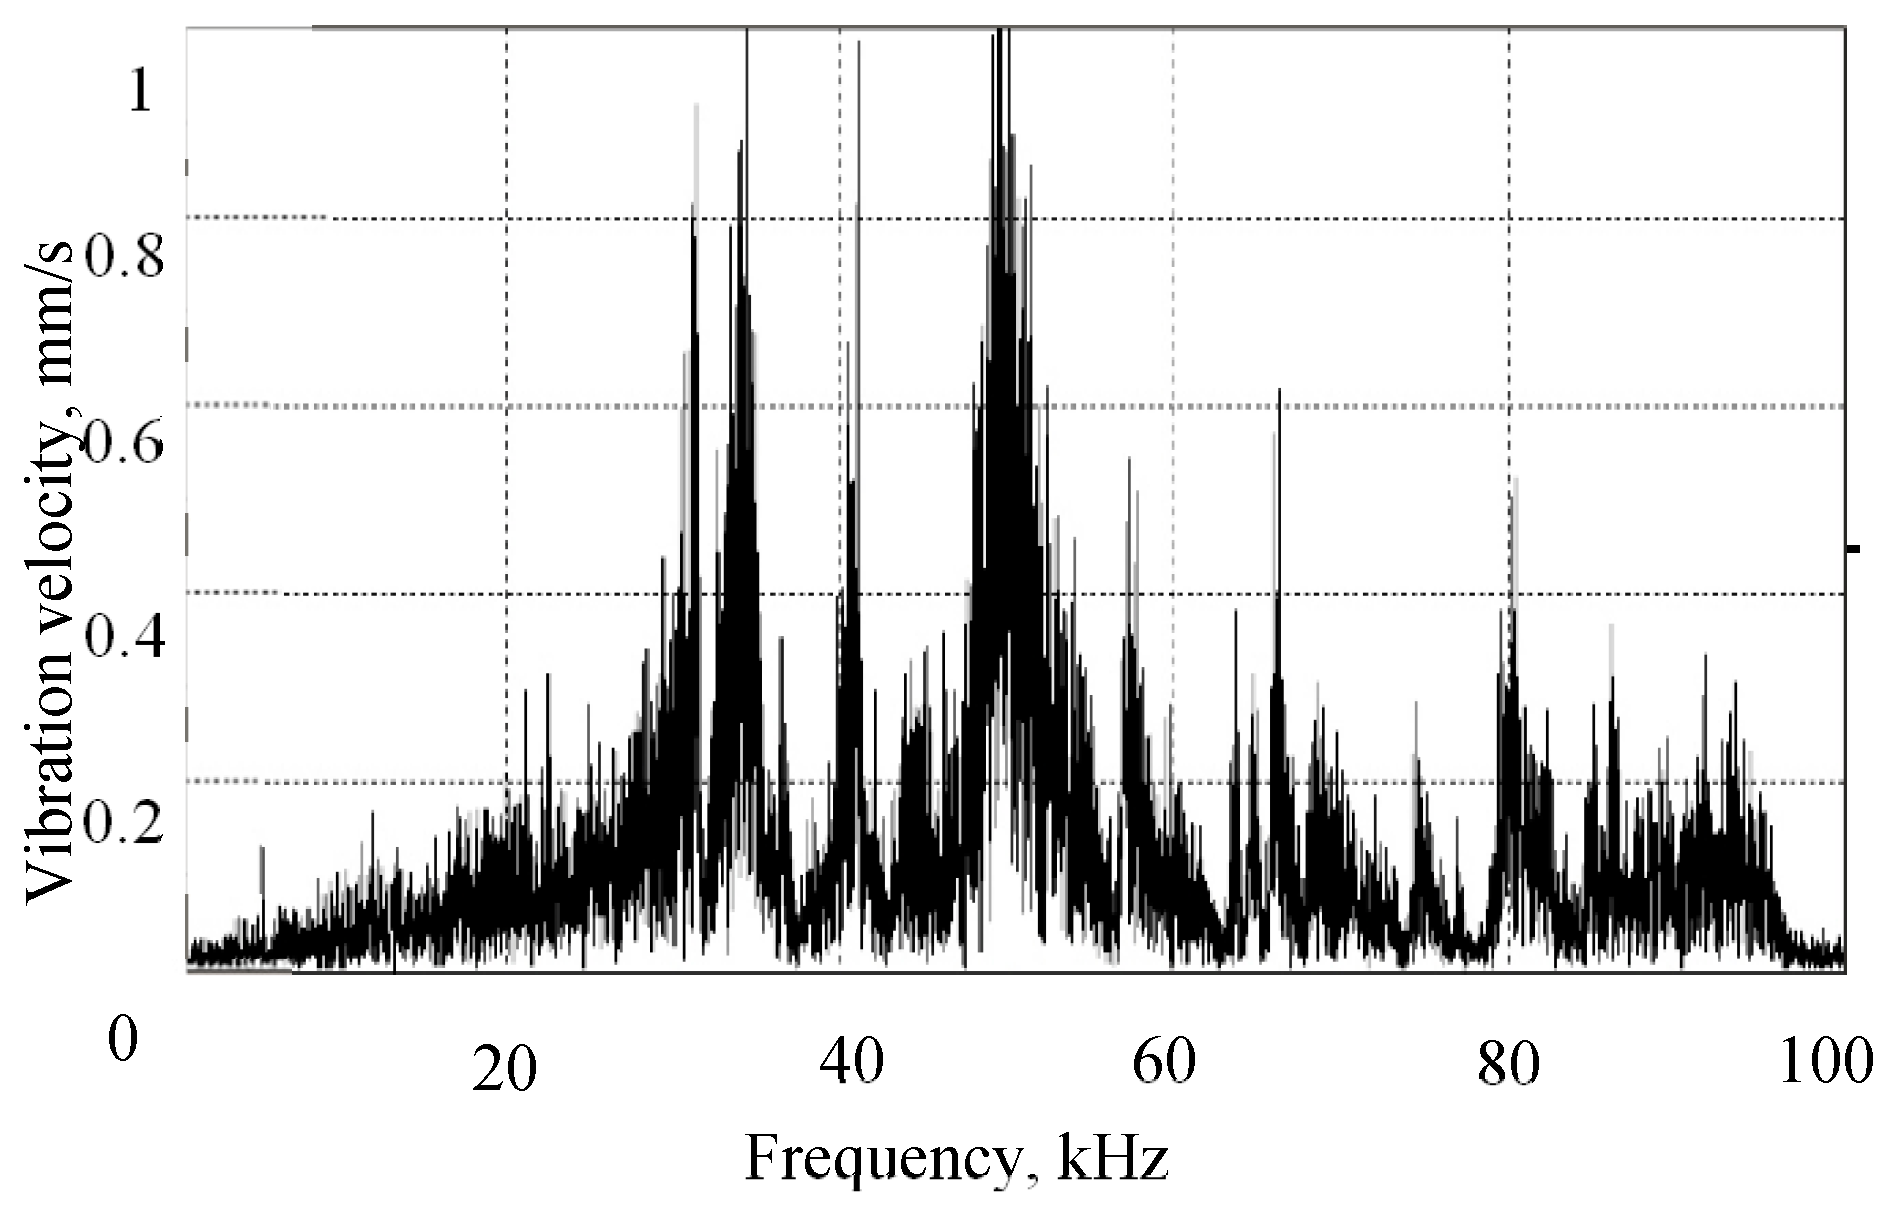
Figure 47.
Multiple defect imaging in noisy mode of RACE: 4 circular FBH of different depths (a) and 4 square inserts at various depths (b) in CFRP plates.
Figure 47.
Multiple defect imaging in noisy mode of RACE: 4 circular FBH of different depths (a) and 4 square inserts at various depths (b) in CFRP plates.

Figure 48.
Zoom-in image of the square insert in CFRP plate obtained in a noisy mode of RACE.
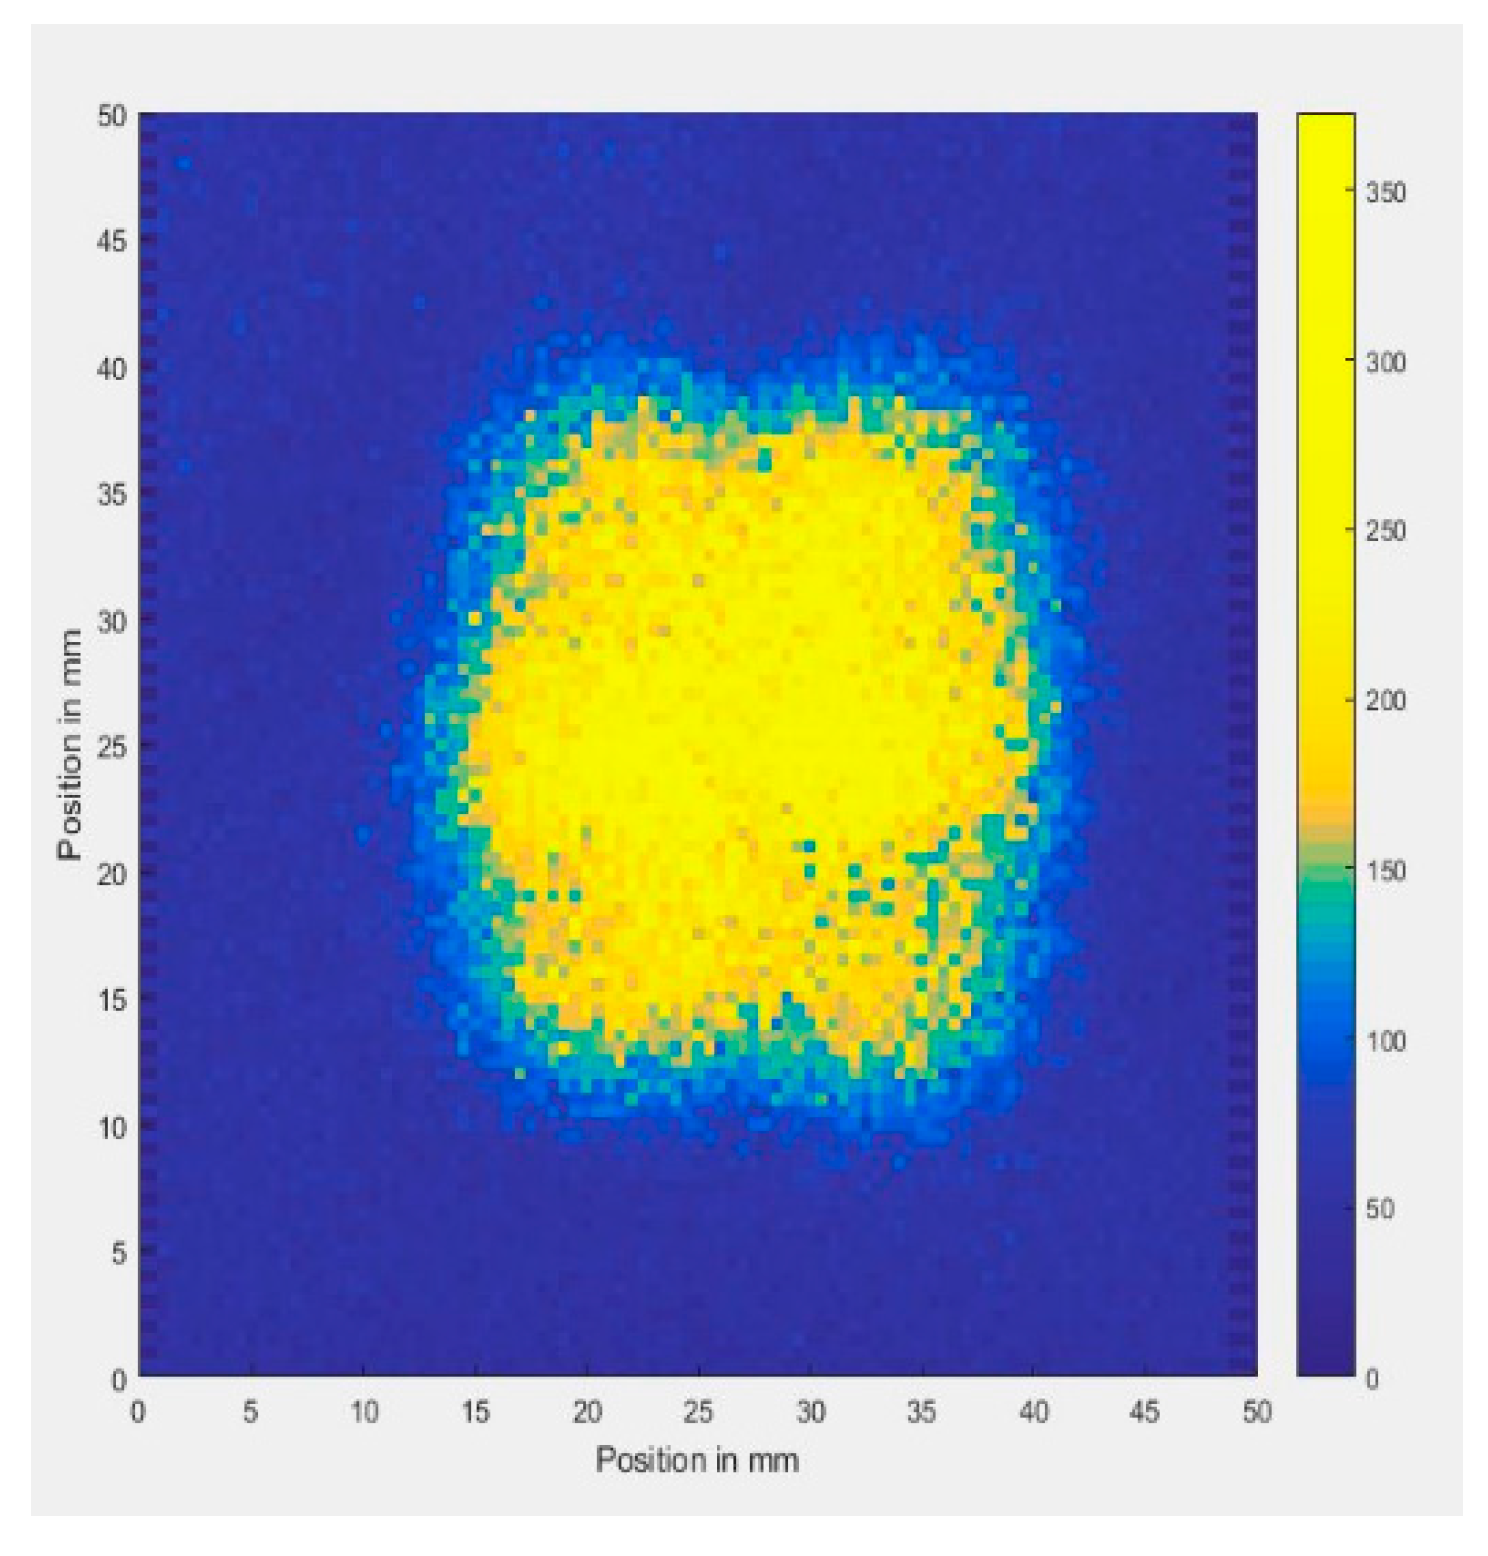
Figure 49.
Noisy RACE (left) and wideband laser vibrometry (right) images of a Teflon ring embedded in (400x400x2 mm3) CFRP plate.
Figure 49.
Noisy RACE (left) and wideband laser vibrometry (right) images of a Teflon ring embedded in (400x400x2 mm3) CFRP plate.
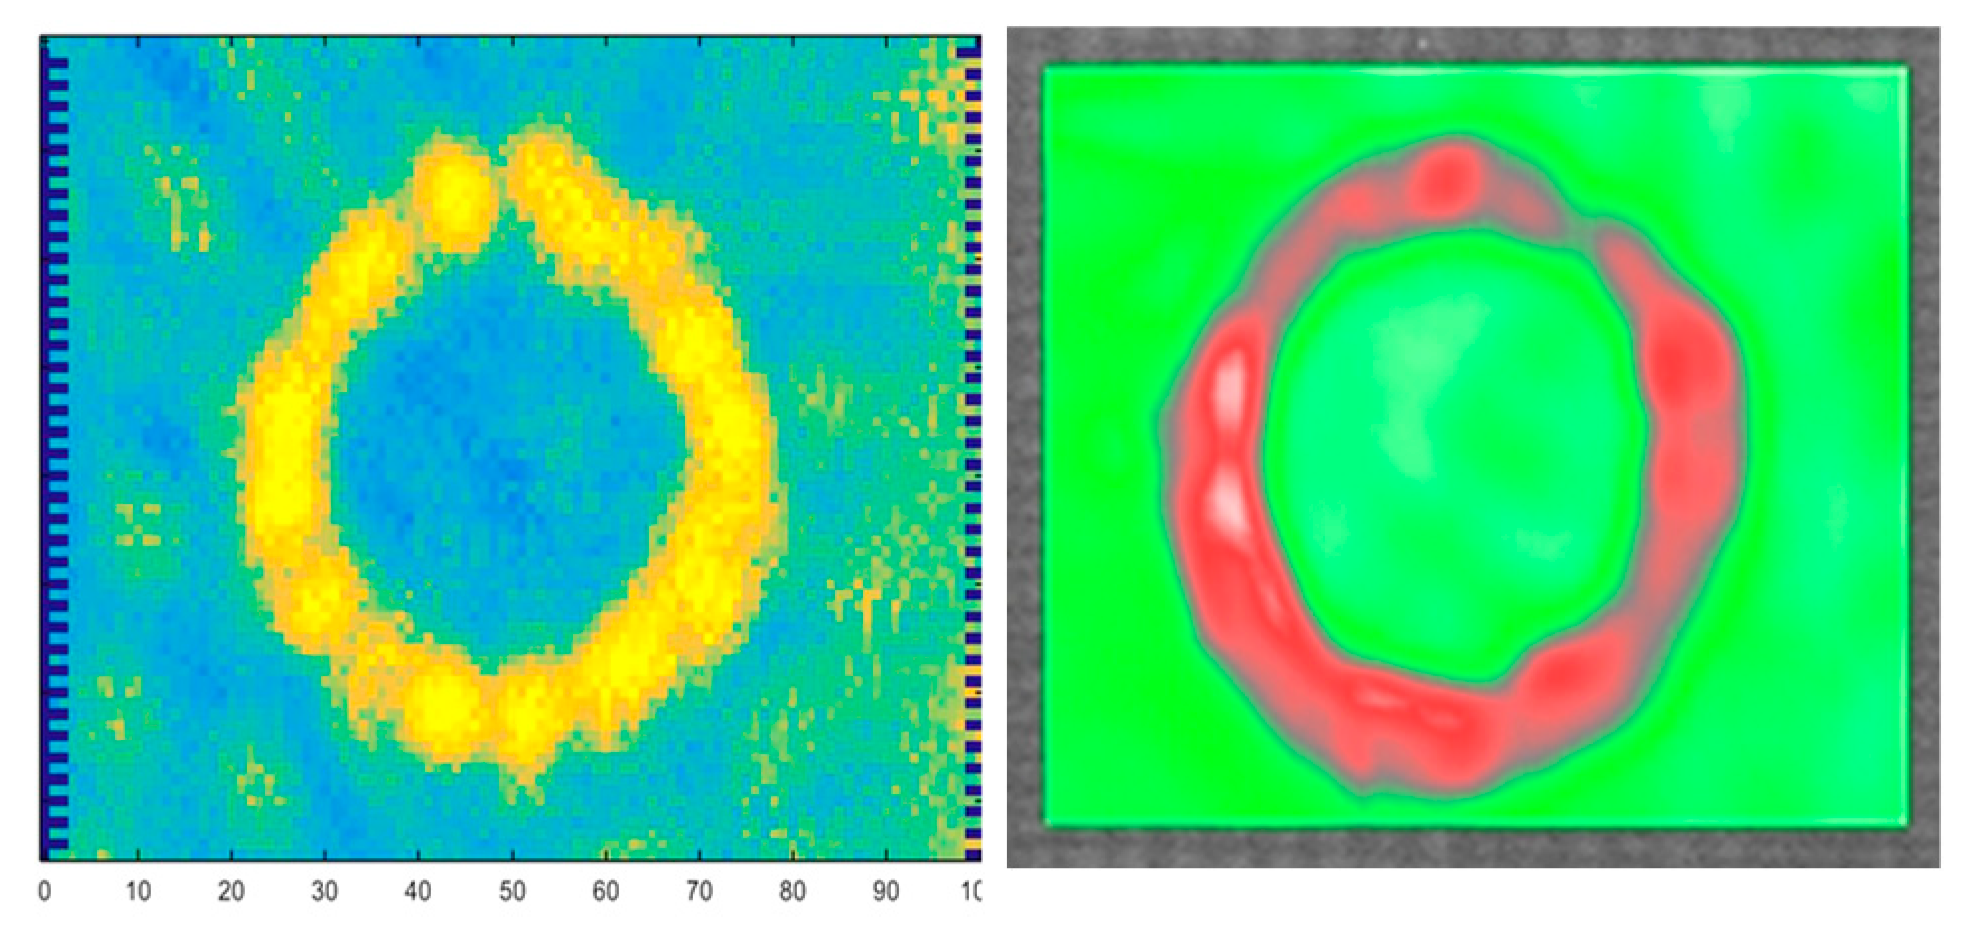
Figure 50.
Robotic scanning setup.
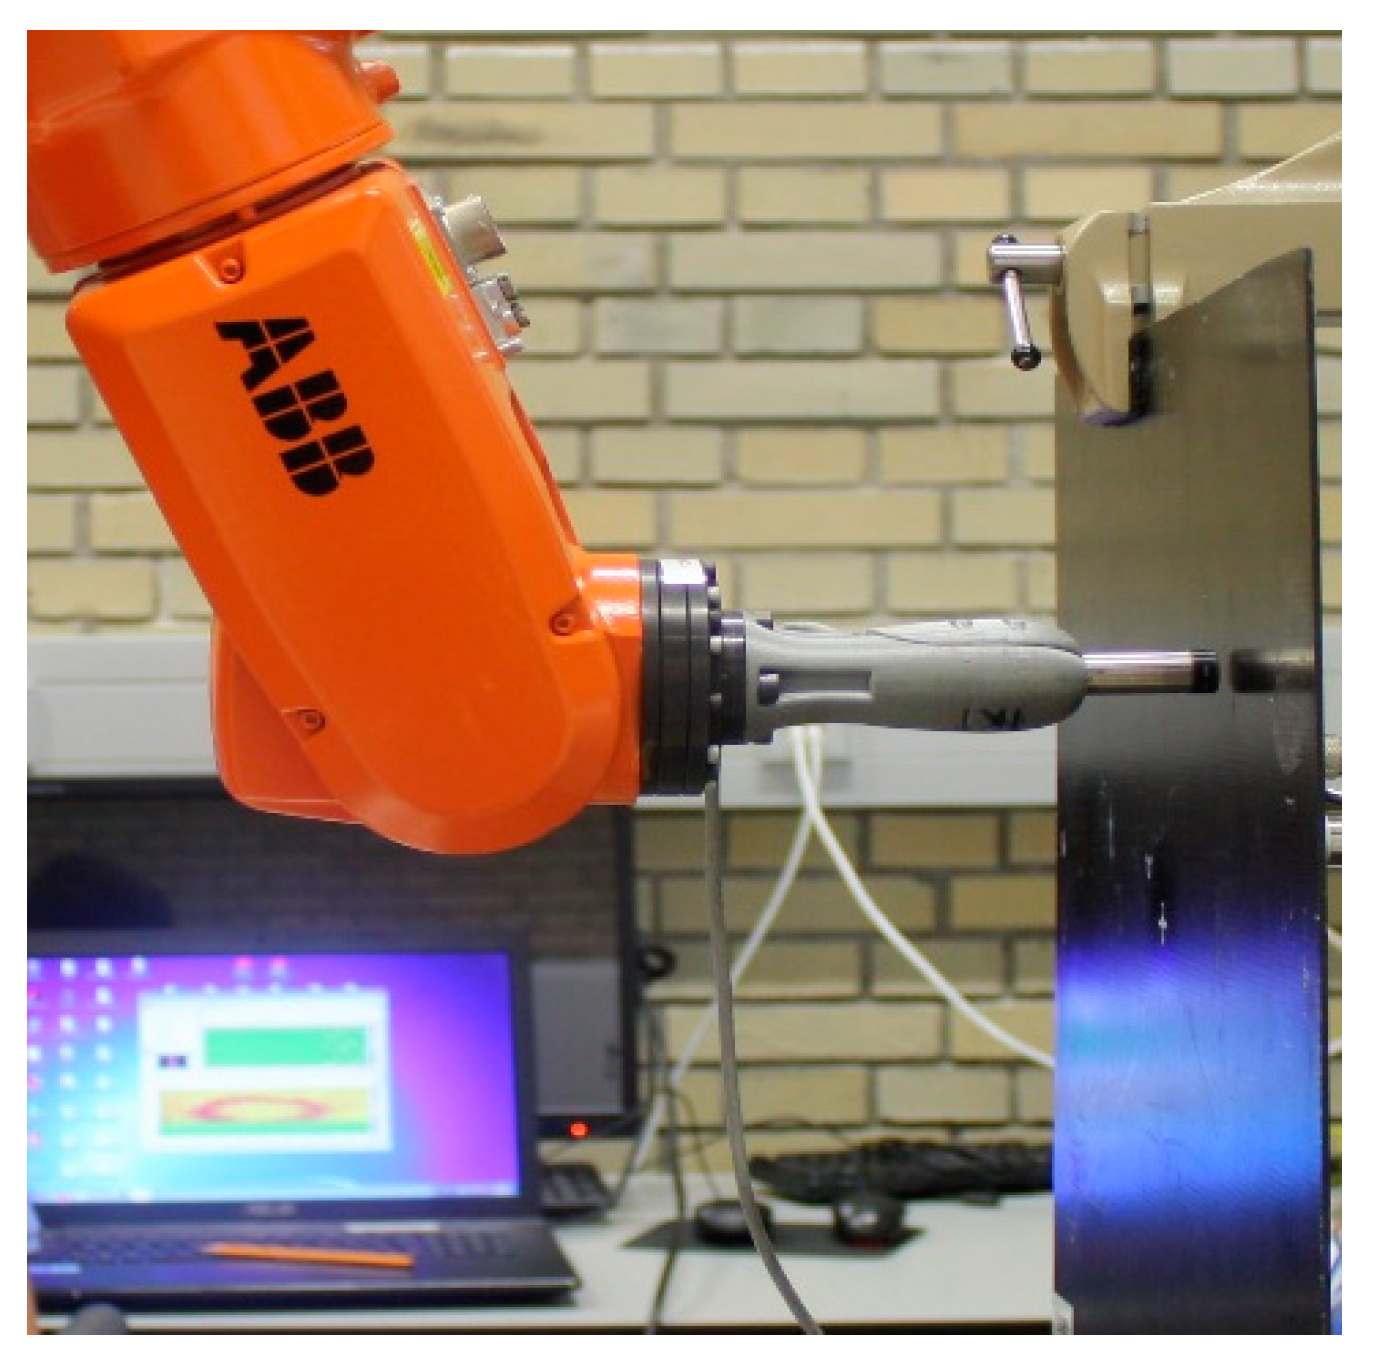
Figure 51.
Noisy mode of LDR imaging for 4 inserts in CFRP: RACE imaging (a), wideband laser vibrometry (b).
Figure 51.
Noisy mode of LDR imaging for 4 inserts in CFRP: RACE imaging (a), wideband laser vibrometry (b).
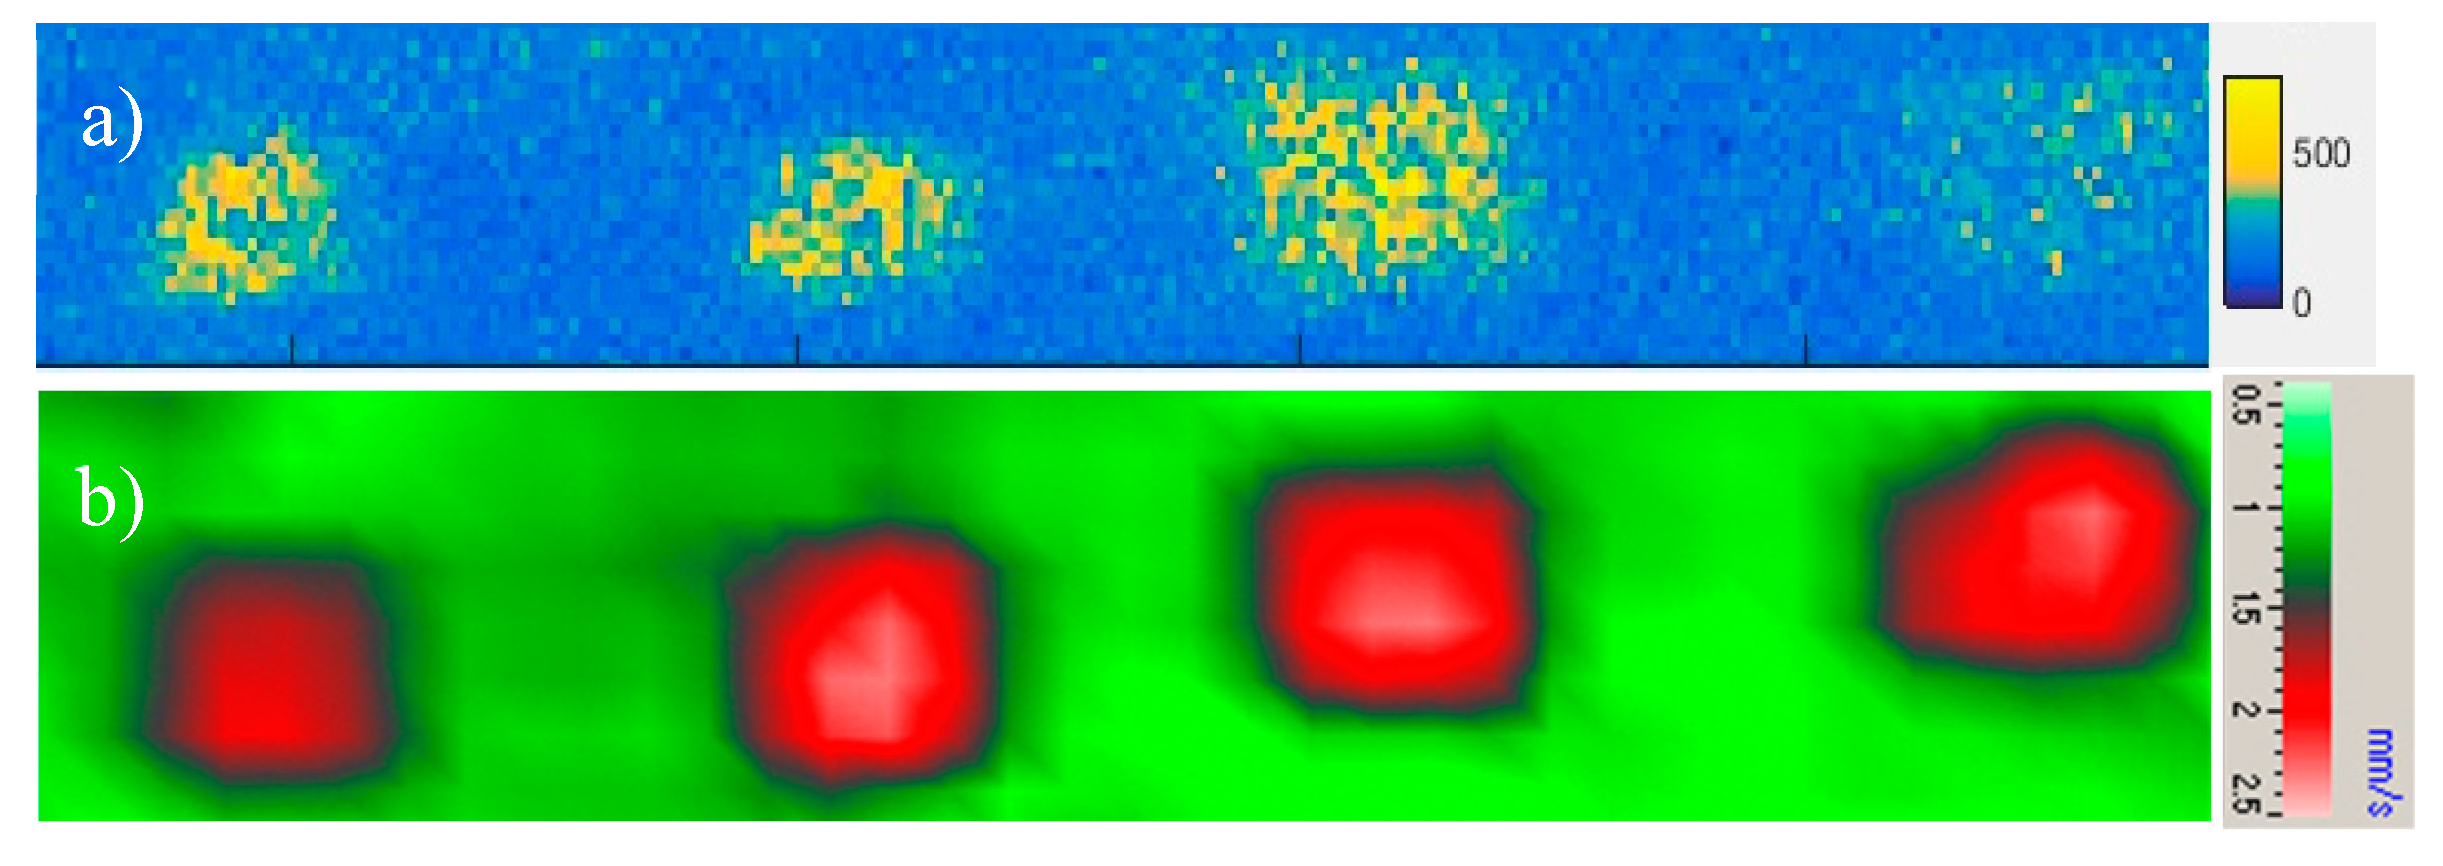
Figure 52.
SoundCam setup for fullfield RACE imaging.
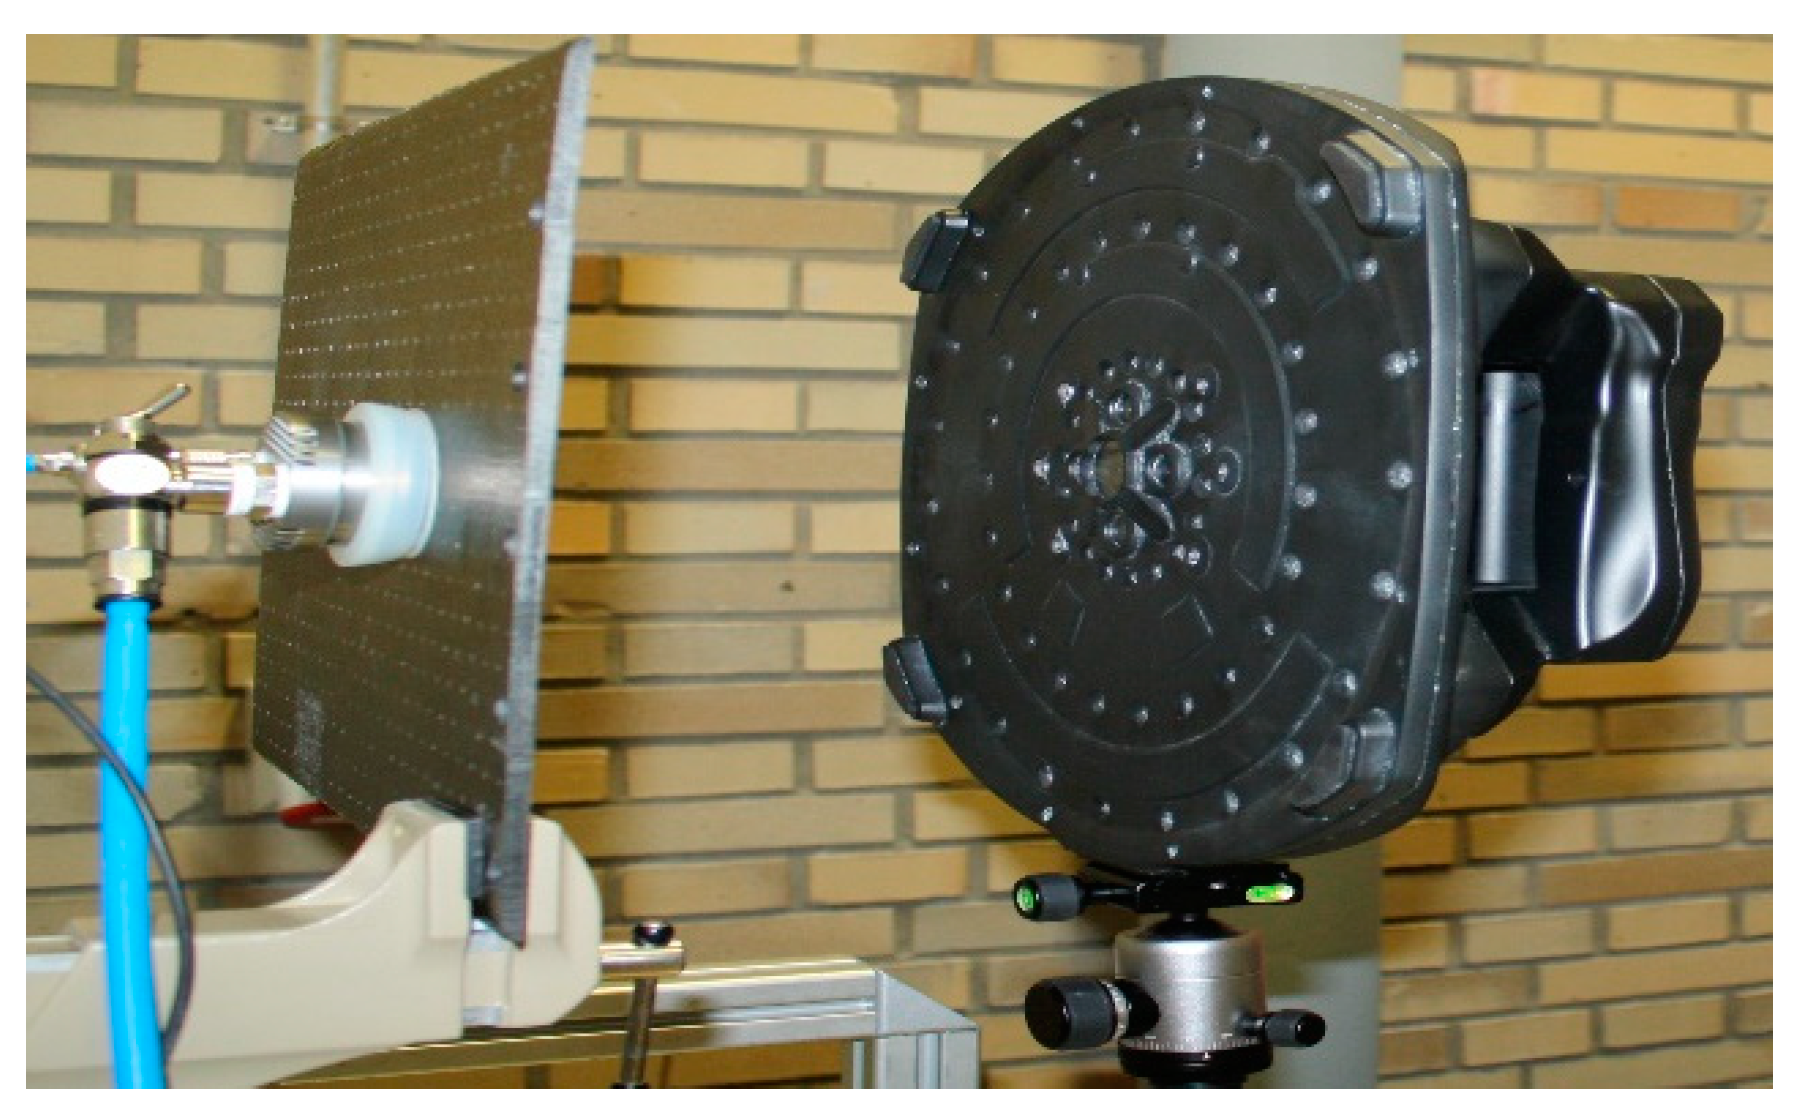
Figure 53.
The interface of SoundCam and full-field image of acoustic field for piezo-transducer (frequency 13100 Hz).
Figure 53.
The interface of SoundCam and full-field image of acoustic field for piezo-transducer (frequency 13100 Hz).
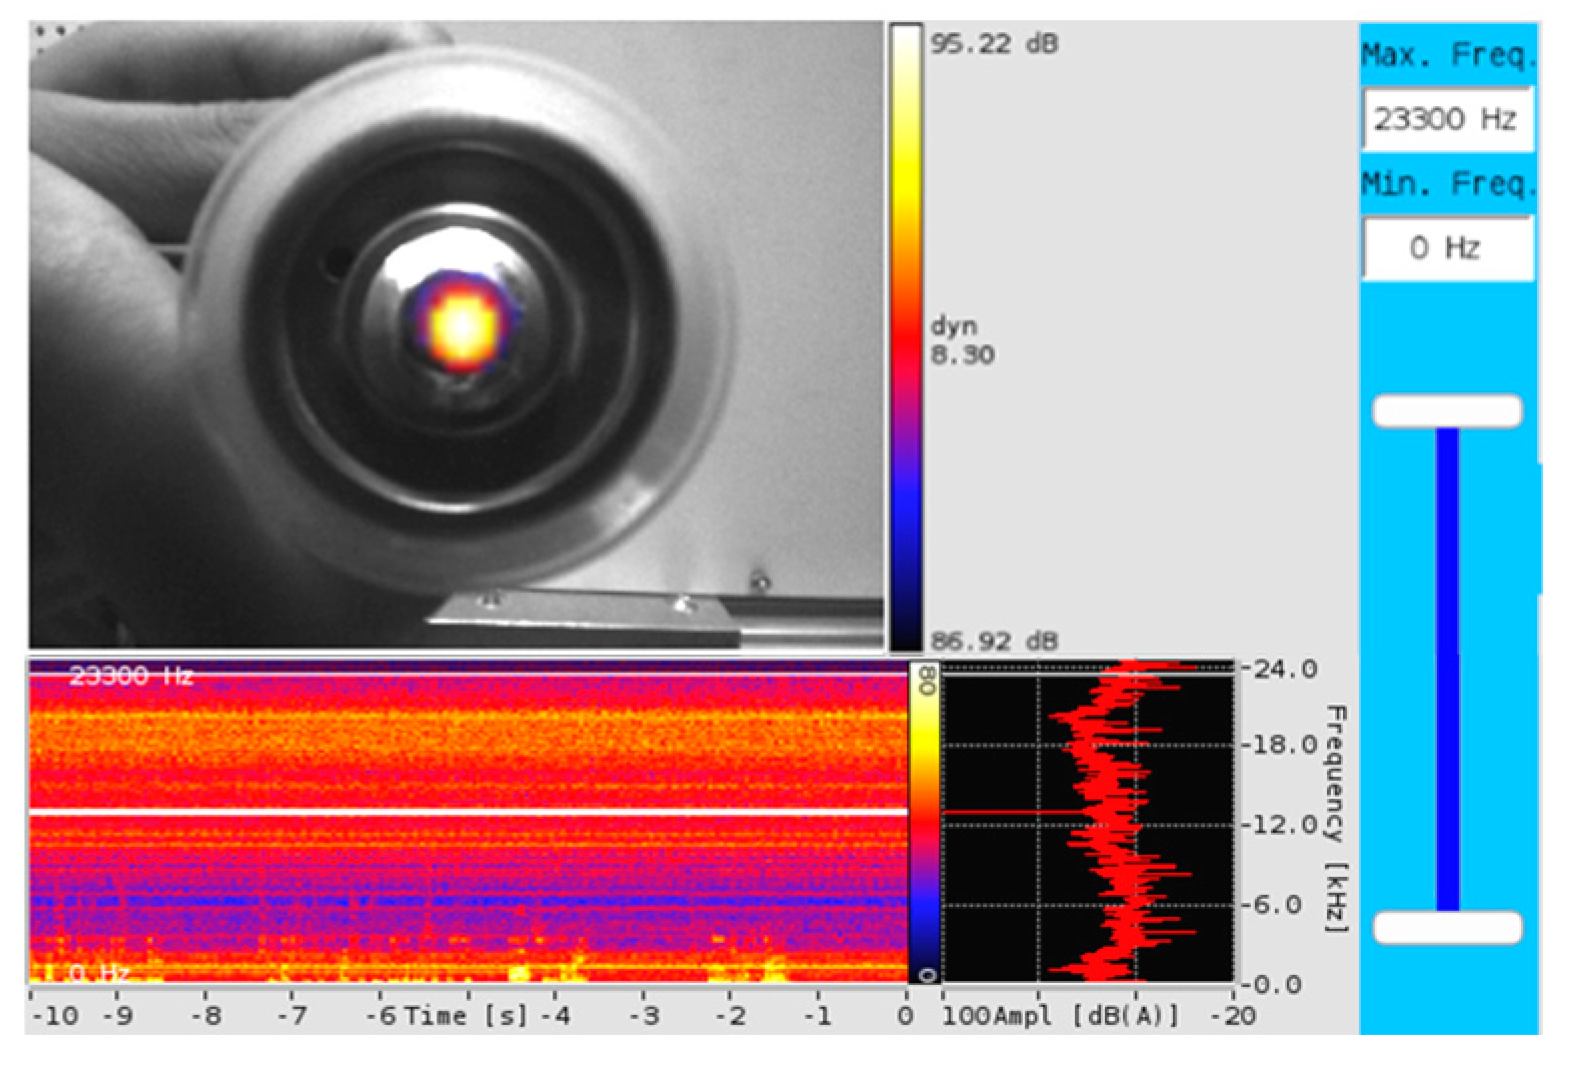
Figure 54.
Comparison between scanning vibrometry (b, c) and full-field RACE images (d, e) for a pair of FBH in Plexiglas plate (a) activated at different LDR frequencies.
Figure 54.
Comparison between scanning vibrometry (b, c) and full-field RACE images (d, e) for a pair of FBH in Plexiglas plate (a) activated at different LDR frequencies.
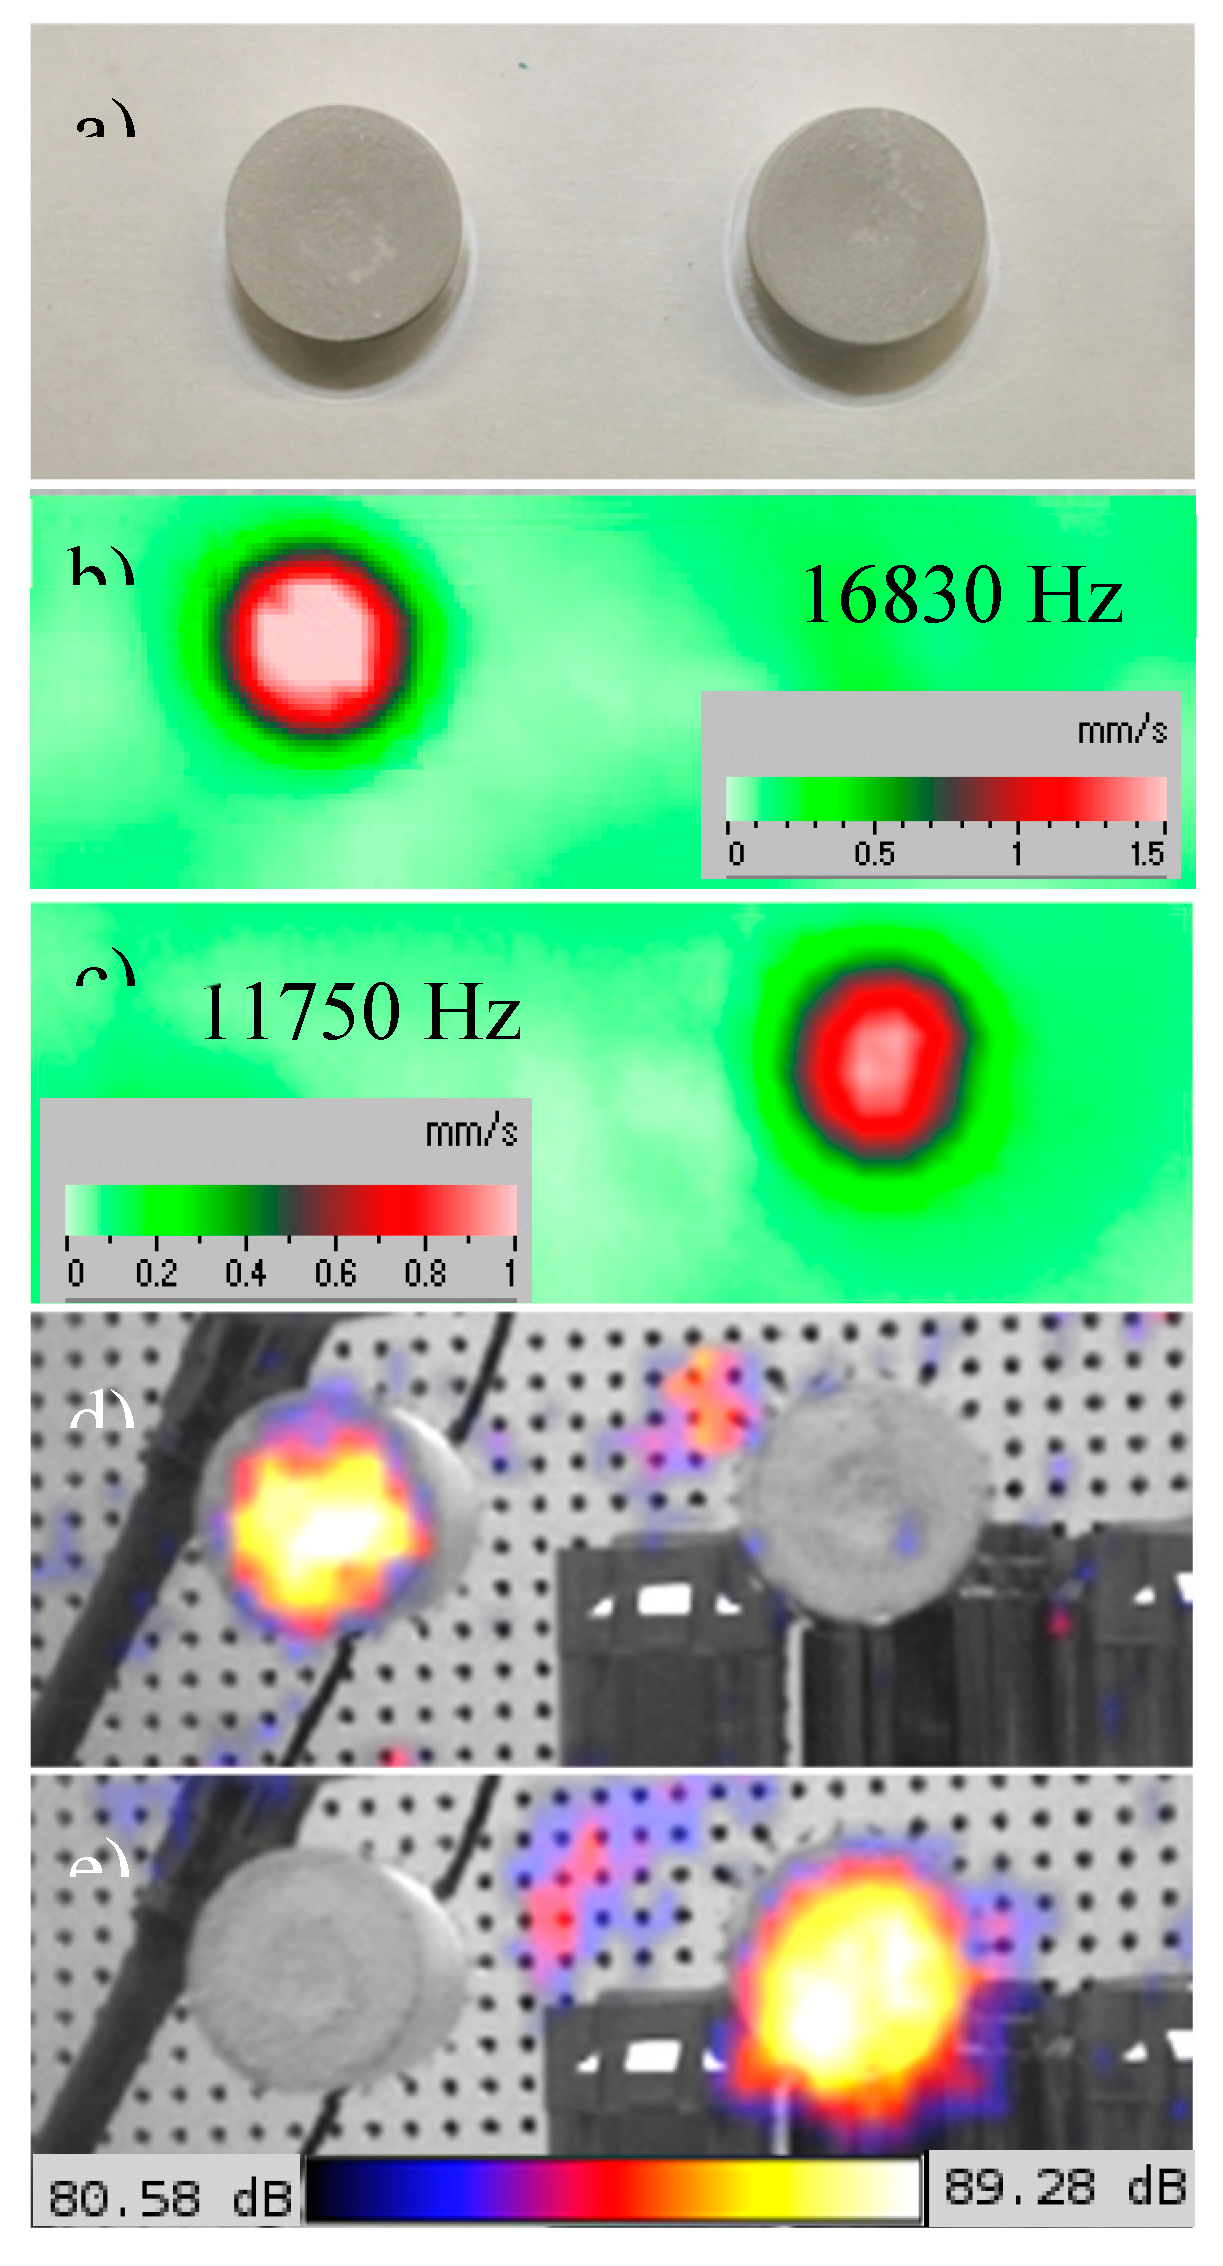
Figure 55.
20 J impact-induced BVID in non-crimp fabric CFRP plate (a) with vibrometry image at LDR frequency 32200 Hz (c) and full-field visualization using acoustic camera (b).
Figure 55.
20 J impact-induced BVID in non-crimp fabric CFRP plate (a) with vibrometry image at LDR frequency 32200 Hz (c) and full-field visualization using acoustic camera (b).
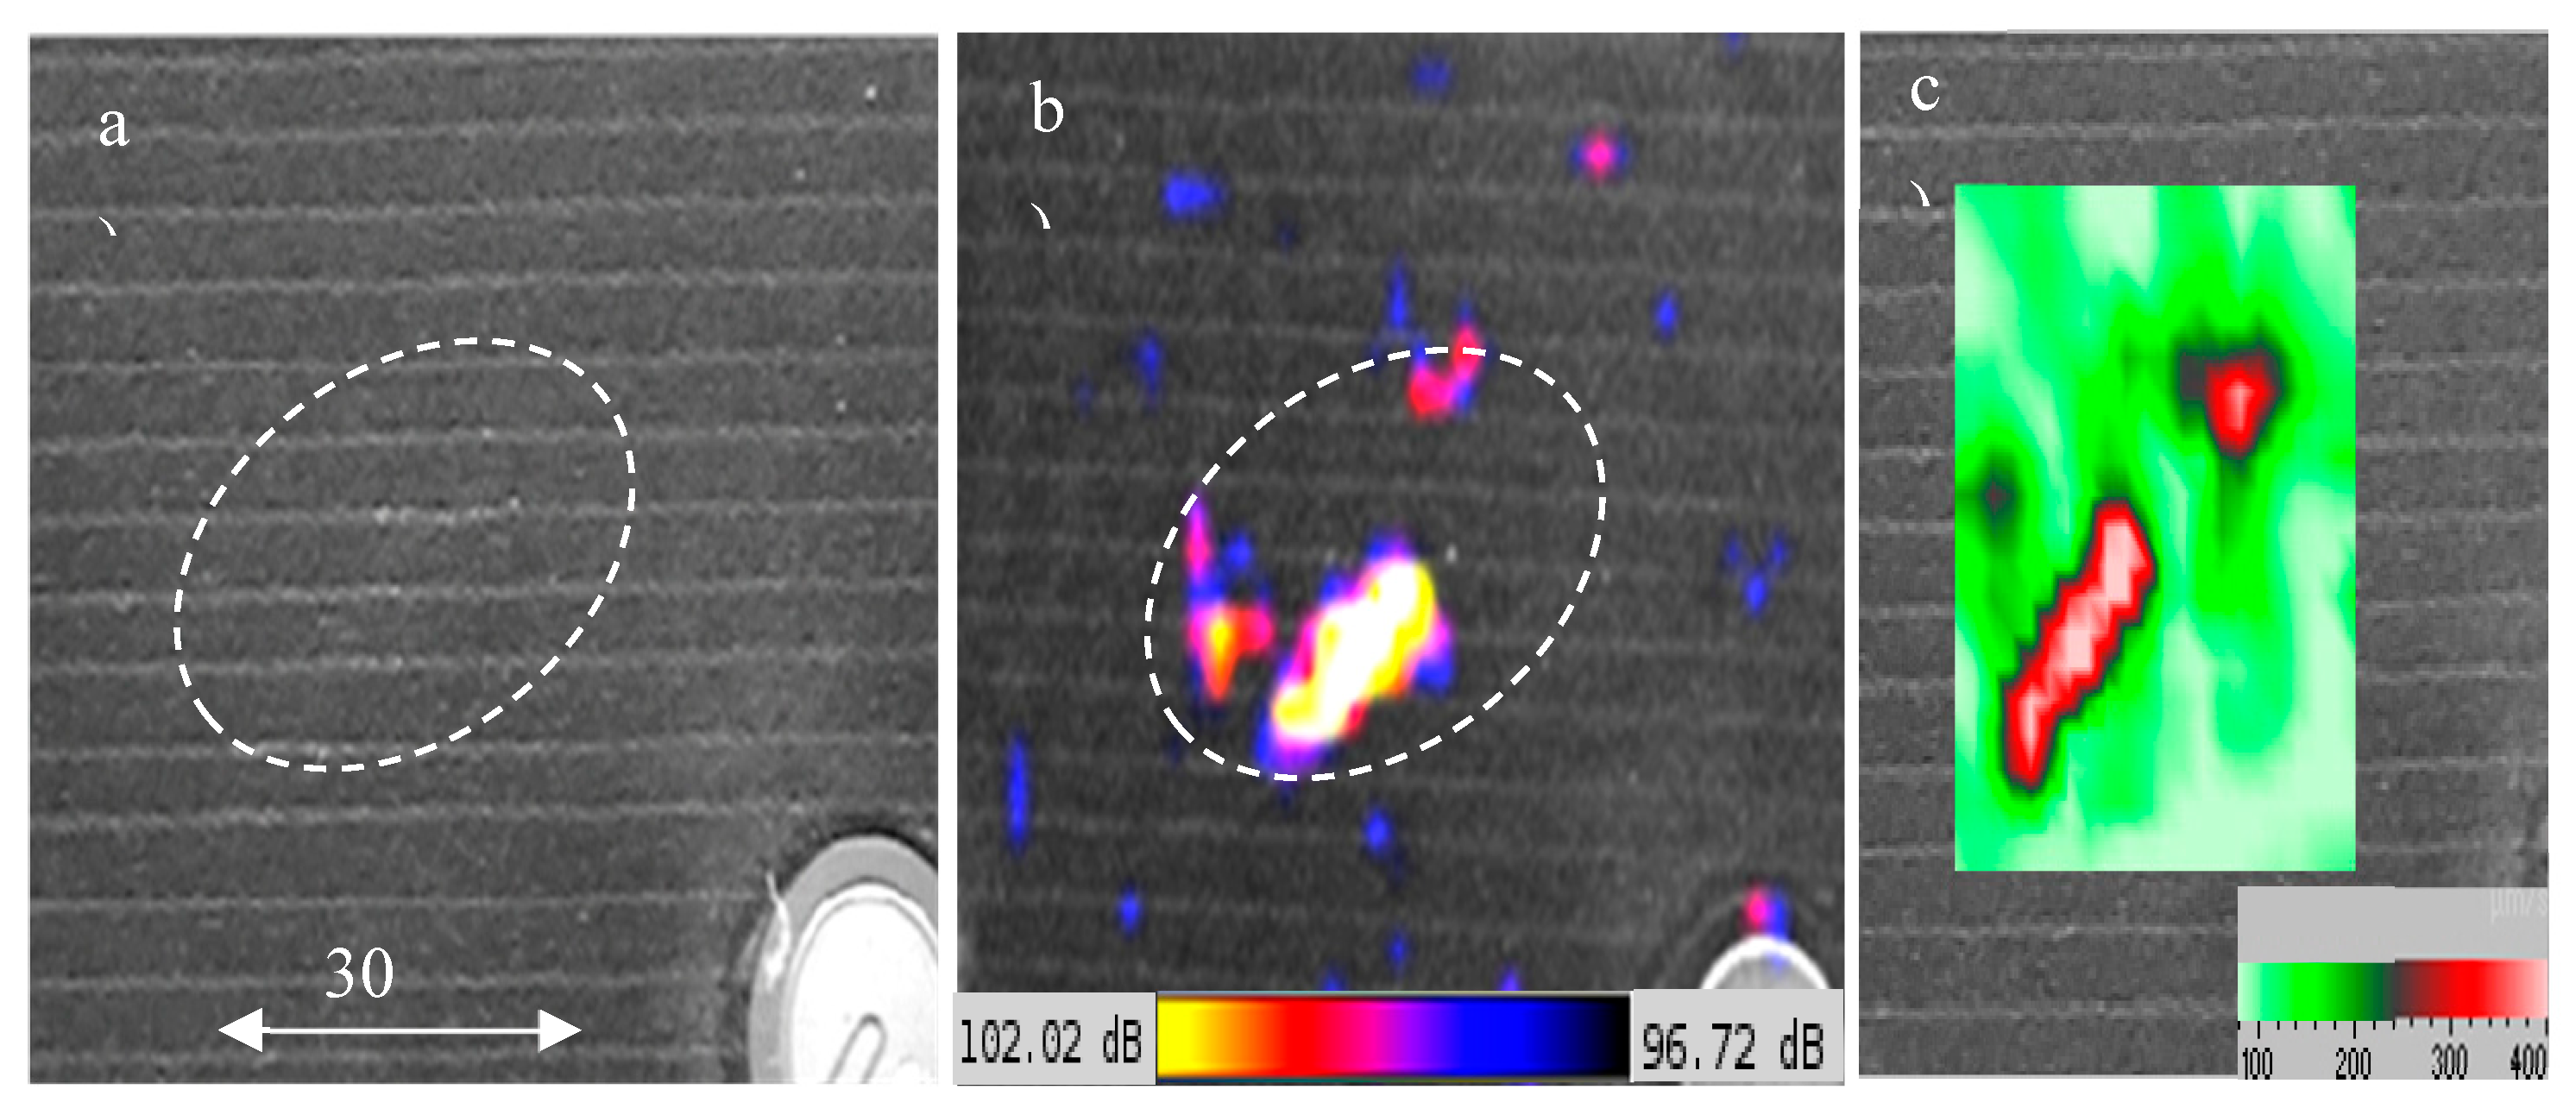

Table 1.
LDR for pores N1-N3.
| Pore | (kHz) | |
|---|---|---|
| N1 | 138.8 | 0.66c |
| N2 | 124.06 | 0.63c |
| N3 | 112.5 | 0.61c |
Disclaimer/Publisher’s Note: The statements, opinions and data contained in all publications are solely those of the individual author(s) and contributor(s) and not of MDPI and/or the editor(s). MDPI and/or the editor(s) disclaim responsibility for any injury to people or property resulting from any ideas, methods, instructions or products referred to in the content. |
© 2024 by the authors. Licensee MDPI, Basel, Switzerland. This article is an open access article distributed under the terms and conditions of the Creative Commons Attribution (CC BY) license (http://creativecommons.org/licenses/by/4.0/).
Copyright: This open access article is published under a Creative Commons CC BY 4.0 license, which permit the free download, distribution, and reuse, provided that the author and preprint are cited in any reuse.


