

Submitted:
05 August 2024
Posted:
05 August 2024
You are already at the latest version
Abstract
Froth flotation, a widely used mineral beneficiation technique, generates substantial volumes of data, offering the opportunity to extract valuable insights from these data for production line analysis. The quality of flotation data is critical to designing accurate prediction models and process optimisation. Unfortunately, industrial flotation data are often compromised by quality issues such as outliers that can produce misleading or erroneous analytical results. A general approach is to preprocess the data by replacing or imputing outliers with data values that have no connection with the real state of the process. However, this does not resolve the effect of outliers, especially those that deviate from normal trends. Outliers often occur across multiple variables and their values may occur in normal observation ranges, making their detection challenging. An unresolved challenge in outlier detection is how far is far enough for an observation to be considered an outlier. Existing methods rely on domain experts’ knowledge which is difficult to apply when experts encounter large volumes of data with complex relationships. In this paper, we propose an approach to conduct outlier analysis on a flotation dataset. The approach uses a 2σ rule as the threshold to find quasi-outliers and multiple machine learning (ML) algorithms including k-Nearest Neighbour (kNN), Local Outlier Factor (LOF), and Isolation Forest (ISF) to identify true outliers. The approach then analyses the mutual coverage between quasi-outliers and outliers from the ML algorithms to identify the most effective outlier detection algorithm. We found that the outliers by kNN cover outliers of other methods. We use the experimental results to show that outliers affect model prediction accuracy and excluding outliers from training data can reduce the average prediction errors.
Keywords:
froth flotation
; outlier detection
; prediction error
; data quality
1. Introduction
Froth flotation is a physicochemical separation of economically valuable minerals of interest from their gangue [1,2]. This separation process occurs in organised cells in which the feed material (ie, ore) is treated until the valuable minerals are sufficiently recovered. In most industrial operations, sensors are used to measure key parameters of the flotation process leading to the production of large volumes of data for analysis. Recent advances in machine learning (ML) application offer opportunities to effectively use flotation data to design predictive and process control models for process optimisation. However, sensed flotation data are prone to quality issues, mainly outliers that compromise the reliability of the data and the accuracy of models derived from them. To leverage valuable insights from flotation data analytics, it is critical to have high-quality data to enable ML models to learn meaningful relationships to effectively monitor control systems, improve performance, and optimise processes.
Enhancing data quality is necessary as outliers can interfere with experimental analysis leading to biased predictions, misleading insights, and reduced generalisation [3]. Outliers may not always be bad observations in the dataset. It is worth mentioning that outliers can have exceptional information, in which case further investigation may be needed to ascertain their inclusion or removal from the dataset. As such, researchers scrutinize outliers to understand the factors that contributed to their generation, or unique circumstances that might have influenced their existence. This has led to outlier detection that serves a wide range of applications in various domains, including fraud detection [4], network intrusion [5], disease diagnosis [6], and fault detection [7]. Despite its acknowledged significance in diverse fields, outlier detection has not received adequate attention in mineral processing data analytics, representing a relatively under-explored topic. This limited focus can be attributed to; (1) outliers often perceived as errors to be discarded rather than interesting behaviours worth investigating, (2) the inherent complexity of data which makes it challenging to accurately identify outliers, and (3) the lack of domain-specific methods for the identification and interpretation of outliers.
Outliers are observations that deviate from a body of data [8,9]. They can generally be classified into three main categories, namely point outliers, collective outliers, and contextual outliers. Point outliers refer to observations that deviate extremely from the overall distribution of a dataset [10]. Collective outliers describe a group of observations that deviate from the distribution of the dataset [11]. Contextual outliers refer to observations that are extremely different in a specific context [9,12]. For example, a summer temperature of is normal but likely to be an outlier when recorded during winter. Within the mineral processing industry, factors such as faulty sensors, equipment malfunction, improper handling of missing data values, and unexpected fluctuations can produce any of these types of outliers in the production data [13]. As such, outliers should be carefully investigated using appropriate methods to effectively monitor process equipment and the data they generate. More importantly, outliers should be properly managed before making decisions based on analysis of the production data.
The flotation data represent dynamic relationships of key variables including feed variables (feed mineralogy, particle size, throughput, liberation), hydrodynamic variables (bubble size, air flow rate, froth depth, impeller speed), and chemical variables (reagent dosages, pulp chemical conditions) [14,15]. The interdependence of these variables makes it arduous to justify an observation as an outlier within the intricate web of relationships it shares with other variables. For instance, a decrease in Eh values in a flotation pulp measurement may not be an outlier observation. Instead, it may be attributable to an elevated iron sulphide content in the feed [16]. In addition, during communication, changes that occur in mineralogy and grinding media can impact significant changes in the pulp chemistry of flotation feed [17,18]. Again, these changes may not be outliers. Furthermore, sensing in mineral processing occurs in harsh environments [19] where sensors may frequently malfunction or fail, perpetuating inaccurate readings and compromising the data quality. Such variable associations and equipment conditions complicate the distinction between instabilities and outliers in the flotation data. To enhance the quality of flotation data, methods for outlier detection should be critically explored, while considering the intricate relationships among multiple variables.
Studies on outlier detection spans several decades and can be broadly categorised as: (1) statistical-based, and (2) distance-based, (3) density-based, and (4) prediction-based techniques [20]. Statistical methods such as Grubb’s test [21], Doerffel’s test [22], Dixon’s test [3], Peirce’s test [23] and Chauvenet’s test [24] are well known and efficient in detecting point outliers, especially those that occur in univariate datasets. Other works[13,25,26] have reported robust statistical methods of assessing outliers.
In recent years, a boxplot [27] technique for outlier detection has gained popularity in engineering domains. The boxplot utilises a concept of interquartile range (IQR) to visualise outliers. The is computed as , where is the first quartile and is the third quartile such that observations beyond the range to are considered potential outliers [28]. Other studies have used the minimum covariance determinant (MCD) and the minimum volume ellipsoid (MVE) to analyse multivariate data for outliers [29]. However, both MCD and MVE have some limitations as they become ineffective if the data dimension increases. Although statistically based methods are easy to implement, they are mostly sensitive to outliers, as their computation relies on the properties of mean, median, and standard deviation of the data. In addition, their concept follows an underlying assumption of normally distributed data, which is often not the case in real-world data. Furthermore, they are ineffective in detecting multivariate outliers especially those occurring in high dimension datasets.
Alternatively, distance-based methods [30,31] offer solutions to mitigate the limitations of statistical methods. Distance-based methods use distance metrics such as the Euclidean distance to calculate the distance between observations and identify outliers based on these distance relationships. Knorr and Ng [30] proposed a classical distance-based outlier detection technique. They defined a unified notion of outliers as follows. An object O in a dataset T is a UO(p, D)-outlier if at least, fraction p of the objects in T are ≥ distance D from O [30]. Ramaswamy [32], improved this concept by computing the distances K nearest neighbour (KNN) of observations and considered potential outliers as observations that fell beyond a specified neighbourhood. Distance-based methods have several drawbacks including (1) assumption that data is uniformly distributed which may not hold for heterogeneous data with varying distributions, (2) algorithm complexities which arise with high-dimension datasets, and (3) ineffective detection of outliers existing within dense cluster regions.
To overcome the shortfalls of distance-based methods, researchers have explored density-based outlier detection methods [33,34]. The most widely used density-based method is the local outlier factor (LOF) [35]. It adopts the concept of comparing the local density of an observation to the density of its neighbours. An observation is considered an outlier if it lies in a lower-density region compared to the local density of its neighbours. A score is computed to describe the degree of ‘outlierness’. This score is used to identify the exceptions in the data set whose divergence is not easily detected, as well as those that exist in high-dimensional subspaces [36,37]. Recently, several variants of the LOF have been explored, including local outlier probability (LoOP) [38], local correlation integral (LOCI) [39], and local sparsity coefficient (LSC) [40], local distance-based outlier factor (LDOF) [41]. Although density-based methods can capture local outliers, they tend to be ineffective when low-density patterns occur in a given dataset [42,43].
The task of detecting and confirming outliers in the flotation data is not straightforward, given the complexities associated with multiple variables as well as the diverse principles underlying various detection methods. Individual methods are effective only if their principles of detection apply. This means different methods would detect different outliers. As such, it is unclear what method to use and what threshold to set.
In this research, we propose an approach to conduct outlier detection in the flotation data. This approach addresses two main challenges; (1) many outliers are similar to and mixed with normal observations, and (2) outliers show different properties compared to normal observations from different perspectives. Our approach consists of four parts. First, a standard deviation factor of the outlier scores is used to determine which observations in the data are outliers. Second, we use a naive algorithm called Trend differential to identify quasi-outliers, including observations that visually form sharp peaks on the input features. Thirdly, we use different machine learning (ML) algorithms to identify outliers in the dataset from different perspectives. Fourthly, we analyse the coverage of quasi-outliers by outliers from the ML algorithms to confirm valid outliers and determine the effectiveness of the ML algorithms. The ML algorithms used in our work include k-nearest neighbour (kNN), Local Outlier Factor (LOF), and Isolation Forest (ISF).
Our approach addresses two key questions: (1) should multiple methods be used in detecting outliers and (2) how should the methods and their results be compared?
The contributions of this study are as follows:
- The standard deviation factor of two (2) is verified to be a suitable value to define the threshold for outlier detection.
- A method called trend differential is proposed to systematically identify visual outliers called quasi-outliers. These outliers are important as a starting point for our outlier detection work.
- An analysis of the coverage of outliers from different methods to examine the consistency of these methods. Our results show that the outliers by kNN algorithm covers most of the outliers by other methods making it the most effective.
- An analysis of the effect of outliers on model building. The result of the analysis shows that outliers can degrade the predictive power of predictive models by increasing prediction errors.
The remainder of this paper is organised as follows. We present in Section 2 the collection and pre-processing of the sensed flotation data used in this study. In Section 3, we present the outlier detection algorithms used in this study. In Section 4, we present the results and discuss the findings of this work in Section 5. Finally, we draw our conclusions in Section 6.
2. Dataset and Pre-Processing
2.1. Collection of Sensed Flotation Data
The dataset used in this study was obtained from a copper rougher flotation plant in South Australia. Figure 1 illustrates a schematic flow chart of the flotation operation. A primary rougher flotation stage, receives feed input from a conditioning tank, scavenger concentrate, and cleaner tailings. The rougher concentrate undergoes further flotation in a cleaner stage to enhance concentrate grade, while the rougher tailings are directed to a scavenger stage. The final concentrate and tailings are derived from the cleaner concentrate and scavenger tailings, respectively [44].
The rougher flotation is a pivotal stage in the operation that reaches approximately 50-60% recovery. An effective analysis of outlier detection of data from this stage can significantly help to detect operational errors early, improve process control, reduce chemical consumption, and loss of valuable minerals to tailings [45,46]. Given that the output of the rougher flotation stage influences key decision making and overall process performance, we analysed data from this stage in this study.
Table 1 shows the copper rougher flotation dataset consisting of ten input variables recorded every minute and a corresponding outcome variable. The outcome variable (i.e recovery) which indicates the performance of the operation was obtained from an Online Stream Analyser (OSA) results and computed using the expression in Equation 1:
where:
= concentrate grade
= feed grade
= tailings grade

Table 1.
Nomenclature of flotation variables and their respective notations.
| Variables | Location | Units | Notations | |
|---|---|---|---|---|
| Input | Feed grade | % | Grd | |
| Throughput | t/h | Thp | ||
| Particle size | % | PSD | ||
| Xanthate dosage | Tank 1 | ml/min | XT1 | |
| Xanthate dosage | Tank 4 | ml/min | XT4 | |
| Frother dosage | Tank 1 | ml/min | FD1 | |
| Frother dosage | Tank 4 | mm | FD4 | |
| Froth depth | Tank 1 | mm | FD1 | |
| Froth depth | Tank 2/3* | mm | FD2 | |
| Froth depth | Tank 4/5 ▵ | mm | FD4 | |
| Outcome | Recovery | % | Rec |
* Tank levels of tank 2 and 4 represent tank 3 and 5, respectively. ▵ Froth depth of tank 2 and 4 represents tank 3 and 5, respectively
Figure 2 visualises a normalised measurements of the copper rougher flotation input variables with 20,000 observations.
2.2. Pre-Processing of Sensed Flotation Data
Data from industrial operations often have quality issues stemming from improper instrument calibrations or processes operating under quasi-stable conditions [29]. A meticulous cleaning process is essential to acquire accurate operational data values for analysis. Before conducting the outlier detection experiment, we cleaned the sensed flotation data by removing records with missing and wrong values. For example, in a typical flotation operation, a zero record for variables such as feed grade, throughput, and particle size distribution implies that there is no feed material (ore) in the plant. This scenario is highly implausible since operating an empty plant serves no purpose. Therefore, records with zero data values that are indicative of operational instabilities such as shutdown and maintenance periods were excluded from the dataset.
We illustrate this phenomenon using one of the input variables from the sensed flotation dataset: throughput. Throughput is a measure of the quantity of ore processed within a given time [47]. When the throughput is zero, it indicates several possibilities: either there is no feed in the plant or the plant is not operational. However, the effect extends beyond the absence of feed, such that when the throughput is turned back on, there is a period during which the plant is settling into operation. For example, when the throughput drops to zero and remains off for 60 minutes all observations within this period for all input variables should be excluded from the dataset during experimental analysis. Further, when the feed is turned back on there is a period (usually three residence times, about 90 minutes) where circulating loads, reagent additions, air and level controls are slowly returning to equilibrium [2]. Observations within this period should be excluded from the experimental analysis, as they do not accurately reflect the flotation behaviour. Figure 3 shows the visualisation of the throughput variable in the copper rougher flotation data analysed in this study. Instances of zero throughput data values, indicated in orange, can be observed continuously over a long period of time in the dataset. Simply removing these observations would disrupt the continuity of the time sequence. Therefore, we tag these observations and exclude them from further analysis in this study.
Table 2 shows the descriptive statistics of the dataset excluding the tagged observations.
3. Methodology
In this section, we present the outlier detection methods used in this study in Section 3.1, Section 3.2, and Section 3.3. We formerly describe our method of identifying quasi-outliers and validating them in Section 3.4 and Section 3.5. The selected methods include k-nearest neighbor (kNN), local outlier factor (LOF), isolation forest (ISF). kNN method leverages the distances between an observation and its neighbours to detect outliers. LOF assesses outliers by comparing the local densities of observations with that of their neighbours. ISF identifies outliers by analysing the number of steps required to isolate observations from others using an ensemble of decision trees.
3.1. kNN
kNN [48] is a widely used technique for outlier detection in data mining. It determines outliers based on the distance of an observation to its nearest neighbours (k-distance). Distances are computed using metrics such as Euclidean, Manhattan, and Mahalanobis. A score is computed for each observation as the ratio of the sum of the distances to its nearest neighbours and the k value ( Equation 2). Observations with scores beyond a specified (user-defined) threshold are flagged as outliers.
Where:
= observation
= the nearest neighbour of
k = number of nearest neighbours of
3.2. LOF
The LOF [35] method utilizes a concept of comparing the local density of an observation to the local density of its neighbours to identify outliers. It computes an outlier score where observations with local densities lower than the local densities of their neighbours are assigned higher scores. Figure 4 shows an observation O and it’s three nearest neighbours (k = 3) given as p1, p2, and p3. LOF measures the distances from O to its nearest neighbours using the expression in Equation 3 and determines a reachability distance (reach-dist) as the maximum distance of either the k-distance of O or any of the distances measured using Equation 4. Furthermore, the algorithm computes a local reachability distance (LRD) for the observations as the inverse of the average reachability distance of O from its k-nearest neighbours as expressed in Equation 5. The LRD of each observation is then compared with the average LRD of its k-nearest neighbours. Lower LRD values imply that an observation is likely to be in a lower density region. Finally, an LOF score is calculated as the average of the ratio of the LRD of an observation to that of its k-nearest neighbours. Equation 6 estimates the LRD of observation P. Intuitively, when the LRD of P is lower than that of its k-nearest neighbours, it receives a higher LOF score that indicates a higher probability of being an outlier. If the observation P is not an outlier, the average LRD of its neighbours is approximately equal to its LRD.
Where:
n = number of observations
= reachability distance of O within its k nearest neighbours
= the distance from O to its nearest neighbours
= the local reachability distance of the point P
= the set of k-nearest neighbours of observation P
= the reachability distance between observations P and O
= the cardinality of the set .
3.3. ISF
Isolation Forest (ISF) [49] builds decision trees that recursively partition datasets to isolate outliers or anomalies. It leverages the concept of isolation in identifying observations that deviate significantly from most of the observations. The key intuition is that outlier observations are typically isolated with fewer splits in a decision tree than non-outlier observations. This isolation process is repeated for each observation, and the number of splits required to isolate a point measures its abnormality. The algorithm calculates the number of partitions needed to isolate a given observation and counts a path length from the root to the terminating node where the observation is located. The partitions are based on the homogeneity of the dataset. Observations with shorter path lengths are most likely to be considered as outliers.
More formally, for a given data set having N observations, D dimensions, and , , the isolation forest constructs trees by randomly sampling a subset of the size data . A feature and splitting value within the interval are randomly selected. Randomisation ensures that trees are diverse and uncorrelated, making the algorithm less sensitive to the specific distribution of the data. The algorithm builds trees by splitting into two subsets and assigned to the left and right branches of the tree, respectively. This is repeated for all branches and trees in the forest until the tree reaches a depth limit.
To isolate an observation , the isolation forest computes a path length, , as the average path length of all the trees with n terminal nodes given by Equation 7. The expected path length is then normalized by , which is the average value of for n data records using the expression in Equation 8. An outlier score for the i-th observation in the dataset is defined by Equation 9. When , it guarantees that the sample anomaly score, denoted , is equal to 0.5. Furthermore, as increases significantly, tends towards 0, and when becomes much smaller than , tends towards 1. This facilitates the establishment of a threshold, denoted as , where an observation is flagged as an outlier if its score exceeds .
Where:
= the n-th harmonic number estimated from , where is the Euler-Mascheroni constant [50]. c = the average path length used to normalize
n = the number of observations
= the average of .
3.4. The Rule
True outliers are important for the evaluation of the effectiveness of the above algorithms and the impact of outliers on predictive models. However, true outliers are generally not available in real applications unless the experts in the applications label them based on application contexts. For this reason, in research, synthetic true outliers are often implanted into the dataset for detection [51].
True outliers are unknown in the dataset from our study. Generated synthetic outliers may not be suitable for the application context. We utilize a statistical distribution principle to establish a metric (to be elaborated upon shortly) for outlier identification. Specifically, within the distribution of all observations with respect to the metric, any observation lying beyond 2 standard deviations from the mean of the metric is designated as an outlier. The outliers identified by this method are referred to as quasi-outliers in this study. Based on a normal distribution guideline, observations that are away from the mean count as 5% of total observations. We note that if true outliers are known for example from experts, they should be used to replace quasi-outliers. Quasi-outliers are not the same as true outliers and this will be demonstrated later in the experimental section. Nevertheless, we use quasi-outliers as a baseline to compare ML outlier detection algorithms.
3.5. Trend Differential (tr) and Quasi-outliers
To determine what thresholds are used to derive true outliers, the differentials tr (i,j) are calculated for every cell in the dataset. We formerly define the metric formerly as follows:
Given a score column s, with mean and standard deviation , the standard deviation factor (sf) for the value in the i’th row of s is given by Equation 10.
This factor reflects the (distribution) rareness of the values in the score column s. If , the observation is 5% rare and flagged as an outlier. The tr of a cell (i,j) is computed as the maximal of two differences expressed in Equation 11. One is the absolute difference value between the previous cell and that of , and the other is the absolute difference between the value of and that of the next cell .
Next, Equation 10 is applied to each column of . Then the score factors of the columns of a row are summarised in a total score factor for the row using Equation 12.
Quasi-outliers are observations whose standard deviation factor is .
4. Results
In this Section, we present the outcomes of our experiments for the outlier detection algorithms presented in the previous section. Our objective is to analyse the effectiveness of these algorithms in detecting true outliers in the flotation data. In the following, we first present the results of neighbourhood size for kNN. Next, we present the quasi-outliers detected by the trend-differential method, and their properties through visualization. Then we compare the effectiveness of the outlier detection algorithms in Section 4.3. Finally, we present the impact of outliers on prediction performance in Section 4.7
All experiments were conducted on a personal computer with Intel(R) Core (TM) i5-10210U CPU @ 4GHz and 8GB memory with a Windows 10 operating system. The outlier detection algorithms were sourced from Scikit-learn open source libraries, except for the trend differential, and implemented using Python programming software for data pre-processing, experiments, and result analysis. For the analysis of the impact of outliers on predictive models, the dataset was split into 80% for training and 20% for testing when the predictive models were built.
4.1. Nearest Neighbourhood Size
The neighbourhood size k, is a user-defined parameter representing the number of nearest neighbours to be considered in calculating the outlier score. It is an important parameter in the identification of outliers. If , all observations get the same outlier score of 0 and If k equals the total number of records of the data set, all observations get the same distance. The appropriate k value can help differentiate rare observations from other observations [52,53]. By leveraging Euclidean distances, we use the elbow graph method [54] to optimise the parameter k using weighted averaging.
For each k from 3 to 100, the average error that predicts the outcome is calculated for all observations following the prediction of k nearest neighbour. From k and its average error, a graph is plotted. The elbow point is the inflexion point at which the down-trend of the line is changing to the horizontal trend.
Given the following definitions:
- : Euclidean distance for the j-th nearest neighbor of the i’th observation.
- : Corresponding target value for the j-th nearest neighbor
We define
where:
and represent the weighted sum and sum of distances for the ’th observation.
The error for each observation i is computed as the absolute difference between the actual target value and the weighted average:
This error is then accumulated to obtain a total error for the current k:
By deriving the total errors for each k, we can identify the optimal k that minimizes the total error. The results are visualized by plotting the corresponding total errors against k, facilitating a clear identification of the optimal k. This approach provides a robust framework for determining the optimal k for the flotation data used in this study.
Figure 5 shows an elbow graph of error measures against k-distance values. The curve takes a bend for k values greater than 20 and plateaus as the neighbourhood size increases. According to the graph, we adapt a neighbourhood size of in this study for the detection of outliers in the sensed flotation dataset.
4.2. Quasi-Outliers
Based on the definition of quasi-outliers in Equation 12, 150 quasi-outliers were obtained from the dataset. Figure 6 shows a plot of the first 50 quasi-outliers on every feature variable where the y-axis is the normalised feature value and the x-axis is the time when the observation was taken. The feature values are plotted in blue and the quasi-outliers are plotted in red coloured vertical lines which indicate the time dimension when the outlier occurs. It can be seen that the outliers exist mostly in regions where the data peaks or drops and reflect across some input variables.
Now we use Figure 7 to show worst quasi-outlier observations with their k-nearest neighbours where the red line is the outlier and the blue line is it’s k-nearest neighbours. It can be seen that the normal observation follows the clusters of its neighbours, whereas the outlier observation deviates from the clusters of its neighbours at some input variables. In Figure 7 a significant deviation can be seen in the input variables XT1, XT4, FT1, FT4, Grd, and FD4. In our application, the variable(s) where the deviation occurs can be inspected by operators or experts to determine what may be causing the production of the erroneous observations.
4.3. Effectiveness of the Outlier Detection Algorithms
We now assess the effectiveness of the outlier detection algorithms quasi-outliers in the dataset. Although, the individual outlier algorithms detect quasi-outliers, they do not rank them equally. This means that top-ranked quasi-outliers may not be ranked among the top outliers from other algorithms. This is correct as each algorithm follows a different principle in its detection. Nevertheless, all algorithms rank quasi-outliers at the top as the worst outliers and non-outliers at the bottom [55]. We analyse the effectiveness of outlier detection algorithms using the cover rate presented in the following section.
4.3.1. Cover rate (CR)
We obtain a ranking of the quasi-outliers and determine their coverage by the detection algorithms. By coverage, we mean that a quasi-outlier is considered covered by an algorithm g if the record index i of the quasi-outlier is in the outliers O of g or a sequential neighbour i’ of i is in O where the neighbour must be in [i-, i+] and is a time range to reflect the fact that the flotation response to an event takes a period of up to 20-30 minutes. In this experiment, we explore the results for in 3, 5, 10, and 15 minutes.
We use Figure 8 to show the coverage of the first 50 quasi-outliers by different methods. Quasi-outliers are plotted in Figure 8(a) and algorithm coverage are plotted for kNN in Figure 8(b), LOF in Figure 8(c), and ISF in Figure 8(d). The red circles (’o’) represent the quasi-outliers and the blue markers (’x’) represent the outliers from the detection algorithms.
The total coverage rate, of all quasi-outliers by an algorithm is defined in Equation 17 as:
where:
is the number of quasi-outliers covered.
is the total number of quasi-outliers.
We present in Table 3 the ranking of the first 50 quasi-outliers. The first column represents the quasi-outlier observations with their corresponding ranking in the second column. The next three columns show their rank coverage positions for kNN, LOF, and ISF. Quasi-outliers that are not covered within of a detection algorithm are assigned an * for the rank position. In Table 4 we present the CR of the detection algorithms for different cover ranges. From the table, we observe that; (1) kNN obtained the highest CR, followed by LOF, then ISF across all the ranges investigated with maximum CR of 0.84, 0.65, 0.63 for kNN, LOF, and ISF, respectively, (2) when the time range reaches 10, the coverage stabilises and does not improve any further.
4.4. Covered Quasi-Outliers
We show in Figure 9 quasi-outliers that are covered by the detection algorithms. We note that these outliers represent true or confirmed outliers and should not be ignored. Figure 9(a) shows all outliers covered by the detection algorithms (plotted in red). The outliers mark the time dimensions where significant deviations occur, characterised by peaks and jumps across all the input variables. We present in Figure 9(b) a worst covered outlier observation showing jumps across the input features. This means that they cause rippling effects across multiple variables, leading to extensive compromise of the observation and the outcome it generates.
4.5. Uncovered quasi-outliers
Now, we analyse the quasi-outliers discovered by the detection algorithms. We plot all uncovered quasi-outliers in Figure 10(a). We found that all these uncovered quasi-outliers have the property of a one-sided trend jump. One-sided trend means that before the time of the outlier observation, variables take similar values, at the time of the outlier, the values of some variables have either jumped up or down. After the outlier time index, the variables take similar values again (but maybe at new value levels for some of them).This phenomenon can be observed in Figure 10(b) with one-sided jump before the observation in variables FD and one-sided drop before the observation in variable PSD. A normal outlier has a two-sided trend change to make the observation different from others, making the observation detected by other algorithms. The observation at the one-sided trend change is either similar to its neighbours before the observation or similar to its neighbours after the observation, and this similarity indicates that the outliers at the one-sided trend change are falsely identified by the trend differential algorithm. As a result, quasi-outliers uncovered by kNN can be ignored.
4.6. Non-Covering kNN, LOF, and ISF Outliers
The following question is whether outliers detected by kNN, LOF, and ISF which do not cover any quasi-outlier are important or should they be ignored? We analyse the outliers from the detection algorithms and present in Table 5 the number of non-covering outliers. We represent non-covering outliers from kNN, LOF, and ISF by , LOF , and ISF respectively. We found 80 outliers as , 11 as , and 2 as . The analysis also revealed that ∈. As such we considered only and in further analysis.
Figure 11 visualises the time dimension for all variables. Figure 11(a) shows all the whereas Figure 12(b) shows the worst observations.
We use Figure 12(b) to show how these outliers are validated. Considered the group A of outliers near time=15000 in Figure 12(b). Their sequential neighbours are coloured yellow in the Thp and FD1 subplots. 2.5 hours before the outlier (near time=14800), the subplots reflecting inputs (Grd, PSD, XT1, XT4, FT1, FT4, FD2,AND FD4) are stable except Thp, which has a deep dive. However after about 2 hours, Thp comes back to stable value while other inputs dimensions remain stable during this period. From the inputs, we expect that properties such as FD1 should remain stable, as well. However, FD1 shows a sudden drop as shown near time=15000. As is well known, the impact of a change in inputs to the flotation fades away within 0.5-1.5 hours, and the system should be stable. The sudden drop in FD1 for this group of outliers is hard to explain. So, we conclude that they are true outliers. The non-covering kNN Outliers (in Figure 11(a)) demonstrate the same ’hard to explain’ property. We conclude that they are true outliers.
Similarly, we visualise in Figure 12. Figure 12(a) shows all whereas Figure 13(a) shows the worst observations. In Figure 13(a), the yellow rectangle shows the time dimension and variable (XT1) where the worst occurs. The observations in this region have a density relatively lower than that of their neighbors. As such, the LOF algorithm rightly detects them as outliers.
We conclude that both and observations should not be ignored. In our application, we recommend that such outliers should be carefully inspected in consultation with the domain knowledge of operation.
We summarize the experimental results as follows:
- The common outliers by kNN and trend differential method are obvious outliers and the trend differential method helps validate these.
- The kNN outliers that are not trend differential outliers are subtle and not visually obvious. Based on our analysis, they are valid outliers.
- kNN identifies almost all outliers, while LOF adds a few subtle ones. In our application, we recommend that such outliers should not be ignored, rather they should be carefully inspected.
4.7. Impact of Outliers on Prediction Performance
So far we have argued that the method of deriving quasi-outliers is effective in identifying suspicious observations and the outlier algorithms have confirmed worst quasi-outliers in the dataset. Now we train predictive models using the flotation dataset with and without outliers to show the impact of outliers on predicting flotation performance.
Firstly, we investigate model performance when different levels of quasi-outliers are removed from the training dataset. Next, we train a model on a ’normal’ observations and compare the models’ performance on different test data sets. The models are then evaluated using the performance metrics of the root mean squared error (RMSE) and the mean absolute percentage error (MAPE) expressed in Equations 18 and 19, respectively, where n is the total number of observations in the data set, is the actual value of the dependent variable for the observation, is the predicted or estimated value of the dependent variable for the observation. A model with smaller values for both metrics is better. We evaluated the accuracy of the prediction performance of the model using Equation 20. Higher values indicate better model performance.
We present in Table 6 the impact of quasi-outliers on prediction performance. The results show different levels of quasi-outlier removal on the model performance assessment for both training and testing datasets. Overall, increasing quasi-outlier removal leads to a reduction in prediction errors and more accurate predictions. In this case, a mean absolute percentage error (MAPE) of 0.62% was achieved for predictions on test data containing quasi-outliers. After removing the top quasi-outliers, the prediction error for the test data decreased to about 0.22%, which is approximately one-third of the error when the quasi-outliers were included. This indicates that outliers can impact predictive model performance and must be carefully treated.
Secondly, we rank the dataset using kNN outlier score and apply a threshold as a cut-off to separate outliers from ’normal’ observations. From the ’normal’ observations, we randomly select 1000 observations and keep as ’unseen’ test data and use the remaining observations to train two models: model 1 with outlier observations and model 2 without the outlier observations as illustrated in Figure 13. Both models are tested using the ’unseen’ test data and assessed using the RMSE, MAPE, and .
The performance of Model 1 and Model 2 is presented in Table 7 and Table 8, respectively. The performance of model trained without outliers (Model 2) was better than the model with outliers (model 1) for both training, validation and testing. Model 1 achieved a RMSE of 0.0050, MAPE of 0.4715, and of 0.98. whereas model 2 had an RMSE of 0.0040, MAPE of 0.4072, and of 0.99 when tested on the ’unseen’ test data. This indicates that the outliers cause higher prediction errors and negatively impacts the prediction performance.
5. Discussion
In this study, we proposed a Trend differential approach and utilised a standard deviation factor (sf) to identify quasi-outliers in industrial flotation data. We then confirmed these quasi-outliers using ML outlier detection algorithms (kNN, LOF, and ISF). The outcome of the outlier algorithms indicates that our approach makes sense and captures majority of the worst outliers in the flotation dataset. The visualisation of the quasi-outliers also revealed significant break in trends across multiple variables. As the outlier algorithms utilise different techniques to detected outliers, we introduced a 5% control limit to capture rare observations in the dataset and demonstrated their effectiveness in identifying outliers in the flotation dataset. We also evaluated a model prediction performance with and without outliers.
The results indicate that outliers occur in diverse directions within the dataset, and detection algorithms effectively captured these intricate outliers. Furthermore, the study demonstrates how outliers affect the prediction of flotation performance, as they cause high prediction errors. This research was limited to three state-of-the-art outlier detection algorithms. Future studies can consider artificial neural networks (ANNs) applications for outlier detection in near real-time for monitoring mineral processing operations to generate quality data for analysis and decision making.
6. Conclusions
The following conclusions can be drawn from this study:
- The outlier detection algorithms are effective in enhancing data quality and their performance was assessed. The kNN model performed best compared to LOF and ISF in terms of the number of quasi-outliers detected and covered as kNN ranks majority of the worst outliers as top outliers. The effectiveness of the detection algorithms can be ordered as .
- Training data containing outliers can cause predictive models to make larger errors on non-outlier input records. The study showed that outliers have detrimental effects on prediction performance compared to ’normal’ observations. This negative impact of outliers should not be overlooked as they produce inaccurate performance outcomes, especially in high dimensional data.
- The dynamic nature of flotation processes makes distinguishing ’normal’ observations from outliers complex. Analysts should avoid rigidly applying predetermined thresholds for outlier detection without thorough investigations and consultation with industry experts. It is essential to assess the degree of outlier behaviour in flotation data using both analytical methods and domain knowledge to enhance data quality.
This research is highly significant to both the research community and the mineral processing industry. It demonstrates that unsupervised ML algorithms are effective in analyzing data from flotation operations. These algorithms can detect outliers, enhance data quality for predictive analysis, and improve process optimization for future planning and decision-making.
Author Contributions
Conceptualization, C.L. and J.L.; methodology, C.L.; software, C.L.; validation, C.L., J.L. and C.G.; formal analysis, C.L. and J.L.; investigation, C.L. and J.L.; resources, C.L., J.L., R.A.; data curation, C.L., J.L., R.A.; writing—original draft preparation, C.L.; writing—review and editing, J.L.,R.A.,C.G.,M.Z; visualization, X.X.; supervision, J.L.,R.A.,C.G.,M.Z; project administration, W.S.; funding acquisition, W.S. All authors have read and agreed to the published version of the manuscript.
Funding
This research was supported by the Australian Research Council Integrated Operations for Complex Resources Industrial Transformation Training Centre (project number IC190100017) and funded by universities, industry and the Australian Government.
Data Availability Statement
Data are not available for confidentiality reasons
Conflicts of Interest
The authors declare no conflicts of interest.
Abbreviations
| ML | Machine Learning |
| kNN | k-Nearest Neighbour |
| LOF | Local outlier factor |
| ISF | Isolation forests |
| LRD | Local reachability distance |
| RMSE | Root mean square error |
| MAPE | mean absolute percentage error |
| Trend differential | |
| CR | Cover rate |
| kNN non-covering outliers | |
| LOF non-covering outliers | |
| ISF non-covering outliers |
References
- Li, Y.; Lartey, C.; Song, S.; Li, Y.; Gerson, A.R. The fundamental roles of monovalent and divalent cations with sulfates on molybdenite flotation in the absence of flotation reagents. RSC advances 2018, 8, 23364–23371. [CrossRef] [PubMed]
- Wills, B. Wills’ Mineral Processing Technology: An Introduction to the Practical Aspects of Ore Treatment and Mineral Recovery, 8th ed.; Elsevier, 2016.
- Dixon, W.J. Analysis of extreme values. The Annals of Mathematical Statistics 1950, 21, 488–506. [CrossRef]
- Chandola, V.; Banerjee, A.; Kumar, V. Anomaly detection: A survey. ACM Computing Surveys (CSUR) 2009, 41, 1–58. [CrossRef]
- Safaei, M.; Asadi, S.; Driss, M.; Boulila, W.; Alsaeedi, A.; Chizari, H.; Abdullah, R.; Safaei, M. A systematic literature review on outlier detection in wireless sensor networks. Symmetry 2020, 12, 328. [CrossRef]
- Domingues, R.; Filippone, M.; Michiardi, P.; Zouaoui, J. A comparative evaluation of outlier detection algorithms: Experiments and analyses. Pattern Recognition 2018, 74, 406–421. [CrossRef]
- Bhosale, S.V. Holy Grail of Outlier Detection Technique: A Macro Level Take on the State of the Art. International Journal of Computer Science & Information Technology 2014.
- Hawkins, D.M. Identification of outliers; Vol. 11, Outliers (Statistics), British Library Cataloguing in Publication Data: Springer, 1980; p. 194.
- Smiti, A. A critical overview of outlier detection methods. Computer Science Review 2020, 38, 100306. [CrossRef]
- Jiawei, H.; Micheline, K. Data mining: concepts and techniques; Morgan Kaufmann, 2006.
- Pahuja, D.; Yadav, R. Outlier detection for different applications: review. International Journal of Engineering Research & Technology (IJERT) 2013, 2.
- Xu, S.; others. Data cleaning in the process industries. Reviews in Chemical Engineering 2015, 31, 453–490. [CrossRef]
- Dastjerdy, B.; Saeidi, A.; Heidarzadeh, S. Review of Applicable Outlier Detection Methods to Treat Geomechanical Data. Geotechnics 2023, 3, 375–396. [CrossRef]
- Mazzour, E.; Hodouin, D.; Makni, S. Optimal sensor implementation in metallurgical plants—an application to a generic mineral separation plant. Int. J. Miner. Process. 2003, 69, 185–203. [CrossRef]
- McCoy, J.; Auret, L. Machine learning applications in minerals processing: A review. Miner. Eng. 2019, 132, 95–109. [CrossRef]
- Greet, C.; Kyle, S. Continuous, real-time pulp chemistry measurements and what they tell us about metallurgical performance. Proceedings of the 12th International Mineral Processing Conference; , 2016.
- Greet, C.; Small, G.; Steinier, P.; Grano, S. The Magotteaux Mill®: investigating the effect of grinding media on pulp chemistry and flotation performance. Minerals Engineering 2004, 17, 891–896. [CrossRef]
- Li, C.; Gao, Z. Effect of grinding media on the surface property and flotation behavior of scheelite particles. Powder Technology 2017, 322, 386–392. [CrossRef]
- Owusu, K.B.; Skinner, W.; Asamoah, R.K. Acoustic Sensing and Supervised Machine Learning for In Situ Classification of Semi-Autogenous (SAG) Mill Feed Size Fractions Using Different Feature Extraction Techniques. Powders 2023, 2, 299–322. [CrossRef]
- Beckman, R.; Cook, R. Outlier………. s. Technometrics 1983, 25, 119–149.
- Grubbs, F. Sample Criteria for Testing Outlying Observations. Ann. Math. Statist. 1950, 21, 27–58. [CrossRef]
- Doerffel, K. Beurteilung von Analysenverfahren und-ergebnissen. Fresenius’ Zeitschrift für analytische Chemie 1961, 185, 1–98. [CrossRef]
- Peirce, B. Criterion for the rejection of doubtful observations. Astronomical Journal 1852, 2, 161–163. [CrossRef]
- Chauvenet, W. A Manual of Spherical and Practical Astronomy: Vol. II; BoD–Books on Demand, 2022.
- Davies, L.; Gather, U. The identification of multiple outliers. Journal of the American Statistical Association 1993, 88, 782–792. [CrossRef]
- Hampel, F. The influence curve and its role in robust estimation. J. Am. Stat. Assoc. 1974, 69, 383–393. [CrossRef]
- Siegel, A.; Morgan, C. Statistics and data analysis: an introduction, 2nd ed.; Wiley, 1996.
- Tukey, J. Exploratory data analysis, Vol. 2; Reading, MA, 1977.
- Xu, S.; et al.. Data cleaning in the process industries. Rev. Chem. Eng. 2015, 31, 453–490. [CrossRef]
- Knorr, E.M.; Ng, R.T. Algorithms for mining distance-based outliers in large datasets. Proceedings of the International Conference on Very Large Data Bases; , 1998; pp. 392–403.
- Kriegel, H.P.; Kröger, P.; Zimek, A. Outlier Detection Techniques, 2010.
- Ramaswamy, S.; Rastogi, R.; Shim, K. Efficient algorithms for mining outliers from large data sets. Proceedings of the 2000 ACM SIGMOD International Conference on Management of Data; , 2000; pp. 427–438.
- Tang, B.; He, H. A local density-based approach for outlier detection. Neurocomputing 2017, 241, 171–180. [CrossRef]
- Breunig, M.M.; Kriegel, H.P.; Ng, R.T.; Sander, J. Optics-of: Identifying local outliers. Proceedings of the Principles of Data Mining and Knowledge Discovery: Third European Conference, PKDD’99; Springer: Prague, Czech Republic, 1999.
- Breunig, M.M.; others. LOF: identifying density-based local outliers. Proceedings of the ACM SIGMOD International Conference on Management of Data, 2000, Vol. 10, pp. 142–149.
- Erich, H.P.; Zimek, S.A. Interpreting and unifying outlier scores. SIAM International Conference on Data Mining (SDM), 2011, Vol. 42.
- De Vries, T.; Chawla, S.; Houle, M.E. Finding local anomalies in very high dimensional space. IEEE International Conference on Data Mining, 2010, Vol. 10, pp. 142–149.
- Kriegel, H.P.; others. LoOP: local outlier probabilities. Proceedings of the 18th ACM Conference on Information and Knowledge Management; , 2009.
- Papadimitriou, S.; others. Loci: Fast outlier detection using the local correlation integral. Proceedings 19th International Conference on Data Engineering, 2003. Cat. No. 03CH37405.
- Agyemang, M.; Ezeife, C.I. Lsc-mine: Algorithm for mining local outliers. Proceedings of the 15th Information Resource Management Association (IRMA) International Conference; IRM Press: New Orleans, USA, 2004.
- Zhang, K.; Hutter, M.; Jin, H. A new local distance-based outlier detection approach for scattered real-world data. Proceedings of the Advances in Knowledge Discovery and Data Mining: 13th Pacific-Asia Conference, PAKDD 2009; Springer: Bangkok, Thailand, 2009.
- Tang, J.; Chen, Z.; Fu, A.; Cheung, D. Enhancing effectiveness of outlier detections for low density patterns. Proceedings of the Pacific-Asia Conference on Knowledge Discovery and Data Mining; , 2002; pp. 535–548.
- Zhang, J.; Yang, Y. Density-Distance Outlier Detection Algorithm Based on Natural Neighborhood. Axioms 2023, 12, 425. [CrossRef]
- Amankwaa-Kyeremeh, B.; Zhang, J.; Zanin, M.; Skinner, W.; Asamoah, R.K. Feature selection and Gaussian process prediction of rougher copper recovery. Minerals Engineering 2021, 170, 107041. [CrossRef]
- Ghodrati, S.; Nakhaei, F.; VandGhorbany, O.; Hekmati, M. Modeling and optimization of chemical reagents to improve copper flotation performance using response surface methodology. Energy Sources, Part A: Recovery, Utilization, and Environmental Effects 2020, 42, 1633–1648. [CrossRef]
- Yianatos, J.; Carrasco, C.; Bergh, L.; Vinnett, L.; Torres, C. Modelling and simulation of rougher flotation circuits. Int. J. Miner. Process. 2012, 112–113, 63–70. [CrossRef]
- Yap, A.; Saconi, F.; Nehring, M.; Arteaga, F.; Pinto, P.; Asad, M.W.A.; Ozhigin, S.; Ozhigina, S.; Mozer, D.; Nagibin, A.; others. Exploiting the metallurgical throughput–recovery relationship to optimise resource value as part of the production scheduling process. Minerals Engineering 2013, 53, 74–83. [CrossRef]
- Knorr, E.M.; Ng, R.T. A Unified Notion of Outliers: Properties and Computation. Proceedings of the Knowledge, Discovery and Data mining (KDD) conference; , 1997; pp. 219–222.
- Liu, F.T.; Ting, K.M.; Zhou, Z.H. Isolation forest. Proceedings of the 2008 Eighth IEEE International Conference on Data Mining; , 2008; pp. 413–422.
- Lesouple, J.; Baudoin, C.; Spigai, M.; Tourneret, J.Y. Generalized isolation forest for anomaly detection. Pattern Recognition Letters 2021, 149, 109–119. [CrossRef]
- Jha, H.S.; Khanal, A.; Seikh, H.M.D.; Lee, W.J. A comparative study on outlier detection techniques for noisy production data from unconventional shale reservoirs. Journal of Natural Gas Science and Engineering 2022, 105, 104720. [CrossRef]
- Boehmke, B.; Greenwell, B.M. Hands-on machine learning with R; Chapman and Hall/CRC, 2019; pp. 339–415. [CrossRef]
- Xu, H.; Zhang, L.; Li, P.; Zhu, F. Outlier detection algorithm based on k-nearest neighbors-local outlier factor. Journal of Algorithms & Computational Technology 2022, 16, 1–12. [CrossRef]
- Yuan, C.; Yang, H. Research on K-value selection method of K-means clustering algorithm. J 2019, 2, 226–235. [CrossRef]
- Huang, H.; Mehrotra, K.; Mohan, C.K. Rank-based outlier detection. Journal of Statistical Computation and Simulation 2013, 83, 518–531. [CrossRef]
Figure 1.
Schematic flow chart of the copper flotation operation indicating sensed data collected observations on rougher flotation stage. Grd - feed grade, Thp - throughput, PSD - particle size distribution, XT1 - xanthate dosage in tank 1, FT1 - frother dosage in tank 1, FD1 - froth depth in tank 1, XT4 - xanthate dosage in tank 4, FT4 - frother dosage in tank 4, FD4 - froth depth in tank 4.
Figure 1.
Schematic flow chart of the copper flotation operation indicating sensed data collected observations on rougher flotation stage. Grd - feed grade, Thp - throughput, PSD - particle size distribution, XT1 - xanthate dosage in tank 1, FT1 - frother dosage in tank 1, FD1 - froth depth in tank 1, XT4 - xanthate dosage in tank 4, FT4 - frother dosage in tank 4, FD4 - froth depth in tank 4.
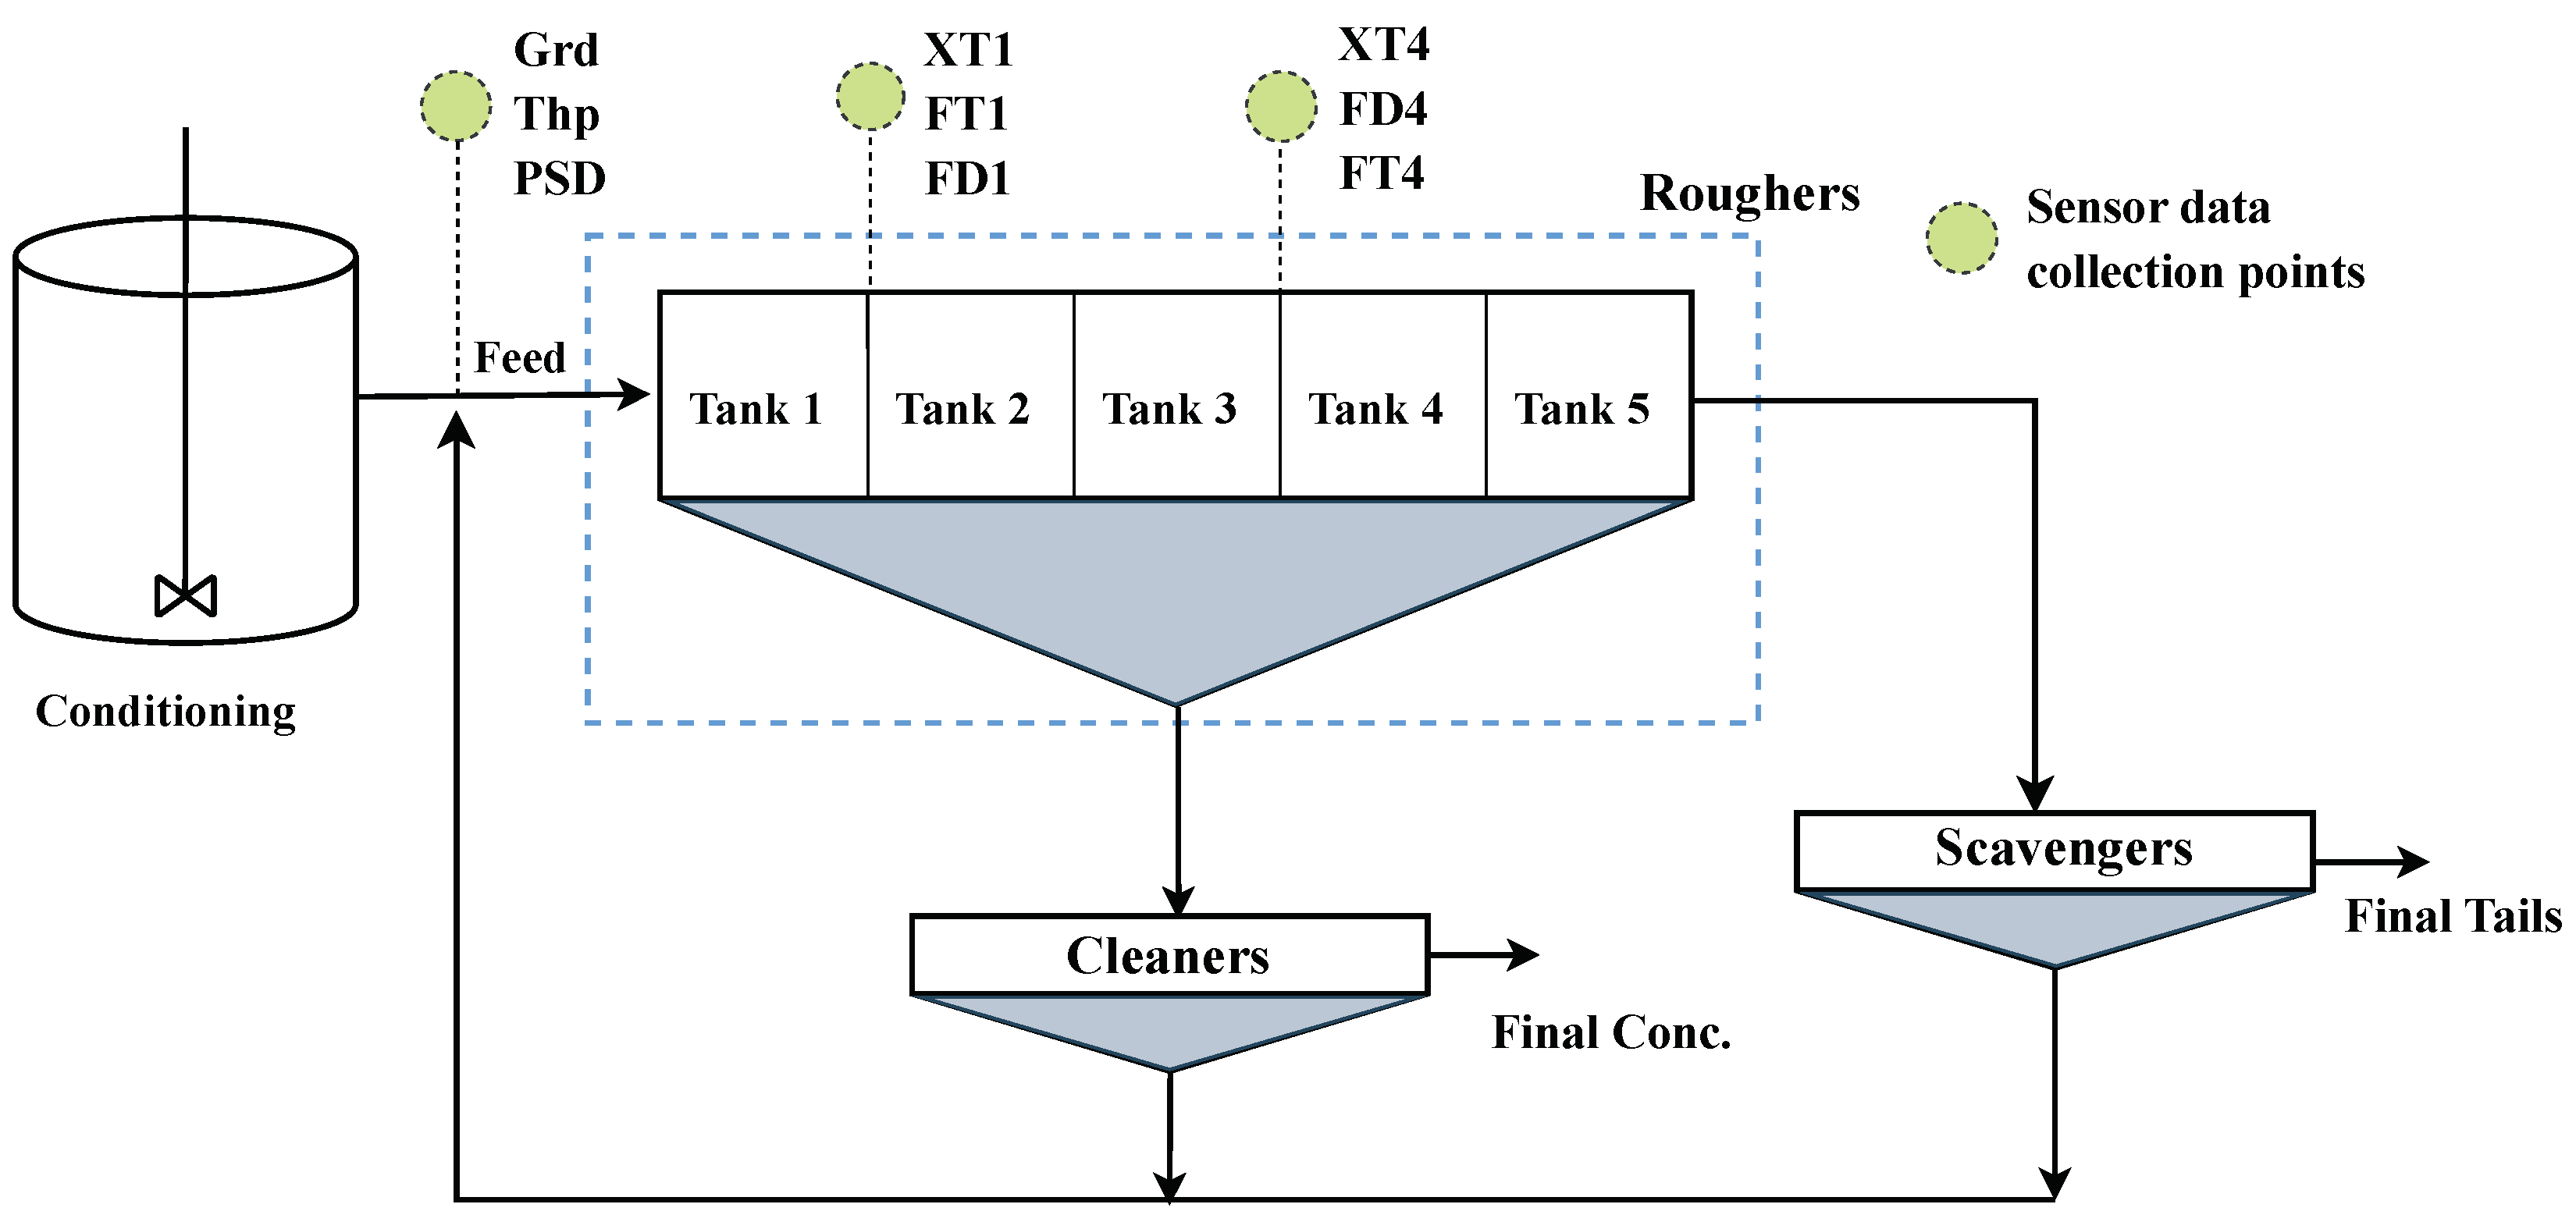
Figure 2.
Normalised measurements of input variables from a rougher flotation process. Grd - feed grade, Thp - throughput, PSD - particle size distribution, XT1 - xanthate dosage in tank 1, FT1 - frother dosage in tank 1, FD1 - froth depth in tank 1, XT4 - xanthate dosage in tank 4, FT4 - frother dosage in tank 4, FD4 - froth depth in tank 4.
Figure 2.
Normalised measurements of input variables from a rougher flotation process. Grd - feed grade, Thp - throughput, PSD - particle size distribution, XT1 - xanthate dosage in tank 1, FT1 - frother dosage in tank 1, FD1 - froth depth in tank 1, XT4 - xanthate dosage in tank 4, FT4 - frother dosage in tank 4, FD4 - froth depth in tank 4.
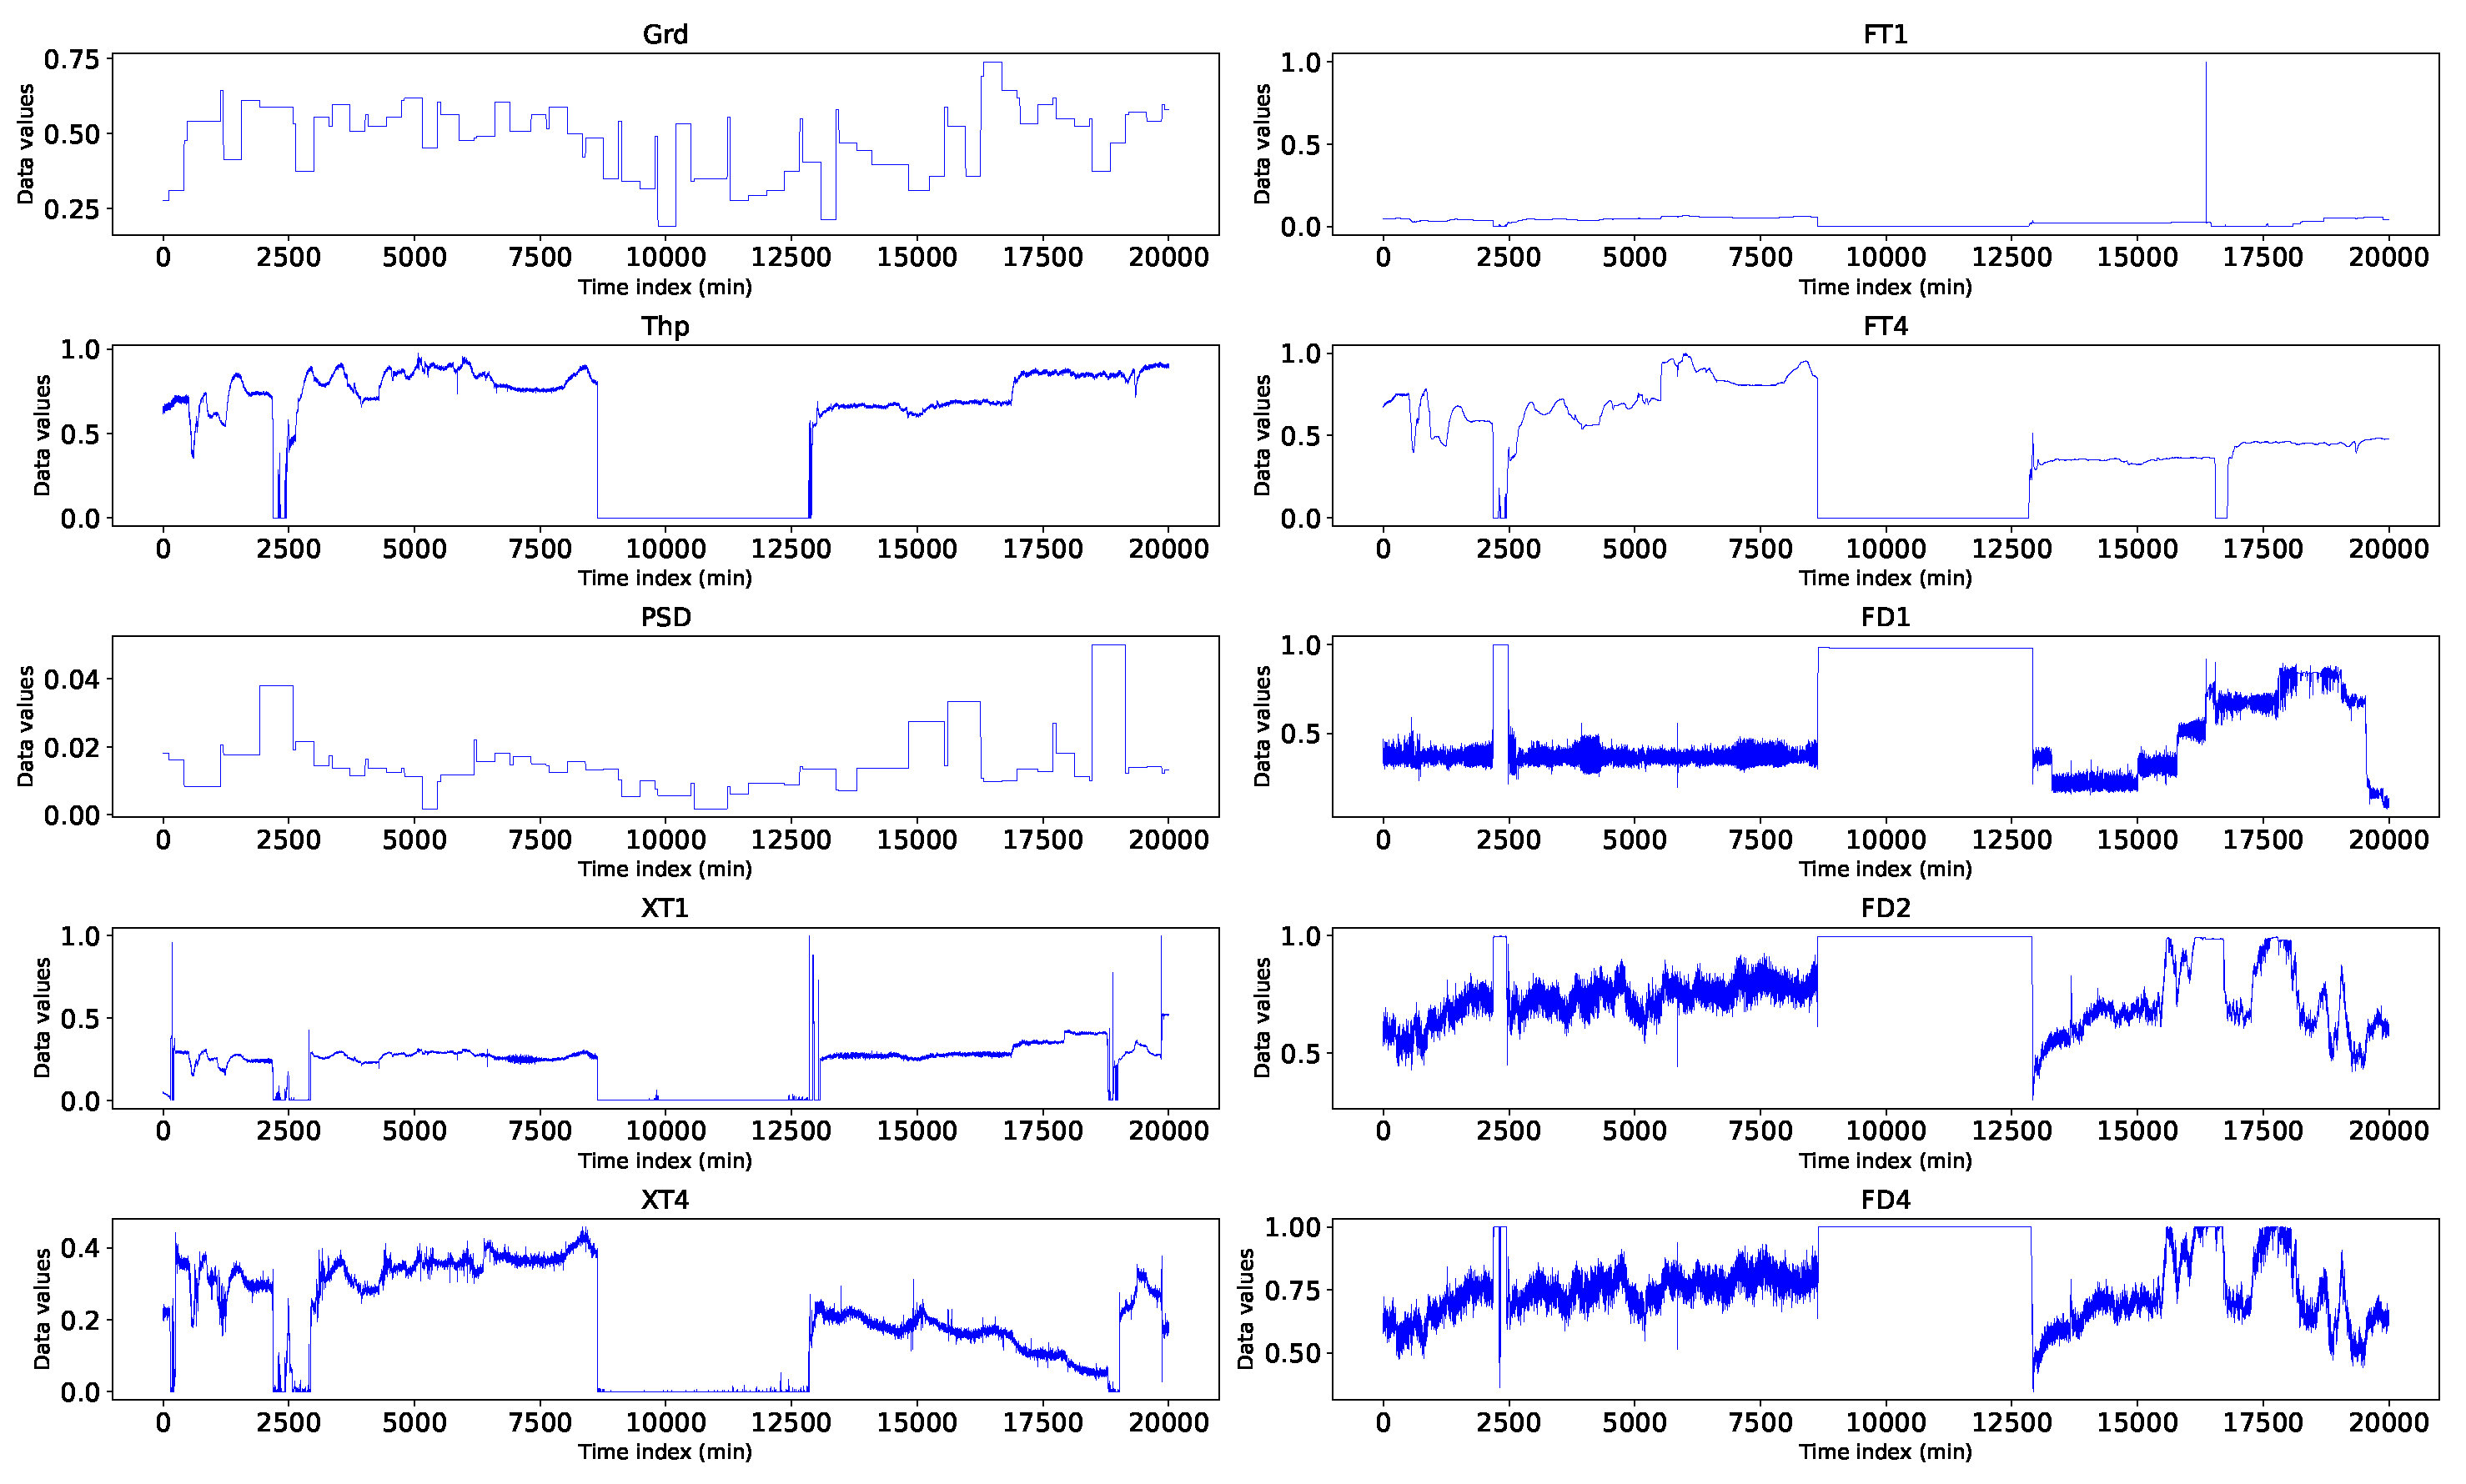
Figure 3.
Visualisation of throughput of the copper rougher flotation data highlighting observations with zero data values.
Figure 3.
Visualisation of throughput of the copper rougher flotation data highlighting observations with zero data values.
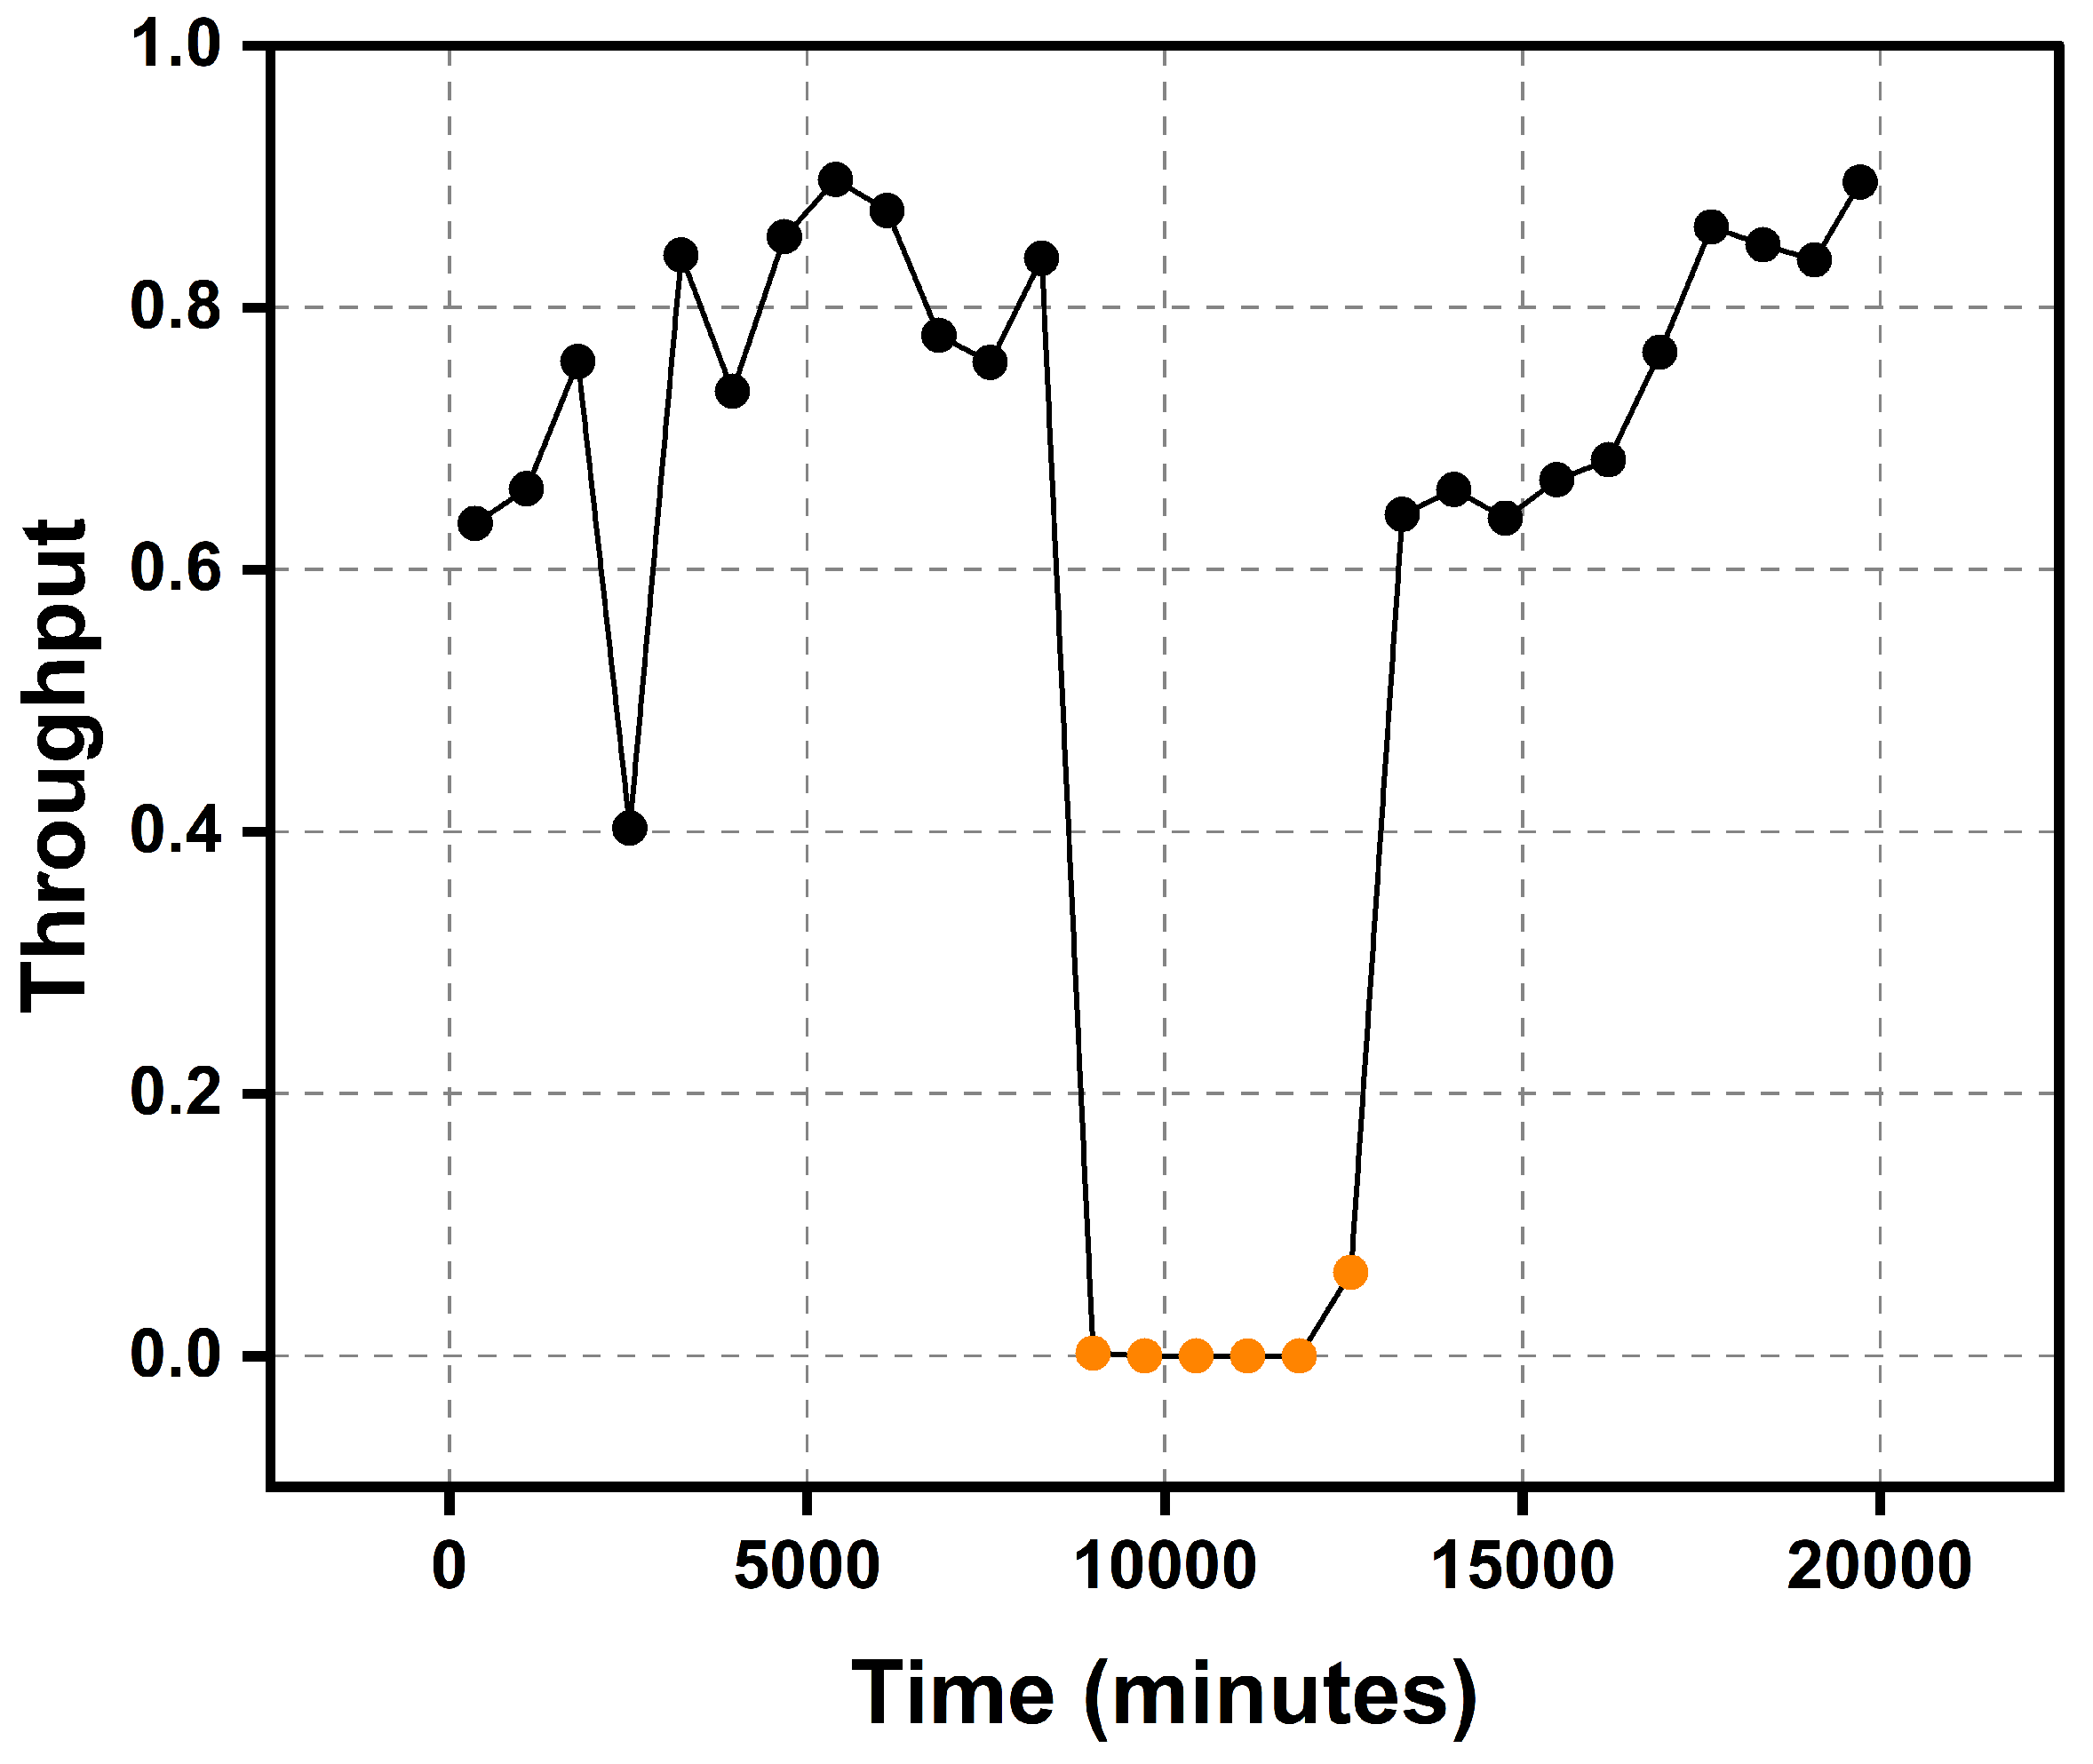
Figure 4.
Illustration of nearest neighbours and reachability distance, for k=3. k-dist(O) = is the distance from observation O to its nearest neighbours, reah-dist (p, O) = reachability distance of O.
Figure 4.
Illustration of nearest neighbours and reachability distance, for k=3. k-dist(O) = is the distance from observation O to its nearest neighbours, reah-dist (p, O) = reachability distance of O.
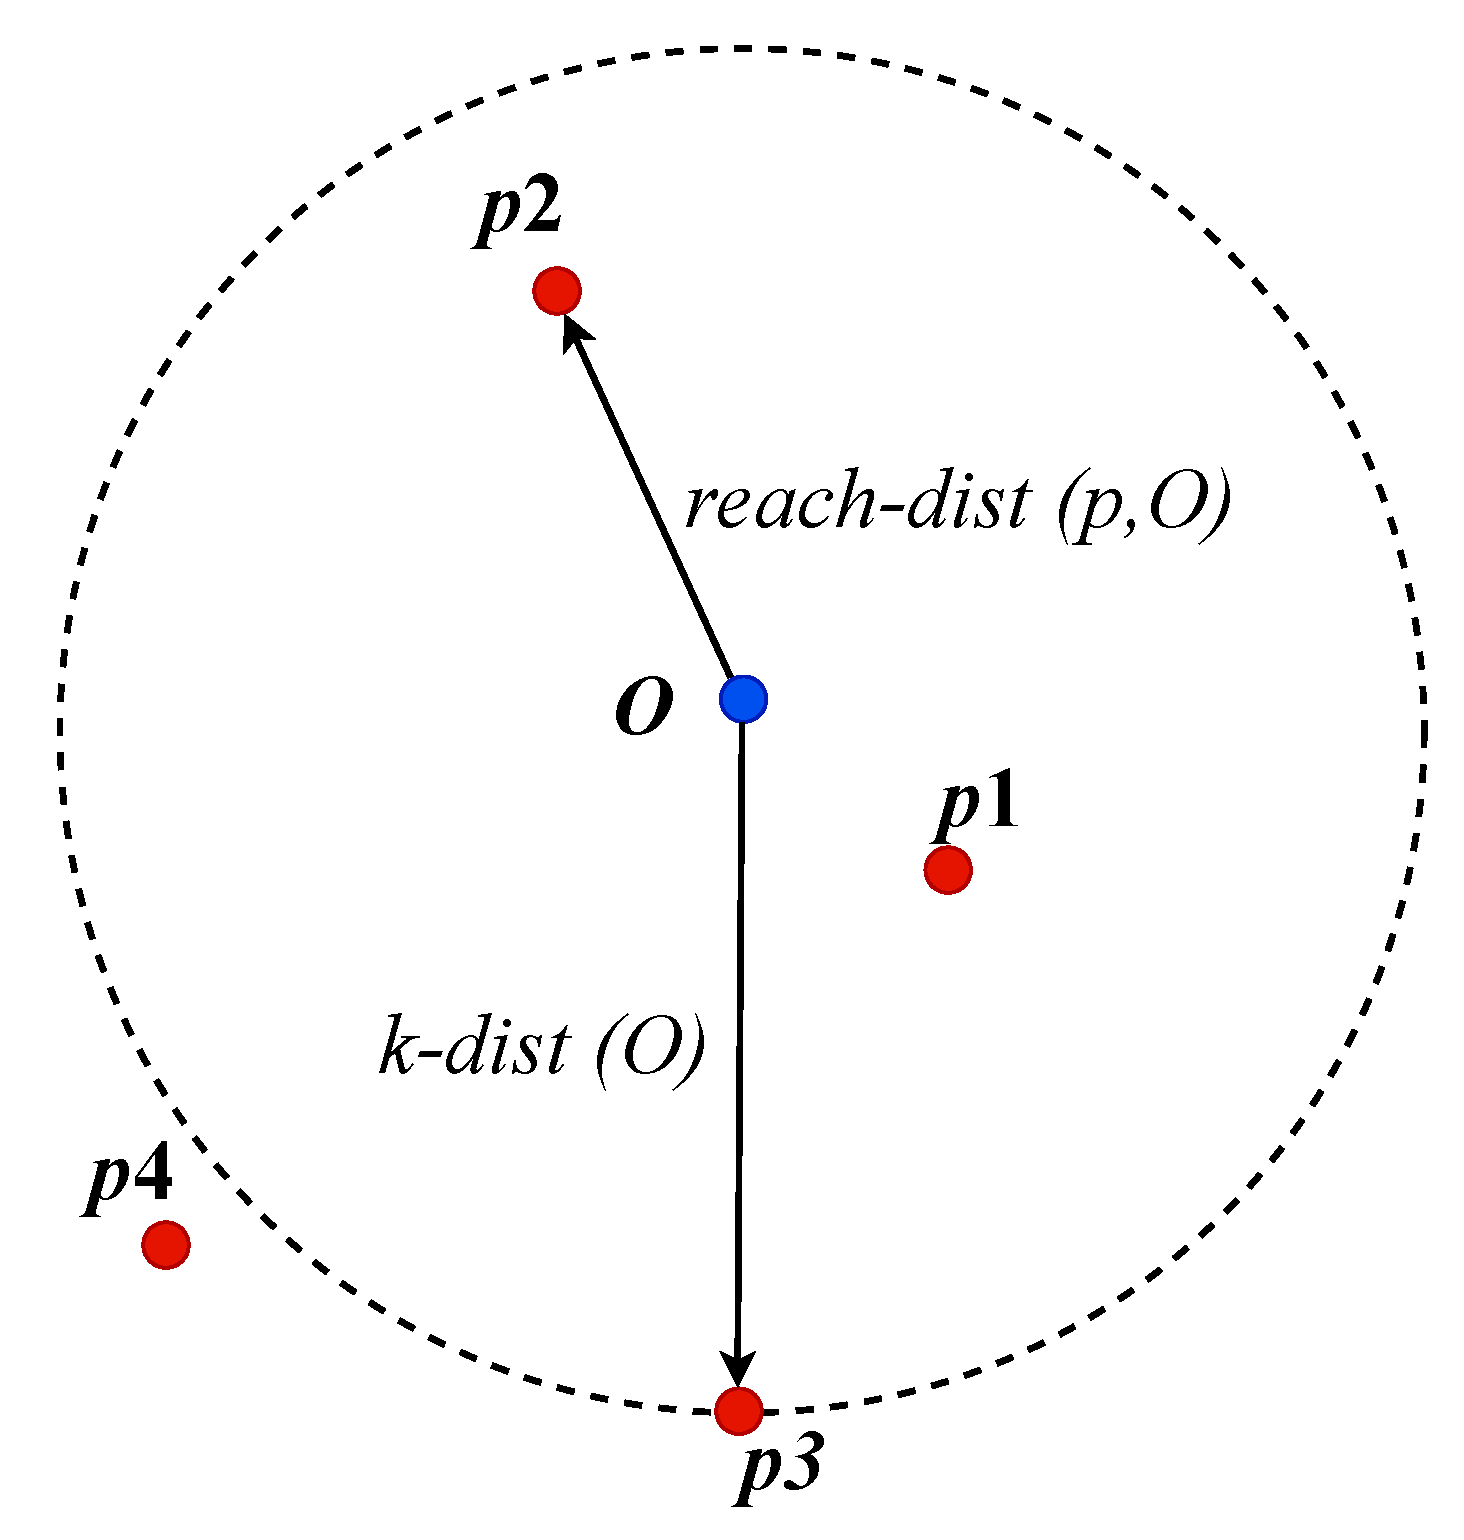
Figure 5.
Selection of nearest neighbourhood size (k) for the copper rougher flotation dataset.
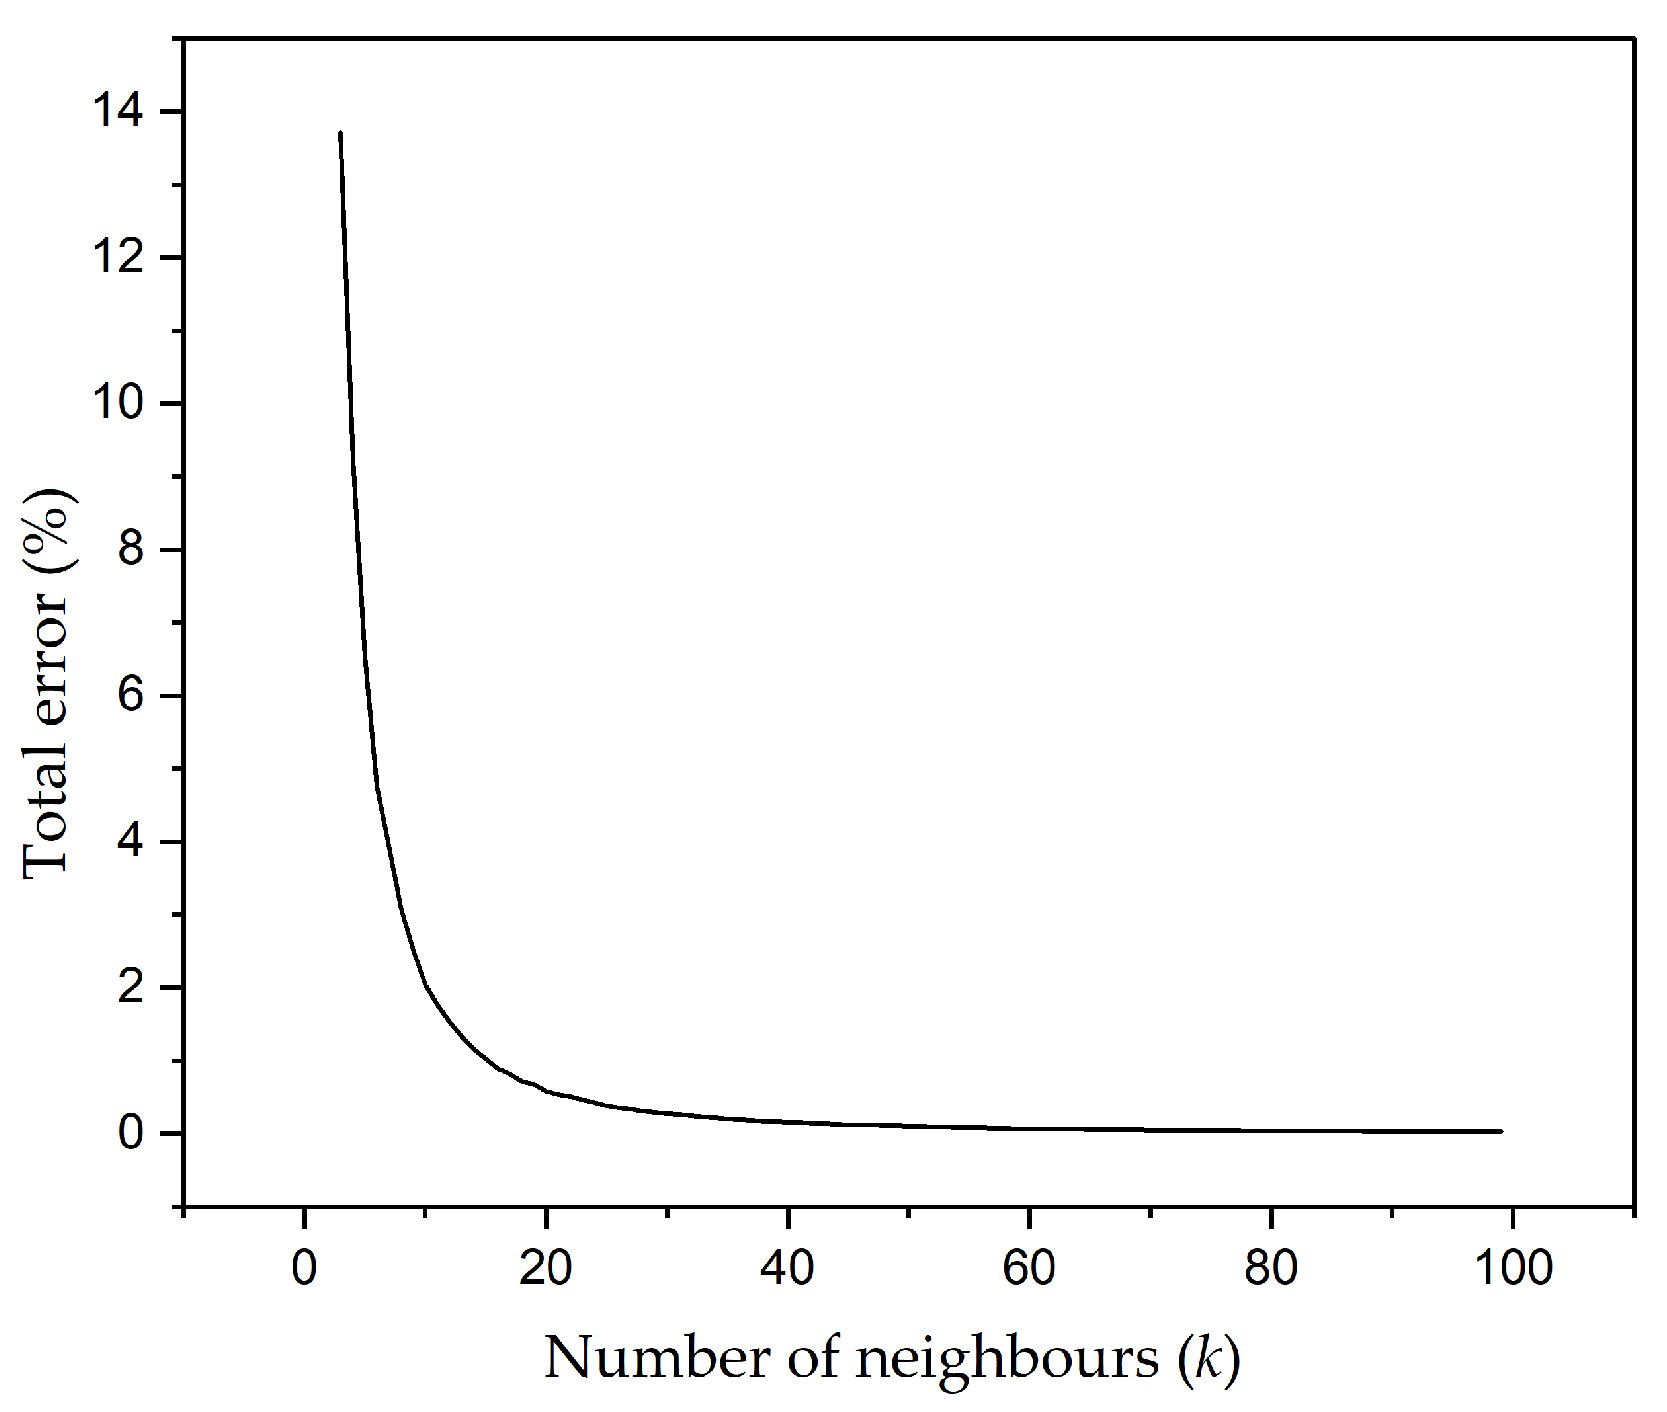
Figure 6.
Visualisation of first 50 quasi-outliers on each input variable along the time dimension. Note: Grd - feed grade, Thp - throughput, PSD - particle size distribution, XT1 - xanthate dosage in tank 1, FT1 - frother dosage in tank 1, FD1 - froth depth in tank 1, XT4 - xanthate dosage in tank 4, FT4 - frother dosage in tank 4, FD4 - froth depth in tank 4.
Figure 6.
Visualisation of first 50 quasi-outliers on each input variable along the time dimension. Note: Grd - feed grade, Thp - throughput, PSD - particle size distribution, XT1 - xanthate dosage in tank 1, FT1 - frother dosage in tank 1, FD1 - froth depth in tank 1, XT4 - xanthate dosage in tank 4, FT4 - frother dosage in tank 4, FD4 - froth depth in tank 4.
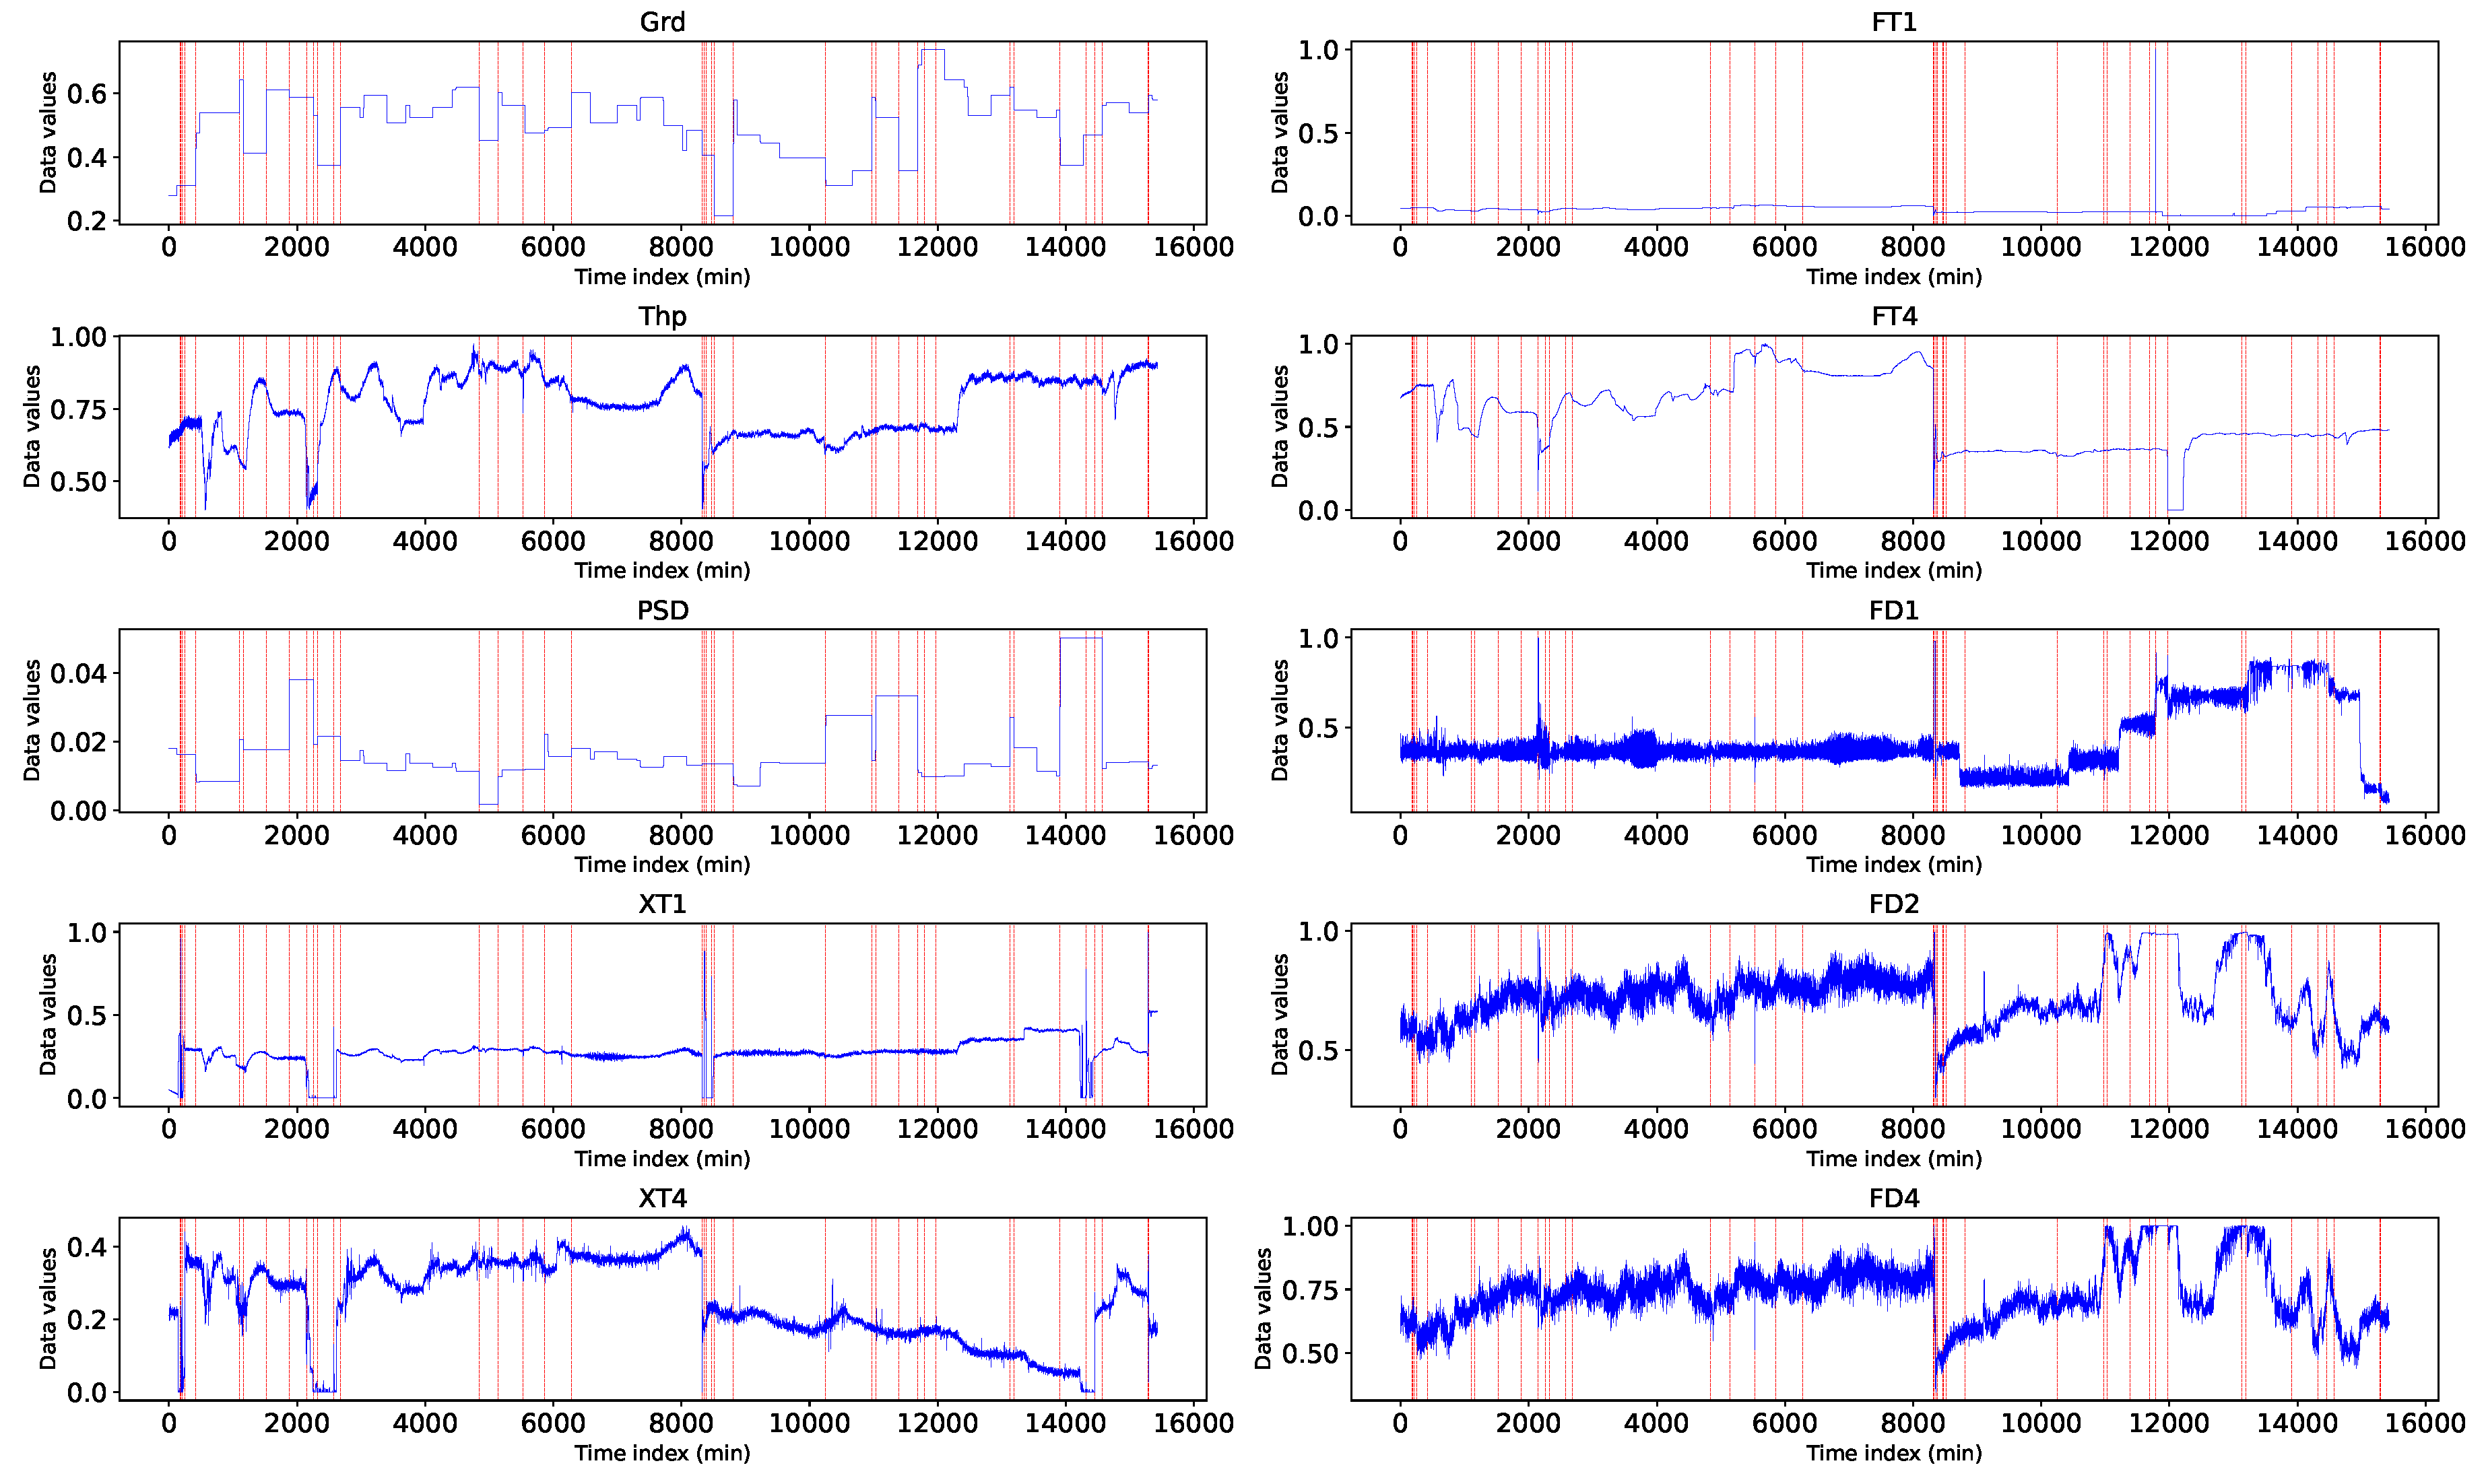
Figure 7.
Feature plots of quasi-outliers identified by the various outlier detection algorithms. Note: The red line represents an observation under consideration, blue lines represent the 20 nearest neighbours of the observation. Grd - feed grade, Thp - throughput, PSD - particle size distribution, XT1 - xanthate dosage in tank 1, FT1 - frother dosage in tank 1, FD1 - froth depth in tank 1, XT4 - xanthate dosage in tank 4, FT4 - frother dosage in tank 4, FD4 - froth depth in tank 4.
Figure 7.
Feature plots of quasi-outliers identified by the various outlier detection algorithms. Note: The red line represents an observation under consideration, blue lines represent the 20 nearest neighbours of the observation. Grd - feed grade, Thp - throughput, PSD - particle size distribution, XT1 - xanthate dosage in tank 1, FT1 - frother dosage in tank 1, FD1 - froth depth in tank 1, XT4 - xanthate dosage in tank 4, FT4 - frother dosage in tank 4, FD4 - froth depth in tank 4.
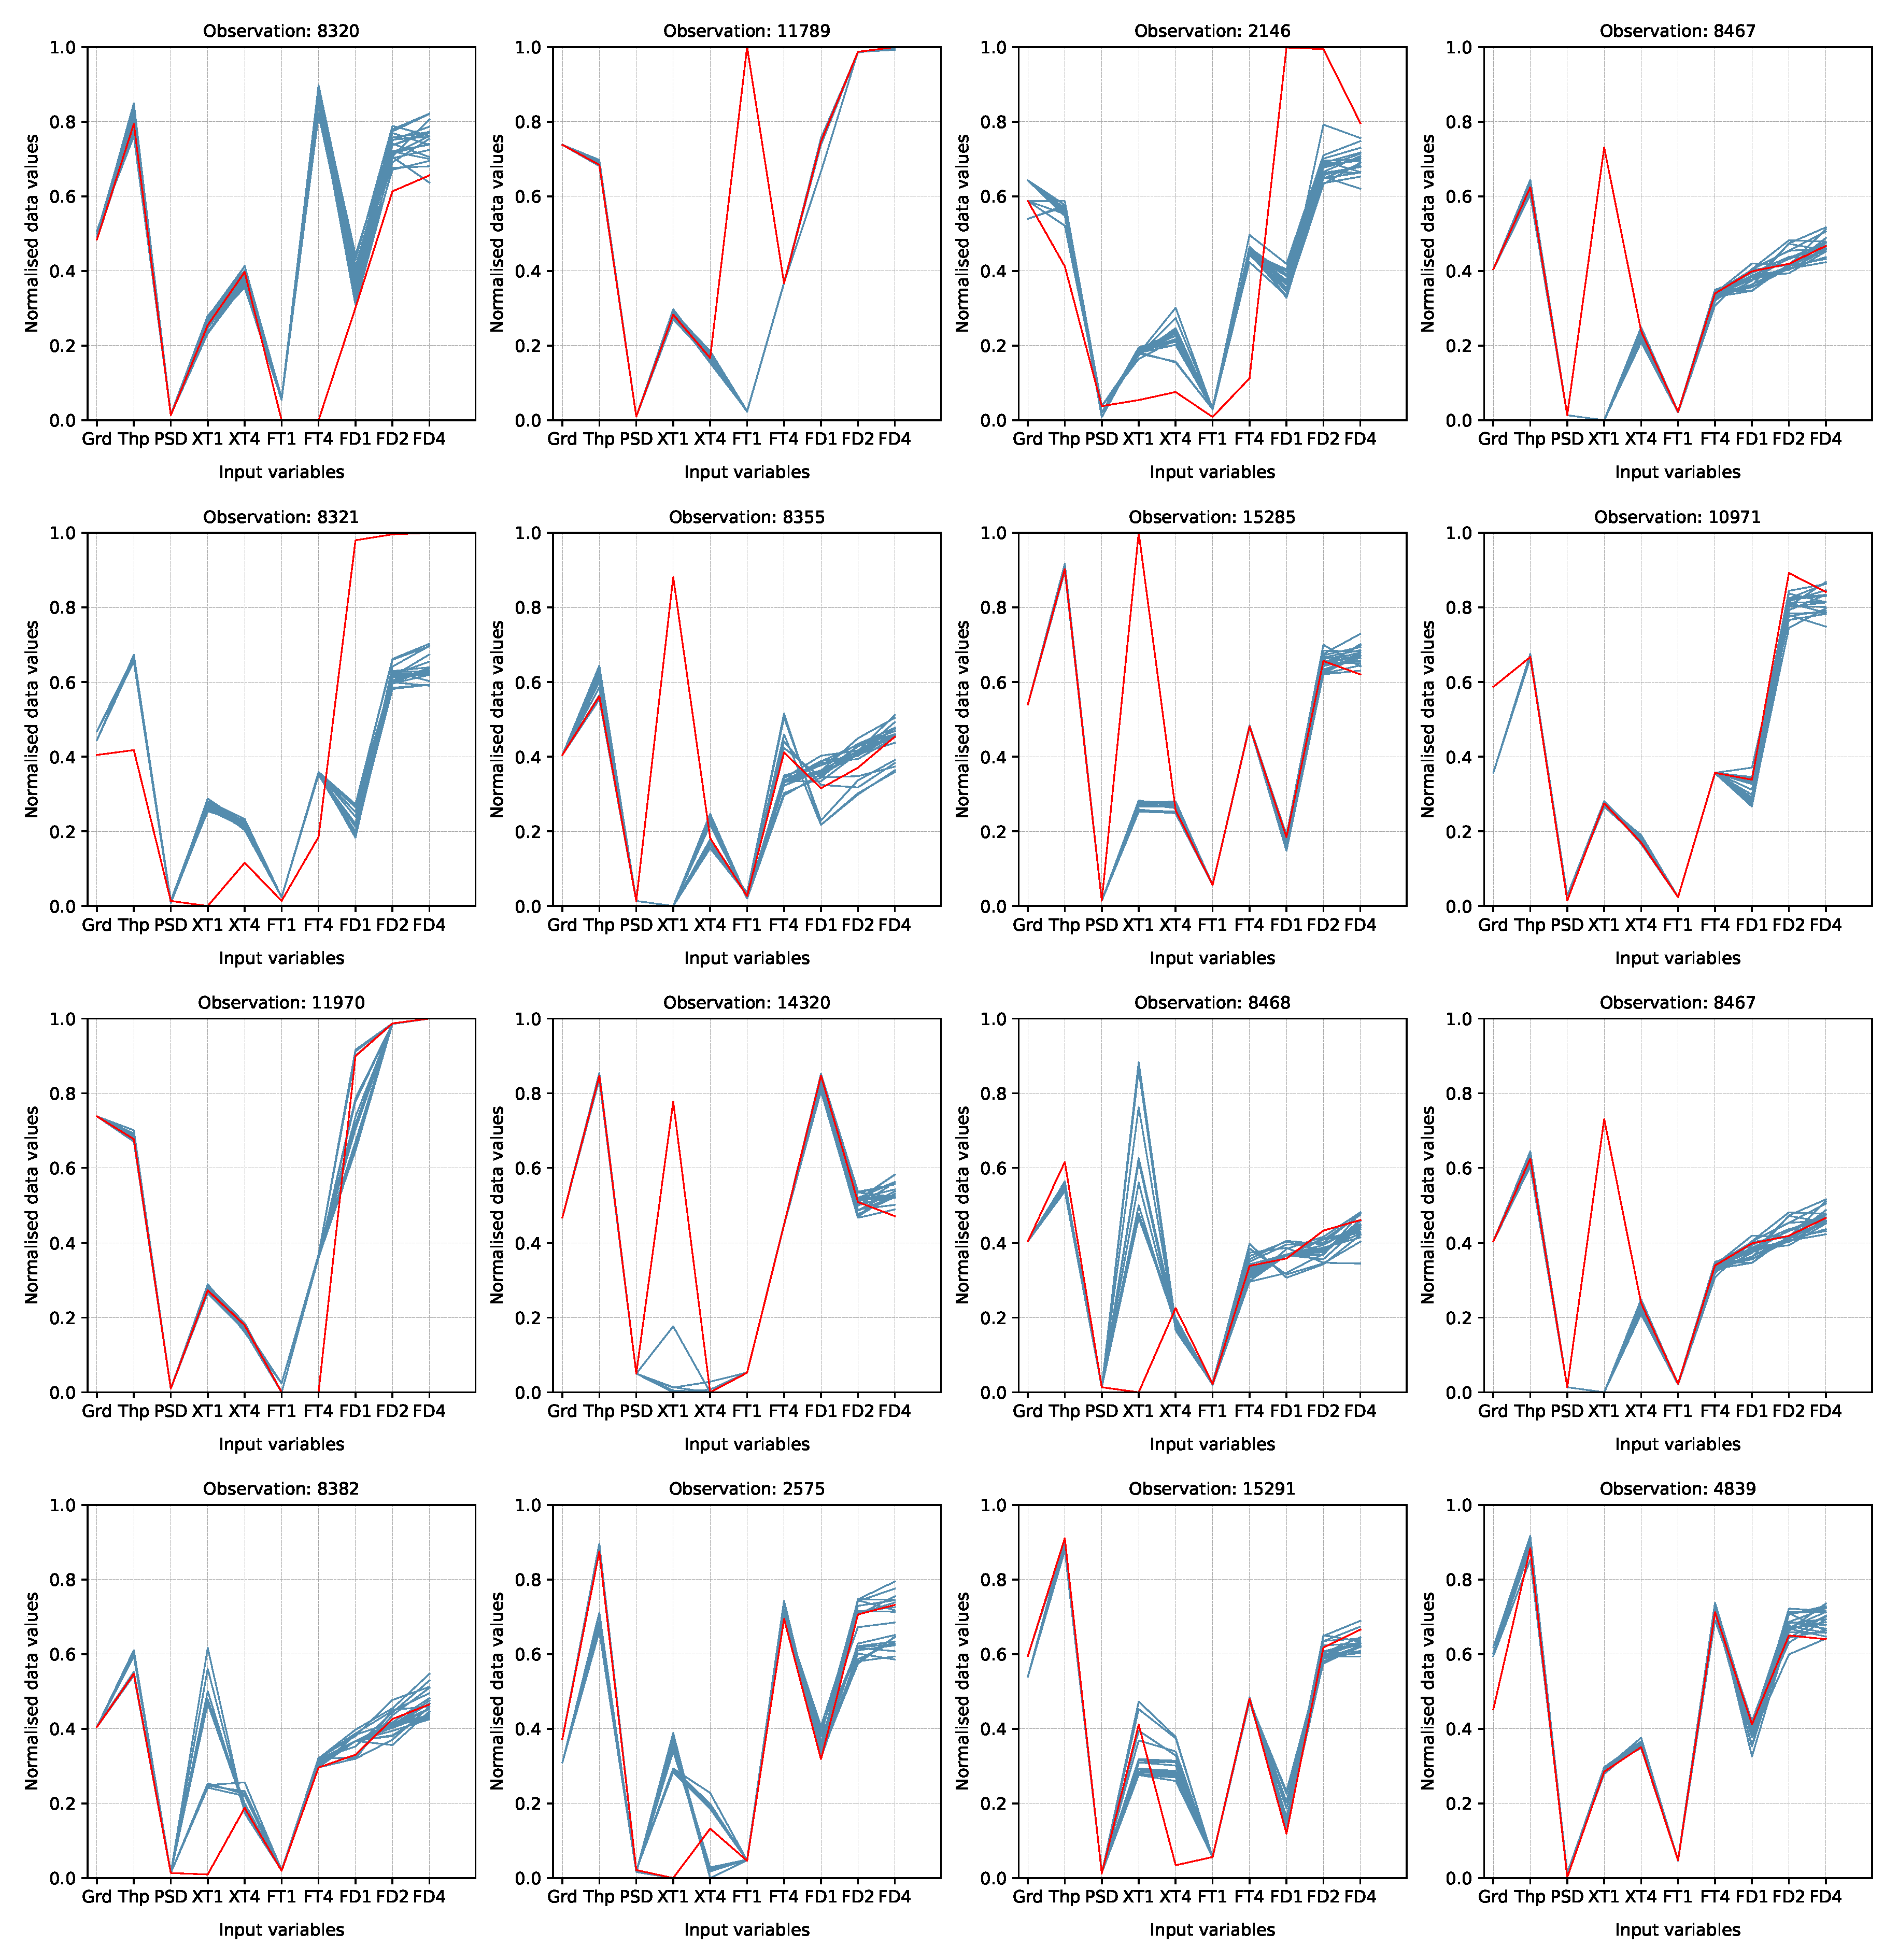
Figure 8.
Coverage plot of quasi-outliers and outlier from detection algorithms. The red circles (’o’) represent the quasi-outliers and the blue markers (’x’) represent the outliers from the detection algorithms.
Figure 8.
Coverage plot of quasi-outliers and outlier from detection algorithms. The red circles (’o’) represent the quasi-outliers and the blue markers (’x’) represent the outliers from the detection algorithms.
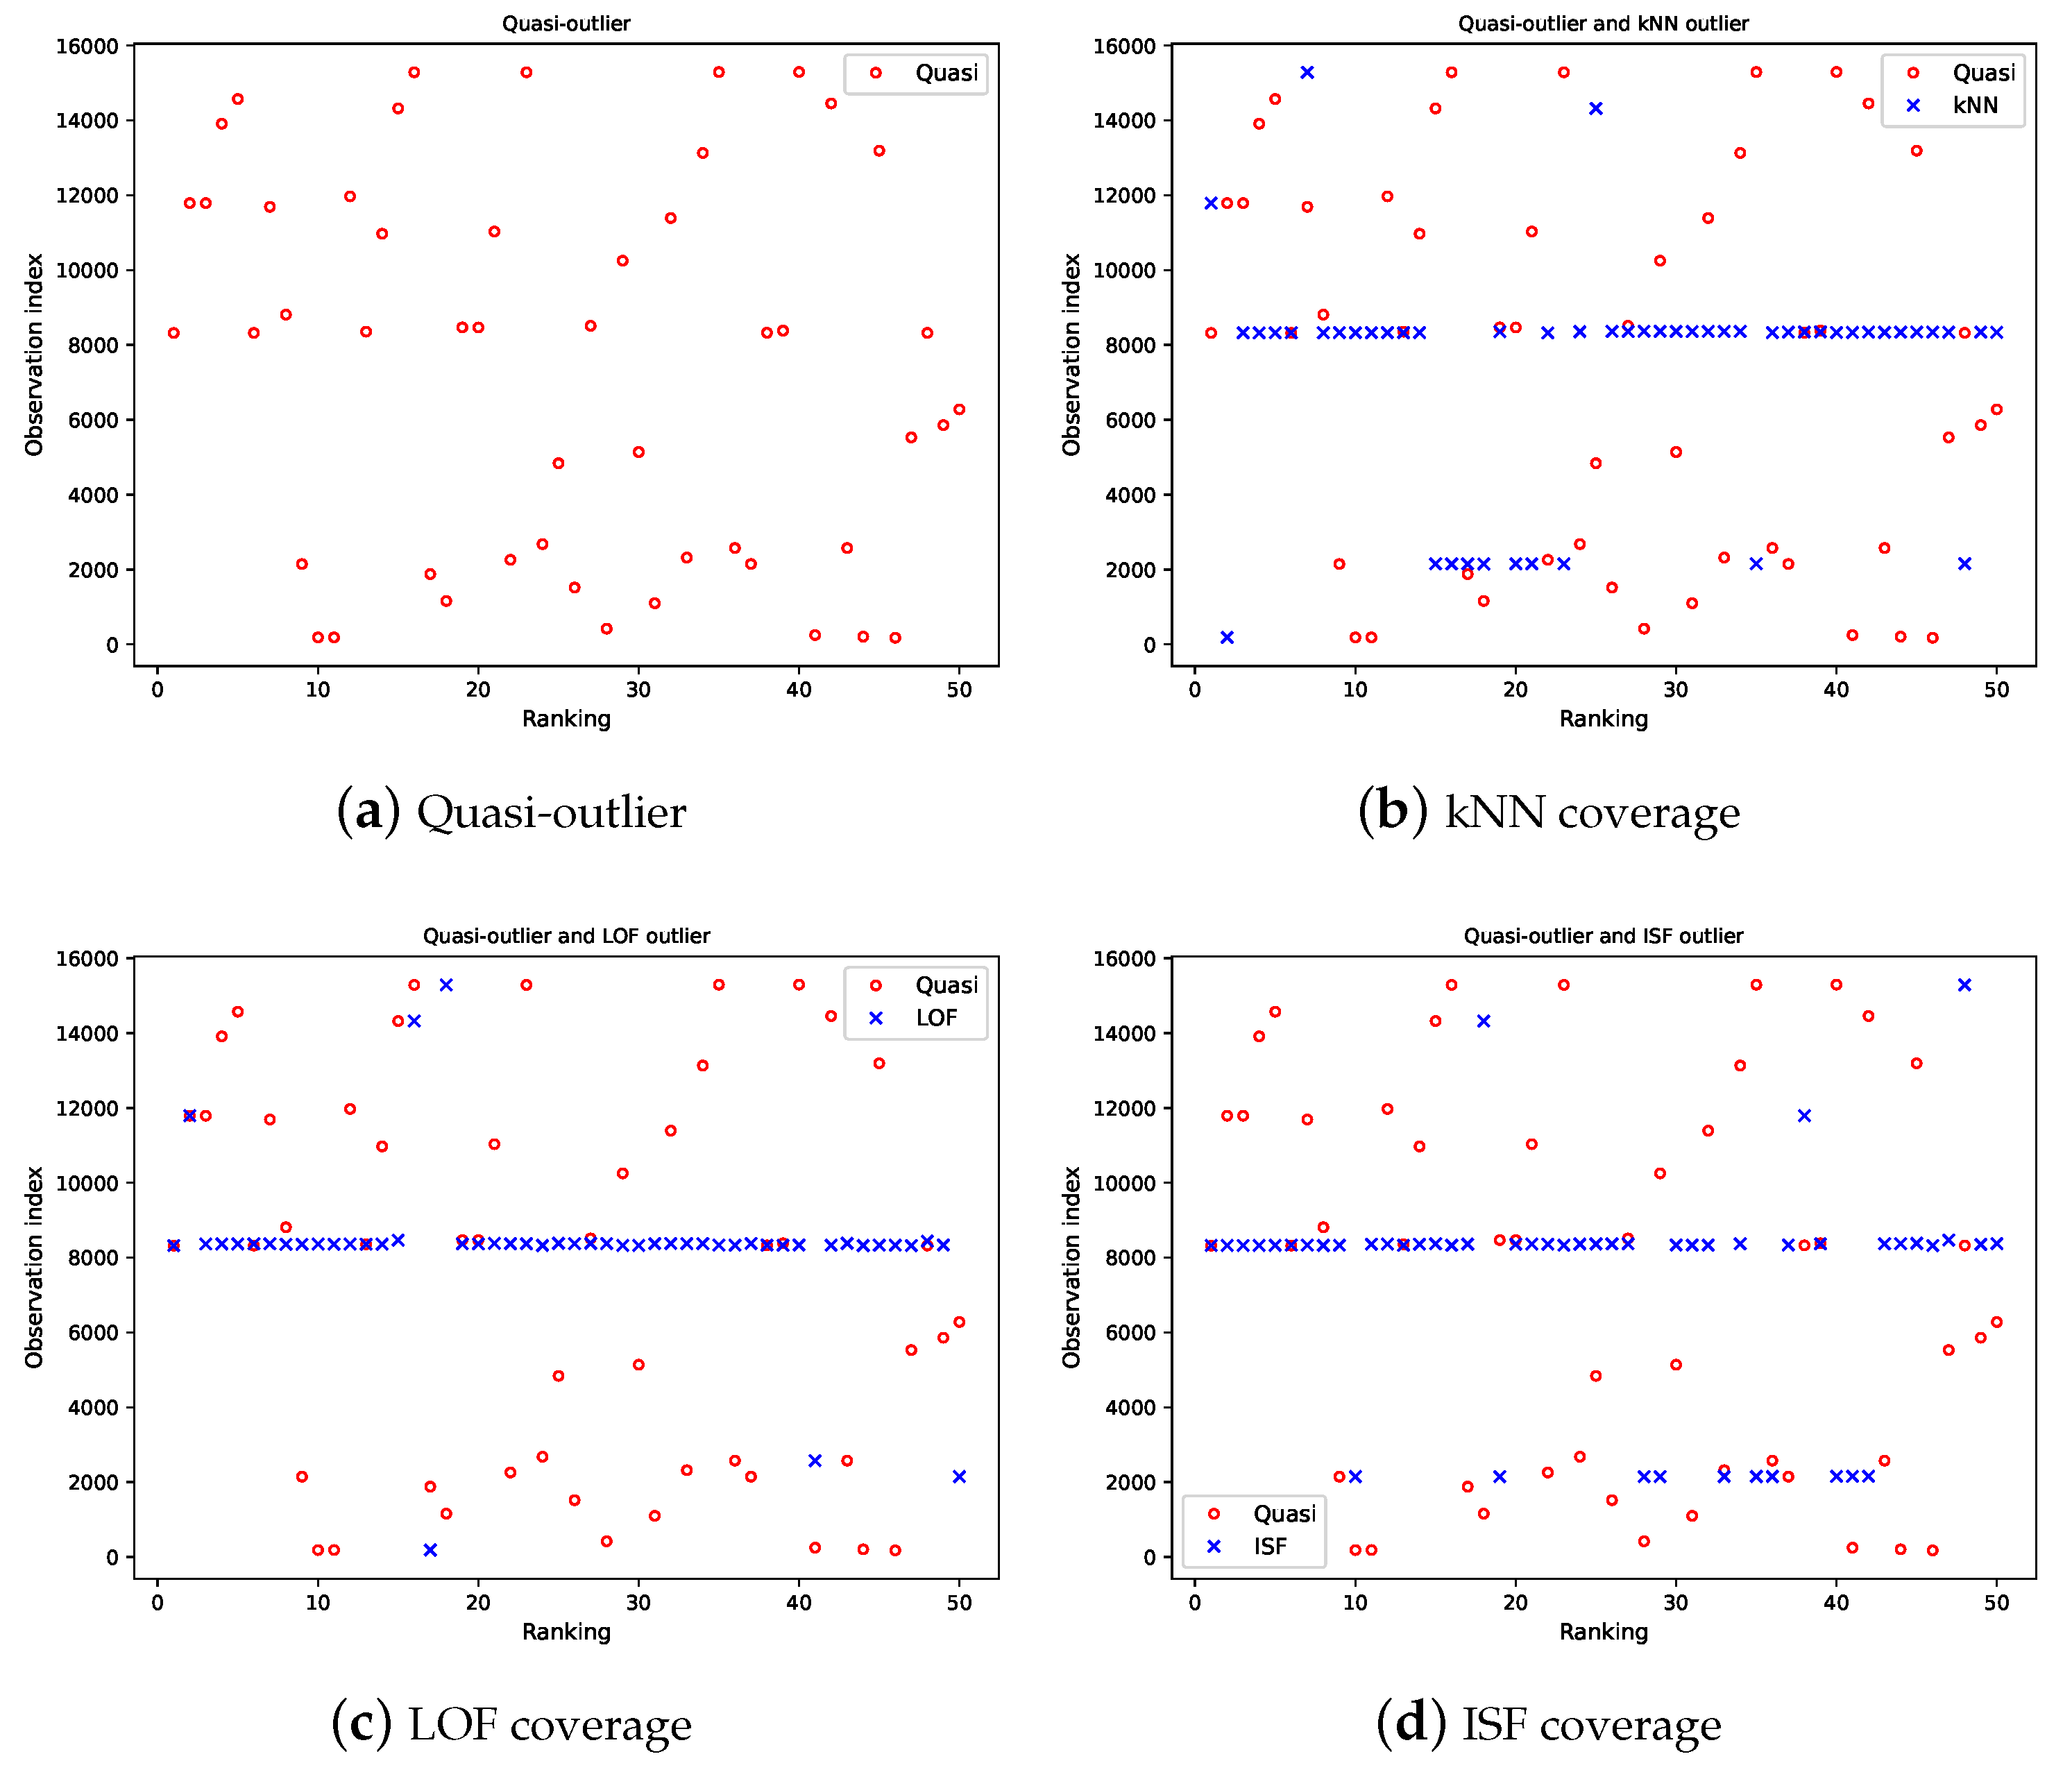
Figure 9.
Time series plot of quasi-outliers (a) covered by the detection algorithms, and (b) worst covered quasi-outlier observation
Figure 9.
Time series plot of quasi-outliers (a) covered by the detection algorithms, and (b) worst covered quasi-outlier observation
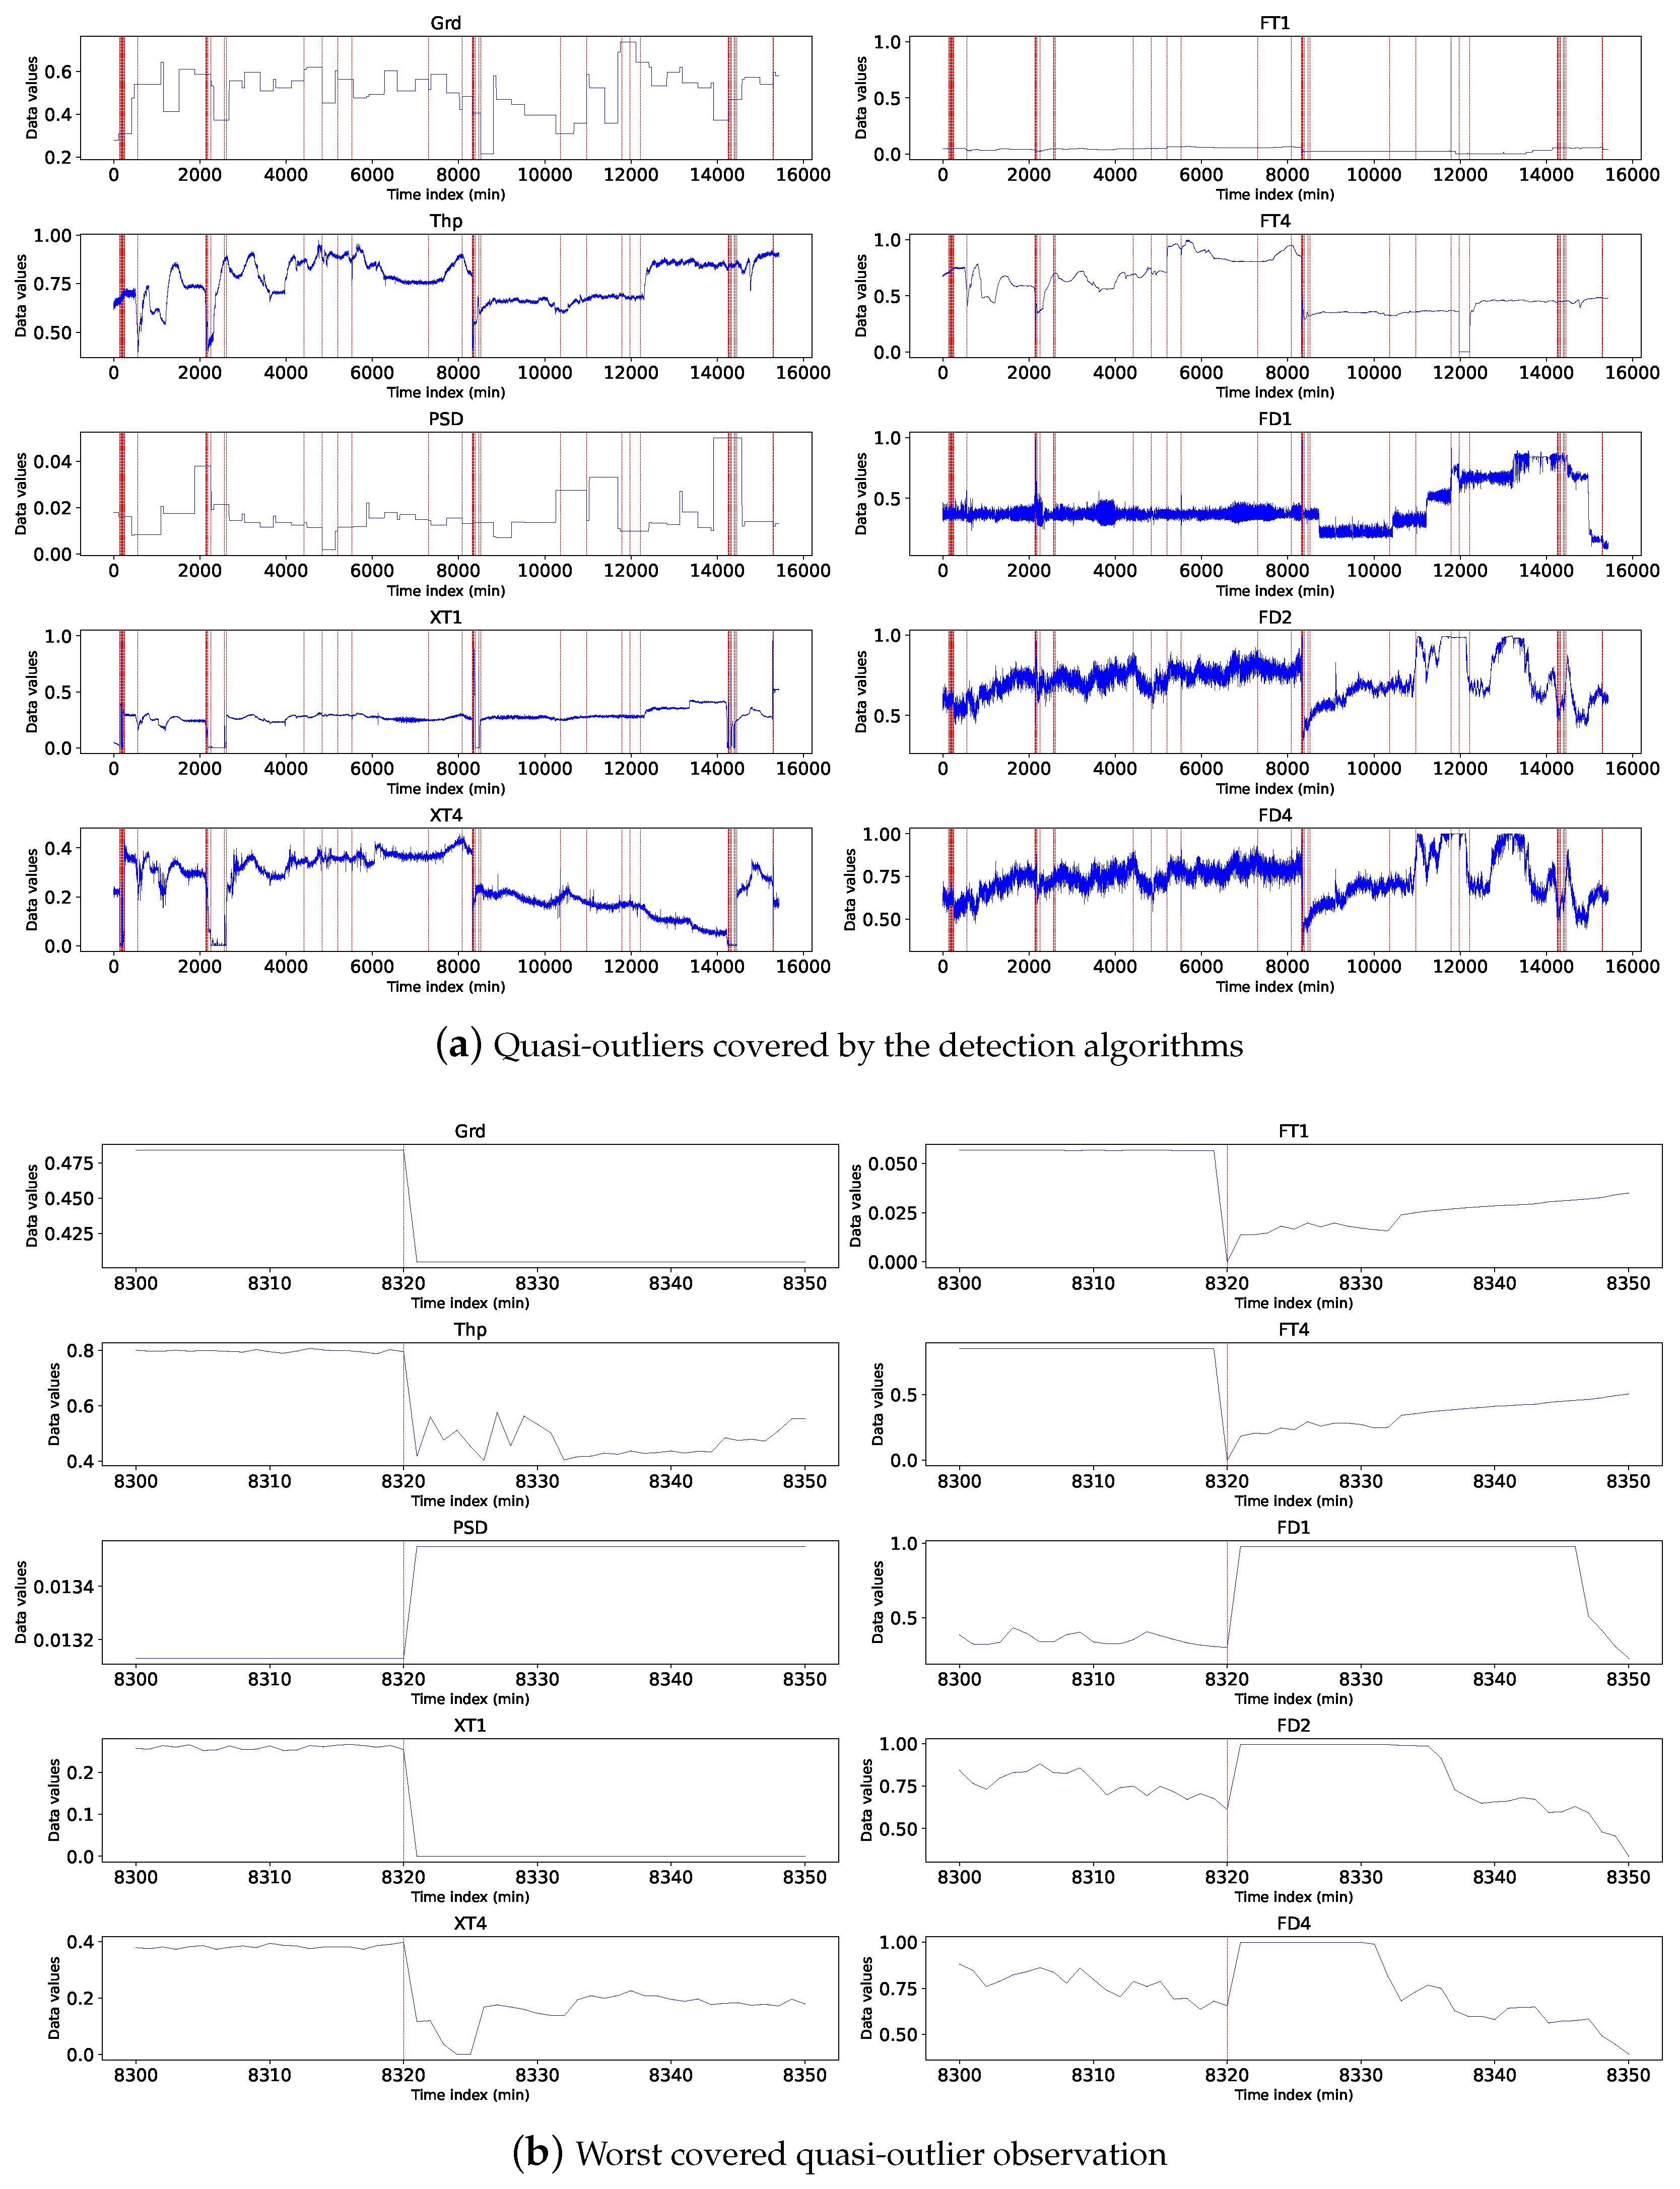
Figure 10.
Time series plot of (a) all uncovered quasi-outliers, and (b) worst quasi-outlier not covered by the detection algorithms
Figure 10.
Time series plot of (a) all uncovered quasi-outliers, and (b) worst quasi-outlier not covered by the detection algorithms
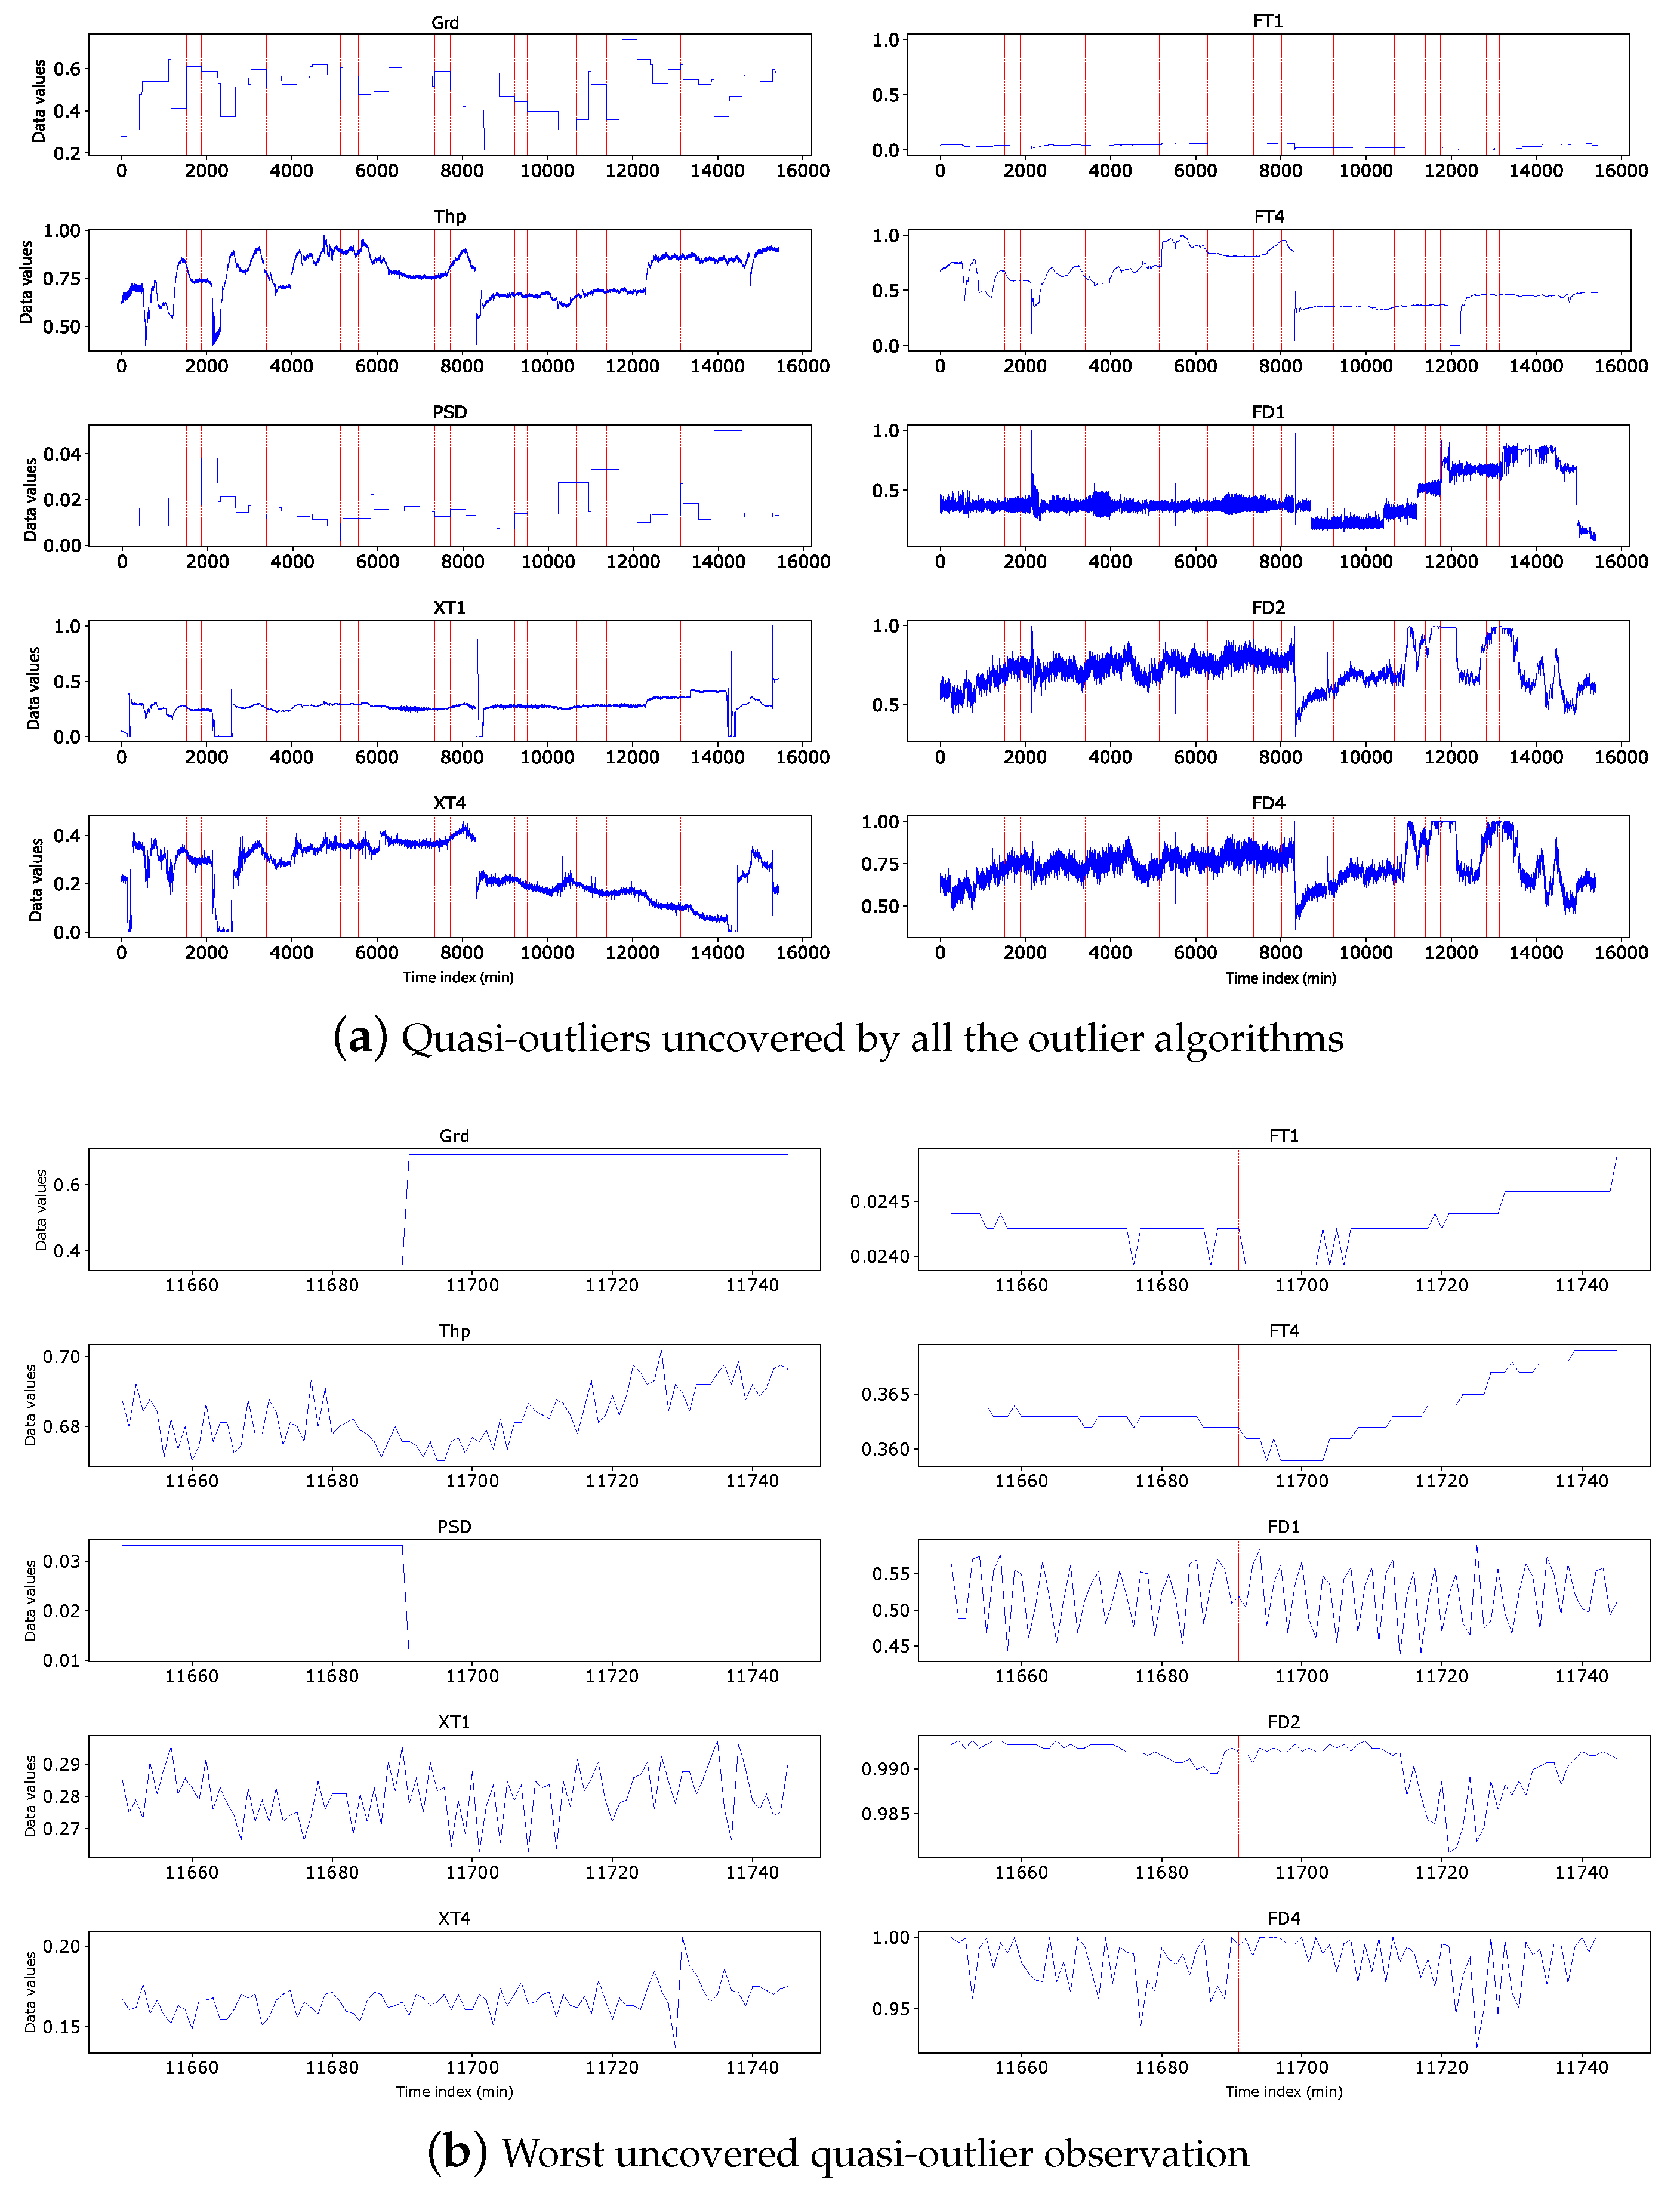
Figure 11.
Time series plot of non-covering kNN outliers
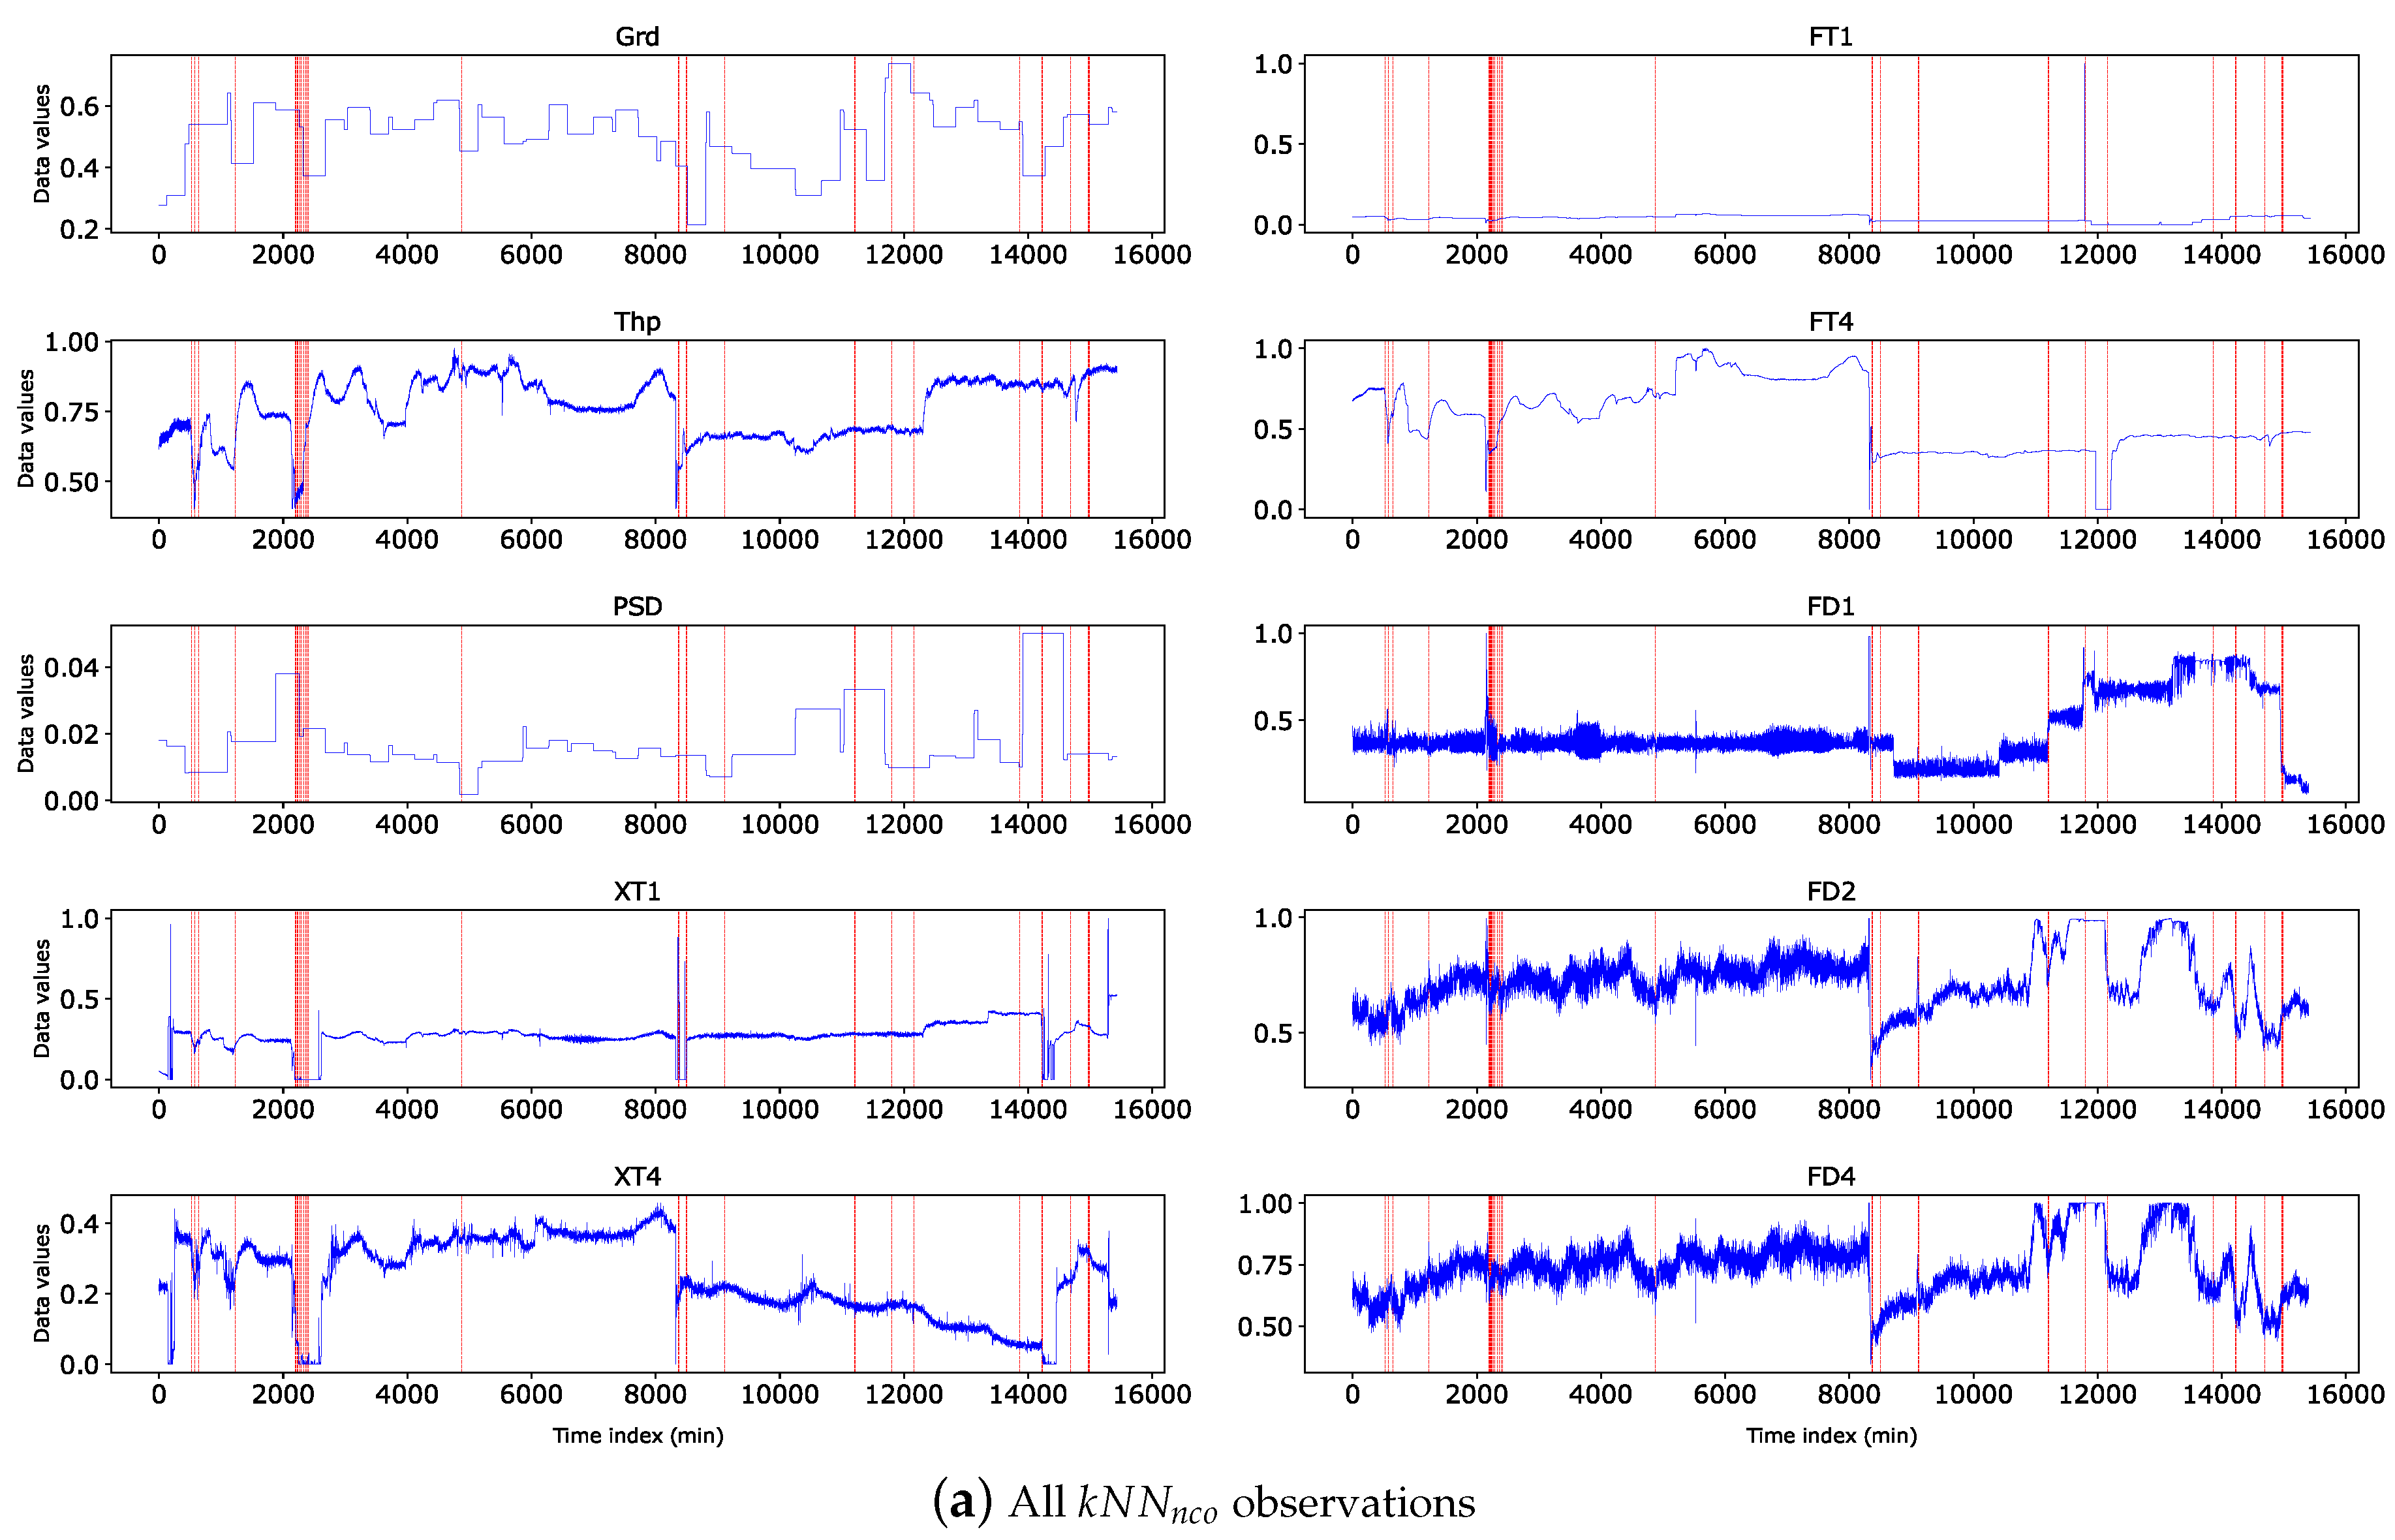
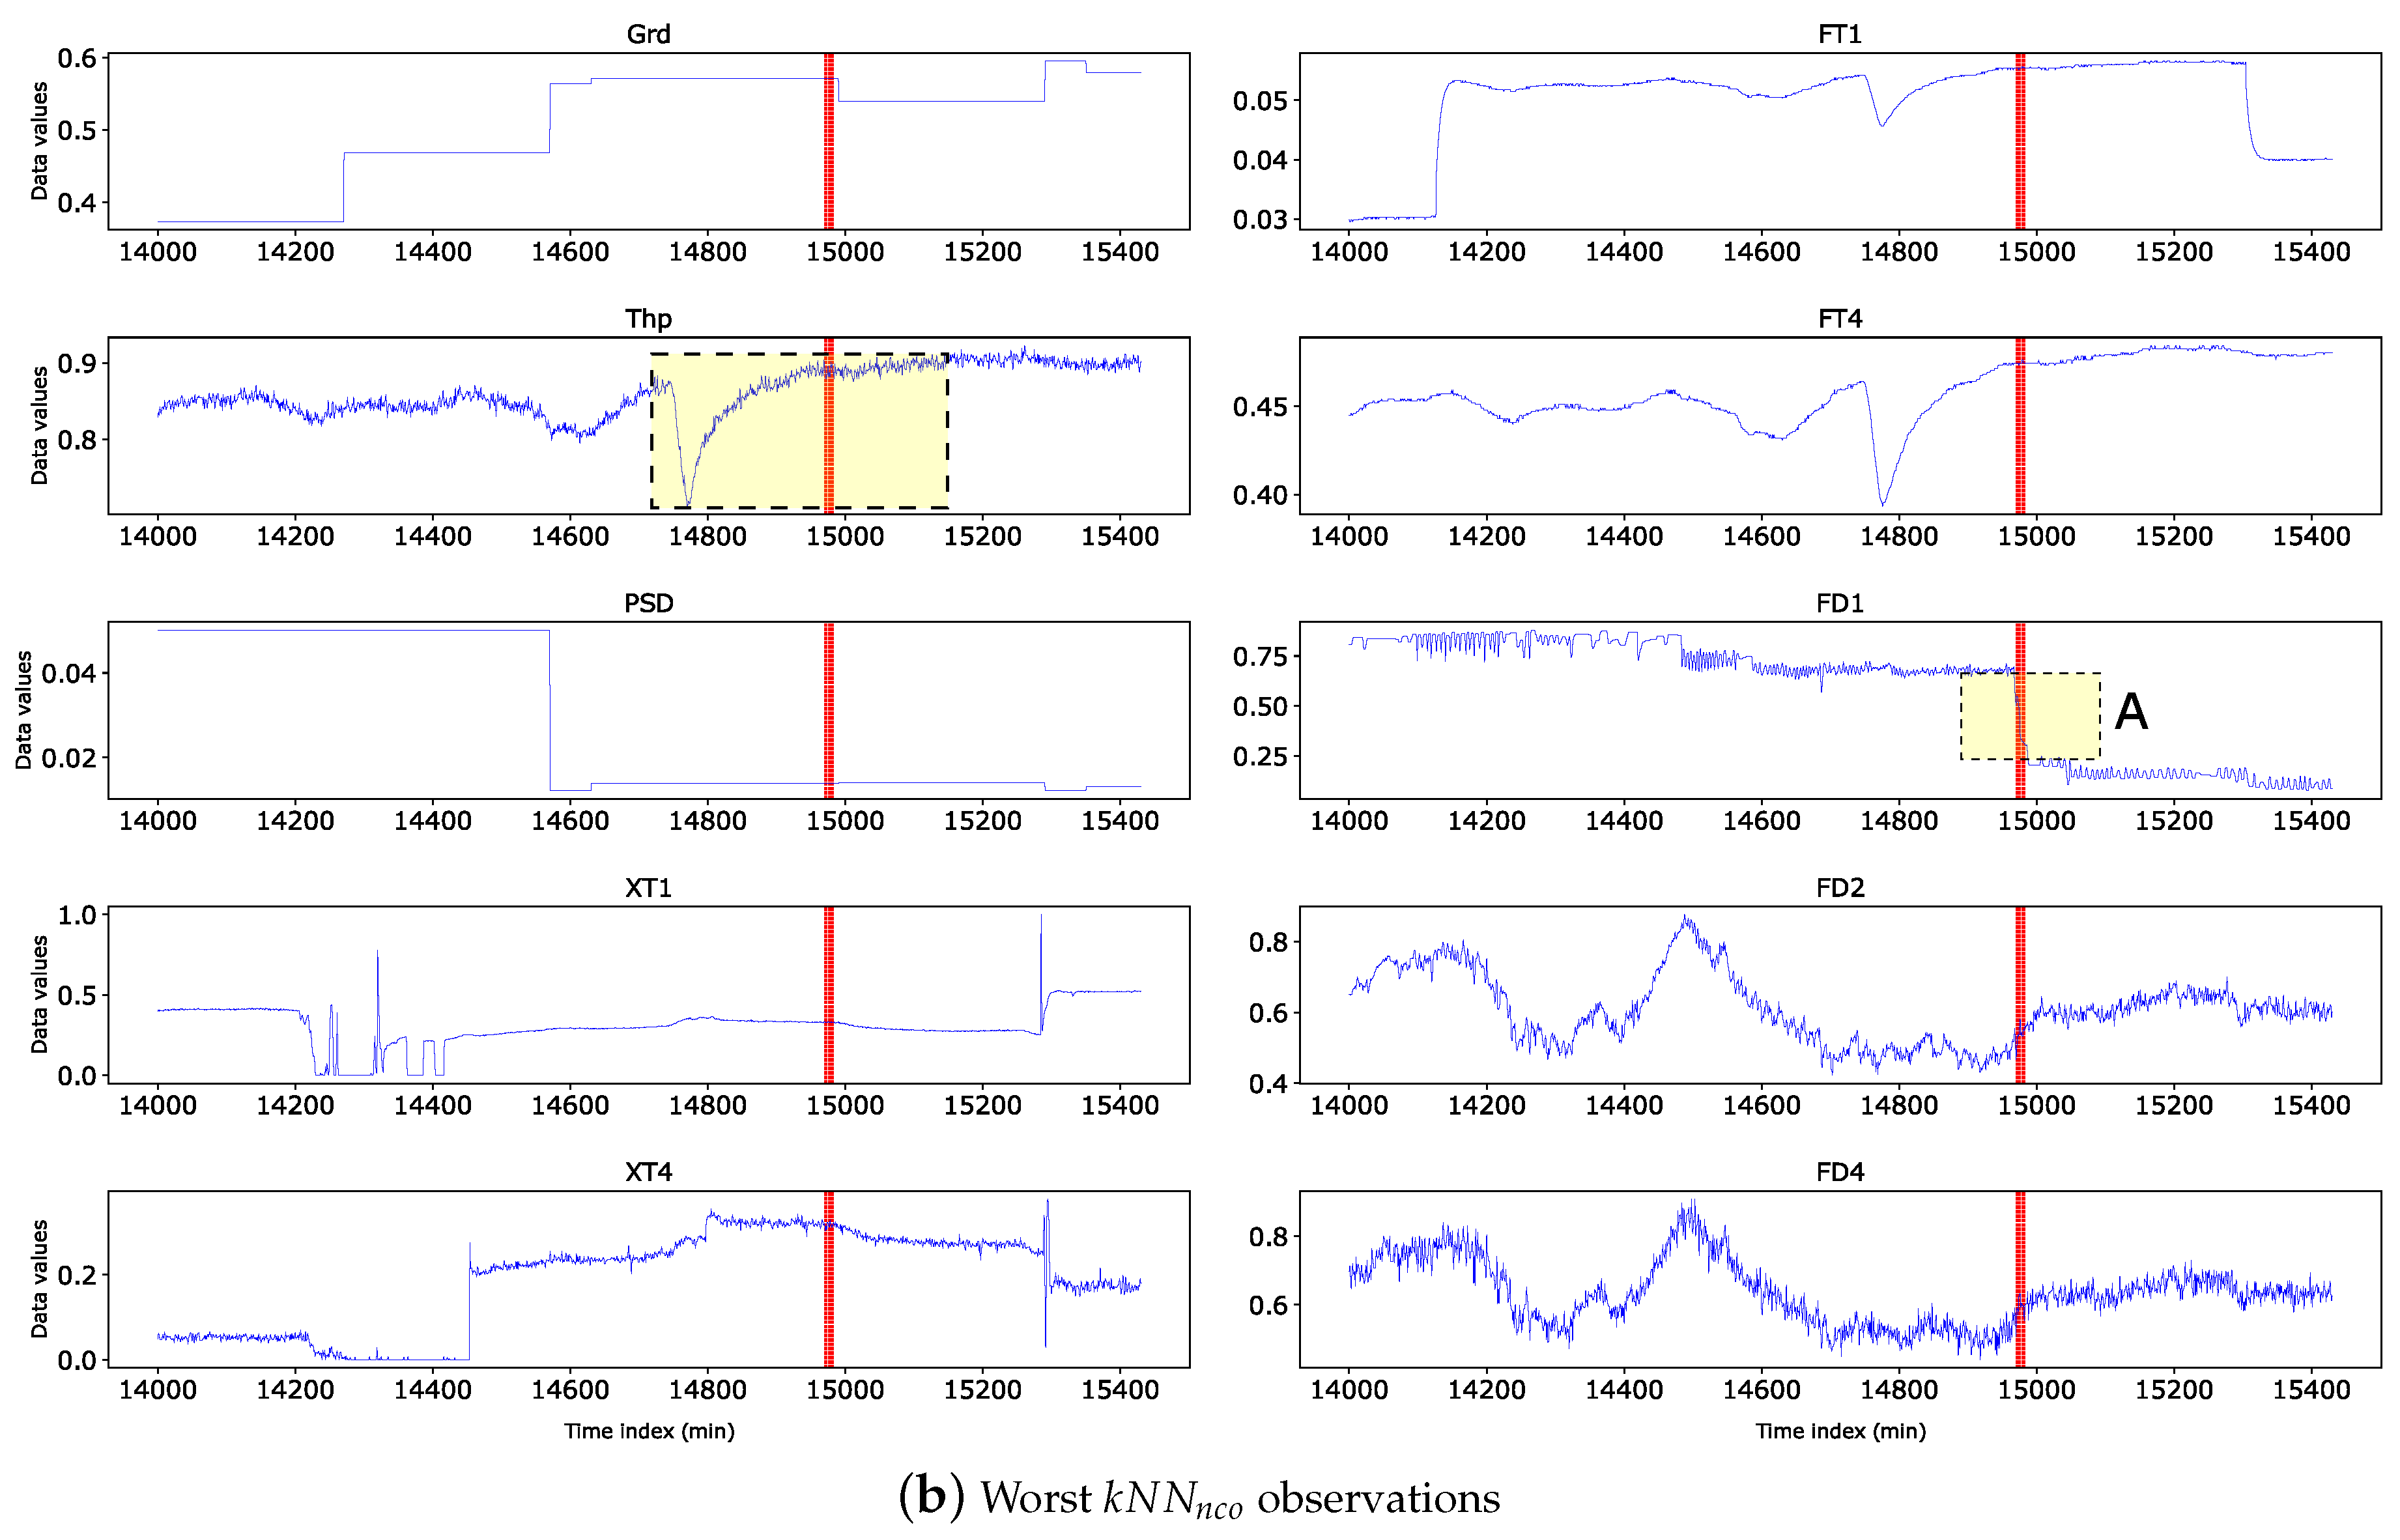
Figure 12.
Time series plot of observations
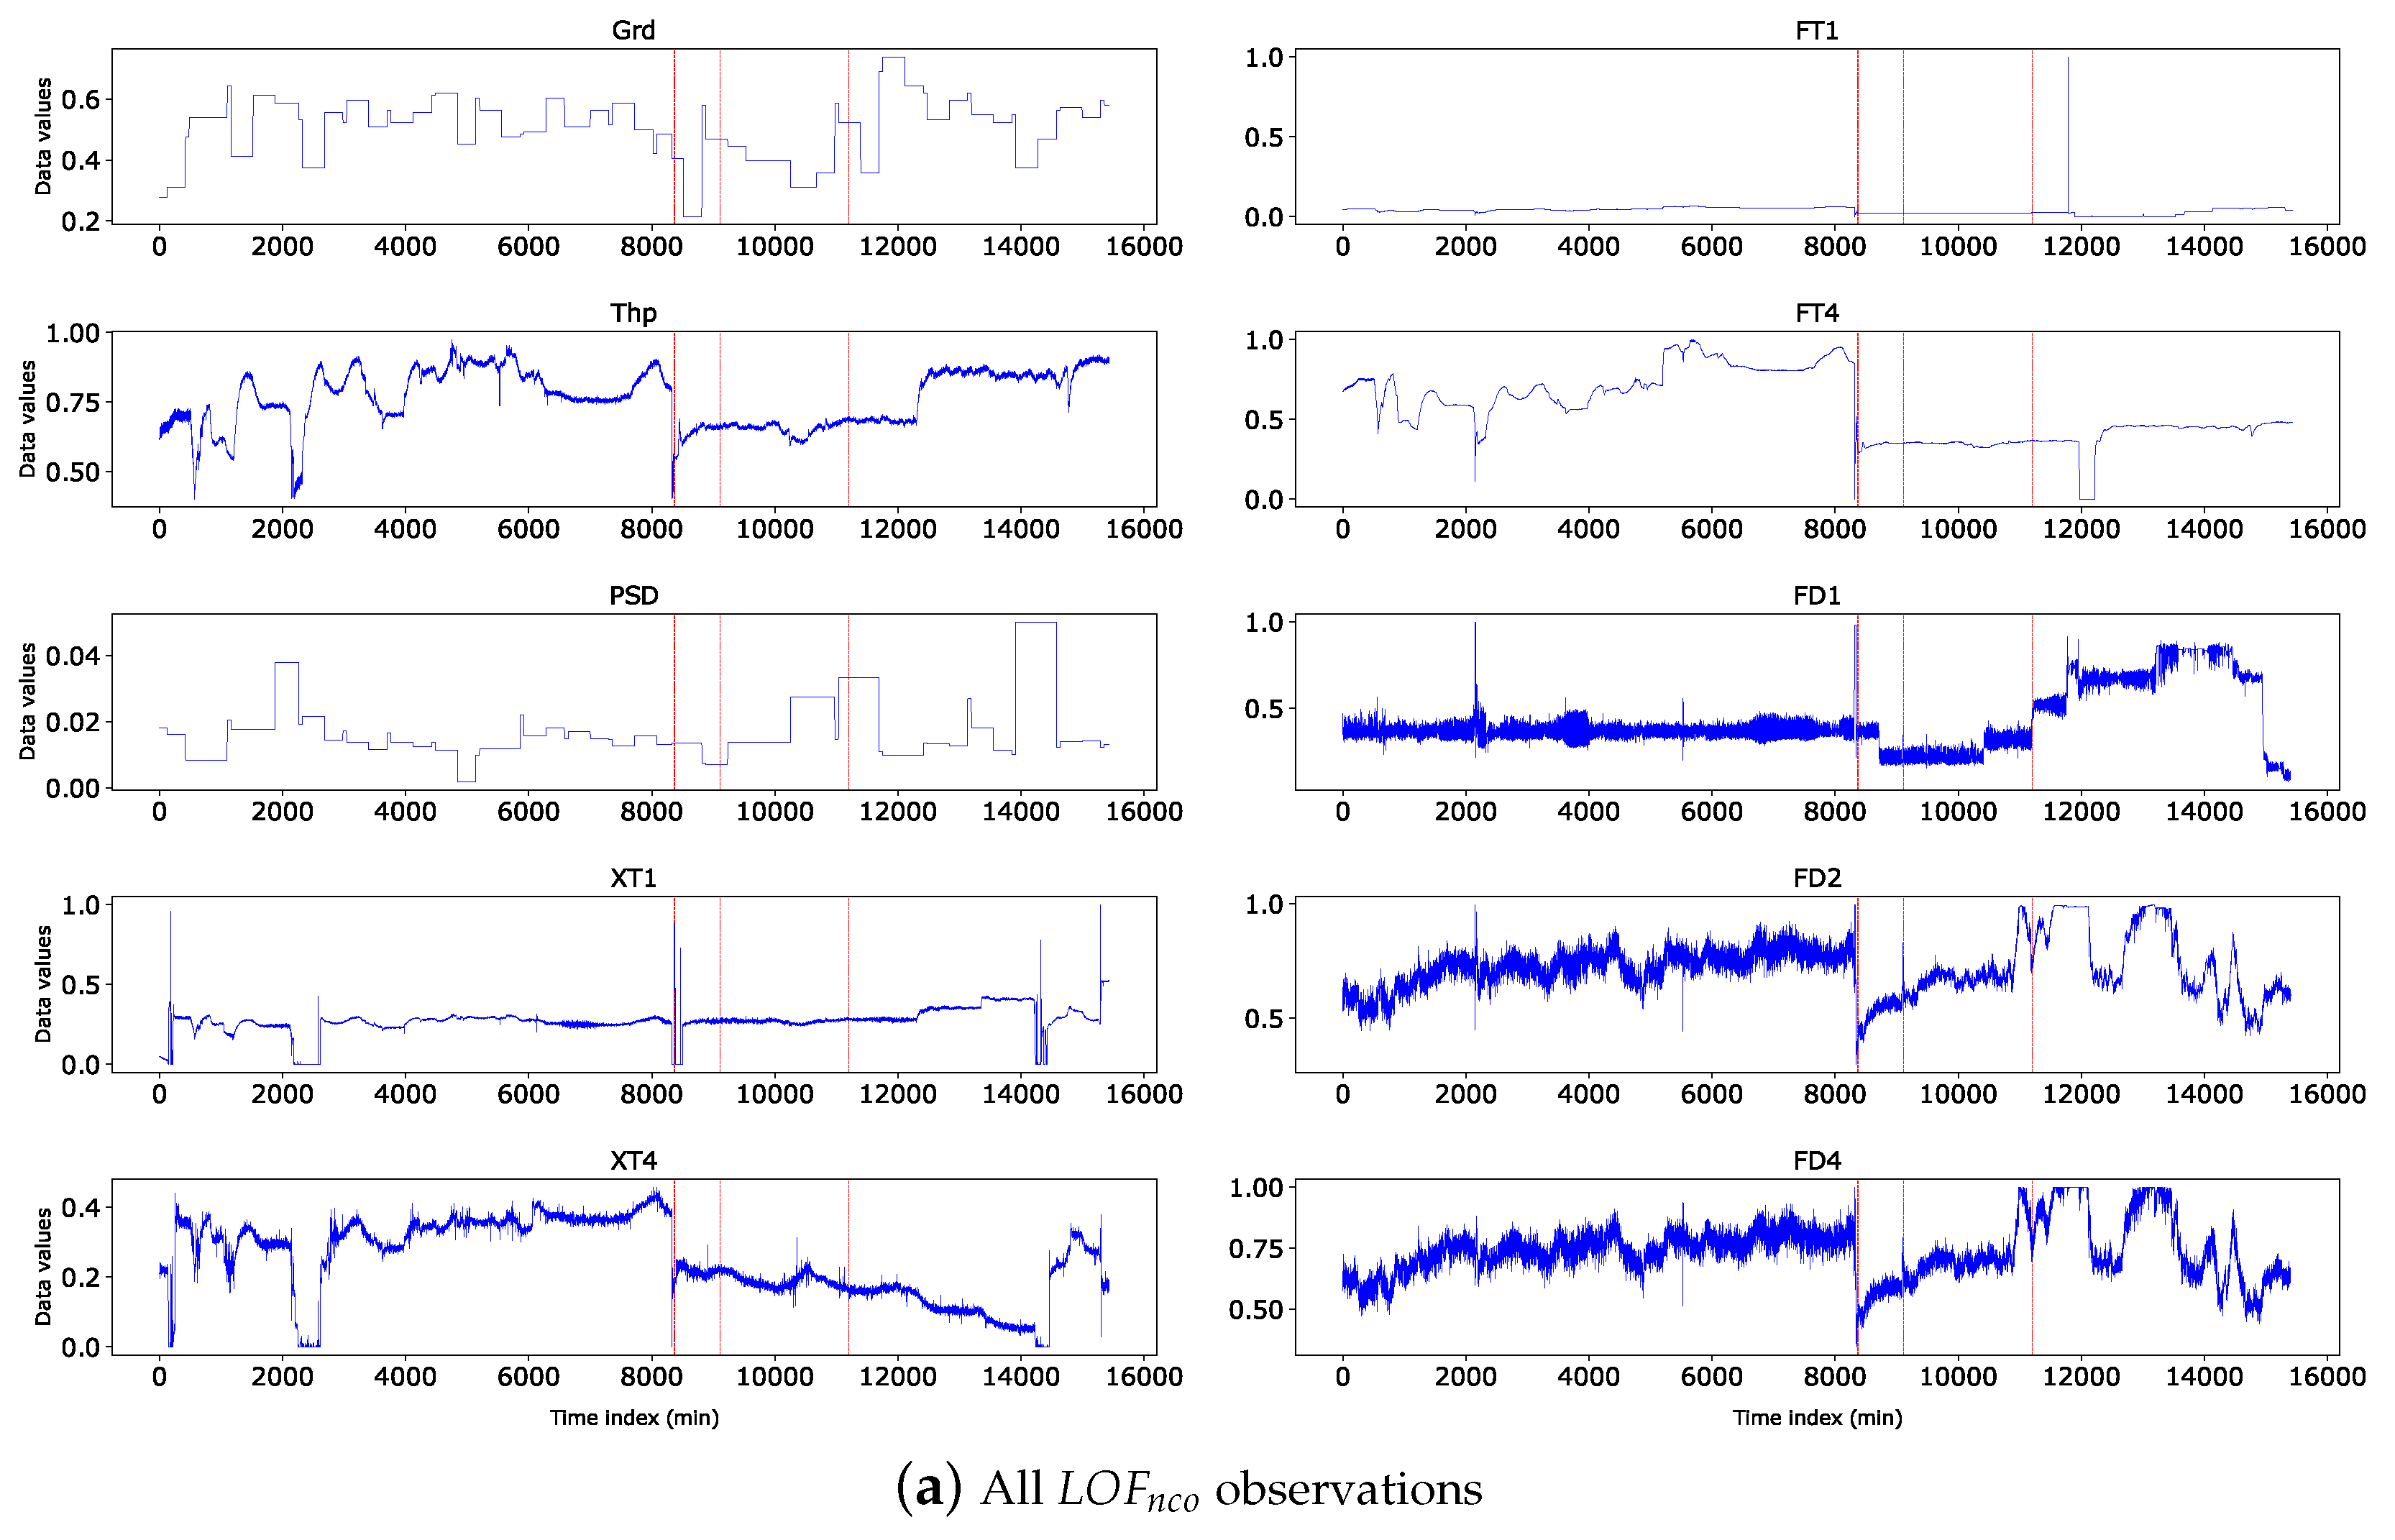
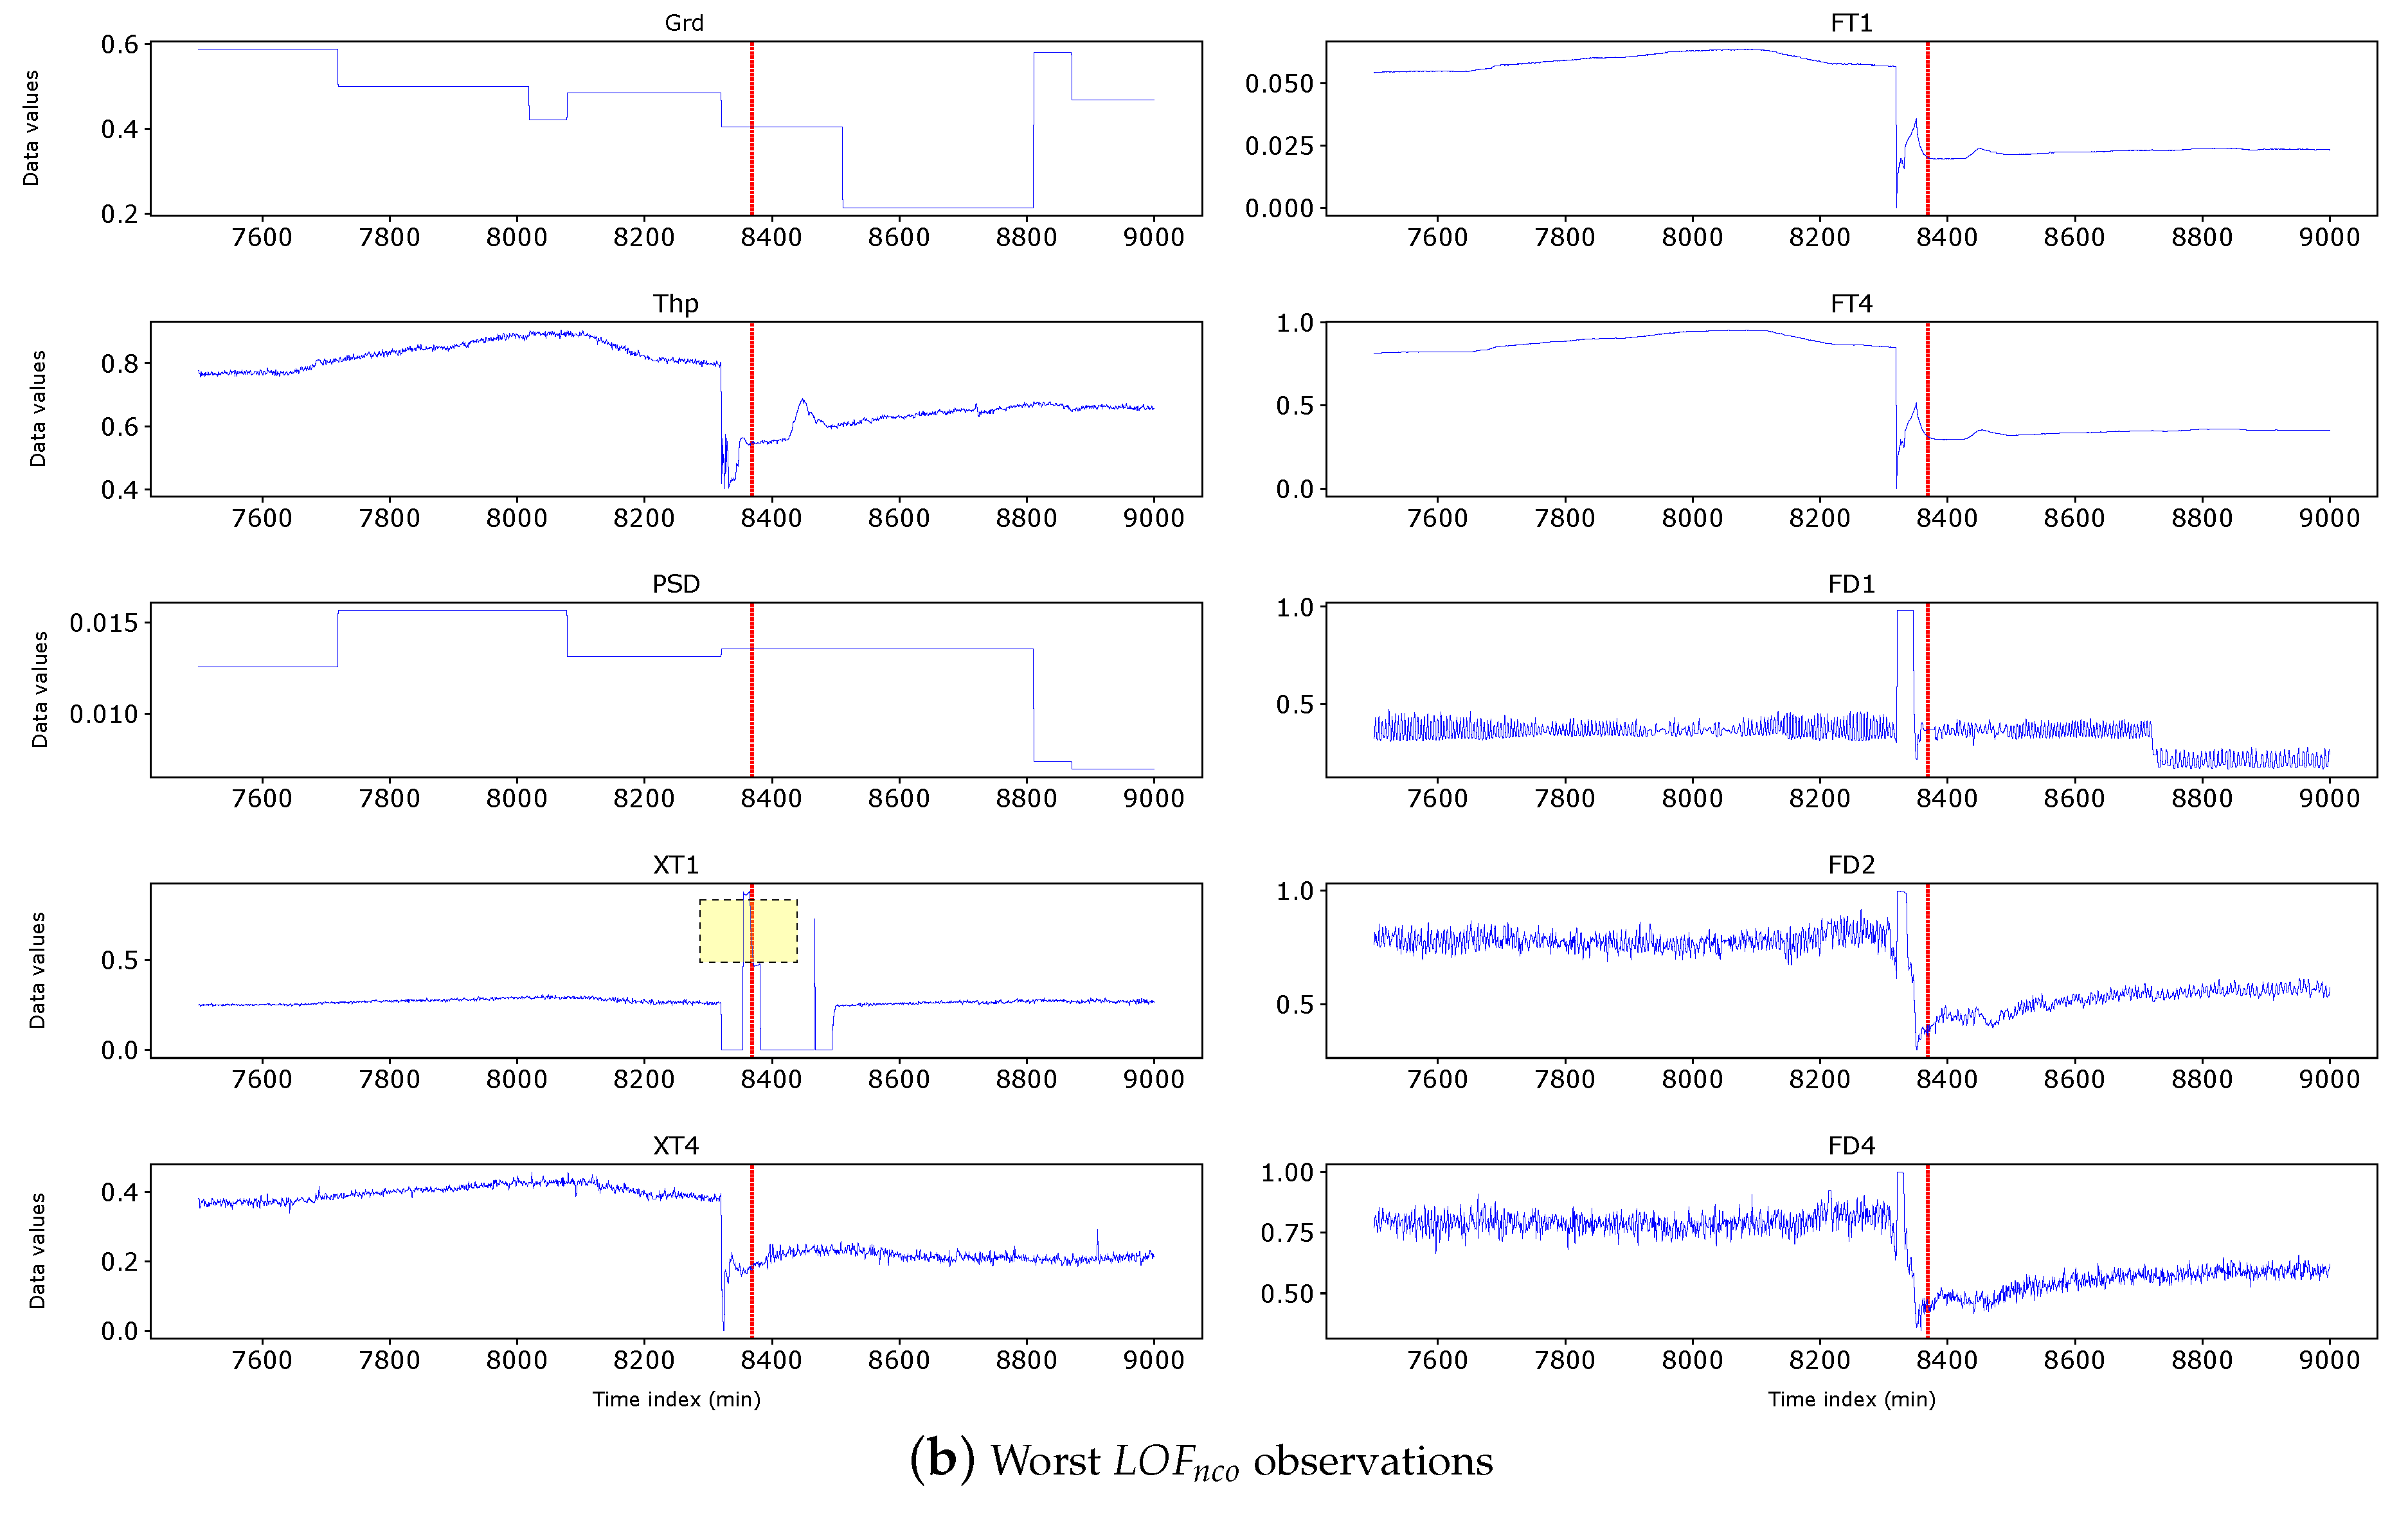
Figure 13.
Flow diagram illustrating model performance with and without outliers.
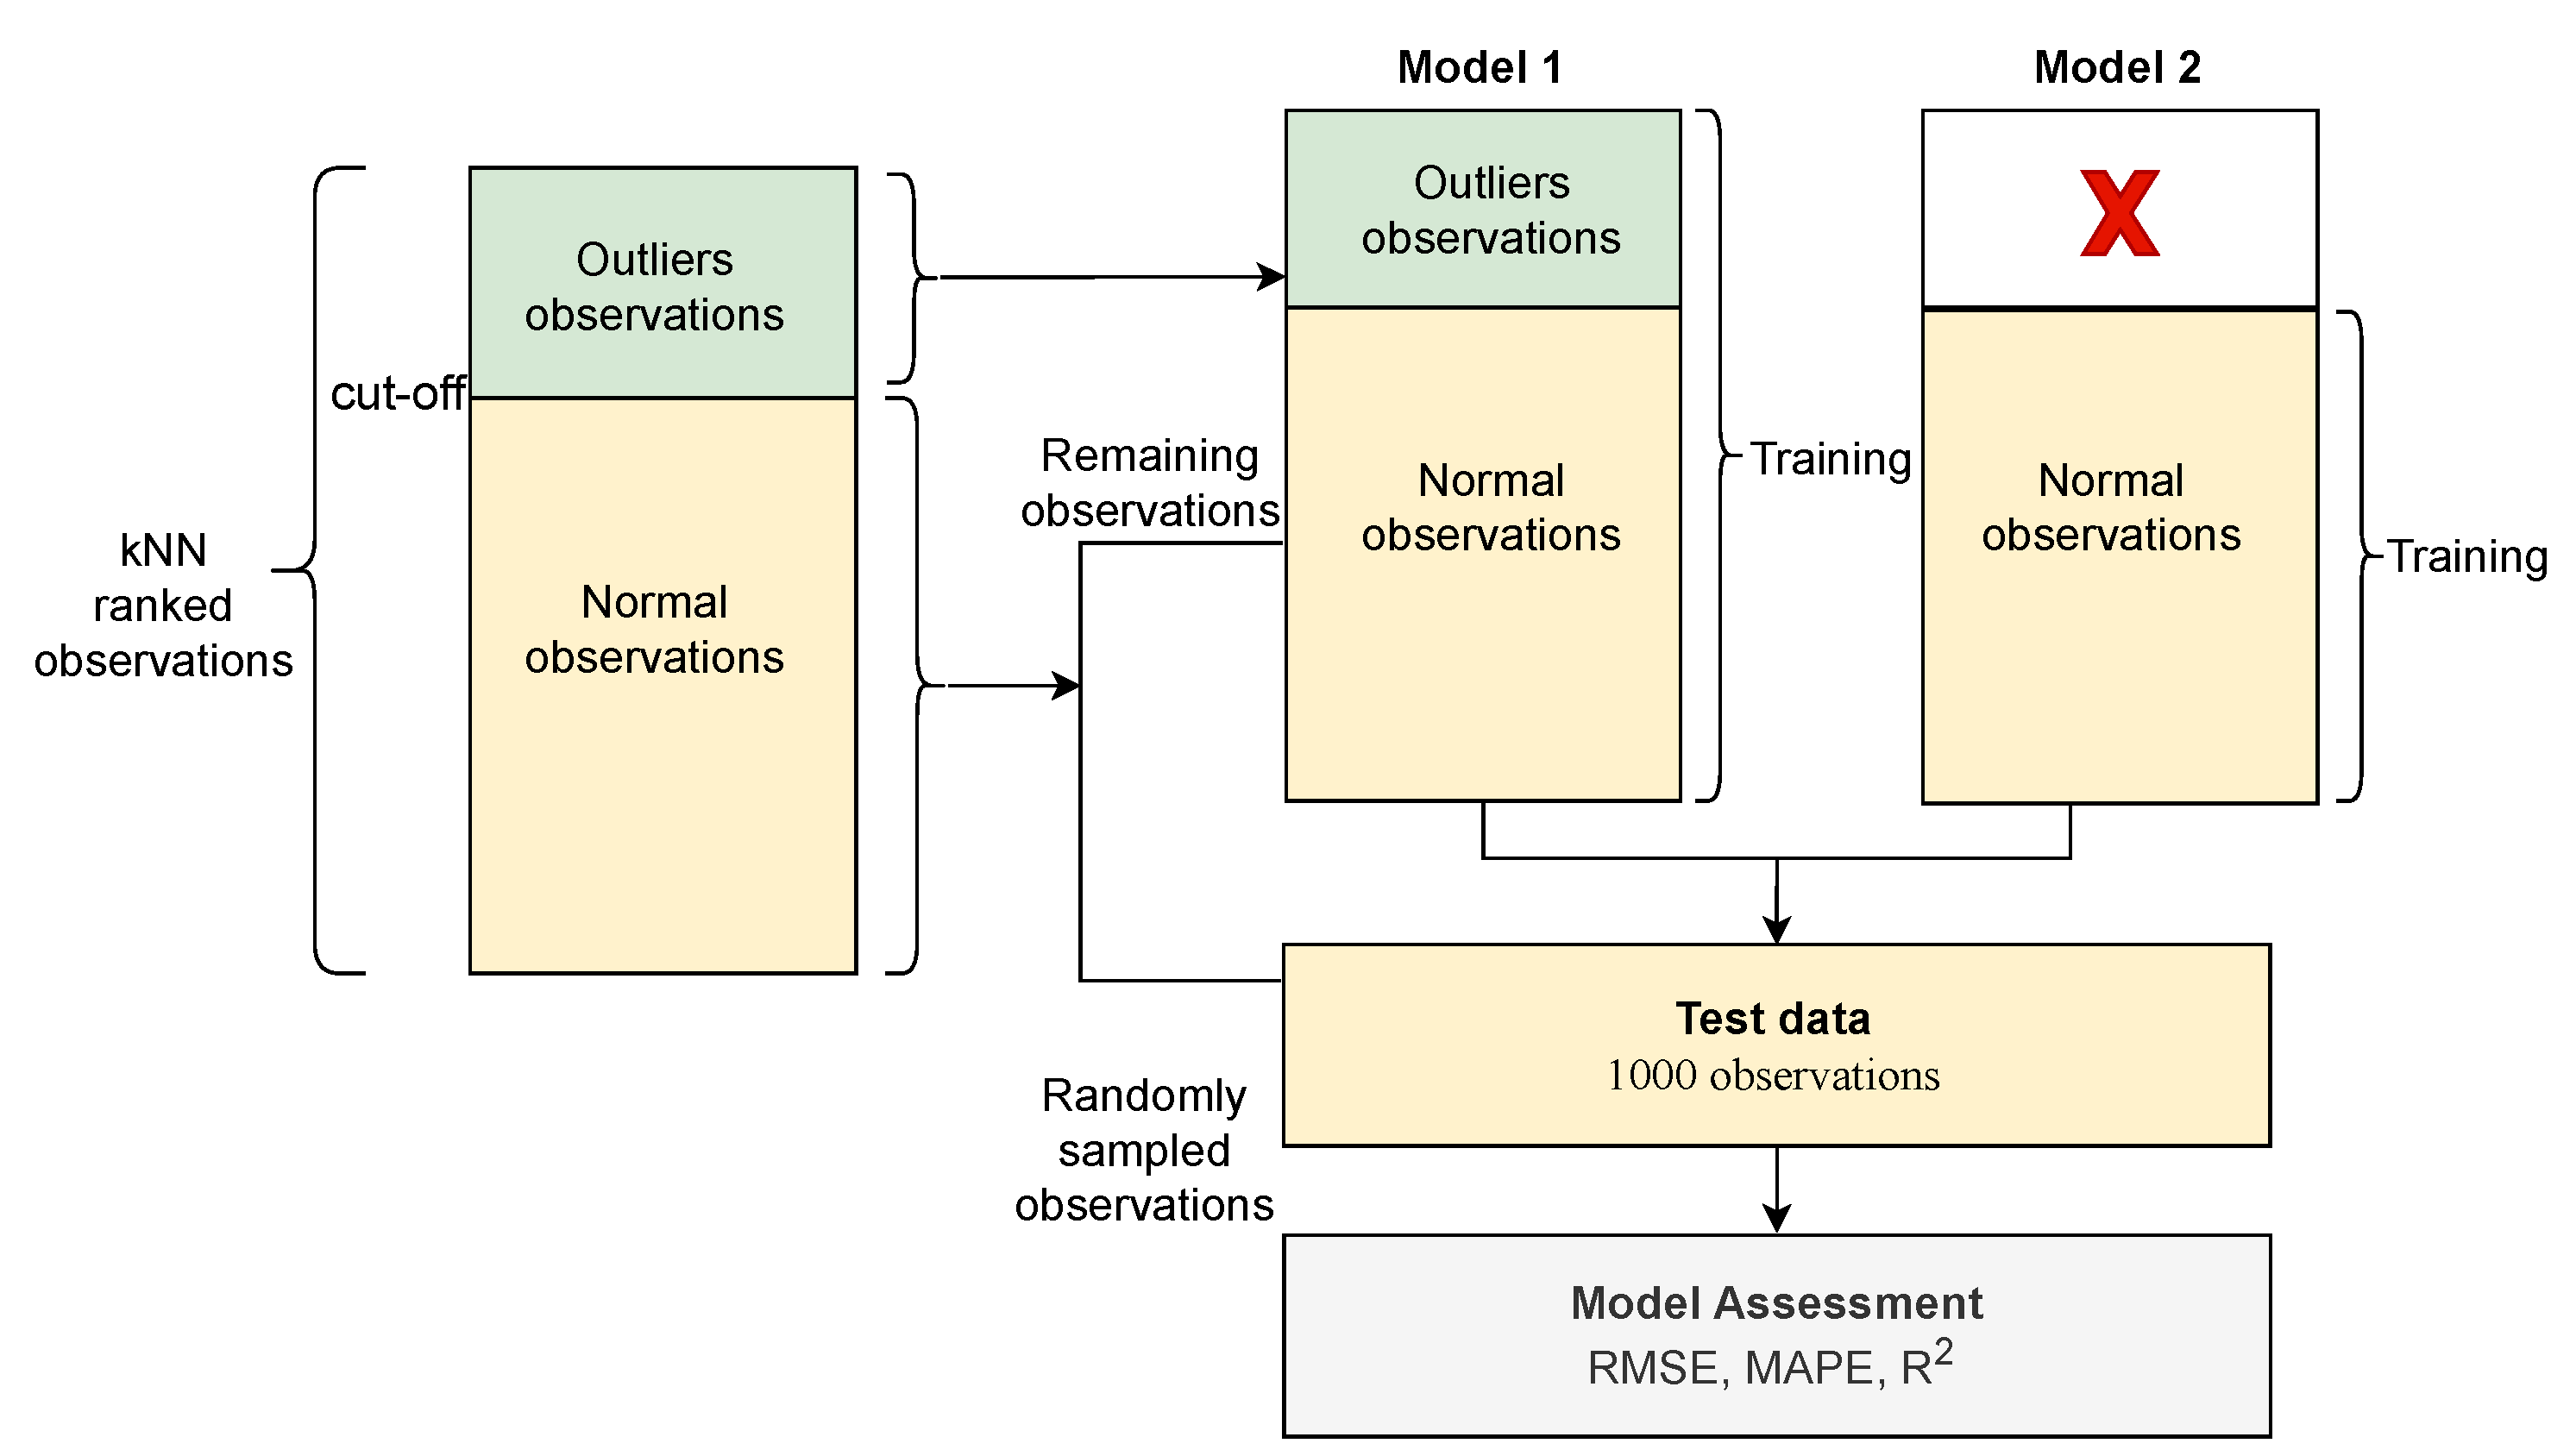
Table 2.
Basic descriptive statistics
| Variable | Mean | Std | Min | Max |
|---|---|---|---|---|
| Grd | 0.501713 | 0.103416 | 0.214286 | 0.738095 |
| Thp | 0.762795 | 0.10295 | 0.400435 | 0.974973 |
| PSD | 0.017179 | 0.009804 | 0.001816 | 0.050147 |
| XT1 | 0.270034 | 0.083872 | 0.000000 | 1.000000 |
| XT4 | 0.246805 | 0.111945 | 0.000000 | 0.457447 |
| FT1 | 0.036745 | 0.01972 | 0.000000 | 1.000000 |
| FT4 | 0.566525 | 0.207371 | 0.000000 | 1.000000 |
| FD1 | 0.425439 | 0.186854 | 0.075309 | 0.998814 |
| FD2 | 0.721567 | 0.123625 | 0.298425 | 0.996372 |
| FD4 | 0.73869 | 0.115472 | 0.345048 | 1.000000 |
| Rec | 0.828509 | 0.062056 | 0.695473 | 0.944154 |
Std = standard deviation, Min = Minimum, Max = Maximum Grd - feed grade, Thp - throughput, PSD - particle size distribution, XT1 - xanthate dosage in tank 1, FT1 - frother dosage in tank 1, FD1 - froth depth in tank 1, XT4 - xanthate dosage in tank 4, FT4 - frother dosage in tank 4, FD4 - froth depth in tank 4.
Table 3.
Quasi-outlier ranking within by the detection algorithms
| Quasi-outlier | Ranking | Ranking positions | ||
|---|---|---|---|---|
| kNN position | LOF position | ISF position | ||
| 8320 | 1 | 3 | 1 | 1 |
| 11790 | 2 | 1 | 2 | 38 |
| 11789 | 3 | 1 | 2 | 38 |
| 13911 | 4 | 208 | * | 398 |
| 14571 | 5 | 315 | 1220 | * |
| 8321 | 6 | 3 | 1 | 1 |
| 11691 | 7 | * | * | * |
| 8811 | 8 | * | 223 | * |
| 2146 | 9 | 15 | 50 | 10 |
| 186 | 10 | 2 | 17 | 54 |
| 187 | 11 | 2 | 17 | 54 |
| 11970 | 12 | 102 | 546 | 102 |
| 8355 | 13 | 19 | 3 | 11 |
| 10971 | 14 | 431 | 148 | 938 |
| 14320 | 15 | 25 | 16 | 18 |
| 15285 | 16 | 7 | 18 | 48 |
| 1879 | 17 | * | * | * |
| 1159 | 18 | 271 | 218 | * |
| 8468 | 19 | 57 | 15 | 47 |
| 8467 | 20 | 57 | 15 | 47 |
| 11031 | 21 | 943 | * | * |
| 2259 | 22 | 235 | 880 | 266 |
| 15286 | 23 | 7 | 18 | 48 |
| 2679 | 24 | 369 | 314 | * |
| 4839 | 25 | 455 | 473 | 662 |
| 1519 | 26 | * | * | * |
| 8511 | 27 | 92 | 54 | 81 |
| 420 | 28 | 233 | * | * |
| 10251 | 29 | 957 | 266 | * |
| 5139 | 30 | * | * | * |
| 1099 | 31 | 438 | * | * |
| 11391 | 32 | * | * | * |
| 2319 | 33 | 141 | * | 494 |
| 13131 | 34 | * | * | * |
| 15291 | 35 | 2 | 18 | 48 |
| 2575 | 36 | 7 | 41 | 75 |
| 2147 | 37 | 15 | 50 | 10 |
| 8327 | 38 | 3 | 1 | 1 |
| 8382 | 39 | 59 | 21 | 45 |
| 15293 | 40 | 7 | 18 | 48 |
| 249 | 41 | 164 | 365 | 459 |
| 14454 | 42 | 278 | 534 | 346 |
| 2574 | 43 | 74 | 41 | 75 |
| 206 | 44 | 132 | 320 | 199 |
| 13191 | 45 | * | * | 142 |
| 177 | 46 | 2 | 17 | 54 |
| 5529 | 47 | 80 | 70 | 77 |
| 8322 | 48 | 2 | 1 | 1 |
| 5859 | 49 | 1041 | * | * |
| 6279 | 50 | * | * | * |
Note: A lower number means an algorithm considers an observation the worst outlier whereas higher number means an algorithm considers the observation as less suspicion to be an outlier. * denotes quasi-outliers not covered by the corresponding algorithm.
Table 4.
Cover rate of quasi-outliers by detection methods
| Algorithms | Cover range and rate of outlier detection algorithms | |||
|---|---|---|---|---|
| kNN | 0.77 | 0.79 | 0.84 | 0.84 |
| LOF | 0.59 | 0.61 | 0.65 | 0.65 |
| ISF | 0.57 | 0.61 | 0.63 | 0.64 |
Note: Bold text represent highest values which indicate better cover rate (CR) and effective detection
Table 5.
Non-covering outliers from the detection algorithms
| Algorithms | Number of outliers ( threshold) | Number of non-covering outliers |
|---|---|---|
| kNN | 300 | 80 |
| LOF | 74 | 11 |
| ISF | 28 | 2 |
Table 6.
Summary of the impact of removing quasi-outliers on prediction
| Quasi-outliers removed | Training | Testing | ||
|---|---|---|---|---|
| RMSE | MAPE | RMSE | MAPE | |
| 0* | 0.0083 | 0.6146 | 0.0079 | 0.6153 |
| 93 | 0.0028 | 0.2124 | 0.0036 | 0.2393 |
| 150 | 0.0026 | 0.1976 | 0.0031 | 0.2252 |
* Data set in which no quasi-outlier observations have been removed
Table 7.
Model (Model 1) performance assessment with outliers
| Metrics | Training | Validation | Testing |
|---|---|---|---|
| RMSE | 0.1125 | 0.1128 | 0.0050 |
| MAPE | 0.8462 | 0.8711 | 0.4715 |
| 0.96 | 0.96 | 0.98 |
Table 8.
Model (Model 2) performance assessment without outliers
| Metrics | Training | Validation | Testing |
|---|---|---|---|
| RMSE | 0.0105 | 0.0111 | 0.0040 |
| MAPE | 0.8193 | 0.8231 | 0.4072 |
| 0.97 | 0.97 | 0.99 |
Disclaimer/Publisher’s Note: The statements, opinions and data contained in all publications are solely those of the individual author(s) and contributor(s) and not of MDPI and/or the editor(s). MDPI and/or the editor(s) disclaim responsibility for any injury to people or property resulting from any ideas, methods, instructions or products referred to in the content. |
© 2024 by the authors. Licensee MDPI, Basel, Switzerland. This article is an open access article distributed under the terms and conditions of the Creative Commons Attribution (CC BY) license (http://creativecommons.org/licenses/by/4.0/).
Copyright: This open access article is published under a Creative Commons CC BY 4.0 license, which permit the free download, distribution, and reuse, provided that the author and preprint are cited in any reuse.


