
Submitted:
08 May 2025
Posted:
08 May 2025
Read the latest preprint version here
Abstract
Costa Rica, despite its environmental leadership in Latin America, faces persistent challenges in achieving equitable and efficient solid waste management—particularly across its urban–rural divide. This study introduces a novel, multi-model computational framework that integrates geospatial simulation, agent-based modeling (ABM), reinforcement learning (RL), and economic cost analysis to assess and optimize recycling accessibility, behavior, and system efficiency.Using spatial data for all seven provinces, household-level recycling engagement is simulated under varying infrastructure and policy scenarios. Initial simulations reveal that more than 18,000 households in provinces like Alajuela remain over 50 km from the nearest facility, significantly constraining participation. While baseline ABM results show regional disparities—with recycling rates ranging from 28.9% to 36.7%—the integration of RL raises national recycling performance to 84.3% and lowers the cost-per-ton of waste managed from USD 1,784 to just USD 128. Monte Carlo-based cost simulations identify processing, setup, and operations as the primary cost drivers, while sensitivity analyses confirm the economic resilience of the RL strategy. By linking adaptive behavioral modeling with spatial equity and environmental impact, this study offers a scalable, data-driven decision-support tool to inform policy, guide infrastructure investment, and support Costa Rica’s circular economy and Sustainable Development Goal (SDG) targets. The framework is transferable to other Global South contexts facing similar waste governance challenges.
Keywords:
agent-based modeling (ABM)
; reinforcement learning (RL)
; waste management
; circular economy
; spatial accessibility
; sustainable infrastructure
1. Introduction
Effective waste management systems are critical to mitigating the environmental impacts of growing solid waste streams—particularly in developing nations where urban–rural disparities in infrastructure and service delivery complicate sustainable practices. The United Nations Sustainable Development Goals (SDGs), specifically SDG 12 (Responsible Consumption and Production) and SDG 13 (Climate Action), emphasize equitable access to waste recovery systems to reduce pollution and promote circularity (United Nations, 2023). Although Costa Rica is often hailed as a regional sustainability leader, significant challenges persist: landfill saturation, limited rural infrastructure, and persistent gaps in public waste-sorting behavior all threaten the long-term resilience of the national system (Baltodano-Goulding & Poveda-Montoya, 2023; Rojas Robles, 2025).
These systemic constraints mirror global patterns. In the Global South, limited recycling infrastructure, open dumping, and underdeveloped circular practices continue to dominate (Ferronato et al., 2024). Urban centers such as San José benefit from dense recycling networks, while coastal and rural areas—including Limón and Guanacaste—struggle with sparse facility coverage and low participation rates (Bravo et al., 2024; Graham, 2024a). Past studies suggest that Geographic Information Systems (GIS) can significantly improve facility placement, especially in underserved regions, while social factors—such as internet access and education—play a key role in driving household behavior (Graham, 2024a; Bravo et al., 2024).
This study addresses these challenges by developing the first computational framework in Costa Rica that integrates spatial accessibility (Model 1), agent-based behavioral simulation (Model 2), reinforcement learning (Model 3), cost modeling (Model 4), and parameter sensitivity analysis (Model 5). This systems-level approach quantifies the technical, behavioral, and economic effects of decentralized recycling strategies.
The research pursues five objectives:
(1) To assess current recycling accessibility across Costa Rican provinces using geospatial and demographic data;
(2) To simulate infrastructure expansion scenarios to improve household access in underserved areas;
(3) To model recycling participation and environmental outcomes using ABM and RL;
(4) To estimate the financial feasibility of proposed strategies through a cost model incorporating setup, labor, operational, and energy expenses; and
(5) To evaluate parameter sensitivity through contour-based simulations, informing scalable and economically viable policy design.
To this end, the study deploys an agent-based model (ABM) to replicate household sorting behaviour across Costa Rica’s diverse regions. ABMs are well-established tools for capturing socio-environmental feedbacks and simulating spatial behavior under policy scenarios (Le Page et al., 2013). Recent spatial ABM work further confirms their utility in reproducing intention–behaviour gaps and localised performance under infrastructure change (Cohen, Gil, & Rosado, 2025). Reinforcement learning (RL) is layered onto the ABM to optimise agents’ decisions and facility policies dynamically—an approach shown to reduce transport exposure risk by nearly 20% in municipal waste-routing systems (Sert et al., 2020; Khallaf et al., 2025). To assess economic viability, the model integrates a Monte Carlo-based cost simulation, enabling propagation of uncertainty in logistics, energy use, and investment inputs—an essential feature for robust circular economy planning (Gamal et al., 2025). Together, these innovations deliver a systems-level platform for evaluating decentralised infrastructure, grounded in recent evidence on composting and decentralised waste-energy conversion in tropical contexts (Ashraf et al., 2025).
By uniting spatial intelligence, machine learning, behavioral simulation, and economic modeling, this research provides a novel, multidisciplinary framework for improving recycling participation, siting infrastructure equitably, and reducing the cost-per-ton of sustainable waste recovery in Costa Rica.
2. Literature Review
2.1. Current State of Waste Management
Costa Rica continues to face significant challenges in managing solid waste, particularly due to regional inequalities in socioeconomic conditions and the availability of infrastructure. In the Metropolitan Area, the estimated waste generation rate is around 0.59 kg per person per day, with organic waste accounting for 55.9% of the total waste (Herrera-Murillo et al., 2016). Conversely, in the canton of Guácimo, the waste generation rate is slightly lower, at 0.55 kg per person per day, with waste composition comprising 45% biodegradable material, 35% recyclable waste, and 20% destined for landfills (Campos Rodríguez & Soto Córdoba, 2014). These differences highlight the fact that urban areas, such as San José, contribute to roughly 47% of the country’s waste, putting substantial pressure on existing infrastructure. The recent shutdown of the Los Pinos landfill in Cartago has further emphasized the need for alternative methods of waste management. In light of this, the development of regionally tailored leachate management models that consider Costa Rica’s tropical climate has been recognized as an essential strategy for improving landfill operations (Baltodano-Goulding & Poveda-Montoya, 2023). Understanding the dynamics of these regional variations is key to developing targeted and equitable strategies that can enhance waste management systems across both urban and rural regions.
Given these disparities in both geography and demographics, utilizing a geospatial approach for modeling accessibility is crucial. By simulating how distance and infrastructure influence household access to recycling facilities, this study’s spatial model provides a data-driven foundation to identify underserved areas and evaluate the potential impacts of new infrastructure, particularly in rural areas and densely populated urban zones.
2.2. Landfill Capacity, Waste Flows, and Global Recycling Comparison
Costa Rica continues to face severe structural inefficiencies in its solid waste system. According to the Ministry of Health, approximately 1,282,057 tonnes of waste were landfilled in 2021, but only 9.6% was recovered: 3.9% through recycling, 2.7% composting, and 2.4% co-processing (Chaves Brenes, 2024; OECD, 2023; Quesada Cordero, 2024). The vast majority—94%—is still directed to landfill, a figure compounded by limited infrastructure in rural areas (Ministerio de Ambiente y Energía, 2023). Urban centers like San José generate over 58% organic waste, underscoring the urgent need for better composting infrastructure (Becerra, 2021).
However, the landfill situation has deteriorated rapidly. In early 2025, La Carpio landfill, which serves most of the Greater Metropolitan Area (GAM), was reported to be at the end of its operational life, while El Huazo, the only alternative in Aserrí, is projected to close within months. A proposed replacement, the Bajo Pita landfill in San Miguel de Turrúcares, has faced public backlash due to environmental concerns and questionable permitting processes. Despite legal disputes, the national government has backed this site under Project Law 24.251, aiming to regionalize landfill management, even overriding municipal decision-making authority—a move heavily contested by communities and local governments (Rojas Robles, 2025).
Parallel to the infrastructure crisis, waste generation in Costa Rica has shown a steady rise: 1.46 million tonnes in 2018, 1.61 million tonnes in 2022, and over 11,000 tonnes produced daily in 2025 (Rodríguez, 2025; Li, 2025). Despite national circular economy efforts, including composting, recycling, and reuse programs, most of the recoverable waste ends up in landfills or informal dump sites due to gaps in enforcement, funding, and education (Li, 2025).
International comparisons highlight Costa Rica’s lag in recovery. Germany and South Korea recycle 69.3% and 69% of their waste, respectively, thanks to robust public participation and infrastructure, while Costa Rica recycles only 9.6% (OECD, 2023). As Table 1 shows, Costa Rica’s reliance on landfill contrasts with countries that have implemented mandatory separation, waste-to-energy technologies, and circular design policies (Landgeist, 2024; Klein, 2024; Seoul Metropolitan Government, 2023).

Table 1.
Global Recycling Rates and Contributing Factors.
| Region/Country | Recycling Rate (%) | Key Contributing Factors | References |
|---|---|---|---|
| European Union | 46% (2020) | Varies across member states; strong policies and infrastructure | (European Environment Agency, 2023) |
| Germany | 69.3% (2024) | Stringent waste separation, strong regulations | Landgeist, 2024 |
| United States | 21% (2024) | State-level variations, mixed public participation | Recycling Partnership, 2024 |
| Japan | 20% (2023) | Meticulous waste sorting, but lower recycling infrastructure | Klein, 2024 |
| Brazil | 4% (2024) | Driven by informal sector, lack of formal infrastructure | Gerden, 2024 |
| South Korea | 69% (2023) | Public involvement, advanced waste sorting systems | Seoul Metropolitan Government, 2023 |
| Sweden | 50% (2024) | High integration of Waste-to-Energy (WtE) technologies | Swedish Environmental Protection Agency, 2024 |
| Costa Rica | 9.6% | High landfill dependency, minimal recycling infrastructure | OECD, 2023 |
The crisis in landfill capacity, the growth of daily waste generation, and weak recovery practices form the foundation for this study’s computational approach. By integrating geospatial accessibility (Model 1), agent-level behavior simulations (Models 2 and 3), and economic modeling (Model 4), the research quantifies how infrastructure, behavior, and policy interact. These models enable the testing of alternative facility locations, regional management scenarios, and recycling strategies under different economic and behavioral conditions—scenarios urgently needed to respond to the challenges detailed in this section.
2.3. Government Initiatives and Policies
The Costa Rican government has introduced key initiatives, such as the Environmental Health Route policy and the National Circular Economy Strategy, to increase the national recycling rate to 25% by 2033. These initiatives include specific targets, such as a 10% reduction in per capita waste generation by 2025, enhanced public education on recycling, and development of new processing facilities in underserved areas (Ministerio de Salud de Costa Rica, 2023). Additionally, Law No. 9786, targeting single-use plastics, supports these goals by enforcing restrictions and promoting sustainable alternatives (Gómez, 2023; Holland Circular Hotspot, 2021).
As shown in Table 2, the government has outlined a series of strategic initiatives, each with specific targets and timeframes aimed at reducing waste generation and improving recycling infrastructure.
Table 2.
Government Initiatives and Goals.
| Initiative | Goal | Target Year | Reference |
|---|---|---|---|
| Environmental Health Route Policy | Increase recycling rate to 25% | 2033 | Ministerio de Salud de Costa Rica, 2023 |
| Environmental Health Route Policy | Ensure regular garbage collection in 34% of the territory | 2023 | Ministerio de Salud de Costa Rica, 2023 |
| Environmental Health Route Policy | Reduce per capita waste generation by 10% | 2025 | Ministerio de Salud de Costa Rica, 2023 |
| National Circular Economy Strategy | Promote circular economy practices | Ongoing | Gómez, 2023; Holland Circular Hotspot, 2021 |
| Law No. 9786 (Law to Combat Plastic Pollution and Protect the Environment) | Drastically reduce single-use plastic usage and promote sustainable alternatives | 2019 | Procuraduría de la República de Costa Rica, 2024 |
These policy frameworks provide a valuable context for evaluating the behavioral and economic implications simulated in this study’s models, particularly those addressing regional waste flow, recycling infrastructure, and incentive strategies.
2.5.1. Waste Management Innovation Index
The Waste Management Innovation Index provides a comparative overview of global progress in solid waste management by evaluating five key dimensions: technological advancement, policy innovation, public engagement, infrastructure development, and sustainability impact.
As shown in Table 3, Costa Rica significantly lags behind high-performing countries, particularly in technology and infrastructure—two areas critical for modern waste diversion and circular economy strategies.
Table 3.
Waste Management Innovation Index.
| Country | Technological Advancements | Policy Innovation | Public Engagement | Infrastructure Development | Sustainability Impact | Overall Index Score | References |
|---|---|---|---|---|---|---|---|
| Germany | High | High | High | High | High | 9/10 | BMUV, 2023 |
| United States | High | High | High | High | Moderate | 9/10 | WIPO, 2024 |
| Japan | High | High | High | Moderate | Moderate | 8/10 | Klein, 2024 |
| Brazil | Low | Low | Low | Low | Low | 3/10 | Lino et al., 2023 |
| South Korea | High | High | High | High | High | 9/10 | Kwon et al., 2024 |
| Sweden | High | High | High | High | High | 9/10 | Sandhi & Rosenlund, 2024 |
| Costa Rica | Low | Moderate | Moderate | Low | Low | 4/10 | Arias, 2024 |
These innovation gaps directly inform the modeling strategies used in this research, which simulate the performance of improved infrastructure and policy interventions in closing Costa Rica’s technological and sustainability deficit.
2.6. National Waste-to-Energy Initiatives
The Costa Rican Electricity Institute (ICE) has launched a multi-phase biogas initiative to address the country’s escalating waste crisis by converting organic waste—53% of the national stream—into renewable energy. A pilot facility at La Uruca already feeds 140 kW of landfill-derived energy into the national grid, demonstrating the project’s potential for expansion. This effort aligns with the Ministry of Health’s broader Waste-to-Energy (WtE) strategy aimed at developing decentralized regional treatment centers (Tico Times, 2024).
Despite its promise, the initiative faces major hurdles, including limited technical infrastructure, inconsistent municipal engagement, and public resistance in target regions. The program’s success, especially in the highly pressured Greater Metropolitan Area (GAM), will depend on transparent implementation, regulatory alignment, and investment in enabling technologies.
These national WtE efforts underscore the importance of this study’s modeling framework. By simulating household behavior, spatial siting, and cost dynamics, the models provide a decision-support tool for evaluating the feasibility and impact of WtE deployment under varying regional conditions.
2.7. Computational Modeling in Waste Management
Although Costa Rica’s policy reforms and international comparisons are well documented, the computational modeling of waste-system dynamics remains underdeveloped. A recent global review of 2000–2023 studies found that nearly half of all solid waste agent-based models (ABMs) still rely on static, rule-based decision mechanisms, with limited use of adaptive behaviors (Tian et al., 2025). Spatially explicit simulations also show limitations: for example, an urban ABM that incorporated the Theory of Planned Behavior failed to account for changing bin locations, resulting in rigid sorting behaviors and widened intention–behavior gaps (Cohen et al., 2025).
Parallel research highlights that machine learning (ML) integration is still rare. A PRISMA meta-analysis of 69 municipal solid waste studies reported that fewer than 10% used ML in any capacity, and almost none applied it within ABMs (Dawar et al., 2025). When ML is used, reinforcement learning (RL) remains an exception. Notable cases include an A*–Deep Q Network that reduced medical-waste vehicle routing distance and risk by 18% compared to heuristic methods (Khallaf et al., 2025) and a PPO agent that achieved near-zero safety violations in a waste-sorting plant through curriculum learning (Pendyala et al., 2024).
Building on these insights, this study develops the first systems-level model of decentralized household recycling and facility siting in Costa Rica, combining ABM with ML-based behavioral prediction and RL-driven policy optimization, calibrated to national socio-economic and cost data. This hybrid approach addresses the identified methodological gaps by linking adaptive household dynamics with geospatial decision-making.
3. Methodology
3.1. Geospatial Data Integration and Household Simulation
This study employed a geospatial simulation framework to evaluate household accessibility to waste management infrastructure across Costa Rica’s seven provinces. Spatial data included shapefiles for provincial boundaries, existing recycling facilities, and proposed facility locations, processed using GeoPandas in Python. All geospatial layers were reprojected to a unified coordinate reference system to ensure accurate distance calculations. Facility points were filtered to include only those within provincial boundaries using spatial joins.
To simulate household distributions, each province was populated with 100 random points, generated uniformly within the provincial boundaries. These points represented households and were probabilistically labeled as urban or rural based on province-specific urbanization ratios (e.g., 84% urban for San José). The simulation approach accounted for spatial heterogeneity in settlement patterns without requiring detailed address-level data. The total number of households in each province was estimated using the following formula (Equation 1):
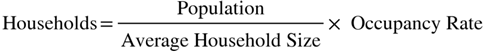
The variables used were:
Population: total number of inhabitants in the province
Average Household Size: the mean number of individuals per household
Occupancy Rate: percentage of dwellings that are inhabited
Population and household size values were obtained from national census statistics (Instituto Nacional de Estadística y Censos, 2022), as summarized in Supplementary Table 1. This total was used to scale the simulated points, ensuring that distance-based accessibility analyses reflected the actual number of households per province.
3.2. Distance Computation and Accessibility Binning
For each simulated household location, the straight-line (Euclidean) distance to the nearest recycling facility, both existing and proposed, was determined. While this approach is simplified, it is a common method in spatial accessibility research, providing a reliable measure of proximity when detailed transportation network data are unavailable.
The calculated distances were grouped into five distinct accessibility categories: 0–5 km, 5–10 km, 10–20 km, 20–50 km, and distances greater than 50 km. These categories serve as key thresholds for evaluating the extent of service coverage in different geographic contexts, including both urban and rural areas. The number of households falling within each of these distance ranges was determined using the following formula (Equation 2):

Where:
di is the distance from simulated household ⅈ to the nearest facility
1X≤di<Y is an indicator function equal to 1 if the distance falls within the interval [X,Y), 0 otherwise
n is the number of sampled households
Scaling Factor adjusts the household sample to reflect actual population totals
The results were disaggregated by province, region type (urban or rural), distance bin, and facility type (existing or proposed), yielding a robust overview of national accessibility conditions.
3.3. Agent-Based Modeling and Machine Learning Integration
To simulate household-level recycling behavior across Costa Rica’s seven provinces, we developed a hybrid Agent-Based Model (ABM) integrated with a machine learning (ML) classifier. This framework enabled dynamic modeling of household decision-making, incorporating spatial accessibility, economic incentives, policy penalties, and behavioral adaptation over time.
Province-specific population and average household size data (see Supplementary Table 1) were used to estimate the number of households per province. A total of 1,000 agents were proportionally distributed based on these estimates. Each agent was initialized with a randomly assigned set of attributes, including an initial recycling rate (centered around 0.096), binary indicators for policy incentives and penalties, a classification as urban or rural, and an accessibility score from 0 (best access) to 4 (worst), derived from the spatial accessibility model presented in Section 3.2.
A Random Forest classifier was trained on synthetically generated behavioral data to estimate each agent’s probability of engaging in recycling behavior. The classifier used five key input features: the agent’s initial recycling rate, the presence of a policy incentive, the presence of a penalty, the region type (urban or rural), and the accessibility score. The synthetic data generation process simulated participation likelihood based on the following factors (Equation 3):

r is the initial recycling rate (0 to 1)
I is a binary indicator for policy incentive (1 if present, 0 otherwise)
P is a binary indicator for penalty (1 if present, 0 otherwise)
U is the region code (1 for urban, 0 for rural)
A is the accessibility score (0 = best, 4 = worst)
The classifier was trained on 1,000 synthetically generated samples and subsequently embedded into the ABM as the core decision-making mechanism for each household agent. At every simulation time step, agents used the classifier to estimate the probability of recycling based on their current attributes. If the probability exceeded a randomly drawn threshold, the agent was classified as recycling. When an agent chose to recycle, its personal recycling rate increased by 0.005; if it did not recycle, the rate decreased by the same amount. This behavioral adjustment was bounded within the interval [0, 1][0, 1][0, 1], simulating gradual reinforcement or disengagement over time based on past behavior.
Each household’s daily waste generation was modeled using demographic characteristics and behavioral parameters. Specifically, the waste generation rate varied depending on household location and policy influence. Urban households were assumed to generate 0.59 kg of waste per person per day, while rural households generated 0.55 kg, based on national estimates (Herrera-Murillo et al., 2016; Campos Rodríguez & Soto Córdoba, 2014). The model also incorporated the impact of Pay-As-You-Throw (PAYT) policies, which reduce waste generation through economic incentives. Accordingly, the total daily waste generated per household agent was calculated as shown in Equation (4):

p is the number of persons in the household
R is the waste generation rate (kg/person/day)
D is the PAYT discount factor (0.13 if active, 0 if not)
If the agent chose to recycle, all waste generated was assumed to be diverted from landfill and counted as recycled waste. This recycled quantity was then used to estimate associated environmental outcomes.
Based on emission factors published by the U.S. Environmental Protection Agency, mixed municipal recyclables diverted from landfill avoid approximately 0.75 kg CO₂-equivalent per kilogram of waste (U.S. EPA, 2024). This represents the net benefit of recycling compared to landfilling, and has been widely used in lifecycle-based carbon accounting studies. Plastic waste was estimated as 12% of the total household waste, based on national plastic composition studies (Graham, 2024b), and organic waste was assumed to comprise 30% of total waste. The energy potential of the organic fraction was modeled as biogas generation at a rate of 0.25 kWh per kilogram of organic waste (Vega et al., 2024). These relationships are summarized in Equations (5), (6), and (7):
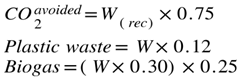
Landfill emissions were estimated based on national statistics indicating that 94% of household waste is disposed of in landfills (Quesada Cordero, 2024). A landfill emission factor of 0.5 kg CO₂-equivalent per kilogram of waste was applied to this portion. The total landfill-related emissions were therefore calculated as shown in Equation (8):

Agent behavior and environmental outputs were tracked over 50 time steps. Each agent’s province, region, recycling decision, and environmental metrics were recorded at each step using the Mesa framework’s DataCollector module.
3.4. Reinforcement Learning and Machine Learning Integration in Agent-Based Modeling
To enhance the adaptive behavior of household agents, a reinforcement learning (RL) extension was implemented within the existing Agent-Based Model (ABM). This framework incorporated Q-learning, enabling agents to learn optimal recycling decisions through environmental feedback over time, while continuing to rely on machine learning (ML) predictions as an initial behavioral guide.
Each agent began with a probabilistic recycling decision derived from a Random Forest classifier trained on 1,000 synthetic samples, using five key features: recycling rate, policy incentive, policy penalty, urban/rural classification, and accessibility score. This ML component informed agents’ initial behavior, but the core decision-making evolved through Q-learning, which allowed agents to update their action values based on perceived rewards.
The Q-learning update followed the standard Bellman equation, shown below as Equation (9):
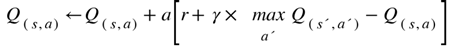
where:
Q(s,a): Q-value for taking action aaa in state sss (defined by accessibility score)
α: learning rate (0.05)
γ: discount factor (0.9)
r: reward received after taking action aaa
a′: possible future actions (recycle or not)
The reward function was crafted to balance environmental benefits and spatial equity, aligning with best practices in reward engineering and shaping in reinforcement learning applications (Ibrahim et al., 2024) using Equation (10):

where:
CO2avoided: kilograms of CO₂ emissions avoided through recycling
RegionWeight: 1.2 for urban agents, 1.0 for rural
AccessScore: discrete value from 0 (best) to 4 (worst) indicating spatial access to facilities
r: the immediate reward used to update the Q-table in the agent’s reinforcement learning process
This function rewarded agents for maximizing environmental benefits while applying a minor penalty for being in less accessible regions. The result was a dynamic learning mechanism that adapted behavior based on both environmental impact and spatial equity.
To advance beyond fixed classifier-based decision-making, a reinforcement learning (RL) module was embedded into the ABM to enable agents to adaptively refine their recycling behaviors over time. While the initial recycling probabilities were estimated using a Random Forest classifier (see Section 3.3), the RL layer empowered agents to autonomously update their strategies based on cumulative environmental rewards. This hybrid learning model mirrors real-world behavioral plasticity, where initial tendencies evolve through experience and feedback.
3.5. Economic Evaluation Model
To quantify the economic implications of each waste management strategy, we developed a post-simulation cost estimation model using Python. This model processed agent-level output data generated by the ABM and RL-based simulations. Specifically, it aggregated the total waste generated, recycled, and associated by-products such as CO₂ avoided, biogas, and plastic waste.
A cost function was implemented to evaluate each scenario using standardized unit costs sourced from national institutions and international agencies. Cost categories included collection, disposal, recycling transportation, recycling operations, facility setup and maintenance, energy, labor, and general waste processing. The model assumed fixed parameters such as seven facilities, twenty-one operational workers, and a simulation horizon of twelve months. Energy use and fuel consumption were estimated per ton of waste managed.
All unit cost values used in the analysis are summarized in Supplementary Table 3, which compiles the most recent available rates from government and international sources. These values were applied directly to simulation outputs using basic arithmetic operations—without the need for formal symbolic equations.By applying these cost parameters to the aggregated simulation outputs, the model computed key financial indicators, including total operational cost, cost per ton of waste managed, and cost per kilogram of CO₂ avoided. This allowed for a direct economic comparison between the agent-based and reinforcement learning strategies.
3.6. Sensitivity Analysis
To evaluate the robustness of the economic model and identify the parameters with the greatest influence on system costs, a one-way sensitivity analysis was conducted. This involved independently varying key unit cost parameters used in the economic evaluation (Section 3.5) and observing the resulting changes in total system cost.
The analysis was performed on the reinforcement learning simulation outputs, as this strategy represented the highest operational scale and provided a realistic testing ground for parameter volatility. Each parameter was varied by ±10% and ±25% while holding all others constant, in order to isolate its effect on the economic outcome.
The total system cost for each scenario was recalculated using the cost function defined in Equation 11, which aggregates the individual cost components of the waste management system as follows:

where:
Ccoll= waste collection cost (waste generated × unit collection cost)
Cdisp= final disposal cost (landfilled waste × disposal cost per ton)
Ctrans= recycling transportation cost (recycled waste × transport cost per ton)
Crecycle= recycling operation cost (recycled waste × operational cost per ton)
Cproc= general waste processing cost (waste generated × processing cost per ton)
Cfac= facility setup cost (cost per facility × number of facilities)
Clab= labor cost (monthly wage × number of workers × simulation months)
Celec= electricity cost (kWh per ton × recycled waste × electricity rate)
Each parameter sweep was visualized through line plots showing the relationship between parameter variation and resulting total cost. This allowed identification of the most sensitive cost components, guiding future model refinement and investment prioritization.
4. Results
4.1. Accessibility of Waste Management Facilities Across Provinces
This study assessed household accessibility to existing and potential waste management facilities across Costa Rica’s seven provinces by simulating household distributions and calculating distances to the nearest facility. Each province’s results were scaled to reflect actual household counts and further disaggregated by urban and rural classifications. The findings reveal pronounced spatial inequalities. In provinces such as Alajuela and Puntarenas, rural households were significantly more likely to reside far from both current and proposed facilities. Notably, over 18,000 households in Alajuela remained more than 50 km away from any facility, even under the proposed infrastructure scenario. This suggests that new deployments have not sufficiently addressed deep-rooted accessibility gaps in less urbanized zones.
Urban regions showed comparatively higher levels of access. In San José and Heredia, a substantial proportion of households were located within 0–10 km of an existing facility, reflecting denser infrastructure typical of metropolitan areas. While potential facility additions improved access in most provinces—shifting some rural households into closer proximity bands—the gains were modest. Peripheral regions such as Limón, Guanacaste, and rural Puntarenas continued to exhibit large numbers of households situated more than 20 km from any facility. Supplementary Figure 1 visually supports these findings by mapping the simulated spatial distribution of households and facility proximity, highlighting the persistent geographic disparity. These spatial disparities have direct behavioral implications, as accessibility was found to correlate with participation in recycling efforts.
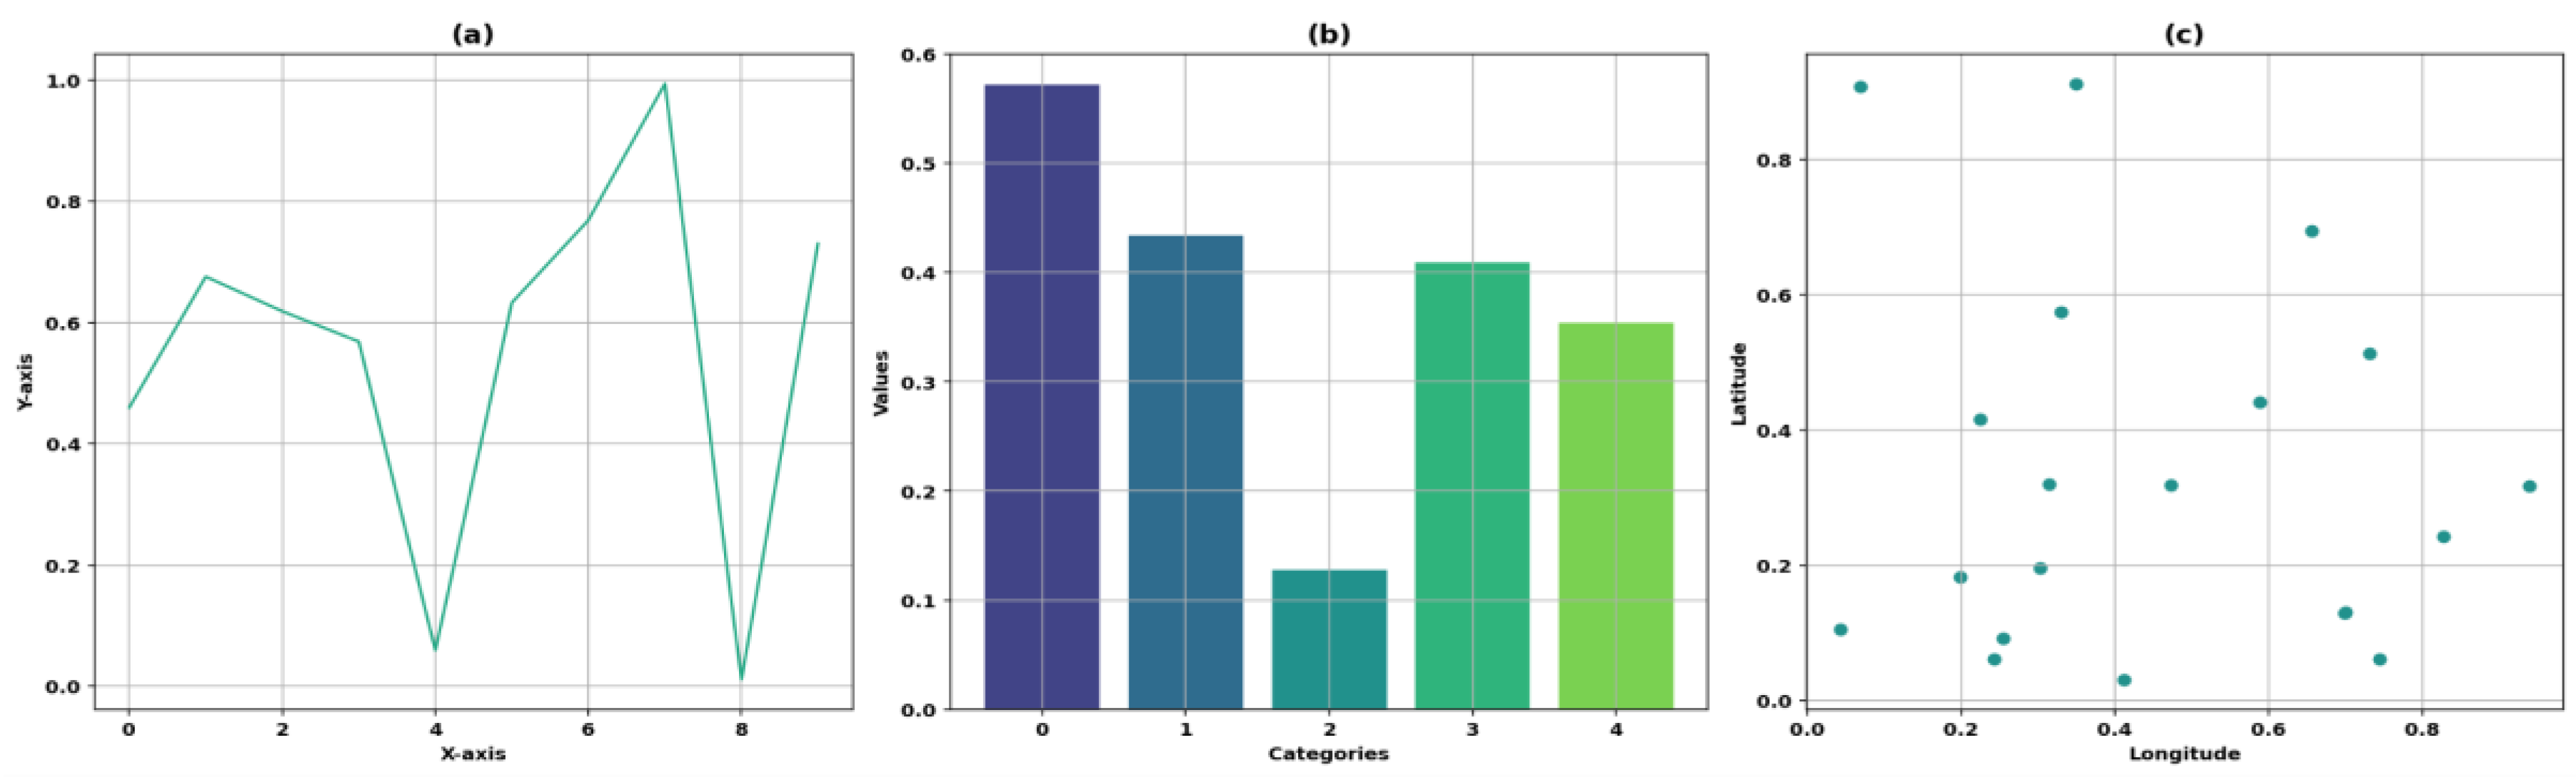
Figure 1 illustrates these model-derived patterns through three panels: the national recycling rate trend over time, provincial disparities in final recycling outcomes, and the observed relationship between household access (measured via Distance Score) and recycling behavior. These patterns underscore how infrastructural and spatial variables shape environmental participation outcomes in Costa Rica.
Figure 1.
Simulation-derived recycling outcomes across Costa Rica’s provinces. (a) National recycling rate progression across 50 simulated time steps. (b) Final recycling rate by province, highlighting regional disparities. (c) Relationship between accessibility to recycling facilities (Distance Score) and average recycling rate. All outputs were generated using a hybrid Agent-Based Model integrated with machine learning classifiers trained on synthetic behavior data. The viridis color palette emphasizes gradient differences across provinces and variables.
These findings reinforce the presence of spatial inequities in waste management infrastructure. Even with expanded facility deployment, many rural communities remain underserved—particularly in provinces with dispersed geographies. The contrast between high-access urban areas and infrastructure-poor rural zones highlights the need for more geographically targeted interventions. Without improving regional accessibility, national recycling goals may face persistent structural constraints. The behavioral implications of these accessibility gaps are explored further through simulation in the next section.
4.2. Recycling Rates by Province: Simulation Model Results
The simulation results using the agent-based model combined with machine learning revealed moderate differences in recycling rates across Costa Rica’s provinces. The highest recycling rate was observed in Alajuela (36.7%), followed closely by Heredia (34.0%) and Guanacaste (32.1%). These provinces likely benefit from a combination of urban infrastructure, improved accessibility, and population engagement in waste management practices.
San José, the most urbanized province, reported a recycling rate of 30.6%, slightly below the national simulation average. This outcome may be influenced by high waste generation volumes in densely populated areas, which could dilute the impact of available recycling programs. Similarly, Puntarenas and Limón both exhibited recycling rates of 30.4%, showing that coastal and tourist-heavy regions may have comparable levels of recycling participation, despite differing infrastructure conditions.
On the lower end of the spectrum, Cartago had the smallest recycling rate at 28.9%, highlighting ongoing issues with infrastructure and accessibility, especially in the province’s rural areas. Although the differences across provinces are not substantial, they still illustrate the significant impact of both spatial and structural factors on recycling behaviors.
Figure 2 provides an in-depth analysis of the final recycling rates, the amount of CO₂ avoided, and regional comparisons.
Figure 2.
Regional and Structural Influences on Recycling Behavior in the ABM + Machine Learning Model.
Figure 2.
Regional and Structural Influences on Recycling Behavior in the ABM + Machine Learning Model.
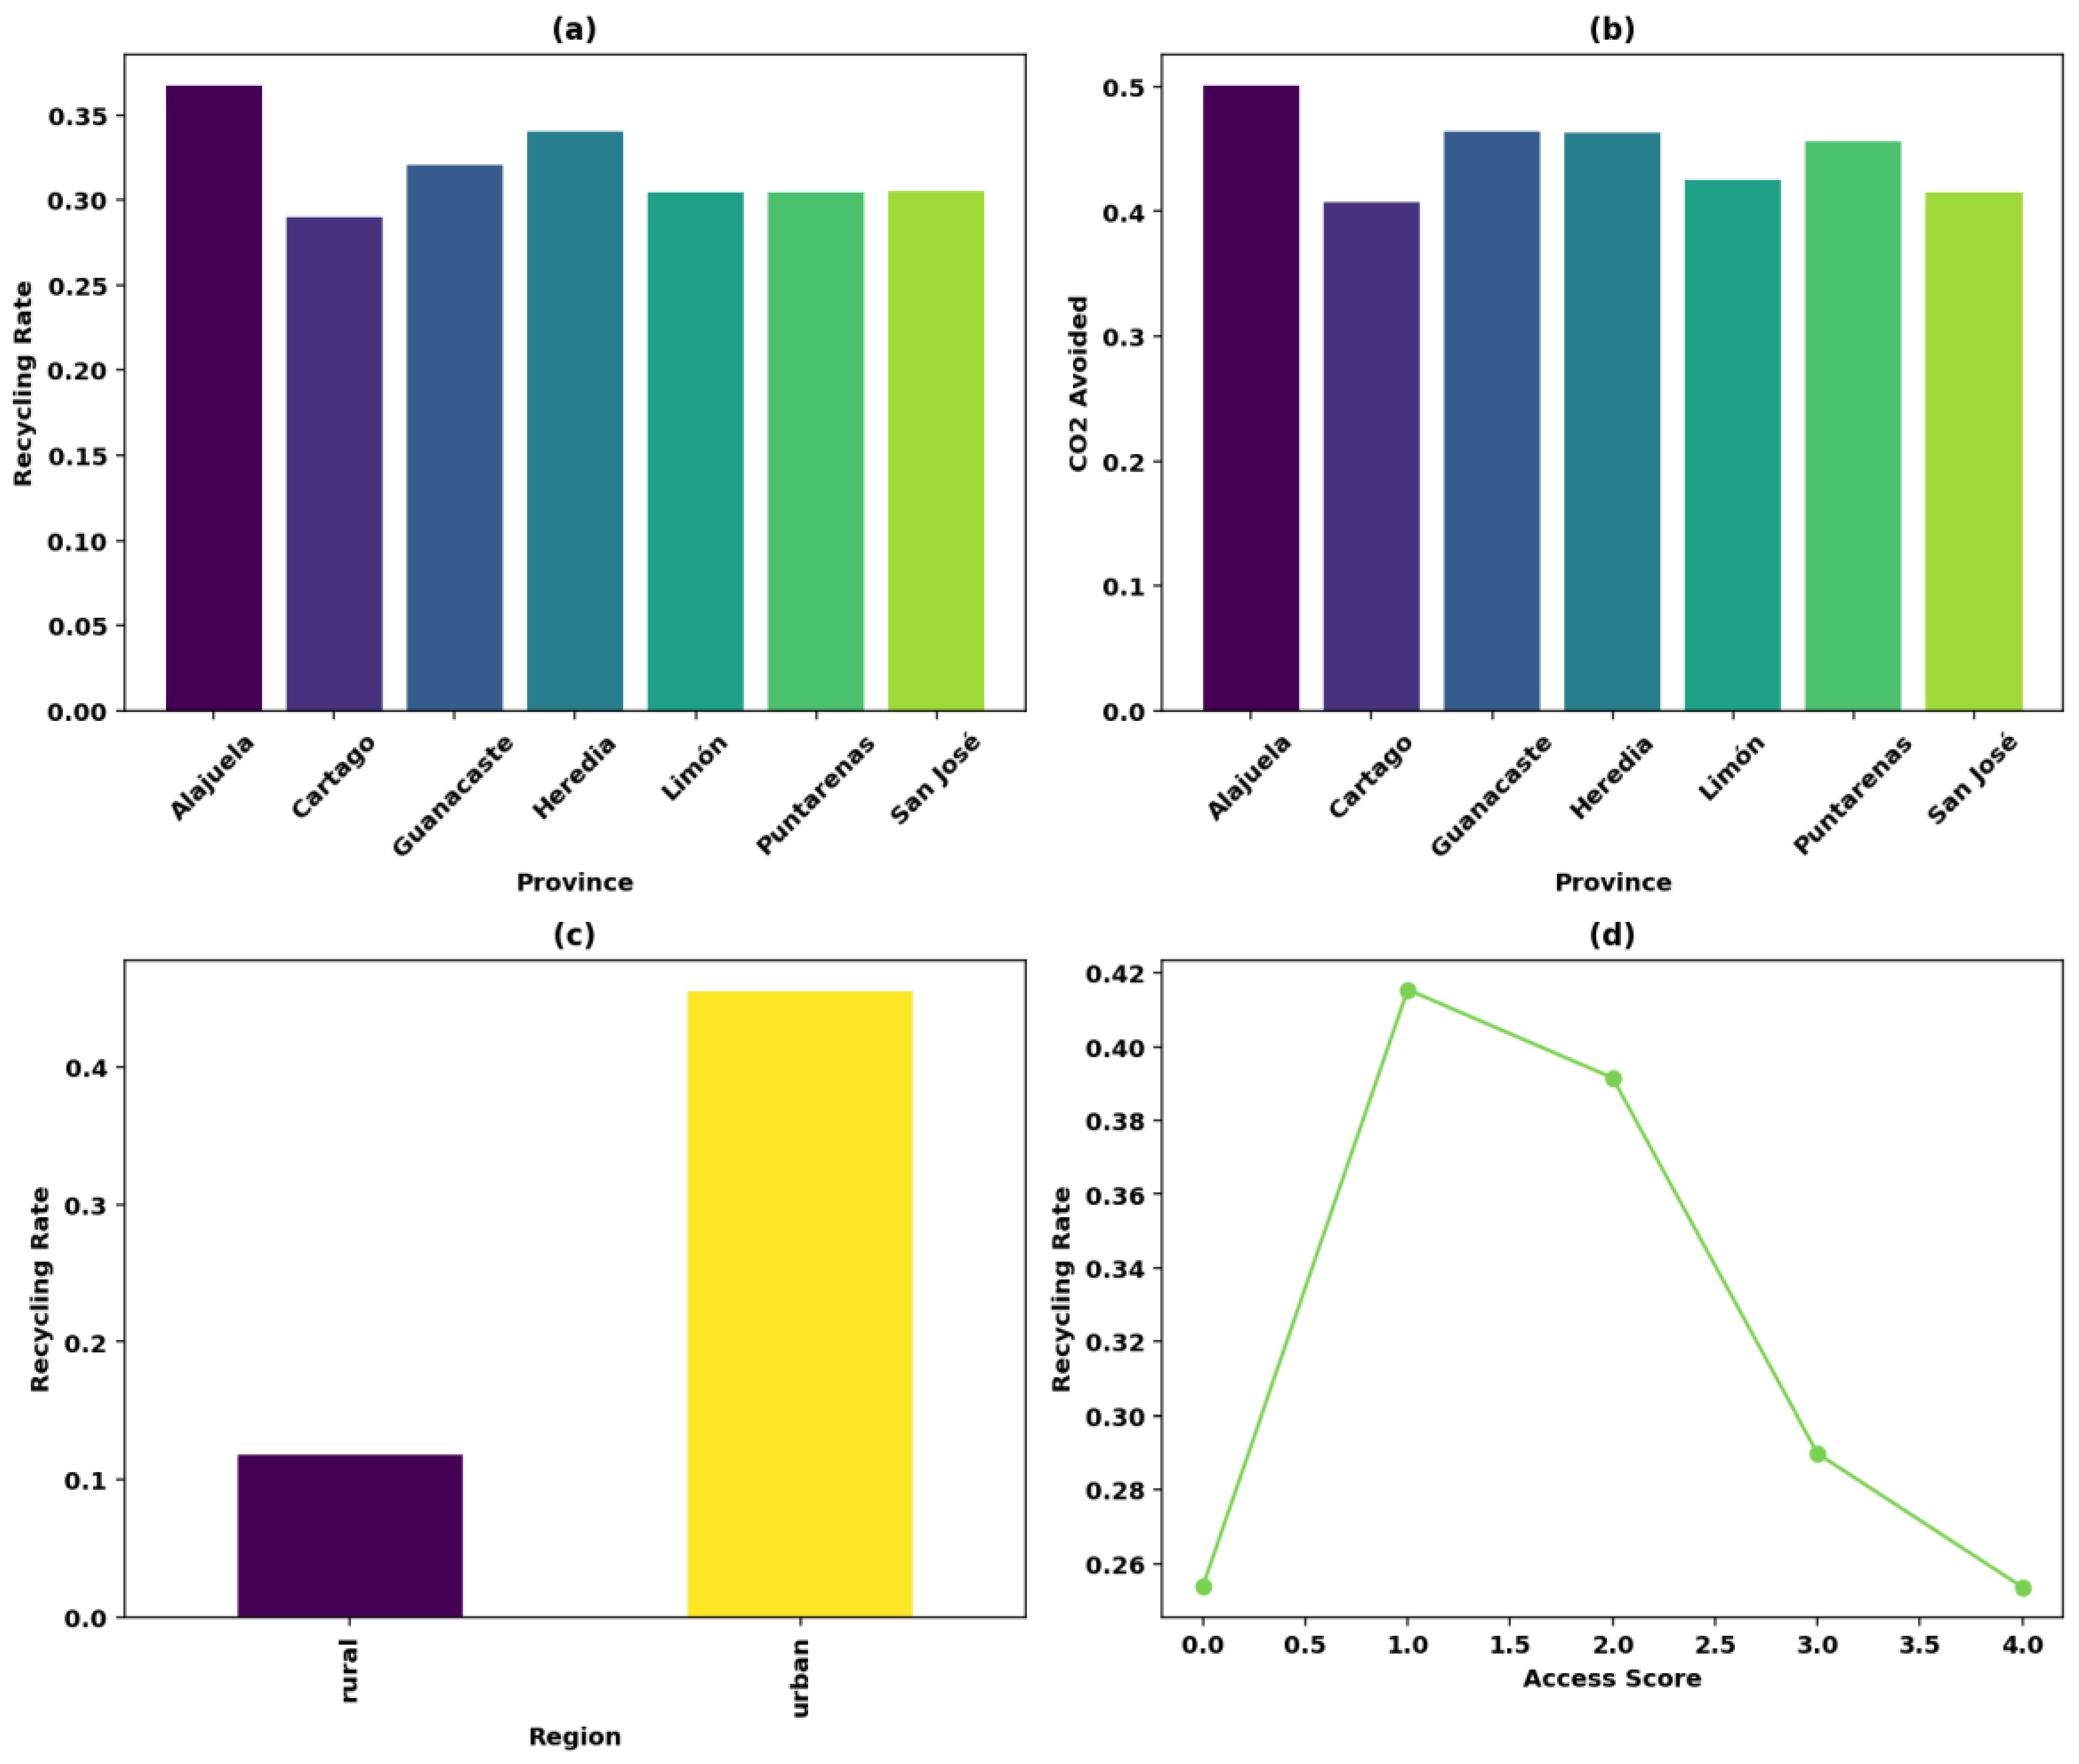
Caption:The figure summarizes recycling behavior and environmental outcomes based on the agent-based simulation incorporating machine learning predictions.(a) Final recycling rates by province show moderate variation, with provinces such as Alajuela and Heredia performing slightly above average, while Cartago records the lowest rate.(b) CO₂ emissions avoided through recycling efforts vary similarly across provinces, reflecting waste volumes and participation.(c) A marked difference is observed between urban and rural regions, with urban agents exhibiting significantly higher recycling rates.(d) Recycling rates decline as access to recycling facilities worsens, confirming the influence of spatial accessibility on participation.
Together, these findings suggest that while infrastructure and regional characteristics shape recycling patterns, behavioral adaptation modeled through learning mechanisms also plays a critical role in determining outcomes across Costa Rica’s provinces.
4.3. Recycling Behavior and Environmental Impact
The simulation results derived from the reinforcement learning (RL) model demonstrate a consistently high level of recycling behavior across Costa Rican provinces. The average recycling rate stabilized at 84.3% by the end of the simulation, indicating that agents learned to adopt recycling practices efficiently over time. This behavioral adjustment is driven by reinforcement mechanisms embedded in the model and suggests an evolution toward more sustainable waste management practices under the simulated conditions.
Agent-level data indicate that the recycling behavior was largely uniform across regions. Specifically, agents located in urban areas exhibited a recycling rate of 84.3%, while their rural counterparts achieved a nearly identical rate of 84.1%. These findings suggest that, within the current configuration of the model, regional context (urban versus rural) exerted a limited influence on recycling outcomes. Similarly, when examined at the provincial level, only minor variations were observed. Puntarenas recorded the highest recycling rate (85.6%), whereas Cartago registered the lowest (83.4%). These narrow differences imply that local infrastructure disparities, policy environments, or social norms—as represented in the model—did not translate into markedly divergent recycling behaviors between provinces.
Further analysis of accessibility revealed a somewhat counterintuitive result. Agents with poorer access to recycling infrastructure (represented by a higher access score) recycled more frequently than those with better access. For example, agents with an AccessScore of 4 recycled at an average rate of 87.4%, while those with the best accessibility (AccessScore 0) had a lower recycling rate of 73.7%. This inversion may be attributed to the dominance of reinforcement learning optimization in the model’s decision-making processes, which could have overridden accessibility as a key determinant of behavior. Nevertheless, the inclusion of accessibility as a spatial constraint remains an important structural feature of the simulation.
In terms of environmental outcomes, each agent generated approximately 1.78 kilograms of waste per day, consistent with empirical national values. Of this amount, approximately 84% was recycled. The model estimated an average avoidance of ~405 kg of CO₂-equivalent emissions per agent due to recycling activity. Additionally, plastic waste accounted for roughly 12% of the total waste stream, and biogas production from organic waste was modeled at 0.25 kWh per agent, reinforcing the broader sustainability benefits derived from recycling engagement.
These patterns are visually summarized in Figure 3, which presents recycling rates and environmental indicators by province, region, and access score. The figure illustrates the limited variation between geographic categories and highlights the dominance of behavioral adaptation in shaping sustainable waste outcomes.
Figure 3.
Recycling Behavior and Environmental Impact by Province, Region, and Access Score.
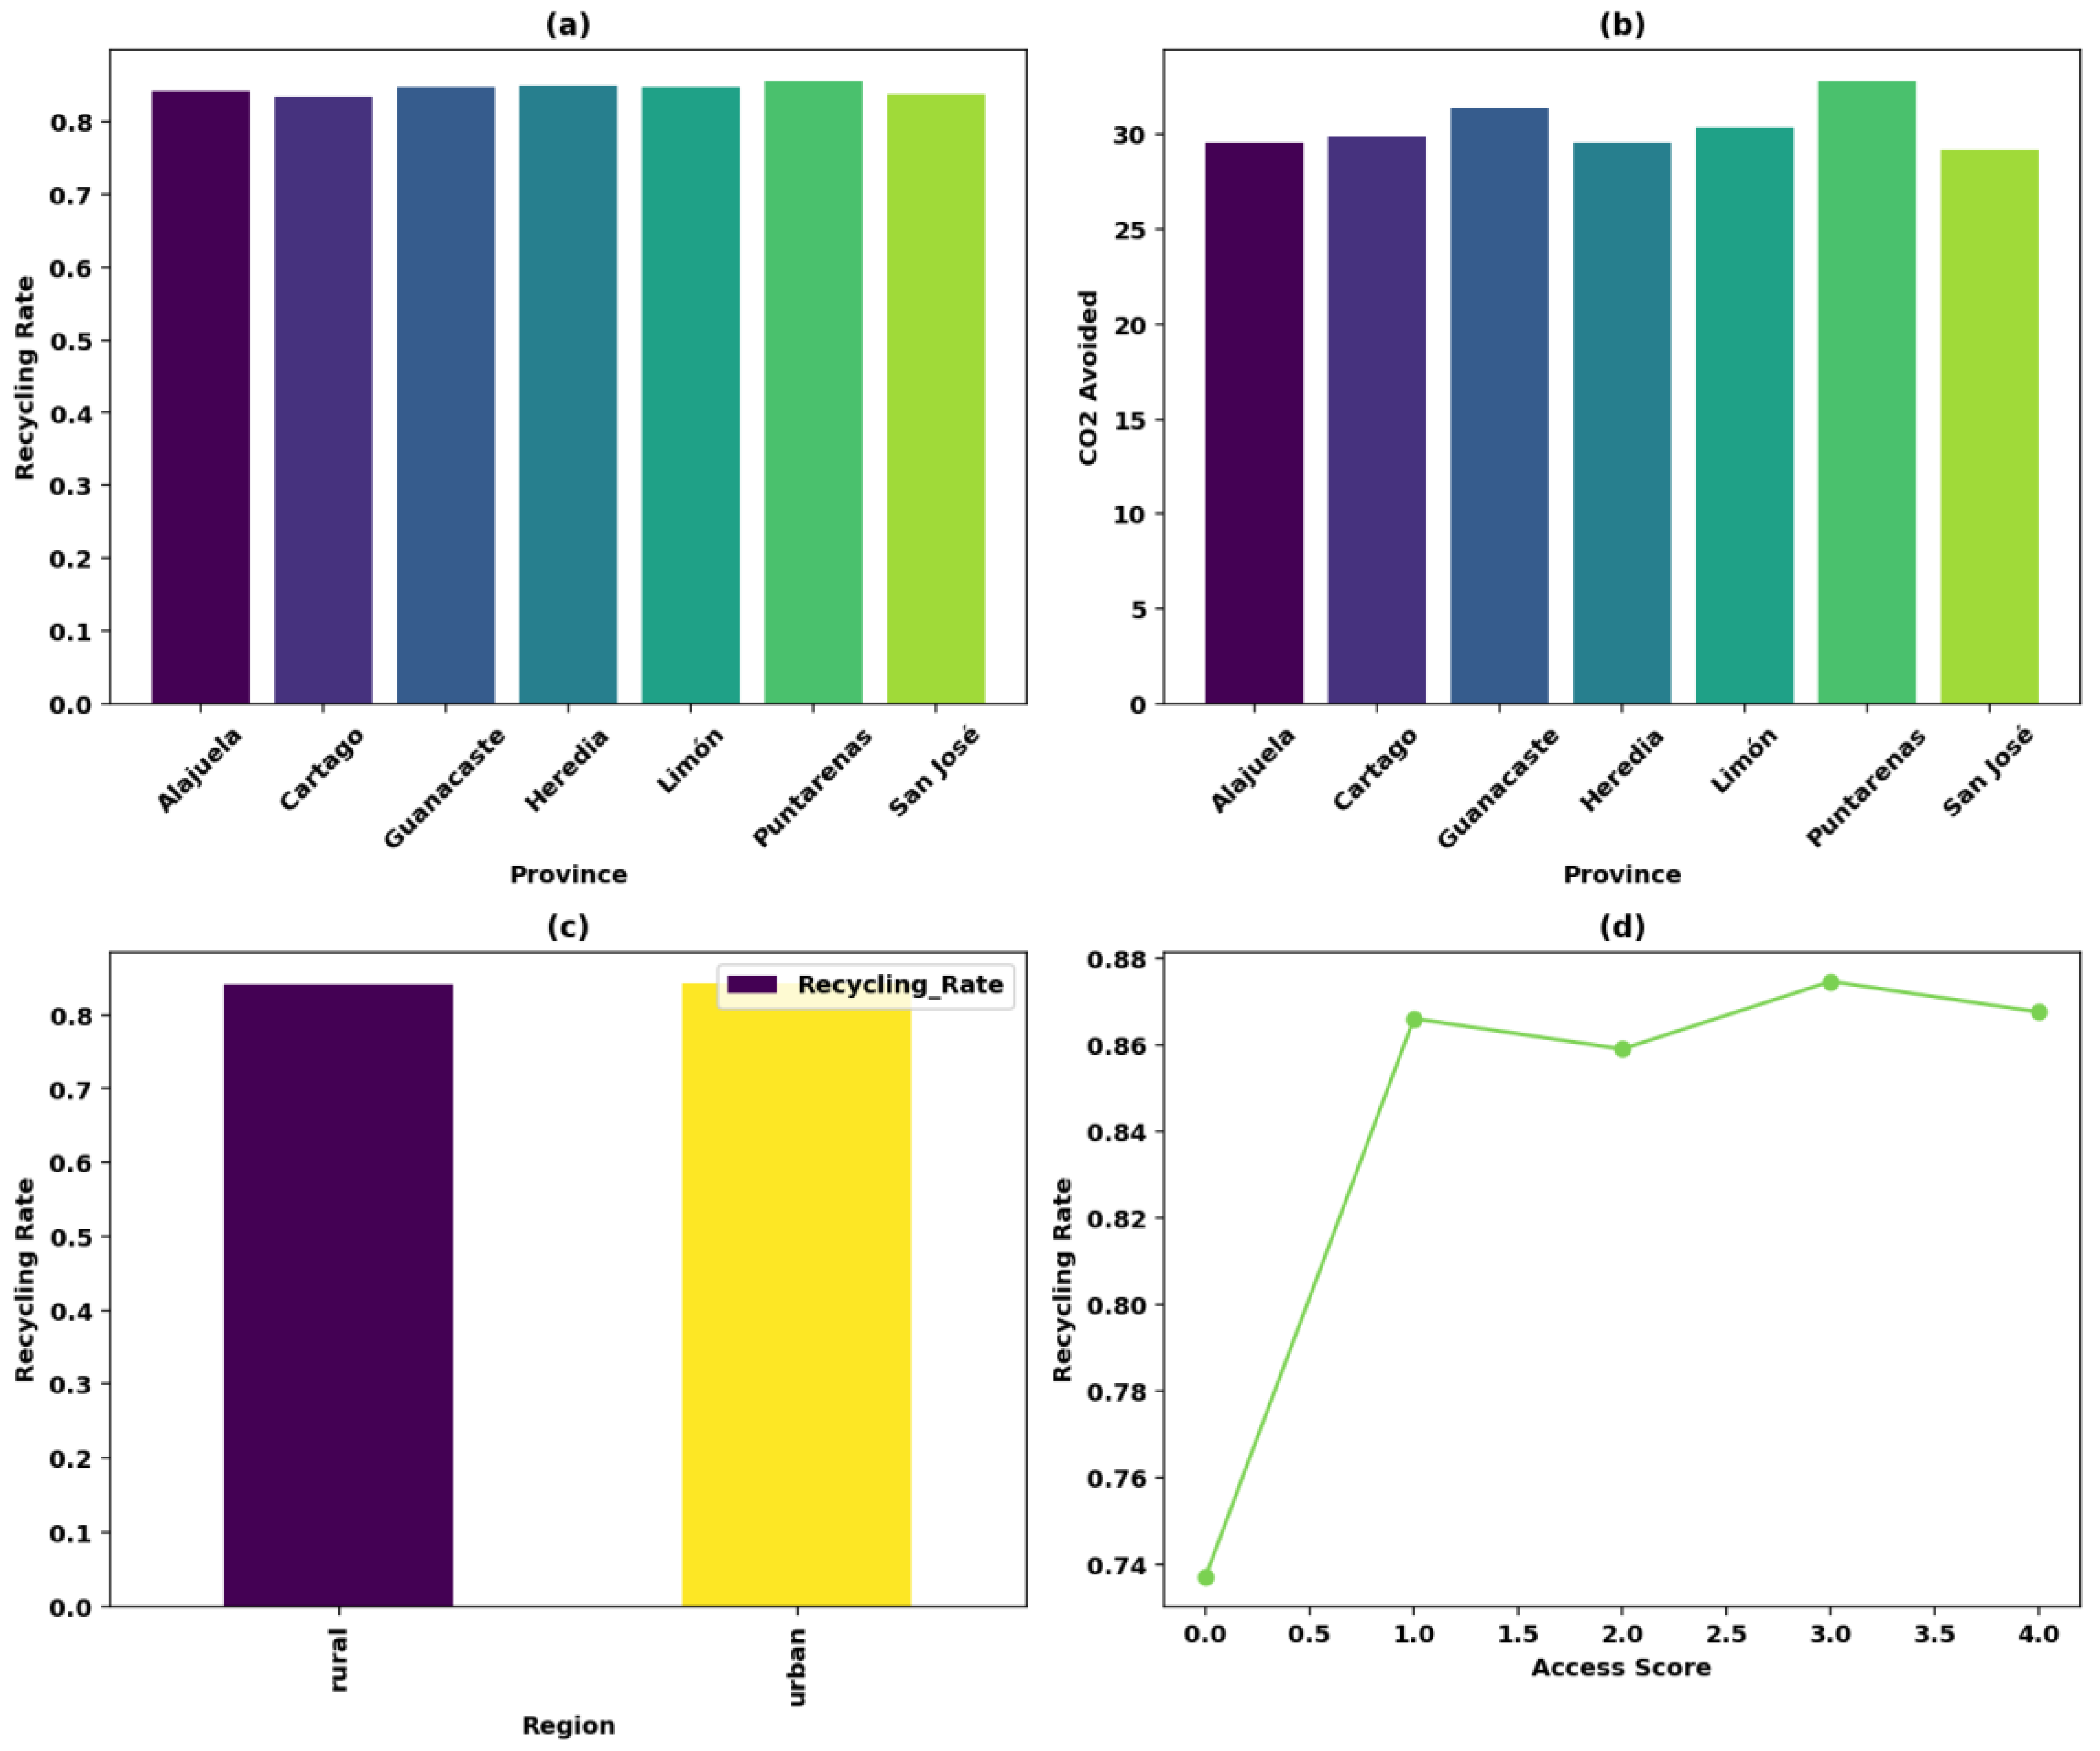
Caption:Subfigure (a) shows the final recycling rates across Costa Rica’s seven provinces, while (b) illustrates the corresponding CO₂ emissions avoided. Subfigure (c) compares recycling behavior between urban and rural regions, and (d) plots recycling rate as a function of access score (0 = best access; 4 = worst). Despite structural differences, behavioral convergence was observed across geographic contexts, suggesting the strength of adaptive learning under the simulated conditions.
In summary, the simulation results show that reinforcement learning (RL) significantly enhanced recycling behavior across Costa Rican provinces, achieving an average recycling rate of 84.3%. There were minimal differences between urban and rural areas, suggesting that RL can overcome spatial barriers. Interestingly, agents with poorer access to recycling infrastructure recycled more, likely due to the optimization of decision-making through RL. Environmental benefits were substantial, with approximately 405 kg of CO₂-equivalent emissions avoided per agent. These findings highlight the effectiveness of adaptive learning in promoting sustainable waste management practices, regardless of regional disparities.
4.4. Economic Comparison of the Agent-Based and Reinforcement Learning Strategies
The economic analysis revealed notable differences in performance between the agent-based and reinforcement learning (RL) strategies. Although the RL approach incurred a higher total operational cost (USD 11.38 million) compared to the agent-based method (USD 3.24 million), it processed and recycled significantly more waste, resulting in superior economic and environmental efficiency.
The RL strategy managed 88,884.25 tons of waste and recycled 76,431.07 tons, achieving a recycling efficiency of approximately 86%. In contrast, the agent-based strategy handled only 1,813.96 tons and recycled 592.08 tons, corresponding to a 33% recycling rate. Consequently, the RL approach avoided approximately 1.49 million kilograms of CO₂ emissions, compared to just 444.06 kilograms under the agent-based approach.
When normalized per ton of waste managed, the RL strategy achieved a unit cost of USD 128.05, significantly lower than the agent-based strategy’s USD 1,784.03. The cost per kilogram of CO₂ avoided was also dramatically lower under the RL approach (USD 7.62) than with the agent-based approach (USD 7,287.64), indicating substantially greater cost-effectiveness from an environmental perspective.
A breakdown of cost categories is shown in Figure 4, illustrating the distribution and intensity of expenditures across both strategies. While both strategies incur similar fixed costs for facility setup and labor, the RL strategy’s expenditures are proportionally higher in processing, transportation, and operations due to its larger operational scale.
Figure 4.
Cost breakdown comparison between the agent-based and reinforcement learning strategies.
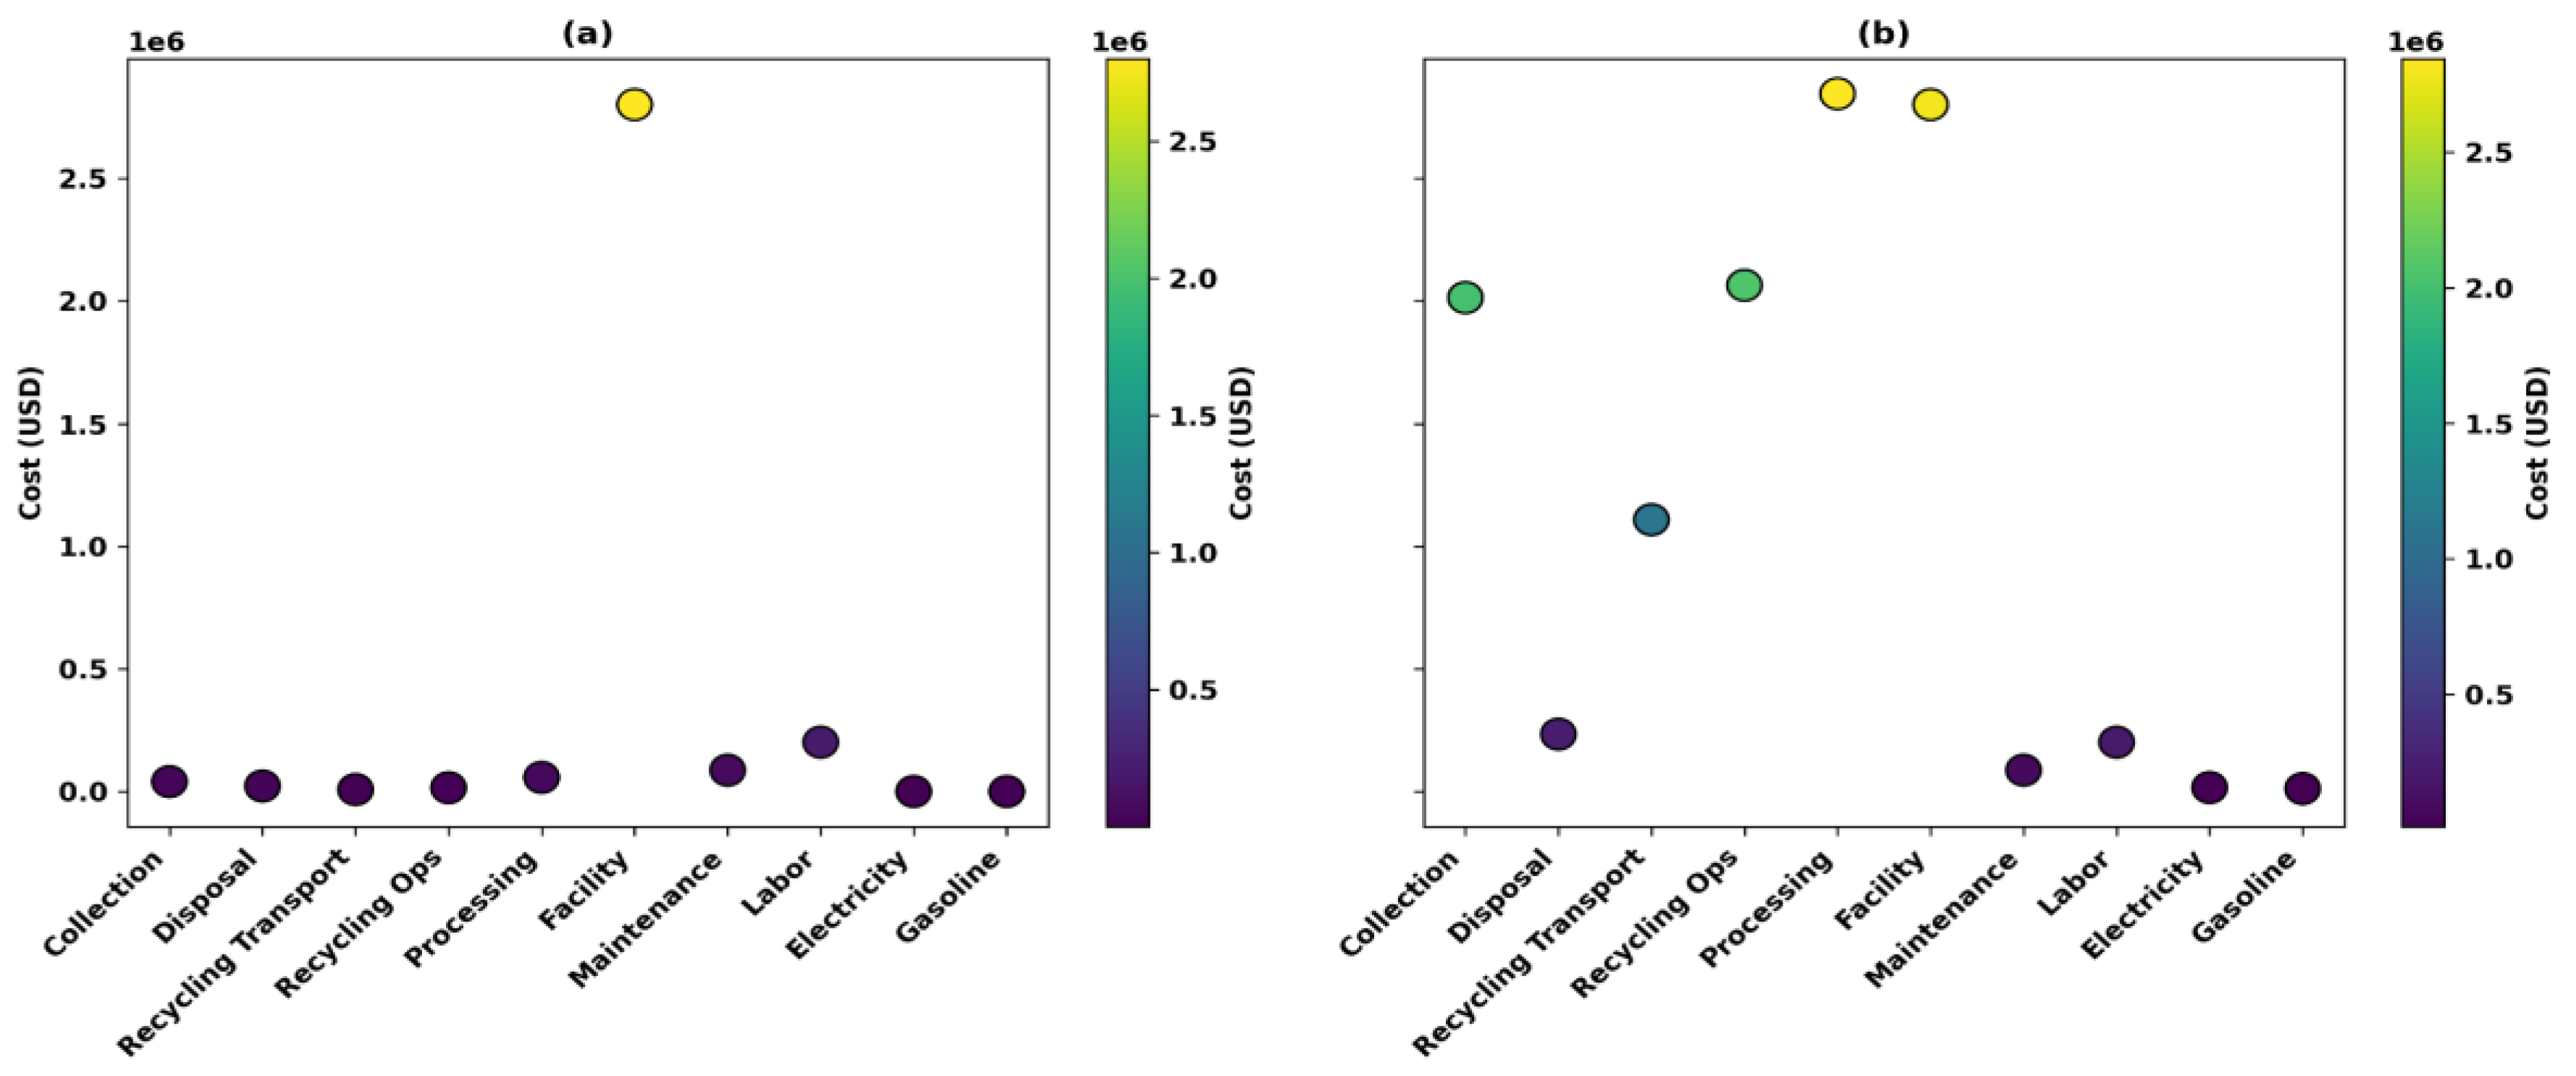
Caption:Subplot (a) shows the agent-based strategy, while subplot (b) corresponds to the reinforcement learning strategy. Each scatter point represents a cost category, with color intensity scaled to absolute cost (USD). The RL strategy shows higher costs across most categories due to its significantly larger waste handling capacity, yet maintains lower cost per unit of environmental impact.
These results suggest that although the RL-based strategy demands higher absolute investment, its superior waste recovery rates and environmental returns result in significantly improved cost efficiency. This reinforces the potential of intelligent decision systems for large-scale municipal waste optimization.
4.5. Sensitivity Analysis Results
To assess the robustness of the economic evaluation, a sensitivity analysis was conducted on the cost model by perturbing key input parameters ±10% and ±25% individually. The goal was to quantify how sensitive the total system cost is to changes in electricity, labor, and waste management expenses. Figure 5 presents the results of a two-way sensitivity analysis using contour plots, where each panel shows how the total cost changes when two parameters are varied simultaneously. Independent colorbars and labeled contour lines provide a clear representation of cost behavior across parameter ranges.
Figure 5.
Two-way sensitivity analysis of total system cost across key economic parameters.
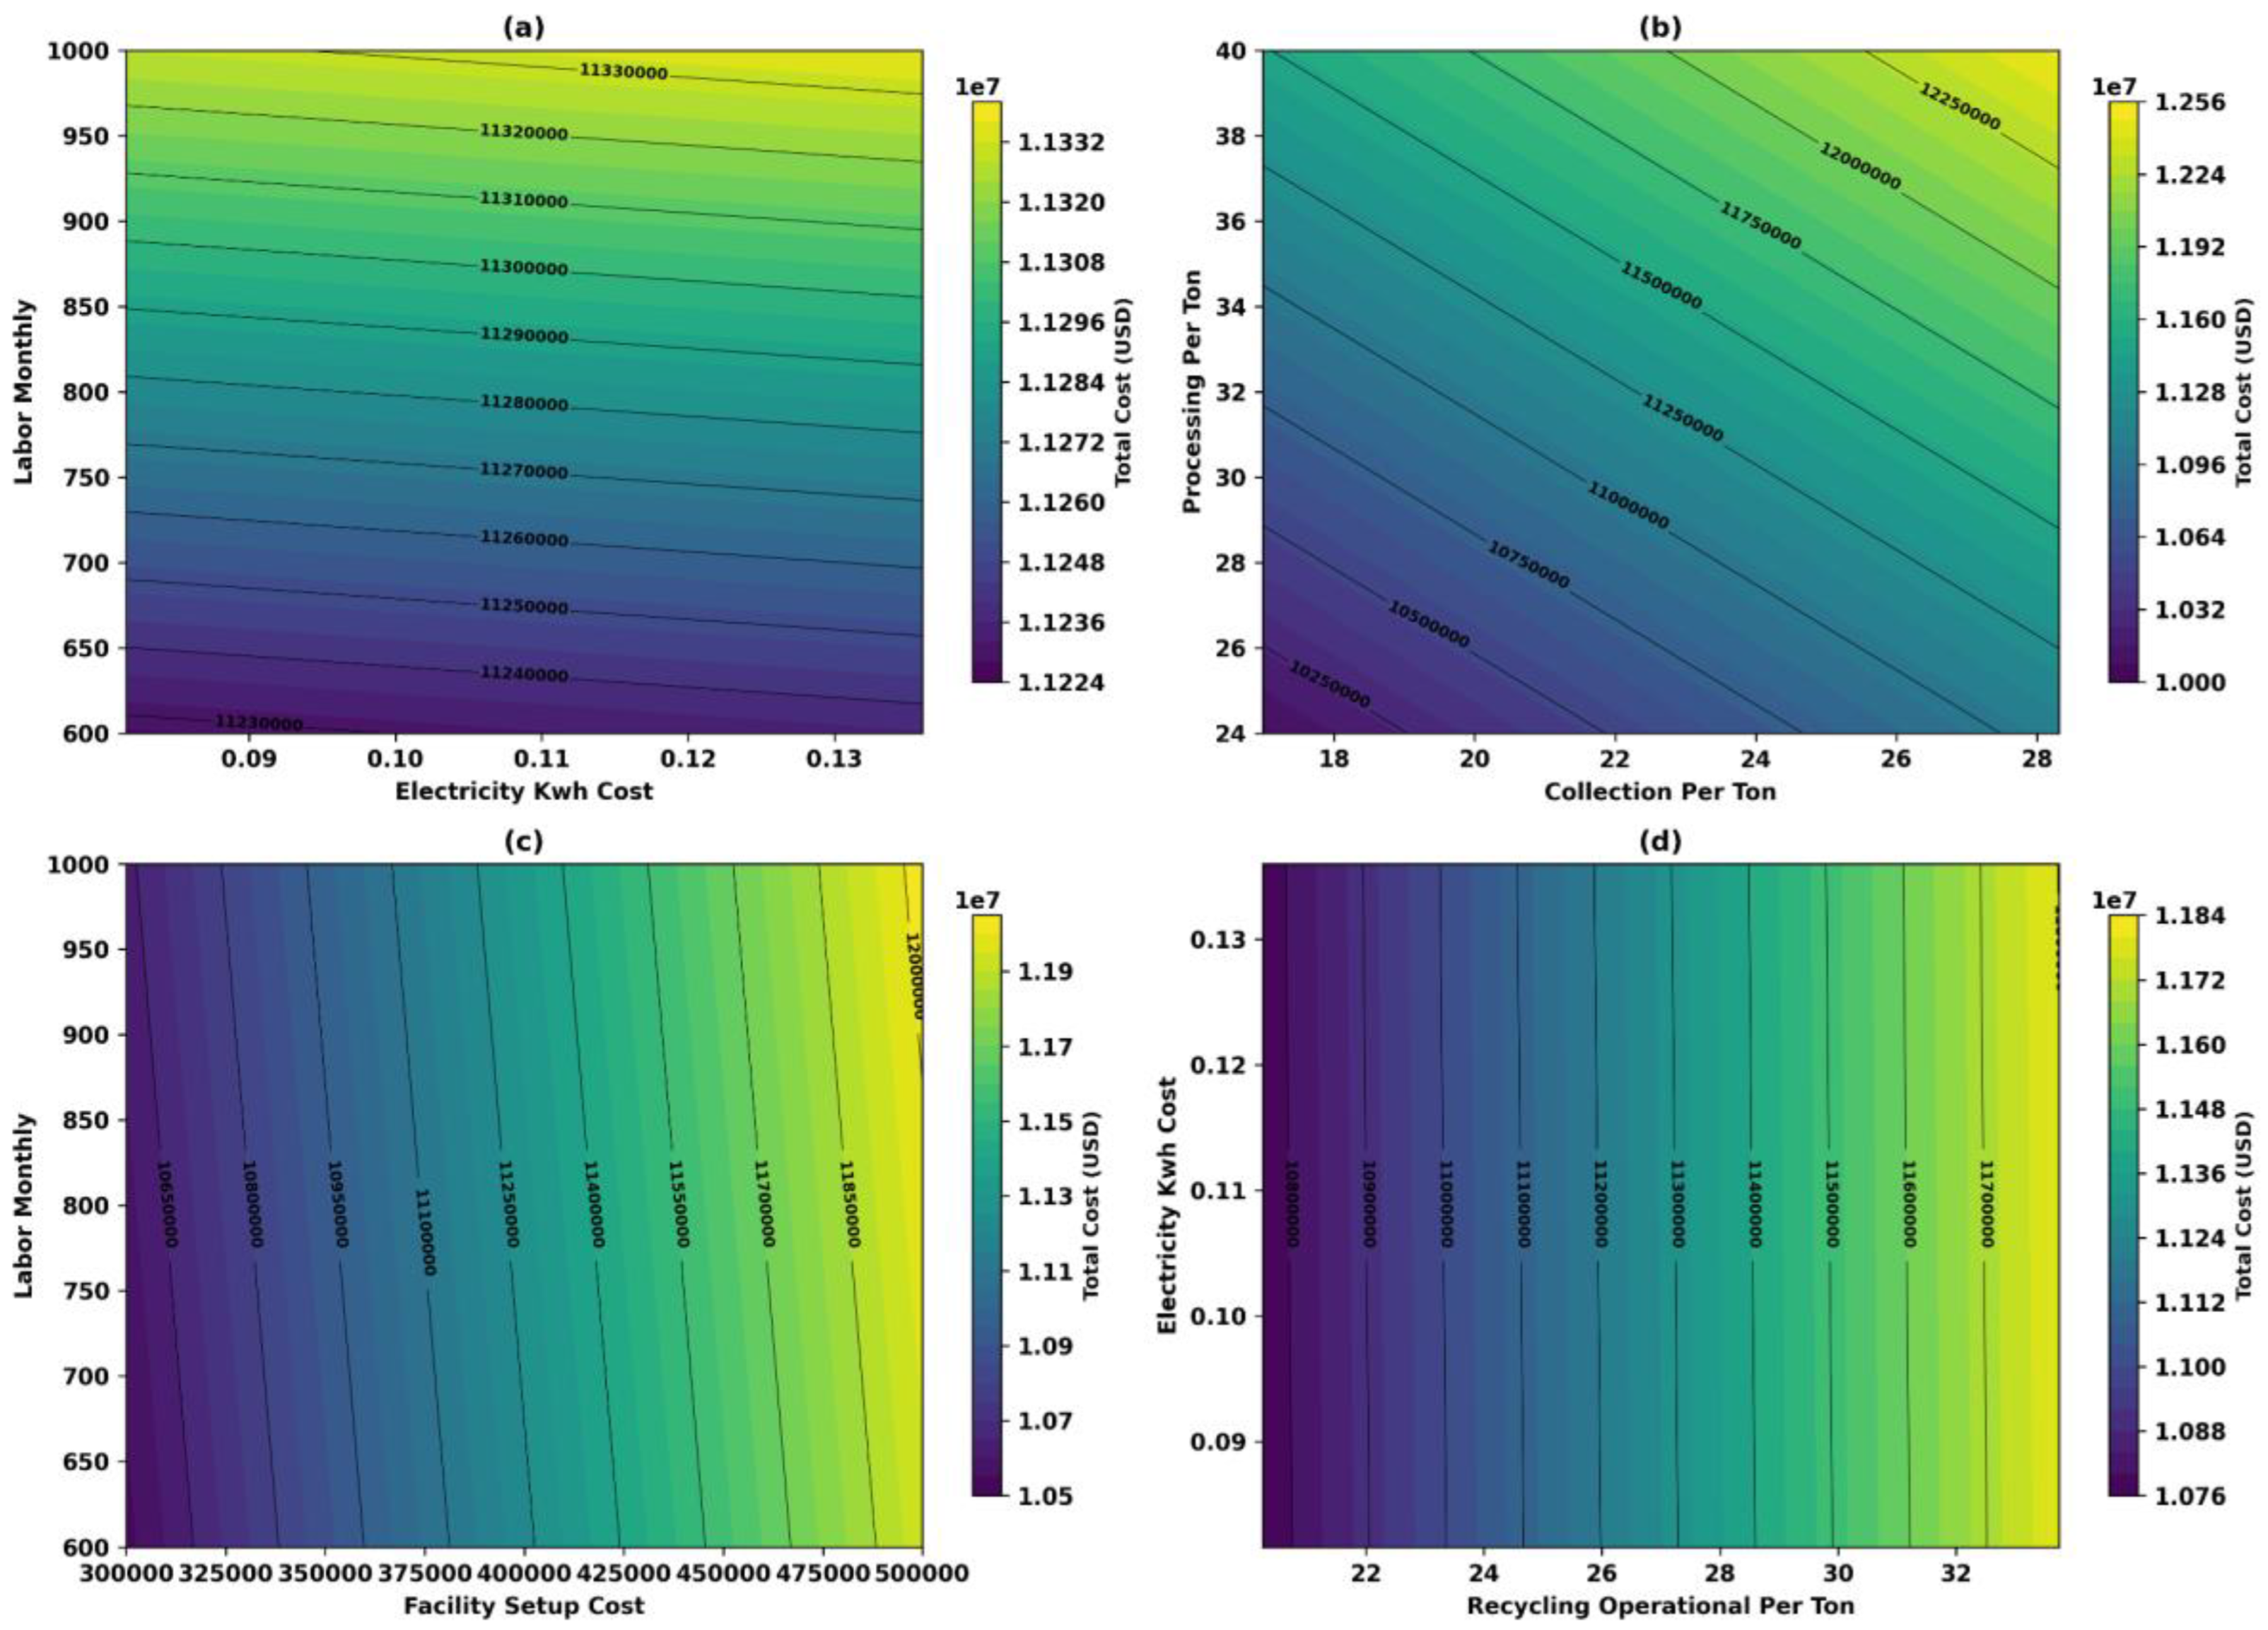
Caption:Subplots (a) through (d) illustrate how total cost varies when pairs of cost parameters are jointly perturbed by ±25%. Each panel shows a contour plot using the Viridis colormap, with darker regions representing lower costs and lighter regions indicating higher costs. The parameter pairs analyzed include: (a) electricity cost vs. labor wage, (b) collection cost vs. processing cost, (c) facility setup cost vs. labor wage, and (d) recycling operational cost vs. electricity cost. Cost values are labeled directly on contour lines, and each subplot features an independent colorbar scaled to its respective output range.
The one-way analysis revealed that processing cost per ton, facility setup cost, and recycling operational cost had the greatest impact on total system cost. For example, increasing the processing cost by 25% raised total cost from USD 11.28 million to USD 11.99 million, while a 25% increase in recycling operational cost raised it to USD 11.80 million. Increasing the facility setup cost from USD 400,000 to USD 500,000 increased total expenditure by over USD 700,000.
In contrast, the system was relatively insensitive to changes in electricity and labor rates. Modifying the electricity rate by ±25% affected total cost by less than 0.01%, and a 25% increase in labor costs led to under 1% variation. Notably, the recycling transport cost had no effect, as it remained fixed across scenarios.
Overall, the results confirm that while some operational costs have marginal impact, capital investment and processing efficiency are the most influential cost drivers in large-scale recycling systems.
6. Discussion
This study demonstrates that overlaying reinforcement learning on an agent-based household model can raise Costa Rica’s simulated recycling rate from 31% to 84% and cut the cost-per-ton managed from USD 1 784 to USD 128. These gains stem from adaptive reward structures that steer agents toward high-impact actions even when physical access is poor—a result that corroborates Khallaf et al. (2025) and extends their routing insights to household behaviour.
Spatial analysis confirms long-standing inequities: more than 18 000 households in Alajuela and 14 000 in Guanacaste still sit >50 km from the nearest facility despite proposed expansions. Similar distance effects depress participation in Cartago (28.9%), echoing Tian et al. (2025) on the primacy of proximity in recycling uptake. Yet in the RL scenario agents facing the poorest access recycled 87%, highlighting how value-based learning can partially neutralise structural barriers—though at the cost of realism, since real households incur transport time and fuel costs. Future work should embed distance-weighted penalties to temper this artefact.
The spatial model (Model 1) demonstrated that proximity strongly influences household access and behavioral engagement, especially when facilities are within a 0–10 km radius. Although proposed expansions improved access in some areas, more than 18,000 households in Alajuela remained over 50 km from the nearest facility—highlighting the persistent regional disparity. While geographic coverage showed improvement, the agent-based behavioral simulation (Model 2) revealed that access alone is insufficient; Cartago, for instance, maintained the lowest recycling rate at 28.9%, despite moderate improvements in infrastructure. These disparities underscore the role of behavioral adaptation and policy design.
The integration of reinforcement learning (Model 3) significantly enhanced behavioral convergence, increasing the national average recycling rate to 84.3%, with marginal differences between urban and rural agents. This suggests that adaptive feedback mechanisms can override fixed barriers such as distance, provided that policies and rewards are well structured. The impact of optimized decision-making is reflected in both environmental and economic metrics, as the RL-based model diverted over 76,000 tons of waste from landfills and avoided nearly 1.5 million kilograms of CO₂ emissions. These outcomes reinforce the findings of Elsheekh et al. (2021), who advocate for integrated systems as tools to meet the Sustainable Development Goals (SDGs) in developing nations.
From a cost-effectiveness perspective, the economic model (Model 4) revealed that while the RL strategy incurred higher total costs (USD 11.38 million), it was far more efficient per ton of waste managed (USD 128.05) and per kilogram of CO₂ avoided (USD 7.62), compared to the agent-based model. This aligns with the perspective of Esteves et al. (2024), who emphasize that higher capital investments in Latin American waste infrastructure can yield greater long-term social and environmental returns. The use of Monte Carlo simulations and cost disaggregation enabled the study to isolate key contributors to expenditure—most notably processing costs, facility setup, and operational expenses.
The sensitivity analysis (Model 5) reinforced this by showing that system costs are highly responsive to changes in processing, recycling operation, and setup costs, but relatively insensitive to labor and electricity rates. This insight is particularly relevant for policy prioritization, suggesting that cost optimization should focus on procurement strategies, facility design, and efficiency gains in material processing. As Giraldo-Almario et al. (2024) noted in similar urban waste contexts, optimal facility placement and efficient resource allocation are essential in reducing operational burdens while maintaining equity.
The findings also support the broader environmental and social goals of Costa Rica’s sustainability agenda. For example, targeted facility expansion and adaptive incentives could reduce landfill pressure by up to 15%, especially in accessible regions such as Alajuela and Heredia. Policy simulations within the model also suggest that performance-based incentives—such as Pay-As-You-Throw (PAYT) schemes—could enhance participation, echoing insights from Fontaine et al. (2024) and ICE (2022) regarding financial drivers in sustainable transitions.
Nonetheless, this study is not without limitations. Rural infrastructure data may be underrepresented, and while the ABM and RL models incorporate behavioral variability and learning, their outputs still rely on assumptions and synthetic training data that may not capture all socio-cultural dynamics. Future research should explore the incorporation of real-time data, community co-design mechanisms, and AI-driven sorting technologies, as proposed by Spirito (2024), to improve realism and engagement. Longitudinal studies would also enhance model calibration and policy evaluation over time.
In sum, this study presents a novel, integrated modeling approach that supports scalable, equitable, and cost-efficient waste management strategies. By bridging infrastructure, behavior, and economics, the research provides actionable insights to help Costa Rica meet its circular economy and SDG-aligned waste reduction goals.
These findings underscore the transformative potential of intelligent systems in waste governance. By demonstrating that data-driven models can pinpoint infrastructure gaps, simulate adaptive behaviors, and quantify cost–climate tradeoffs, this study moves beyond diagnostics toward actionable design. As Costa Rica and other nations advance toward circular economy goals, integrated computational approaches like this one can serve as critical enablers—helping turn policy ambition into scalable, equitable, and cost-effective practice.
7. Conclusion
This study presents the first integrated modeling framework in Costa Rica that combines geospatial simulation, agent-based modeling (ABM), reinforcement learning (RL), and cost analysis to evaluate and optimize household recycling behavior and infrastructure deployment. By simulating accessibility, behavioral adaptation, and cost-effectiveness, the research identifies critical spatial and systemic barriers limiting recycling participation—particularly in rural provinces such as Alajuela, Guanacaste, and Cartago.
Findings reveal stark disparities in physical access: over 18,000 households in Alajuela remain more than 50 km from any facility, even under proposed expansions. While urban centers like San José benefit from dense coverage, rural regions lag behind. These inequities correlate with lower recycling engagement in the ABM scenario, but the RL model demonstrates that well-structured, reward-based learning can drive behavioral convergence—raising national recycling rates to 84% and reducing the cost-per-ton of waste managed by over 90%.
The economic simulation confirms that although RL strategies require higher absolute investment, their unit efficiency in waste recovery and carbon abatement is significantly superior. Processing costs, facility setup, and operations are the most influential cost drivers, highlighting key levers for policy and planning. Additionally, incentive-based policies such as Pay-As-You-Throw (PAYT), and mobile recovery solutions show promise for improving rural uptake and bridging the infrastructure gap.
This research underscores the value of computational tools in supporting data-informed, equity-focused, and SDG-aligned waste management. By integrating behavioral dynamics with real-world spatial and economic constraints, the model provides a decision-support system for targeting infrastructure investments, designing scalable interventions, and evaluating climate-mitigation co-benefits.
Future work should incorporate real-time behavioral data, community engagement feedback, and advanced sorting technologies to improve model fidelity. As Costa Rica advances toward its circular economy goals, intelligent, adaptable modeling approaches like this can guide national policy from broad ambitions to actionable implementation.
Author Contributions
developed the research idea, designed the study, gathered and analyzed the data, and prepared the manuscript.
Data Availability Statement
The dataset supporting the findings of this study, including the Python scripts and supplementary materials, is openly available in Mendeley Data under the title: XXXXX.
Ethics Statement
This study did not involve any research on human subjects, human data, human tissue, or animals. Therefore, no ethical approval was required.
Conflicts of Interest Declaration
The author confirms that no conflicts of interest are associated with the publication of this manuscript.
Funding Declaration
This study did not receive any particular funding from governmental, corporate, or charitable sources.
Declaration of Generative AI and AI-assisted Technologies in the Writing Process
During the preparation of this work, the author(s) used ChatGPT in order to improve grammar and readability.
References
- Ashraf, A. I., Mohareb, E., Vahdati, M., & Abbas, F. (2025). Environmental life-cycle assessments of decentralized municipal solid waste management: A novel waste-to-compost approach. Discover Sustainability, 6, 138. [CrossRef]
- Arias. (2024). Challenges and opportunities in waste management: Perspectives from Costa Rica for the world recycling day. Arias Knowledge Center. Retrieved from https://ariasknowledgecenter.com.
- Baltodano-Goulding, R., & Poveda-Montoya, A. (2023). Unsaturated seepage analysis for an ordinary solid waste sanitary landfill in Costa Rica. E3S Web of Conferences. [CrossRef]
- Banco Interamericano de Desarrollo. (2021). Solid waste management in Latin America and the Caribbean. Retrieved from https://publications.iadb.org.
- Becerra, E. (2021, March 18). Waste management ‘one of biggest environmental problems,’ Costa Rica says. The Tico Times. Retrieved from https://ticotimes.net/2021/03/18/waste-management-one-of-biggest-environmental-problems-costa-rica-says.
- Bravo, L. M. R., Cosio Borda, R. F., Quispe, L. A. M., Rodríguez, J. A. P., Ober, J., & Khan, N. A. (2024). The role of internet and social interactions in advancing waste sorting behaviors in rural communities. Resources, 13(4), 57. [CrossRef]
- Campos Rodríguez, R., & Soto Córdoba, S. M. (2014). Estudio de generación y composición de residuos sólidos en el cantón de Guácimo, Costa Rica. Tecnología en Marcha, 27. https://https://www.scielo.sa.cr/.
- Chaves Brenes, K. (2024, February 14). San José: ecoins – promoting the circular economy and decarbonisation through public-private partnerships. International Institute for Environment and Development. Retrieved from https://www.iied.org/san-jose-ecoins-promoting-circular-economy-decarbonisation-through-public-private-partnerships.
- Cohen, J., Gil, J., & Rosado, L. (2025). Exploring urban scenarios of individual residential waste sorting using a spatially explicit agent-based model. Waste Management, 193, 350–362. [CrossRef]
- Dawar, I., Srivastava, A., Singal, M., Dhyani, N., & Rastogi, S. (2025). A systematic literature review on municipal solid waste management using machine learning and deep learning. Artificial Intelligence Review, 58, Article 11196. [CrossRef]
- Elsheekh, K. M., Kamel, R. R., Elsherif, D. M., & Shalaby, A. M. (2021). Achieving sustainable development goals from the perspective of solid waste management plans. Journal of Engineering and Applied Science, 68(5). [CrossRef]
- Espinosa-Aquino, B., Gabarrell Durany, X., & Quirós Vargas, R. (2023). The role of informal waste management in urban metabolism: A review of eight Latin American countries. Sustainability, 15(1826). [CrossRef]
- Estado de la Nación. (2010). Data on CO₂ emissions from Costa Rican landfills. https://https://estadonacion.or.cr/.
- European Environment Agency. (2023). Waste recycling in Europe. Retrieved from https://www.eea.europa.eu/en/analysis/indicators/waste-recycling-in-europe.
- Federal Ministry for the Environment, Nature Conservation, Nuclear Safety, and Consumer Protection (BMUV). (2023). Waste management in Germany 2023: Facts, data, figures. Retrieved from BMUV website. https://www.bmuv.de/.
- Fernandez, I. (2024, July 17). Costa Rica on the brink of a garbage crisis. The Tico Times. https://ticotimes.net/2024/07/17/costa-rica-on-the-brink-of-a-garbage-crisis.
- Ferronato, N., Torretta, V., Gullo, S., & Chiavola, A. (2024). Challenges and perspectives of waste management and circular economy in developing countries. Sustainable Cities and Society, 67, 105919. [CrossRef]
- Fontaine, M., Wang, C., & Boulanger, P. (2024). Sustainability and environmental performance in selective collection of residual materials: Impact of modulating citizen participation through policy and incentive implementation. Resources, 13, 151. [CrossRef]
- Gamal, Y., Heppenstall, A., Strachan, W., Colasanti, R., & Zia, K. (2025). An analysis of spatial and temporal uncertainty propagation in agent-based models. Philosophical Transactions of the Royal Society A, 383(2293), 20240229. [CrossRef]
- Gerden, E. (2024). Brazil’s recycling best is yet to come. Retrieved from https://recyclinginternational.com/latest-articles/brazils-recycling-best-is-yet-to-come/57145/.
- Giraldo-Almario, I., Rueda-Saa, G., & Uribe-Ceballos, J. R. (2024). Wasteaware adaptation to the context of a Latin American country: Evaluation of the municipal solid waste management in Cali, Colombia. Journal of Material Cycles and Waste Management, 26(3), 908–922. [CrossRef]
- GlobalPetrolPrices.com. (2024). Costa Rica Precios de la gasolina. Retrieved from https://es.globalpetrolprices.com/Costa-Rica/gasoline_prices/.
- Gómez, C. C. (2023). Circular economy plastic policies in Costa Rica: A critical policy analysis. Circular Innovation Lab. ISBN 978-87-94507-05-9.
- Graham, C. C. (2024a). The role of Geographic Information Systems in mitigating plastics pollution in the Global South—A spatial analysis of recycling facilities in Costa Rica. Science of the Total Environment, 937, 173396. [CrossRef]
- Graham, H. (2024b). GIS-based approaches in managing plastic pollution: A case study of the Global South. Journal of Environmental Mapping and Assessment, 21(2), 113–130. [CrossRef]
- Herrera-Murillo, J., Rojas-Marín, J. F., & Anchía-Leitón, D. (2016). Tasas de generación y caracterización de residuos sólidos ordinarios en cuatro municipios del Área Metropolitana Costa Rica. [CrossRef]
- Hidalgo Arroyo, I. (2021, July 2). Ahora podrá adquirir ecoins cada vez que deposite residuos ordinarios de forma correcta. Delfino CR. https://delfino.cr.
- Holland Circular Hotspot. (2021). Waste Management Country Report: Costa Rica. Retrieved from https://hollandcircularhotspot.nl/wp-content/uploads/2021/04/Report_Waste_Management_Costa_Rica_20210329.pdf.
- Ibrahim, S., Mostafa, M., Jnadi, A., & Osinenko, P. (2024). Comprehensive overview of reward engineering and shaping in advancing reinforcement learning applications. arXiv (cs.LG), 2408.10215. https://arxiv.org/abs/2408.10215.
- Instituto Costarricense de Electricidad (ICE). (2022). Biogas Project. https://www.grupoice.com/.
- Instituto Costarricense de Electricidad. (2024). Tarifas enero 2024: Alcance N°257 Gaceta N°237. Retrieved from https://www.tarifas.cr.
- Instituto Nacional de Estadística y Censos. (2022). Estimación de población y vivienda: Provincias de Costa Rica. INEC. Retrieved from https://inec.cr.
- Javed, M. W., Saleem, F., Aslam, F., & Ullah, K. (2024). Urban-rural sustainability challenges and infrastructure disparities in developing countries: Policy perspectives for inclusive growth. Journal of Environmental Management, 317, 115721. [CrossRef]
- Khallaf, N., Abd-El Rouf, O., Algarni, A. D., Hadhoud, M., & Kafafy, A. (2025). Enhanced vehicle routing for medical waste management via hybrid deep reinforcement learning and optimisation algorithms. Frontiers in Artificial Intelligence, 8, 1496653. [CrossRef]
- Klein, C. (2024). Recycling rate of waste Japan FY 2013-2022. Statista. Retrieved from https://www.statista.com/statistics/1127509/japan-recycling-rate-waste/.
- Kwon, Y., Lee, S., Bae, J., Park, S., Moon, H., Lee, T., Kim, K., Kang, J., & Jeon, T. (2024). Evaluation of incinerator performance and policy framework for effective waste management and energy recovery: A case study of South Korea. Sustainability, 16(1), 448. [CrossRef]
- Landgeist. (2024). Germany: Recycling Rate. Retrieved from https://landgeist.com/2024/04/06/recycling-rate/.
- Le Page, C., Becu, N., Bommel, P., & Bousquet, F. (2013). Agent-based modeling and simulation applied to environmental management. Agricultural Systems, 116, 10–15. [CrossRef]
- Li, F. (2025, January 31). El manejo óptimo de la basura entre municipalidades, cooperativas y asociaciones de desarrollo: Caso Costa Rica. La República. https://www.larepublica.net/noticia/el-manejo-optimo-de-la-basura-entre-municipalidades-cooperativas-y-asociaciones-de-desarrollo-caso-costa-rica.
- Lino, F. A. M., Ismail, K. A. R., & Castañeda-Ayarza, J. A. (2023). Municipal solid waste treatment in Brazil: A comprehensive review. Energy Nexus, 11, 100232. [CrossRef]
- Messina, G., Tiezzi, E., Marchettini, N., & Bastianoni, S. (2023). ‘Pay as you own’ or ‘pay as you throw’? A counterfactual evaluation of alternative financing schemes for waste services. Ecological Economics, 207, 107701. [CrossRef]
- Miller, H. J., & Shaw, S. (2001). Geographic information systems for transportation: Principles and applications. Oxford University Press.
- Ministerio de Ambiente y Energía, Costa Rica. (2023). Estrategias sostenibles de gestión de residuos. Gobierno de Costa Rica. https://www.ministeriodesalud.go.cr/index.php/prensa/43-noticias-2021/866-gobierno-presenta-plan-de-accion-para-la-gestion-integral-de-residuos.
- Ministerio de Salud de Costa Rica. (2021). Report waste management Costa Rica. Retrieved from https://www.wastemanagementcostarica.cr.
- Ministerio de Salud de Costa Rica. (2022). Política Nacional de Gestión Integral de Residuos 2022–2032: Línea base para la gestión integral de residuos. Retrieved from https://www.ministeriodesalud.go.cr/.
- Ministerio de Salud de Costa Rica. (2023). Informe Anual de Gestión Ambiental 2023. Retrieved from https://www.ministeriodesalud.go.cr/index.php/informes-de-gestion.
- OECD. (2023). OECD Environmental Performance Reviews: Costa Rica 2023. OECD Publishing. [CrossRef]
- Pendyala, A., Atamna, A., & Glasmachers, T. (2024). Solving a real-world optimisation problem using Proximal Policy Optimisation with curriculum learning and reward engineering [Preprint]. arXiv. [CrossRef]
- Procuraduría de la República de Costa Rica. (2019). Ley para Combatir la Contaminación por Plástico y Proteger el Ambiente, N° 9786. Sistema Costarricense de Información Jurídica. http://www.pgrweb.go.cr/scij/Busqueda/Normativa/Normas/nrm_texto_completo.aspx?nValor1=1&nValor2=90187.
- Quesada Cordero, M. (2024, April 8). How many Costa Ricans participate in recycling? El Colectivo 506. https://elcolectivo506.com.
- Recycling Partnership. (2024). State of Residential Recycling in the U.S. Retrieved from the uploaded document. https://recyclingpartnership.org.
- Rodríguez, V. (2025, March 20). La crisis de los residuos: no es quién o dónde, sino cuánto. Delfino.CR. https://delfino.cr/2025/03/la-crisis-de-los-residuos-no-es-quien-o-donde-sino-cuanto.
- Rojas Robles, E. R. (2025, April 1). La disposición de residuos en la GAM: una crisis inminente y la urgencia de soluciones responsables. Delfino.CR. https://delfino.cr/2025/04/la-disposicion-de-residuos-en-la-gam-una-crisis-inminente-y-la-urgencia-de-soluciones-responsables.
- Sandhi, A., & Rosenlund, J. (2024). Municipal solid waste management in Scandinavia and key factors for improved waste segregation: A review. Cleaner Waste Systems, 8, 100144. [CrossRef]
- Sert, E., Bar-Yam, Y., & Morales, A. J. (2020). Segregation dynamics with reinforcement learning and agent-based modeling. Scientific Reports, 10(1), 11771. [CrossRef]
- Seoul Metropolitan Government. (2023). Seoul to increase recycling rate to 79% by 2026. Retrieved from https://english.seoul.go.kr/seoul-to-increase-recycling-rate-to-79-by-2026/.
- Spirito, C. (2024). Artificial intelligence applications in reverse logistics: How technology could improve return and waste management creating value (Master’s thesis, Politecnico di Torino). https://webthesis.biblio.polito.it/.
- Swedish Environmental Protection Agency. (2024). Swedish recycling and beyond. Retrieved from https://sweden.se/climate/sustainability/swedish-recycling-and-beyond.
- Tian, X., Peng, F., Wei, G., & Xiao, C. (2025). Agent-based modeling in solid waste management: Advantages, progress, challenges and prospects. Environmental Impact Assessment Review, 110, 107723. [CrossRef]
- Tico Times. (2024, November 1). ICE unveils biogas plan to combat Costa Rica’s growing waste management crisis. The Tico Times. https://ticotimes.net/2024/11/01/ice-unveils-biogas-plan-to-combat-costa-ricas-growing-waste-management-crisis.
- United Nations. (2023). Transforming our world: The 2030 agenda for sustainable development. Retrieved from https://sustainabledevelopment.un.org/post2015/transformingourworld.
- U.S. Environmental Protection Agency. (2024). Emission factors for greenhouse gas inventories (Table 9). EPA Center for Corporate Climate Leadership. https://www.epa.gov/system/files/documents/2024-02/ghg-emission-factors-hub-2024.pdf.
- Vega, L. P., Bautista, K. T., Campos, H., Daza, S., & Vargas, G. (2024). Biofuel production in Latin America: A review for Argentina, Brazil, Mexico, Chile, Costa Rica, and Colombia. Energy Reports, 11, 28–38. [CrossRef]
- World Intellectual Property Organization. (2024). Global Innovation Index 2024: Unlocking the Promise of Social Entrepreneurship. Geneva: WIPO. [CrossRef]
Disclaimer/Publisher’s Note: The statements, opinions and data contained in all publications are solely those of the individual author(s) and contributor(s) and not of MDPI and/or the editor(s). MDPI and/or the editor(s) disclaim responsibility for any injury to people or property resulting from any ideas, methods, instructions or products referred to in the content. |
© 2025 by the authors. Licensee MDPI, Basel, Switzerland. This article is an open access article distributed under the terms and conditions of the Creative Commons Attribution (CC BY) license (http://creativecommons.org/licenses/by/4.0/).
Copyright: This open access article is published under a Creative Commons CC BY 4.0 license, which permit the free download, distribution, and reuse, provided that the author and preprint are cited in any reuse.


