
Submitted:
11 June 2025
Posted:
12 June 2025
You are already at the latest version
Abstract
The rapid proliferation of electronic waste, driven by the short lifecycle of smartphones and planned obsolescence strategies, presents escalating global environmental challenges. To address these issues from a systems perspective, this study develops an agent-based modeling (ABM) framework that simulates consumer decisions and stakeholder interactions within the smartphone reuse and recycling ecosystem. The model incorporates key behavioral drivers—privacy concerns, moral norms, and financial incentives—to examine how social and economic factors shape consumer behavior. Four primary agent types—consumers, manufacturers, recyclers, and second-hand retailers—are modeled to capture complex feedback and market dynamics. Calibrated using empirical data from Jiangsu Province, China, the simulation reveals a dominant consumer tendency to store obsolete smartphones rather than engage in reuse or formal recycling. However, the introduction of government subsidies significantly shifts behavior, doubling participation in second-hand markets and markedly improving recycling rates. These results highlight the value of integrating behavioral insights into environmental modeling to inform circular economy strategies. By offering a flexible and behaviorally grounded simulation tool, this study supports the design of more effective policies for promoting responsible smartphone disposal and lifecycle extension.
Keywords:
privacy concern
; agent-based modeling
; consumer behavior
; smartphone recycling
; circular economy
1. Introduction
The rapid proliferation of electronic waste (e-waste), particularly driven by the short lifecycle of smartphones, continues to pose significant environmental challenges worldwide [34]. As consumers continuously pursue the most recent technological innovations, alongside bold marketing and design tactics that promote planned obsolescence, the volume of thrown-away smartphones continues to grow each year. Although some devices are refurbished or resold, a large proportion ends up either indefinitely stored or improperly discarded, exacerbating resource depletion, pollution, and increasing pressure on landfills [27].
According to the Global E-waste Monitor 2024, global e-waste generation reached approximately 59.4 million metric tons in 2023, marking a steady annual increase. Alarmingly, only around 22% of this waste stream is formally collected and recycled, despite international efforts to improve e-waste management systems. Smartphones remain a major contributor to this issue due to their frequent replacement cycles, driven by the rapid adoption of 5G technology, advancements in AI functionalities, and enhanced camera systems. Many users typically replace their smartphones every two to three years, often discarding fully functional devices in pursuit of newer models [27,28]. This consumer behavior accelerates e-waste accumulation and amplifies the environmental burden associated with resource extraction and manufacturing.
Although existing e-waste regulations and recycling initiatives are in place, they struggle to achieve high participation rates. A significant number of discarded smartphones are processed through informal channels or not recycled at all, leading to severe environmental hazards such as the leakage of toxic substances like lead, mercury, cadmium, and brominated flame retardants [29]. Moreover, smartphones contain valuable but non-renewable resources such as rare earth elements, lithium, and cobalt, making efficient recycling essential for sustainable resource management.
While technical advancements in recycling methods are ongoing, research increasingly indicates that technology alone cannot resolve the e-waste challenge. Consumer behavior plays a pivotal role in determining the effectiveness of reuse and recycling programs [30]. Persistent barriers such as data privacy concerns [31], distrust in recycling systems, and the perceived inconvenience of formal recycling channels discourage participation [32]. Even with accessible recycling infrastructure, many consumers hesitate due to fears of personal data breaches or skepticism about the effectiveness of recycling processes.
At the same time, financial incentives and community-driven initiatives have emerged as promising strategies to encourage consumer engagement. Monetary rewards, accessible trade-in schemes, and visible social norms within communities have shown to significantly enhance participation in recycling activities. Despite these developments, a gap remains in the availability of comprehensive models that integrate social and economic factors to predict and influence consumer behavior accurately.
To bridge this gap, this study develops an Agent-Based Model (ABM) [33] to simulate and analyze the complex interactions between consumers, recyclers, manufacturers, and policymakers in the context of smartphone reuse and recycling. By incorporating behavioral insights, financial incentives, and policy interventions, the model aims to provide a holistic understanding of the factors influencing consumer decisions. The objective of this research is to evaluate how different strategies—such as subsidies, trust-building measures, and community engagement—can effectively promote smartphone recycling and contribute to sustainable e-waste management practices.
Ultimately, this research contributes both theoretical and practical value. Theoretically, it advances the application of ABM in environmental behavior research. Practically, it provides actionable recommendations for policymakers and industry stakeholders seeking to develop integrated, consumer-centric recycling policies aligned with circular economy principles.
2. Methods
2.1. Overview
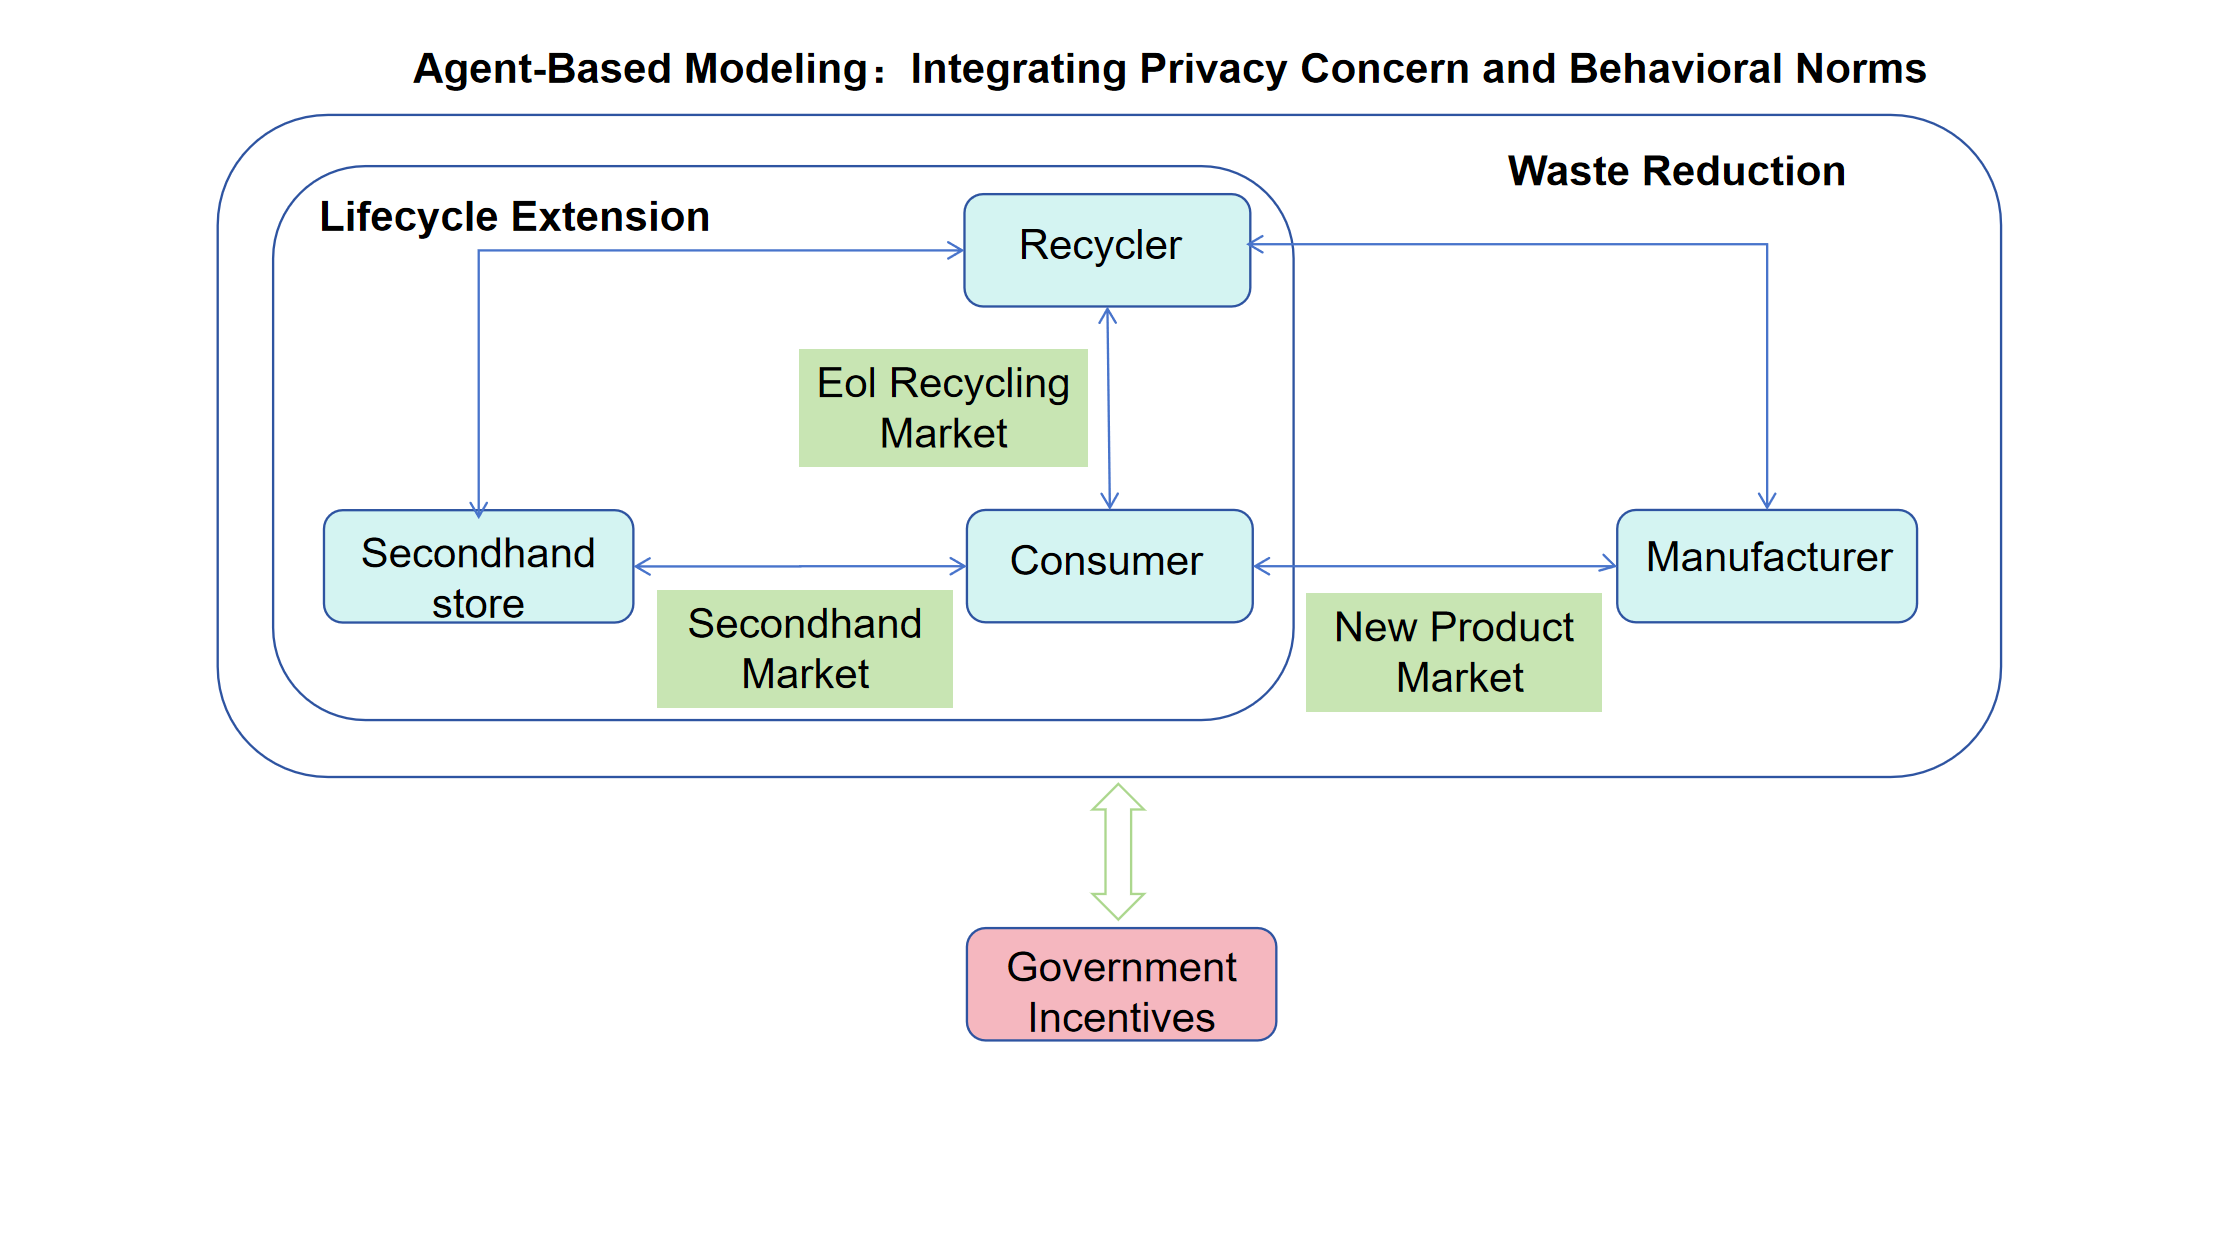
This study employs an ABM to simulate the autonomous behaviors and interactions of diverse stakeholders, including consumers, manufacturers, second-hand stores, and recyclers, to explore emergent patterns in smartphone reuse and recycling. The model captures the flow of smartphones through a network of interconnected agents, each fulfilling distinct roles across the product lifecycle. Consumers purchase, use, and dispose of devices; manufacturers handle production and manage take-back programs; recyclers process end-of-life smartphones for material recovery; and second-hand stores refurbish and resell used devices.
Beyond these operational agents, the system includes global market agents for new, used, and recycled smartphones, which monitor inventories, sales, and recycling rates. By modeling the dynamic interactions within this ecosystem, the ABM provides insights into strategies that encourage sustainable consumer behavior and advance circular economy (CE) objectives throughout the smartphone lifecycle.
2.2. System Definition
As depicted in Figure 1, the proposed agent-based model (ABM) simulates the smartphone lifecycle by integrating a diverse set of autonomous agents—consumers, manufacturers, second-hand stores, and recyclers—each with distinct roles and decision-making processes. The model captures five end-of-life (EoL) pathways: proffering (giving away), storing, reselling, recycling, and landfilling. Recycling is further divided into manufacturer-led and third-party channels. Emphasis is placed on modeling consumer behavior to assess strategies that enhance reuse and recycling.
The simulation operates in discrete monthly time steps (t). At each step, consumers first evaluate whether to purchase a new or used smartphone, initiating transactions with manufacturers or second-hand stores based on utility-maximizing decisions. Simultaneously, if their current smartphone’s performance falls below a threshold (), they choose an EoL action. These decisions are governed by the Theory of Planned Behavior (TPB), incorporating attitudes, subjective norms, and perceived behavioral control.
To reflect real-world complexities, the model extends TPB by including moral norms and privacy concerns—factors known to influence recycling reluctance. Additionally, it incorporates government policies that incentivize sustainable behavior through financial support for recyclers and manufacturers. These incentives dynamically adjust trade-in and recycling prices, reinforcing participation in circular economy practices.
2.3. Properties of Agents
To capture the multifaceted dynamics of the smartphone lifecycle, the model defines several agent types, each playing a distinct role in shaping system-level outcomes. The notation and description are listed in Table 1, these agents reflect the key stakeholders in the reuse and recycling ecosystem and are described as follows:
- Smartphones are represented as resource agents that undergo performance degradation and repairs over time, simulating the physical decline and maintenance typical of real-world devices.
- Consumers act as decision-makers whose purchasing and end-of-life (EoL) behaviors are influenced by income, product attributes, and social norms. Their choices are modeled using utility-based frameworks and the Theory of Planned Behavior to reflect both economic and psychological drivers.
- Second-hand stores function as intermediaries that acquire, refurbish, and resell used smartphones. Their decisions are shaped by repair costs, inventory levels, and prevailing market conditions.
- Recyclers handle smartphones from consumers and second-hand stores, with operations guided by pricing strategies and government incentives aimed at optimizing material recovery.
- Manufacturers are responsible for producing new smartphones and facilitating trade-in or take-back programs, thereby influencing product demand and the flow of devices into recycling channels.
Beyond these primary agents, the model also includes global market agents that manage aggregated data on inventory, sales, and recycling volumes across the new, used, and recycled smartphone markets. These agents support systemic feedback mechanisms and enable macro-level evaluation of market trends. Together, this agent-based framework captures the emergent dynamics of stakeholder interactions, offering a robust platform for analyzing sustainable strategies in smartphone life-cycle management. Detailed descriptions of each agent type are presented in the subsequent sections.
2.3.1. Smartphone Agent
The smartphone serves as a central resource entity within the model, encapsulating both the physical degradation and economic valuation throughout its lifecycle—from initial production to final disposal. Each device is characterized by a set of state variables that evolve over its usage period, including performance level , purchase price , resell price , second-hand market price , recycle price , and trade-in price . We present the model of degradation in the following text and pricing strategies in the Section 2.3.3, Section 2.3.4 and Section 2.3.5.
Performance Degradation. The performance of a smartphone naturally degrades over time due to hardware aging and cumulative user wear. This decline is modeled as an exponential decay process, where the time a device has been held is denoted by . The performance function is defined as:
where represents the normalized performance level at time , with denoting the initial performance of a new smartphone. The decay rate is empirically calibrated based on observed performance trajectories in recent smartphone aging studies and benchmark degradation reports ([45,46]). This value reflects a gradual decline over a typical device lifecycle of 3–5 years, aligning with data from controlled lab tests and real-world usage analytics indicating performance drops of 15–30% within the first 2–3 years of use.
To further capture individual variability, a Gaussian noise term is added to account for real-world variability and stochastic fluctuations in performance. This noise component reflects the unpredictable effects of individual usage patterns and environmental conditions, enhancing the realism of the degradation model.
Repairing. Smartphones may undergo repairs to prolong their functional lifespan; however, the effectiveness of each successive repair diminishes due to progressive hardware fatigue and limitations in restoration capability. To realistically model this phenomenon, the performance recovery after the i-th repair is expressed as a declining function, ensuring that full restoration becomes increasingly unattainable with repeated maintenance. Empirical evidence suggests that after approximately six repairs, performance improvements become marginal, reflecting both physical device constraints and reduced consumer motivation to pursue further repairs. Letting denote the cumulative number of repairs, the repair effectiveness is formulated as:
where defines the minimum achievable performance after repair, and are decay coefficients representing the impact of repair frequency and device age, respectively. These parameters are calibrated through 5 simulations to align with [47]. This formulation captures the inverse relationship between repair efficacy and both usage duration and repair count, highlighting the practical limitations of extending smartphone lifespan solely through maintenance.
In addition, the repair success rate is modeled as a stochastic variable that follows uniform distribution , A repair attempt is deemed unsuccessful if repair success rate is smaller than the repair effectiveness . Conversely, if the repair succeeds, the smartphone’s performance is incremented by an amount , which is proportional to the remaining gap between the current performance and its maximum potential. This increment is defined as:
where is the base performance gain coefficient, and denotes the performance at the time of repair. This formulation ensures diminishing returns as the device approaches its maximum performance limit . The updated performance following a successful repair is then given by:
It is also important to account for performance degradation during storage, particularly for smartphones held by second-hand stores. Although these devices are not actively used, they still experience a slower decay. Since second-hand stores merely store second-hand mobile phones without using them (or rarely use them), in the experiment, after more than 5 simulations, we believe it is reasonable to set the decay rate of second-hand stores to a quarter of that for consumers (), such that .
Figure 2 illustrates the performance degradation curves for smartphones owned by consumers and second-hand stores, along with the impact of six repair attempts. Moreover, We visualize the price strategies of the smartphone for different agents in Figure 3, and provide detailed explanations in the following sections.
Additional attributes of the smartphone include its classification as new or used, the identification of its producer and current holder. Overall, the smartphone agent functions as both a behavioral and economic node, enabling analysis of life-cycle extension strategies and sustainability outcomes.
2.3.2. Consumer Agent
The consumer agent represents individual decision-makers in the smartphone life-cycle, whose actions significantly influence the dynamics of reuse and recycling systems. As depicted in Figure 4, each consumer is modeled with distinct behavioral, economic, and psychological attributes that shape their decisions regarding smartphone purchases and EoL pathways. Purchasing decisions are governed by a utility-based discrete choice model, incorporating factors such as price, features, brand preference, and income level. Consumers evaluate both new and used smartphones and choose the option with the highest perceived utility. End-of-life decisions—whether to recycle, resell, store, landfill or proffer a smartphone—are guided by the Theory of Planned Behavior (TPB). Furthermore, we extend TPB model to include moral norms and privacy concerns to construct a more scalable model for recycling behavior.
Income Distribution. In our model, the consumer population is intentionally limited and tailored to reflect the socioeconomic context of Jiangsu, China [5,6]. Given this regional focus, consumer income is modeled using a log-normal distribution to capture real-world variability and periodic increases stemming from promotions, economic growth, or other life events. This approach is chosen over the commonly used Pareto distribution, which is better suited to modeling national-level or large-scale income inequality patterns [7]. Specifically, the income increment process follows a log-normal distribution, such that the additional income for consumer i at time t is drawn as . The consumer’s income is then updated according to:
where denotes the current income at time t, and is the income update interval. We sample from and set to represent annual income growth. Here, and is draw from the report ([8,9]). This iterative accumulation process continues across multiple time steps, allowing for the simulation of long-term economic trajectories and their influence on consumer behavior.
Social Network. To construct the TPB framework, consumer agents interact through a social network that captures real-world relationships and peer influence on smartphone purchasing and recycling decisions. Unlike aggregated models, which abstract away individual heterogeneity, ABM allows for the explicit representation of diverse social network structures [12,13]. This capability provides valuable insights into how network topology influences emergent behaviors within the system. Different network structures are suited to different empirical contexts; for example, socio-technical systems such as urban infrastructures or power grids are often best represented by small-world or scale-free networks due to their realistic clustering and path-length properties.
In our ABM, consumer interactions are governed by a small-world network ([10]), which is generated using a rewiring probability of 0.1 and an average degree of 10 neighbors per agent. Letting V denote the set of consumer agents (nodes) and E the set of social connections (edges), we define the consumer social graph such that:
Purchase Decision. We implement a basic TPB model to simulate consumers’ decisions between purchasing a new or used smartphone. The decision-making process is twofold: first, the consumer chooses between the two product types; then, depending on the choice, the consumer either selects a specific manufacturer (brand) l for a new product or a particular second-hand store j for a used product. Let represent the set of possible purchase options. The binary decision variable is defined as:
where is the purchase choice. The behavioral intention to choose option c, denoted , reflects the likelihood that agent i will opt for a particular alternative at time t. Omitting the time t for clarity, the intention is expressed as:
where denotes the attitude of agent i toward option c, is the subjective norm, and represents the perceived behavioral control. The respective weights and quantify the relative influence of each component.
The attitude for purchasing a used smartphone ranges from 0 (negative) to 1 (positive), while the attitude toward a new product is simply .
Subjective norm captures the perceived social pressure based on the behaviors of agent i’s neighbors:
where is the number of neighbors, and refers to each neighbor of agent i.
Perceived behavioral control reflects the agent’s perceived ease or difficulty in making the purchase, influenced by the relative cost:
where denotes the normalized cost of each option:
To reflect information asymmetry in real-world second-hand markets, the model samples only 40% of available second-hand stores when calculating . This mechanism captures the limited visibility consumers often face when comparing used smartphone prices across sellers.
Purchasing New Product. New smartphone purchasing behavior is modeled using a utility-based discrete choice framework ([14,15]) grounded in the TPB. The utility score that consumer i assigns to smartphone product s is defined as:
where is the income of consumer i, is the price of smartphone s, denotes the feature quality of the device, and captures the brand or product preference of consumer i for smartphone s. The model includes a stochastic error term to represent unobserved heterogeneity and individual variability in consumer preferences. The utility formulation highlights two critical trade-offs: the income-to-price ratio, which reflects affordability, and the quality-to-price ratio, which reflects perceived value. The weights , , and calibrate the relative importance of these components through more than 5 simulations to align with [16]. Consumers are assumed to select the smartphone—new or used—that maximizes their expected utility, subject to brand loyalty and budgetary constraints.
Purchasing Used Product. The decision-making process for purchasing a used smartphone differs notably from that of a new device. While new products typically offer full transparency regarding specifications and condition, second-hand products often lack complete or reliable information. To address these uncertainties, we adopt an extended utility-based model that incorporates second-hand-specific factors into the consumer’s evaluation. The utility that consumer i assigns to a used smartphone s offered by seller j is defined as:
where is the income of consumer i, is the price of the used smartphone s, denotes the feature quality, captures the consumer’s preference for that model, and represents the perceived reputation of second-hand store j. The error term accounts for unobserved variability in consumer choices. The parameters , , and reflect the relative importance of affordability, feature quality, and brand preference.
Once the consumer decides between purchasing a new or used device, the specific product is selected by maximizing the respective utility function—either Eq. (12) for new smartphones or Eq. (13) for used ones. Ultimately, consumer i purchases the smartphone with the highest overall utility score.
End-of-Life Decision. At the EoL stage, consumers are required to select one pathway for managing their used smartphones. Let denote the set of possible EoL actions. Among these, recycling and reselling are classified as circular economy (CE) behaviors. The EoL decision of a consumer agent is represented by the following indicator function:
where is an EoL choice. To model the behavioral intention behind EoL decisions, we employ another TPB framework. The intention of consumer i to choose EoL pathway p is given by:
where represents the attitude of consumer i toward the specific EoL pathway p. For CE behaviors (i.e., reselling and recycling), the initial attitude is drawn from a normal distribution , while the attitude toward non-CE actions is set as . The subjective norm is modeled similarly to Eq. (9), capturing the influence of peer behavior within the consumer’s social network.
Meanwhile, perceived behavioral control , following the structure of Eq. (10), reflects the perceived difficulty of each EoL option. The cost of CE actions are driven by a normalized cost function:
where is the average of the third-party recycling price and the official manufacturer trade-in price. The scale parameters and calibrate the economic weights of the CE pathways.
For non-CE actions, the costs are modeled as random variables drawn from normal distributions to reflect behavioral variability and subjective valuation draw from [16] through 5 experiments:
Recycling Decision. As depicted in Figure 5, to provide a more nuanced understanding of recycling intentions in the context of EoL smartphone management, we propose an extended TPB model that incorporates additional psychological constructs—specifically, moral norms and privacy concerns. This enriched framework offers a more comprehensive and structured approach to analyzing consumer decisions regarding formal recycling options. The behavioral intention represents the likelihood that consumer agent i will choose a specific recycling option , and is defined as follows:
where and represent the attitude and subjective norm of agent i toward recycling action r, respectively. captures the perceived behavioral control, operationalized as the relative financial incentive or “cash-back" value, associated with the recycling method. This is computed as:
where and denote the financial returns from trade-in and third-party recycling, respectively. Additionally, captures the influence of moral norms, while reflects the consumer’s privacy concerns. The interaction term accounts for moderating effects, such as the potential of privacy concerns to diminish the impact of other motivational factors. Together, these elements form a robust framework for modeling recycling behavior in response to diverse personal, social, and contextual drivers.
In Eq. (18), the moral norm component exerts a positive influence on consumers’ intentions to engage in formal recycling of obsolete smartphones. To operationalize this factor, we assign values using Gaussian random variables: and , reflecting differing baseline moral motivations across recycling options.
Conversely, privacy concern negatively affects the intention to participate in formal recycling programs. This factor is similarly modeled as a Gaussian variable, with both trade-in and third-party recycling assigned , capturing consumers’ anxiety over potential data breaches or misuse.
To account for the moderating influence of privacy concerns on other psychological drivers, we introduce an interaction term , which quantifies how privacy concerns attenuate the effects of attitude, subjective norm, perceived behavioral control, and moral norm. The moderation effect is defined as:
where and are coefficients that indicate the strength of moderation. These interaction terms can be incorporated into regression analysis or structural equation modeling to empirically assess the extent to which privacy concerns weaken the influence of other TPB components.
Consumer agents can continuously track their smartphone ownership history and adapt their behavior in response to policy interventions, such as trade-in subsidies or increased recycling incentives based on the extended TPB model in Eq. (18). These individual-level decisions, when aggregated, shape demand in both the new and used smartphone markets and critically influence the flow of devices toward recycling or landfill. As a result, consumer behavior emerges as a central driver in evaluating the sustainability performance of the modeled system.
2.3.3. Second-hand Store Agent
In real-world settings, second-hand stores typically perform repairs on used smartphones before reselling them, as depicted in Figure 6. However, repair costs can vary significantly depending on technical capabilities, labor efficiency, and spare parts availability. To manage this variability in our model while maintaining tractability, we propose a dynamic repair cost function , which depends on the original purchase price of the smartphone , the current performance level , and the time the phone has been held :
where , , and are calibration parameters. This formulation captures the intuitive idea that lower-performing and older smartphones are more costly to repair, but with diminishing marginal impact as devices age. Figure 3 illustrates the repair cost dynamics over time, reflecting increased maintenance burden on aging devices.
Following repairs, second-hand store agents must determine both the price at which they purchase used smartphones from consumers—denoted —and the resale price on the second-hand market, . To simulate pricing strategies realistically, we introduce a two-stage pricing model. The resell price is calculated using a combination of normalized repair cost , performance-adjusted base price , and a time-adjusted depreciation factor . The resulting first stage formulation for the resell price is:
where scales the price to align with typical second-hand market conditions, and , , define the depreciation profile. This model reflects empirical insights from the circular economy literature, where resell prices are influenced by functional quality, repair investment, and age-based depreciation ([19,20]).
In the second stage of the pricing model, second-hand stores determine the market selling price of refurbished smartphones, denoted as . This price reflects both the device’s restored functionality and the operational costs incurred during refurbishment. Unlike the resell price, which accounts for acquisition and repair expenses, the second-hand market price incorporates an adjusted markup to reflect added value and profit margin. The price is modeled as:
where represents the base value adjusted by the phone’s performance level, and is the normalized repair cost. The time-based depreciation factor moderates the pricing curve based on the age of the device. The parameter acts as a scaling coefficient to reflect the typical markup in the refurbished smartphone market, while , , and are empirically calibrated constants.
Eq. (22) and (23) reflect realistic pricing strategies in second-hand markets, where store owners aim to balance profitability with market competitiveness. By incorporating device quality, repair investment, and time-based depreciation, this model aligns with established practices in reverse logistics and resale value estimation ([21,22]).
2.3.4. Manufacturer Agent
The manufacturer agent (as depicted in Figure 7) plays a dual role in the our ABM: first, by setting the price of newly released smartphones and modeling their price evolution over time ([23]); and second, by managing trade-in programs that incentivize recycling through financial compensation ([24]). These mechanisms directly influence consumer purchasing and end-of-life decisions, thereby shaping the dynamics of the smartphone reuse and recycling ecosystem. We propose product price growth model and trade-in incentive model for manufacturer.
Product Price Growth Model. To simulate long-term market dynamics, the model incorporates annual price adjustments for new smartphones. The updated price for year is calculated as:
where denotes the annual price increase rate, which may vary based on macroeconomic trends or strategic pricing by the manufacturer.
It is important to note that while the purchase price of a specific smartphone model remains fixed after its release, manufacturers periodically launch new models with increased selling prices. These price increments reflect technological advancements, evolving market conditions, and strategic product differentiation relative to previous generations.
Trade-in Incentive Model. To promote formal recycling and circular economy practices, manufacturers offer trade-in services, allowing consumers to return used smartphones in exchange for discounts on new purchases. The trade-in price , determined by the time held and current performance , is defined as:
where is a stochastic scaling factor accounting for brand policy or promotional variability. The parameters , , and represent the performance weight, depreciation effect, and time-based adjustment, respectively. Notably, if , and for older devices, reflecting the diminishing value of extended usage.
2.3.5. Recycler Agent
The recycler agent in the model represents third-party recycling entities that purchase EoL smartphones directly from consumers for material recovery and refurbishment. As depicted in Figure 8, these agents play a crucial role in facilitating circular economy outcomes by offering financial incentives that encourage responsible disposal behaviors. The recycling price is offered to consumers based on the condition and usage history of the device.
To simulate this process, we adopt a pricing model structurally similar to the manufacturer’s trade-in pricing scheme as depicted in Eq. 25), but with adjusted parameters to reflect third-party valuation strategies. Specifically, the recycler price is calculated as:
The key difference lies in , which replaces the manufacturer’s , representing a slightly more generous depreciation adjustment by third-party recyclers.
Eq. (26) supports the evaluation of policies that aim to increase recycling rates through strategic pricing mechanisms.
2.3.6. Government Incentive Model
To promote sustainable smartphone disposal practices, the model incorporates a government incentive mechanism designed to reward both manufacturers and third-party recyclers for their contributions to formal recycling systems. This policy framework reflects real-world subsidy schemes in which governments financially support circular economy actors based on performance metrics such as the volume of devices recycled.
The core function of this model is to link the amount of government incentive received to the number of smartphones successfully processed by each recycler or manufacturer agent. Let denote the government incentive allocated to agent at time . The incentive function is defined as:
where is the number of smartphones recycled by agent g at time t, and , , and are model parameters. The exponent introduces diminishing returns, ensuring that while higher recycling volumes lead to greater rewards, the marginal benefit decreases to prevent over-incentivizing large-scale operators disproportionately. This structure mirrors economic policies aimed at balancing fairness, scalability, and efficiency in public subsidy distribution ([25,26]).
An important consequence of this incentive model is its direct influence on pricing behavior. Specifically, the previously stochastic pricing coefficient used in the trade-in and recycling pricing models in Eq. (25) and (26) is now endogenously determined by government support, such that: . It ensures that recyclers and manufacturers who demonstrate strong recycling performance receive higher pricing power, thereby enhancing their competitiveness and encouraging continued engagement in environmentally responsible practices.
2.4. Experimental Settings
In the simulation, we initialize consumer agents, 15 recyclers, 10 manufacturers, and 20 second-hand stores.
Each second-hand store begins with an inventory of 100 used smartphones, randomly initialized with performance levels and usage durations months. Inventory is replenished annually, and any device held longer than 60 months is forwarded to recyclers.
Manufacturer agents initialize new smartphone prices within the range (2999, 6999) and update them annually according to Eq. (24). Recycler agents collect smartphones from both consumers and second-hand stores, though for evaluating the impact of government incentives, only consumer-originated recycling is considered.
3. Results
In our experiments, we conduct 50 independent simulation runs for each scenario and report the aggregated average statistics to ensure robustness and minimize stochastic noise. Two simulation settings are compared: the base ABM system without policy support, and an extended version that incorporates the government incentive (GI) model.
Figure 9 presents a comparison of smartphone trade-in and recycling price strategies over time, both with and without government incentives. In the baseline scenario, trade-in and recycling prices follow a standard depreciation curve, with values steadily declining as smartphones age.
When the government incentive model is introduced, both trade-in and recycle prices are consistently elevated across all time intervals. This is particularly evident in the early-to-mid lifecycle (up to 60 months), where trade-in prices and recycle prices remain significantly higher than their non-incentivized counterparts. This uplift is driven by the GI model’s volume-based reward structure, which adjusts the pricing coefficients () in proportion to the recycler’s or manufacturer’s recovery performance.
These enhanced pricing strategies have a direct influence on consumer behavior, increasing the attractiveness of formal recycling and trade-in options and thereby supporting the model’s goal of promoting circular economy outcomes. In subsequent sections, we further examine how these pricing changes translate into shifts in consumer decision-making and system-wide sustainability impacts.
3.1. Analysis of Consumer Behavior
Figure 10 presents the baseline simulation results of consumer behavior in smartphone purchasing and end-of-life (EoL) management, in the absence of any government incentive policies. These patterns align closely with observed trends in Jiangsu Province, China, as reported in [16].
Figure 10a reveals that the vast majority of consumers (91.49%) opt to purchase new smartphones, while only 8.51% choose second-hand devices. This low rate of second-hand adoption reflects prevailing consumer preferences in Jiangsu, where concerns about quality, warranty, and product lifespan often deter individuals from engaging in reuse markets.
Figure 10b illustrates consumer choices at the EoL stage. Notably, more than half of the users (54.39%) prefer to store old smartphones rather than dispose of them, a behavior commonly attributed to data privacy concerns and emotional attachment to digital devices. Recycling accounts for 24.52% of actions, while proffering (15.49%) and reselling (3.97%) represent additional pathways. Landfilling remains minimal at 1.63%, consistent with improved public awareness and stricter environmental regulations.
Within the recycling segment, consumers show a stronger preference for third-party recyclers (16.43%) over manufacturer-led trade-in programs (8.09%), likely due to greater accessibility or higher offered prices. Overall, these findings highlight the dominant preference for new product consumption and the substantial behavioral inertia at the EoL stage, underscoring the need for policy interventions—such as financial incentives or awareness campaigns—to shift consumer behavior toward circular economy practices.
The simulation results provide several critical insights into the behavior of consumers and the effectiveness of government incentives in promoting smartphone reuse and recycling. Firstly, even without policy interventions, consumer preferences exhibit strong inertia towards purchasing new smartphones, driven by perceptions of quality, reliability, and technological advancement. The baseline scenario highlights a significant reluctance to engage in second-hand markets and recycling channels, with a majority of consumers opting to store their old devices indefinitely. This behavior aligns with prior studies that identify privacy concerns and emotional attachment as major deterrents to recycling.
3.2. Impact of Government Incentives
Figure 11 illustrates the behavioral outcomes of consumers under the government incentives (GI) are introduced to promote formal recycling. Compared to the baseline scenario, the presence of financial support significantly alters consumer preferences in both purchasing and end-of-life (EoL) behaviors.
As shown in Figure 11a, the proportion of consumers opting to purchase used smartphones rises to 21.32%, more than doubling from 8.51% in the no-incentive scenario. This shift reflects improved market competitiveness of refurbished devices, driven by enhanced recovery and resale operations incentivized by policy.
More strikingly, Figure 11b reveals a substantial increase in formal EoL actions. Recycling rates climb from 24.52% to 35.69%, and reselling activity rises from 3.97% to 8.88%. These gains are accompanied by a notable decrease in informal disposal behavior—particularly proffering, which drops from 15.49% to 13.62%. This suggests that government subsidies not only enhance the financial attractiveness of recycling and reselling but also reduce reliance on informal device transfer.
The detailed breakdown of recycling destinations shows that both channels benefit from incentives: recycling to third-party recyclers increases to 21.81%, and recycling to manufacturers grows to 13.88%. These findings affirm the effectiveness of targeted policy interventions in shifting consumer behavior toward circular economy practices, improving device recovery rates, and extending product lifecycles.
In conclusion, when government incentives are introduced, the landscape changes markedly. Financial incentives prove to be a powerful motivator, substantially increasing both second-hand purchases and formal recycling rates. Specifically, the share of consumers buying used smartphones more than doubles, and recycling rates experience a notable uplift. These findings emphasize the critical role of well-designed policy interventions in shifting consumer behavior toward circular economy practices. Moreover, the incentive model demonstrates that targeted financial support for recyclers and manufacturers not only boosts recovery rates but also stabilizes pricing strategies, making formal recycling more attractive over time.
3.3. Validation
Table 2 compares smartphone disposal behaviors observed in various empirical studies with the outcomes of our agent-based simulations, both with and without government incentives (GI). Across prior research, notable trends emerge: storing remains the dominant disposal behavior globally, ranging from 43.0% in the USA ([37]) to as high as 79.3% in China ([43]). This pattern reflects widespread consumer reluctance to part with old devices, often due to privacy concerns or perceived residual value.
Recycling behaviors vary considerably by context. For example, third-party recycling rates peak in Austria ([39]) and Finland ([38]), both exceeding 18%, while manufacturer-led recycling remains generally low, seldom surpassing 10% in most cases. Reselling rates are modest across studies, with the highest recorded at 7.0% in China ([36]), suggesting limited market engagement for used smartphones in many regions.
Our baseline simulation (without GI) closely aligns with the findings of [16] for Jiangsu, China, particularly in the dominant storing behavior (54.4%) and comparable rates of reselling (4.0%), manufacturer recycling (8.1%), and third-party recycling (16.4%). This correspondence supports the validity of our model in capturing real-world consumer behavior under existing policy conditions.
With the implementation of the government incentive model, notable shifts occur. Reselling rates increase substantially from 4.0% to 8.9%, and combined recycling (manufacturer and third-party) rises from 24.5% to 35.7%, while storing behavior declines from 54.4% to 40.3%. These changes demonstrate the effectiveness of financial incentives in diverting smartphones away from idle storage and towards formal reuse and recycling channels. Such findings underscore the policy relevance of our ABM, highlighting how targeted economic interventions can meaningfully advance circular economy objectives in the smartphone sector.
4. Conclusions
In this paper, we develop a novel ABM system to evaluate the impacts of social factors and financial incentives on consumer behaviors, especially for the reuse and recycling of smartphones. By simulating complex interactions among consumers, second-hand stores, manufacturers, recyclers, the model provides a nuanced understanding of the dynamics within smartphone life-cycle management. The findings underscore that while technical advancements and market structures are important, consumer behavior remains the linchpin for effective e-waste management.
Furthermore, the study demonstrates that combining financial incentives with community engagement and clear privacy protections can yield the most substantial improvements in recycling participation. Policymakers and industry leaders should therefore pursue holistic strategies that address both the economic and social dimensions of consumer decision-making.
Building upon our current agent-based framework, future research will expand the model to assess a broader set of product-level circular economy strategies, including leasing, sharing, and rental systems. Inspired by recent advances in circularity modeling, we aim to endogenize boundedly rational consumer interactions across key lifecycle phases—acquisition, obsolescence, repair, hibernation, and disposal.
Our next step involves integrating additional variables such as technological innovation in recycling and refurbishment processes, regional variability in behavioral responses, and long-term environmental outcomes, including lifecycle greenhouse gas emissions. By running simulation experiments over extended periods, we plan to evaluate the diffusion potential of product-service systems and identify critical leverage points, including promotional synergies (e.g., pricing incentives, advertising, service quality), systemic bottlenecks (e.g., product collection inefficiencies), and potential rebound effects (e.g., induced emissions from logistics or new production). Ultimately, the extended model will serve as a “what-if” analysis platform to test intervention scenarios, offering policymakers and industry stakeholders a robust tool for designing effective strategies toward a net-zero circular economy.
References
- Macal, C. M.; North, M. J. Tutorial on agent-based modeling and simulation. Proceedings of the Winter Simulation Conference 2005, 14–pp.
- Bonabeau, E. Agent-based modeling: Methods and techniques for simulating human systems. Proceedings of the National Academy of Sciences 2002, 99, 7280–7287. [Google Scholar] [CrossRef] [PubMed]
- Rahmandad, H.; Sterman, J. Heterogeneity and network structure in the dynamics of diffusion: Comparing agent-based and differential equation models. Management Science 2008, 54, 998–1014. [Google Scholar] [CrossRef]
- Hansen, P.; Liu, X.; Morrison, G. M. Agent-based modelling and socio-technical energy transitions: A systematic literature review. Energy Research & Social Science 2019, 49, 41–52. [Google Scholar]
- Meng, C.; Gustafsson, B.; Knight, J. Economic Transformation and Income Distribution in China Over Three Decades; Cambridge University Press, 2023. [Google Scholar]
- Skare, M.; Gil-Alana, L. A.; Claudio-Quiroga, G.; Pržiklas Družeta, R. Income inequality in China 1952-2017: persistence and main determinants. Oeconomia Copernicana 2021, 12, 863–888. [Google Scholar] [CrossRef]
- Charpentier, A.; Flachaire, E. Pareto models for top incomes and wealth. The Journal of Economic Inequality 2022, 20, 1–25. [Google Scholar] [CrossRef]
- Yi, X.; Jue, W.; Huan, H. Does economic development bring more livability? Evidence from Jiangsu Province, China. Journal of Cleaner Production 2021, 293, 126187. [Google Scholar] [CrossRef]
- Wang, N.; Chen, Z.; Li, T.; Zhen, M. Spatiotemporal pattern evolution and influence mechanism of urban vertical expansion: a case study of Jiangsu Province, China. Land 2022, 11, 433. [Google Scholar] [CrossRef]
- Ferreira, L. N.; Hong, I.; Rutherford, A.; Cebrian, M. The small-world network of global protests. Scientific Reports 2021, 11, 19215. [Google Scholar] [CrossRef]
- Cubillos-Cornejo, J.; Mendoza, M. E.; Bordeu, I. Extreme events at the onset of epileptic-like intermittent activity of FitzHugh–Nagumo oscillators on small-world networks. Chaos, Solitons & Fractals 2025, 192, 116000. [Google Scholar]
- Axtell, R. L.; Farmer, J. D. Agent-based modeling in economics and finance: Past, present, and future. Journal of Economic Literature 2025, 63, 197–287. [Google Scholar] [CrossRef]
- Kerr, C. C.; Stuart, R. M.; Mistry, D.; Abeysuriya, R. G.; Rosenfeld, K.; Hart, G. R.; Núñez, R. C.; Cohen, J. A.; Selvaraj, P.; Hagedorn, B.; et al. Covasim: an agent-based model of COVID-19 dynamics and interventions. PLOS Computational Biology 2021, 17, e1009149. [Google Scholar] [CrossRef] [PubMed]
- Song, Y.; Li, G.; Li, T.; Li, Y. A purchase decision support model considering consumer personalization about aspirations and risk attitudes. Journal of Retailing and Consumer Services 2021, 63, 102728. [Google Scholar] [CrossRef]
- Esmeli, R.; Bader-El-Den, M.; Abdullahi, H. Towards early purchase intention prediction in online session based retailing systems. Electronic Markets 2021, 31, 697–715. [Google Scholar] [CrossRef]
- Zhang, L.; Ran, W.; Jiang, S.; Wu, H.; Yuan, Z. Understanding consumers’ behavior intention of recycling mobile phone through formal channels in China: The effect of privacy concern. Resources, Environment and Sustainability 2021, 5, 100027. [Google Scholar] [CrossRef]
- Jiang, S.; Zhang, L.; Hua, H.; Liu, X.; Wu, H.; Yuan, Z. Assessment of end-of-life electric vehicle batteries in China: Future scenarios and economic benefits. Waste Management 2021, 135, 70–78. [Google Scholar] [CrossRef]
- Lyu, T.; Chen, H.; Guo, Y. Investigating innovation diffusion, social influence, and personal inner forces to understand people’s participation in online e-waste recycling. Journal of Retailing and Consumer Services 2023, 73, 103366. [Google Scholar] [CrossRef]
- Bocken, N. M. P.; De Pauw, I.; Bakker, C.; Van Der Grinten, B. Product design and business model strategies for a circular economy. Journal of Industrial and Production Engineering 2016, 33, 308–320. [Google Scholar] [CrossRef]
- Steffen, A. Second-hand consumption as a lifestyle choice. International Conference on Consumer Research 2017, 189–207. [Google Scholar]
- Gobbi, C. Designing the reverse supply chain: the impact of the product residual value. International Journal of Physical Distribution & Logistics Management 2011, 41, 768–796. [Google Scholar]
- Shu, T.; Liao, H.; Chen, S.; Wang, S.; Lai, K. K.; Gan, L. Analysing remanufacturing decisions of supply chain members in uncertainty of consumer preferences. Applied Economics 2016, 48, 3208–3227. [Google Scholar] [CrossRef]
- Wangsa, I. D.; Yang, T. M.; Wee, H. M. The effect of price-dependent demand on the sustainable electrical energy supply chain. Energies 2018, 11, 1645. [Google Scholar] [CrossRef]
- Zink, T.; Maker, F.; Geyer, R.; Amirtharajah, R.; Akella, V. Comparative life cycle assessment of smartphone reuse: repurposing vs. refurbishment. The International Journal of Life Cycle Assessment 2014, 19, 1099–1109. [Google Scholar] [CrossRef]
- Wang, H.; Gu, Y.; Li, L.; Liu, T.; Wu, Y.; Zuo, T. Operating models and development trends in the extended producer responsibility system for waste electrical and electronic equipment. Resources, Conservation and Recycling 2017, 127, 159–167. [Google Scholar] [CrossRef]
- Hartley, K.; van Santen, R.; Kirchherr, J. Policies for transitioning towards a circular economy: Expectations from the European Union (EU). Resources, Conservation and Recycling 2020, 155, 104634. [Google Scholar] [CrossRef]
- Hazelwood, D. A.; Pecht, M. G. Life extension of electronic products: a case study of smartphones. IEEE Access 2021, 9, 144726–144739. [Google Scholar] [CrossRef]
- Prabhu N, S.; Majhi, R. Disposal of obsolete mobile phones: A review on replacement, disposal methods, in-use lifespan, reuse and recycling. Waste Management & Research 2023, 41, 18–36. [Google Scholar]
- Sari, D. P.; Masruroh, N. A.; Asih, A. M. S. Eco-Efficiency Comparative Analysis of Informal and Formal Smartphone Recycling Practices Using Life Cycle Assessment. International Journal on Advanced Science, Engineering & Information Technology 2023, 13, 3. [Google Scholar]
- Khan, F.; Ahmed, W.; Najmi, A. Understanding consumers’ behavior intentions towards dealing with the plastic waste: Perspective of a developing country. Resources, Conservation and Recycling 2019, 142, 49–58. [Google Scholar] [CrossRef]
- Klymenko, O.; Meisenbacher, S.; Matthes, F. Identifying practical challenges in the implementation of technical measures for data privacy compliance. arXiv 2023, arXiv:2306.15497. [Google Scholar]
- Souza Piao, R.; Vincenzi, T. B.; Vazquez-Brust, D. A.; Yakovleva, N.; Bonsu, S.; Carvalho, M. M. Barriers toward circular economy transition: Exploring different stakeholders’ perspectives. Corporate Social Responsibility and Environmental Management 2024, 31, 153–168. [Google Scholar] [CrossRef]
- Terano, T. Why agent-based modeling in social system analysis. J. Stage Oukan 2010, 2, 56–62. [Google Scholar]
- Sarath, P.; Bonda, S.; Mohanty, S.; Nayak, S. K. Mobile phone waste management and recycling: Views and trends. Waste Management 2015, 46, 536–545. [Google Scholar] [CrossRef] [PubMed]
- Liu, J.; Bai, H.; Zhang, Q.; Jing, Q.; Xu, H. Why are obsolete mobile phones difficult to recycle in China? Resources, Conservation and Recycling 2019, 141, 200–210. [Google Scholar] [CrossRef]
- Li, B.; Yang, J.; Song, X.; Lu, B. Survey on disposal behaviour and awareness of mobile phones in Chinese university students. Procedia Environmental Sciences 2012, 16, 469–476. [Google Scholar] [CrossRef]
- Arain, A. L.; Pummill, R.; Adu-Brimpong, J.; Becker, S.; Green, M.; Ilardi, M.; Van Dam, E.; Neitzel, R. L. Analysis of e-waste recycling behavior based on survey at a Midwestern US University. Waste Management 2020, 105, 119–127. [Google Scholar] [CrossRef]
- Ylä-Mella, J.; Keiski, R. L.; Pongrácz, E. Electronic waste recovery in Finland: Consumers’ perceptions towards recycling and re-use of mobile phones. Waste Management 2015, 45, 374–384. [Google Scholar] [CrossRef]
- Wieser, H.; Tröger, N. Exploring the inner loops of the circular economy: Replacement, repair, and reuse of mobile phones in Austria. Journal of Cleaner Production 2018, 172, 3042–3055. [Google Scholar] [CrossRef]
- Yin, J.; Gao, Y.; Xu, H. Survey and analysis of consumers’ behaviour of waste mobile phone recycling in China. Journal of Cleaner Production 2014, 65, 517–525. [Google Scholar] [CrossRef]
- Wilson, G. T.; Smalley, G.; Suckling, J. R.; Lilley, D.; Lee, J.; Mawle, R. The hibernating mobile phone: Dead storage as a barrier to efficient electronic waste recovery. Waste Management 2017, 60, 521–533. [Google Scholar] [CrossRef]
- Ongondo, F. O.; Williams, I. D. Greening academia: Use and disposal of mobile phones among university students. Waste Management 2011, 31, 1617–1634. [Google Scholar] [CrossRef]
- Bai, H.; Wang, J.; Zeng, A. Z. Exploring Chinese consumers’ attitude and behavior toward smartphone recycling. Journal of Cleaner Production 2018, 188, 227–236. [Google Scholar] [CrossRef]
- Tan, Q.; Duan, H.; Liu, L.; Yang, J.; Li, J. Rethinking residential consumers’ behavior in discarding obsolete mobile phones in China. Journal of Cleaner Production 2018, 195, 1228–1236. [Google Scholar] [CrossRef]
- Pramanik, P. K. D.; Sinhababu, N.; Mukherjee, B.; Padmanaban, S.; Maity, A.; Upadhyaya, B. K.; Holm-Nielsen, J. B.; Choudhury, P. Power consumption analysis, measurement, management, and issues: A state-of-the-art review of smartphone battery and energy usage. IEEE Access 2019, 7, 182113–182172. [Google Scholar] [CrossRef]
- Xu, B.; Oudalov, A.; Ulbig, A.; Andersson, G.; Kirschen, D. S. Modeling of lithium-ion battery degradation for cell life assessment. IEEE Transactions on Smart Grid 2016, 9, 1131–1140. [Google Scholar] [CrossRef]
- Rahmati, A.; Qian, A.; Zhong, L. Understanding human-battery interaction on mobile phones. Proceedings of the 9th International Conference on Human Computer Interaction with Mobile Devices and Services 2007, 265–272. [Google Scholar]
Figure 1.
Overview of the proposed Agent-based Modeling System.
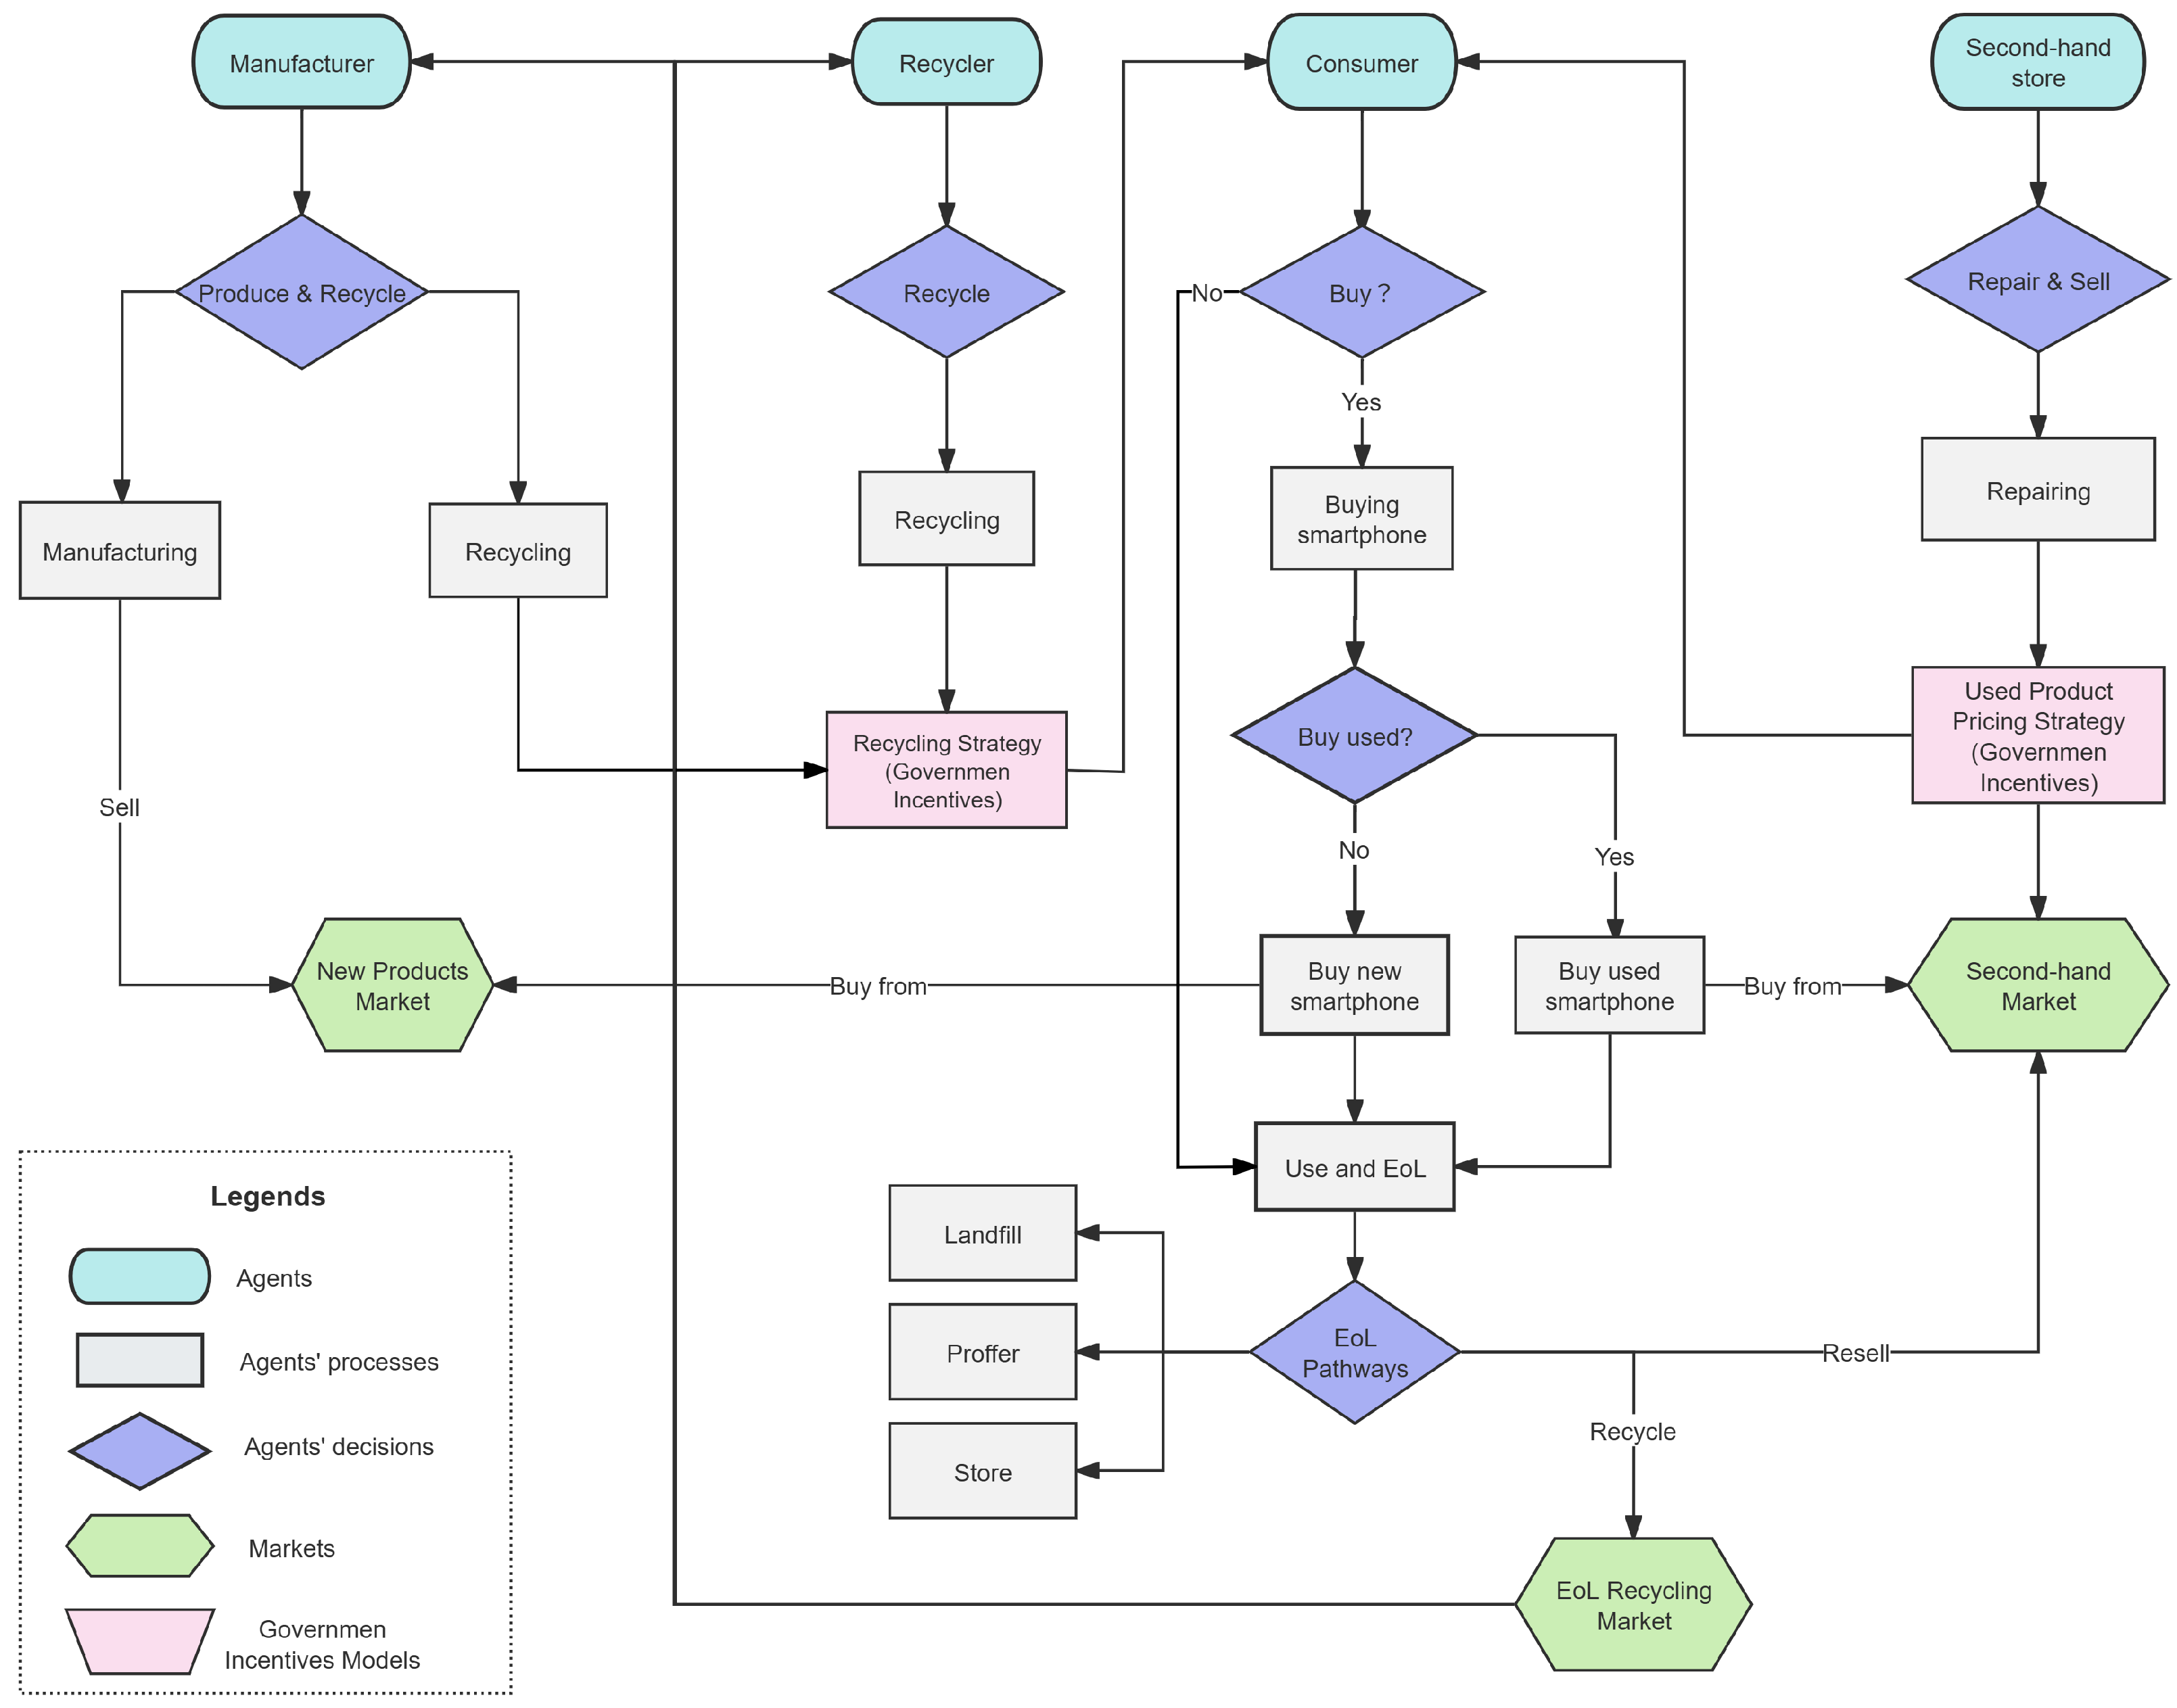
Figure 2.
Smartphone performance degradation over time with consumer and second-hand store as owners.
Figure 2.
Smartphone performance degradation over time with consumer and second-hand store as owners.
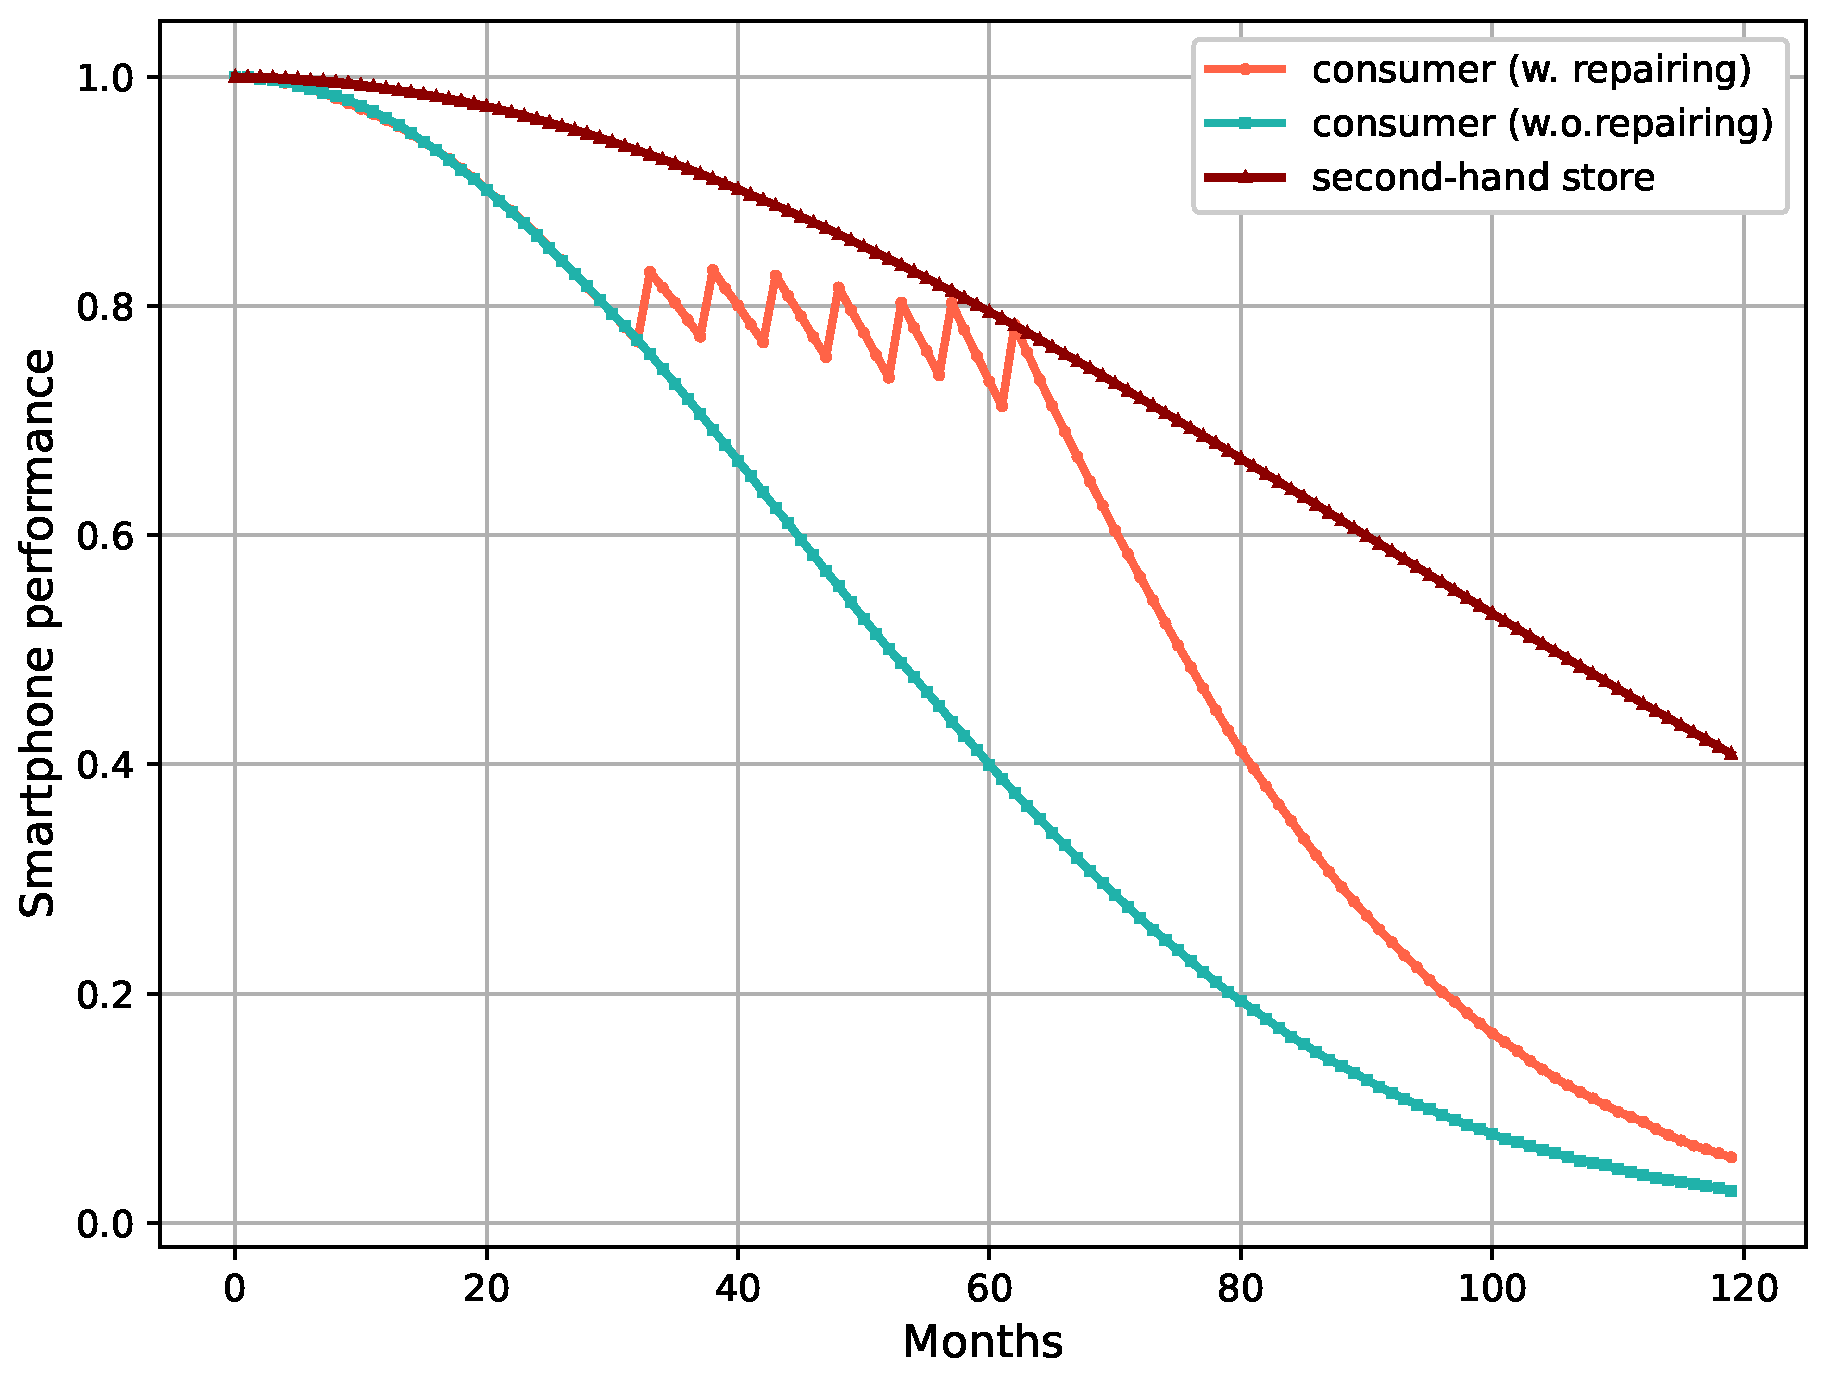
Figure 3.
Smartphone price and repairing cost over time.
Figure 4.
Consumer decision tree.
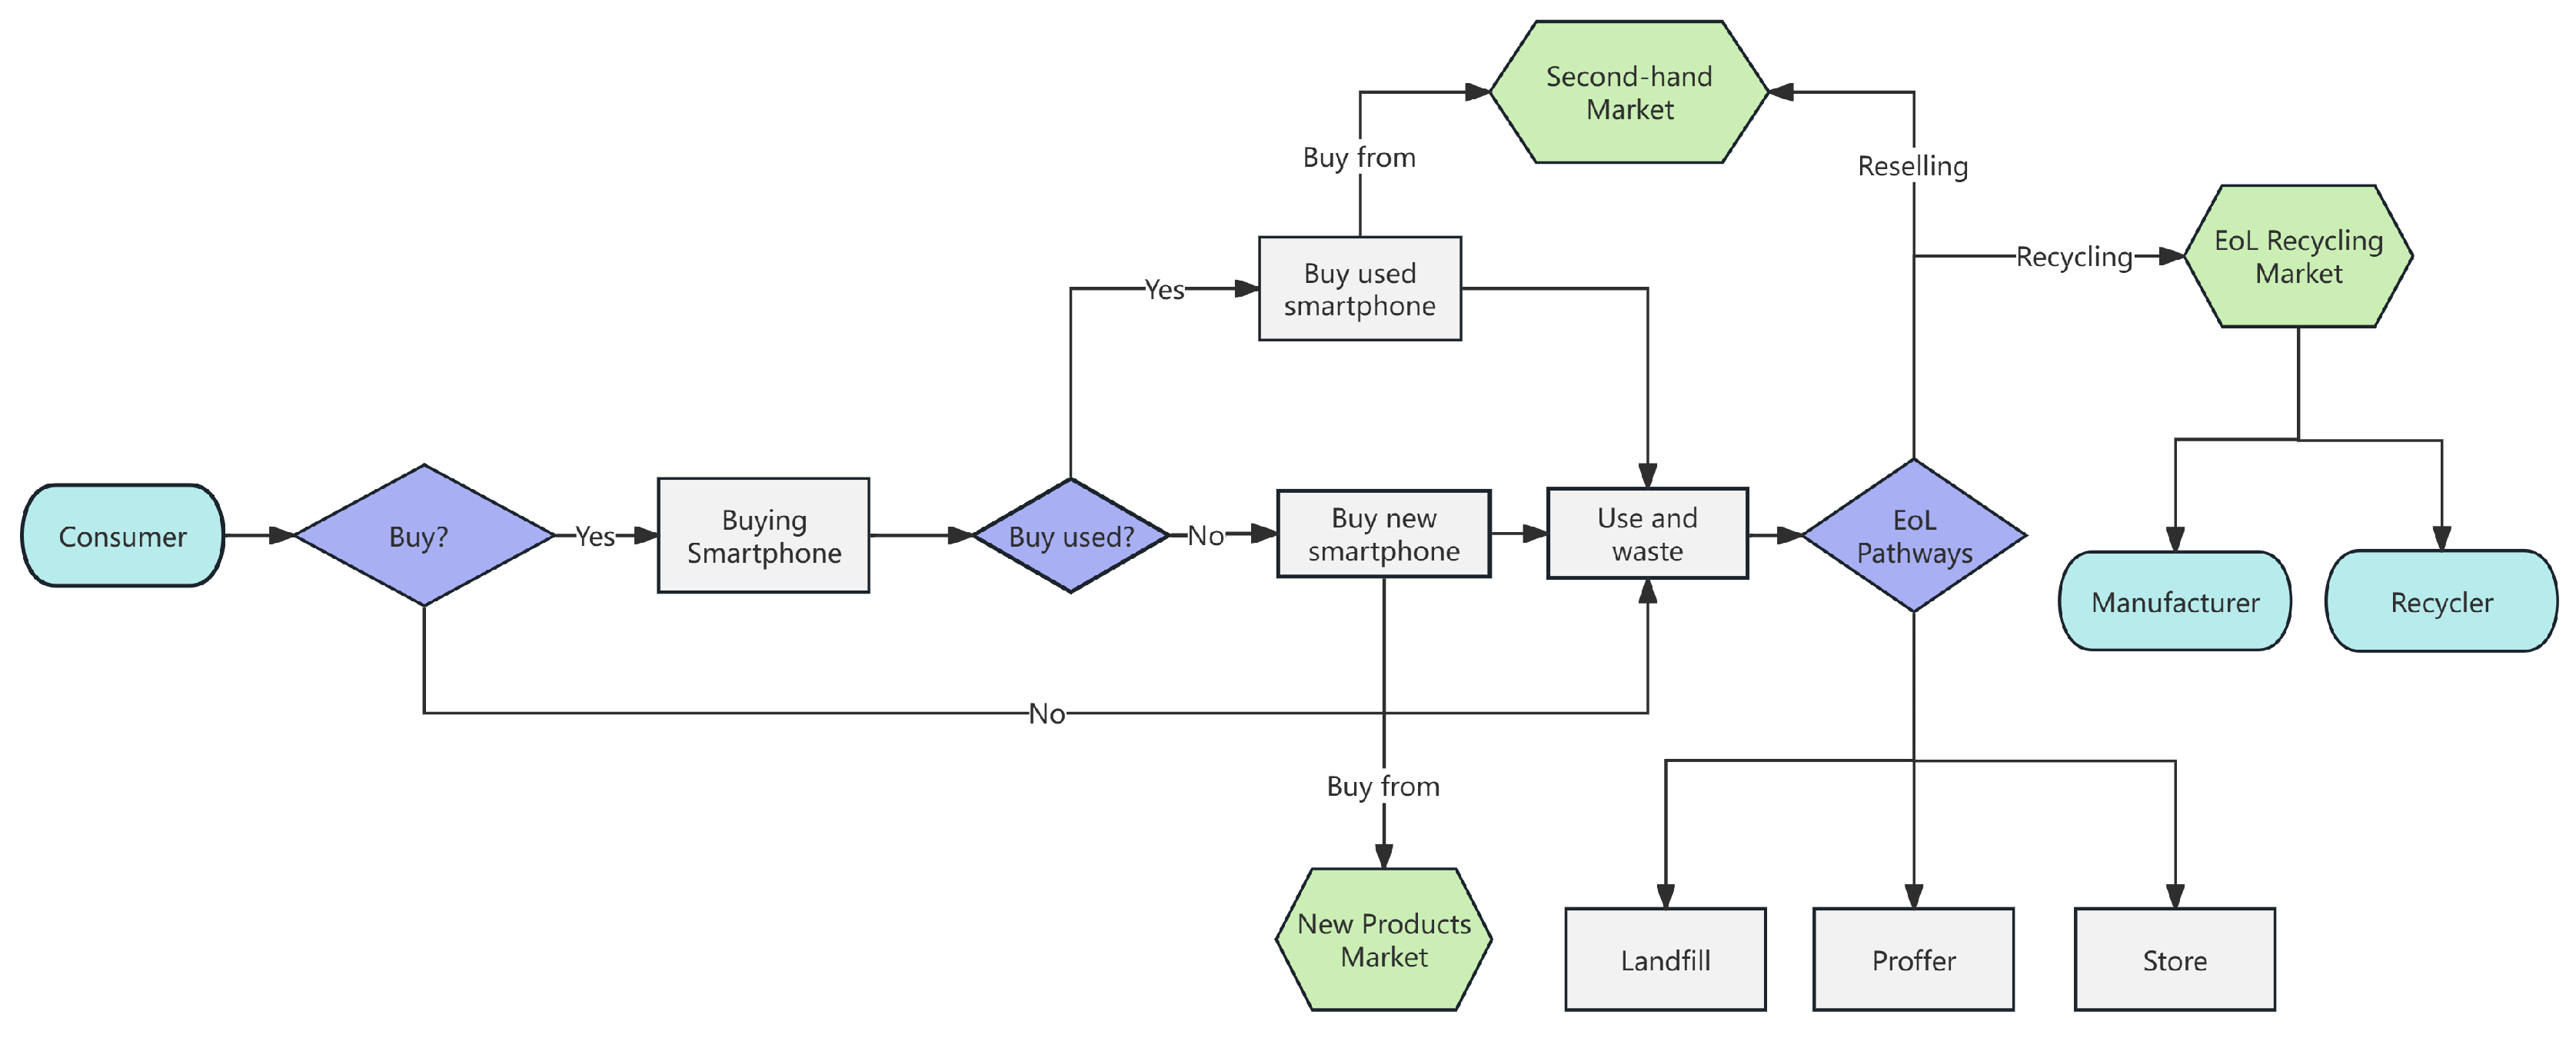
Figure 5.
Extended TPB model from [16].
Figure 5.
Extended TPB model from [16].
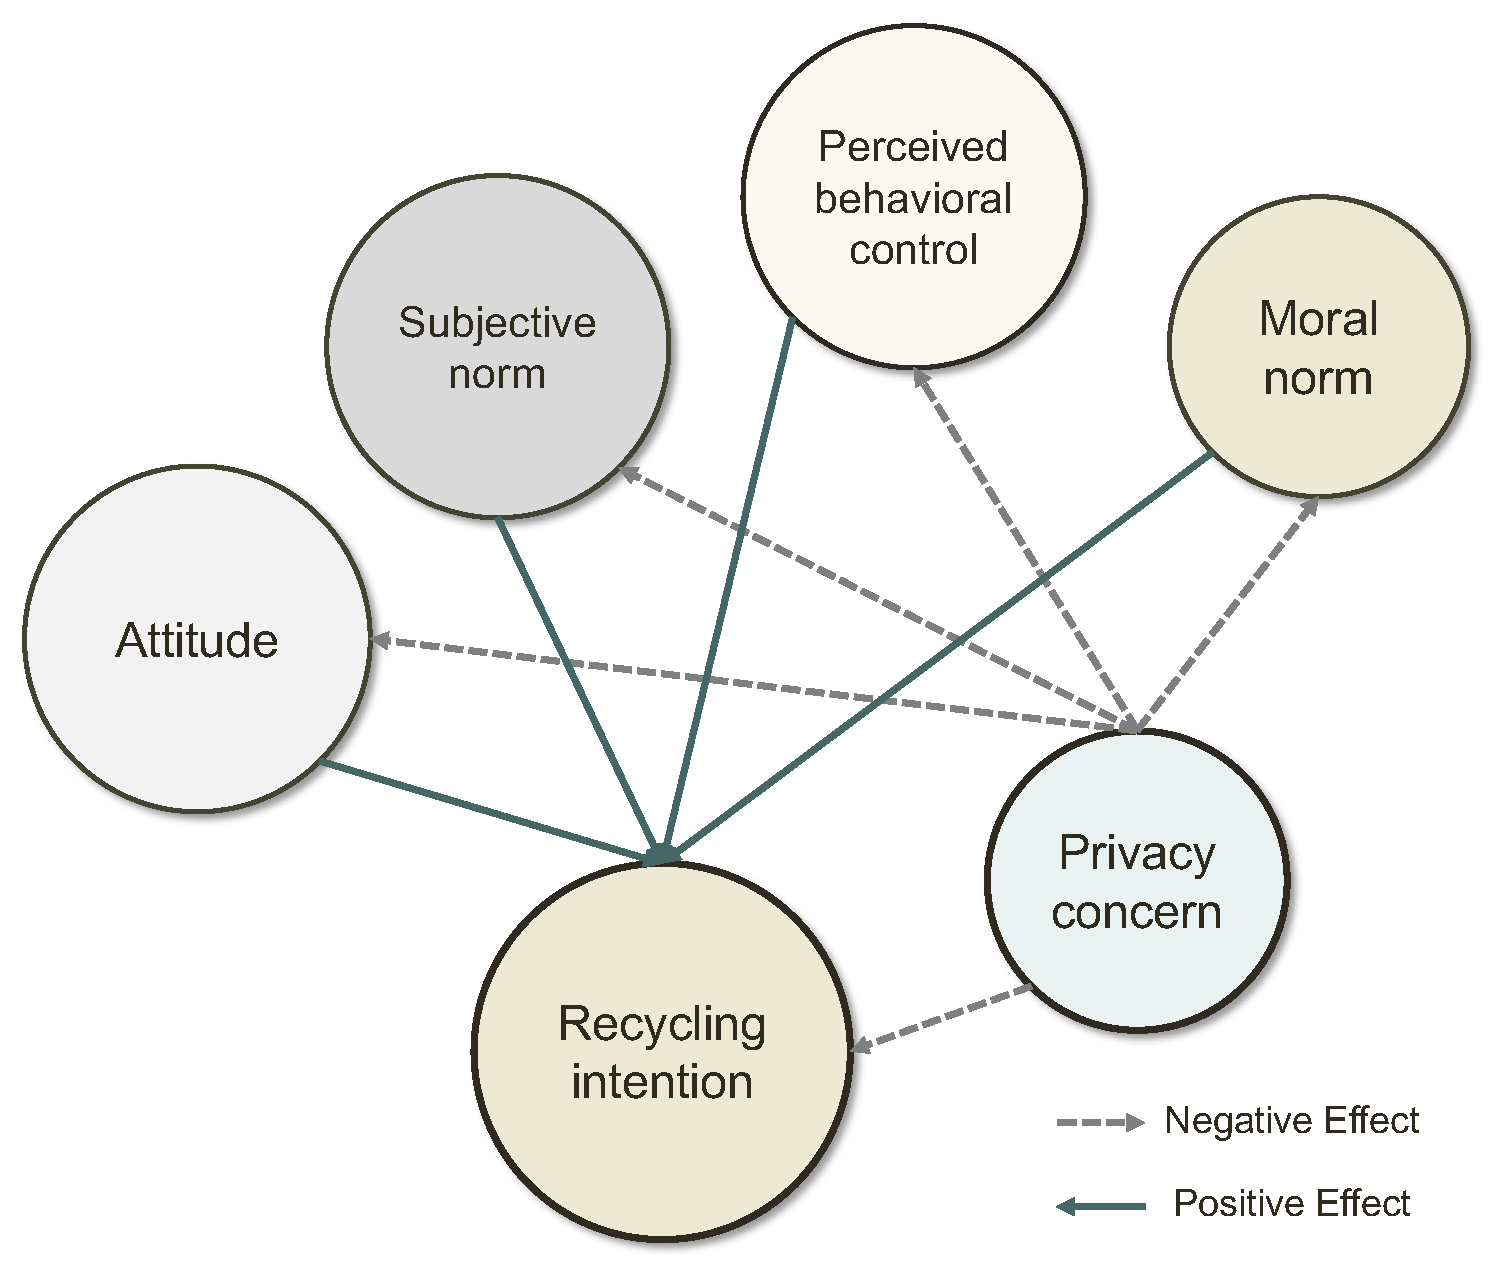
Figure 6.
Second-hand store decision tree.
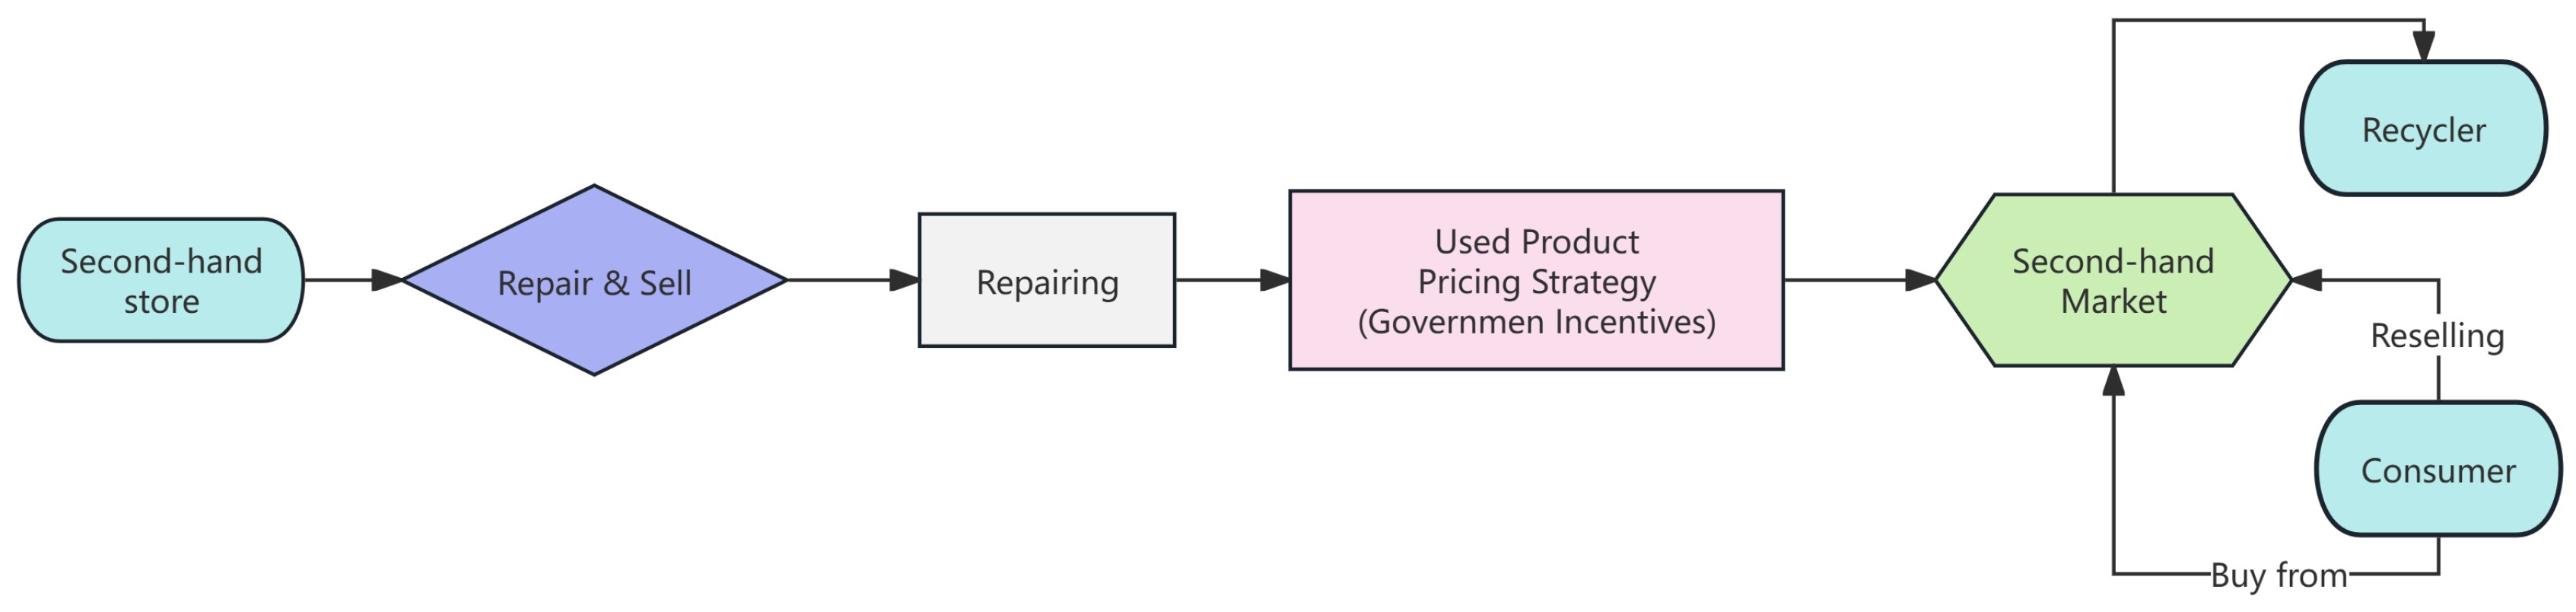
Figure 7.
Manufacturer decision tree.
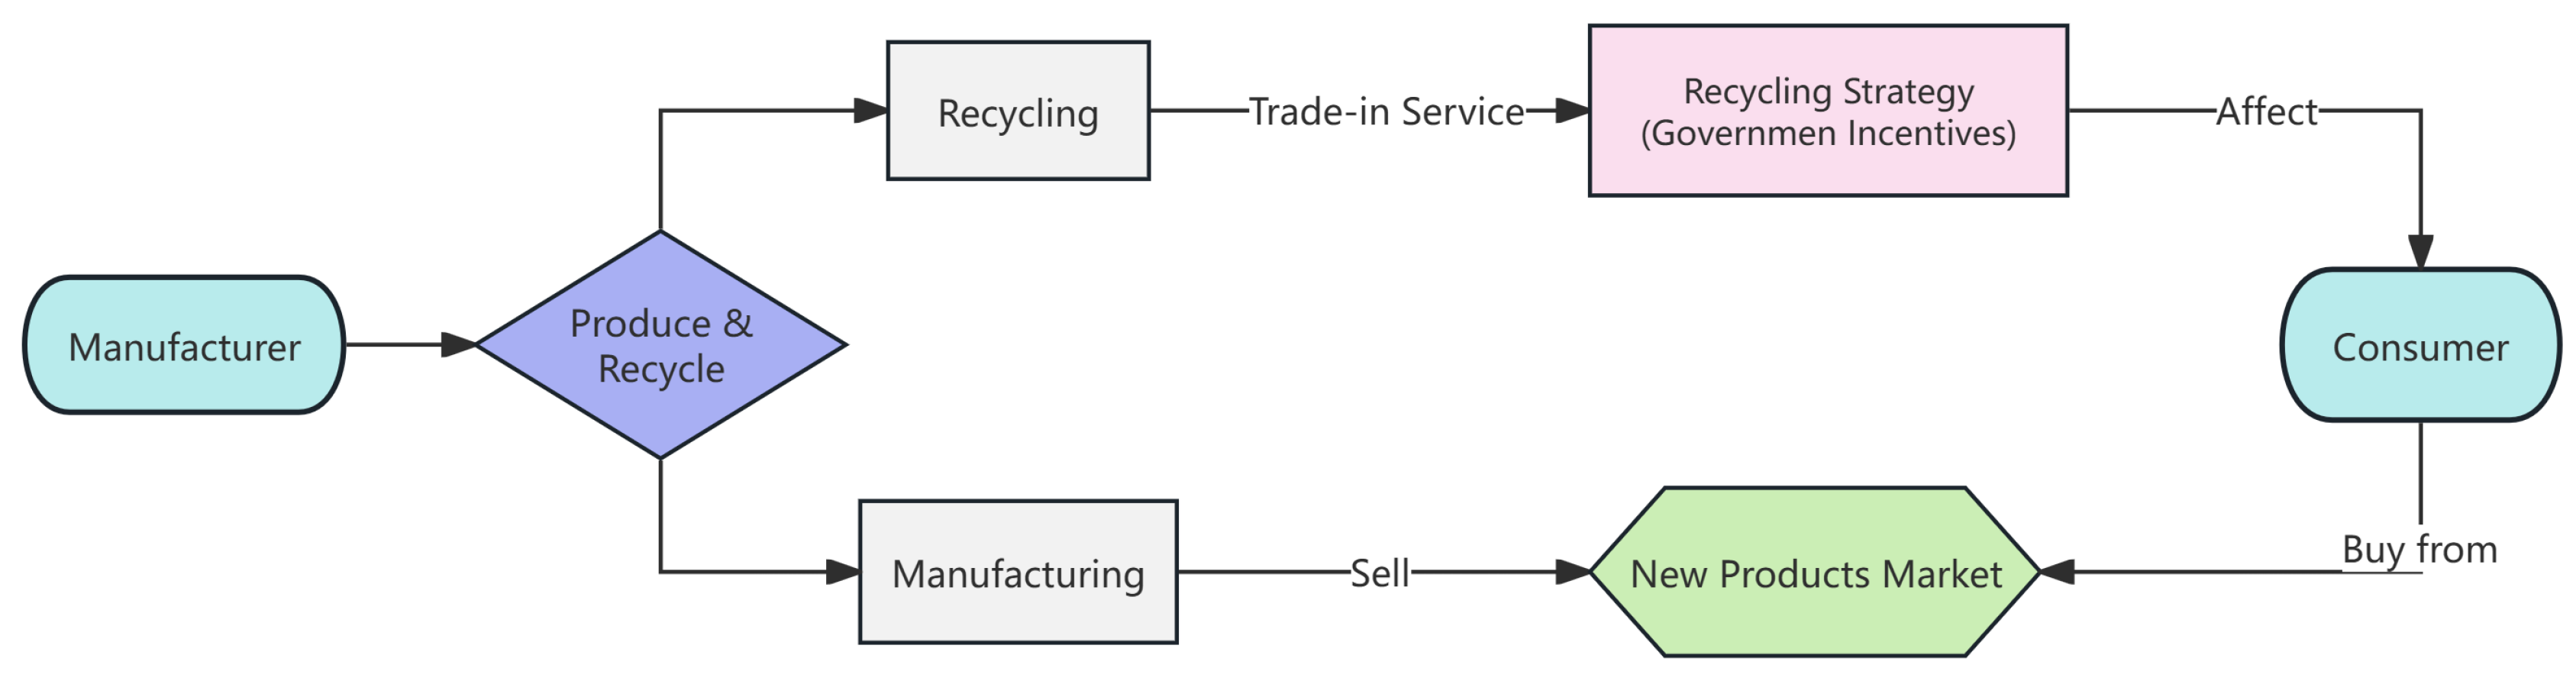
Figure 8.
Recycler decision tree.
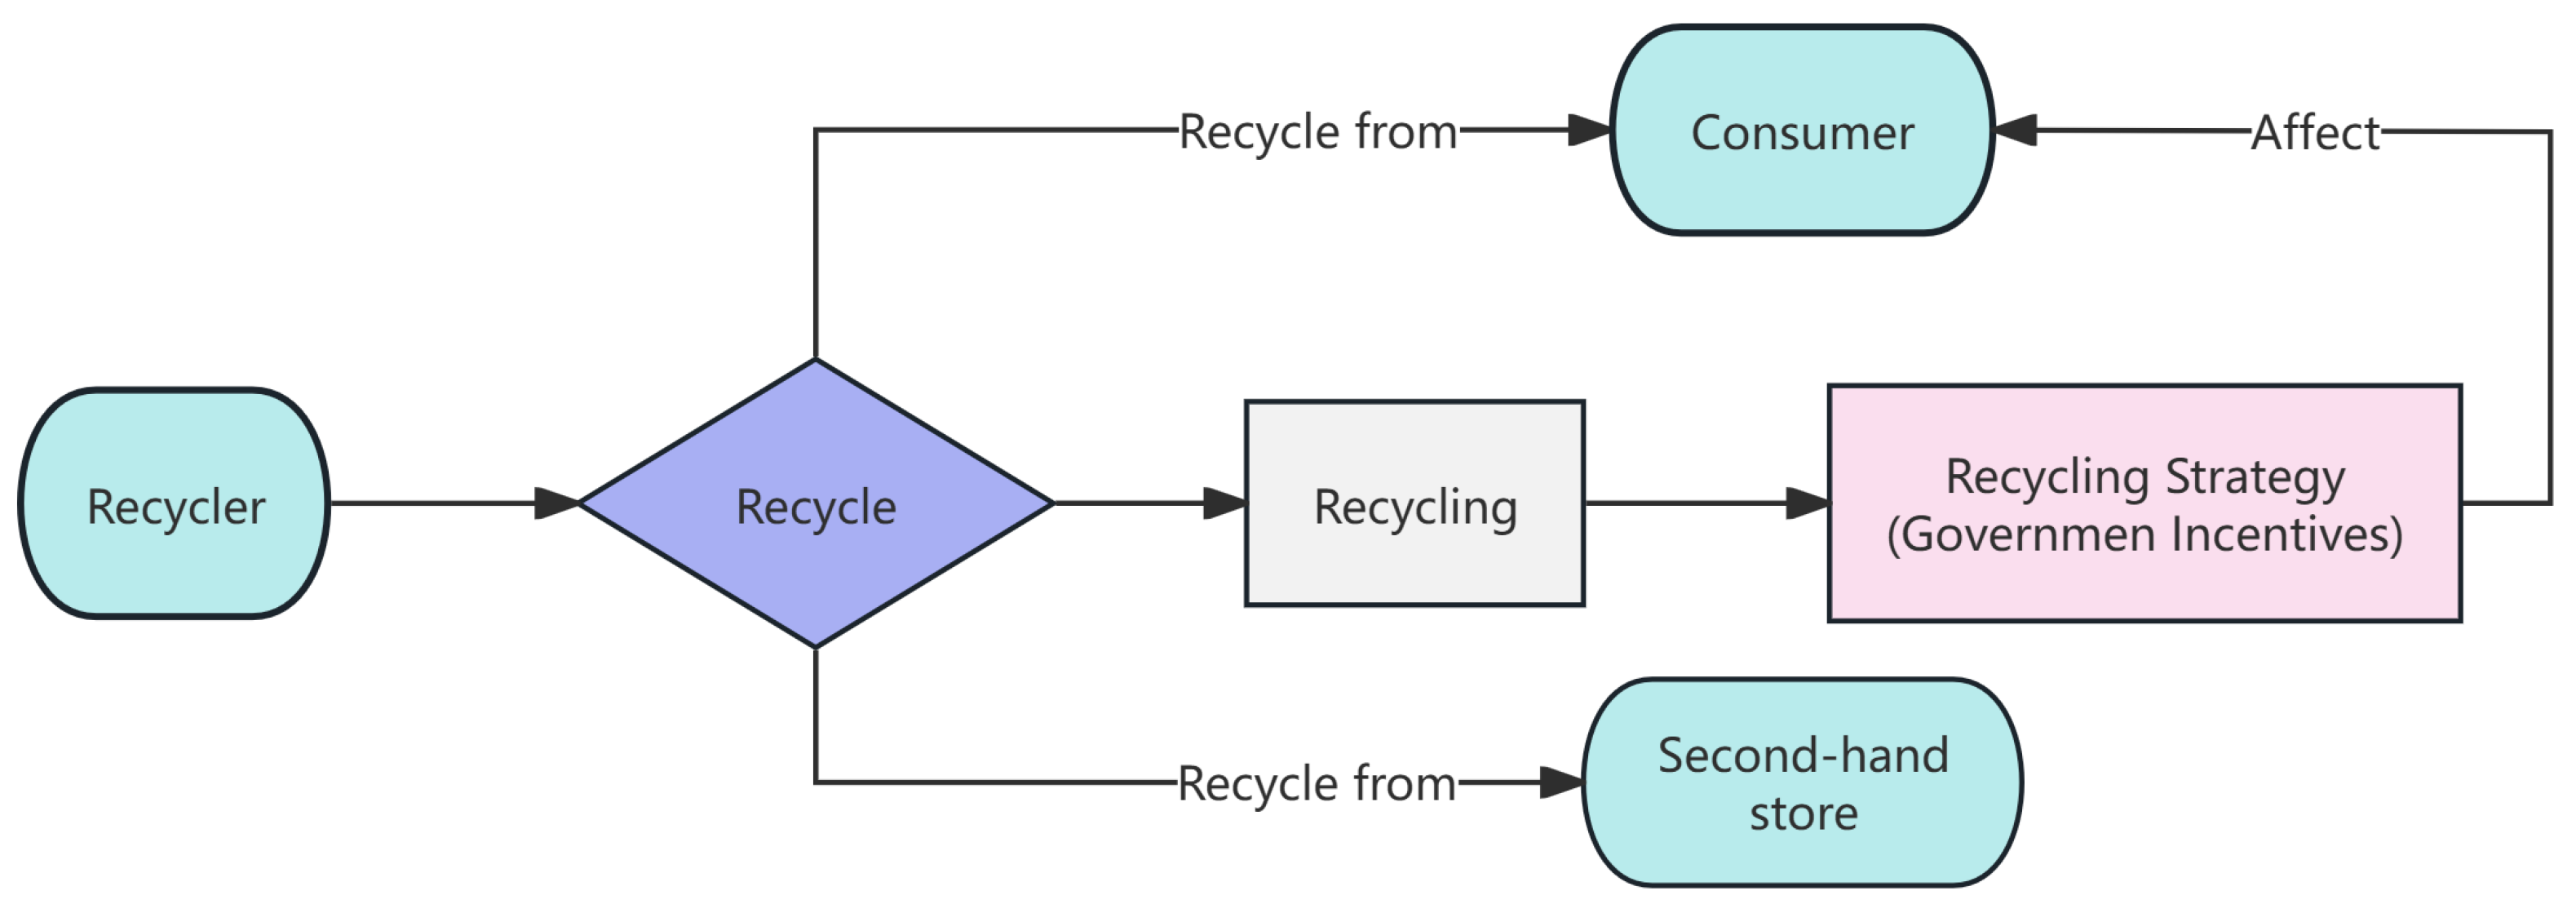
Figure 9.
Comparisons of smartphone price strategies.
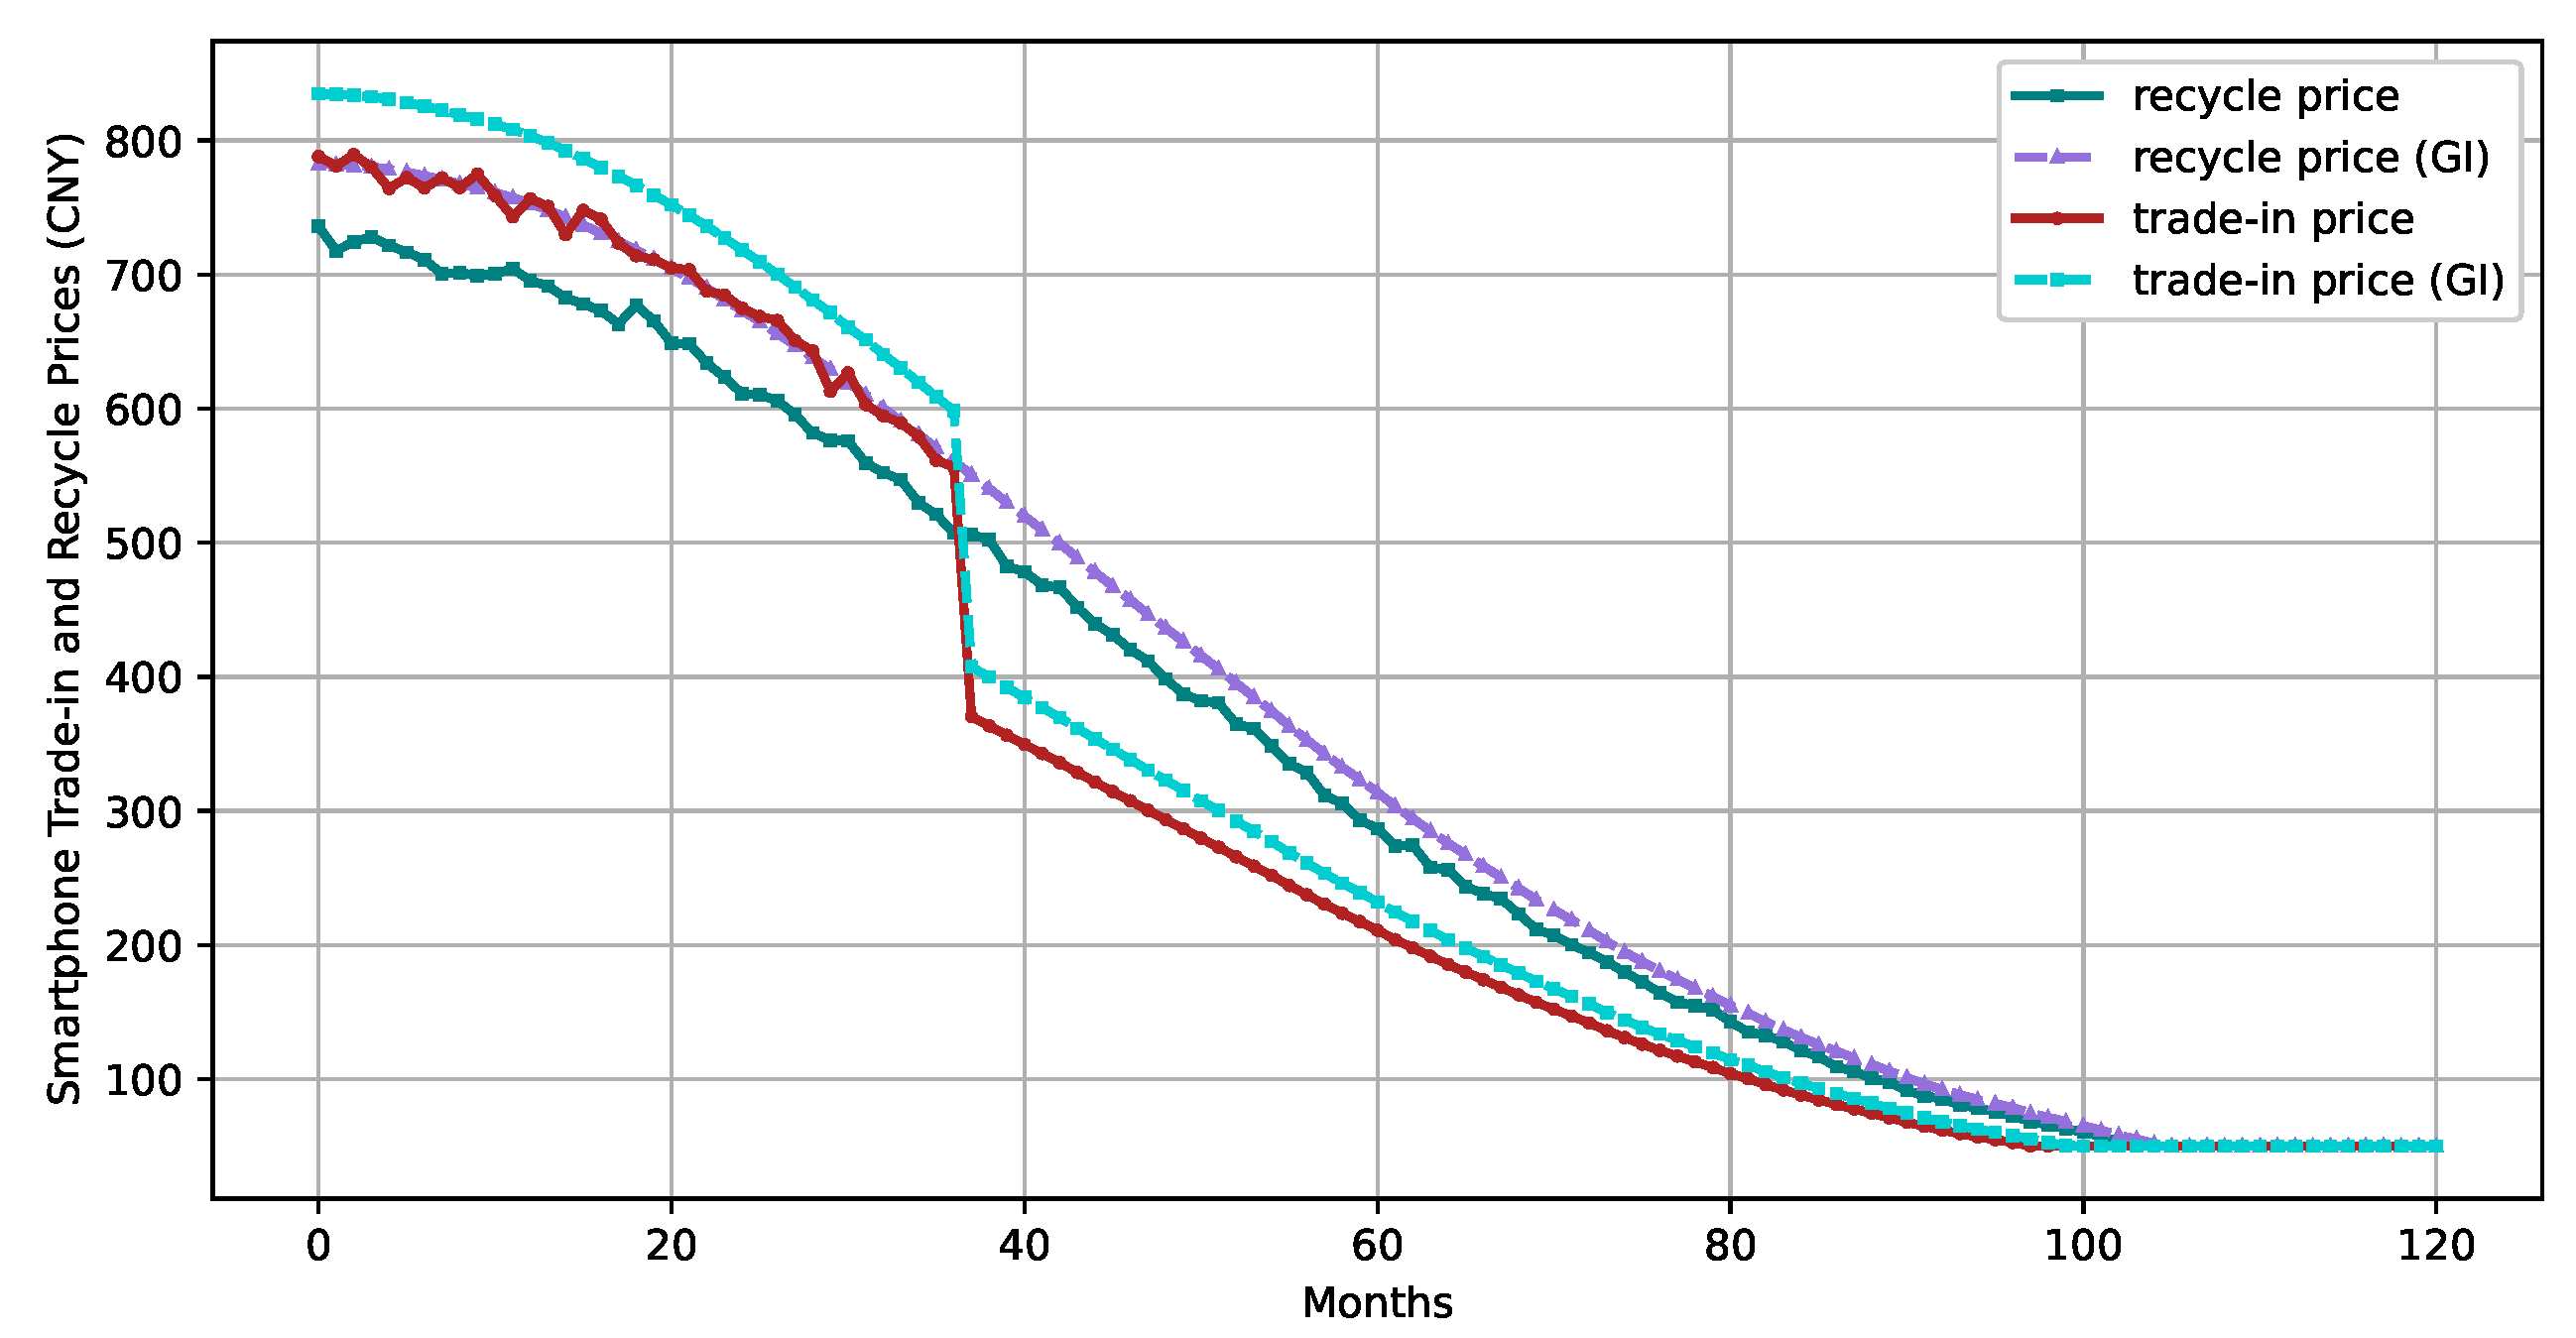
Figure 10.
Consumers’ preference for buying and EoL actions of smartphones.
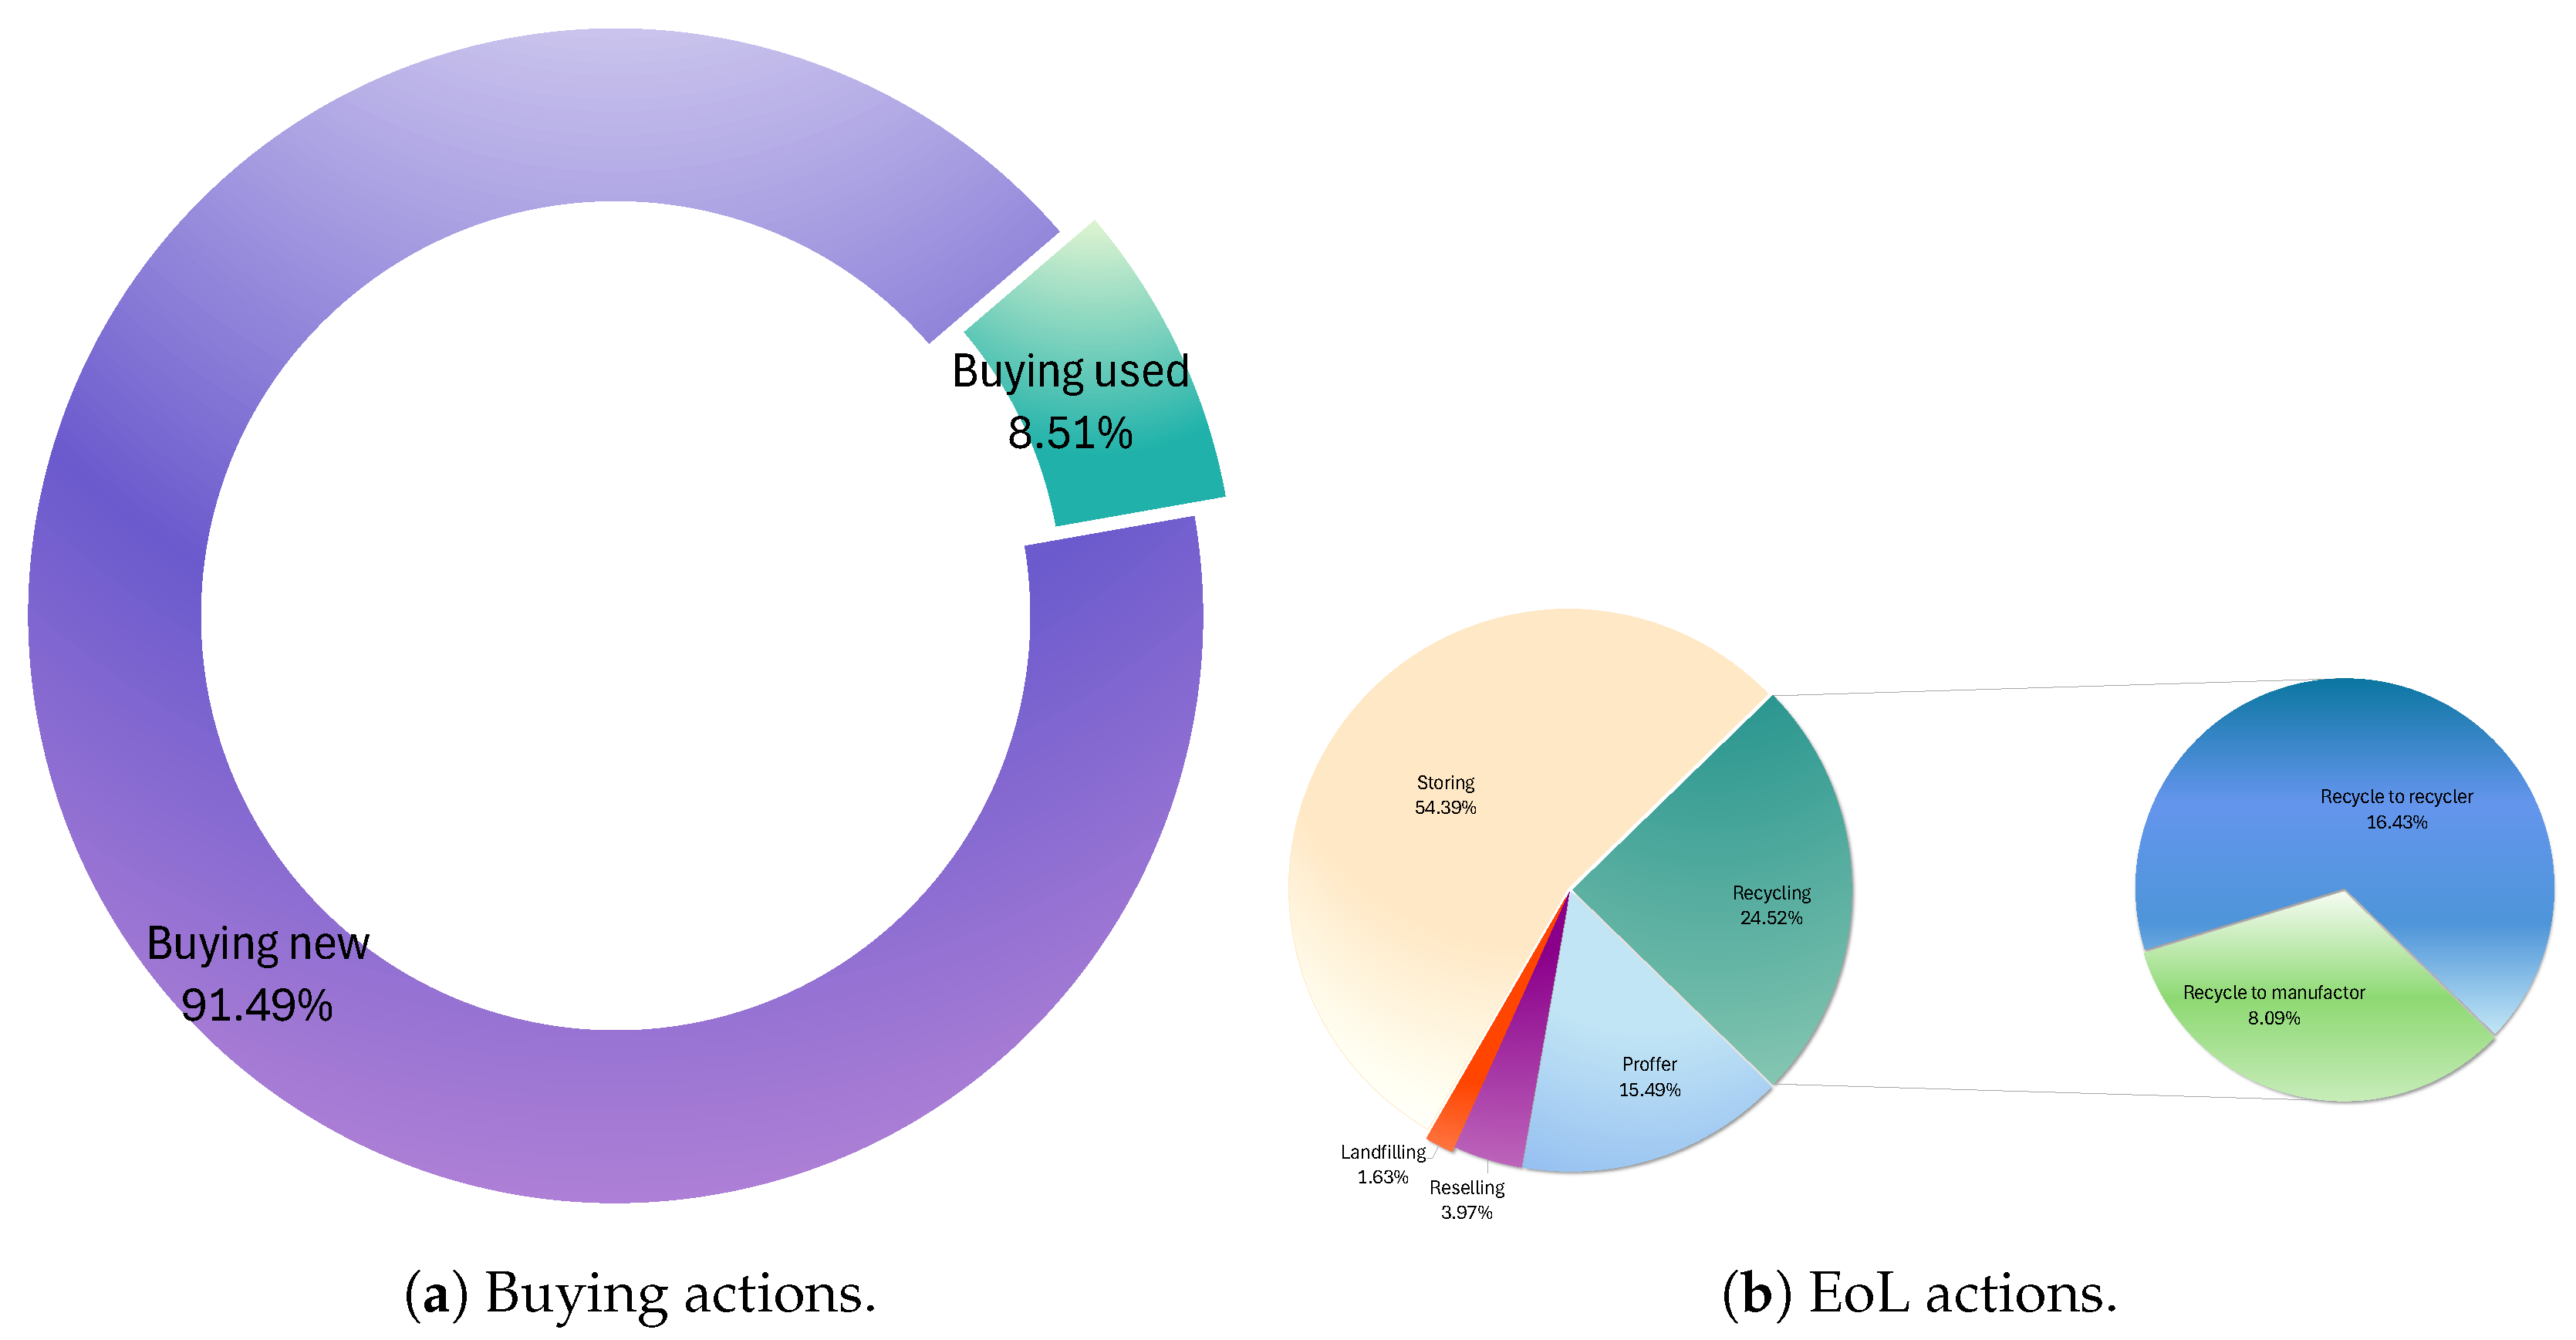
Figure 11.
Consumers’ preference for buying and EoL actions of smartphones with GI model.
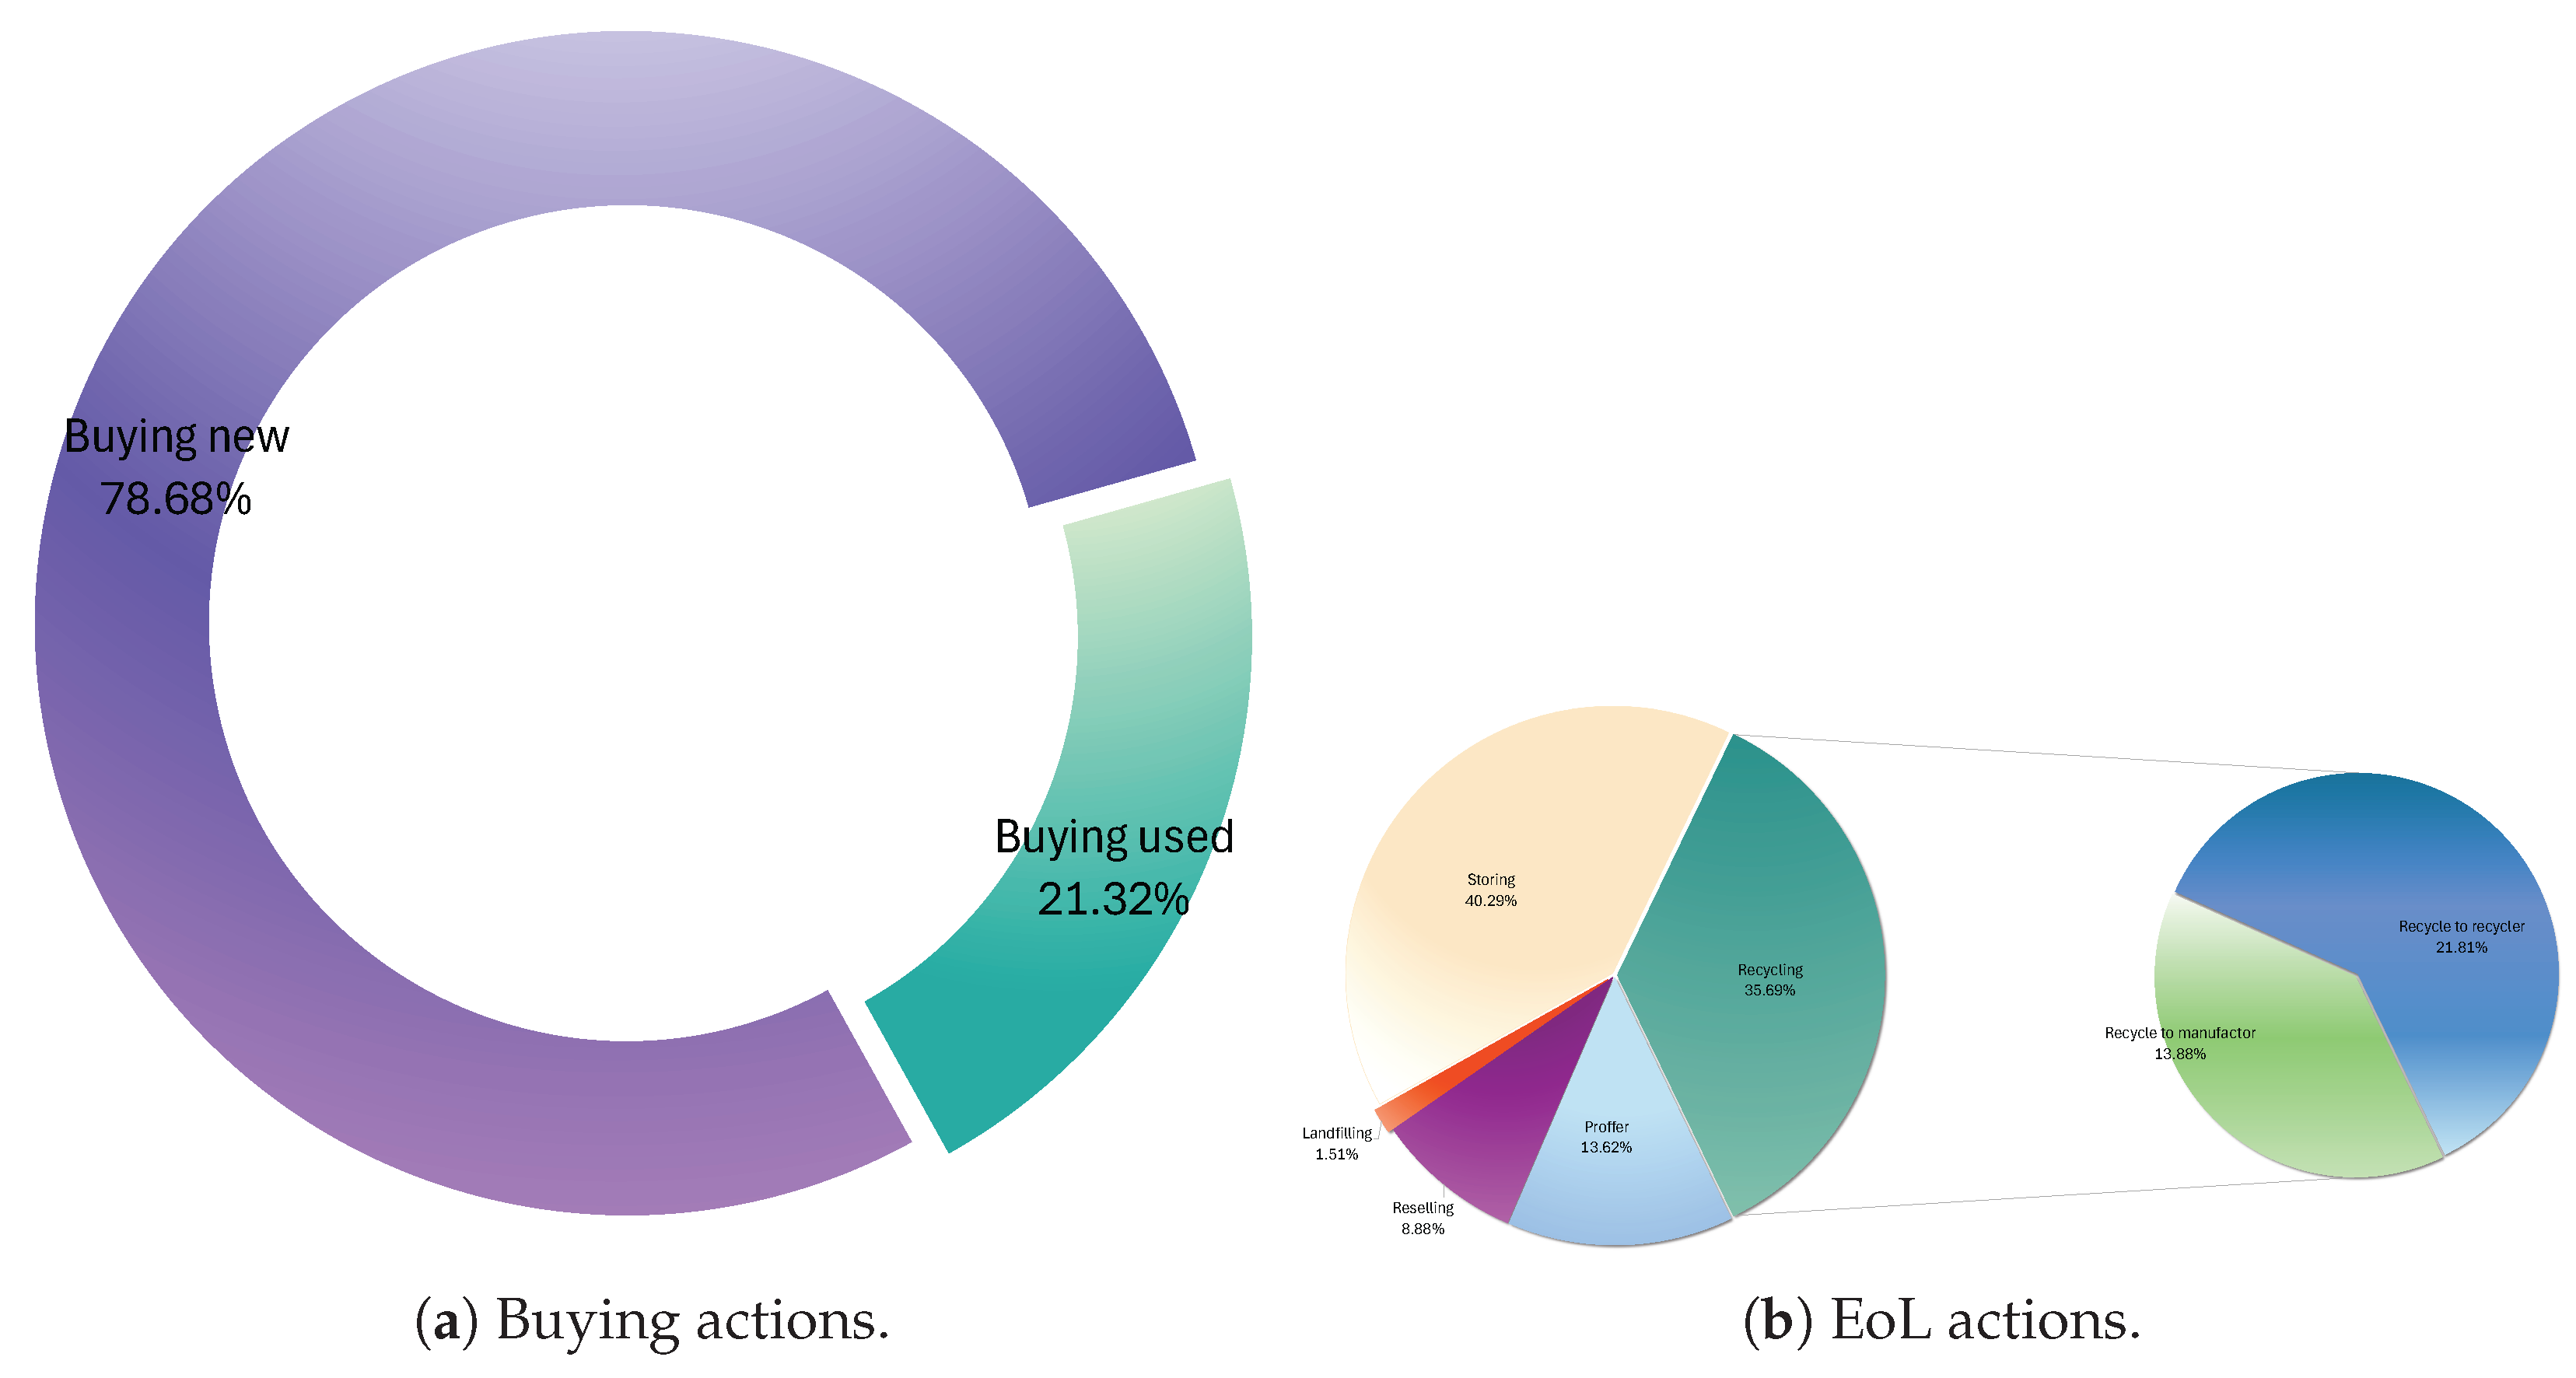

Table 1.
Notation of Agents in ABM.
| Notation | Agent | Description |
| Consumer | Active agent | |
| Second-hand Store | Active agent | |
| Recycler | Active agent | |
| Manufacturer | Active agent | |
| Smartphone | Resource agent |
Table 2.
Smartphone disposal actions adopted by consumers across various studies.
| Study | Location | Proffer | Landfill | Store | Resell | Manufacturer Recycle |
Third-party Recycle |
| [35] | China | 25.0 | 6.0 | 54.0 | - | - | 15.0 |
| [38] | Finland | 16.0 | 8.5 | 55.0 | 2.4 | - | 18.0 |
| [39] | Austria | 12.2 | 1.4 | 51.4 | 6.7 | - | 19.1 |
| [40] | China | 24.8 | 6.9 | 47.1 | - | - | - |
| [36] | China | 20.0 | 3.0 | 64.0 | 7.0 | 1.0 | 5.0 |
| [37] | USA | 41.0 | 3.0 | 43.0 | 3.0 | 9.0 | 1.0 |
| [42] | UK | 18.7 | 1.6 | 55.7 | 3.1 | 5.2 | 9.4 |
| [43] | China | 35.7 | - | 79.3 | 6.0 | - | - |
| [44] | China | 12.7 | 8.9 | 62.1 | - | 1.4 | 0.8 |
| [16] | China | 19.0 | 1.0 | 49.0 | 4.0 | 11.0 | 14.0 |
| Ours | - | 15.5 | 1.6 | 54.4 | 4.0 | 8.1 | 16.4 |
| Ours+GI | - | 13.6 | 1.5 | 40.3 | 8.9 | 13.9 | 21.8 |
Disclaimer/Publisher’s Note: The statements, opinions and data contained in all publications are solely those of the individual author(s) and contributor(s) and not of MDPI and/or the editor(s). MDPI and/or the editor(s) disclaim responsibility for any injury to people or property resulting from any ideas, methods, instructions or products referred to in the content. |
© 2025 by the authors. Licensee MDPI, Basel, Switzerland. This article is an open access article distributed under the terms and conditions of the Creative Commons Attribution (CC BY) license (http://creativecommons.org/licenses/by/4.0/).
Copyright: This open access article is published under a Creative Commons CC BY 4.0 license, which permit the free download, distribution, and reuse, provided that the author and preprint are cited in any reuse.


