
Submitted:
02 August 2024
Posted:
05 August 2024
You are already at the latest version
Abstract
Adeno-associated viruses (AAV) are widely used as viral vectors for gene delivery in mammalian cells. We focused on the efficacy of transduction of AAV 2/5, 2/6, 2/8 and 2/9 expressing GFP in 3T3-L1 murine preadipocyte cells by live imaging microscopy using IncuCyte S3 and flow cytom-etry. Three transduction modes were assessed: AAV transduction in 3T3-L1 preadipocyte cells with or without further differentiation into mature adipocyte-like cells and injection of AAVs in differ-entiated adipocyte-like cells. AAV2/6 demonstrated the highest transduction efficiency in 3T3-L1 preadipocytes, as it was 1.5–2-fold more effective than AAV2/5, and AAV2/8 in the range of viral concentrations from 2×10⁴ to 1,6×10⁵ VG/cell. AAV2/5 and AAV2/8 showed transduction effi-ciencies similar to each other. The expression of GFP under the CMV promoter remained stable for up to 20 days. The induction of 3T3-L1 differentiation in three days after AAV transduction did not alter the GFP expression level, and AAV2/6 showed the best transduction efficiency. AAV2/6 demonstrated the ability to transduce mature adipocytes. These results were confirmed by in vivo studies on C57BL6 mice AAV2/6 had the highest transducing activity on both inguinal and inter-scapular adipose tissue. Thus, AAV2/6 has demonstrated higher transduction efficacy compared to AAV2/5, AAV2/8 and AAV2/9 both in 3T3-L1 adipocytes and adipose tissue in vivo, which proves its usability along with AAV8 and AAV9 for gene delivery to adipocytes.
Keywords:
adeno-associated virus
; viral tropism
; adipocytes
; adipose tissue
; anti-obesity agents
; gene therapy
1. Introduction
Obesity, which has reached global epidemic, is a major contributor to the development of type 2 diabetes mellitus and is a significant risk factor for cardiovascular diseases, including coronary heart disease [1]. The expansion of adipose tissue is characterized by both hypertrophy (increased adipocyte size) and hyperplasia (in-creased number of adipocytes), and these processes depend on nutrient influx and the rate of adipocyte differentiation [2]. Adipocyte differentiation, also known as adipo-genesis, is the process by which fibroblast-like precursor cells transform into fully differentiated adipocytes under the influence of adipogenic stimulants such as insulin and glucocorticoid agonists. This process is also influenced by an individual’s genetic background. The action of adipogenic stimuli activates transcription factors that regulate the expression of numerous genes involved in adipocyte differentiation.
Currently, the development of promising therapeutic strategies for obesity is in progress, among which correction of nutritional habits [3], surgical interventions [4], and the use of most recently approved drugs such as semaglutide that positively affect the obese and diabetic status [5]. One of the strategies for improving the insulin sensitivity of adipocytes is to influence the molecular mechanisms underlying insulin resistance. Conversion of energy-storing white adipose tissue into energy-burning beige adipose tissue, called browning, has emerged as a promising approach in the fields of metabolic research and obesity treatment [6].
As the prominence of the adipose-related research tends to increase, the targeted gene delivery to adipose tissue remains relevant. Adeno-associated viruses (AAV) are widely used in research and therapeutic applications [7]. Specifically, AAVs are commonly used to introduce transgenes or gene editing tools into cells and animal models for studying gene function, and disease mechanisms. Up-to-date six AAV vector-based therapies were approved by European Medicines Agency and Food and Drug Administration, which includes Glybera® for the treatment of lipoprotein lipase deficiency, Luxturna® for inherited retinal dystrophy, Zolgensma® for the treatment of spinal muscular atrophy, Upstaza® for aromatic L-amino acid decarboxylase deficiency, Roctavian® for hemophilia A, and Hemgenix® for hemophilia B [8]. In regard to adipose, such genes were subjected to AAV-mediated delivery as leptin [9,10], BSCL2 [11], BMP7 [12], FGF21[13], TrkB.FL[14], and evaluated for the treatment of metabolic disorders in vivo.
We decided to perform comparative analysis of recombinant AAV vectors in order to provide valuable insights into their differential transduction efficiencies and preadipocyte-specific targeting. We chose AAV8 and AAV9 for their known ability to transduce the cells of adipose in vivo [15]. Both for AAV5 [16] and AAV6 [17] it was previously reported the ability to transduce the cells of mesenchymal origin.
We propose to use AAVs for gene delivery to adipose tissue cells. Therefore, we decided to utilize a preadipocyte cell model (3T3-L1) in order to evaluate the effects of gene delivery during adipogenesis. The 3T3-L1 cell line is the most investigated model of adipocyte differentiation, widely used for cell-based assays, and obesity and insulin resistance-related studies due to its adipogenic capacity [18]. However, it was revealed that AAV transduction capacity for in vitro and in/ex vivo applications differ significantly [19]. Further, it is known that there is a great difference between different mammal species in AAV tissue tropism [20]. Nonetheless, 3T3-L1 remains the most used model for the study of metabolic processes in adipose tissue. Here we show that transduction capacity of adeno-associated virus serotypes in 3T3-L1 cell line represents viral tropism of recombinant AAV in vivo.
2. Results
Production of Recombinant AAV5-GFP, AAV6-GFP, AAV8-GFP, and AAV9-GFP
Production of high-quality recombinant viruses and purification procedures constitute an initial step in the study (the process of recombinant AAV production is shown in Figure 1). In brief, transfection of suspension HEK293 cell culture with three plasmids (pAAV-CMV-GFP, pHelper, and corresponding pRC) resulted in rAAV production. Five days after transfection cells were lysed, and the resulting cell lysates containing rAAV particles were subjected to concentration by tangential flow filtration. The concentrated virus was purified by chromatography using CaptureSelect AAVX affinity resin. Further ultrafiltration was performed to exchange buffer and remove excess salt.
The produced rAAV samples were analyzed by means of dynamic light scattering (DLS). The results of the dynamic light scattering analysis (Supplementary Data) demonstrated the presence of AAV5-GFP, AAV6-GFP, AAV8-GFP, and AAV9-GFP particles with hydrodynamic diameters of 26.92 nm, 32.08 nm, 27.49 nm, and 26.62 nm at a concentration of 1.39×10¹², 3.2×10¹³, 2.38×10¹³, and 4.51×10¹², respectively. The average volume fraction of particles was 99.99%.
Genomic titers of the four rAAV serotypes were determined in the range of 1×10¹¹–1×10¹³ VG/mL (viral genomes per liter of culture), as determined by RT-qPCR. Total viral particle concentrations were 4.6×10¹¹ (AAV5-GFP), 1.64×10¹¹ (AAV6-GFP), 6.98×10¹² (AAV8-GFP), and 1.57×10¹² (AAV9-GFP) VG/mL.
Fluorescence Intensity In AAV6-Transduced 3T3-L1 Cells Is Significantly Higher In Comparison With AAV5,8 And 9 Serotypes
Transduction of 3T3-L1 cell line with AAV2/5, AAV2/6, AAV2/8, and AAV2/9 at four concentrations: 2-, 4-, 8-, and 16-×104 VG/cell demonstrated a dose-dependent increase in GFP fluorescence for all serotypes and for AAV6 in particular (Figure 2a). AAV6 demonstrated much higher GFP fluorescence at all high doses (8 and 16×104 VG/cell) at all time points. However, at low doses (2 and 4×10⁴ VG/cell), AAV6 shows similar transduction efficiency to AAV5 and AAV8 (Figure 2b, c). AAV8 is second in transduction efficiency only at a concentration of 16×104 VG/cell. At lower viral concentrations, AAV8 and AAV5 show the same transduction activity. Notably, AAV9 showed the lowest transduction efficiency among the serotypes tested at all dosages (Figure 2c). Visually distinguishable GFP positive cells on a fluorescent microscope can only be detected at a concentration of AAV9 of not less than 8×10⁴ VG/cell.
Flow Cytometry Demonstrates the Outperformance of AAV6-GFP
Four days after transduction, the number of GFP-positive cells was assessed by flow cytometry (Figure 3). Untreated 3T3-L1 cells were used as a negative control (see Figure 3a - the strategy of gating presented). After transduction with AAVs at the lowest concentrations (2×10⁴ VG/cell), the differences observed in fluorescence intensity between cells transduced with different serotypes were statistically not significant, which is consistent with the GFP fluorescence intensity detected with Incucyte. We noticed that, as a result of AAV6 transduction, the fluorescence intensity changed in a different manner compared to other evaluated AAV serotypes. In particular, the transduction efficiency of AAV6-GFP arose drastically at concentrations higher than 4×10⁴ VG/cell in contrast to the rest of the samples (Figure 3b). At a concentration of 4 × 10⁴ VG/cell, a significant difference in the number of GFP+ cells was observed between AAV6 and AAV8 (p-value < 0.0001), AAV5 and AAV9 (p-value < 0.0001), AAV8, and AAV9 (p-value < 0.0001). Moreover, AAV9 had the lowest transduction efficiency among the AAV serotypes tested. At 8- and 16×104 VG/cell AAV6 showed better performance with a significant difference (p-value < 0.0001) compared to other serotypes. AAV8 and AAV5 to AAV6 in terms of transduction activity (Figure 3c).
GFP Fluorescence Intensity Peaks 15 Days After Transduction For All Four Serotypes
To determine the period during which different AAV serotypes were able to maintain transgene expression, GFP fluorescence intensity was measured for a month after transduction. The fluorescence intensity reached its maximum 15 to 20 days after transduction. The pattern of fluorescence change was similar for all the AAV serotypes tested. After 25 days, there was a notable decrease in GFP fluorescence intensity, which could have possibly happened both due to cell death and due to GFP bleaching (Figure 4a). The level of GFP fluorescence as a result of AAV6 transduction of 3T3-L1 cells throughout the course of analysis at four viral concentrations was 2–6 times higher than that of serotype AAV5, 2–4 times higher than that of serotype AAV8, and 4–50 times higher than that of AAV9 (Figure 4b). Moreover, the difference in GFP fluorescence intensity was maximal in the period of 4 days after transduction and further decreased or insignificantly changed.
Induction of 3T3-L1 Adipogenic Differentiation After Transduction
The induction of 3T3-L1 differentiation in adipocytes alters their phenotype, i.e., not only morphology but presence of receptors on the surface. Thus, the differentiation can change AAV tropism, and subsequently transgene expression levels. To assess this effect, we induced differentiation with IBMX-DEX-INS solution one day after AAV transduction. AAV6 has the highest transducing activity (Figure 5). GFP fluorescence intensity peaks 10 days after transduction, which is 5 to 10 days less in the case of no differentiation.
AAV6 serotype has higher transduction capacity in differentiated 3T3-L1 cells compared with AAV5, AAV8 and AAV9
To study the ability of AAV to transduce differentiated preadipocytes, 3T3-L1 cells were differentiated with IBMX-DEX-INS cocktail before transduction. The AAV transduction efficiency of differentiated 3T3-L1 cells was found to be significantly lower than that of preadipocytes. AAV9 is practically unable to transduce 3T3-L1 adipocyte-like cells (Figure 6).
AAV6 Serotype Shows a Better Adipose Tissue Transduction Ability In Vivo
Evaluation of AAV tropism in vivo was performed using several known AAV of different serotypes (6,8,9) coding for GFP on C57BL6 mice. In order to estimate the transduction efficiency 100 μl of each recombinant AAV product was injected in adipose tissue of inguinal region. One week after injection adipose tissue was subjected to postmortal manipulations: samples were extracted for both confocal microcopy and RNA analysis. For PCR analysis 50 mg of adipose was used for RNA extraction. Results of PCR analysis presented at Figure 7. Sample of adipose extracted from AAV9-injected mice were used as a reference due to the lowest Ct value. We see the four-fold increase in relative expression of GFP in adipose of AAV8-injected mice, which had no statistical significance. Instead, in sample AAV2/6-injected mice there was 65-fold increase in relative expression of GFP compared to AAV2/9 and 16-fold to AAV2/8 increased, which was statistically significant. These results strictly confirm the data we earlier obtained in vitro in 3T3-L1 cell line.
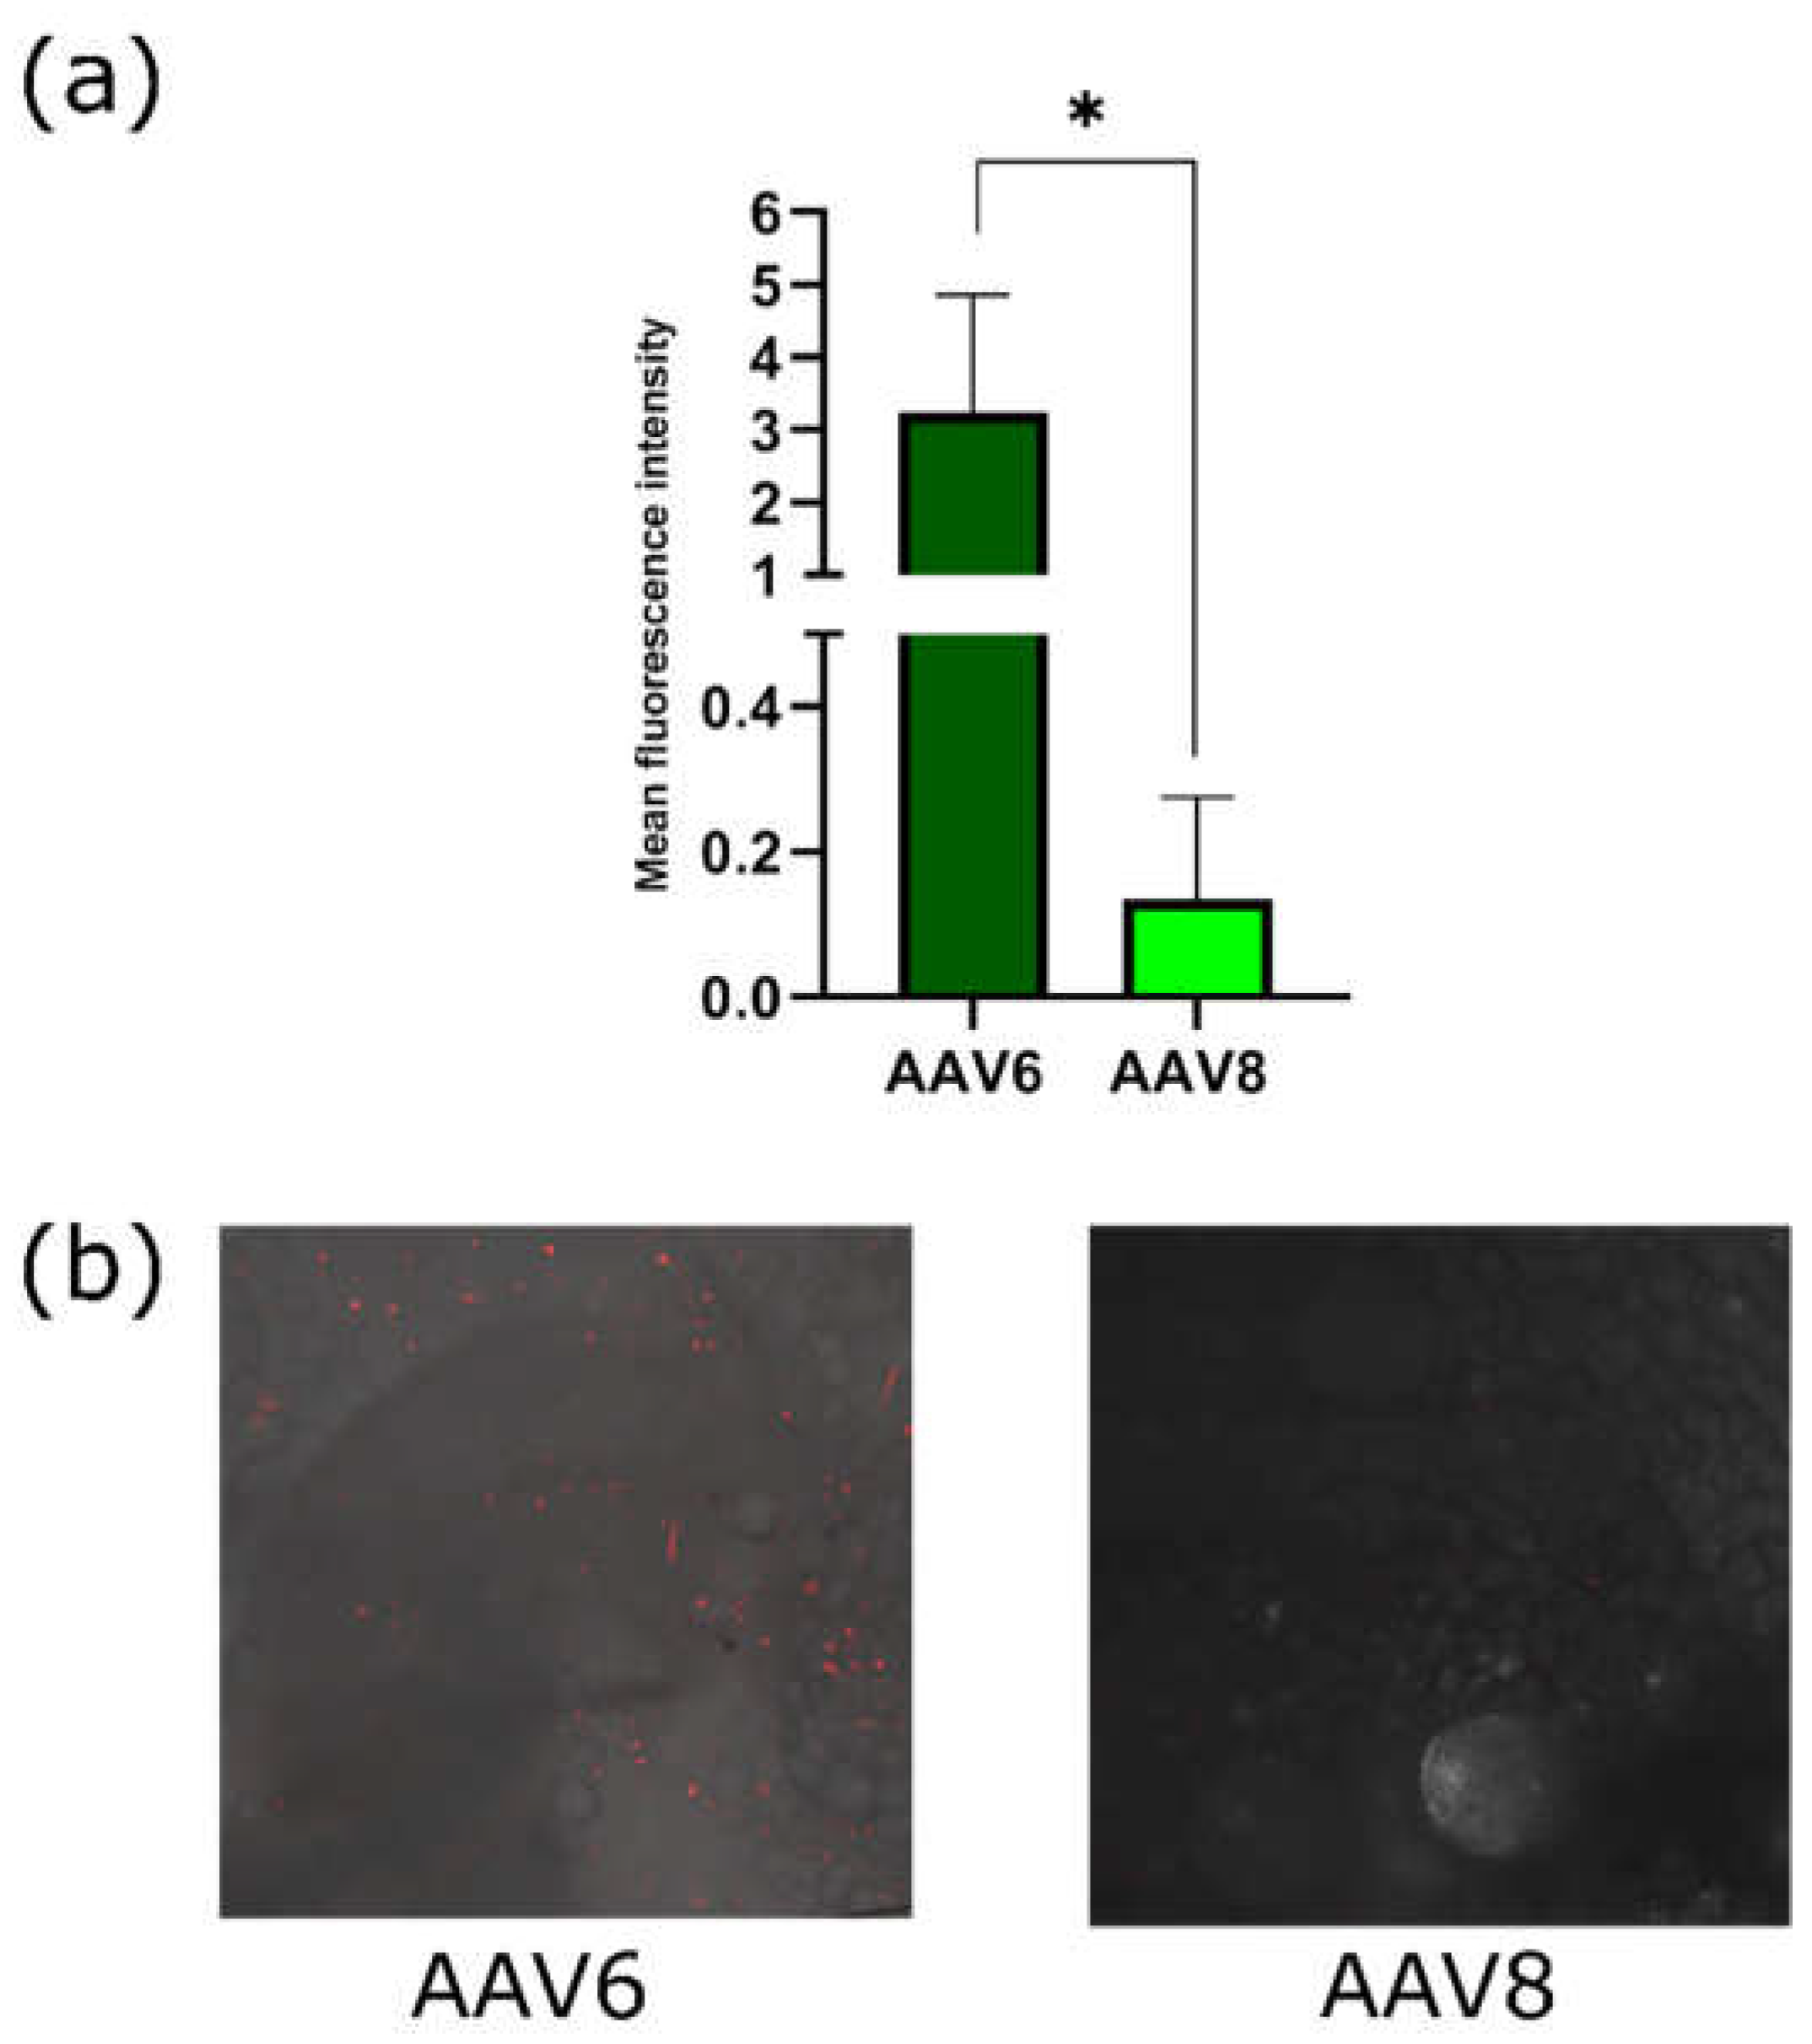
To assess the transduction capacity of AAV6 and AAV8 on brown adipose tissue in vivo, 100 μl (5 × 10¹¹ VG) of recombinant AAV6 and AAV8 coding for fluorescent protein Katushka2S under brown adipose-specific Ucp1 promoter were injected into the interscapular region of C57BL6 mice. Interscapular adipose was extracted one week after viral vectors administration. Katushka2S fluorescence intensities were analyzed using confocal microscopy (Figure 8). Mean fluorescence intensity of AAV2/6-injected adipose samples was more than 10 times higher in comparison with AAV2/8-injected adipose which indicates of a higher tropism of AAV6 to brown adipose tissue.
3. Discussion
Virus capsids are substantial for AAV-mediated gene transfer, since they determine the host cell tropism, immunogenicity, and transduction efficiency. Different AAV serotypes have been identified by the transduction efficiency attributed to the capsid [21]. As capsid is a primary interface between the host and the vector, its features play a crucial role in various stages of the gene transfer process: binding to receptors, internalization and trafficking within the cell [22].
Among natural serotypes isolated many of which exhibit unique patterns of tissue tropism, transduction capabilities of several vectors were noticed. The comparative analysis of recombinant AAV vectors has provided valuable insights into their differential transduction efficiencies and tissue-specific targeting.
Intriguingly, several studies highlighted the superiority of AAV6 serotype for the cells of mesodermal origin. Identification of the receptors on the target cells that mediate cellular tropism effects [23] demonstrated that high transduction efficacy of AAV6 for the skeletal and cardiac tissue compared to AAV8 and AAV9 is due to the involvement of α2,3- or α2,6-linked sialic acid receptor for the cellular entry. The AAV6 uses α2,3- or α2,6-linked sialic acid receptor whereas AAV8 and AAV9 use laminin receptors. It was also discovered that α2–6sialylation is present on a surface of adipose-derived mesenchymal stem cells, and may serve as a marker of their differentiation potential [24].
We use AAVs for transduction of adipose tissue cells, and we aimed to choose a relevant cell model to evaluate the effects of gene therapy on adipogenesis. Therefore, we focused on the efficacy of transduction of AAV5, AAV6, AAV8 and AAV9 in widely utilized murine preadipocyte cell line 3T3-L1. Here we evaluated the efficacy of transduction of AAV 2/5, 2/6, 2/8, 2/9 expressing GFP in 3T3-L1 murine preadipocyte cells by live imaging microscopy using IncuCyte S3 and flow cytometry. Since all the AAV vectors used in this study share the same AAV2 ITR, then observed differences in transduction efficiency of AAV serotypes for 3T3-L1 murine preadipocyte cells can be attributed to the difference in capsid proteins.
Three transduction modes were assessed: AAVs transduction in 3T3-L1 preadipocyte cells with or without further differentiation into mature adipocytes and transduction in differentiated 3T3-L1 adipocyte cells. The differentiation of 3T3-L1 was induced by adipogenic IBMX-DEX-INS cocktail. AAV2/6 demonstrated the superior transduction efficiency in 3T3-L1 preadipocytes in the range of viral concentration from 2×10⁴ to 16×104 VG/cell (Figure 1). AAV2/6 demonstrated the highest transduction efficiency in 3T3-L1 preadipocytes, as it was 1.5–2-fold more effective than AAV2/5 and AAV2/8 in the range of viral concentration from 2×10⁴ to 8×10⁴ VG/cell. AAV2/8 showed the better transduction efficiency than AAV2/5 at high dosage (8 and 16×104 VG/cell) and similar efficiency at lower dosage. The different levels of GFP fluorescence at low and high doses between serotypes AAV5, AAV6, and AAV8 can be explained by the difference in receptors that mediate entry into host cells. For AAV5, the primary receptor is N-linked sialic acids, and the co-receptor is platelet-derived growth factor receptor (PDGFR) [25]. For AAV6, in addition to the N-linked sialic acid, heparan sulfate and proteoglycans serve as primary receptors, and the list of co-receptors includes GPR108 and EGFR. The presence of the primary and co-receptors at the surface determines the level of saturation for different AAV serotypes, for each it is unique. Theoretically, after saturation will be no further increase in transduction efficacy.
Despite the fact that previously AAV8 [26] was used for gene delivery in 3T3-L1 preadipocyte cell line, our study shows that AAV2/6 is effective in 3T3-L1 preadipocyte cells. We showed that the transduction efficiency of AAV6 was pronounced in comparison with AAV5, AAV8 and AAV9. AAV2/5 and AAV2/8 showed the lower transduction efficiency similar to each other.
Ensuring prolonged transgene expression is one of the main objectives of gene therapy. Thus, the aim of our study was also to evaluate the duration of transgene expression in 3T3-L1 preadipocytes and adipocytes after differentiation. We demonstrated that expression of GFP under the control of CMV promoter remained stable for up to 20 days in preadipocytes for all tested AAV serotypes. In differentiated 3T3-L1 cells, GFP fluorescence reached a plateau 15 days after transduction. The induction of 3T3-L1 differentiation in three days after AAVs transduction did not alter much the GFP expression level, and AAV2/6 showed the highest transduction efficiency. However, without differentiation, the GFP fluorescence level reaches a maximum on day 20 after transduction, whereas after induction of differentiation – on day 10, followed by a decline in fluorescence level. In this way, adipogenesis affects the duration of AAV-mediated transgene expression.
To confirm the tissue tropism of AAV2/6 we performed a series of in vivo studies on C57BL6 mice. We observed a greater transduction ability of AAV2/6 that was confirmed by quantitative PCR and confocal microscopy for inguinal adipose tissue, and by confocal microscopy for interscapular adipose.
AAV2/6 demonstrated ability to transduce mature adipocytes. Thus, AAV2/6 compared to AAV2/5 and AAV2/8 demonstrated the higher transduction efficacy in 3T3-L1 preadipocytes and mature adipocytes, which proved its usability along with AAV8 and AAV9 for gene delivery to adipocytes.
4. Materials and Methods
HEK293 Suspension Culture
Suspension cell cultures were grown on a BalanCD HEK293 animal component-free chemically-defined medium (Irvine Scientific, Santa Ana, Califormia) in a cell concentration range between 1×10⁵ and 3×10⁶ cells/ml. HEK293 cells were cultured in plastic Erlenmeyer flasks (Corning, Corning, NY) inside the INFORS HT Multitron orbital shaker-incubator (INFORS, Bottmingen, Switzerland) at +37 °C, 5% CO2, 80% humidity, 100 rpm. Cells were passaged twice a week by addition of fresh medium to reach 1×10⁵ cells/ml. Alternatively, suspension cell cultures were passaged by centrifugation with subsequent resuspension in order to remove waste products.
Adeno-Associated Virus Production
Adeno-associated viral vectors (AAVs) were produced by transfection of suspension HEK293 cells. Suspension cell cultures were grown up to concentration 1×10⁶ cells/ml. Transfection was performed using PEI (Linear, MW 40,000, Polysciences Inc., Warrington, PA, USA) and DNA plasmid vectors (pDNA): pAAV-CMV-GFP and pAAV-UCP1-Katushka2S coding for Katushka2S, pHelper, and corresponding pRC vector. After sequential addition of plasmids and into centrifuge tube, the solution of PEI 1 μg/ml was prepared in a mass ratio of pDNA:PEI 1:5. After this preparation components were diluted by a serum-free medium (either Opti-MEM or DMEM, Invitrogen, Carlsbad, CA, USA), and the contents of the tubes were mixed by pipetting and kept at room temperature for 10 minutes. For transfection, a prepared mixture with a concentration of plasmids 1.5 μg per million cells was added to Erlenmeyer flasks. Previously prepared transfection mixtures were added directly into the flasks using a single-channel dispenser. After this, the flasks were transferred to an incubator for cultivation and kept at 37.0 °C, humidity 70%, CO2 content 5%, stirring 120 rpm. RepCap vectors (pRC) contained the same Rep but different Cap sequences coding for AAV5 (pAAV-RC2/5), AAV6 (pAAV-RC2/6), AAV8 (pAAV-RC2/8), and AAV9 (pAAV-RC2/9) capsid proteins for the packaging of different recombinant AAV serotypes.
After 120 hours past transfection chemical lysis of the cell suspension was carried out using 10% Tween 20 for 1 hours at 37 °C and stirring 130 rpm. After chemical lysis enzymatic treatment with Serratia marcescens endonuclease was performed in order to hydrolyze free nucleic acids. The resulting lysates were clarified by adding diatomaceous earth (0.01 g/ml of Celite HyFlo Super Cel, Roth), mixing for 5 minutes at 37 °C and 330 rpm, followed by sterilizing filtration of the lysates through a filter with a pore diameter of 0.22 μm. Tangential filtration of the clarified lysates of AAV5-, AAV6-, AAV8- and AAV9-GFP was performed using VivaFlow200 tangential filtration system (Sartorius, Bohemia, NY, USA). Chromatographic purification was carried out using the CaptureSelect POROS AAVX affinity resin (ThermoFischer Scientific, Waltham, MA, USA) with Bio-Rad Quest 10 Plus system. Finally, recombinant AAV vectors were concentrated to a volume of 1 mL through dialysis in a 1x phosphate-buffered saline (PBS) (0.37 M NaCl) using Vivaspin 20 ultrafiltration units (Sartorius, Bohemia, NY, USA), and 0.001% Pluronic F-68 was added (Sigma-Aldrich, Gillingham, UK)
Determination of titer for AAV genomes (RT-qPCR)
Genomic titers of rAAV serotypes were determined by quantitative PCR (qPCR). The Biomaster HS-qPCR-Hi-ROX mix (Biolabmix LLC, MHR020-2040, Novosibirsk, Russia) contained ITR sequence-specific forward (5′-GGAACCCCTAGTGATGGAGTT-3′) and reverse (5′-CGGCCTCAGTGAGCGA-3′) primers and a fluorescent probe (5′-FAM-CACTCCCTCTCTGCGCGCTCG-BHQ1-3′). The components were mixed at the following ratio: 7.5 μL of Biomaster HS-qPCR-Hi-ROX mix, 1 μL H2O, 50 μM each oligonucleotide, and 5 μL DNA. Prior to analysis, the samples containing rAAV were treated with DNase I (Biolabmix LLC, EM-250) according to the manufacturer’s instructions, mixing 2 μL of the sample with two units of DNase I and a one-time buffer (100 mM Tris-HCl (pH 7.0), 30 mM MgCl2, 30 mM CaCl2) in a final volume of 20 μL, followed by a 30 min incubation at +37 ◦C and enzyme inactivation for 15 min at +55 °C to remove non-viral DNA. Next, 20 μL of Proteinase K diluted to a concentration of 0.1 U/μL was added to the sample and incubated for 1 h at +55 °C following enzyme inactivation at +95 °C for 5 min. The resulting DNA preparation was used for qPCR analysis using a standard curve. A linearized pAAV-GFP plasmid was used to construct the standard curve. A series of serial dilutions were made starting with 1.8 ng/μL (corresponding to 0.2 × 10⁸ gene copies/μL) in 10-fold increments down to 0.02 fg/μL (corresponding to 0.2 × 10⁴ gene copies/μL), the lower limit of detectable concentrations. PCR analysis was carried out using a StepOnePlus device (Thermo Scientific,Waltham, MA, USA) using the Quantification-Standard Curve application of StepOneSoftWare V2.3 software. The standard curve was considered reliable if the coefficient of determination (R2) exceeded 0.99 and the reaction efficiency was in the range of 85 to 100%. Reliable concentration measurements were made in the range from the seventh to the twenty-fifth cycle, which corresponds to intermediate and boundary points of the standard curve in the range of determined concentrations.
Sample Analysis Using Dynamic Light Scattering (DLS)
Dynamic light scattering (DLS) is a non-contact method that applies the light scattering effect and is designed to measure the size of nano- and submicron particles of a dispersed phase that have Brownian motion. The DLS method possesses an advantage over other optical methods by allowing the sample to be measured in its native form. The samples were measured at +25 °C on a Zetasizer Ultra (Malvern Panalytical Ltd., Malvern, UK) analyzer equipped with a He-Ne laser with a wavelength of 633 nm and a maximum power of 10 mW. The multi-angle light scattering method, based on the sequential capture of the analytical signal from three detection angles of scattered radiation, allowed for the estimation of the hydrodynamic diameter, the modality of particle distribution, and the fractional ratios. The small-volume quartz cuvette (Malvern Panalytical Ltd., Malvern, UK) was used for measurements. The data were processed using ZS XPLORER software v3.1.0 (Malvern Panalytical Ltd., Malvern, UK).
3. T3-L1 Сell Culture
Cells were grown on Dulbecco’s modification of Eagle’s medium (DMEM high glucose, 4.5 g/L, Paneco, Moscow, Russia) with addition of 10% bovine calf serum (NBCS New Zealand origin, Gibco) and 2 mM L-glutamine (Paneco). 3T3-L1 cells were seeded onto cell culture treated plastic dishes, and incubated at 37°C in a humid modified atmosphere (95% air, 5% CO2). Cells were passaged once a week until reaching approximately 70% confluence, and the medium (DMEM+10%BCS) was replaced every 3 days. For 3T3-L1 is important to avoid cell-to-cell contact unless required by the experimental conditions.
AAV Transduction
After seeding the cells into a 48-well culture plate for flow cytometry analysis and a 24-well for analysis in a IncuCyte S3, the volume of viral eluate required was calculated (based on the cell number, in a range from 10,000 to 300,000 viral genomes per cell). Thus, to transduce 100,000 cells with 40,000 viral genomes per cell 4*109 viral genomes were introduced into a well. The required volume of viral eluate was added immediately after seeding unless required by the experimental conditions. 3T3-L1 cell line was transduced in DMEM high glucose with 10% CSS.
Induction of Adipogenic Differentiation
Cells were cultured up to 100% confluence in the DMEM+10%BCS medium, and differentiation was induced 48 hours after reaching confluency. To induce differentiation the medium was replaced by DMEM medium with 10% fetal bovine serum (FBS South American origin, Gibco) and with the addition of 0.5 mM isobutymethylxanthine (Sigma), 1 μM dexamethasone (Sigma), 5 μg/ml insulin (Paneco), mentioned as IBMX-DEX-INS. After 48 hours of induction, the cells were cultured in DMEM with 10% FBS and 1 μg/ml insulin (adipocyte maintenance medium); the medium was replaced every 2 days.
Flow Cytometry
Ninety-six hours post-transduction, the number of GFP-positive cells was analysed by flow cytometry. Briefly, the cells were trypsinized, washed twice with 500 μL PBS, and resuspended in 250 μL chilled FACS buffer (1 × PBS, 2% FBS, 1 mM EDTA). The data was recorded on the CytoFLEX B2-R2-V0 flow cytometer (Indianapolis, IN, USA) using CytExpert software v1.2 gating on single FITC-positive live cells. The analysis of median fluorescent intensity (MFI) values of GFP-positive populations was carried out using FlowJo™ v10 software.
RNA Extraction and Reverse Transcription
RNA extraction was done with Lira+ kit (LRP-100-3, Biolabmix, Novosibirsk, Russia) and reverse transcription was done with RT-M-MuLV-RH kit (R01-250, Biolabmix, Novosibirsk, Russia). 1 μg of total RNA and 3 μl random hexa primer diluted in deionized nuclease free water up to 18 μl was used for primer annealing. On the first stage mixture was heated at 70 °C in 3 minutes and thaw on ice for melting of RNA second structures and primer annealing. On the second stage 12 μl of reservation mix (6 μl of 5хKCl buffer, 3 μl of DTT, 1.5 μl 20x dNTP, 1.5 M-MuLV revertase) was added to RNA prepared samples. Final mixture was incubated 10 minutes at 25° C, 60 minutes at 42 °C, 10 minutes at 70 °C in T100 Thermal Cycler (1861096, BioRad, USA).
Gene Expression Analysis
For gene expression RT-PCR analysis were used following components: HS-qPCR SYBR Blue kit (MHC030-2040, Biolabmix, Novosibirsk, Russia), primers for PPIA (Forward: CATTATGGCGTGTAAAGTCAC, Reverse: CAGACAAAGTTCCAAAGACAG) GFP (Forward: AAGCTGACCCTGAAGTTCATC, Reverse: CAGGACCATGTGATCGCG) and prepared cDNA samples. cDNA concertation was normalized by similar values PPIA threshold cycles. PCR mix was done with 10 ng of cDNA per reaction, 10 μl of 2x HS-qPCR SYBR Blue premix, 0.25 pmole of primers per one reaction and deionized nuclease free water added up to 20 μl. 2 step PCR reaction was ran with following stages: 5 minutes preheating, 40 cycles of 10 seconds denaturation and 30 seconds annealing combined with elongation and final melt-curve stage analysis of reaction products. RT-PCR analysis was done with StepOnePlus real-time PCR system (437659, Thermo Scientific, USA) and 2ddCt relative expression measurement mode of in the StepOneSoftWare V2.3 software. One-way statistic ANOVA analysis was performed with GraphPad Prism 9.3.1.
Statistical Analysis
Statistical analysis of the normal distribution of samples and the confidence interval of differences for rejection of the null hypothesis was performed using GraphPad Prism 8.2.1 software (Shapiro-Wilk test, ordinary one-way ANOVA, Sidak’s multiple comparison test). Results are presented as mean ± standard deviation of 2–3 biological replicates, confidence interval: level of difference is significant (**)–p-val < 0.01, (***) p-val < 0.001, (****) p-val < 0.0001, not significant (ns)–p > 0.05.
Live Imaging Microscopy IncuCyte S3
Live imaging was performed using the IncuCyte S3 system (Sartorius) in the bright field and GFP channels (300 ms exposure time), taking images every 2 h for 4 days. The intensity of GFP expression was presented as Total Green Objects Area (μm2
/image) (TGOA) values. In longitudal experiments with differentiation images were taken every 2 days (48 hours).
After transduction, the culture plate was transferred to the IncuCyte S3 system for intravital cell analysis. The system has selected the scan type according to schedule (Scan on schedule). In the Create or Restore Vessel field, the corresponding type of vessel used (in our case, a 48-well plate manufactured by Eppendorf) and imaging channels (Brightfield and Green). In the Vessel Location field, the position in the system corresponding to the position of the scanned tablet was selected. In the Scan Pattern field, the wells of the plate to be analyzed and the number of microphotographs for each well of the plate (9) were selected. In the Vessel Notebook field, the name of the experiment in the system, as well as the cell type, was entered. In the Analysis Setup field, the following settings are selected: Basic Analyzer, GFP per cell. In the Scan Schedule field, a scanning schedule was generated for the analyzed wells of the plate.
Confocal Microscopy
Confocal fluorescence images were obtained using an inverted point scanning confocal microscope (LSM 980 Airyscan based on Axio Observer 7, Carl Zeiss Microscopy GmbH, Jena, Germany) equipped with a motorized piezo stage through a 10× objective lens (EC Plan-Neofluar, numerical aperture 0.3, Carl Zeiss Microscopy GmbH, Jena, Germany). Images were obtained in Airyscan mode. GFP was excited by a 488 nm laser diode (maximum power: 13 mW; AOTF transmission was set to 0.9%). Emission light was passed through the emission filter of the Airyscan (495–550 nm). Detector gain was set to 850 V. Confocal scan zoom was set to 2×, and image size was set to 1045 × 1045 pixels. The image parameters were set as follows: pixel dwell time, 1,96 micro s (scan speed 6); pixel size, dx = dy = 0.39 µm. Raw Airyscan images were processed by the Airyscan processing algorithm (processing strength 3,9). Images were obtained using Zen software (version Zen Blue 3.2, Carl Zeiss Microscopy GmbH, Jena, Germany).
5. Conclusions
AAV2/6 compared to AAV2/5, AAV2/8 and AAV2/9 demonstrated the higher transduction efficacy both in vitro in 3T3-L1 preadipocytes and mature adipocytes. For in vivo study in adipose tissue of C57BL6 mice we injected AAV2/6, AAV2/8 and AAV2/9 of C57BL6 mice, and evaluation has proved the higher transduction capacity of AAV2/6 and its usability along with AAV2/8 and AAV2/9 for gene delivery to adipose tissue. Taking into account the differences in tissue tropism of different AAV serotypes, we recommend the use of AAV2/6 for in vitro and in vivo applications, as well as targeted gene delivery to both preadipocytes and adipocytes.
Author Contributions
S.B.: investigation, cell culture work, experimental design, data curation, writing, original draft preparation, preparation of figures; A.A.: investigation, cell culture work; V.L. confocal microscopy and data curation; A.B.: investigation, flow cytometry, quantitative PCR; A.E.: conceptualization, investigation, preparation of figures, project administration, supervision, methodology, manuscript writing, editing.
Funding
This research was funded by the Russian Science Foundation and Kuban Science Foundation (project no. 22-14-20046).
Institutional Review Board Statement
The experiments involving mice were approved by institutional ethics committee.
Informed Consent Statement
Not applicable.
Data Availability Statement
We encourage all authors of articles published in MDPI journals to share their research data. In this section, please provide details regarding where data supporting reported results can be found, including links to publicly archived datasets analyzed or generated during the study. Where no new data were created, or where data is unavailable due to privacy or ethical restrictions, a statement is still required. Suggested Data Availability Statements are available in section “MDPI Research Data Policies” at https://www.mdpi.com/ethics.
Acknowledgments
Authors gratefully acknowledge technical support of Elena Sahibgaraeva (DLS) and Dzerassa Gurtsieva (data analysis), and kind assistance of Nizami Gasanov. We thank Anna Ryzhova and Marina Predeina for administrative support, and Alexander Karabelsky for friendly endorsement.
Conflicts of Interest
The authors declare no conflicts of interest
References
- Lopez-Jimenez, F.; Almahmeed, W.; Bays, H.; Cuevas, A.; Di Angelantonio, E.; le Roux, C.W.; Sattar, N.; Sun, M.C.; Wittert, G.; Pinto, F.J.; et al. Obesity and Cardiovascular Disease: Mechanistic Insights and Management Strategies. A Joint Position Paper by the World Heart Federation and World Obesity Federation. Eur J Prev Cardiol 2022, 29, 2218–2237. [Google Scholar] [CrossRef] [PubMed]
- Jo, J.; Gavrilova, O.; Pack, S.; Jou, W.; Mullen, S.; Sumner, A.E.; Cushman, S.W.; Periwal, V. Hypertrophy and/or Hyperplasia: Dynamics of Adipose Tissue Growth. PLoS Comput Biol 2009, 5, e1000324. [Google Scholar] [CrossRef] [PubMed]
- Smethers, A.D.; Rolls, B.J. Dietary Management of Obesity. Medical Clinics of North America 2018, 102, 107–124. [Google Scholar] [CrossRef] [PubMed]
- Roomy, M. Al; Hussain, K.; Behbehani, H.M.; Abu-Farha, J.; Al-Harris, R.; Ambi, A.M.; Abdalla, M.A.; Al-Mulla, F.; Abu-Farha, M.; Abubaker, J. Therapeutic Advances in Obesity Management: An Overview of the Therapeutic Interventions. Front Endocrinol (Lausanne) 2024, 15. [Google Scholar] [CrossRef] [PubMed]
- Ryan, D.H.; Lingvay, I.; Deanfield, J.; Kahn, S.E.; Barros, E.; Burguera, B.; Colhoun, H.M.; Cercato, C.; Dicker, D.; Horn, D.B.; et al. Long-Term Weight Loss Effects of Semaglutide in Obesity without Diabetes in the SELECT Trial. Nat Med 2024. [Google Scholar] [CrossRef] [PubMed]
- Machado, S.A.; Pasquarelli-do-Nascimento, G.; da Silva, D.S.; Farias, G.R.; de Oliveira Santos, I.; Baptista, L.B.; Magalhães, K.G. Browning of the White Adipose Tissue Regulation: New Insights into Nutritional and Metabolic Relevance in Health and Diseases. Nutr Metab (Lond) 2022, 19, 61. [Google Scholar] [CrossRef] [PubMed]
- Bates, R.; Huang, W.; Cao, L. Adipose Tissue: An Emerging Target for Adeno-Associated Viral Vectors. Mol Ther Methods Clin Dev 2020, 19, 236–249. [Google Scholar] [CrossRef] [PubMed]
- Minskaia, E.; Galieva, A.; Egorov, A.D.; Ivanov, R.; Karabelsky, A. Viral Vectors in Gene Replacement Therapy. Biochemistry (Moscow) 2023, 88, 2157–2178. [Google Scholar] [CrossRef] [PubMed]
- O’Neill, S.M.; Hinkle, C.; Chen, S.-J.; Sandhu, A.; Hovhannisyan, R.; Stephan, S.; Lagor, W.R.; Ahima, R.S.; Johnston, J.C.; Reilly, M.P. Targeting Adipose Tissue via Systemic Gene Therapy. Gene Ther 2014, 21, 653–661. [Google Scholar] [CrossRef]
- Huang, W.; Liu, X.; Queen, N.J.; Cao, L. Targeting Visceral Fat by Intraperitoneal Delivery of Novel AAV Serotype Vector Restricting Off-Target Transduction in Liver. Mol Ther Methods Clin Dev 2017, 6, 68–78. [Google Scholar] [CrossRef] [PubMed]
- Sommer, N.; Roumane, A.; Han, W.; Delibegović, M.; Rochford, J.J.; Mcilroy, G.D. Gene Therapy Restores Adipose Tissue and Metabolic Health in a Pre-Clinical Mouse Model of Lipodystrophy. Mol Ther Methods Clin Dev 2022, 27, 206–216. [Google Scholar] [CrossRef] [PubMed]
- Casana, E.; Jimenez, V.; Sacristan, V.; Muñoz, S.; Jambrina, C.; Rodó, J.; Garcia, M.; Mallol, C.; León, X.; Franckhauser, S.; et al. BMP7 Overexpression in Adipose Tissue Induces White Adipogenesis and Improves Insulin Sensitivity in Ob/Ob Mice. Int J Obes 2021, 45, 449–460. [Google Scholar] [CrossRef]
- Jimenez, V.; Jambrina, C.; Casana, E.; Sacristan, V.; Muñoz, S.; Darriba, S.; Rodó, J.; Mallol, C.; Garcia, M.; León, X.; et al. FGF21 Gene Therapy as Treatment for Obesity and Insulin Resistance. EMBO Mol Med 2018, 10. [Google Scholar] [CrossRef] [PubMed]
- Anderson, J.M.; Boardman, A.A.; Bates, R.; Zou, X.; Huang, W.; Cao, L. Hypothalamic TrkB.FL Overexpression Improves Metabolic Outcomes in the BTBR Mouse Model of Autism. PLoS One 2023, 18, e0282566. [Google Scholar] [CrossRef] [PubMed]
- Jimenez, V.; Muñoz, S.; Casana, E.; Mallol, C.; Elias, I.; Jambrina, C.; Ribera, A.; Ferre, T.; Franckhauser, S.; Bosch, F. In Vivo Adeno-Associated Viral Vector–Mediated Genetic Engineering of White and Brown Adipose Tissue in Adult Mice. Diabetes 2013, 62, 4012–4022. [Google Scholar] [CrossRef] [PubMed]
- Pasquale, G. Di; Davidson, B.L.; Stein, C.S.; Martins, I.; Scudiero, D.; Monks, A.; Chiorini, J.A. Identification of PDGFR as a Receptor for AAV-5 Transduction. Nat Med 2003, 9, 1306–1312. [Google Scholar] [CrossRef] [PubMed]
- Rezvani, M.; Español-Suñer, R.; Malato, Y.; Dumont, L.; Grimm, A.A.; Kienle, E.; Bindman, J.G.; Wiedtke, E.; Hsu, B.Y.; Naqvi, S.J.; et al. In Vivo Hepatic Reprogramming of Myofibroblasts with AAV Vectors as a Therapeutic Strategy for Liver Fibrosis. Cell Stem Cell 2016, 18, 809–816. [Google Scholar] [CrossRef] [PubMed]
- Ruiz-Ojeda, F.; Rupérez, A.; Gomez-Llorente, C.; Gil, A.; Aguilera, C. Cell Models and Their Application for Studying Adipogenic Differentiation in Relation to Obesity: A Review. Int J Mol Sci 2016, 17, 1040. [Google Scholar] [CrossRef] [PubMed]
- Ellis, B.L.; Hirsch, M.L.; Barker, J.C.; Connelly, J.P.; Steininger, R.J.; Porteus, M.H. A Survey of Ex Vivo/in Vitro Transduction Efficiency of Mammalian Primary Cells and Cell Lines with Nine Natural Adeno-Associated Virus (AAV1-9) and One Engineered Adeno-Associated Virus Serotype. Virol J 2013, 10, 74. [Google Scholar] [CrossRef]
- Huang, Q.; Chan, K.Y.; Tobey, I.G.; Chan, Y.A.; Poterba, T.; Boutros, C.L.; Balazs, A.B.; Daneman, R.; Bloom, J.M.; Seed, C.; et al. Delivering Genes across the Blood-Brain Barrier: LY6A, a Novel Cellular Receptor for AAV-PHP.B Capsids. PLoS One 2019, 14, e0225206. [Google Scholar] [CrossRef] [PubMed]
- Issa, S.S.; Shaimardanova, A.A.; Solovyeva, V. V.; Rizvanov, A.A. Various AAV Serotypes and Their Applications in Gene Therapy: An Overview. Cells 2023, 12, 785. [Google Scholar] [CrossRef]
- Van Vliet, K.M.; Blouin, V.; Brument, N.; Agbandje-McKenna, M.; Snyder, R.O. The Role of the Adeno-Associated Virus Capsid in Gene Transfer. In Methods Mol Biol ; 2008; pp. 51–91.
- Wu, Z.; Miller, E.; Agbandje-McKenna, M.; Samulski, R.J. A2,3 and A2,6 N-Linked Sialic Acids Facilitate Efficient Binding and Transduction by Adeno-Associated Virus Types 1 and 6. J Virol 2006, 80, 9093–9103. [Google Scholar] [CrossRef]
- Tateno, H.; Saito, S.; Hiemori, K.; Kiyoi, K.; Hasehira, K.; Toyoda, M.; Onuma, Y.; Ito, Y.; Akutsu, H.; Hirabayashi, J. A2–6 Sialylation Is a Marker of the Differentiation Potential of Human Mesenchymal Stem Cells. Glycobiology 2016, cww039. [Google Scholar] [CrossRef] [PubMed]
- Pupo, A.; Fernández, A.; Low, S.H.; François, A.; Suárez-Amarán, L.; Samulski, R.J. AAV Vectors: The Rubik’s Cube of Human Gene Therapy. Molecular Therapy 2022, 30, 3515–3541. [Google Scholar] [CrossRef] [PubMed]
- Uhrig-Schmidt, S.; Geiger, M.; Luippold, G.; Birk, G.; Mennerich, D.; Neubauer, H.; Grimm, D.; Wolfrum, C.; Kreuz, S. Gene Delivery to Adipose Tissue Using Transcriptionally Targeted RAAV8 Vectors. PLoS One 2014, 9, e116288. [Google Scholar] [CrossRef]
Figure 1.
Schematic representation of adeno-associated virus production and purification shows the typical process during AAV manufacturing.
Figure 1.
Schematic representation of adeno-associated virus production and purification shows the typical process during AAV manufacturing.
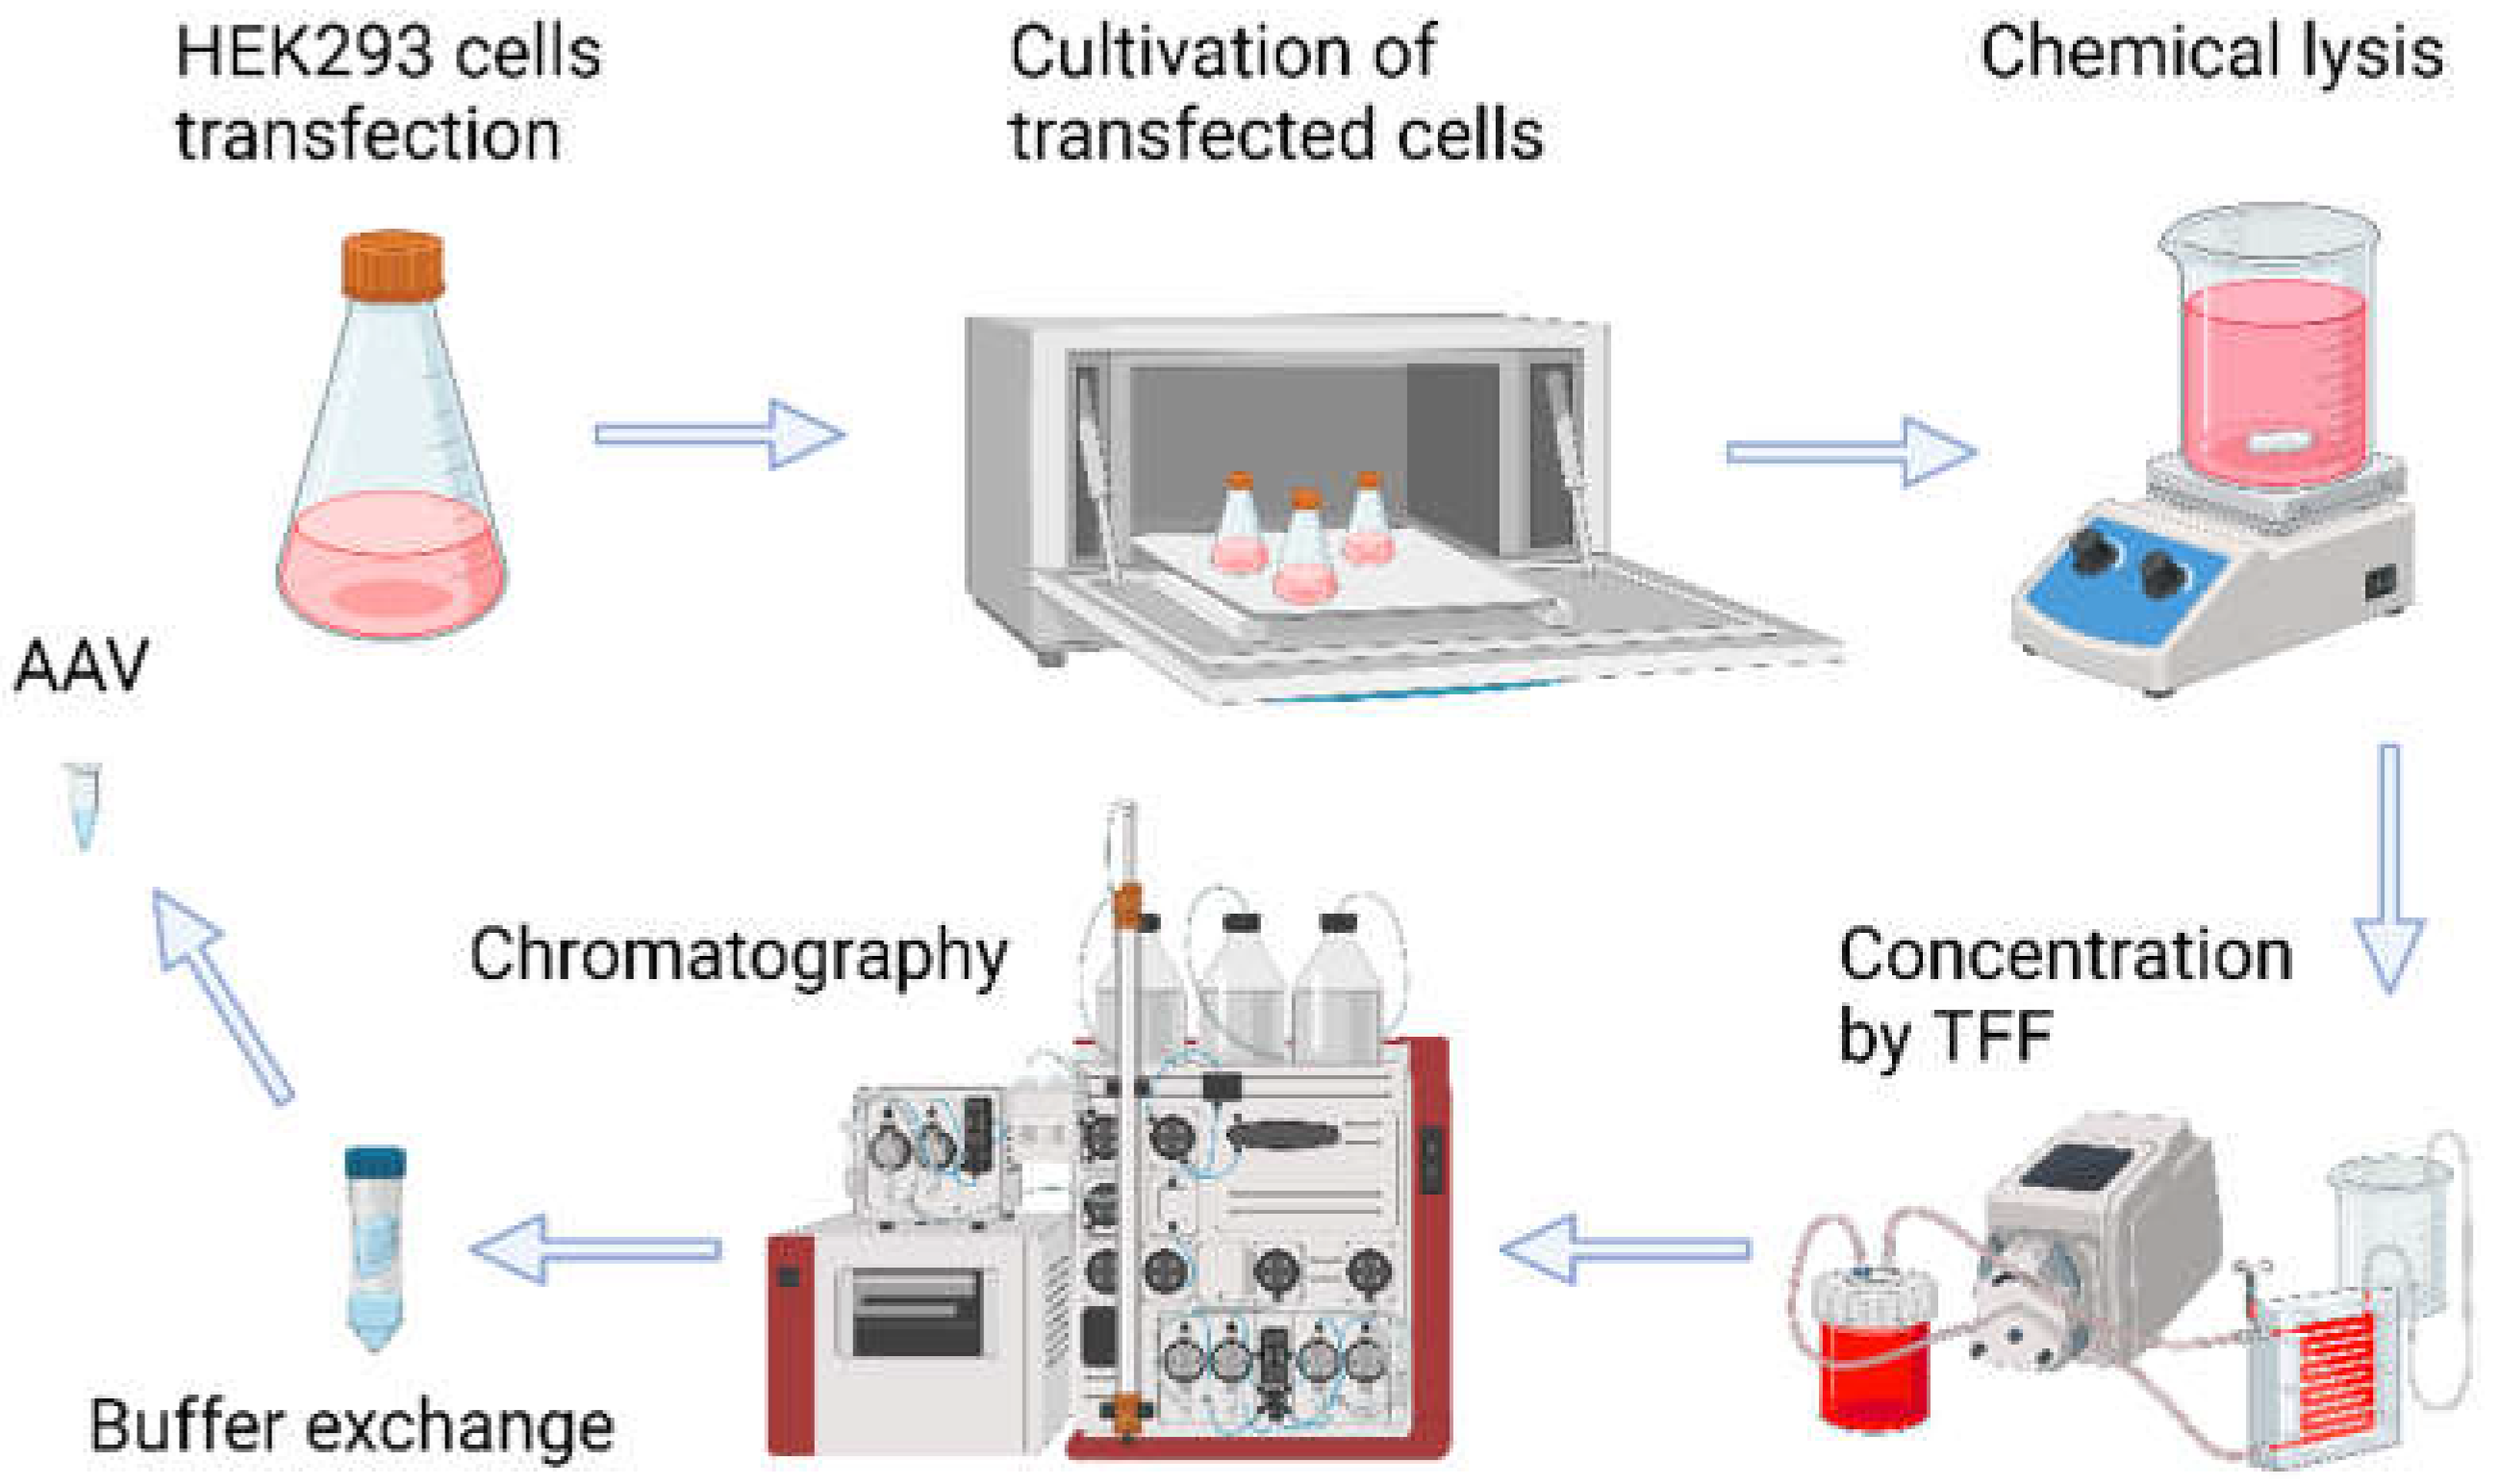
Figure 2.
(a) Dose-dependent GFP fluorescence intensity measured in Total Green Objects Area (TGOA) during the 4-day time course in 3T3-L1 preadipocyte cell teransduced by AAV6 at viral concentrations of 2-, 4-, 8-,16 × 104 VG/cell; (b) GFP fluorescence intensity values at 28 hours after transduction for the four serotypes; (c) comparison of transduction efficiencies by the four serotypes (AAV5, AAV5, AAV8, AAV9) at viral concentrations of 2-, 4-, 8-,16×104 VG/cell; (d) cells, respectively (IncuCyte S3).
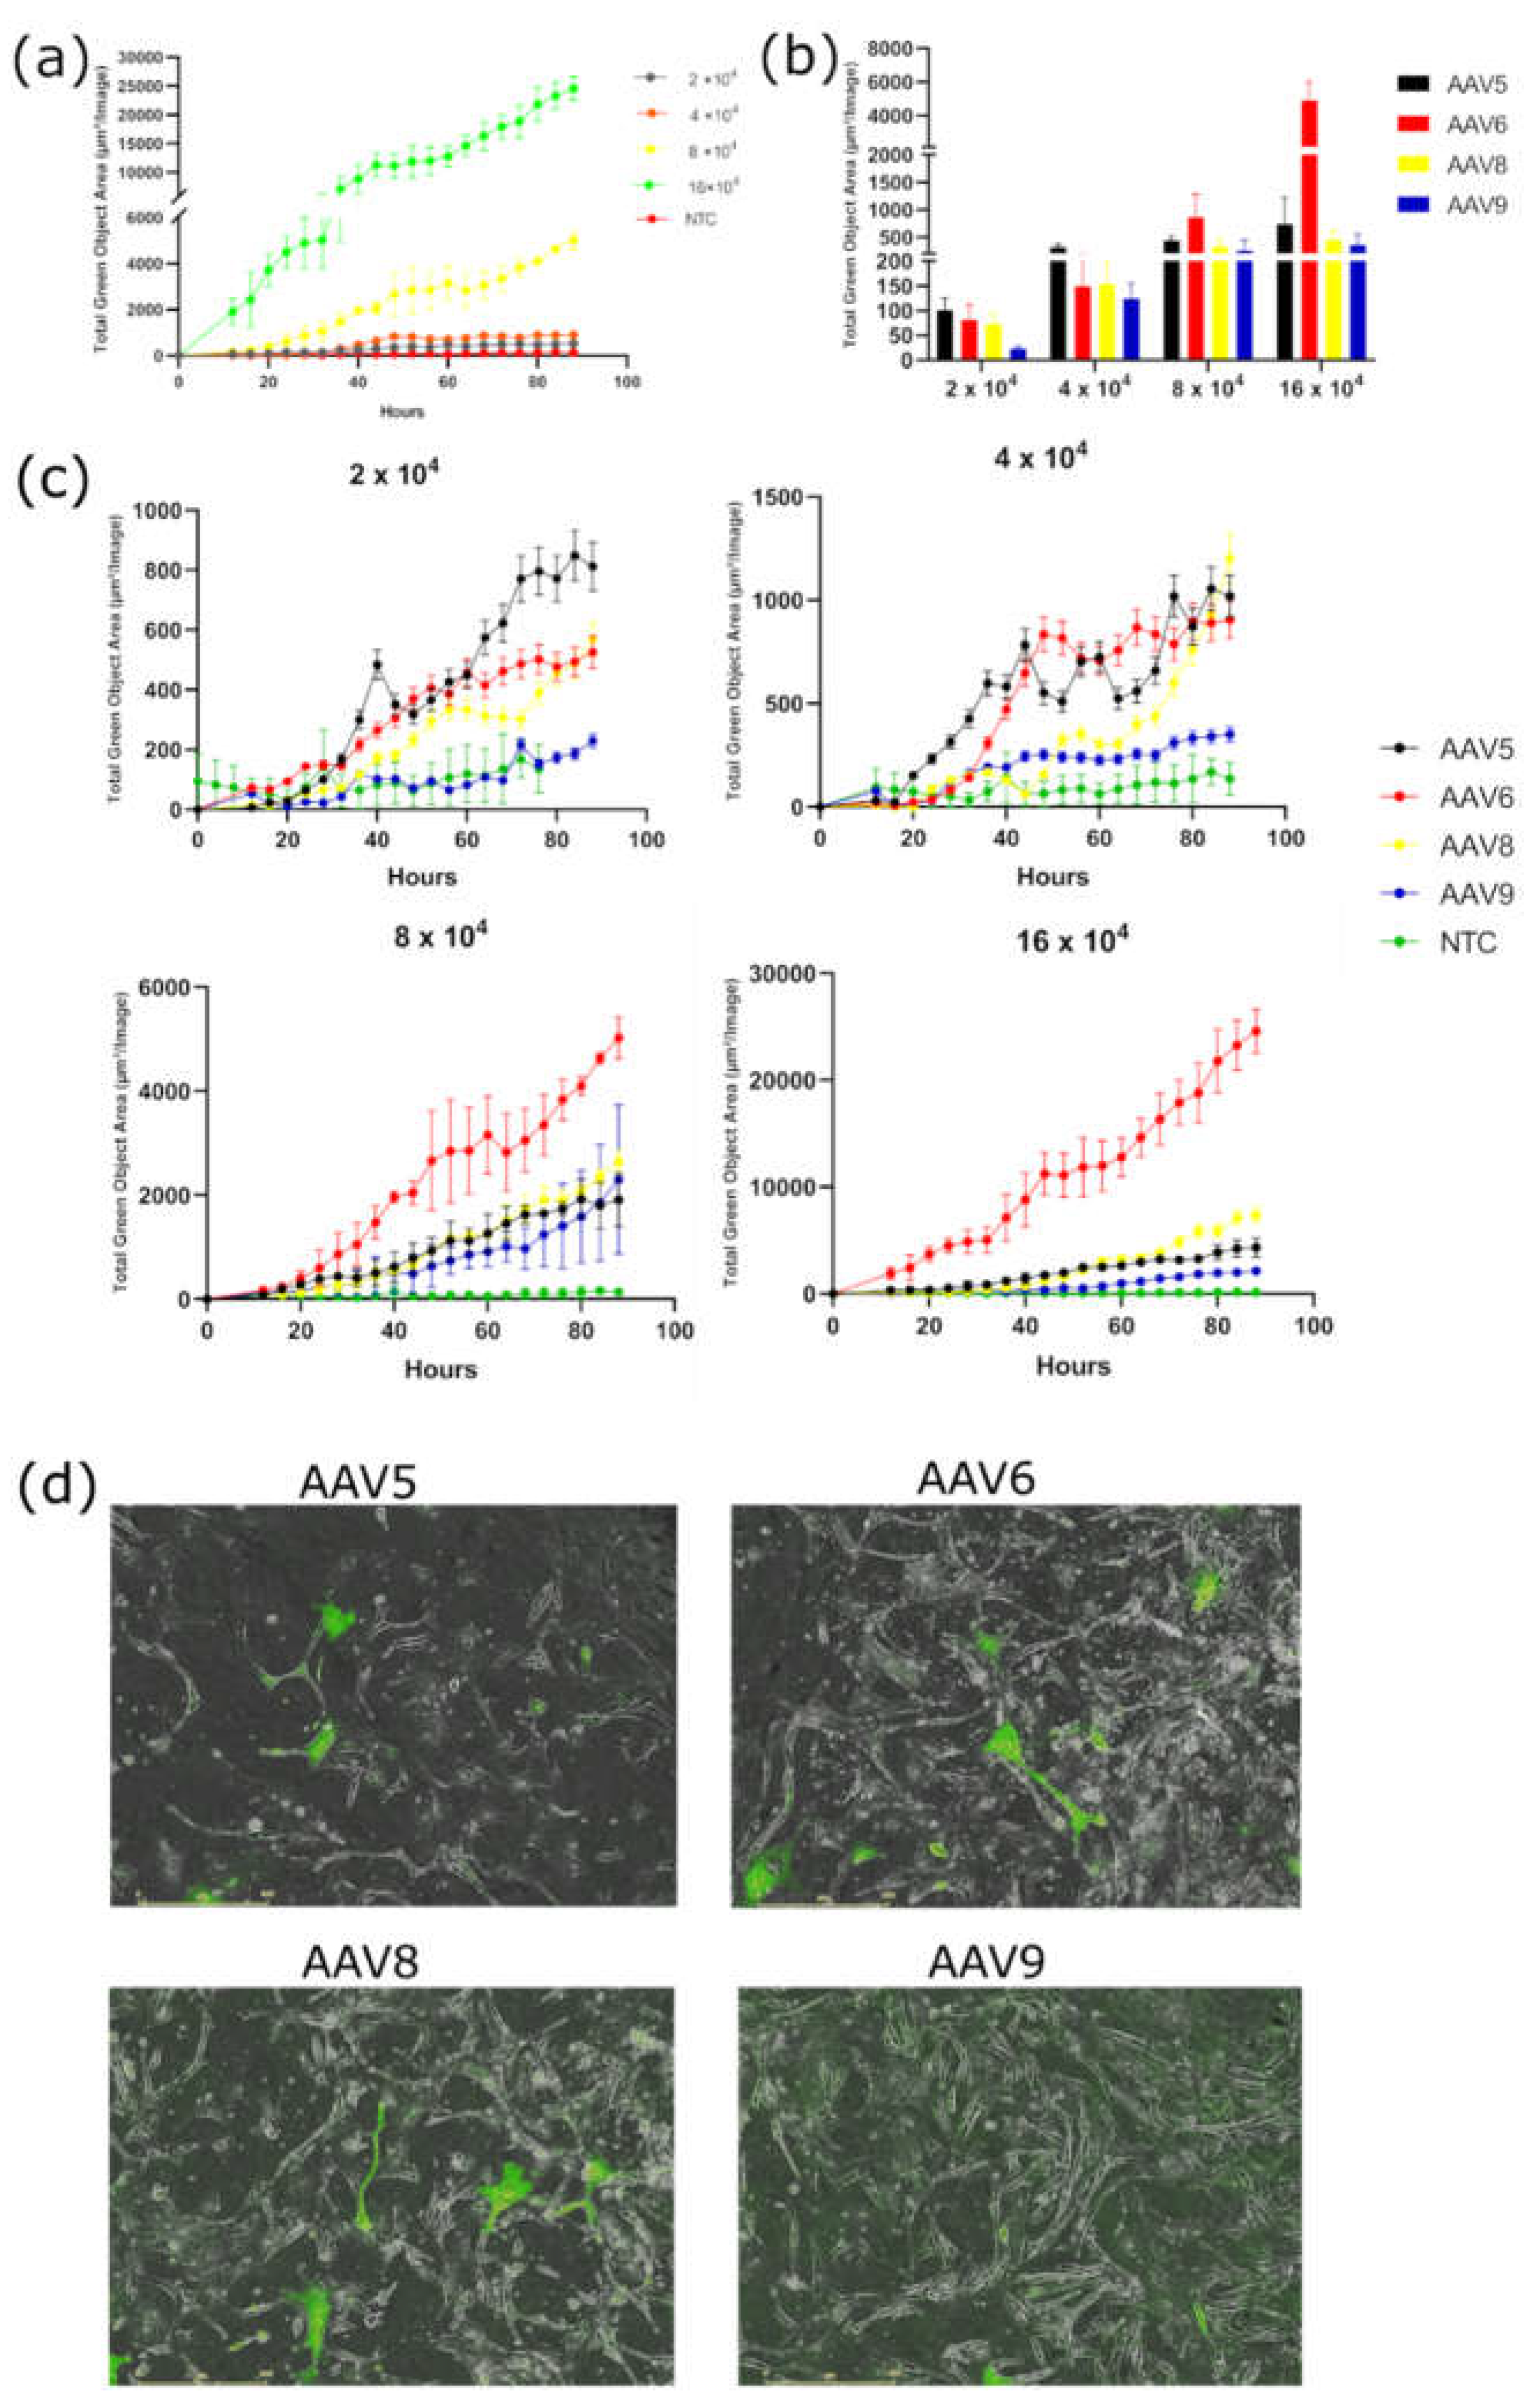
Figure 3.
Flow cytometry analysis of 3T3-L1 preadipocyte cells transduced by AAV5, AAV6, AAV8, and AAV9 (four days after transduction). (a) gating of cell populations expressing GFP; (b) Dose-dependent percentage of GFP-positive 3T3-L1 cells; (c) statistical analysis of GFP+ 3T3-L1 cells at four viral concentrations.
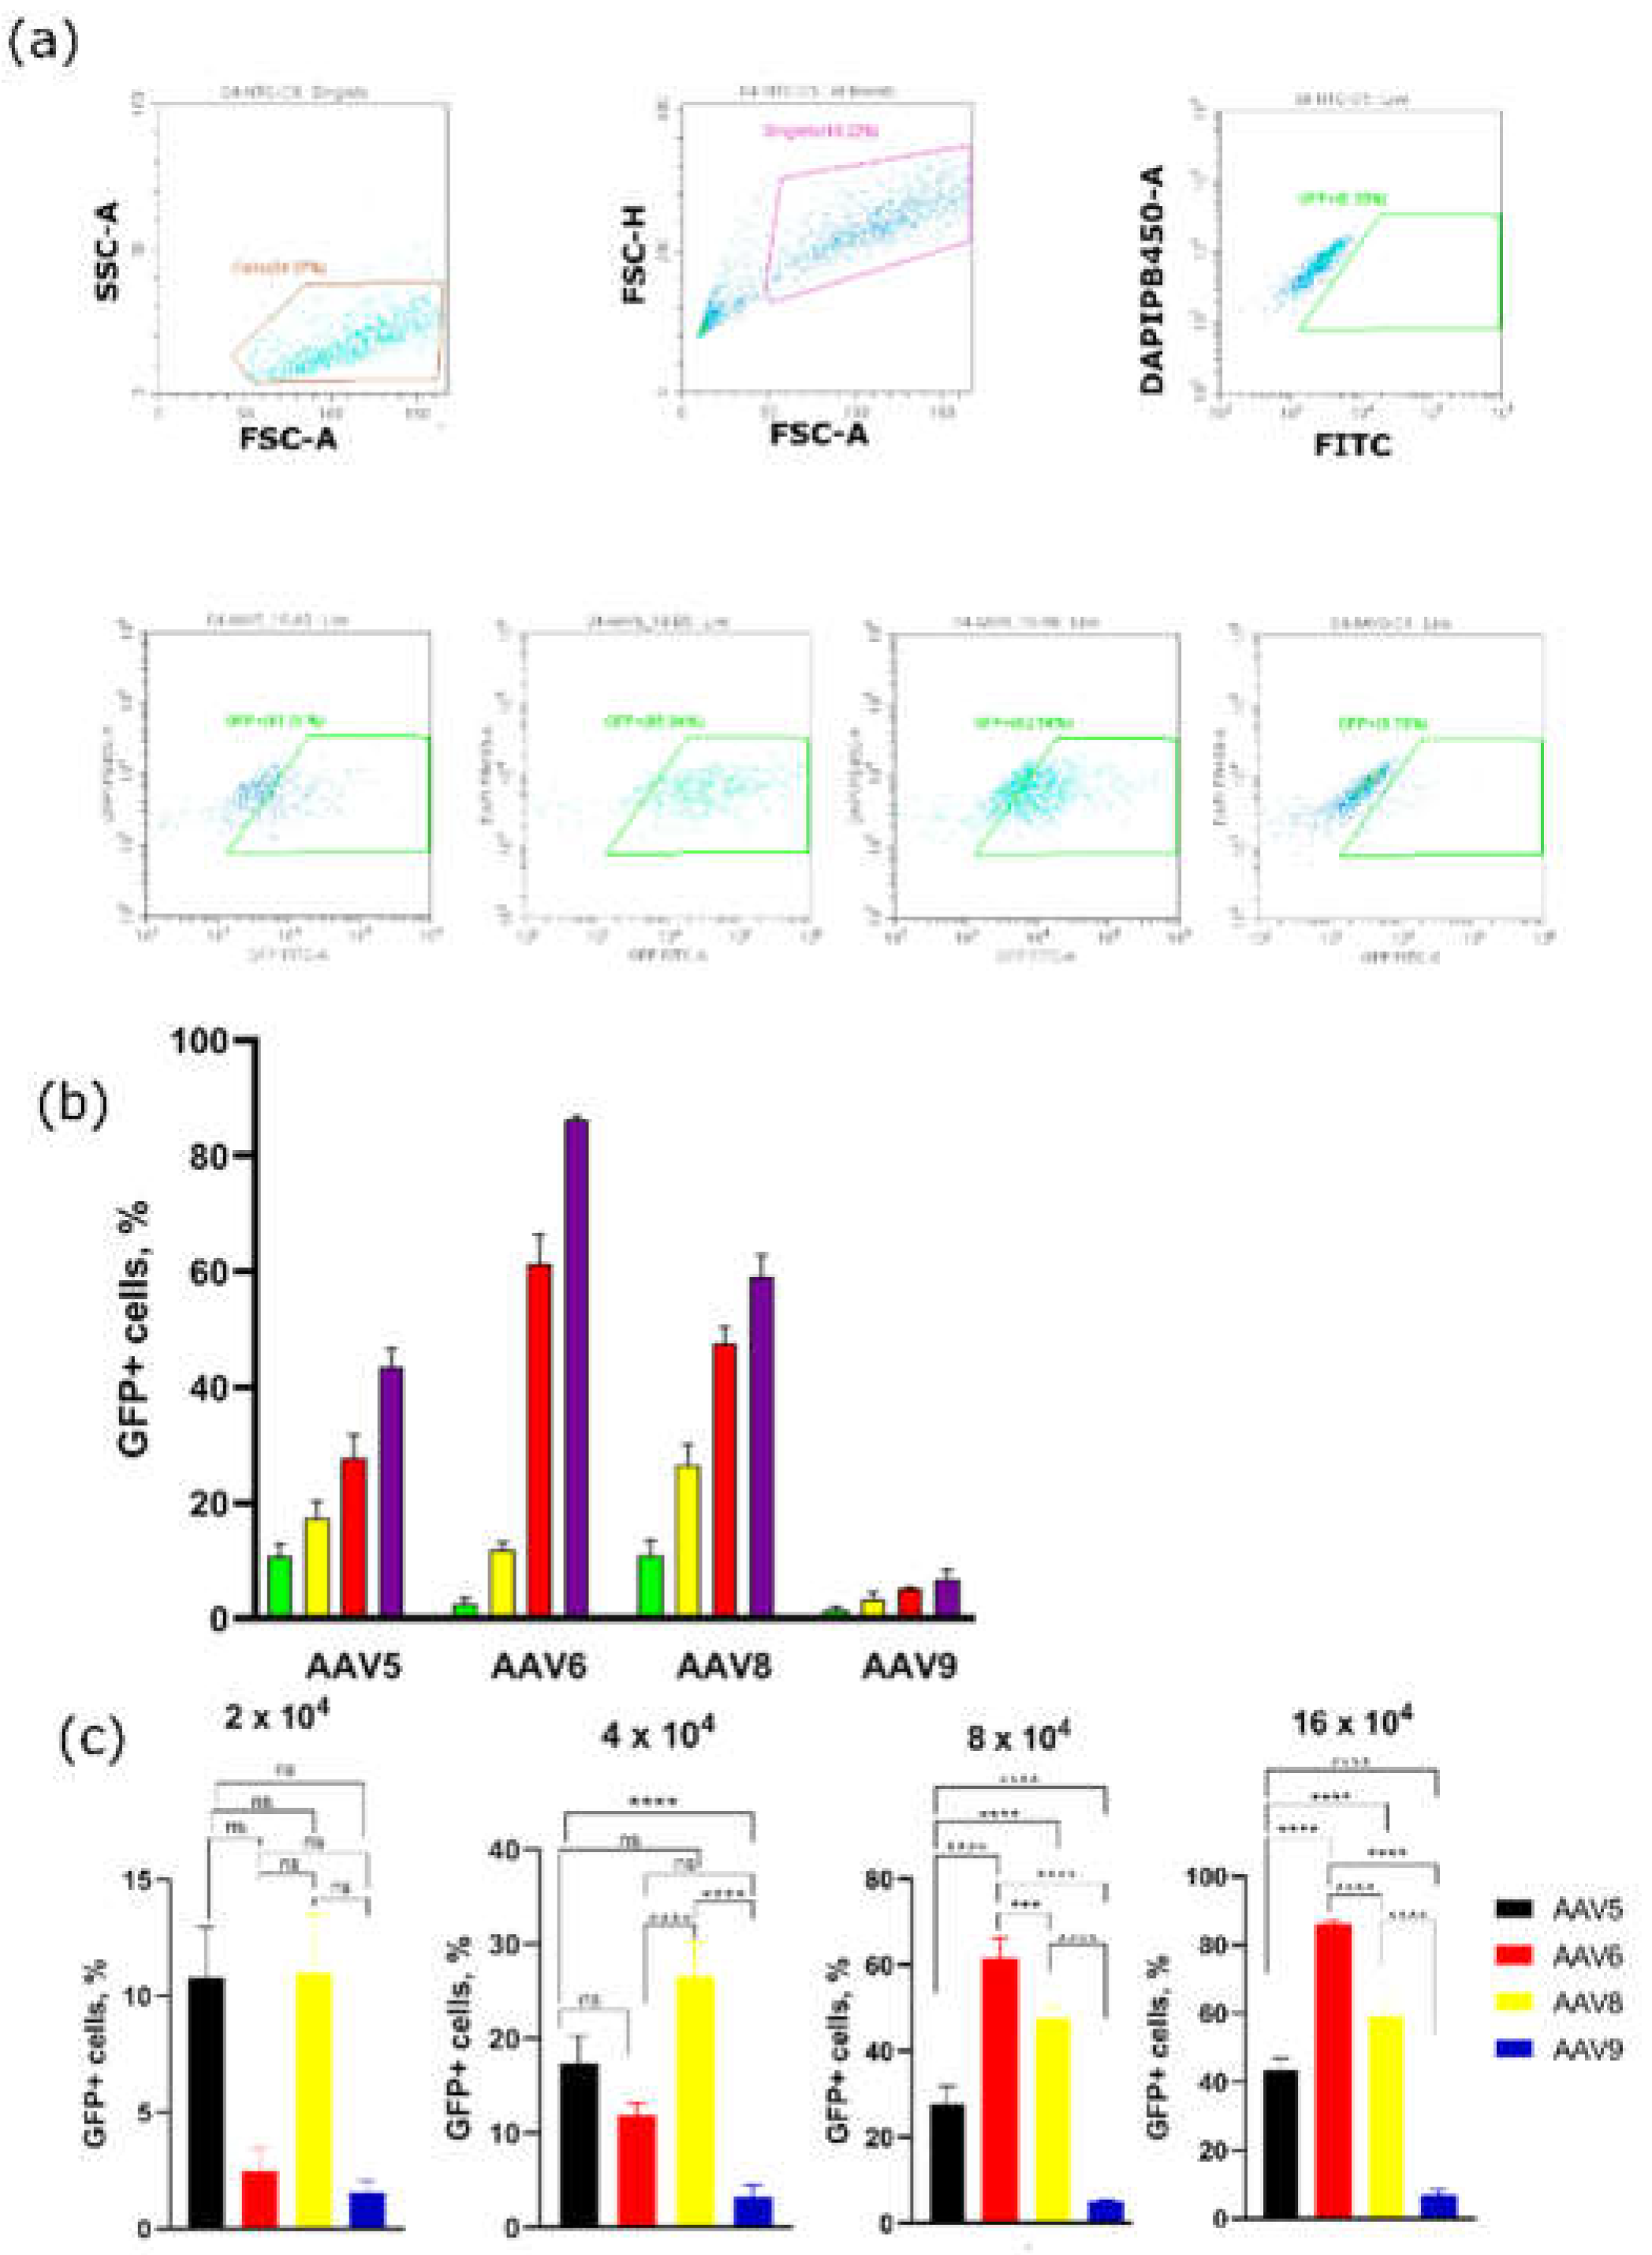
Figure 4.
(a) GFP fluorescence intensity measured in Total Green Objects Area (TGOA) during the 25-day time course in 3T3-L1 preadipocyte cell transduced by AAV5, AAV6, AAV8, and AAV9 at viral concentration of 8 × 10⁴ VG/cell; (b) GFP fluorescence intensity fold change differences between AAV6 and AAV5, AAV8, or AAV9 at a viral concentrations of 2-, 4-, 8-, and 16 × 104 VG/cell.
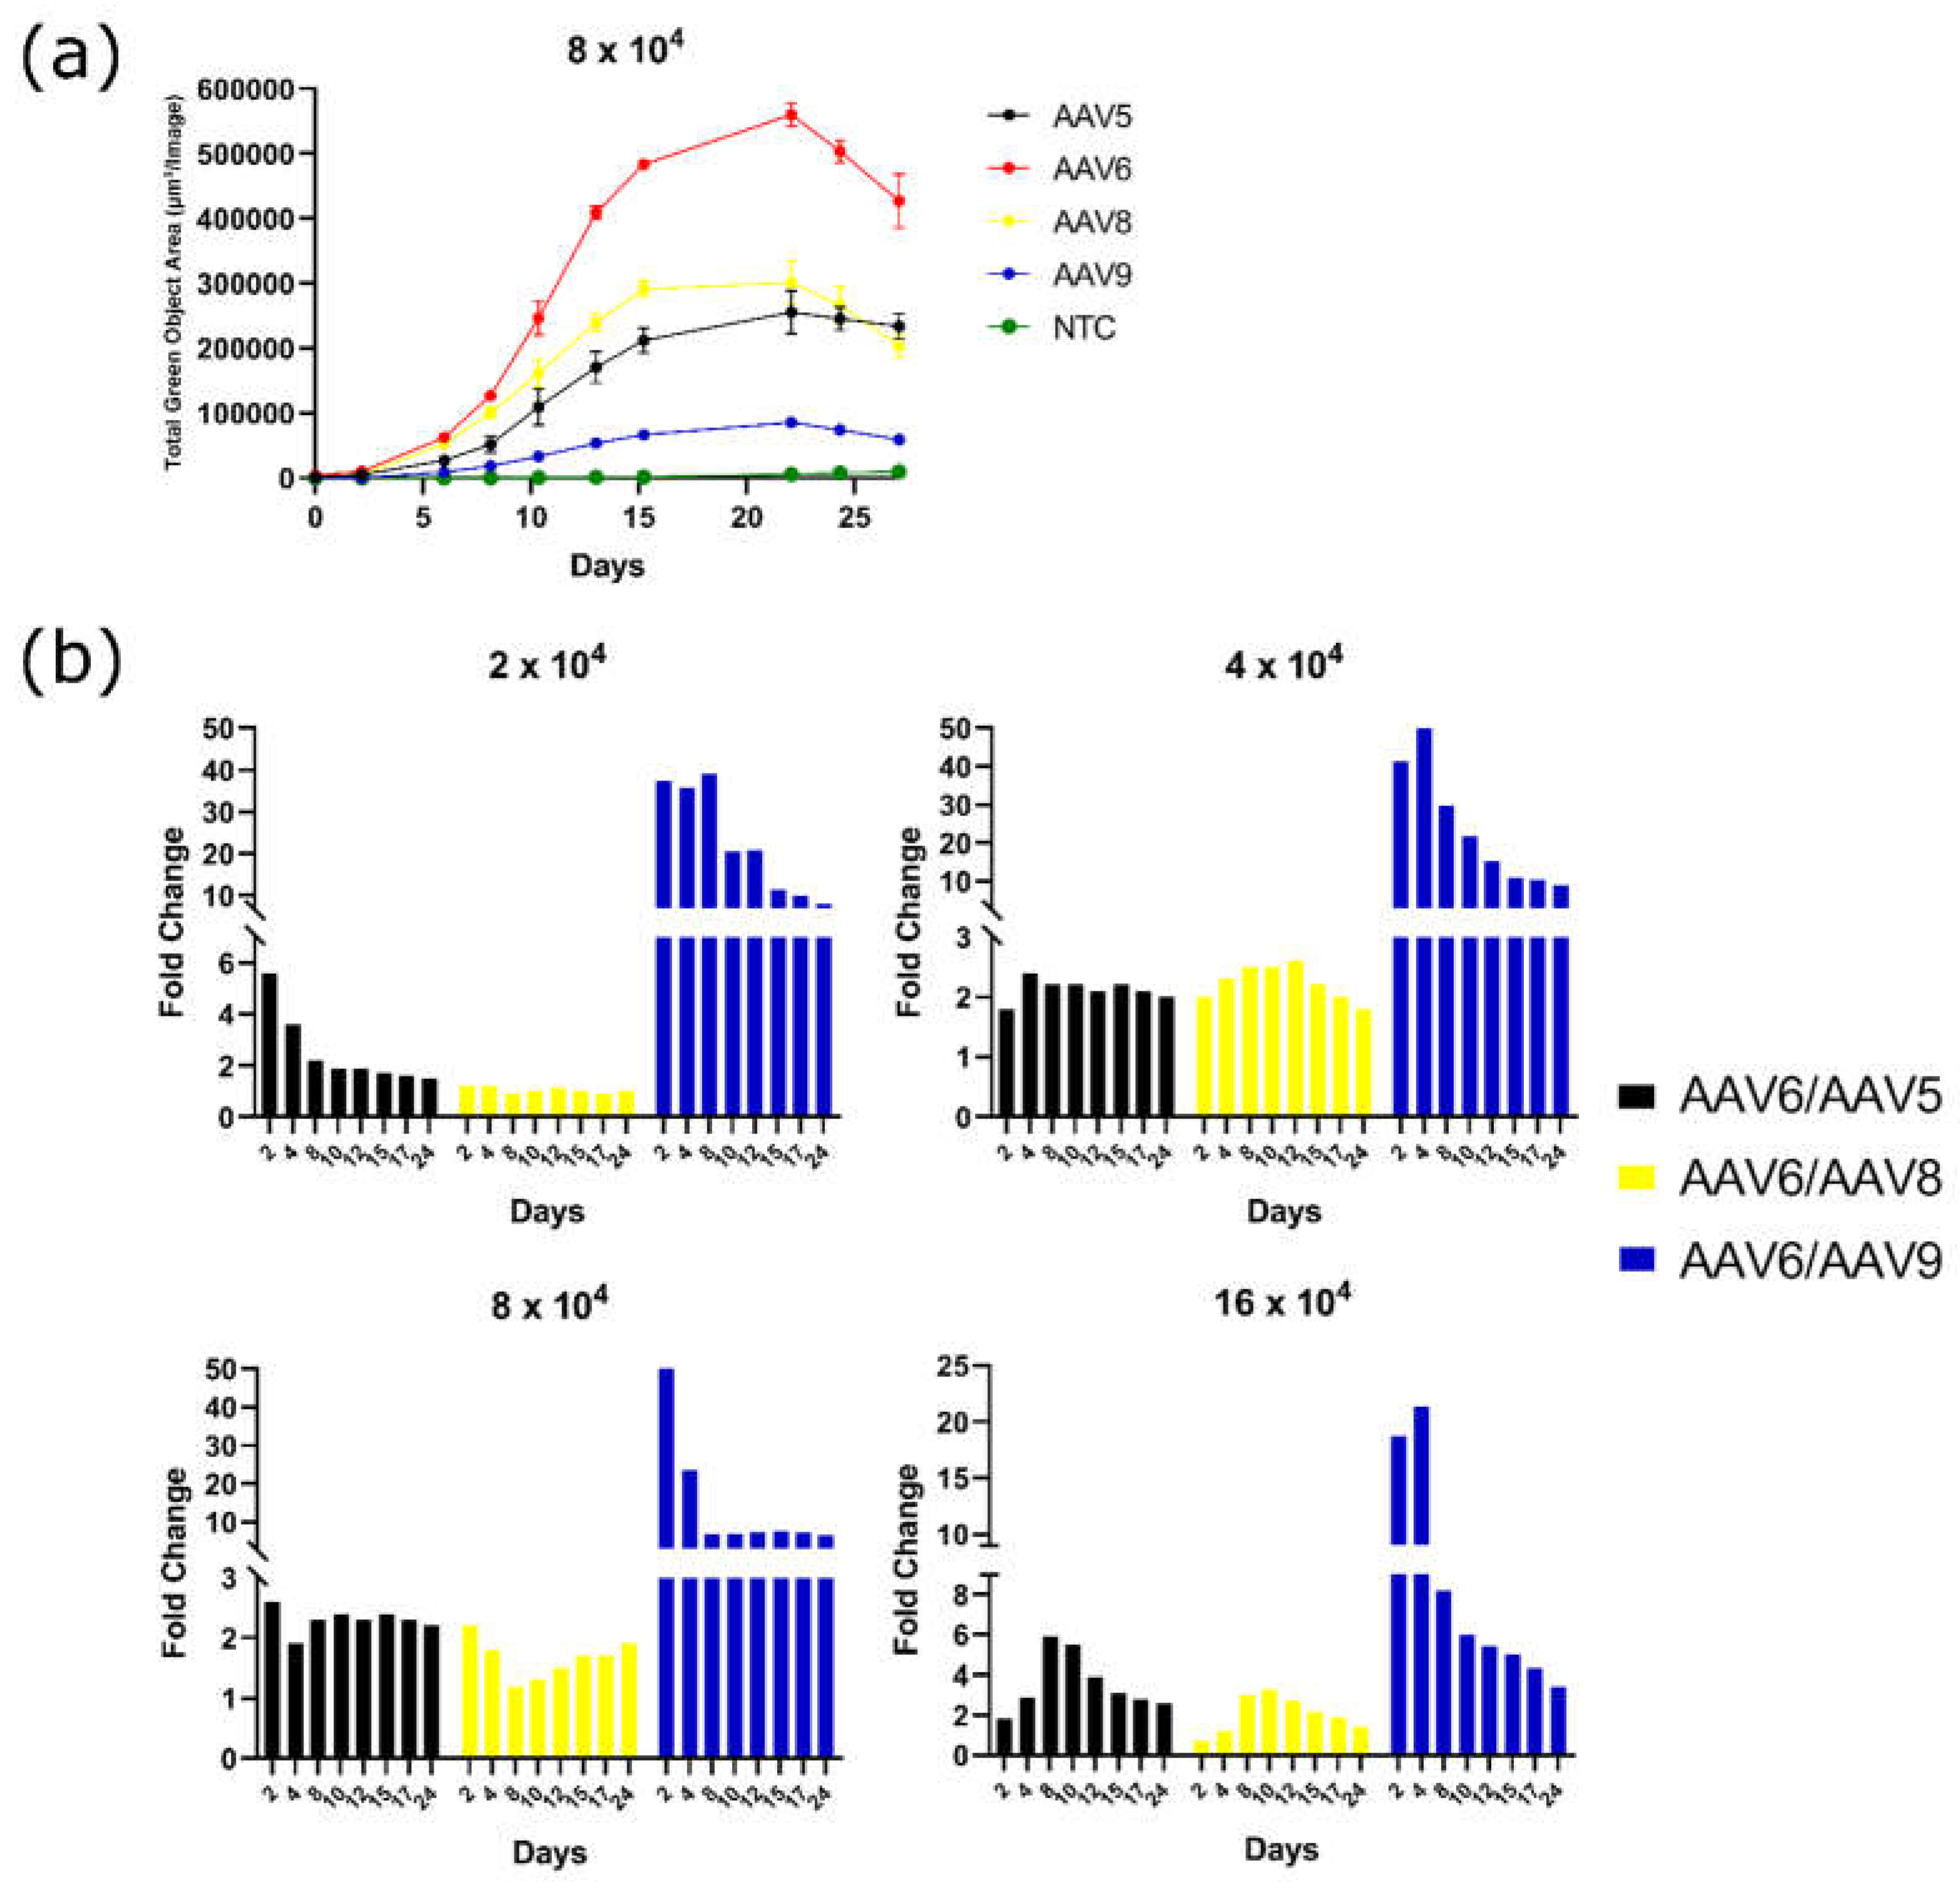
Figure 5.
GFP fluorescence intensity measured in Total Green Objects Area (TGOA) during the 25-day time course in 3T3-L1 preadipocyte cell transduced by AAV5, AAV6, AAV8, AAV9 at viral concentration of 16 × 104 VG/cell. Induction of 3T3-L1 adipogenic differentiation was made at one day post-transduction; (b) cells, respectively (IncuCyte S3).
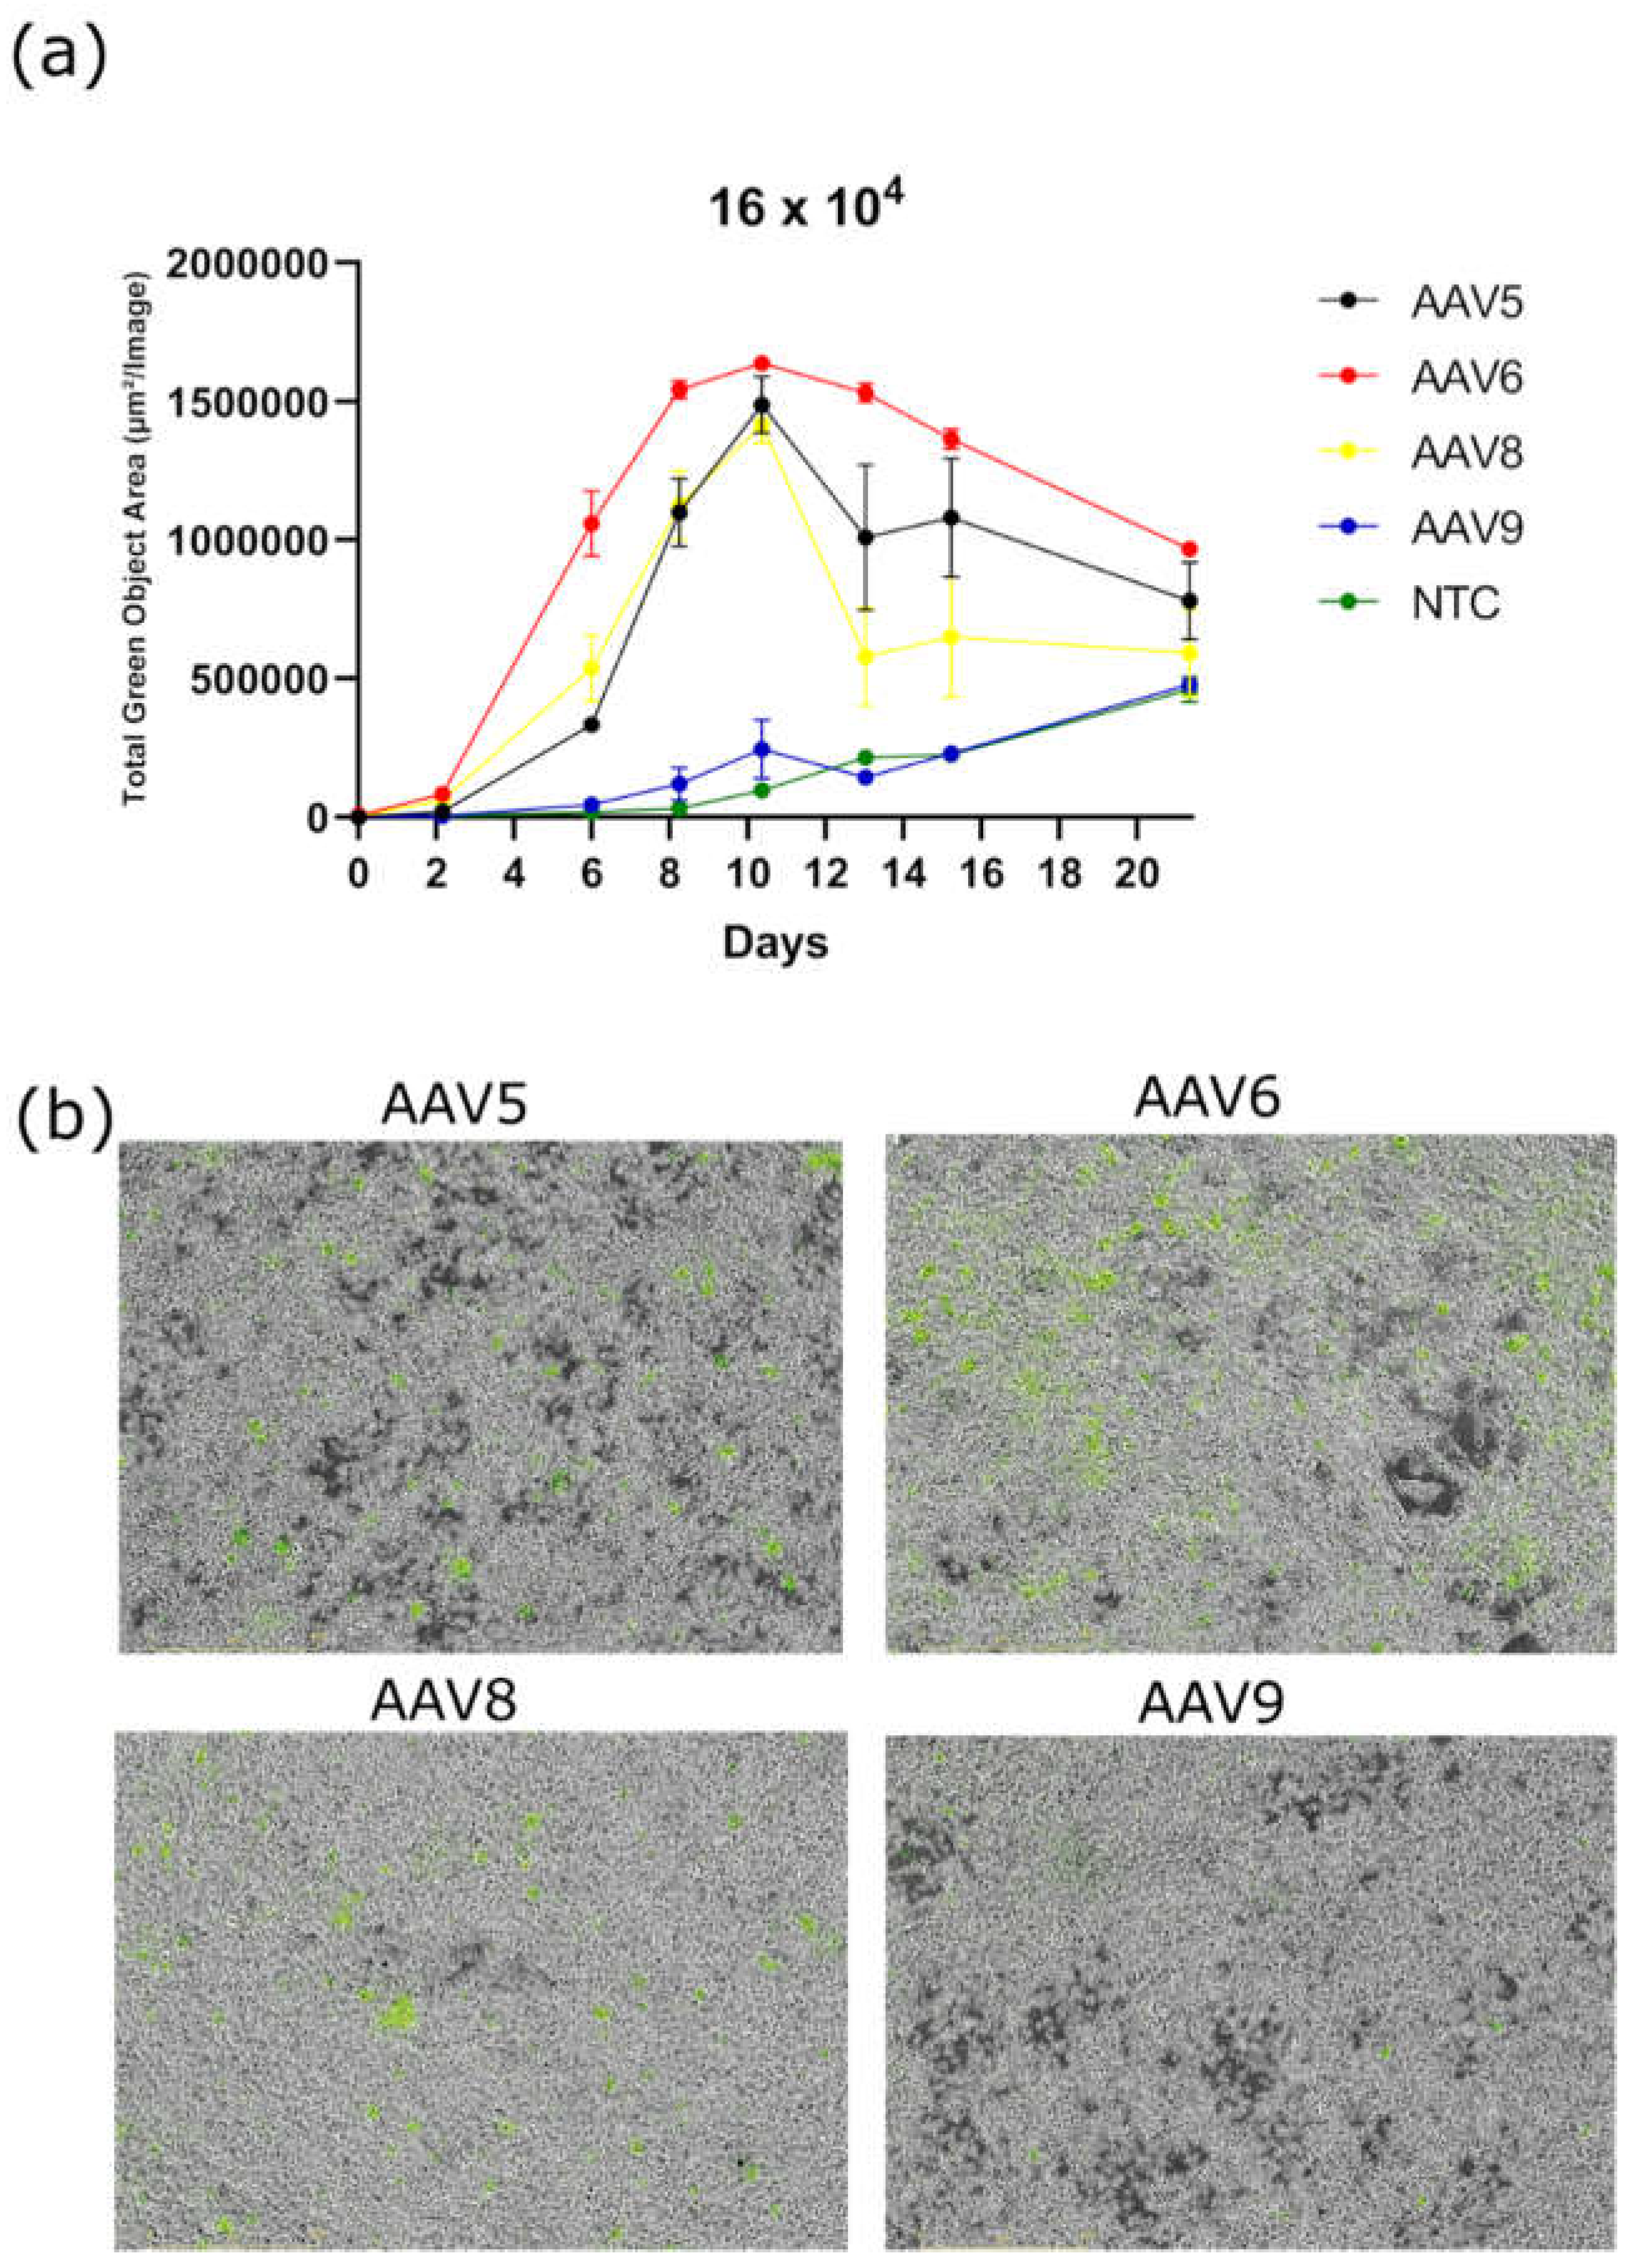
Figure 6.
(a) 3T3-L1 differentiated adipocyte; (b) GFP fluorescence intensity measured in Total Green Objects Area (TGOA) during the 17-day time course in differentiated 3T3-L1 cell transduced by AAV5, AAV6, AAV8, AAV9 at viral concentrations of 1 × 10⁴ and 4 × 10⁴ VG/cell; (c) cells, respectively (IncuCyte S3).
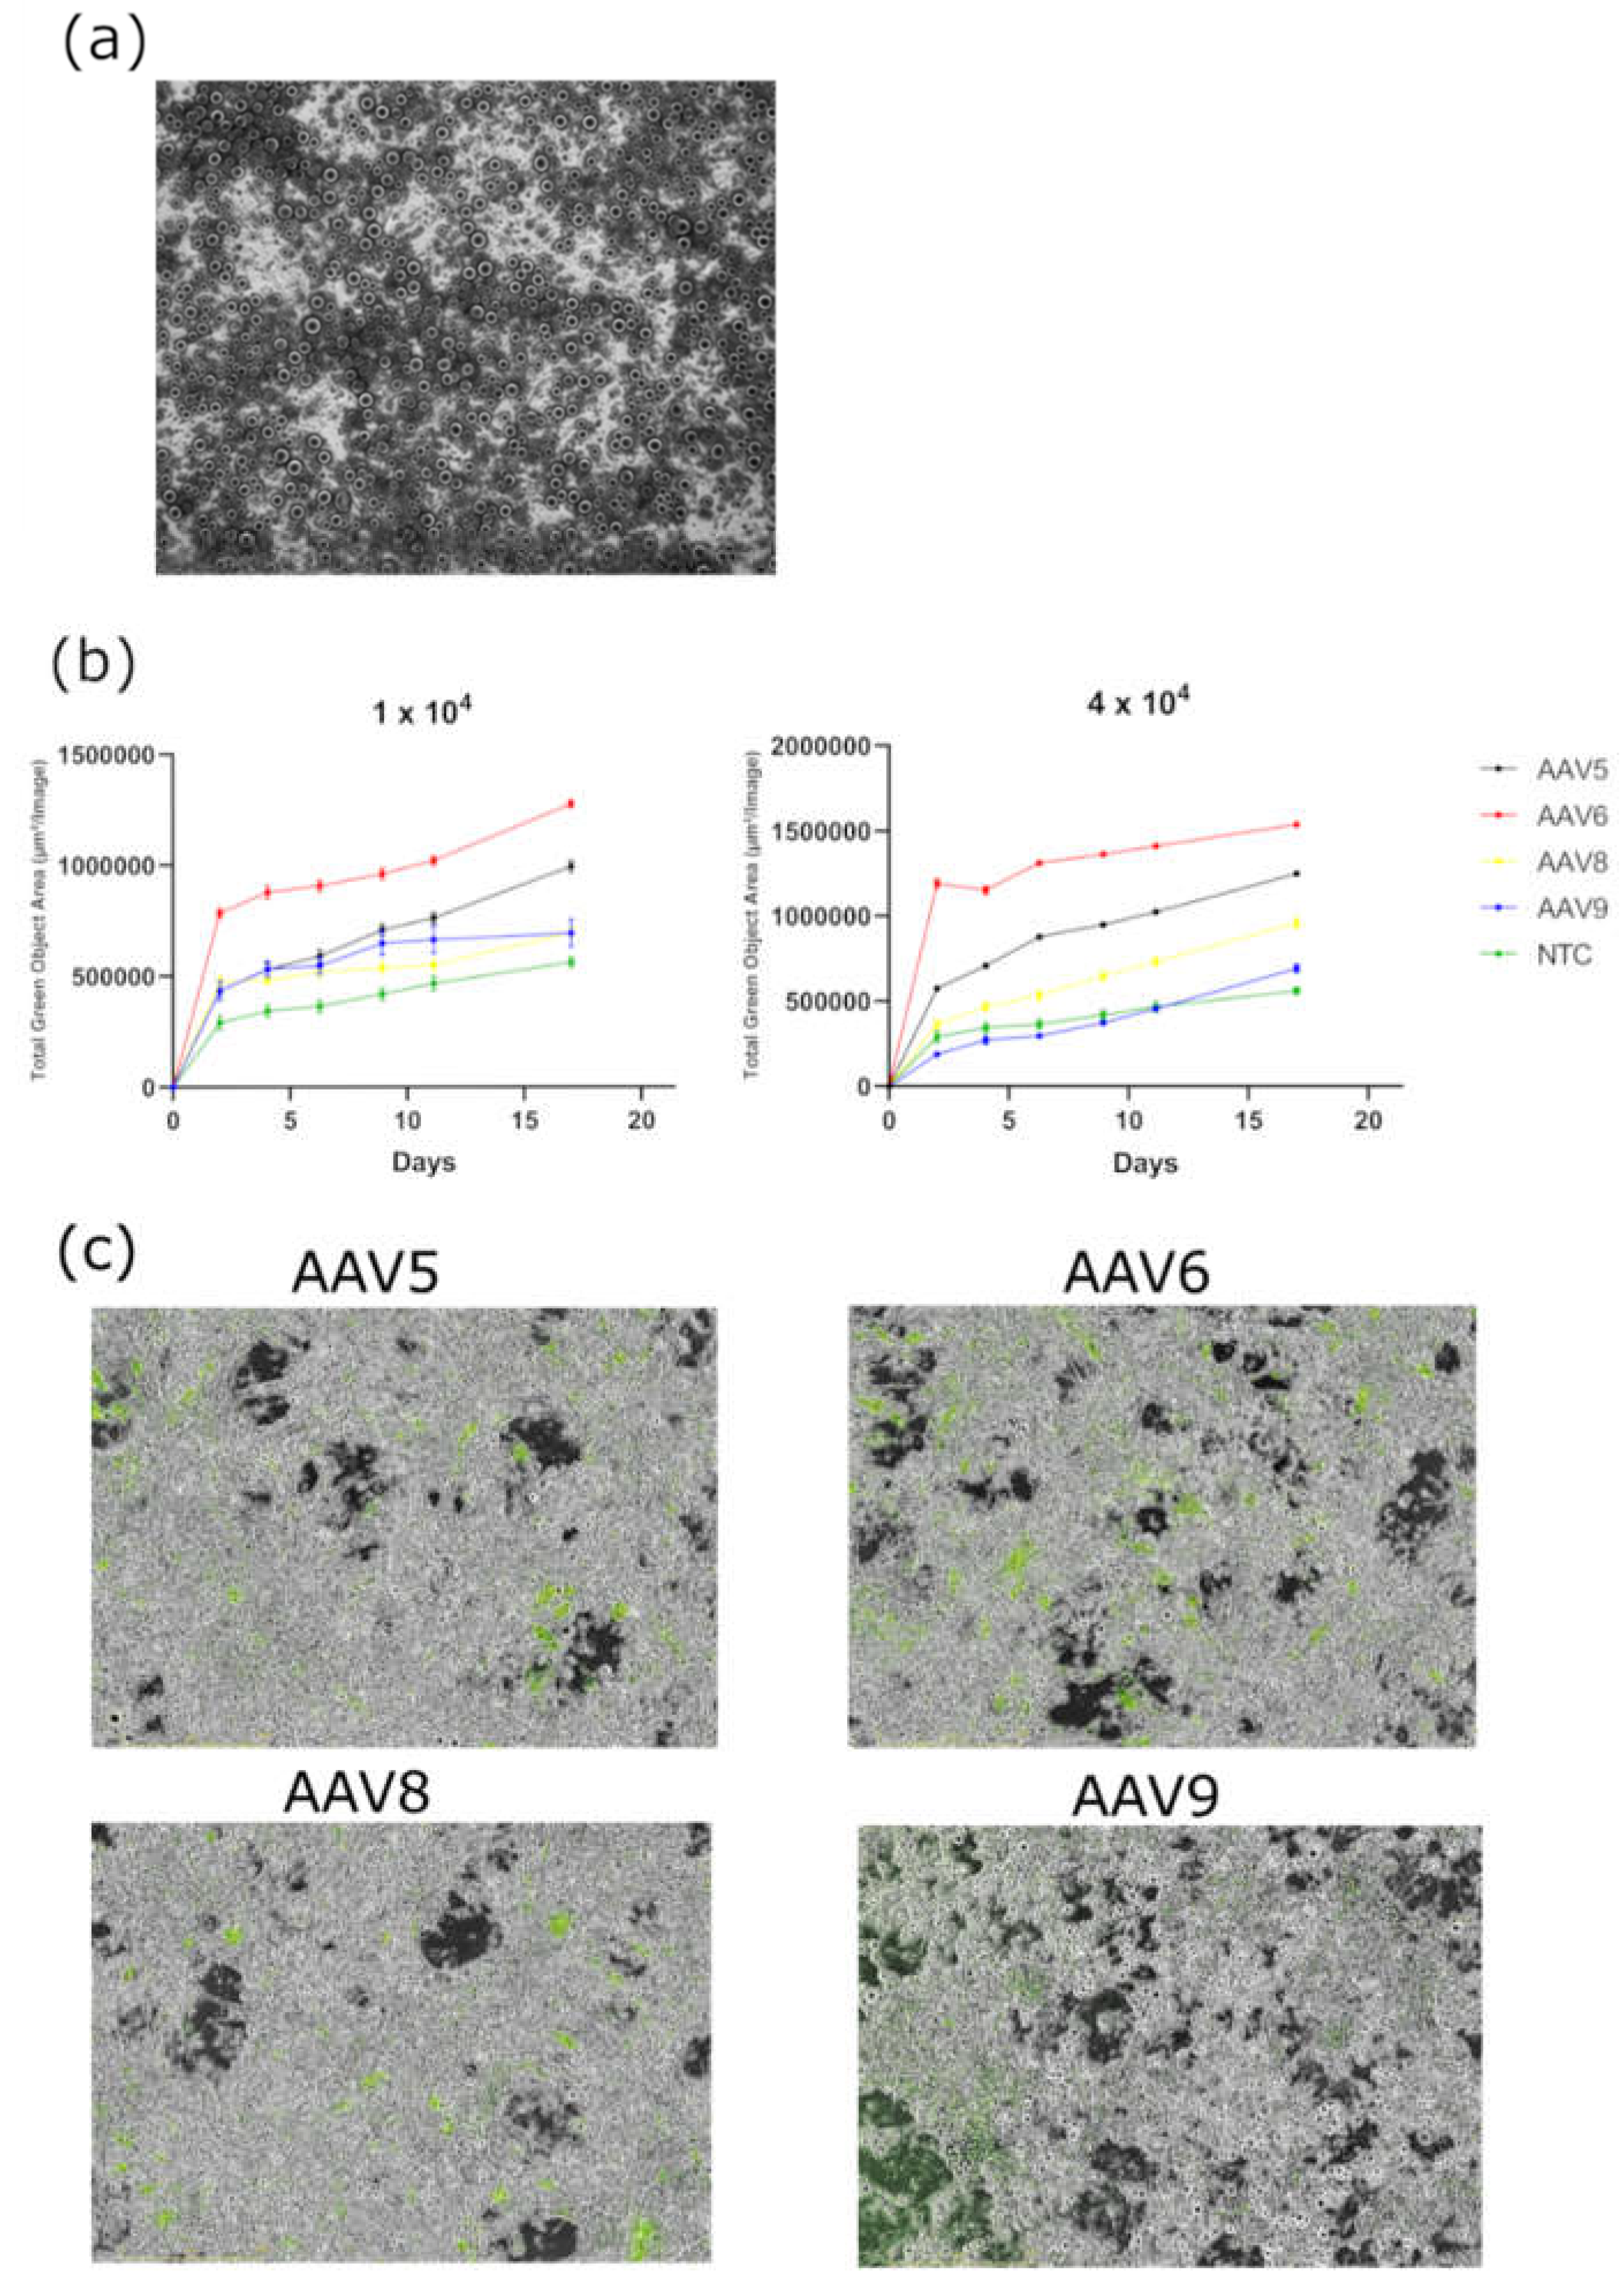
Figure 7.
RT-qPCR analysis of GFP expression in the adipose tissue samples from C57BL6 mice, (∗∗∗∗) P < 0.0001.
Figure 7.
RT-qPCR analysis of GFP expression in the adipose tissue samples from C57BL6 mice, (∗∗∗∗) P < 0.0001.
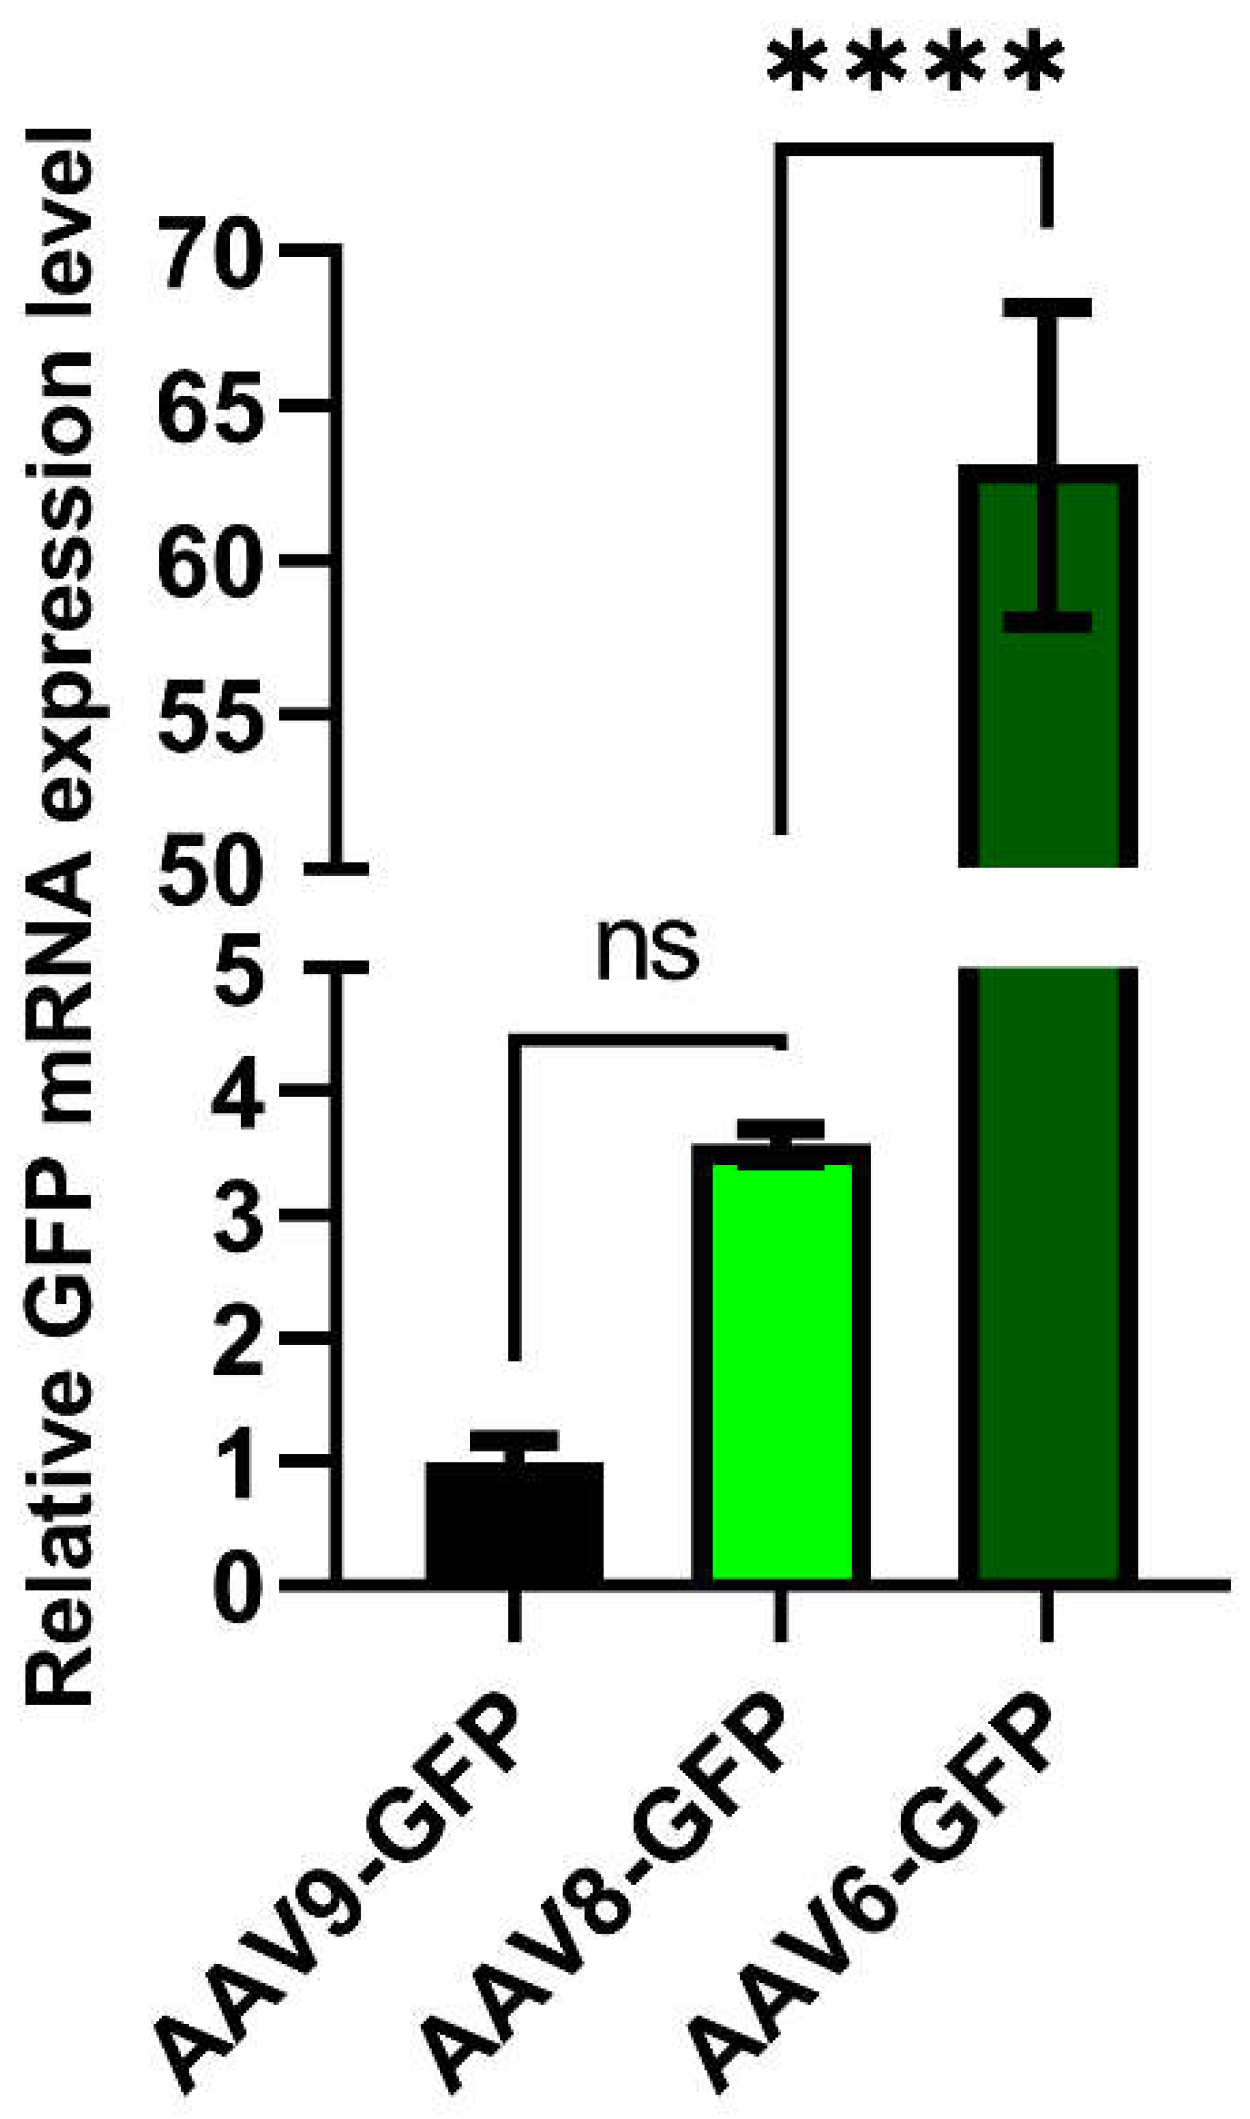
Figure 8.
(a) Mean fluorescence intensity of Katushka2S in the interscapular adipose tissue (b) Confocal fluorescence images of the interscapular adipose tissue.
Figure 8.
(a) Mean fluorescence intensity of Katushka2S in the interscapular adipose tissue (b) Confocal fluorescence images of the interscapular adipose tissue.
Disclaimer/Publisher’s Note: The statements, opinions and data contained in all publications are solely those of the individual author(s) and contributor(s) and not of MDPI and/or the editor(s). MDPI and/or the editor(s) disclaim responsibility for any injury to people or property resulting from any ideas, methods, instructions or products referred to in the content. |
© 2024 by the authors. Licensee MDPI, Basel, Switzerland. This article is an open access article distributed under the terms and conditions of the Creative Commons Attribution (CC BY) license (http://creativecommons.org/licenses/by/4.0/).
Copyright: This open access article is published under a Creative Commons CC BY 4.0 license, which permit the free download, distribution, and reuse, provided that the author and preprint are cited in any reuse.


