
Submitted:
30 July 2024
Posted:
31 July 2024
You are already at the latest version
Abstract
Climate change is a crucial issue of the 21st century, leading to more frequent and severe extreme precipitation events globally. These events result in significant social and economic disruptions, including flooding, loss of life, and damage to infrastructure. Projections suggest that extreme rainfall will intensify in the latter half of the century, underscoring the need for accurate and timely forecasting. Despite advancements in meteorological and climate models that offer high accuracy for various weather parameters, these models still struggle to detect extreme values, particularly for precipitation. This research examines the sensitivity of extreme precipitation events to temperature, based on the Clausius-Clapeyron relationship, focusing on Thessaloniki, Greece. It also evaluates the effectiveness of reanalysis data in identifying extreme precipitation and explores how rainfall-temperature relationships can enhance prediction accuracy. The findings are vital for improving the estimation of extreme rainfall events and informing the design of flood-resilient infrastructure.
Keywords:
clausius-clapeyron
; extreme precipitation
; increasing temperature
; ERA5 land
1. Introduction
One of the most significant impacts of climate change concerns disruptions in the hydrological cycle. These disruptions are not expected to be uniform, unlike temperature increases. In some regions, there is a trend towards increased average precipitation, while in others, a decrease is expected. Specifically, reductions are observed in subtropical areas and increases in higher latitudes, particularly in North America, Eurasia, and Argentina. Negative trends are particularly observed in the Mediterranean, southern Asia, and Africa [1,2]. Changes in extremes do not necessarily align with changes in average precipitation. Extreme precipitation events generally show increasing trends worldwide, even in regions where a decrease in average precipitation is observed [2]. Particularly in drier areas, the increase in extremes appears to be significantly greater, as evidenced by both observations and model simulations [3].
Pall et al. [4] concluded that that alterations in mean precipitation are governed by the energy balance, while changes in the upper percentiles of the precipitation distribution are expected to be restricted by moisture availability, specifically by the Clausius-Clapeyron relationship. A prerequisite for a rise in extreme precipitation at a rate specified by the Clausius-Clapeyron (CC) relationship is the presence of moisture in the atmosphere. In regions where there is lack of moisture, such as continental areas, the relationship between extreme precipitation and temperature will be smaller than the CC relationship (sub-Clausius-Clapeyron or sub-CC) [5]. In tropical regions, the mechanisms driving heavy precipitation are predominantly impacted by the latent heat released during the process of rainfall. As a result, it is projected that there will be enhancements exceeding the expected rate defined by the Clausius-Clapeyron equation, a phenomenon known as super Clausius-Clapeyron or super CC [4]. This phenomenon also holds true for regions at high latitudes in the event of moisture influx from nearby areas during extreme weather occurrences [5].
It is evident that the daily precipitation intensity exhibits different types of scaling with mean temperature depending on the geographical region. Specifically, in tropical regions (20° S-20° N), a consistently negative scaling prevails, while a consistently positive scaling is identified in areas with a high latitude in the Northern Hemisphere (>55° N). In mid-latitudes (20°-55° N and S), positive scaling dominates up to a certain temperature threshold, beyond which it becomes negative. This behavior has been observed in many areas and is associated with the limitation of moisture availability at higher temperatures [6].The most common temperature parameter used to determine the relationship between extreme precipitation and temperature is the mean daily temperature, rather than the temperature during the event itself [7]. The reason hourly temperatures are not preferred is due to the significant influence they receive from boundary layer processes and radiation. In contrast, the mean daily temperature better represents the air mass above the region [8]. Additionally, the temperature during the event is affected by the cooling caused by the precipitation itself [9]. Various studies have observed that using the dew point instead of surface temperature better represents the precipitation-temperature relationship. The use of dew point instead of surface temperature is a better and more realistic indicator of the response of extreme precipitation to warming. This is because the relative humidity is taken into account for the dew point calculation, which must remain constant for the CC relationship to hold. However, this is not the case for all regions and especially for high temperatures, where there is a limitation of relative humidity [10]. Additionally, the timescale under investigation plays a significant role in the relationship, as a considerably greater increase in extreme precipitation with temperature is observed, exceeding the rate defined by the Clausius-Clapeyron (super-CC), on hourly scales. On even shorter timescales (such as 10 or 5-minute intensities), the increase can be up to twice the Clausius-Clapeyron rate (2CC) [11,12].
In the Mediterranean, extreme precipitation events (99th percentile) at daily or smaller scales (three-hourly, hourly, and ten-minute intensities) from E-OBS data show an increase at a rate close to the CC (7%/°C) up to a certain temperature threshold. Beyond this threshold, they follow sub-CC or negative trends, thus exhibiting a characteristic "hook" shape.The temperature change point indicates the temperature at which a sharp change occurs in the precipitation-temperature relationship [5].
Moreover, it is worth noting that the type of data used to determine the relationship between extreme precipitation and temperature for a region should be carefully chosen. In cases where the network of available meteorological stations does not cover the study area, many studies resort to using data from other sources (reanalysis, E-OBS, model simulations). For such data, it should be taken into consideration that they may have limitations in simulating the phenomena under study, especially extreme precipitation events. E-OBS data compared to stations tend to systematically underestimate extremes (dry bias) [5]. The same applies to ERA5 and ERA5-Land reanalysis, which tend to overestimate small episodes while underestimating the most intense ones [13,14].
The aim of this study is to introduce the Clausius-Clapeyron (CC) relationship into a mid-latitude, semiarid region (Thessaloniki, Greece) by employing various methodologies to correct reanalysis data. The need for accurate prediction of extreme precipitation, which drives flash floods and causes various impacts, motivates the use of the CC relationship to improve extreme precipitation databases. By accurately incorporating the CC relationship, we aim to enhance the precision of reanalysis datasets, thereby improving the understanding of extreme precipitation patterns in the region.
2. Data and Methodology
Thessaloniki, located in northern Greece, is the country’s second largest city with more than one million residents in its metropolitan area. To investigate the extreme precipitation relationship with temperature both station and reanalysis data were used. Specifically, temperature, dew point, and precipitation data from the meteorological station of Aristotle University of Thessaloniki were collected, spanning the period from 1951 to 2021. Additionally, reanalysis data from the ERA5-Land dataset were utilized for the same parameters and for the period 1981-2021. For establishing the relationship between extreme precipitation and temperature and comparing it with the rate defined by the Clausius-Clapeyron, two methods were employed: linear Quantile Regression and the Binning method. The quantile regression method was applied to the hourly and three-hourly precipitation data, using both mean daily temperature and mean daily dew point. This methodology, established by de Vyver et al. [15], was utilized in the analysis of station data from Central Europe and Scandinavia. This study pertains to assessing the efficacy of employing this methodology in a station exhibiting distinct climatic attributes. The methodology fits two different linear models to the precipitation data. A simple linear model applied to the upper quantile for the whole temperature range and a second model using piecewise linear quantile regression, in which a tipping point is specified, representing the temperature threshold above which the relationship changes and thus the slope of the line changes. In the first model, which is called the ”CC model”, the scaling of the upper quantiles () of the daily rainfall is calculated using the logarithm of rainfall - log(P) with temperature or the dew point as the predictor variable [16]:
where:
- ,the slope of the line resulting in CC scaling.
- T,the mean daily temperature or the dew point.
The second model, called the "CC+ model" calculates the inflection point of the scaling line, using piecewise linear quantile regression [17]:
where:
- ,the temperature threshold above which the rainfall-temperature relationship changes
- , the slope of the line before the inflection point, corresponding to the rate of increase defined by the Clausius-Clapeyron (CC rate, )
- ,the slope of the line after the inflection point Tc, corresponding to a rate of increase greater (, super-CC), smaller (, sub-CC), or negative () scaling.
To determine which of the two models better represents the data, the Bayesian Information Criterion (BIC) is applied. Additionally, to assess the ability of each model to represent the data for a specific quantile, the goodness-of-fit criterion is applied.
For the binning method, the methodology is developed according to the standards of Drobinski et al. [5]. The methodology was applied to hourly, three-hourly and daily precipitation values using the average daily temperature. Days with precipitation of at least 0.1 mm were characterized as rainy days. The classification of the observations was performed in bins with a fixed range of 2°C. The data were sorted in ascending order based on the mean daily temperature (respectively for the dew point) and the maximum and minimum temperatures were calculated in order to determine the total range. They were then divided into fixed range classes of 2°C and sorted into them according to the average temperature on the day of the rainfall. Unlike [5], an equal number of cases in each class was not used ensuring no cases were dropped. Instead, all cases were sorted for the reference period. To ensure statistical significance, only classes with at least 50 cases were selected. In this way, the upper and lower classes of the distribution were excluded. The average temperature of each class was then calculated and finally, for each of them, the cases were ranked in descending order and the 90th, 95th, 99th and 99,9th percentiles were calculated.
The main difference between the Quantile Regression and Binning methods is that the first calculates the relationships between extreme precipitation and temperature by taking into account the upper percentiles of the entire distribution. In contrast, the second calculates the quantile of each temperature class separately. In this way, the binning method includes cases that do not necessarily belong to the extreme percentiles of the total precipitation distribution of the station. On the other hand, the separation of the episodes into temperature classes and the calculation of the upper percentiles for each of them, provides the advantage of a more comprehensive and thorough study of the relationship between extreme precipitation and temperature in particular temperature ranges. In addition, by using the binning method, it is easier to detect the temperature threshold above which the relationship becomes negative for the mid-latitudes, which include our study area.
In Figure 1, the flowchart of the applied methodology is presented. For the Quantile Regression methodology, once the linear relationships for the station data have been determined, they are applied to the reanalysis data. Using as temperature (T) the mean daily temperature or dew point from the reanalysis data and given the coefficients , (CC model - Equation(1)) and ,,, (CC+ model-Equation (2)) for each t-quantile, the expected precipitation value of each quantile for that temperature is obtained. The Binning methodology involves a more complex process. A function was developed to utilize temperature values from reanalysis data and extract the precipitation percentiles, which were obtained from observations, corresponding to this temperature. First, the function identifies the temperature class and verifies if the temperature falls within the acceptable range. Then, it extracts the percentiles for that class. Next, the percentiles for the two adjacent classes (upper and lower) are determined, and weights for all three classes are calculated based on the distance of the given temperature from the average temperatures of the neighboring classes. Finally, a linear regression is performed using these weights to quantify the temperature. This function is applied to each temperature value from the reanalysis data in order to obtain a new set of binning-corrected data.
3. Results
Comparing the observational data with ERA5 Land values at the closest grid point to the station, it is apparent that while ERA5 Land data can accurately depict daily temperatures during extreme events (Figure 2 left), they exhibit a tendency to significantly underestimate precipitation. Illustrated in Figure 2 right, the majority of 3-hourly intensities exceeding the 90th percentile of the distribution lies below the x=y line, indicating this underestimation by ERA5 Land. In light of this observation, and drawing from existing literature, it becomes evident that there exists a crucial necessity to acknowledge and enhance this underestimation. In order to address this concern, our objective is to utilize the observed scaling relations between extreme precipitation and temperature on the data derived by ERA5 Land.
3.1. Identifying the Observed scaling relations
The analysis compares two methodologies, Quantile Regression and the Binning method, applied to extreme precipitation data from 1951 to 2021, examining cold (October-March) and warm (April-September) seasons separately. The statistical analysis (goodness of fit criterion) of the fit of these methods to the data shows that using temperature against dew point provides a slightly better fit for the station data across all timescales and periods examined. Quantile Regression demonstrates that extreme precipitation generally increases with temperature, with the highest rates being observed during the warm period. This rate of increase surpasses the Clausius-Clapeyron (CC) relation, notably for very extreme events. Similarly, the binning method indicates an overall increase in extreme precipitation with temperature exceeding the rate defined by the Clausius-Clapeyron equation, predominantly during the warm season. The binning method also identifies the temperature threshold for this increased rate to be around 21°C to 24°C across all timescales analyzed. The analysis of Figure 2 involves comparing the Quantile Regression (dashed lines) and Binning (solid lines) methodologies for the upper percentiles of hourly precipitation with daily mean temperature, across different periods and temperature models. For Quantile Regression, the rates of increase of extreme precipitation percentiles with temperature are given in Table 1, for the whole season and for warm and cold half of the year along with the temperature threshold for CC and the CC+ methods. Specifically, the Quantile Regression method identified increasing rates in agreement with the rate defined by CC, for the 90th and 95th percentile of hourly precipitation, while rates exceeding the CC rate have been identified for the 99th and 99.9th as shown in Table 1. For the 99th percentile during the total reference period, the rate of increase as derived from the CC+ model is significantly higher reaching super-CC (+9.9 %/°C) for temperatures above 14.1 °C. The precipitation during the cold period shows a similar behavior with the increase after the temperature change point (Tc = 16.1 °C) being more than double the CC rate (>2CC) with +15.8 %/°C. In the warm period, an increase of 9.9 %/°C up to 17.7 °C is observed. For the 99.9th percentile, for temperatures exceeding 9.5°C and 9.7°C (Figure 2), very extreme precipitation increases at a rate of +10.5%/°C (total period) and +10.7% (cold season). During the warm half, scaling close to 2CC is observed with a rate of +13.3 %/°C for average daily temperatures below 18.5°C and following the CC rate (+7.3 %/°C) for higher temperatures. For the 3-hourly intensities (Table 2 and Figure 3), the Quantile Regression method identified an increasing rate below the one defined by the Clausius-Clapeyron equation. The rate increases with the intensity and for the 99.9th percentile an increase of about 6%/°C is found. Unlike the hourly intensities, the increase in the warm season is not the highest. The most pronounced increase with temperature is found when the warm and cold periods are considered together.

Table 2.
Scaling rates of 3-hourly precipitation extremes to temperature, for each period and percentile and for both models (CC, CC+), as determined by the slope of the quantile lines. For the CC+ model the temperature threshold () is shown. Shaded with gray is the best model according to BIC method. Super-CC rates are denoted in bold.
| P90 | P95 | P99 | P99.9 | |||||||||||||
|---|---|---|---|---|---|---|---|---|---|---|---|---|---|---|---|---|
| CC | CC+ | CC | CC+ | CC | CC+ | CC | CC+ | |||||||||
| (∘C) | (∘C) | (∘C) | (∘C) | |||||||||||||
| 1951-2021 | 3.8 | 4.1 | 2.5 | 19 | 4.4 | 2.5 | 5.1 | 8.9 | 5.7 | 5.1 | 6.5 | 13.6 | 5.9 | 6.2 | 4.4 | 18.7 |
| 1951-2021 Cold period |
3.3 | 3.4 | 1.9 | 15.1 | 3.8 | 2.6 | 5.1 | 9.3 | 5.5 | 6.6 | 4.6 | 6.8 | 5.3 | 6.5 | 4.2 | 11.5 |
| 1951-2021 Warm period |
3.1 | 4 | 2 | 17.3 | 4.4 | 5.9 | 3 | 17.3 | 6.2 | 6.7 | 4.4 | 19 | 5 | 7.6 | 4.3 | 18.2 |
With the Binning method the extreme hourly intensities show an increase with average daily temperature at a rate similar to and greater than the rate defined by the CC relation. Super-CC scaling is observed at temperatures -3 to +1 °C (Figure 2, total period; cold period). and between 15 and 21.5 °C where it reaches 2CC. For temperatures above 21.5°C, the precipitation-temperature relationship becomes negative for the 90th and 95th percentiles, as well as the 99th and 99.9th percentiles. During the cold period of the year (October-March), hourly precipitation values increase with the temperature at a rate close to the 7%/°C defined by Clausius-Clapeyron. The 99th and 99.9th percentiles exceed this rate for temperatures of 15-18 °C, but show a negative relationship at higher temperatures. In the warm season (April-September) the binning method shows an increase close to CC rate up to 15 °C. Between 15°C and 22°C, the increase exceeds 7%/°C for the 90th and 95th percentiles and exceeds twice the CC rate (2CC) for the 99th and 99.9th percentiles. However, for temperatures above 26°C, the relationship becomes negative. The 3-hourly precipitation intensities, for the whole period, follow the Clausius-Clapeyron rate closely (Figure 3). Specifically, the 95th, 99th and 99.9th percentiles follow the CC rate for temperatures from 2 °C to 22 °C, while the 90th percentile shows sub-CC growth. Between 18°C and 22°C, the 90th and 95th percentiles increase at a rate approaching 2CC, but become negative above 22-24°C. During the cold period, the rate of increase for extreme precipitation exceeds the CC rate between 2-6 °C and 10-14 °C becoming negative above 18-20 °C. In the warm season, the increase exceeds the CC rate (super-CC) and reaches or exceeds 2CC for temperatures between 15 and 21 °C., but becomes negative at higher temperatures. The evolution of the daily extremes with temperature occurs at a rate lower than that defined by CC rate. There is a significant increase in daily extremes up to 6 °C. For temperatures higher than 22oC, the relationship becomes negative, except for the 99th and 99.9th percentiles, which show a significant increase at 26-28 °C. When separating the data into cold and warm seasons, a similar pattern is observed.
3.2. Reanalysis Data
The application of the Binning method to the three-hourly and daily rainfall data from ERA5 Land (Figure 5) demonstrates the clear underestimation of the extremes. The upper percentiles follow a negative relationship with temperature up to 6 °C and then a positive relationship up to 10-12 °C for all three time scales. For higher temperatures, the 90th and 95th percentiles show a continuous negative trend, the 99th shows a zero trend up to 21 °C and then a decline, and the 99.9th follows an increase at a rate slightly less than CC up to 21 °C before the relationship becomes negative. Although significant increases are found for some temperature classes, these are not sustained. It appears that the ”hook shape” observed for the Mediterranean regions is more pronounced in the reanalysis data than in the observations. Despite the underestimation of extremes by ERA5, the temperatures where the relationship becomes strongly negative are between 21 and 24 °C and are in agreement with observations. However, a negative relationship is found for the 90th and 95th percentiles for temperatures >9-10 °C which is in agreement with previous studies placing the threshold at 7 °C for the Greek region (Drobinski et al. 2018).
In order to reduce this underestimation of extremes the observed relations are applied to the temperature data of ERA5 Land reanalysis dataset on the days that extreme precipitation was recorded on the station. Figure 6 shows the values of the upper percentiles of the hourly precipitation from the observations compared to the primary data from ERA5 Land (black) and to the corrected values through the two methodologies in the same diagram. For the quantile regression method in red for the QQ model and in yellow for the QQ+ model and for the binning method in green. To better compare the methods, the violin plots of the differences of the station observations from ERA5 and the results of the two methods were created (Figure 7). Figure 6 clearly shows that extreme rainfall in the Thessaloniki area is consistently underestimated (black dots). However, the results from the three methods indicate a promising trend, with significant correction observed, particularly for the most extreme cases at the 95th and 99th percentiles. Figure 7 allows us to quantify the improvement in estimating extreme precipitation. It is evident that the majority of the difference values are positive for ERA5 Land. By correcting the values through the equations obtained from the three methods, it is evident that the differences are significantly reduced. More specifically, for the 90th percentile the average value of the difference between station and ERA5 Land is 7.7 mm and is reduced to 5.3 mm with the two quantile regression methods and to 4.6 mm with the binning method. For the 95th the reduction is from 9.1 mm to 4.5 mm with the CC model, 4.3 mm with the CC+ model and 3.8 mm with the Binning method. For the 99th percentile the difference is reduced respectively from 16.6 mm to 2.3 mm (CC), 1.1 mm (CC+) and 1.9 mm (Binning). Overall, the Binning method provides a clearer and more precise depiction of the relationship between temperature and extreme precipitation. Unlike Quantile Regression, which offers a broader analysis, the Binning method identifies specific temperature thresholds and rates of change, making it more effective for understanding and predicting extreme precipitation patterns. This detailed approach underscores its advantage in capturing the nuances of temperature-related precipitation dynamics.
4. Discussion and Conclusions
The statistical analysis of the methods’ application to the data shows that the use of temperature compared to the dew point seems to have a slightly better fit for the station data. On the contrary, in regions with wetter climatic characteristics, such as Western Europe and Scandinavia, it has been shown that the dew point presents a better fit with extreme precipitation [15]. The hourly values show an increase with temperature, which is in agreement with the Clausius-Clapeyron (CC) relationship, while for very extreme precipitation, a rate that significantly exceeds this relationship (super-CC) is recorded, reaching up to 2CC. Many researchers have reported similar findings for the Netherlands, Switzerland, and Austria, with scaling detection exceeding 2CC [11,12,18]. For the 3hourly values, this rate is smaller but still in agreement with CC without exceeding it, while for the daily values, the change is even smaller and is below the CC rate (sub-CC). These results are in agreement with studies worldwide [7,19] and show that the smaller the timescale, the stronger the rate of increase of the extremes with temperature. The Binning method identified the temperature threshold above which a negative relationship prevails, averaging between 21-22°C for all time scales and most percentiles. This threshold is in agreement with [20] where for Thessaloniki station it was identified at 20°C and is significantly higher than the threshold of 7°C found for Greece in previous studies [5].
The evaluation of the ERA5 Land reanalysis data showed that despite the good agreement with the observations for daily mean temperatures, extreme precipitations are significantly underestimated. Numerous studies [13,14,21] have reported this underestimation of very intense precipitation episodes, often accompanied by an overestimation of small rainfall amounts. Furthermore, both the rate of increase with temperature and the temperature threshold from which the relationship becomes negative were found to be smaller compared to the observed values when the binning method was performed on ERA5 Land data. By applying the derived equations from the two methodologies to the temperature data from ERA5 Land during the days when extreme rainfall occurred at the station, a significant improvement is observed. In particular, a decrease in the underestimation was observed ranging from 10% to more than 50% with the greatest improvement being found during the most extreme rainfall events. The improvement is similar with all three models (CC, CC+ and Binning) without any of them being superior .
Overall, the application of the methods for determining the extreme precipitation - temperature relationship shows that the extremes are indeed in agreement with the Clausius-Clapeyron relationship. At the same time, the rate exceeding the CC, which has been identified in sub daily data of different regions, is also found in Thessaloniki. In addition, an important conclusion is that the application of the observed relationship is able to lead to an improvement of the underestimations from the reanalysis data. The latter makes the method a particularly important tool for prevention against extreme events that may lead to flooding events in the near and distant future. The Clausius-Clapeyron (CC) relationship has the limitation of being highly specific to each region, necessitating separate definitions for different areas. Furthermore, accurately defining this relationship requires station-observed data, which are often difficult to obtain. Despite these challenges, these limitations inspire future work and the potential application of the method in other regions, paving the way for broader and more comprehensive studies.
Author Contributions
Conceptualization, A.P.Z. and C.A.; methodology, A.P.Z.; software, A.P.Z.; validation, C.A. and A.P.Z; writing—original draft preparation, A.P.Z.; writing—review and editing, C.A. and A.P.Z.; visualization, A.P.Z.; supervision, C.A.; All authors have read and agreed to the published version of the manuscript.
Funding
This research received no external funding.
Institutional Review Board Statement
Not applicable.
Informed Consent Statement
Not applicable.
Data Availability Statement
Data available on request from the authors.
Conflicts of Interest
The authors declare no conflicts of interest.
References
- IPCC. IPCC, 2023: Climate Change 2023: Synthesis Report. Contribution of Working Groups I, II and III to the Sixth Assessment Report of the Intergovernmental Panel on Climate Change [Core Writing Team, H. Lee and J. Romero (eds.)]. IPCC, Geneva, Switzerland., 2023. [CrossRef]
- Trenberth, K.E. Changes in precipitation with climate change. Climate Research 2011, 47. [Google Scholar] [CrossRef]
- Donat, M.G.; Lowry, A.L.; Alexander, L.V.; O’Gorman, P.A.; Maher, N. More extreme precipitation in the world’s dry and wet regions. Nature Climate Change 2016, 6. [Google Scholar] [CrossRef]
- Pall, P.; Allen, M.R.; Stone, D.A. Testing the Clausius-Clapeyron constraint on changes in extreme precipitation under CO2 warming. Climate Dynamics 2007, 28. [Google Scholar] [CrossRef]
- Drobinski, P.; Silva, N.D.; Panthou, G.; Bastin, S.; Muller, C.; Ahrens, B.; Borga, M.; Conte, D.; Fosser, G.; Giorgi, F.; et al. Scaling precipitation extremes with temperature in the Mediterranean: past climate assessment and projection in anthropogenic scenarios. Climate Dynamics 2018, 51, 1237–1257. [Google Scholar] [CrossRef]
- Tang, J.; Lu, Y.; Wang, S.; Guo, Z.; Lu, Y.; Fang, J. Projection of Hourly Extreme Precipitation Using the WRF Model Over Eastern China. Journal of Geophysical Research: Atmospheres 2023, 128. [Google Scholar] [CrossRef]
- Martinkova, M.; Kysely, J. Overview of observed clausius-clapeyron scaling of extreme precipitation in midlatitudes, 2020. [CrossRef]
- Lenderink, G.; Meijgaard, E.V. Increase in hourly precipitation extremes beyond expectations from temperature changes. Nature Geoscience 2008, 1. [Google Scholar] [CrossRef]
- Manola, I.; Hurk, B.V.D.; Moel, H.D.; Aerts, J.C. Future extreme precipitation intensities based on a historic event. Hydrology and Earth System Sciences 2018, 22. [Google Scholar] [CrossRef]
- Zhang, W.; Villarini, G.; Wehner, M. Contrasting the responses of extreme precipitation to changes in surface air and dew point temperatures. Climatic Change 2019. [Google Scholar] [CrossRef]
- Lenderink, G.; Barbero, R.; Loriaux, J.M.; Fowler, H.J. Super-Clausius-Clapeyron scaling of extreme hourly convective precipitation and its relation to large-scale atmospheric conditions. Journal of Climate 2017, 30. [Google Scholar] [CrossRef]
- Schroeer, K.; Kirchengast, G. Sensitivity of extreme precipitation to temperature: the variability of scaling factors from a regional to local perspective. Climate Dynamics 2018, 50. [Google Scholar] [CrossRef]
- Gomis-Cebolla, J.; Rattayova, V.; Salazar-Galán, S.; Francés, F. Evaluation of ERA5 and ERA5-Land reanalysis precipitation datasets over Spain (1951–2020). Atmospheric Research 2023, 284. [Google Scholar] [CrossRef]
- Lavers, D.A.; Simmons, A.; Vamborg, F.; Rodwell, M.J. An evaluation of ERA5 precipitation for climate monitoring. Quarterly Journal of the Royal Meteorological Society 2022, 148. [Google Scholar] [CrossRef]
- de Vyver, H.V.; Schaeybroeck, B.V.; Troch, R.D.; Hamdi, R.; Termonia, P. Modeling the Scaling of Short-Duration Precipitation Extremes With Temperature. Earth and Space Science 2019, 6. [Google Scholar] [CrossRef]
- Wasko, C.; Sharma, A. Quantile regression for investigating scaling of extreme precipitation with temperature. Water Resources Research 2014, 50, 3608–3614. [Google Scholar] [CrossRef]
- Li, C.; Wei, Y.; Chappell, R.; He, X. Bent Line Quantile Regression with Application to an Allometric Study of Land Mammals’ Speed and Mass. Biometrics 2011, 67, 242–249. [Google Scholar] [CrossRef] [PubMed]
- Molnar, P.; Fatichi, S.; Gaál, L.; Szolgay, J.; Burlando, P. Storm type effects on super Clausius-Clapeyron scaling of intense rainstorm properties with air temperature. Hydrology and Earth System Sciences 2015, 19. [Google Scholar] [CrossRef]
- Berg, P.; Moseley, C.; Haerter, J.O. Strong increase in convective precipitation in response to higher temperatures. Nature Geoscience 2013, 6. [Google Scholar] [CrossRef]
- Pakalidou, N.; Karacosta, P.; Douka, M. Associating short-duration precipitation extreme events with land surface temperature in Thessaloniki. COMECAP2021, 2021.
- Jiang, Q.; Li, W.; Fan, Z.; He, X.; Sun, W.; Chen, S.; Wen, J.; Gao, J.; Wang, J. Evaluation of the ERA5 reanalysis precipitation dataset over Chinese Mainland. Journal of Hydrology 2021, 595. [Google Scholar] [CrossRef]
Figure 1.
Flowchart of the applied methodology.
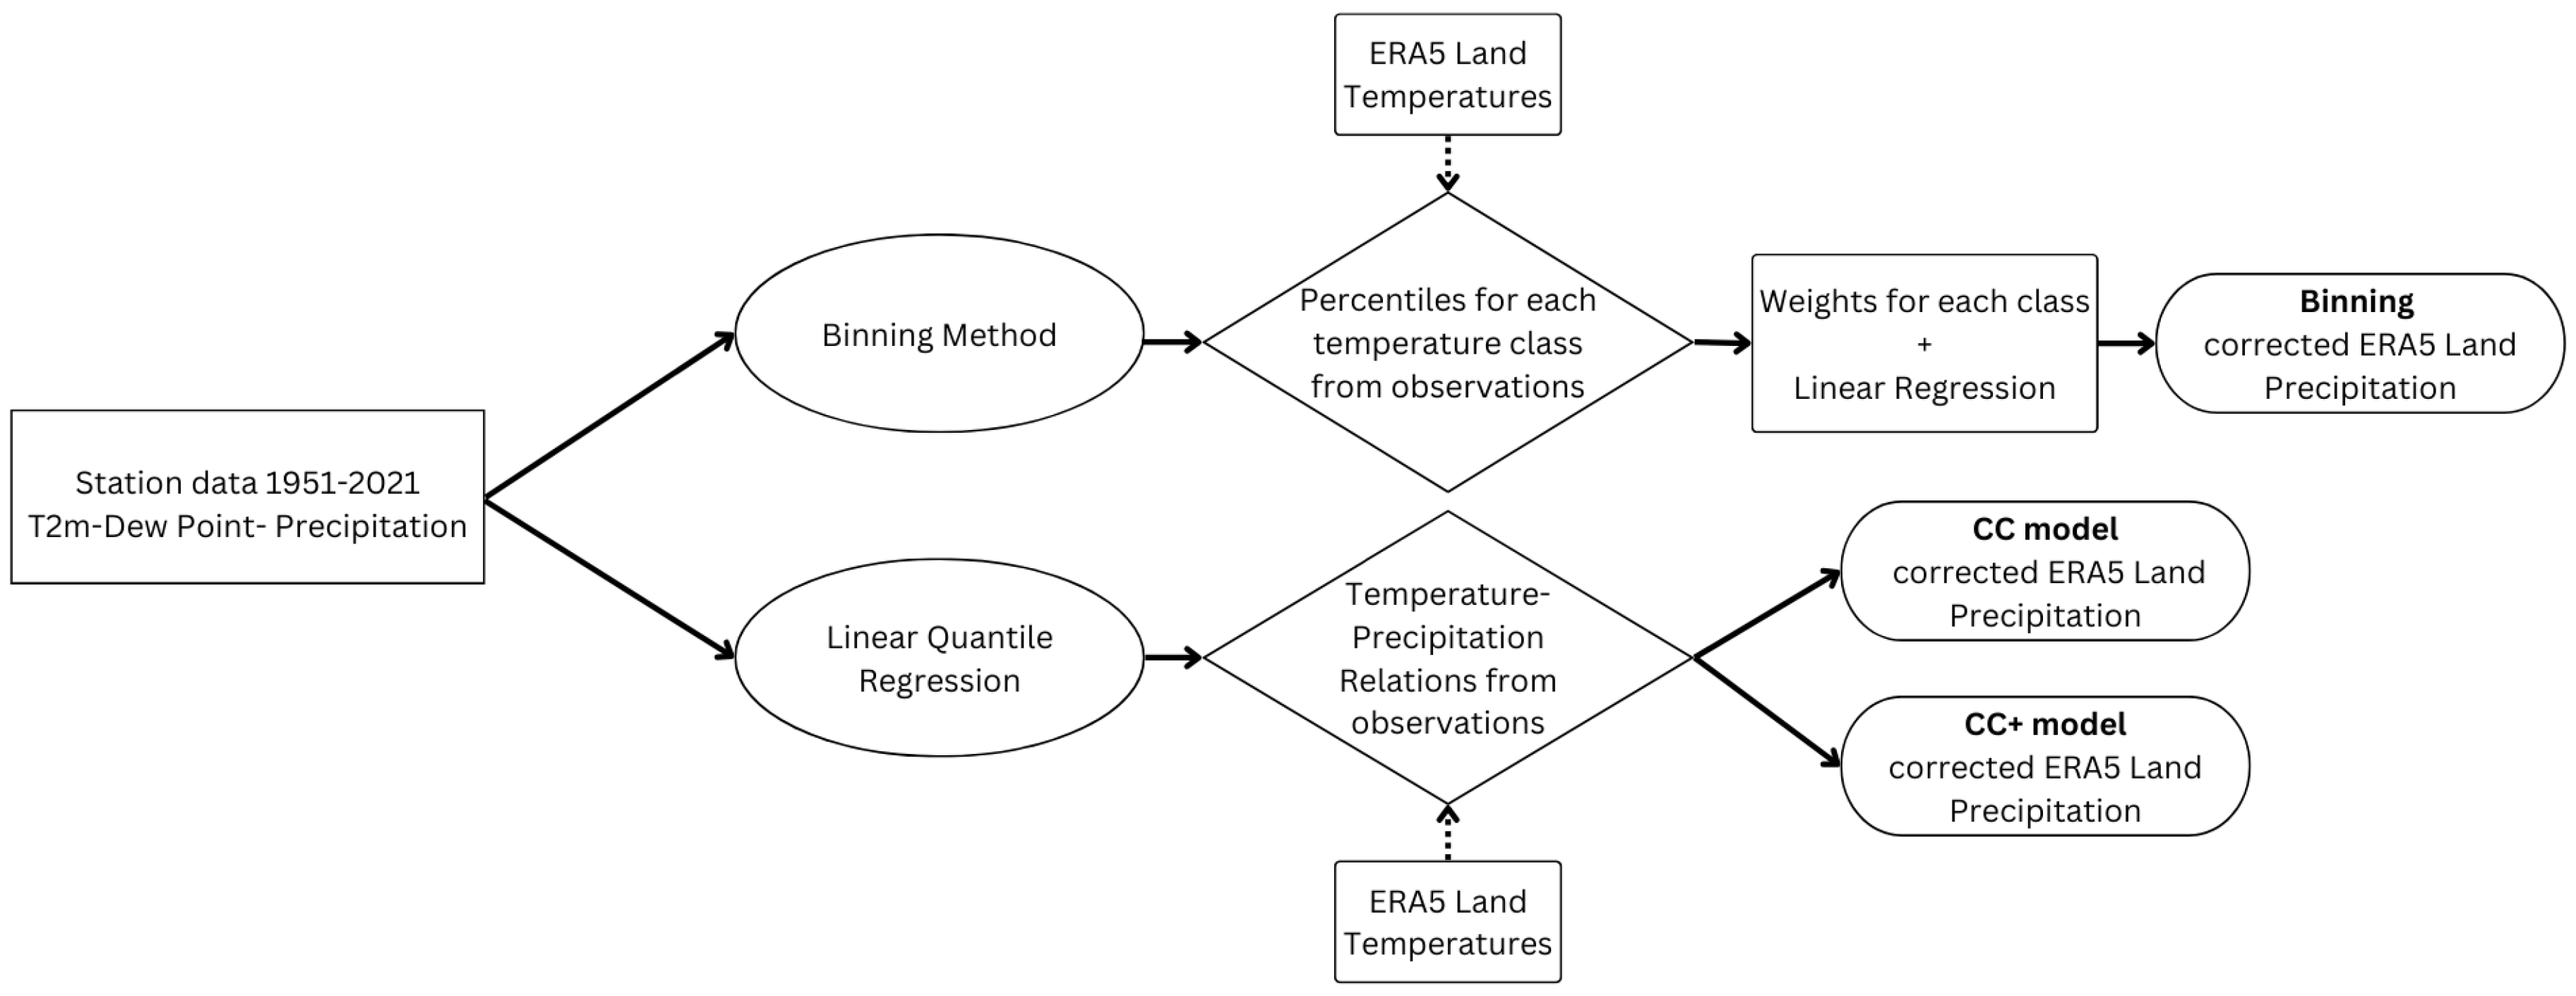
Figure 2.
Comparison between ERA5 Land and observations of daily temperatures at the day of extreme events (left) and 3-hourly precipitation events exceeding the 90th percentile (right).
Figure 2.
Comparison between ERA5 Land and observations of daily temperatures at the day of extreme events (left) and 3-hourly precipitation events exceeding the 90th percentile (right).
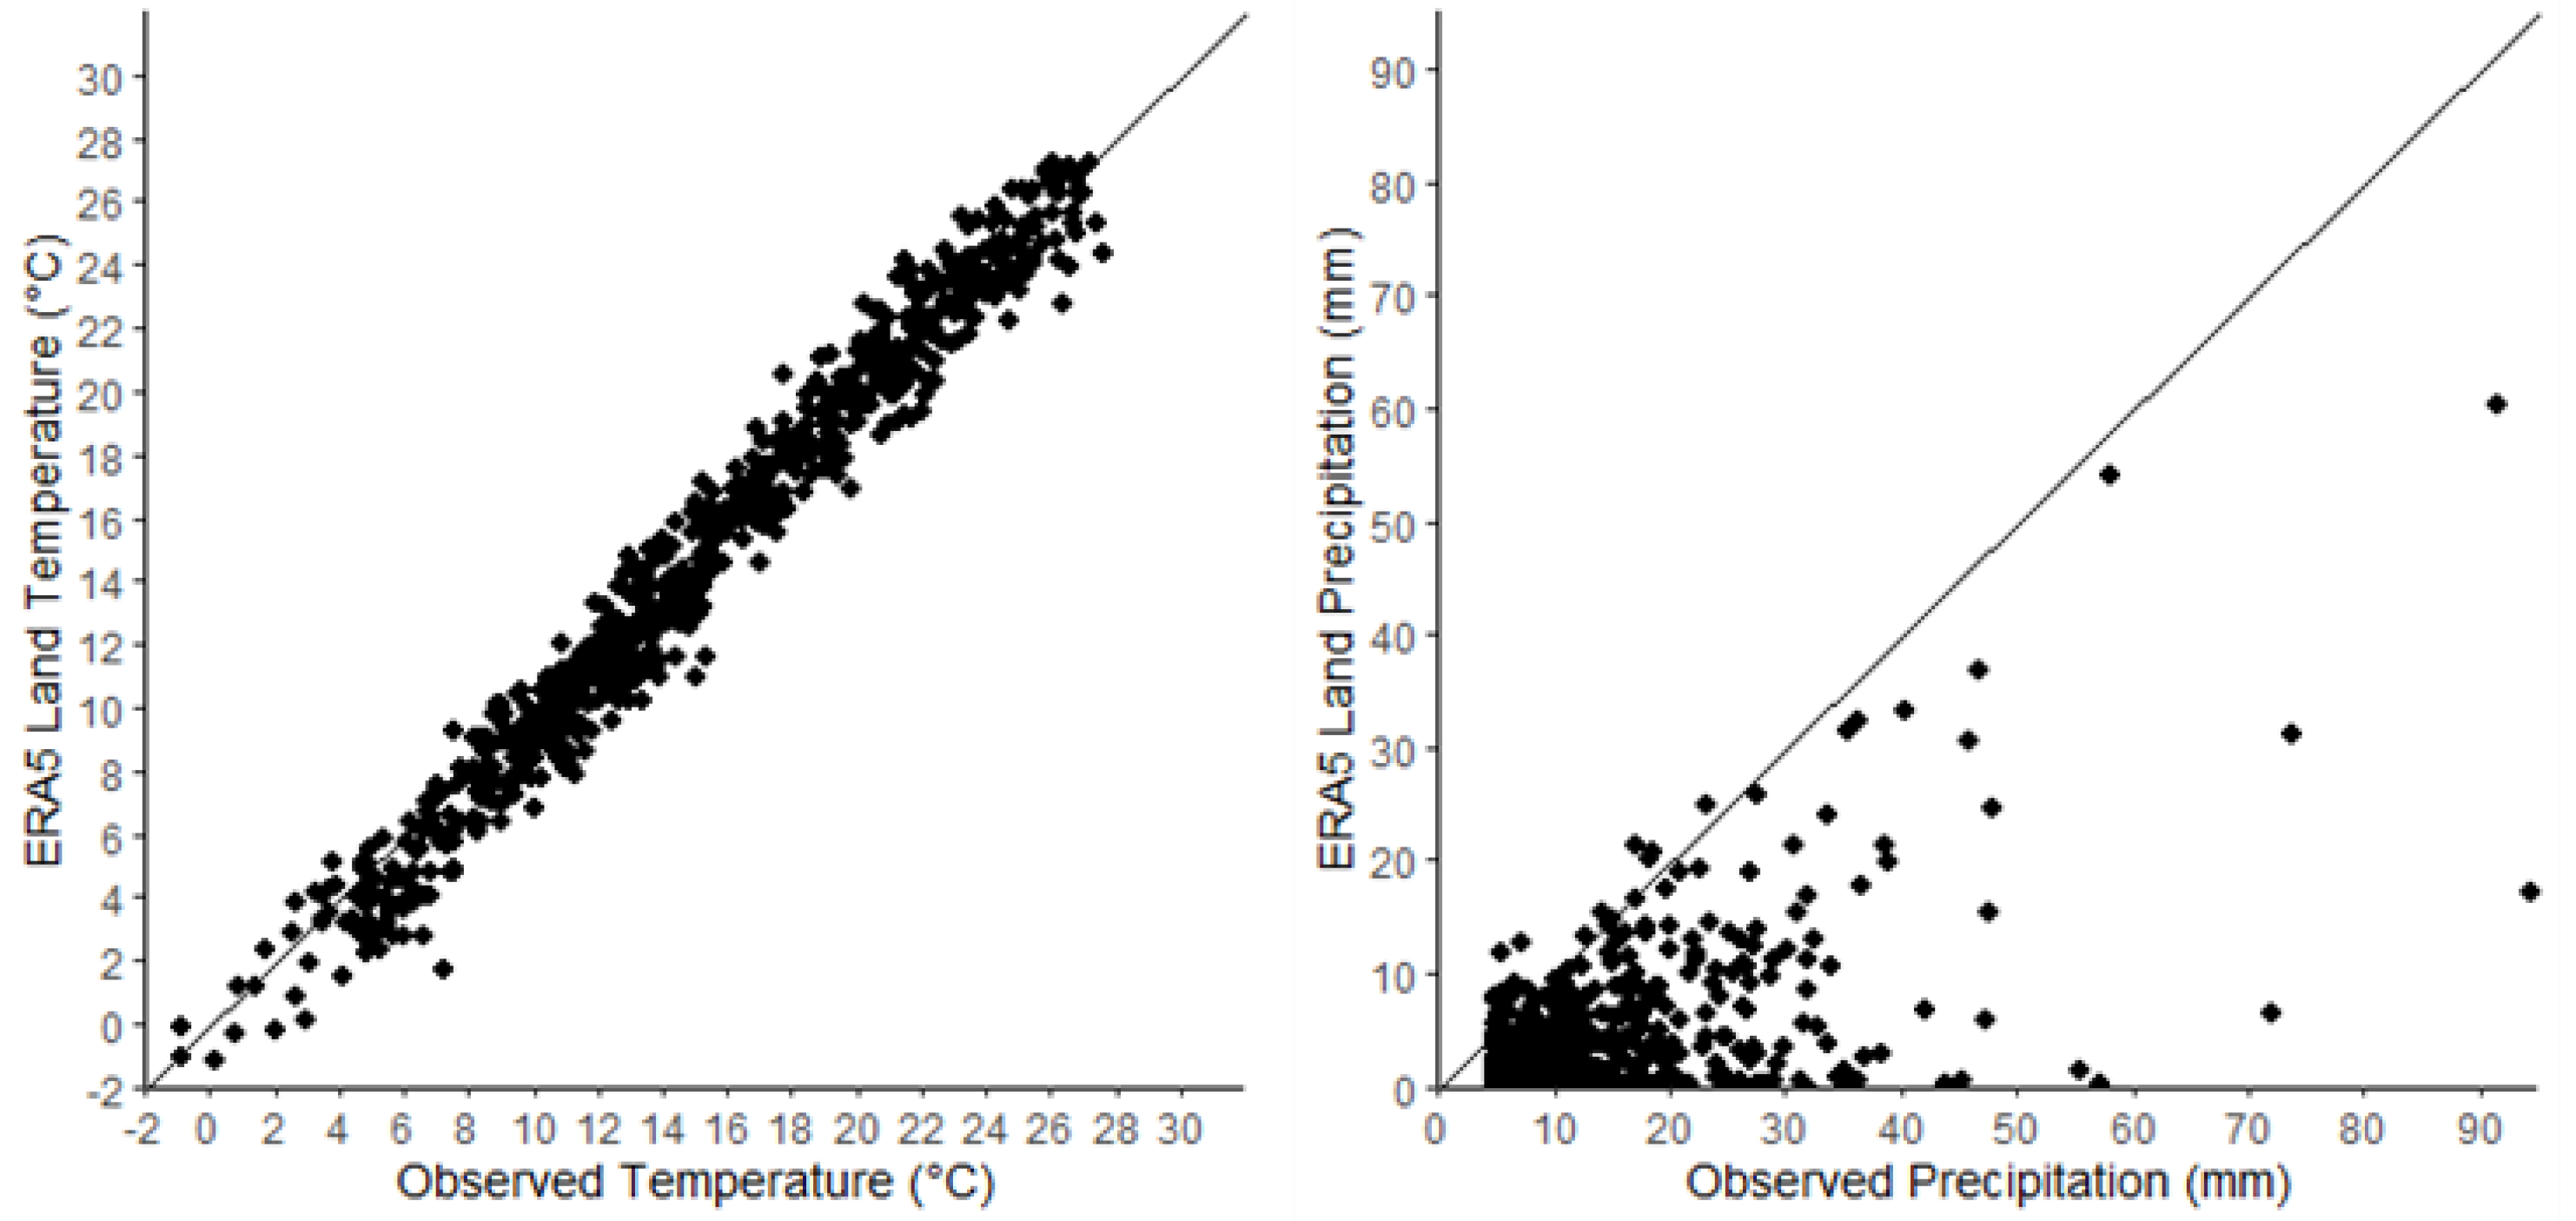
Figure 3.
Comparison of Quantile Regression (dashed lines) and Binning (solid lines) methodologies for the four upper percentiles of hourly precipitation with daily mean temperature. On the left, comparison of the CC model with the Binning method; on the right, comparison of the CC+ model with the Binning method. For a) the whole period 1951-2021, b) warm period (April-September) and c) cold period (October-March). Shown for reference: the CC rate (7%/°C) (red dotted lines) and 2CC (14%/°C) (green dotted lines).
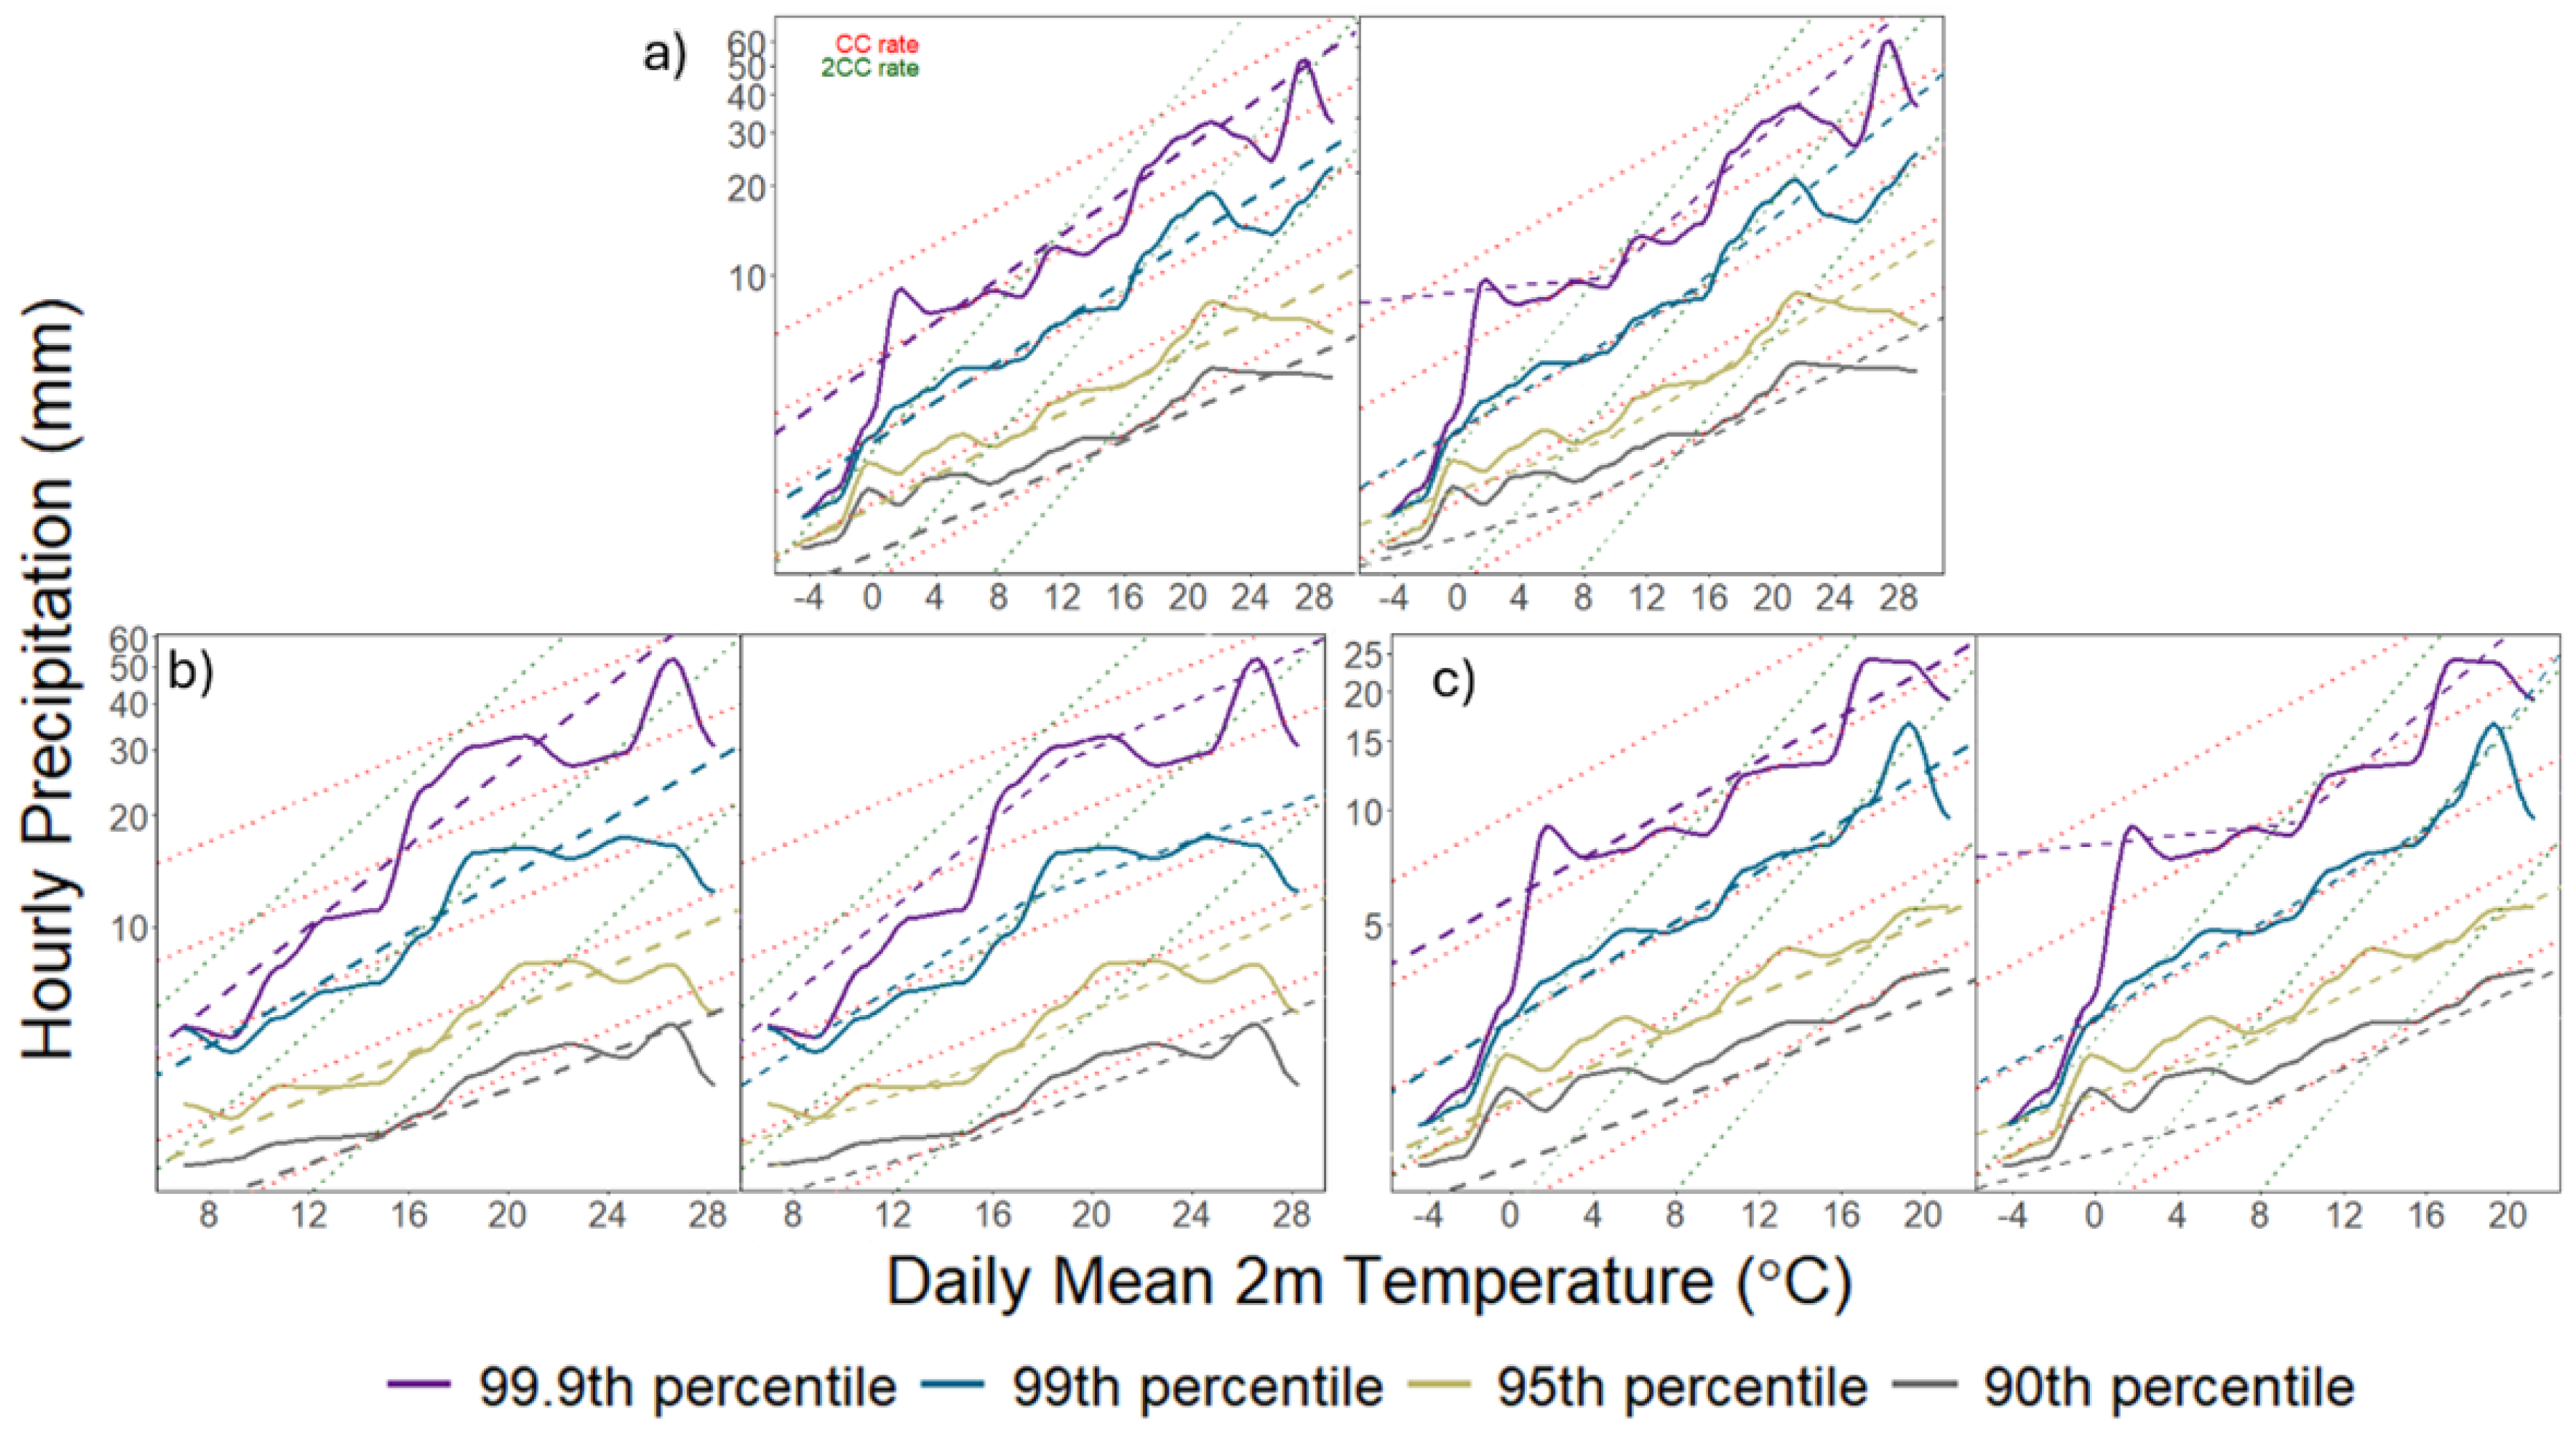
Figure 4.
Comparison of Quantile Regression (dashed lines) and Binning (solid lines) methodologies for the four upper percentiles of 3-hourly precipitation with daily mean temperature. On the left, comparison of the CC model with the Binning method; on the right, comparison of the CC+ model with the Binning method. For a) the whole period 1951-2021, b) warm period (April-September) and c) cold period (October-March). Shown for reference: the CC rate (7%/°C) (red dotted lines) and 2CC (14%/°C) (green dotted lines).
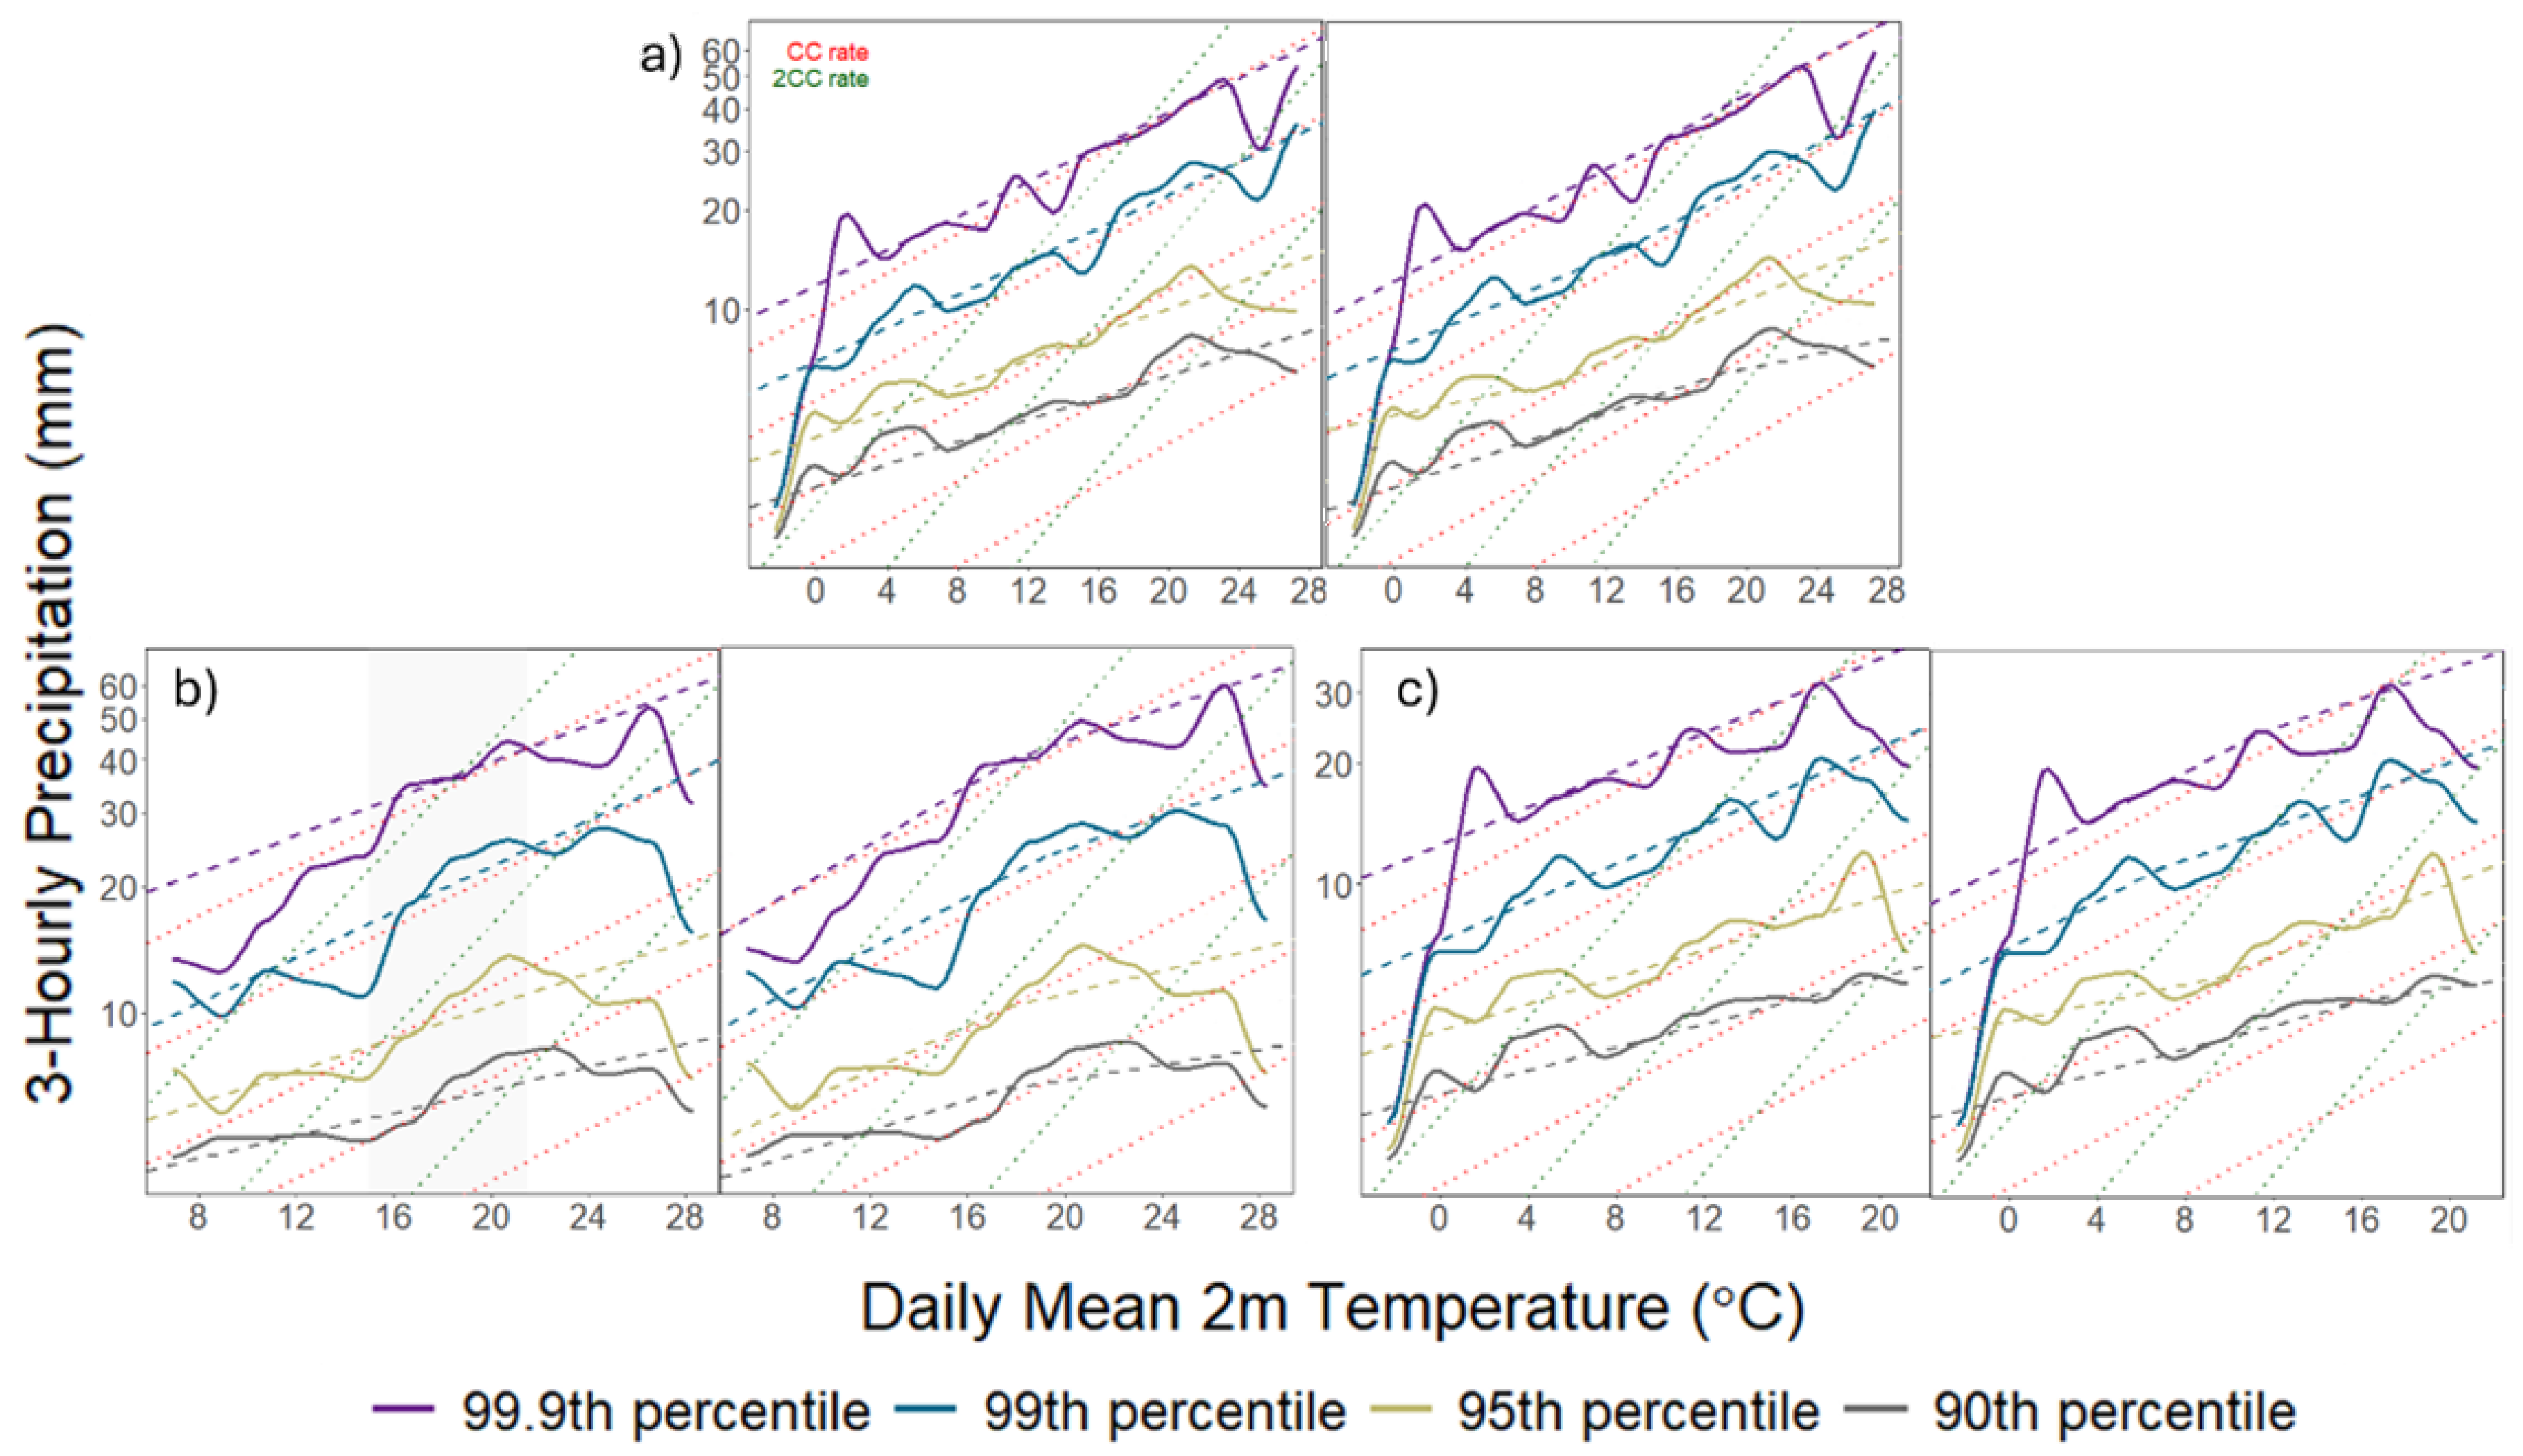
Figure 5.
Precipitation-mean daily temperature relationships between observations (black) and ERA5 Land (red) after applying the binning method to the 3-hourly data for the four upper percentiles (90th, 95th, 99th and 99.9th) Shown for comparison: the CC rate (7%/°C) (red dashed lines) and 2CC (14%/°C) (green dashed lines).
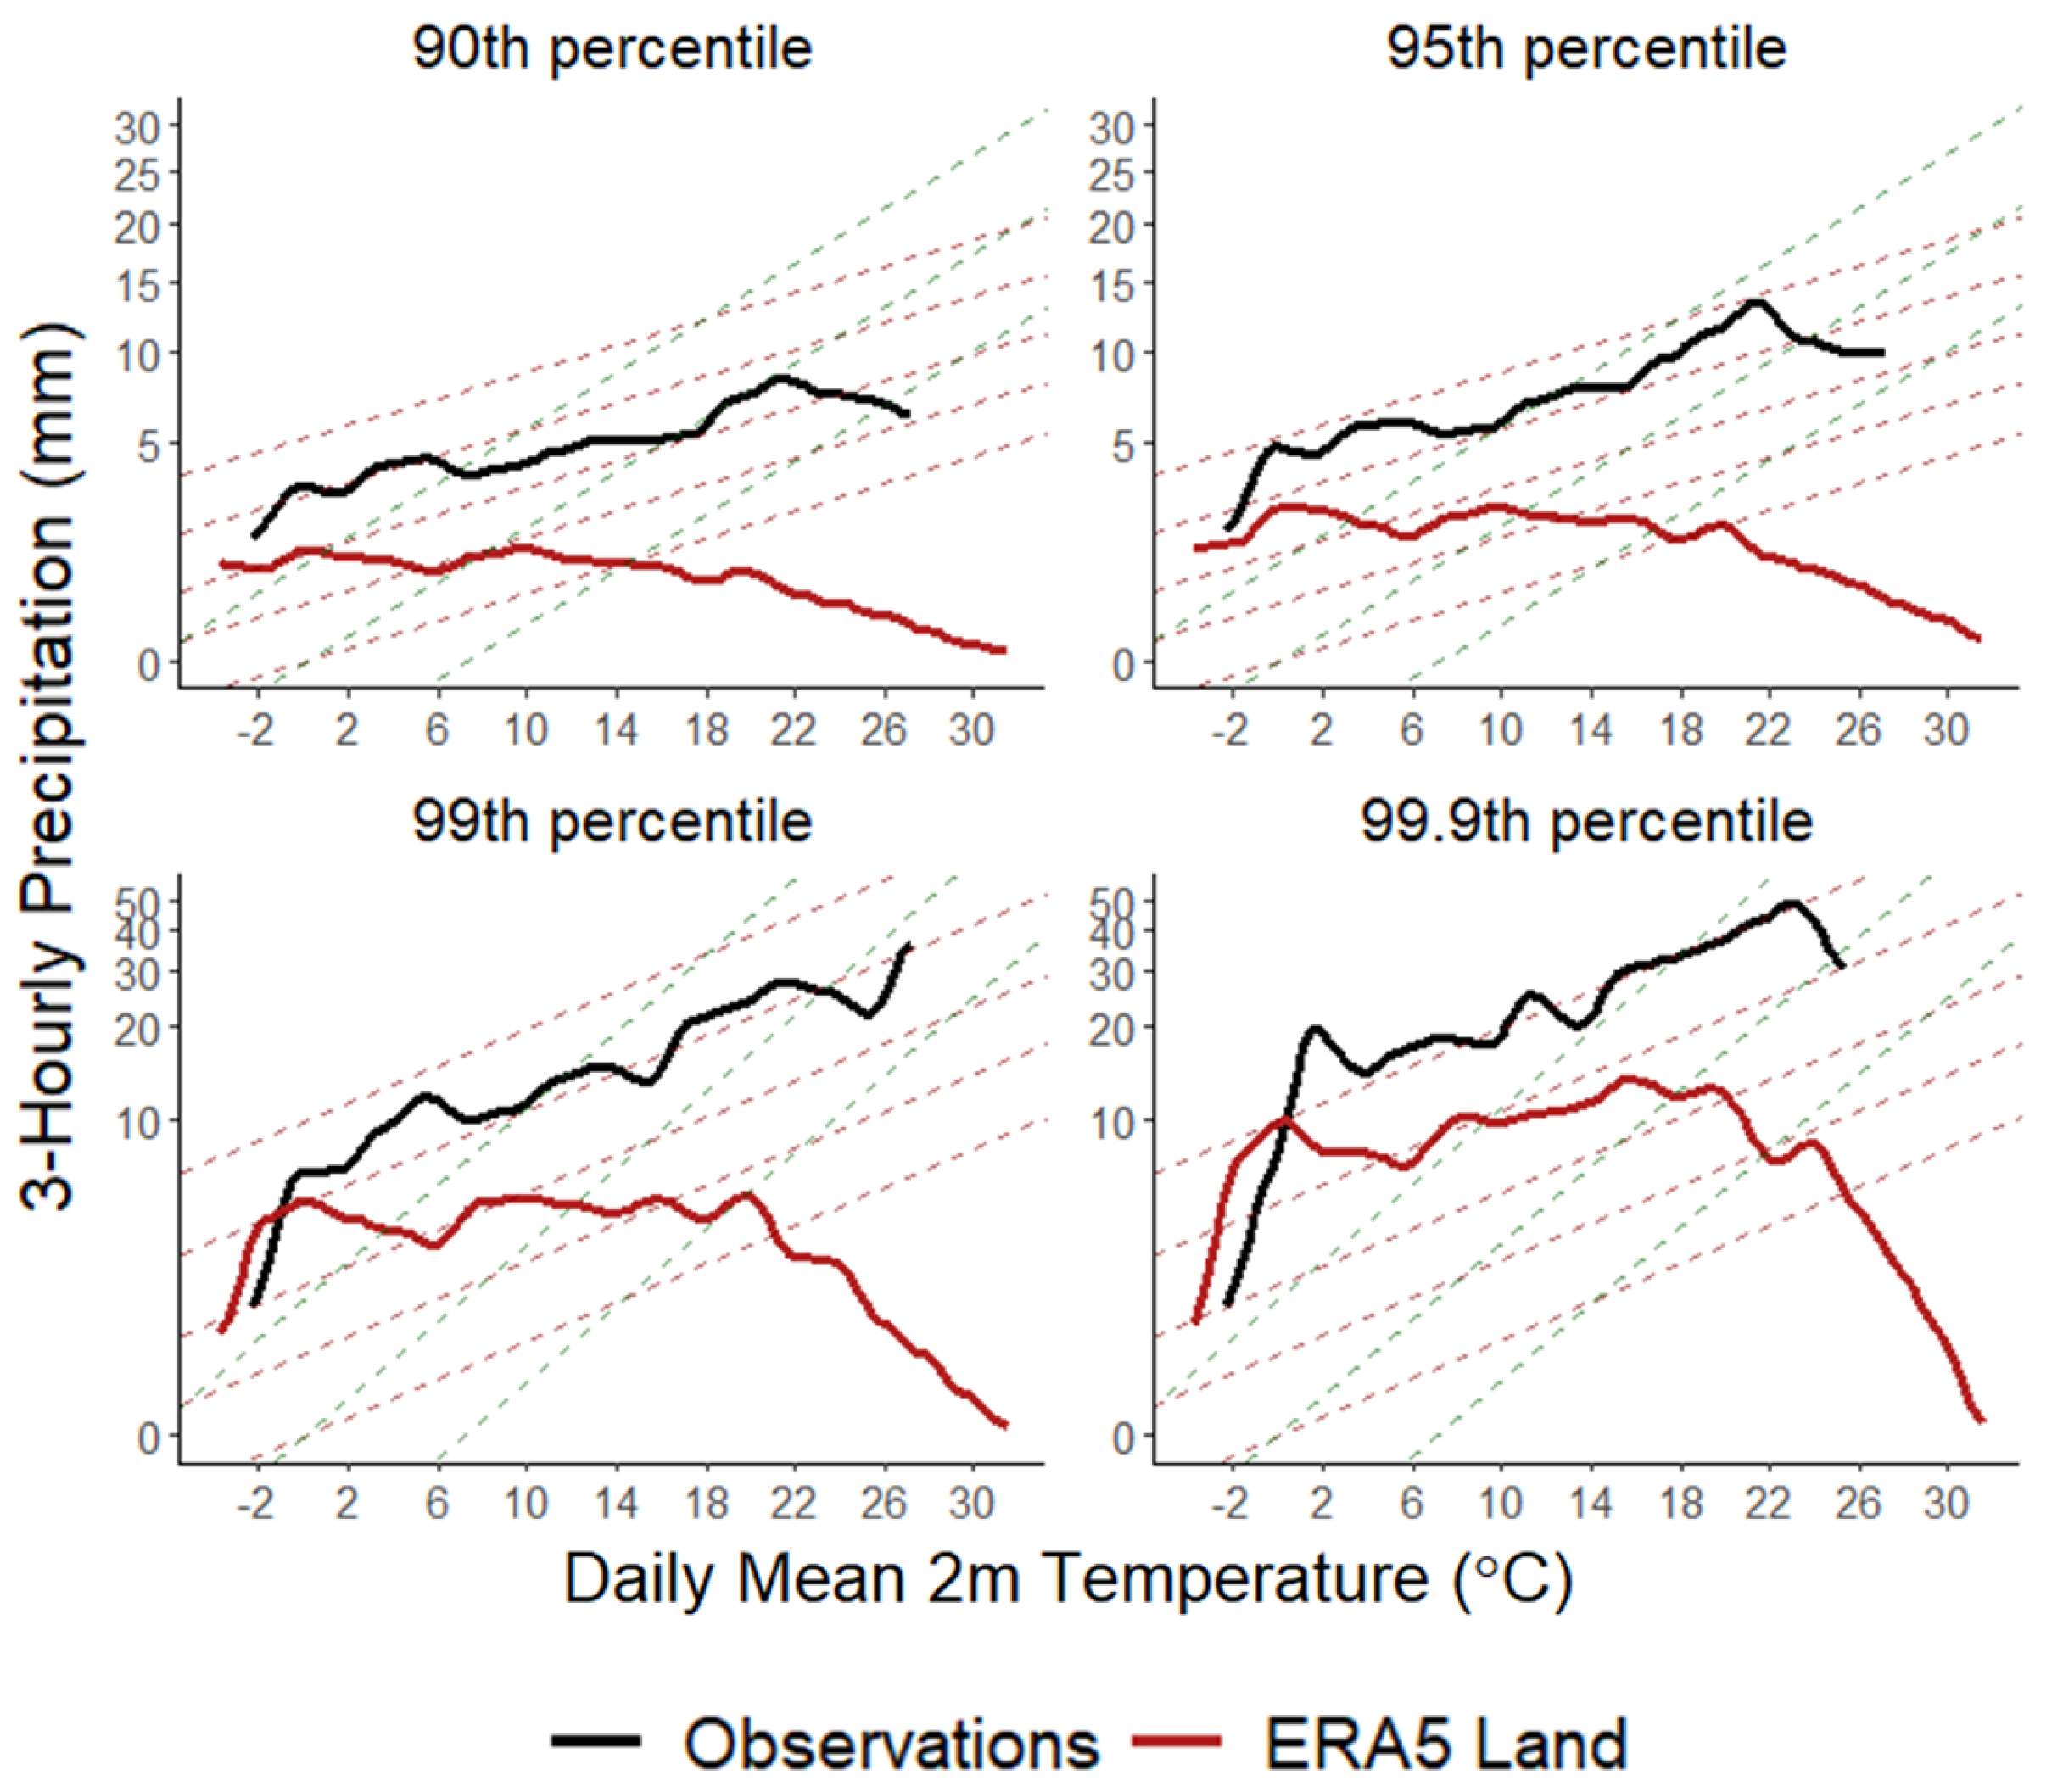
Figure 6.
Scatter plots of the upper percentiles (90th, 95th and 99th) of the 3-hourly rainfall values summed over the 24-hour period between ERA5 Land and station observations (black) and between ERA5 Land regressed with the CC (red) and CC+ (yellow) models of the Quantile regression method and with the Binning method (green). The line corresponds to x=y.
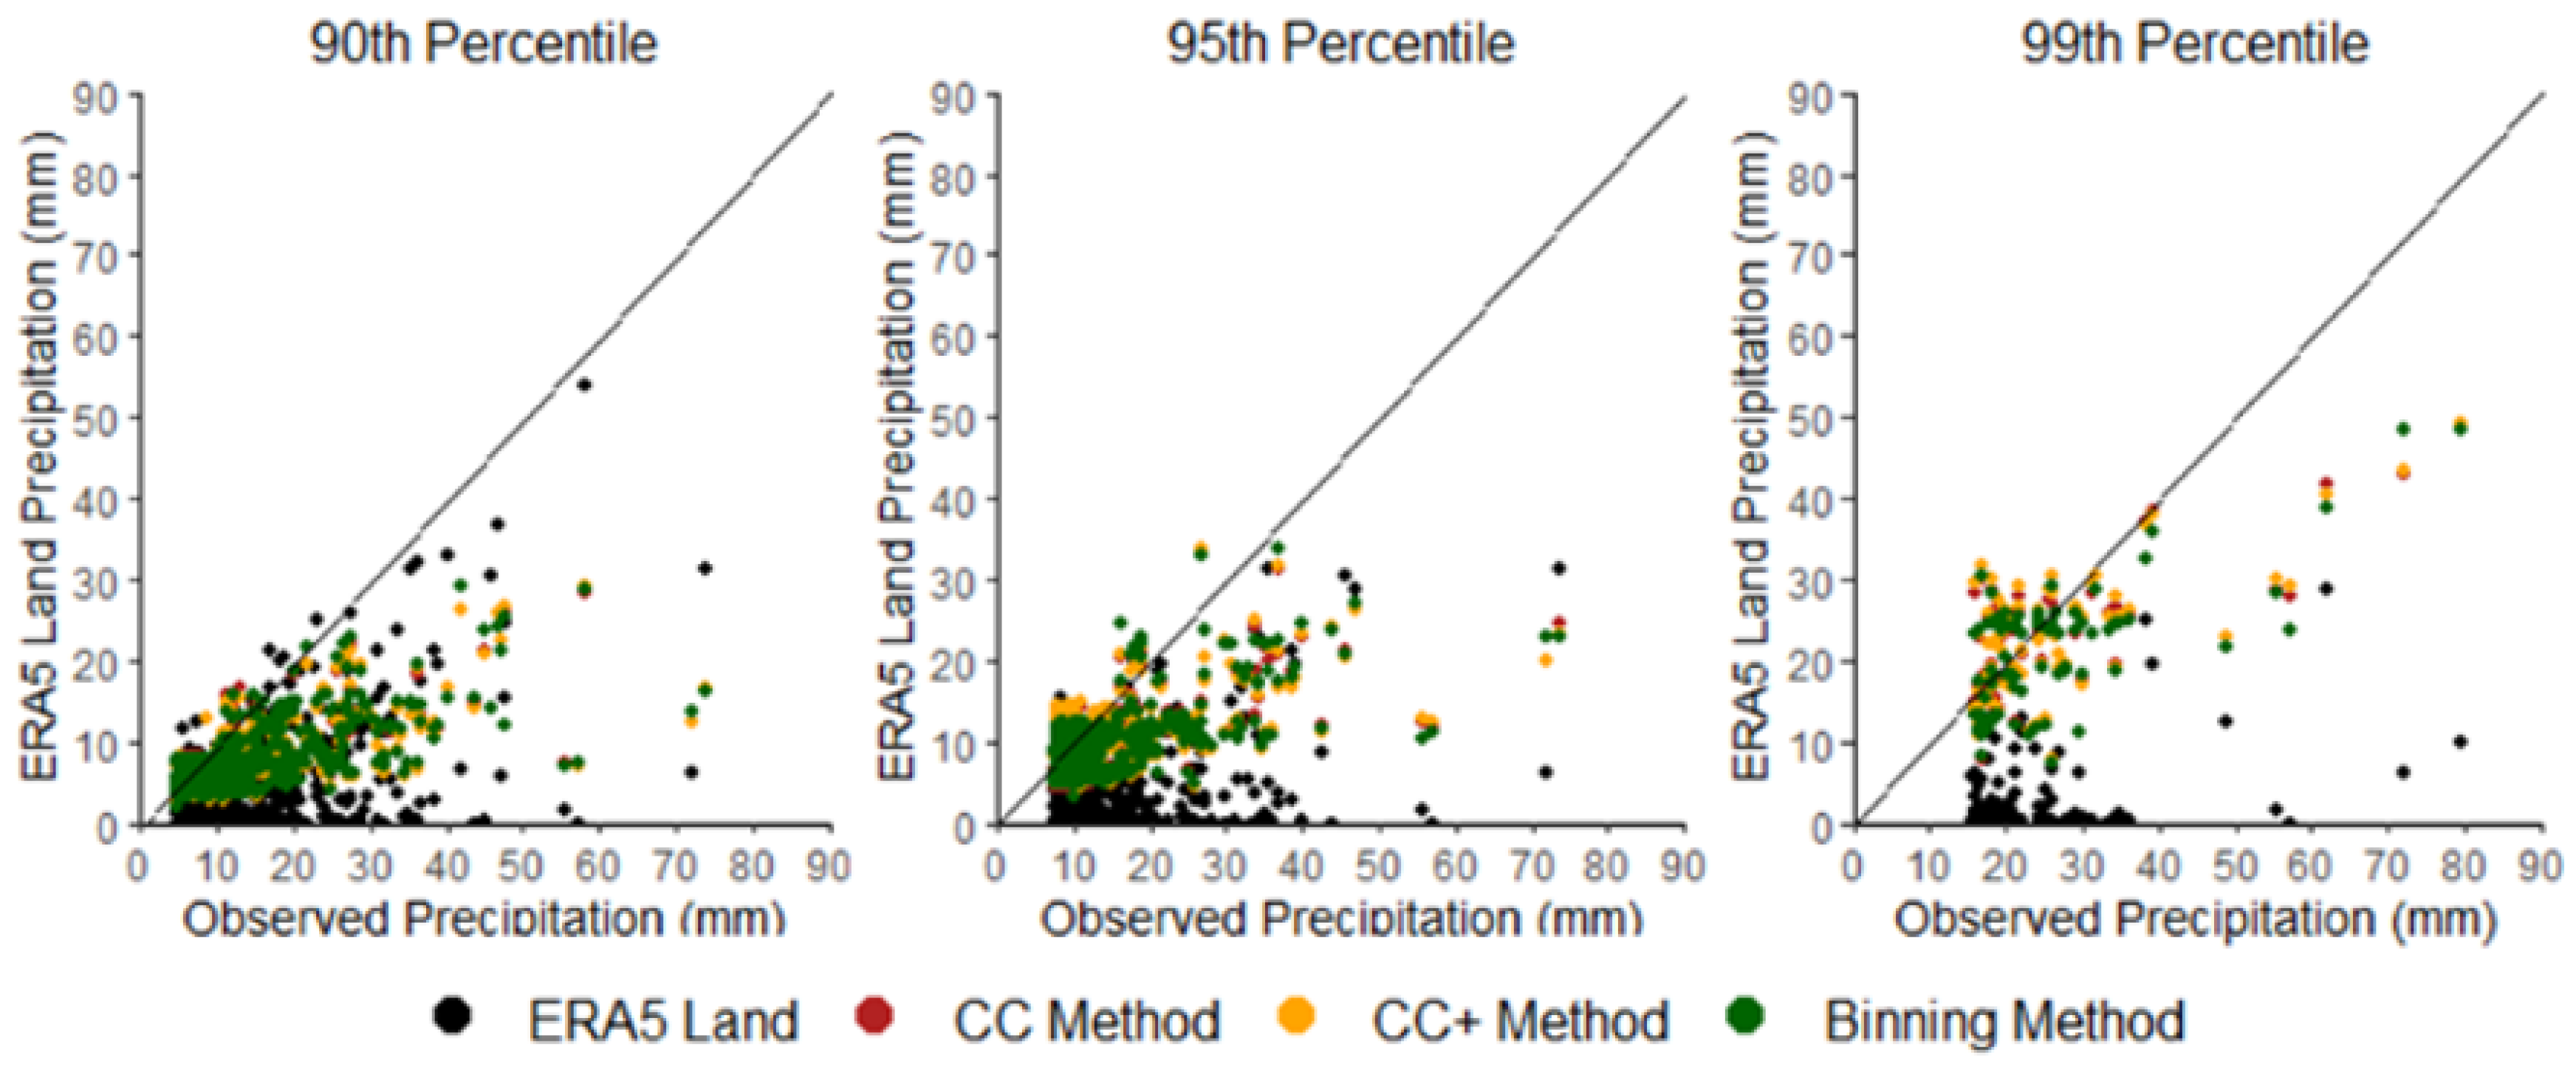
Figure 7.
Violin plots of the differences of station observations from the original ERA5 Land (black) and ERA5 Land recalculated with the CC model (red), CC+ model (yellow) and the Binning method (green) for the 90th, 95th and 99th percentiles of the 3-hourly rainfall values summed over the 24-hour period.
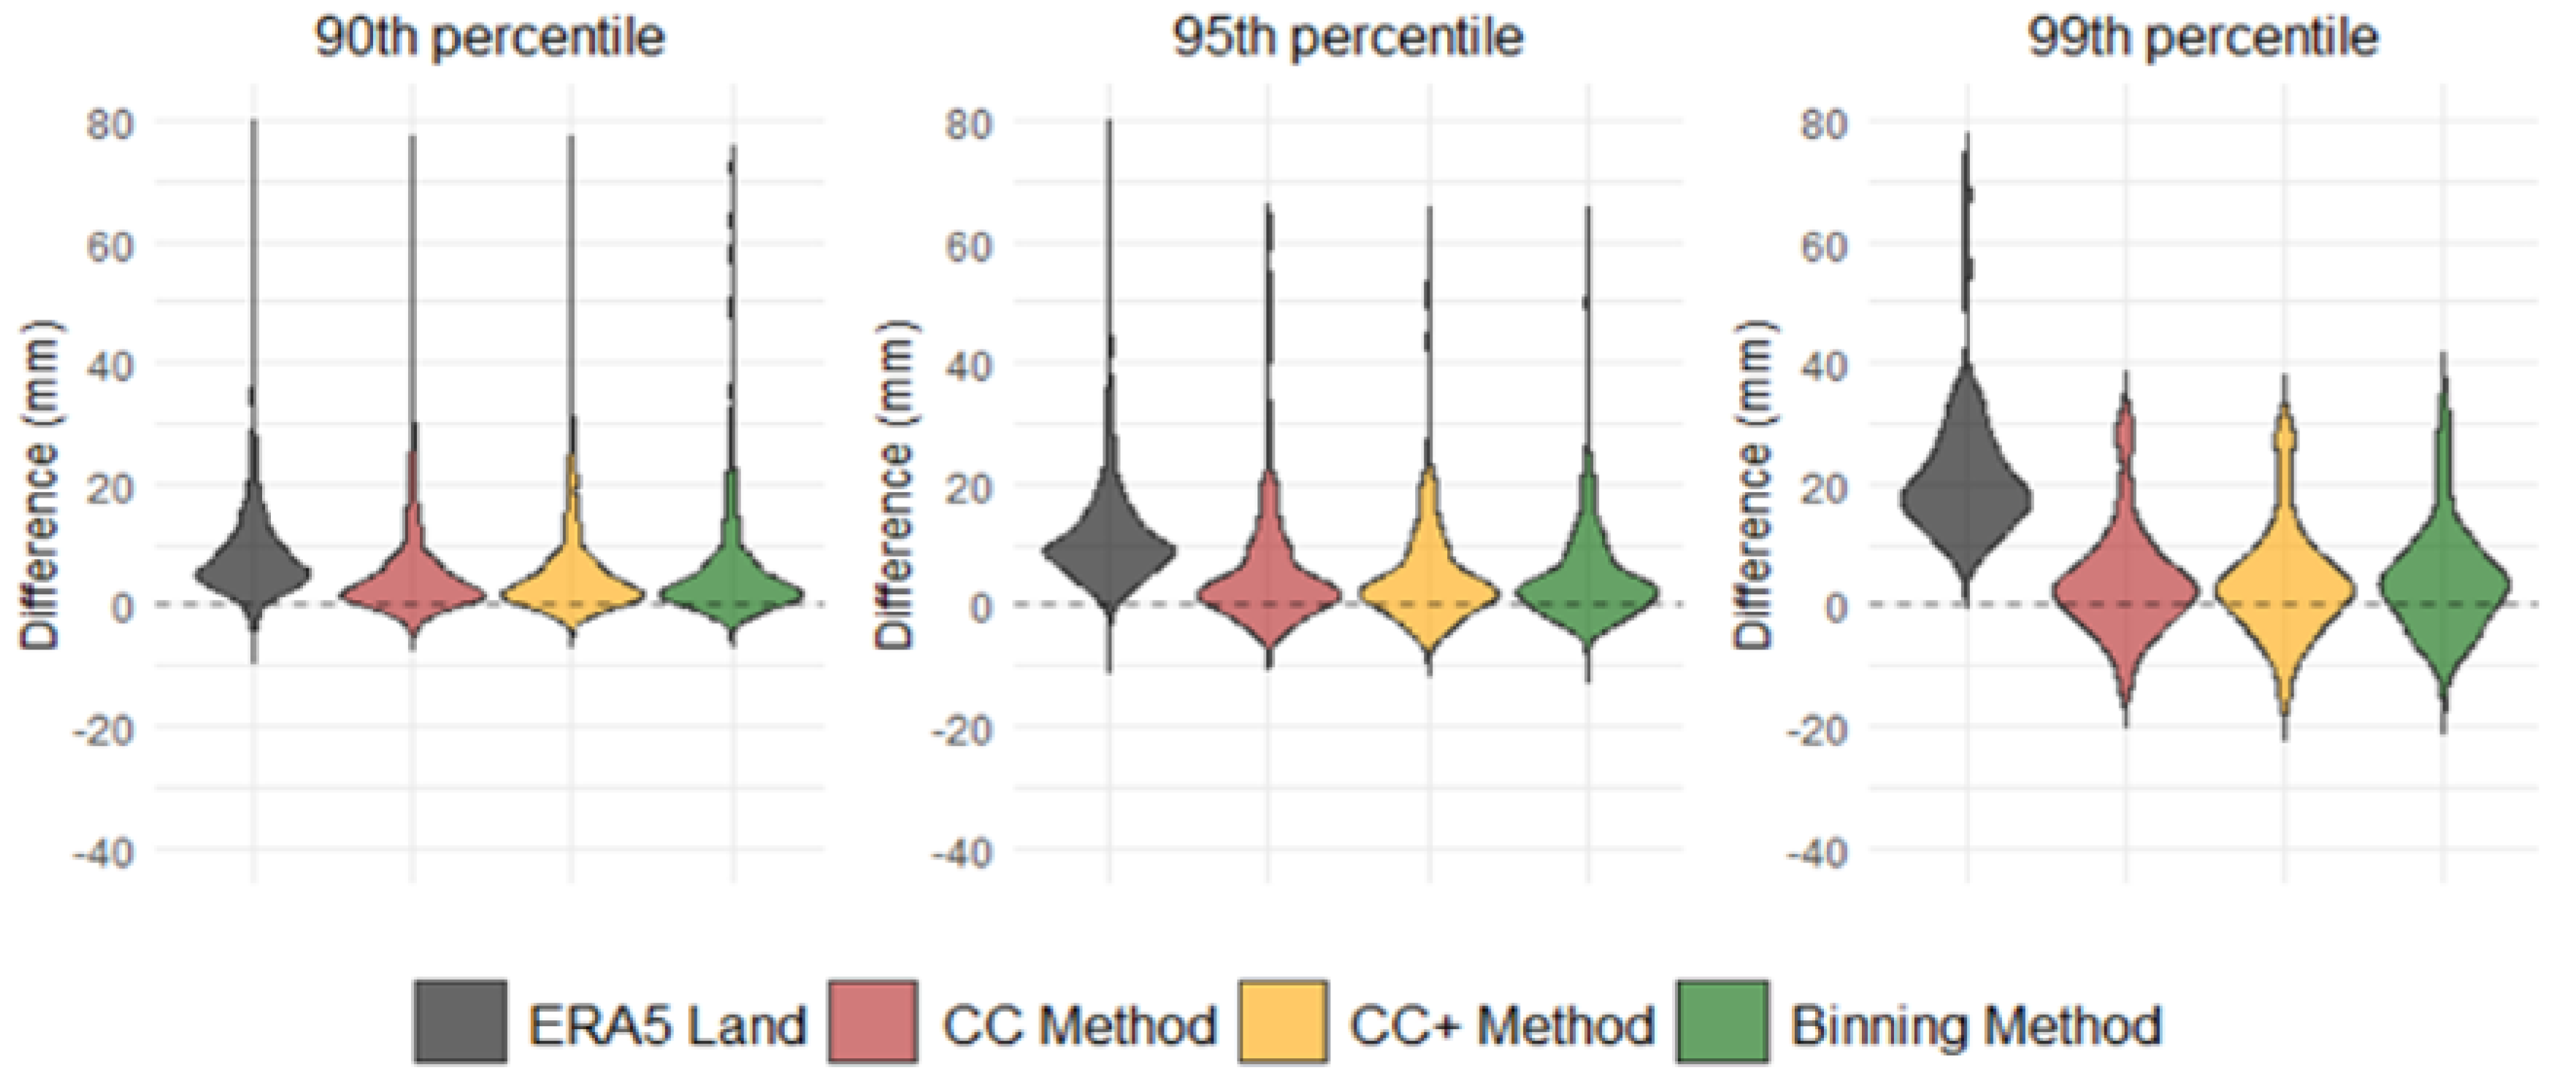
Table 1.
Scaling rates of hourly precipitation extremes to temperature, for each period and percentile and for both models (CC, CC+), as determined by the slope of the quantile lines. For the CC+ model, the temperature threshold () is shown. Shaded with gray is the best model according to BIC method. Super-CC rates are denoted in bold.
| P90 | P95 | P99 | P99.9 | |||||||||||||
|---|---|---|---|---|---|---|---|---|---|---|---|---|---|---|---|---|
| CC | CC+ | CC | CC+ | CC | CC+ | CC | CC+ | |||||||||
| (∘C) | (∘C) | (∘C) | (∘C) | |||||||||||||
| 1951-2021 | 5.4 | 3.4 | 5.9 | 8.1 | 5.9 | 4 | 7 | 9.3 | 7.7 | 6.8 | 9.9 | 14.1 | 8.3 | 1.2 | 10.5 | 9.5 |
| 1951-2021 Cold period |
4.8 | 3.5 | 5.5 | 8 | 5.2 | 4.1 | 6 | 8 | 7.2 | 6.8 | 15.8 | 16.1 | 6.6 | 1.3 | 10.7 | 9.7 |
| 1951-2021 Warm period |
5.7 | 4.3 | 6.2 | 15.1 | 6.7 | 5 | 7.5 | 15.1 | 8.7 | 9.9 | 5.6 | 17.7 | 12.3 | 13.3 | 7.3 | 18.5 |
Disclaimer/Publisher’s Note: The statements, opinions and data contained in all publications are solely those of the individual author(s) and contributor(s) and not of MDPI and/or the editor(s). MDPI and/or the editor(s) disclaim responsibility for any injury to people or property resulting from any ideas, methods, instructions or products referred to in the content. |
© 2024 by the authors. Licensee MDPI, Basel, Switzerland. This article is an open access article distributed under the terms and conditions of the Creative Commons Attribution (CC BY) license (http://creativecommons.org/licenses/by/4.0/).
Copyright: This open access article is published under a Creative Commons CC BY 4.0 license, which permit the free download, distribution, and reuse, provided that the author and preprint are cited in any reuse.


