
Submitted:
30 July 2024
Posted:
31 July 2024
You are already at the latest version
Abstract
Essential oils (EOs) have been gaining popularity in the past decades among researchers due to their potential to replace conventional chemicals used in the fight against pests, pathogenic and spoilage microbes and oxidation processes. EOs are complex mixtures with many chemical components the content of which depends on many factors – not just the plant genus, species or subspecies, but also chemotype, locality and climatic conditions, phase of vegetation, method of extraction and others. Due to this fact, there’s still much to study, with antimicrobial effect being one of the key properties of EOs. There are many methods that have been frequently engaged by researchers for in vitro evaluation; however, although the research has been going on for decades, an internationally accepted standard is still missing. Most of methods are based on time-proven standards used for testing of antibiotics. Due to the specific properties of EOs and their components, such as volatility and hydrophobicity, many modifications of these standard procedures have been adopted. The aim of this review is to describe the most common methods and their modifications for testing of antimicrobial properties of EOs and to point out the most controversial variables which can potentially affect results of the assays.
Keywords:
agar diffusion
; agar dilution
; antibacterial
; biofilm
; broth dilution
; plant extracts
; vapor phase
1. Introduction
Essential oils (EOs) are mixtures of volatile substances present in various parts of plants, including blossoms (e.g. lavender, orange blossoms, rose or ylang-ylang), buds (e.g. clove buds), seeds (e.g. anise seed, caraway or cardamom), pericarp (e.g. bergamot or grapefruit) or whole fruit (e.g. juniper berries), bark (e.g. cinnamon), wood (e.g. camphor, cedarwood or sandalwood), rhizomes and roots (e.g. ginger, turmeric or licorice) and predominantly leaves and stems (e.g. eucalyptus, lemongrass, mint, myrtle, oregano, rosemary, sage, tea tree or thyme) [1,2,3]. In general, the content of EOs in the plant material is very low (less than 5% of the dry matter) [4]. Thanks to their healing properties and pleasant aroma, essential oil-bearing plants have been used throughout the history of humanity to flavor food, cure illnesses, and for spiritual purposes in religious ceremonies [5]. EOs and their main components have been thoroughly studied in the past decades and their analgesic, sedative, anti-inflammatory, antibacterial, antifungal, antiviral, antioxidant, antiparasitic and insecticidal properties have been studied and reviewed in detail [2,3,6].
From the chemical point of view, EOs are formed mainly by terpenes and terpenoids, formed in the cytoplasm of plant cells [3]. More than 70,000 different terpenes and terpenoids have been described [4,5]. These substances are also called isoprenoids, as their structure is derived from the isoprene molecule (C5H8) [4,6]. Whereas basic terpenes are aliphatic or aromatic cyclic (e.g. α-pinene, β-caryophyllene, γ-terpinene, p-cymene, limonene) or acyclic (e.g. myrcene) hydrocarbons, terpenoids are modified terpenes with various methyl groups and functional groups containing oxygen. Based on the functional groups, they can be divided into alcohols (e.g. geraniol, linalool, menthol), aldehydes (e.g. citral), epoxides (e.g. β-caryophyllene epoxide, β-cedrene epoxide), esters (e.g. geranyl acetate, linalyl acetate), ether (e.g. 1,8-cineole, anethole), ketones (e.g. carvone) and phenols (e.g. carvarol, thymol). Although there are differences in sensitivity between various bacterial species, the antimicrobial activity generally decreases in order: phenols > aldehydes > ketones > alcohols > esters > hydrocarbons [3,4,5,7]. Terpenes (and subsequently terpenoids) can be also divided into several classes depending on the number of condensed isoprene molecules. Monoterpenes (2 isoprene units) are the predominant components of EOs (90%), followed by sesquiterpenes (3 isoprene units) [3,4,5,6,7].
The last important class of EOs’ components are phenylpropenes and phenylpropanoids. The name refers to the fact that plants synthesize them from phenylalanine, an aromatic amino acid. Although they are generally less common than terpenes, they may represent the major component in some oils like cinnamon EO or clove EO. The major phenylpropanoids are cinnamaldehyde and eugenol, but also cinnamyl alcohol, chavicol, estragole, isoeugenol, safrone or vanillin belong into this class [3,5].
EO is generally a mixture of approximately 20–60 chemical substances at various concentrations, but some EOs may contain even several hundred different components [4]. The primary constituents of EOs can make up as much as 85% of the total composition, and typically, they determine the biological characteristics of EOs. Nevertheless, the remaining 15% consists of minor components. Despite their lower presence, these minor components play a crucial role in biological activities by synergistically interacting with the major constituents [2,4,8].
The practical utilization of EOs is wide – traditionally in perfumery, aromatherapy and pharmacy, currently in both human [9] and veterinary medicine [10]. Their flavoring, antimicrobial and antioxidant properties also find use in cosmetics [11] and food and beverage industry [12,13,14]; in agriculture EOs are used against plant diseases, pests, and weeds [15]. The potential for application of EOs in large scale has been increasing not only due to the higher degree of knowledge and technological advancement, but also thanks to the inclination of part of population to natural products as alternatives to industrial, synthetized antibiotics (the efficacy of which is threatened by increasing resistance among the target organisms) and food additives (with possible negative side-effects on human health) [16].
Given the number of plant species, subspecies and chemotypes, there are plentiful possible sources of essential oils with beneficial properties. It has been estimated that about 3000 various EOs are known so far [8], but only part has been scientifically studied and only about 100 of the most common EOs have its own ISO norm with specified characteristics. The interest in EOs is demonstrated by increasing number of publications per year dedicated to EOs (Figure 1) and establishment of specific scientific journals - Journal of Essential Oil Research (since 1989) and Journal of Essential Oil Bearing Plants (since 1998).
For assessment of efficacy of conventional antibiotics, standardized procedures have been used for years. The antibacterial properties of EOs has been studied for a shorter period of time and no standardized method has been officially established so far. The researchers usually adapt methods used for antibiotics as described by CLSI (Clinical & Laboratory Standards Institute) or EUCAST for EU (European Committee on Antimicrobial Susceptibility Testing) organizations, intended for determination of susceptibility of microorganisms as surveillance of occurrence and spreading of resistance to antibiotics [17,18,19]. However, lipophilic, volatile substances in EOs may not be suitable for testing by the same methods as conventional antibiotics [18]. Differences in experimental conditions may lead to big variances between results even when using the same method in principle [20]. This can lead to variations in results between research groups [18].
The aim of this review is to summarize the most frequently used methods and their various modifications, analyze the variables and the published data, and suggest the most fitting procedures for analyzing antimicrobial activity of EOs.
2. Determination of Minimum Inhibitory Concentration (MIC)
MIC can be described as the lowest concentration of the tested EO that inhibits the growth of the tested microorganism. MIC determination allows quantitative measurement of the in vitro antimicrobial activity, providing results in easily interpreted units. Knowledge of the effective concentration can be further used in practical application of EO’s in foodstuffs, medicinal products, etc., although it is a well-known fact that due to the complexity of real matrices the EOs are generally effective in much higher concentrations than in in vitro studies [6,16,21].
The determination is based on incorporation of different (usually two-fold) concentrations of the EO into the medium together with a standardized inoculum of the tested microorganism. The series of EO’s dilutions can be prepared in either liquid (broth dilution) or solid (agar dilution) non-selective medium. A positive control (without the tested EO) should be always included. Multiple studies used also one or more antibiotics as negative controls [22,23,24,25,26,27,28]. In broth dilution, negative controls without the testing microorganisms may be used to exclude any contamination during pipetting [29,30,31].
2.1. Broth Dilution Method
Broth dilution, and especially microdilution, is a popular method, highly standardized for testing of antibiotics [17,18,19]. The most important variations of this method include use of solvent (emulsifier), broth type, units and determination of the MIC endpoint [18,19]. For macrodilution (tube dilution) method, volume of 1 – 10 mL is used, whereas for microdilution method the volume ≤ 0.5 mL (most usually 0.1 mL in a 96-well microtitration plate) is used [32,33]. The major drawback of the macrodilution method is the larger amount of EO and medium used, larger space used in the incubators and greater labor during pipetting due to the impossibility to use a multi-channel pipette, which may easily lead to errors [19]. The methodologies generally originate from standardized methods on testing of antibiotics, where 1 mL is required as the minimum for broth macrodilution [34]. In practice, the final volume of 1 mL [35], 2 mL [36,37,38] or as much as 10 mL [39,40] has been used for testing of EOs.
Broth microdilution has been much more in use during the past decades (Figure 2), both for economic reasons and reproducibility [19]. However, some studies suggest that the transition of the vapours between wells can affect the microplate assay results [30,37].
Microplates treated with surface coating intended for tissue cultures should be avoided, as such surface was proved to partially bind the lipophilic antimicrobials, leading to increased MIC [33,41]. Similarly, microplates with special non-binding, hydrophilic coating showed lower MIC values for lipophilic antibiotics than the other polystyrene microplate types [41].
2.1.1. Inoculum Density
The protocols originate in standardized antibiotic testing [34,42], which has been described in detail in several scientific publications [19,33]. A broth microdilution method specifically for EOs has been proposed in 2021 [43], but has not made into an international standard. Even through inoculum size may influence the results [20], the vast majority of studies use the final inoculum size 5 × 10⁵ cells/mL as described in the standards, prepared from a suspension matching the 0.5 McFarland turbidity standard [34,42]. Although in generally, the cell density in an assay and the EO’s efficiency are inversely proportional, it may not work the same for all the EOs or their components and for all the bacterial species [20,44].
2.1.2. Type of Broth
Most studies use Mueller Hinton Broth (MHB) as the cultivating medium for testing antibacterial properties of EOs [26,27,28,41,45,46,47,48,49,50,51,52,53,54,55,56]. The reason is again the CLSI and EUCAST manuals, where cation-adjusted MHB is the mandatory medium for testing resistance of non-fastidious aerobic bacteria to antibiotics [34,57]. However, other authors used also Tryptic Soy Broth (TSB) [29,31,37,43,58], Brain Heart Infusion (BHI) [24,30,59,60], Luria-Bertani broth [35,61,62,63,64,65,66] or Nutrient broth [39,67,68,69,70]. Although TSB showed significantly lower MIC values than MHB (p < 0.001) and BHI (p = 0.006) in my previous study [71], the differences would be insignificant in a two-fold dilution assay. However, the disadvantage of MHB is that the medium is less nutritious and requires supplementation to allow growth of even mildly fastidious microorganisms, which may pose a problem when comparison of various bacterial species is the aim of study.
2.1.3. Stabilization of the oil-in-Water Mixture
The use of solvents and/or emulsifiers for dissolving of EOs has been long discussed [8,20,55]. The lipophilic nature of EOs is important for their antimicrobial properties, as it allows them to dissolve in the cell membrane, leading to increased permeability and loss of intracellular matrix, and to pass through the phospholipid bilayer of the bacterial cell membrane, exerting the inhibitory effect on in-cell targets [4,6,16]. On the other hand, the same key feature may lead to problems with dispersion of the hydrophobic compounds in aqueous phase represented by the cultivation medium. Although some authors did not find the use of dispersing agent necessary [31,48,59,68], especially with constant shaking during incubation [64], most studies used various methods how to ensure the maximum contact of EO with the target bacteria.
Chen et al. [55] studied the dispersion of carvacrol in water and MHB after 2 min and 12 h without shaking. Although carvacrol (unlike the bacterial cells) tended to accumulate in the upper layer, it was visibly much better dispersed in broth than in water, as vigorous shaking in broth led to an emulsion like solution and only slow separation into a hydrophilic and a hydrophobic phase, especially at lower concentrations. Addition of lysed horse blood (2%), a necessary growth enrichment for fastidious bacteria, was also reported to act as surfactant [41]. In determining if any stabilizing agent is necessary, the solubility of the major components of the EO in question should be taken into account, as many of the compounds are partially miscible with water (Table 1). Eucalyptol (eucalyptus, rosemary), eugenol (clove), linalool (coriander seed, lavender), carvone (spearmint) and trans-cinnamaldehyde (cinnamon) may not need aid in broth dissolution, carvacrol (oregano) and thymol (thyme) are less soluble and menthol (peppermint), citral and limonene (lemongrass, citrus) will need solvent/ stabilizer to prevent stratification in the broth. It is worthwhile to highlight that terpenes are generally less water soluble than terpenoids and that the solubility may differ between various batches of EO of the same botanical species, as poorly soluble terpenes p-cymene and γ-terpinene are precursors of much better soluble, phenolic monoterpenoids carvacrol and thymol, respectively, and their ratio may vary between geographical regions, chemotypes and harvesting seasons [8].
The most common solvents for dilution of EOs are dimethyl sulfoxide (DMSO) [23,26,27,28,30,49,60,63,70] and ethanol [25,35,45,58,69,73], used alone or in combination with an emulsifier, followed by methanol [22,24,74]. The solvent is usually used only to prepare stock solution of EO which is further diluted by broth in the assay [23,30,45,51,58,63,70,74], but some authors spiked the broth instead [26,27,49,60]. Whatever diluent is used, it is crucial to verify that the maximal concentration used in the assay won’t interfere with growth of the tested bacteria by including it in the positive control [41,55,75]. In the study of Wadhwani et al. [75] ethanol was found to be the less appropriate solvent as it was the most inhibitory against the tested bacteria. On the other hand, no difference between the solvents was found in agar dilution for Escherichia coli [55]. However, both studies suggest to decrease the final concentration of the solvent in any assay as much as possible, with the recommended value ≤ 1%, in order to prevent potentiation of antimicrobial effect of the tested EO. Although many studies are within these parameters [23,26,30,60,62], some used 2%, [75] 3% [49], or even 4.4% [28] of DMSO as the final concentration. The antimicrobial effect of the solvent may be species dependent and is necessary to verify in advance, especially for testing of fastidious species.
Non-ionic surfactants can also stabilize the emulsions of hydrophobic EOs. Polysorbate 80 (Tween 80) [29,37,41,43,50,51,63,77,78,79,80] has been used in many studies as emulsifier, either alone or in combination with solvents [63]. Deceleration of the separation process of EO from the water phase enables a more efficient inactivation of bacterial cells [44]. It was also suggested that Tween 80 reduced binding of the lipophilic antibiotics to the plastic surface of the microtiter plate [41]. However, 0.5% of Tween 80 had inhibitory effect on Helicobacter pylori [81]. Nielsen et al. [78] noted a stimulating effect of Tween 80 itself on growth of Staphylococcus aureus and inhibitory effect to Pseudomonas fluorescens in concentration of 0.1%. It was also stipulated that Tween 80 at higher concentrations forms such small micelles that EO is entrapped inside and not in contact with bacteria, whereas the bigger droplets are more effective [20,44]. On the contrary, Tween 80 and Tween 20 has been repeatedly used to create micro- and nanoemulsions of EOs which showed higher antimicrobial efficacy than the EO itself, the efficacy increasing with decreasing size of droplets, and higher concentration of the emulsifier generally creating smaller droplets [80,82,83]. In addition to this controversy in using Tween, the emulsion may show an increased turbidity, which can pose a problem for assays measuring optical density [8].
In order to avoid the possible interactions of EOs or bacteria with solvents and detergents, addition of agar in concentration 0.15% was used in multiple studies to stabilize the dispersion [8,39,47,56,61,62,63]. The methodology was introduced by Remmal et al., who produced a stable, homogenous dispersion using broth with 0.2% of agar [37,84]. MIC in assay with agar was significantly lower in comparison to Tween 80 (0.25%) or ethanol (0.2%). Similarly, Mann and Markham [85] reported no evident separation of tea tree EO from nutrient broth supplemented with 0.15% of agar, in comparison to 0.2% of DMSO, 2% of ethanol or 0.5% of Tween. In the study of Thielmann et al. [28] agarose (0.15%) was used instead of agar. Unfortunately, suspensions of some EOs were clouded and DMSO had to be used instead. Similarly, Bouyahaya et al. [62] used agar to stabilize EO for MIC determination by broth microdilution, but for the kinetic measures based on optical density, the EO was diluted in DMSO instead.
Emulsification may be also achieved by sonication [43,53,81]. The method is often part of preparation of EOs’ nanoemulsions. Ultrasound waves create local pressure and turbulences in the liquid leading to collapse of larger oil droplets and creation of multiple droplets with smaller diameter [81,83].
2.1.4. Endpoint Determination
Large variability is in how to determine the endpoint – the concentration at which the tested microorganism does not grow. Many authors use visual determination of the MIC (bacterial growth), as determined by pellet formation or visible turbidity of the liquid medium [29,31,39,49,50,67,69,71,74,80]. For a pellet formation, microtiter plates with U-shaped bottom should be used, without rotation/shaking during incubation. Unfortunately, some fastidious, microaerophilic bacteria like Helicobacter spp. may not grow luxuriously in liquid medium, thus making the growth detection by naked eye unfeasible [81], or they require an addition of lysed blood for their growth, which darkens the medium and makes the reading difficult. Even for non-fastidious bacteria it may be hard sometimes to say if the medium is really clear or very slightly hazed.
For easier and more precious MIC determination, various colorimetric assays with a redox indicator have been published (Figure 3). Resazurin is used most often [23,43,47,52,55,56,62,70,85], based on the principle of its reduction to fluorescent resorufin by mitochondrial enzymes of metabolically active cells [47,86]. The addition varies from 5 to 30 μL per 100 μL with final concentration 0.001 – 0.002% [43,47,52,55,56,62,85]. The dye is added after incubation, and the assay is further incubated usually for 2 h [47,56,62,85], although 0.5 h [43], 1 h [55] or even 2-4 h [52] were reported in various studies. Alternatively, 10 μL of resazurin solution (270 mg in 40 mL) can be added prior incubation [23,70,86]. This procedure is more practical, since the dye can be pre-mixed into medium used for preparation of EO solutions, reducing the necessity to mix each well. Color changes from blue (negative) to pink (positive), while discoloration indicates a reversible reduction of resorufin to dihydroresorufin [85]. The color change is easy to read by naked eye, or by a microplate reader measuring absorbance or fluorescence [85,87]. However, fluorescence reading is possible only in assays where resazurin is added post incubation, since the colorless dihydroresorufin formed after prolonged incubation does not fluoresce [86].
Tetrazolium assays are about as much in use as the ones with resazurin. The principle is transformation of more or less colorless tetrazolium salt to a brightly colored, water insoluble formazan by reducing cellular (predominantly mitochondrial again) enzymes (oxidoreductases and dehydrogenases), thus indicating respiratory activity [45,87,88]. Tetrazolium chloride (tetrazolium red, TTC) has been historically most used [25,35,51,73,88], followed by tetrazolium bromide (thiazolyl blue, MTT) [30,88,89] and iodonitrotetrazolium chloride (iodonitrotetrazolium violet, INT) [27,45,81,88]. The color change of tetrazolium usually takes place within 10-60 min [88]. Although Klančnik et al. [45] did not find any differences between TTC and INT, they recommend INT to indicate the viability of aerobic bacteria. In the study of Ellof [88] INT was also found to be the best indicator, as its formazan stayed stable and there was no color change in negative control. Moreover, INT and MTT worked at concentration of 0.2 mg/mL, which was ten times lower than the minimal working concentration for TTC [45,88]. As is the case of solvents and detergents, toxicity of the chosen dye should be checked in advance for testing of nonstandard, fastidious bacteria, for which tetrazolium or resazurin may be toxic [86]. Negative control is also very important, as the antioxidant (reducing) potential of EOs could in theory affect the results [45,87].
Several authors also used Mueller-Hinton broth supplemented with 0.02 g/L of phenol red [77,79,90], which works as a pH indicator, changing color during incubation from red (negative; alkaline pH) to yellow (positive; acidic pH). The color change would be enhanced due to absence of buffering compounds in Mueller-Hinton broth. Knezevic et al. [60] added Christensen’s urea broth into BHI after incubation and incubated the assay for the next 4 h for MIC determination of various EOs against Helicobacter pylori.
Klančnik et al. [45] used ATP activity to determine MIC of plant extracts against Campylobacter spp., getting results comparable to the INT and TTC assays. Inhibition of intracellular ATP synthesis and leakage of ATP outside the bacterial cell is one of the mechanisms of the antimicrobial effect of EOs [3,4,7]. A commercial reagent causing cell lysis and oxidation of luciferin by luciferase, followed by measurement of luminescence by a microplate reader was used in the study [45].
The last but not least common method is spectrophotometric measurement of optical density (OD). A minor variability exists in published wavelength, using 600 nm [37,60,65,68], but also for example 531 nm [91], 570 nm [92], 620 nm [22] or 655 nm [61], depending on the instrument. Donaldson et al. [37] found MICs from INT and OD assays highly correlated, when determining activity of multiple EOs. MIC is defined as the lowest concentration at which OD doesn’t increase after incubation in comparison to initial measurement [44], although percentage of inhibition (50, 90 or 100%) in comparison to the control reading has been computed instead in several studies [37,91,92].
2.1.5. Units of MIC
Based on the survey of Scopus database, MIC is mostly expressed in mg or μg/mL (w/v), although many studies use μl/mL or percentage (v/v) (Figure 2). Using different units makes it difficult to compare MICs from different studies. While using v/v units based on pipetted volumes is easier for the researchers, w/v represent a more precise result. The conversion of units is based on density of EO, which is unfortunately not listed in each study. In one of the key reviews on EOs [8] the results were all conversed to μL/mL for easier comparison, assuming the same density of EOs as water. The relative density of EOs at 15 °C varies between 0.696 and 1.118 [93]. While most of the EOs are less dense than water, cinnamon EO, clove EO and sassafras EO show a higher density [94]. Although the results will not differ by an order of magnitude, the unification of units would help in cross-study comparisons.
2.2. Agar Dilution Method
The principle of the method is mixing of diluted EO at different concentrations with defined amount of melted agar; after agar solidification, specific number of bacterial cells is spot-inoculated onto the agar surface [6,19,33]. As with broth dilution, MIC is the lowest concentration that totally inhibits the bacterial growth [34].
Similar to broth dilution, the most important variations of this method include use of solvent/emulsifier, agar type and units. Inoculum is usually used according to official guidelines for antibiotic testing. Briefly, bacterial suspension of approx. 108 cells/mL is prepared using 0.5 McFarland turbidity standard/OD measurement, tenfold-diluted and 1-2 μL are spot-inoculated on agar, leading to approx. 104 cells being applied per a spot. The inoculum is not to be diluted if a replicator with smaller pins (dispensing only 0.1-0.2 μL) is used [34]. The same standard was kept in miniaturized methods [55,95], but in some of the 24-well plate methodologies, each well was inoculated with 20 and 50 μL, respectively [96,99].
Although most of studies use Mueller Hinton agar (MHA) as the cultivation medium [55,95,98,100,103,104], some researchers have used Tryptic Soy agar (TSA) [97,101,102] or BHI agar [99,105], either alone or nutrients-supplemented in the case of fastidious bacteria. Similarly to the broth dilution, some studies use solvents/emulsifiers for even distribution of EO in the agar, namely 1-2% of DMSO [95,99] or 0.5% of Tween [103,104]. The question is how much is their presence needed in a solid medium, with the agar itself working as a stabilizer as described in the chapter about broth dilution. However, the solvents may be still useful for preparation of the stock solution of EOs.
The method has several advantages and disadvantages to consider before use. Given the method of inoculation, it allows for testing of multiple bacterial strains using only one set of plates. When using a multi-point inoculator, up to 60 strains can be inoculated on a 90 mm plate [19], and about half the amount by hand pipetting technique (Figure 4). This ensures identical testing conditions suitable for strain comparison when testing a single EO or EO component [33]; however, for testing of multiple EOs on a small amount of bacterial strains, disc diffusion or broth dilution may be a better choice. The second major advantage is oxygen or other gases (CO2, N2, H2) availability, making agar dilution more suitable for fastidious anaerobic or microaerophilic bacteria (e.g. Helicobacter pylori, Campylobacter spp., Neisseria gonorrhoeae), which may grow more poorly in broth dilution (especially macrodilution), where the bacteria are dependent on the dissolution of gases into the liquid medium [6,19,20]. What more, necessary incorporation of growth promoters (blood, vitamins) into agar has no effect on MIC readability, as well as natural opacity or coloring of natural substances including EOs [6,19,95].
Among disadvantages, larger used up volume of EO and medium is most frequently mentioned. When using Petri dishes 100 mm in diameter, sufficient amount of agar must be added (about 3-4 mm in height, corresponding to 25 mL) to create a sufficient layer resistant to desiccation [33]. For a 90 mm Petri dish, 20 mL is standardly used [55]. This means that higher amount of EO is used up to prepare a set of plates with different concentrations in comparison to broth dilution, not to mention broth microdilution [33]. The amount of the material may be cut down by miniaturization. An agar mini-dilution method for determination of MIC of EOs has been recently published [55]. The method used 35 mm Petri dishes with the final volume of 6 mL, mixing 3 mL of double strength MHA with 3 mL of diluted EO. Agar microdilution method of Golus et al. [95] used mixing of EO and MHA in Eppendorf tubes before dispensing 100 μL into a 96-well microplate, with inoculation of one strain per a well using a multichannel pipette. Some authors adopted agar dilution method using 24-well plates [96,97,98,99,100,101,102] with the final volume of 500 μL and inoculated with a single strain.
Unlike in broth dilution, the agar must be tempered to 45 – 50 °C [33,34] to stay liquid, which means that the temperature of EO after mixing is increased. In the agar microdilution method [95], the mixture was kept at 50 °C in a ThermoMixer before dispensing. Temperature can influence some physicochemical properties of EOs, including vapor pressure. Since EOs with different composition may differ in volatility, increased temperature especially with agitation could enhance vaporization and loss of the highly volatile EO components [20]. The recommended agar temperature should not be exceeded, and for comparison of different EOs other method of MIC determination should be considered, although of course some evaporation during incubation will occur even in broth dilution [30].
The agar microdilution still has a great potential as a rapid and cheap method, as it was reported to show higher accuracy and reliability than the broth microdilution or agar dilution method [55], and generally slightly lower MIC values in comparison to broth microdilution. The authors suggested that due to the small amount of agar in the well (100 μL), the medium solidified sooner than any separation of EO and water phase could occur [95].
3. Determination of Minimum Bactericidal Concentration (MBC)
Determination of MBC is usually engaged as a complementary measurement to the determination of antimicrobial activity by MIC by broth dilution. It can be defined as the minimum concentration of EO which devitalizes the tested microorganism. The usual method of determination is based on plating out 2 – 100 μL (most frequently 10 μL) from each tube/well showing negative visible growth after incubation, as the MBC can be either equal to or higher than MIC. The agar for plating usually corresponds to the broth used for MIC determination [22,23,24,25,27,29,47,48,49,50,58,61,62,65,67,73,74,77,81]. Subcultivation of 100-fold dilutions in broth instead of plating on agar has been described, too [69]. By checking for visible growth in medium without the tested EO, it can be determined if the microorganism was lethally damaged or only inhibited but still able to multiply under more favourable conditions. The most precise method is based on enumeration of initial inoculum by plating of serial dilutions and its comparison to CFU counts in various EO’s concentrations from MIC determination. MBC is determined as the lowest concentration decreasing the initial inoculum by 99% [64], although the definition by CLSI gives the value 99.9% [19,44].
4. Kinetic Studies
Kinetic studies (time-kill assays, survival curves, curve-assays) are used to determine the time needed for total elimination of the tested microorganism and to validate the MIC and MBC values. Kinetic studies may include growth curves, using concentrations lower than MIC (e.g. 1/2, 1/4) [18,62,65,97], or inactivation curves, using the concentrations around MIC or higher (e.g. MIC, 2× MIC) [39,45,56,65,90,98,99].
The easiest way how to conduct growth kinetic studies is to use a microplate reader, reading OD in the liquid medium during incubation at pre-set time intervals [18,62,65,66,97]. Alternatively, small amount of the medium is diluted, plated out and enumerated at several times [19,21,39,45,56,65,91,98,99]. While this method is much more laborious in comparison to OD measurement, it’s actually the only way how to get the inactivation curves.
5. Agar Diffusion Methods
Diffusion methods are usually used as preliminary screening methods to determine if the tested EOs have at least some antimicrobial activity. By testing multiple EOs in a rapid, easy and cheap manner, EOs with very low to none antimicrobial activity can be eliminated from further testing. Since the result is rather semi-quantitative, it is strongly recommended to follow up with MIC determination. Diffusion method is considered less comparable between various studies on EOs than MIC, for parameters such as agar thickness and amount of EO vary considerably [8,20].
The principle of the assay is diffusion of the antimicrobial components of EO into agar plates inoculated with test strain, inhibiting the growth of the test strain around the spot (disc or well) where the EO was applied. Both positive (a conventional antibiotic disc/solution) and negative (sterile distilled water) control should be used. The plates are left alone for 30 min to allow EO to defund before incubation. After incubation, a zone of inhibition is created (Figure 5) and its diameter measured and reported in mm [19,21,44,88]. However, the size of inhibition zone has no practical use, as it does not indicate which concentration can be effective in applied research (food model, medical treatment etc.). Although MIC can be calculated from the zone of inhibition size (and vice versa) for common antibiotics [19], no such algorithm has been validated for EOs. Several authors used agar diffusion method to determine MIC, using not the pure EO, but its dilutions. MIC was defined as the lowest concentration of EO which produced an inhibition zone after incubation [45,80,107]. However, the MIC obtained by agar diffusion were reported to be generally higher that the MIC obtained by dilution methods [45]. In many studies, the zone of inhibition size did not even correlate with MIC values [37,47,62,69,88]. The commonly used explanation is that the EOs diffuse differently into the agar depending on their polarity. The EOs richer in compounds with better water solubility (Table 1) will diffuse more quickly and create larger inhibition zones, whereas the hydrophobic compounds would tend to remain on the agar surface and gradually evaporate during incubation. Thus even if the zone of inhibition is not created or is small, the EO may be in fact still effective [44,45]. Due to the volatile nature of EOs, many authors do not consider agar diffusion methods suitable for testing of EOs at all [45,88,98].
It should be noted that for screening purposes some authors use sensitivity of EO evaluation based on size of inhibition zone. It would be better described as EO’s efficiency or strain sensitivity. EOs with inhibition zone diameter ≤ 8 mm can be considered non-efficient, whereas the EOs with inhibition zone ≥ 15 mm are considered very efficient and ≥ 20 mm is considered extremely efficient [27,52,54,108]. On the other hand, another highly cited study used the limits for zone of inhibition < 12 mm (not inhibitory EO) and ≥ 20 mm for strongly inhibitory EO [109]. Although slightly different in the methodology, both original publications use 6 mm discs [108,109].
Last but not least, the zone of inhibition was measured from the edge of the disc/hole to the outer edge of the inhibition zone in one study [37], whereas in the others it was measured as a diameter or was not specified. Diameter is the standard measurement for the Kirby-Bauer method according to CLSI and EUCAST [56,103], whereas the other definition of inhibition zone is used in detection of residues of antibiotics in animal food products by plate method. Since the diameter of zone of inhibition is obviously primarily affected by the disc/hole diameter, any variability in disc/hole size makes for difficult comparability between studies.
5.1. Disc Diffusion Method
Generally, there are two types of diffusion methods: disc diffusion and well diffusion. Disc diffusion method is much in use, since it is rapid, easy to perform and standardized for antibiotic testing. Both CLSI [106] and EUCAST [57] use it as the reference method for both common and certain fastidious microorganisms. Although the method originates from 1940s [19], it has been validated 20 years later and became known as Kirby-Bauer method [106]. Both CLSI and EUCAST prescribe the use of MHA, if needed supplemented with either 5% of sheep blood [106] or horse blood and β-NAD [57]. Most studies on EOs also engage MHA [22,37,45,46,47,48,50,51,61,98,103,110], other media such as nutrient agar [80] or BHI agar [24] are rarely used. Fastidious Anaerobe Agar is recommended for testing of anaerobes by the EUCAST manual [57]. The manuals offer some level of standardization for the agar depth (approx. 4 mm) and inoculum size (McFarland standard 0.5, corresponding to approx. 108 cells/mL). However, the disc impregnation with EO is left to imagination.
When testing EO, pure oil is applied on a paper disc, although some authors used dilutions of specific weight of EO in ethanol [22], methanol [24], DMSO [27] or water with DSMO with Tween 80 for better diffusion [103]. A 6 mm paper disc can be considered the standard [22,27,45,46,47,50,51,59,61,70,80,103,110], but 5 mm [98], 7 mm [107,112], 8 mm [37] or even 10 mm [48] have been occasionally used. One study mentioned using three layers of the filter paper [46], while the other studies seem to use only one layer. Most of studies only mention filter paper, a few studies specify it as grade 1 [67,70] and another as grade 3 [112] or 5 [103]. Most importantly, even the volume of EO applied onto the disc varies a lot among the studies, with no connection with disc diameter. A 6 mm disc with 10 μL seems to be the standard [45,47,50,51,59,110], although 4 μL [98], 5 μL [61,112], 15 μL [22,37] or 20 μL [24,46,70,80,107] were used in other studies. Dipping of the disc into EO should be totally avoided, as the volume of EO soaked up by the paper cannot be regulated.
Given the above mentioned variables, the sizes of inhibition zones are entirely incomparable between different studies.
5.2. Well-Diffusion Method
This variant of agar diffusion is less in use, since it is more laborious than the disc method. Instead of placing paper discs on the agar surface, wells/holes are drilled out into the agar and filled with EO or its solution. A sterile borer can be used or replaced by a sterile pipette tip with a sharp rim. The agar plugs need to be efficiently removed out of the wells. Some authors use Oxford cups to either pour agar around to create the wells [62], or the cylinders are simply placed on top of the agar plate and filled with EO [69]. The inhibition zone is affected by both the diameter and depth of the well. What more, during drilling the agar layer may separate from the bottom of agar plate resulting in leakage of EO from the well. The bottom of the well thus should be sealed by a few drops of molten agar before application of EO [56], which makes the whole method even more laborious.
The main variables include hole diameter, volume of EO tested and medium. Although the most common hole diameter is 6 mm as for the disc method [35,64,69,80], use of 4 mm [37], 7 mm [54,56,107] and 8 mm [62] wells have been published. Besides MHA [37,54,56,107], many authors used Luria-Bertani agar [35,62,64,89] or Nutrient agar [69,80]. The volume of EO include 10 [56,89] or 15 μL [37], but also larger volumes such as 50 μL [54,62,80,107], 80 μL [64], 100 μL [35] and even 200 μL [69]. However, the larger volumes are possible only when using the Oxford cups.
6. Antimicrobial Activity in Vapor Phase
Due to the high volatility of EO’s components at ambient temperature, they exhibit bioactivity in the vapor phase [30]. This is advantageous for developing inhalation therapies, for room and air disinfection, sterilization and protection of stored fresh produce (e.g. in controlled atmosphere), and for extending the shelf-life of foodstuffs by active packaging [44,112]. Incorporating EOs into a biopolymer matrix offers several benefits, such as avoiding labelling of EOs as food additives, and reduced negative impact of EO on the sensory properties of the product [5,21,113]. However, similar to their liquid phase counterparts, vapours are less effective on food than in vitro [113].
Several studies have reported morphological changes in bacteria exposed to EOs’ vapors, including reduced membrane potential, decreased intracellular pH, increased cell permeability and loss of intracellular ATP, mirroring the effects observed in the liquid phase [113].
Although many studies concluded that EOs were more potent inhibitors in vapor form [5,64,113,114], others found it quite the opposite [110,115]. One suggested reason for the increased efficacy in the vapor phase is that lipophilic molecules cumulate to form micelles in the aqueous phase, which limits the contact of the EOs with the microorganism, whereas the vapor phase offers full contact. The antimicrobial activity in the vapor phase is attributed to the presence of highly volatile compounds. It was found that using the disc diffusion method, only water-soluble molecules diffused deeply into the agar, while the other molecules created inhibitory effect by redeposition on the agar surface after previous vaporization. EOs containing alcohols, ketones, esters, oxides, and hydrocarbons showed more distinctive inhibition from vapors, whereas EOs with higher aldehyde content showed inhibition primarily through diffusion [113]. Therefore, assessing the antimicrobial properties in both liquid and vapor phase can provide valuable data.
Despite this, the liquid phase is predominantly used in the studies instead of the vapor phase. Susceptibility testing of microorganisms to EOs and their volatile components using standard broth and agar methods is arduous due to their high volatility, viscosity and hydrophobicity. Unlike the standardized methods for antimicrobial susceptibility of conventional antibiotics, there are no such assays for volatile compounds in the vapor phase [30,115].
The vapor phase assay for EOs, first described by López et al. [114], is based on disc diffusion method. Agar plate is prepared in the same way, but EOs are added to sterile filter discs placed on the inner side of lid of each Petri dish, which is incubated bottom up. Some modifications have been made to avoid direct contact between the essential oils and the plastic lid [44,113]. As with the disc diffusion, undiluted EO is used and the diameter of zone of inhibition measured [110,115]. Alternatively, several plates with dilutions of EO are prepared and the MIC is determined as the lowest concentration that produces a visible inhibition zone [44]. MIC (or MID, the Minimum Inhibitory Dose) is expressed in μL of EO per volume unit of air inside the Petri dish [44,113,114,115]. The volume of free atmosphere must be calculated depending on the dish diameter and thickness of agar layer and the Petri dish is sealed with parafilm to minimize the leakage. It should be noted that for this purpose sealing is sometimes, but not always, noted also in direct contact agar diffusion studies [35,95,103,110].
A four-sectioned Petri dish adaptation of the disc volatilization method has been proposed, allowing testing of four microorganisms on the same plate [116]. More recently, a broth microdilution [117] and macrodilution [30] volatilization assays were published, combining broth dilution and disc volatilization methods. Whereas in the wells of microplate, the EO was tested in liquid phase, small amount of agar was pipetted on the lid for testing in vapor phase. The growth was visualized by MTT dying. However, since there were some drawbacks in the microdilution, macrodilution was proposed [30], using 2 mL Eppendorf tubes. The results were not affected by smaller amount of agar on the microplate lid in comparison with the tube cap, and the vapors could not affect neighboring wells.
Since the methods of testing in vapor phase have been thoroughly reviewed recently [112] with 11 different procedures found in the literature described, more detailed information was not included into this review.
7. Antimicrobial Activity against Biofilm Formation
Biofilms are specific microbial communities attached to biotic or abiotic surfaces [118]. Bacterial cells in biofilm were found to be extremely resistant to unfavorable environmental conditions, including treatment by antimicrobial compounds [24,70]. Biofilm formation is a major problem in medicine and medical facilities, but also in food industry as many foodborne pathogens are able to persist on surfaces, leading to cross-contamination and increased risk of foodborne outbreaks [80,113,118].
No wonder that biofilm removal and prevention of its formation are important aims in studying antimicrobial properties of EOs. The principle of the anti-biofilm effect is mostly being connected with quorum sensing. EOs were found to inhibit expression of several genes responsible for adhesion, decrease metabolic activity of bacterial cells and the production of proteins and polysaccharides forming the extracellular matrix [65,80,119].
Most of studies reported both inhibited biofilm formation/cell adhesion in the presence of EOs [24,26,62,70,80,119,120] and successful removal of pre-formed biofilm [24,35,46,62,70,80,119]. In the study of da Silva et al. [80] on Listeria monocytogenes, S. aureus, Salmonella spp. and E. coli, oregano EO, thymol and carvacrol decreased the adhesion by approx. 49 to 99% (concentration ½ × MIC), while the removal of adherent cells ranged from approx. 65 to 92% (concentration 2 × MIC). Kavanaugh et al. [46] also reported that for some EOs, Pseudomonas biofilm was more susceptible than planktonic cells. On the other hand, other studies demonstrated higher resistance of biofilms in comparison to planktonic cells [26]. However, while MIC has some merit in comparison of biofilm formation and planktonic growth inhibition, it is not much valid for biofilm removal, where MBC value for planktonic cells (which is not always determined) makes much more sense as the testing concentration.
Since MIC and its multiples are used for biofilm testing, standardized method of MIC determination has its importance also here. As for methods of biofilm testing, standard methods seem to be engaged without specific modifications for EO testing. However, as for the previous testing methods, some authors also used solvent or emulsifiers to increase stability of EOs in the hydrophilic environment [24,46,80]. Nielsen et al. [78] found that Tween 80 itself led to formation of less biofilm by both L. monocytogenes and Pseudomonas fluorescens and decreased the effectivity of isoeugenol.
The methods for biofilm testing have been revised previously [118,121]. Static methods for forming biofilms are highly favored due to their simplicity, high reproducibility, and cost-efficiency. However, these methods have several drawbacks, including the inability to provide a continuous supply of fresh medium and inadequate aeration [118]. Based on literature survey, microplate assay has been engaged most for testing of EOs, using plastic plates intended for tissue culture. The bacterial culture is either incubated directly with EO (at MIC multiples) to measure the potential to prevent biofilm formation in comparison to control, or, to measure the potential for biofilm removal, after biofilm formation, the wells are carefully washed out to remove waste products and planktonic cells and fresh medium with EO (at MIC multiples) is added in the next step. In both methods, after incubation, the cells in biofilm attached to the pore wall of the well are stained mostly by crystal violet solution and the coloration is checked visually or mostly by absorbance measuring at 570, 590 or 595 nm. For measurement, after rinsing and fixation the bound crystal violet is dissolved to form a homogenously colored solution fit for measuring [24,26,35,62,65,70,80,102,119,120]. Some studies detected the metabolic (respiratory) activity by dyeing the cells with tetrazolium salts [24,26,119], using the wavelength 570 nm. Based on the control OD values, percentage of biofilm inhibition/removal is calculated.
Calgary biofilm assay is an alternative to classical microplate method. In general, the assay consists of a microtiter plate with a lid with special plastic pegs attached, so after placing the lid, each peg is immersed into a microtiter well containing inoculated broth. During incubation with shaking, biofilm is formed on the peg. The lid is transferred to another microtiter plate for testing of the antimicrobial compound. This way the planktonic cells are easily removed from the assay and the biofilm is not disturbed by washing processes [118,121]. Kavanaugh et al. [46] used a commercial assay for testing of various EOs and EOs’ components and calculated MBEC (minimal biofilm eradication concentration, in %) as an equivalent of MBC. The cells were released from biofilm by sonication and enumerated by plating. MIC also has an equivalent in minimum biofilm inhibition concentration (MBIC) [119].
Testing of biofilm formation/removal on pieces of specific materials such as stainless steel, glass or specific plastic have been engaged far less [24,119].
Based on the literature survey, there are variations in the incubation conditions for adequate biofilm formation – e.g. from 6 h [24] to 2 d [80,119] for L. monocytogenes. Various media have been used in the assays, such as MHB [26,46,80], Luria-Bertani broth [35,62,65,120] or TSB [24,70,119]. However, with percentage of inhibition being a relative value counted form control, the results are still more comparable between studies than the MIC/MBC values for planktonic cells.
8. Other methods Engaged in Testing of EOs’ Antimicrobial Activities
Since the phenolic components of EOs are known as membrane permeabilizers, microscopy plays a significant role in observing the structural damage of membranes and cell lysis of both planktonic cells or biofilm caused by EOs. Scanning electron microscopy (SEM) [65,97,102,119,120], transmission electron microscopy (TEM) [70,120] and confocal microscopy (CLSM/LSCM) [65,78,97,119,120] have been engaged in many studies for this purpose. The microscopic techniques have been well described for example in a review of Azeredo et al. [121].
9. Conclusions and PROSPECT
Although only a small part of the relevant literature could be researched in detail, it is clear that there’s a great variability in assays testing antimicrobial activity of EOs. Although some variables can be reduced simply by keeping to CLSI standards for testing of antibiotics, there are still some variables to be optimized and standardized given the unique properties of EOs, notably their volatility and hydrophobic nature. Based on the literature research, following suggestions when designing an experiment can be recommended:
- Chemical composition of the tested EO/EOs should be always made available, since there’s a great variability among EOs of the same botanical origin. Note that many journals have already made that mandatory.
- It is highly recommended to use multiple assays, especially when agar diffusion method is engaged – this method is useful for preliminary studies, but should not stand alone as the only method of investigation.
- The assays need to be standardized as much as possible at least in the most important parameters. CLSI guidelines can be recommended for some parameters such as media, media preparation, inoculum size and quality control. For the disc diffusion method, a disc size of 6 mm soaked with 10 μL of EO is recommended. For broth dilution, MHB with 0.15% of agar for better dispersion of EO seems to be the most fitting medium, as there’s no doubt about its non-toxicity. Use of solvents such as ethanol or DMSO should be further considered and evaluated. If used, the maximum concentration should be stated and tested for toxicity especially when fastidious bacteria are to be tested.
- MIC should be reported in standardized units such as mg or μg/mL.
- All tests should be performed in triplicate.
Especially the miniaturized dilution assays, alone or in combination with vapor phase evaluation, should be further explored as they seem to have a great potential.
Funding
The work was funded from Institutional support for University of Veterinary Sciences Brno.
Conflicts of Interest
The author declares no conflicts of interest.
References
- Franz, C; Novak, J. Sources of Essential Oils. In Handbook of Essential Oils: Science, Technology, and Applications, 3rd ed.; Baser, K.H.C., Buchbauer, G., Eds.; CRC Press: Boca Raton, FL, USA, 2020; pp. 41–84. [Google Scholar]
- Ribeiro-Santos, R; Andrade, M; Sanches-Silva, A; de Melo, N. R. Essential Oils for Food Application: Natural Substances with Established Biological Activities. Food Bioproc. Tech. 2018, 11, 43–71. [Google Scholar] [CrossRef]
- Hyldgaard, M; Mygind, T; Meyer, R. L. Essential Oils in Food Preservation: Mode of Action, Synergies, and Interactions with Food Matrix Components. Front. Microbiol. 2012, 3, 12. [Google Scholar]
- de Sousa, D.P.; Damasceno, R.O.S.; Amorati, R.; Elshabrawy, H.A.; de Castro, R.D.; Bezerra, D.P.; Nunes, V.R.V.; Gomes, R.C.; Lima, T.C. Essential Oils: Chemistry and Pharmacological Activities. Biomolecules 2023, 13, 1144. [Google Scholar] [CrossRef] [PubMed]
- Amiri, A.; Mottaghipisheh, J.; Jamshidi-Kia, F.; Saeidi, K.; Vitalini, S.; Iriti, M. Antimicrobial Potencies of Major Functional Foods’ Essential Oils in Liquid and Vapor Phases: A Short Review. Appl. Sci. 2020, 10, 8103. [Google Scholar] [CrossRef]
- Reyes-Jurado, F.; Franco-Vega, A.; Ramirez-Corona, N.; Palou, E.; López-Malo, A. Essential Oils: Antimicrobial Activities, Extraction Methods, and Their Modeling. Food Eng. Rev. 2015, 7, 275–297. [Google Scholar] [CrossRef]
- Masyita, A.; Mustika Sari, R.; Dwi Astuti, A.; Yasir, B.; Rahma Rumata, N.; Emran, T.B.; Nainu, F.; Simal-Gandara, J. Terpenes and Terpenoids as Main Bioactive Compounds of Essential Oils, Their Roles in Human Health and Potential Application as Natural Food Preservatives. Food Chem. X 2022, 13, 100217. [Google Scholar] [CrossRef] [PubMed]
- Burt, S. Essential Oils: Their Antibacterial Properties and Potential Applications in Foods – A Review. Int. J. Food Microbiol. 2004, 94, 223–253. [Google Scholar] [CrossRef]
- Ramsey, J.T.; Shropshire, B.C.; Nagy, T.R.; Chambers, K.D.; Li, Y.; Korach, K.S. Essential Oils and Health. Yale J. Biol. Med. 2020, 93, 291–305. [Google Scholar]
- Baser, K.H.C.; Franz, C. Essential Oils Used in Veterinary Medicine. In Handbook of Essential Oils: Science, Technology, and Applications, 3rd ed.; Baser, K.H.C., Buchbauer, G., Eds.; CRC Press: Boca Raton, USA, 2020; pp. 919–932. [Google Scholar]
- Guzmán, E.; Lucia, A. Essential Oils and Their Individual Components in Cosmetic Products. Cosmetics 2021, 8, 114. [Google Scholar] [CrossRef]
- Nahas, R.I. Natural antioxidants as food and beverage ingredients. In Natural Food Additives, Ingredients and Flavourings; Baines, D., Seal, R., Eds.; Woodhead Publishing: Cambridge, UK, 2012; pp. 100–126. [Google Scholar]
- Delves-Broughton, J. Natural antimicrobials as additives and ingredients for the preservation of foods and beverages. In Natural Food Additives, Ingredients and Flavourings; Baines, D., Seal, R., Eds.; Woodhead Publishing: Cambridge, UK, 2012; pp. 127–161. [Google Scholar]
- Rowe, D.J. Natural aroma chemicals for use in foods and beverages. In Natural Food Additives, Ingredients and Flavourings; Baines, D., Seal, R., Eds.; Woodhead Publishing: Cambridge, UK, 2012; pp. 212–230. [Google Scholar]
- Catani, L.; Grassi, E.; di Montanara, A.C.; Guidi, L.; Sandulli, R.; Manachini, B.; Semprucci, F. Essential Oils and Their Applications in Agriculture and Agricultural Products: A Literature Analysis through VOSviewer. Biocatal. Agric. Biotechnol. 2022, 45, 102502. [Google Scholar] [CrossRef]
- Calo, J.R.; Crandall, P.G.; O'Bryan, C.A.; Ricke, S.C. Essential Oils as Antimicrobials in Food Systems – A Review. Food Control 2015, 54, 111–119. [Google Scholar] [CrossRef]
- WHO. Global Antimicrobial Resistance Surveillance System: Manual for Early Implementation; World Health Organization: Geneva, Switzerland, 2015; Available online: https://apps.who.int/iris/handle/10665/188783 (accessed on 25/05/2024).
- Othman, M.; Loh, H.S.; Wiart, C.; Khoo, T.J.; Lim, K.H.; Ting, K.N. Optimal Methods for Evaluating Antimicrobial Activities from Plant Extracts. J. Microbiol. Methods 2011, 84, 161–166. [Google Scholar] [CrossRef] [PubMed]
- Balouiri, M.; Sadiki, M.; Ibnsouda, S.K. Methods for In Vitro Evaluating Antimicrobial Activity: A Review. J. Pharm. Anal. 2016, 6, 71–79. [Google Scholar] [CrossRef] [PubMed]
- Van de Vel, E.; Sampers, I.; Raes, K. A Review on Influencing Factors on the Minimum Inhibitory Concentration of Essential Oils. Crit. Rev. Food Sci. Nutr. 2019, 59, 357–378. [Google Scholar] [CrossRef] [PubMed]
- Rao, J.; Chen, B.; McClements, D. J. Improving the Efficacy of Essential Oils as Antimicrobials in Foods: Mechanisms of Action. Annu. Rev. Food Sci. Technol. 2019, 10, 365–387. [Google Scholar] [CrossRef] [PubMed]
- Mihajilov-Krstev, T.; Radnovic, D.; Kitic, D.; Stojanovic-Radic, Z.; Zlatkovic, B. Antimicrobial Activity of Satureja hortensis L. Essential Oil Against Pathogenic Microbial Strains. Biotechnol. Biotechnol. Equip. 2009, 23, 1492–1496. [Google Scholar] [CrossRef]
- Hussain, A. I.; Anwar, F.; Nigam, P. S.; Sarker, S. D.; Moore, J. E.; Rao, J. R.; Mazumdar, A. Antibacterial Activity of Some Lamiaceae Essential Oils Using Resazurin as an Indicator of Cell Growth. LWT-Food Sci. Technol. 2011, 44, 1199–1206. [Google Scholar] [CrossRef]
- Jadhav, S.; Shah, R.; Bhave, M.; Palombo, E. A. Inhibitory Activity of Yarrow Essential Oil on Listeria Planktonic Cells and Biofilms. Food Control 2013, 29, 125–130. [Google Scholar] [CrossRef]
- Miladinović, D.L.; Ilić, B.S.; Mihajilov-Krstev, T.M.; Nikolić, D.M.; Cvetković, O.G.; Marković, M.S.; Miladinović, L.C. Antibacterial Activity of the Essential Oil of Heracleum sibiricum. Nat. Prod. Commun. 2013, 8, 1309–1311. [Google Scholar] [CrossRef]
- Bazargani, M.M.; Rohloff, J. Antibiofilm Activity of Essential Oils and Plant Extracts Against Staphylococcus aureus and Escherichia coli Biofilms. Food Control 2016, 61, 156–164. [Google Scholar] [CrossRef]
- Puškárová, A.; Bučková, M.; Kraková, L.; Pangallo, D.; Kozics, K. The Antibacterial and Antifungal Activity of Six Essential Oils and Their Cyto/Genotoxicity to Human HEL 12469 Cells. Sci. Rep. 2017, 7, 8211. [Google Scholar] [CrossRef] [PubMed]
- Thielmann, J.; Muranyi, P.; Kazman, P. Screening Essential Oils for Their Antimicrobial Activities Against the Foodborne Pathogenic Bacteria Escherichia coli and Staphylococcus aureus. Heliyon 2019, 5, e01860. [Google Scholar] [CrossRef] [PubMed]
- Pellegrini, M.; Ricci, A.; Serio, A.; Chaves-López, C.; Mazzarrino, G.; D'Amato, S.; Lo Sterzo, C.; Paparella, A. Characterization of Essential Oils Obtained from Abruzzo Autochthonous Plants: Antioxidant and Antimicrobial Activities Assessment for Food Application. Foods 2018, 7, 19. [Google Scholar] [CrossRef] [PubMed]
- Houdkova, M.; Chaure, A.; Doskocil, I.; Havlik, J.; Kokoska, L. New Broth Macrodilution Volatilization Method for Antibacterial Susceptibility Testing of Volatile Agents and Evaluation of Their Toxicity Using Modified MTT Assay In Vitro. Molecules 2021, 26, 4179. [Google Scholar] [CrossRef] [PubMed]
- Hulankova, R. Higher Resistance of Yersinia enterocolitica in Comparison to Yersinia pseudotuberculosis to Antibiotics and Cinnamon, Oregano and Thyme Essential Oils. Pathogens 2022, 11, 1456. [Google Scholar] [CrossRef] [PubMed]
- Ostrosky, E.A.; Mizumoto, M.K.; Lima, M.E.L.; Kaneko, T.M.; Nishikawa, S.O.; Freitas, B.R. Methods for Evaluation of the Antimicrobial Activity and Determination of Minimum Inhibitory Concentration (MIC) of Plant Extracts. Rev. Bras. Farmacogn. 2008, 18, 301–307. [Google Scholar] [CrossRef]
- Wiegand, I.; Hilpert, K.; Hancock, R.E.W. Agar and Broth Dilution Methods to Determine the Minimal Inhibitory Concentration (MIC) of Antimicrobial Substances. Nat. Protoc. 2008, 3, 163–175. [Google Scholar] [CrossRef] [PubMed]
- CLSI. Methods for Dilution Antimicrobial Susceptibility Tests for Bacteria That Grow Aerobically, W: M07, 11th ed. Clinical and Laboratory Standards Institute, 2018; M07.
- Zhao, A.; Zhang, Y.; Li, F.; Chen, L.; Huang, X. Analysis of the Antibacterial Properties of Compound Essential Oil and the Main Antibacterial Components of Unilateral Essential Oils. Molecules 2023, 28, 6304. [Google Scholar] [CrossRef]
- Cervenka, L.; Peskova, I.; Pejchalova, M.; Vytrasova, J. Inhibition of Arcobacter butzleri, Arcobacter cryaerophilus, and Arcobacter skirrowii by Plant Oil Aromatics. J. Food Prot. 2008, 71, 165–169. [Google Scholar] [CrossRef]
- Donaldson, J.R.; Warner, S.L.; Cates, R.G.; Young, D.G. Assessment of Antimicrobial Activity of Fourteen Essential Oils When Using Dilution and Diffusion Methods. Pharm. Biol. 2005, 43, 687–695. [Google Scholar] [CrossRef]
- Sakkas, H.; Economou, V.; Gousia, P.; Bozidis, P.; Sakkas, V.A.; Petsios, S.; Mpekoulis, G.; Ilia, A.; Papadopoulou, C. Antibacterial Efficacy of Commercially Available Essential Oils Tested Against Drug-Resistant Gram-Positive Pathogens. Appl. Sci. 2018, 8, 2201. [Google Scholar] [CrossRef]
- de Azeredo, G.A.; Stamford, T.L.M.; Nunes, P.C.; Neto, N.J.G.; de Oliveira, M.E.C.; de Souza, E.L. Combined Application of Essential Oils from Origanum vulgare L. and Rosmarinus officinalis L. to Inhibit Bacteria and Autochthonous Microflora Associated with Minimally Processed Vegetables. Food Res. Int. 2011, 44, 1541–1548. [Google Scholar] [CrossRef]
- Porter, J.A.; Monu, E.A. Evaluating the Antimicrobial Efficacy of White Mustard Essential Oil Alone and in Combination with Thymol and Carvacrol Against Salmonella. J. Food Prot. 2019, 82, 2038–2043. [Google Scholar] [CrossRef] [PubMed]
- Kavanagh, A.; Ramu, S.; Gong, Y.; Cooper, M.A.; Blaskovich, M.A.T. Effects of Microplate Type and Broth Additives on Microdilution MIC Susceptibility Assays. Antimicrob. Agents Chemother. 2019, 63, e01760–18. [Google Scholar] [CrossRef] [PubMed]
- ISO. ISO 20776-1:2019 Susceptibility testing of infectious agents and evaluation of performance of antimicrobial susceptibility test devices Part 1: Broth micro-dilution reference method for testing the in vitro activity of antimicrobial agents against rapidly growing aerobic bacteria involved in infectious diseases. G: Organisation for Standardisation, 2019.
- Vanegas, D.; Abril-Novillo, A.; Khachatryan, A.; Jerves-Andrade, L.; Peñaherrera, E.; Cuzco, N.; Wilches, I.; Calle, J.; León-Tamariz, F. Validation of a Method of Broth Microdilution for the Determination of Antibacterial Activity of Essential Oils. BMC Res. Notes 2021, 14, 439. [Google Scholar] [CrossRef] [PubMed]
- Seow, Y.X.; Yeo, C.R.; Chung, H.L.; Yuk, H.G. Plant Essential Oils as Active Antimicrobial Agents. Crit. Rev. Food Sci. Nutr. 2014, 54, 625–644. [Google Scholar] [CrossRef] [PubMed]
- Klančnik, A.; Piskernik, S.; Jeršek, B.; Smole Možina, S. Evaluation of Diffusion and Dilution Methods to Determine the Antibacterial Activity of Plant Extracts. J. Microbiol. Methods 2010, 81, 121–126. [Google Scholar] [CrossRef]
- Kavanaugh, N.L.; Ribbeck, K. Selected Antimicrobial Essential Oils Eradicate Pseudomonas spp. and Staphylococcus aureus Biofilms. Appl. Environ. Microbiol. 2012, 78, 4057–4061. [Google Scholar] [CrossRef]
- Boukhira, S.; Balouiri, M.; Bousta, F.; Moularat, S.; Taleb, M.S.; Bousta, D. Antimicrobial Activities of Essential Oil of Five Plant Species from Morocco Against Some Microbial Strains. Int. J. Pharmacogn. Pharm. Res. 2016, 8, 1901–1906. [Google Scholar]
- Park, J.W.; Wendt, M.; Heo, G.J. Antimicrobial Activity of Essential Oil of Eucalyptus globulus Against Fish Pathogenic Bacteria. Lab Anim. Res. 2016, 32, 87–90. [Google Scholar] [CrossRef]
- Alexopoulos, A.; Plessas, S.; Kimbaris, A.; Varvatou, M.; Mantzourani, I.; Fournomiti, M. Mode of Antimicrobial Action of Origanum vulgare Essential Oil Against Clinical Pathogens. Curr. Res. Nutr. Food Sci. 2017, 5, 109–115. [Google Scholar] [CrossRef]
- Sadiki, F.Z.; El Idrissi, M.; Sbiti, M.; Lemrhari, A.; Trifan, A.; Cioanca, O.; Postu, P.A.; Hritcu, L. Chemical Composition and Antibacterial Activity of Essential Oil of Tetraclinis articulata (Vahl) Masters Branches of Eastern Morocco. Chem. Biol. Technol. Agric. 2018, 5, 24. [Google Scholar] [CrossRef]
- Gonçalves, G.M.S.; Barros, P.P.; Silva, G.H.; Fedes, G.R. The Essential Oil of Curcuma longa Rhizomes as an Antimicrobial and Its Composition by CG-MS. Rev. Ciênc. Med. 2019, 28, 1–10. [Google Scholar] [CrossRef]
- Rathore, S.; Mukhia, S.; Kapoor, S.; Bhatt, V.; Kumar, R.; Kumar, R. Seasonal Variability in Essential Oil Composition and Biological Activity of Rosmarinus officinalis L. Accessions in the Western Himalaya. Sci. Rep. 2022, 12, 3305. [Google Scholar] [CrossRef] [PubMed]
- Van, N.T.B.; Vi, O.T.; Yen, N.T.P.; Nhung, N.T.; Cuong, N.V.; Kiet, B.T.; Hoang, N.V.; Hien, V.B.; Thwaites, G.; Campbell, J.; Choisy, M.; Carrique-Mas, J. Minimum Inhibitory Concentrations of Commercial Essential Oils Against Common Chicken Pathogenic Bacteria and Their Relationship with Antibiotic Resistance. J. Appl. Microbiol. 2022, 132, 1025–1035. [Google Scholar] [CrossRef] [PubMed]
- Abdelatti, M.A.I.; Abd El-Aziz, N.K.; El-Naenaeey, E.Y.M.; Ammar, A.M.; Alharbi, N.K.; Alharthi, A.; Zakai, S.A.; Abdelkhalek, A. Antibacterial and Anti-Efflux Activities of Cinnamon Essential Oil Against Pan and Extensive Drug-Resistant Pseudomonas aeruginosa Isolated from Human and Animal Sources. Antibiotics 2023, 12, 1514. [Google Scholar] [CrossRef]
- Chen, S.; Li, Z.; Gu, Z.; Ban, X.; Hong, Y.; Cheng, L.; Li, C. A New Micro-Agar Dilution Method to Determine the Minimum Inhibitory Concentration of Essential Oils Against Microorganisms. J. Microbiol. Methods 2023, 211, 106791. [Google Scholar] [CrossRef]
- Cui, Z.H.; He, H.L.; Wu, S.B.; Dong, C.L.; Lu, S.Y.; Shan, T.J.; Fang, L.X.; Liao, X.P.; Liu, Y.H.; Sun, J. Rapid Screening of Essential Oils as Substances Which Enhance Antibiotic Activity Using a Modified Well Diffusion Method. Antibiotics 2021, 10, 463. [Google Scholar] [CrossRef] [PubMed]
- EUCAST. Media Preparation for EUCAST Disk Diffusion Testing and for Determination of MIC Values by the Broth Microdilution Method, V: 6.0. European Committee on Antimicrobial Susceptibility Testing, 2020.
- Rota, C.; Carramiñana, J.J.; Burillo, J.; Herrera, A. In Vitro Antimicrobial Activity of Essential Oils from Aromatic Plants Against Selected Foodborne Pathogens. J. Food Prot. 2004, 67, 1252–1256. [Google Scholar] [CrossRef]
- Raeisi, M.; Tajik, H.; Yarahmadi, A.; Sanginabadi, S. Antimicrobial Effect of Cinnamon Essential Oil Against Escherichia coli and Staphylococcus aureus. Health Scope 2015, 4, e21808. [Google Scholar] [CrossRef]
- Knezevic, P.; Aleksic Sabo, V.; Simin, N.; Lesjak, M.; Mimica-Dukic, N. A Colorimetric Broth Microdilution Method for Assessment of Helicobacter pylori Sensitivity to Antimicrobial Agents. J. Pharm. Biomed. Anal. 2018, 152, 271–278. [Google Scholar] [CrossRef] [PubMed]
- Hsaine, S.; Charof, R.; Ounine, K. Evaluation of Antibacterial Activity of Essential Oil of Cinnamomum zeylanicum, Eugenia caryophyllata, and Rosmarinus officinalis Against Streptococcus oralis. Asian J. Pharm. Clin. Res. 2017, 10, 411–413. [Google Scholar] [CrossRef]
- Bouyahya, A.; Abrini, J.; Dakka, N.; Bakri, Y. Essential Oils of Origanum compactum Increase Membrane Permeability, Disturb Cell Membrane Integrity, and Suppress Quorum-Sensing Phenotype in Bacteria. J. Pharm. Anal. 2019, 9, 301–311. [Google Scholar] [CrossRef] [PubMed]
- Cazella, L.N.; Glamoclija, J.; Soković, M.; Gonçalves, J.E.; Linde, G.A.; Colauto, N.B.; Gazim, Z.C. Antimicrobial Activity of Essential Oil of Baccharis dracunculifolia DC (Asteraceae) Aerial Parts at Flowering Period. Front. Plant Sci. 2019, 10, 27. [Google Scholar] [CrossRef]
- Sateriale, D.; Forgione, G.; De Cristofaro, G.A.; Facchiano, S.; Boscaino, F.; Pagliuca, C.; Colicchio, R.; Salvatore, P.; Paolucci, M.; Pagliarulo, C. Towards Green Strategies of Food Security: Antibacterial Synergy of Essential Oils from Thymus vulgaris and Syzygium aromaticum to Inhibit Escherichia coli and Staphylococcus aureus Pathogenic Food Isolates. Microorganisms 2022, 10, 2446. [Google Scholar] [CrossRef] [PubMed]
- Cai, T.; Li, Z.; Guo, P.; Guo, J.; Wang, R.; Guo, D.; Yu, J.; Lü, X.; Xia, X.; Shi, C. Antimicrobial and Antibiofilm Efficacy and Mechanism of Oregano Essential Oil Against Shigella flexneri. Foodborne Pathog. Dis. 2023, 20, 209–221. [Google Scholar] [CrossRef] [PubMed]
- Iacovelli, F.; Romeo, A.; Lattanzio, P.; Ammendola, S.; Battistoni, A.; La Frazia, S.; Vindigni, G.; Unida, V.; Biocca, S.; Gaziano, R.; et al. Deciphering the Broad Antimicrobial Activity of Melaleuca alternifolia Tea Tree Oil by Combining Experimental and Computational Investigations. Int. J. Mol. Sci. 2023, 24, 12432. [Google Scholar] [CrossRef] [PubMed]
- de Barros, J.C.; da Conceição, M.L.; Neto, N.J.; da Costa, A.C.; de Souza, E.L. Combination of Origanum vulgare L. Essential Oil and Lactic Acid to Inhibit Staphylococcus aureus in Meat Broth and Meat Model. Braz. J. Microbiol. 2012, 43, 1120–1127. [Google Scholar] [CrossRef] [PubMed]
- Nagalakshmi, S.; Saranraj, P.; Sivasakthivelan, P. Determination of Minimum Inhibitory Concentration (MIC) and Percentage Bacterial Growth Inhibition of Essential Oils Against Gram Positive Bacterial Pathogens. J. Drug Deliv. Ther. 2019, 9, 33–35. [Google Scholar] [CrossRef]
- Liu, J.X.; Huang, D.F.; Hao, D.L.; Hu, Q.P. Chemical Composition, Antibacterial Activity of the Essential Oil from Roots of Radix aucklandiae Against Selected Food-Borne Pathogens. Adv. Biosci. Biotechnol. 2014, 5, 1043–1047. [Google Scholar] [CrossRef]
- Araby, E.; El-Tablawy, S.Y. Inhibitory Effects of Rosemary (Rosmarinus officinalis L.) Essential Oil on Pathogenicity of Irradiated and Non-Irradiated Pseudomonas aeruginosa. J. Photochem. Photobiol. B 2016, 159, 24–32. [Google Scholar] [CrossRef]
- Hulankova, R. The Influence of Liquid Medium Choice in Determination of Minimum Inhibitory Concentration of Essential Oils Against Pathogenic Bacteria. Antibiotics 2022, 11, 150. [Google Scholar] [CrossRef]
- Yalkowsky, S.H.; He, Y.; Jain, P. Handbook of Aqueous Solubility Data, 2nd ed.; CRC Press: Boca Raton, USA, 2010. [Google Scholar]
- Ilić, B.S.; Kocić, B.D.; Cirić, V.M.; Ćvetković, O.G.; Miladinović, D.L. An In Vitro Synergistic Interaction of Combinations of Thymus glabrescens Essential Oil and Its Main Constituents with Chloramphenicol. Sci. World J. 2014, 2014, 826219. [Google Scholar] [CrossRef]
- dal Pozzo, M.; Silva Loreto, E.; Flores Santurio, D.; Hartz Alves, S.; Rossatto, L.; Castagna de Vargas, A.; Viegas, J.; Matiuzzi da Costa, M. Antibacterial Activity of Essential Oil of Cinnamon and Trans-Cinnamaldehyde Against Staphylococcus spp. Isolated from Clinical Mastitis of Cattle and Goats. Acta Sci. Vet. 2012, 40, 1–5. [Google Scholar]
- Wadhwani, T.; Desai, K.; Patel, D.; Lawani, D.; Bahaley, P.; Joshi, P.; Vijay, K. Effect of Various Solvents on Bacterial Growth in Context of Determining MIC of Various Antimicrobials. Internet J. Microbiol. 2018, 7, 1–6. [Google Scholar]
- Tadtong, S.; Suppawat, S.; Tintawee, A.; Saramas, P.; Jareonvong, S.; Hongratanaworakit, T. Antimicrobial Activity of Blended Essential Oil Preparation. Nat. Prod. Commun. 2012, 7, 1401–1404. [Google Scholar] [CrossRef] [PubMed]
- Alitonou, G.A.; Sessou, P.; Tchobo, P.F.; Noudogbessi, J.P.; Avlessi, F.; Yehouenou, B.; Menut, C.; Villeneuve, P.; Sohounhloue, D.C.K. Chemical Composition and Biological Activities of Essential Oils of Chenopodium ambrosioides L. Collected in Two Areas of Benin. Int. J. Biosci. 2012, 2, 58–66. [Google Scholar]
- Nielsen, C.K.; Kjems, J.; Mygind, T.; Snabe, T.; Meyer, R.L. Effects of Tween 80 on Growth and Biofilm Formation in Laboratory Media. Front. Microbiol. 2016, 7, 1878. [Google Scholar] [CrossRef]
- Tovidé, S.N.; Adeoti, K.; Yèhouénou, B.; Dahouénon-Ahoussi, E.; Baba-Moussa, F.; Toukourou, F. Antimicrobial and Physico-Chemical Effects of Essential Oil on Fermented Milk During Preservation. J. Appl. Biosci. 2016, 99, 9469–9477. [Google Scholar]
- da Silva, B.D.; do Rosário, D.K.A.; Neto, L.T.; Lelis, C.A.; Conte-Junior, C.A. Antioxidant, Antibacterial and Antibiofilm Activity of Nanoemulsion-Based Natural Compound Delivery Systems Compared with Non-Nanoemulsified Versions. Foods 2023, 12, 1901. [Google Scholar] [CrossRef]
- Weseler, A.; Geiss, H.K.; Saller, R.; Reichling, J. A Novel Colorimetric Broth Microdilution Method to Determine the Minimum Inhibitory Concentration (MIC) of Antibiotics and Essential Oils Against Helicobacter pylori. Pharmazie 2005, 60, 498–502. [Google Scholar] [PubMed]
- Anwer, M.K.; Jamil, S.; Ibnouf, E.O.; Shakeel, F. Enhanced Antibacterial Effects of Clove Essential Oil by Nanoemulsion. J. Oleo Sci. 2014, 63, 347–354. [Google Scholar] [CrossRef] [PubMed]
- Pimple, V.V.; Kulkarni, A.S.; Patil, S.P.; Dhoble, S.J. Plant Essential Oils Based Nanoemulsion Formulations and Its Antibacterial Effect on Some Pathogens. Int. J. Innov. Technol. Explor. Eng. 2019, 9, 4800–4808. [Google Scholar] [CrossRef]
- Remmal, A.; Bouchikhi, T.; Tantaoui-Elaraki, A.; Ettayebi, M. Inhibition of Antibacterial Activity of Essential Oils by Tween 80 and Ethanol in Liquid Medium. J. Pharm. Belg. 1993, 48, 352–356. [Google Scholar] [PubMed]
- Mann, C.M.; Markham, J.L. A New Method for Determining the Minimum Inhibitory Concentration of Essential Oils. J. Appl. Microbiol. 1998, 84, 538–544. [Google Scholar] [CrossRef] [PubMed]
- Sarker, S.D.; Nahar, L.; Kumarasamy, Y. Microtitre Plate-Based Antibacterial Assay Incorporating Resazurin as an Indicator of Cell Growth, and Its Application in the In Vitro Antibacterial Screening of Phytochemicals. Methods 2007, 42, 321–324. [Google Scholar] [CrossRef]
- Braissant, O.; Astasov-Frauenhoffer, M.; Waltimo, T.; Bonkat, G. A Review of Methods to Determine Viability, Vitality, and Metabolic Rates in Microbiology. Front. Microbiol. 2020, 11, 547458. [Google Scholar] [CrossRef]
- Eloff, J.N. Avoiding Pitfalls in Determining Antimicrobial Activity of Plant Extracts and Publishing the Results. BMC Complement. Altern. Med. 2019, 19, 106. [Google Scholar] [CrossRef] [PubMed]
- Zarai, Z.; Ben Chobba, I.; Ben Mansour, R.; Békir, A.; Gharsallah, N.; Kadri, A. Essential Oil of the Leaves of Ricinus communis L.: In Vitro Cytotoxicity and Antimicrobial Properties. Lipids Health Dis. 2012, 11, 102. [Google Scholar] [CrossRef]
- Yèhouenou, B.; Wotto, D.V.; Sessou, P.; Noudogbessi, J.P.; Sohounhloue, D.C.K. Chemical Study and Antimicrobial Activities of Volatile Extracts from Fresh Leaves of Crassocephalum rubens (Juss and Jack.) S. Moore Against Food Borne Pathogens. Sci. Study Res.: Chem. Chem. Eng. Biotechnol. Food Ind. 2010, 11, 343–351. [Google Scholar]
- Szweda, P.; Zalewska, M.; Pilch, J.; Kot, B.; Milewski, S. Essential Oils as Potential Anti-Staphylococcal Agents. Acta Vet. 2018, 68, 95–107. [Google Scholar]
- Kačániová, M.; Vukic, M.; Vukovic, N.L.; Čmiková, N.; Verešová, A.; Schwarzová, M.; Babošová, M.; Porhajašová, J.I.; Kluz, M.; Waszkiewicz-Robak, B.; Ben Hsouna, A.; Ben Saad, R.; Garzoli, S. An In-Depth Study on the Chemical Composition and Biological Effects of Pelargonium graveolens Essential Oil. Foods 2024, 13, 33. [Google Scholar] [CrossRef]
- d’Acampora Zellner, B.; Dugo, P.; Dugo, G.; Mondello, L. Analysis of Essential Oils. In Handbook of Essential Oils: Science, Technology, and Applications, 3rd ed.; Baser, K.H.C., Buchbauer, G., Eds.; CRC Press: Boca Raton, USA, 2020; pp. 151–183. [Google Scholar]
- Ríos, J.L. Essential Oils: What They Are and How the Terms Are Used and Defined. In Essential Oils in Food Preservation, Flavor and Safety, 1st ed.; Preedy, V.R., Ed.; Academic Press: London, UK, 2016; pp. 3–10. [Google Scholar]
- Golus, J.; Sawicki, R.; Widelski, J.; Ginalska, G. The Agar Microdilution Method - A New Method for Antimicrobial Susceptibility Testing for Essential Oils and Plant Extracts. J. Appl. Microbiol. 2016, 121, 1291–1299. [Google Scholar] [CrossRef] [PubMed]
- Fei, P.; Xu, Y.; Zhao, S.; Gong, S.; Guo, L. Olive Oil Polyphenol Extract Inhibits Vegetative Cells of Bacillus cereus Isolated from Raw Milk. J. Dairy Sci. 2019, 102, 3894–3902. [Google Scholar] [CrossRef]
- Liu, M.; Pan, Y.; Feng, M.; Guo, W.; Fan, X.; Feng, L.; Huang, J.; Cao, Y. Garlic Essential Oil in Water Nanoemulsion Prepared by High-Power Ultrasound: Properties, Stability, and Its Antibacterial Mechanism Against MRSA Isolated from Pork. Ultrason. Sonochem. 2022, 90, 106201. [Google Scholar] [CrossRef] [PubMed]
- López, E.I.C.; Balcázar, M.F.H.; Mendoza, J.M.R.; Ortiz, A.D.R.; Melo, M.T.O.; Parrales, R.S.; Delgado, T.H. Antimicrobial Activity of Essential Oil of Zingiber officinale Roscoe (Zingiberaceae). Am. J. Plant Sci. 2017, 8, 1511–1524. [Google Scholar] [CrossRef]
- Nikolić, I.; Chua, E.G.; Tay, A.C.Y.; Kostrešević, A.; Pavlović, B.; Jončić Savić, K. Savory, Oregano, and Thyme Essential Oil Mixture (HerbELICO®) Counteracts Helicobacter pylori. Molecules 2023, 28, 2138. [Google Scholar] [CrossRef] [PubMed]
- Ramezani, M.; Behravan, J.; Yazdinezhad, A. Chemical Composition and Antimicrobial Activity of the Volatile Oil of Artemisia khorassanica from Iran. Pharm. Biol. 2005, 42, 599–602. [Google Scholar] [CrossRef]
- Shi, C.; Song, K.; Zhang, X.; Sun, Y.; Sui, Y.; Chen, Y.; Jia, Z.; Sun, H.; Sun, Z.; Xia, X. Antimicrobial Activity and Possible Mechanism of Action of Citral Against Cronobacter sakazakii. PLoS One 2016, 11, e0159006. [Google Scholar] [CrossRef]
- Sun, Y.; Guo, D.; Hua, Z.; Sun, H.; Zheng, Z.; Xia, X.; Shi, C. Attenuation of Multiple Vibrio parahaemolyticus Virulence Factors by Citral. Front. Microbiol. 2019, 10, 894. [Google Scholar] [CrossRef]
- Prabuseenivasan, S.; Jayakumar, M.; Ignacimuthu, S. In Vitro Antibacterial Activity of Some Plant Essential Oils. BMC Complement Altern. Med. 2006, 6, 39. [Google Scholar] [CrossRef] [PubMed]
- Fraternale, D.; Genovese, S.; Ricci, D. Essential Oil Composition and Antimicrobial Activity of Aerial Parts and Ripe Fruits of Echinophora spinosa (Apiaceae) from Italy. Nat. Prod. Commun. 2013, 8, 527–530. [Google Scholar] [CrossRef] [PubMed]
- Selim, S. Antimicrobial Activity of Essential Oils Against Vancomycin-Resistant Enterococci (VRE) and Escherichia coli O157 in Feta Soft Cheese and Minced Beef Meat. Braz. J. Microbiol. 2011, 42, 187–196. [Google Scholar] [CrossRef] [PubMed]
- CLSI. Performance Standards for Antimicrobial Disk Susceptibility Tests, W: M02, 14th ed. Clinical and Laboratory Standards Institute, 2024; M02.
- Valgas, C.; de Souza, S.M.; Smânia, E.F.A.; Smânia, A. Screening Methods to Determine Antibacterial Activity of Natural Products. Braz. J. Microbiol. 2007, 38, 369–380. [Google Scholar] [CrossRef]
- Ponce, A.G.; Fritz, R.; Del Valle, C.; Roura, S.I. Antimicrobial Activity of Essential Oils on the Native Microflora of Organic Swiss Chard. Lebensm. Wiss. Technol. 2003, 36, 679–684. [Google Scholar] [CrossRef]
- Rota, M.C.; Herrera, A.; Martínez, R.M.; Sotomayor, J.A.; Jordán, M.J. Antimicrobial Activity and Chemical Composition of Thymus vulgaris, Thymus zygis, and Thymus hyemalis Essential Oils. Food Control 2008, 19, 681–687. [Google Scholar] [CrossRef]
- Ignatiuk, K.; Dzikon, E.; Hagdej, B.; Slotwinska, W.; Malm, M.; Ossowski, M.; Kasela, M. Comparison of Disc-Diffusion and Disc-Volatilization Assays for Determining the Antimicrobial Activity of Thymus vulgaris L. Essential Oil. Curr. Issues Pharm. Med. Sci. 2023, 36, 158–162. [Google Scholar] [CrossRef]
- Busatta, C.; Vidal, R.S.; Popiolski, A.S.; Mossi, A.J.; Dariva, C.; Rodrigues, M.R.; Corazza, F.C.; Corazza, M.L.; Vladimir Oliveira, J.; Cansian, R.L. Application of Origanum majorana L. Essential Oil as an Antimicrobial Agent in Sausage. Food Microbiol. 2008, 25, 207–211. [Google Scholar] [CrossRef]
- Houdkova, M.; Kokoska, L. Volatile Antimicrobial Agents and In Vitro Methods for Evaluating Their Activity in the Vapour Phase: A Review. Planta Med. 2020, 86, 822–857. [Google Scholar] [CrossRef]
- Laird, K.; Phillips, C. Vapour Phase: A Potential Future Use for Essential Oils as Antimicrobials? Lett. Appl. Microbiol. 2012, 54, 169–174. [Google Scholar] [CrossRef]
- López, P.; Sánchez, C.; Batlle, R.; Nerín, C. Solid- and Vapour-Phase Antimicrobial Activities of Six Essential Oils: Susceptibility of Selected Foodborne Bacterial and Fungal Strains. J. Agric. Food Chem. 2005, 53, 6939–6946. [Google Scholar] [CrossRef]
- Ács, K.; Balázs, V.L.; Kocsis, B.; Bencsik, T.; Böszörményi, A.; Horváth, G. Antibacterial Activity Evaluation of Selected Essential Oils in Liquid and Vapor Phase on Respiratory Tract Pathogens. BMC Complement Altern. Med. 2018, 18, 227. [Google Scholar] [CrossRef] [PubMed]
- Kloucek, P.; Smid, J.; Frankova, A.; Kokoska, L.; Valterova, I.; Pavela, R. Fast Screening Method for Assessment of Antimicrobial Activity of Essential Oils in Vapour Phase. Food Res. Int. 2012, 47, 161–165. [Google Scholar] [CrossRef]
- Houdkova, M.; Rondevaldova, J.; Doskocil, I.; Kokoska, L. Evaluation of Antibacterial Potential and Toxicity of Plant Volatile Compounds Using New Broth Microdilution Volatilization Method and Modified MTT Assay. Fitoterapia 2017, 118, 56–62. [Google Scholar] [CrossRef] [PubMed]
- Han, A.; Lee, S.Y. An Overview of Various Methods for In Vitro Biofilm Formation: A Review. Food Sci. Biotechnol. 2023, 32, 1617–1629. [Google Scholar] [CrossRef] [PubMed]
- Zhang, C.; Li, C.; Abdel-Samie, M.A.; Cui, H.; Li, C. Unraveling the Inhibitory Mechanism of Clove Essential Oil Against Listeria monocytogenes Biofilm and Applying It to Vegetable Surfaces. LWT - Food Sci. Technol. 2020, 134, 110120. [Google Scholar] [CrossRef]
- Liu, T.; Kang, J.; Liu, L. Thymol as a Critical Component of Thymus vulgaris L Essential Oil Combats Pseudomonas aeruginosa by Intercalating DNA and Inactivating Biofilm. LWT - Food Sci. Technol. 2021, 136, 110354. [Google Scholar] [CrossRef]
- Azeredo, J.; Azevedo, N.F.; Briandet, R.; Cerca, N.; Coenye, T.; Costa, A.R.; Desvaux, M.; Di Bonaventura, G.; Hébraud, M.; Jaglic, Z.; Kačániová, M.; Knøchel, S.; Lourenço, A.; Mergulhão, F.; Meyer, R.L.; Nychas, G.; Simões, M.; Tresse, O.; Sternberg, C. Critical Review on Biofilm Methods. Crit. Rev. Microbiol. 2017, 43, 313–351. [Google Scholar] [CrossRef]
Figure 1.
Trend in publications on EOs between 1980-2023 with “Salmonella” as reference topic (Web of Science survey from 11/07/2024).
Figure 1.
Trend in publications on EOs between 1980-2023 with “Salmonella” as reference topic (Web of Science survey from 11/07/2024).
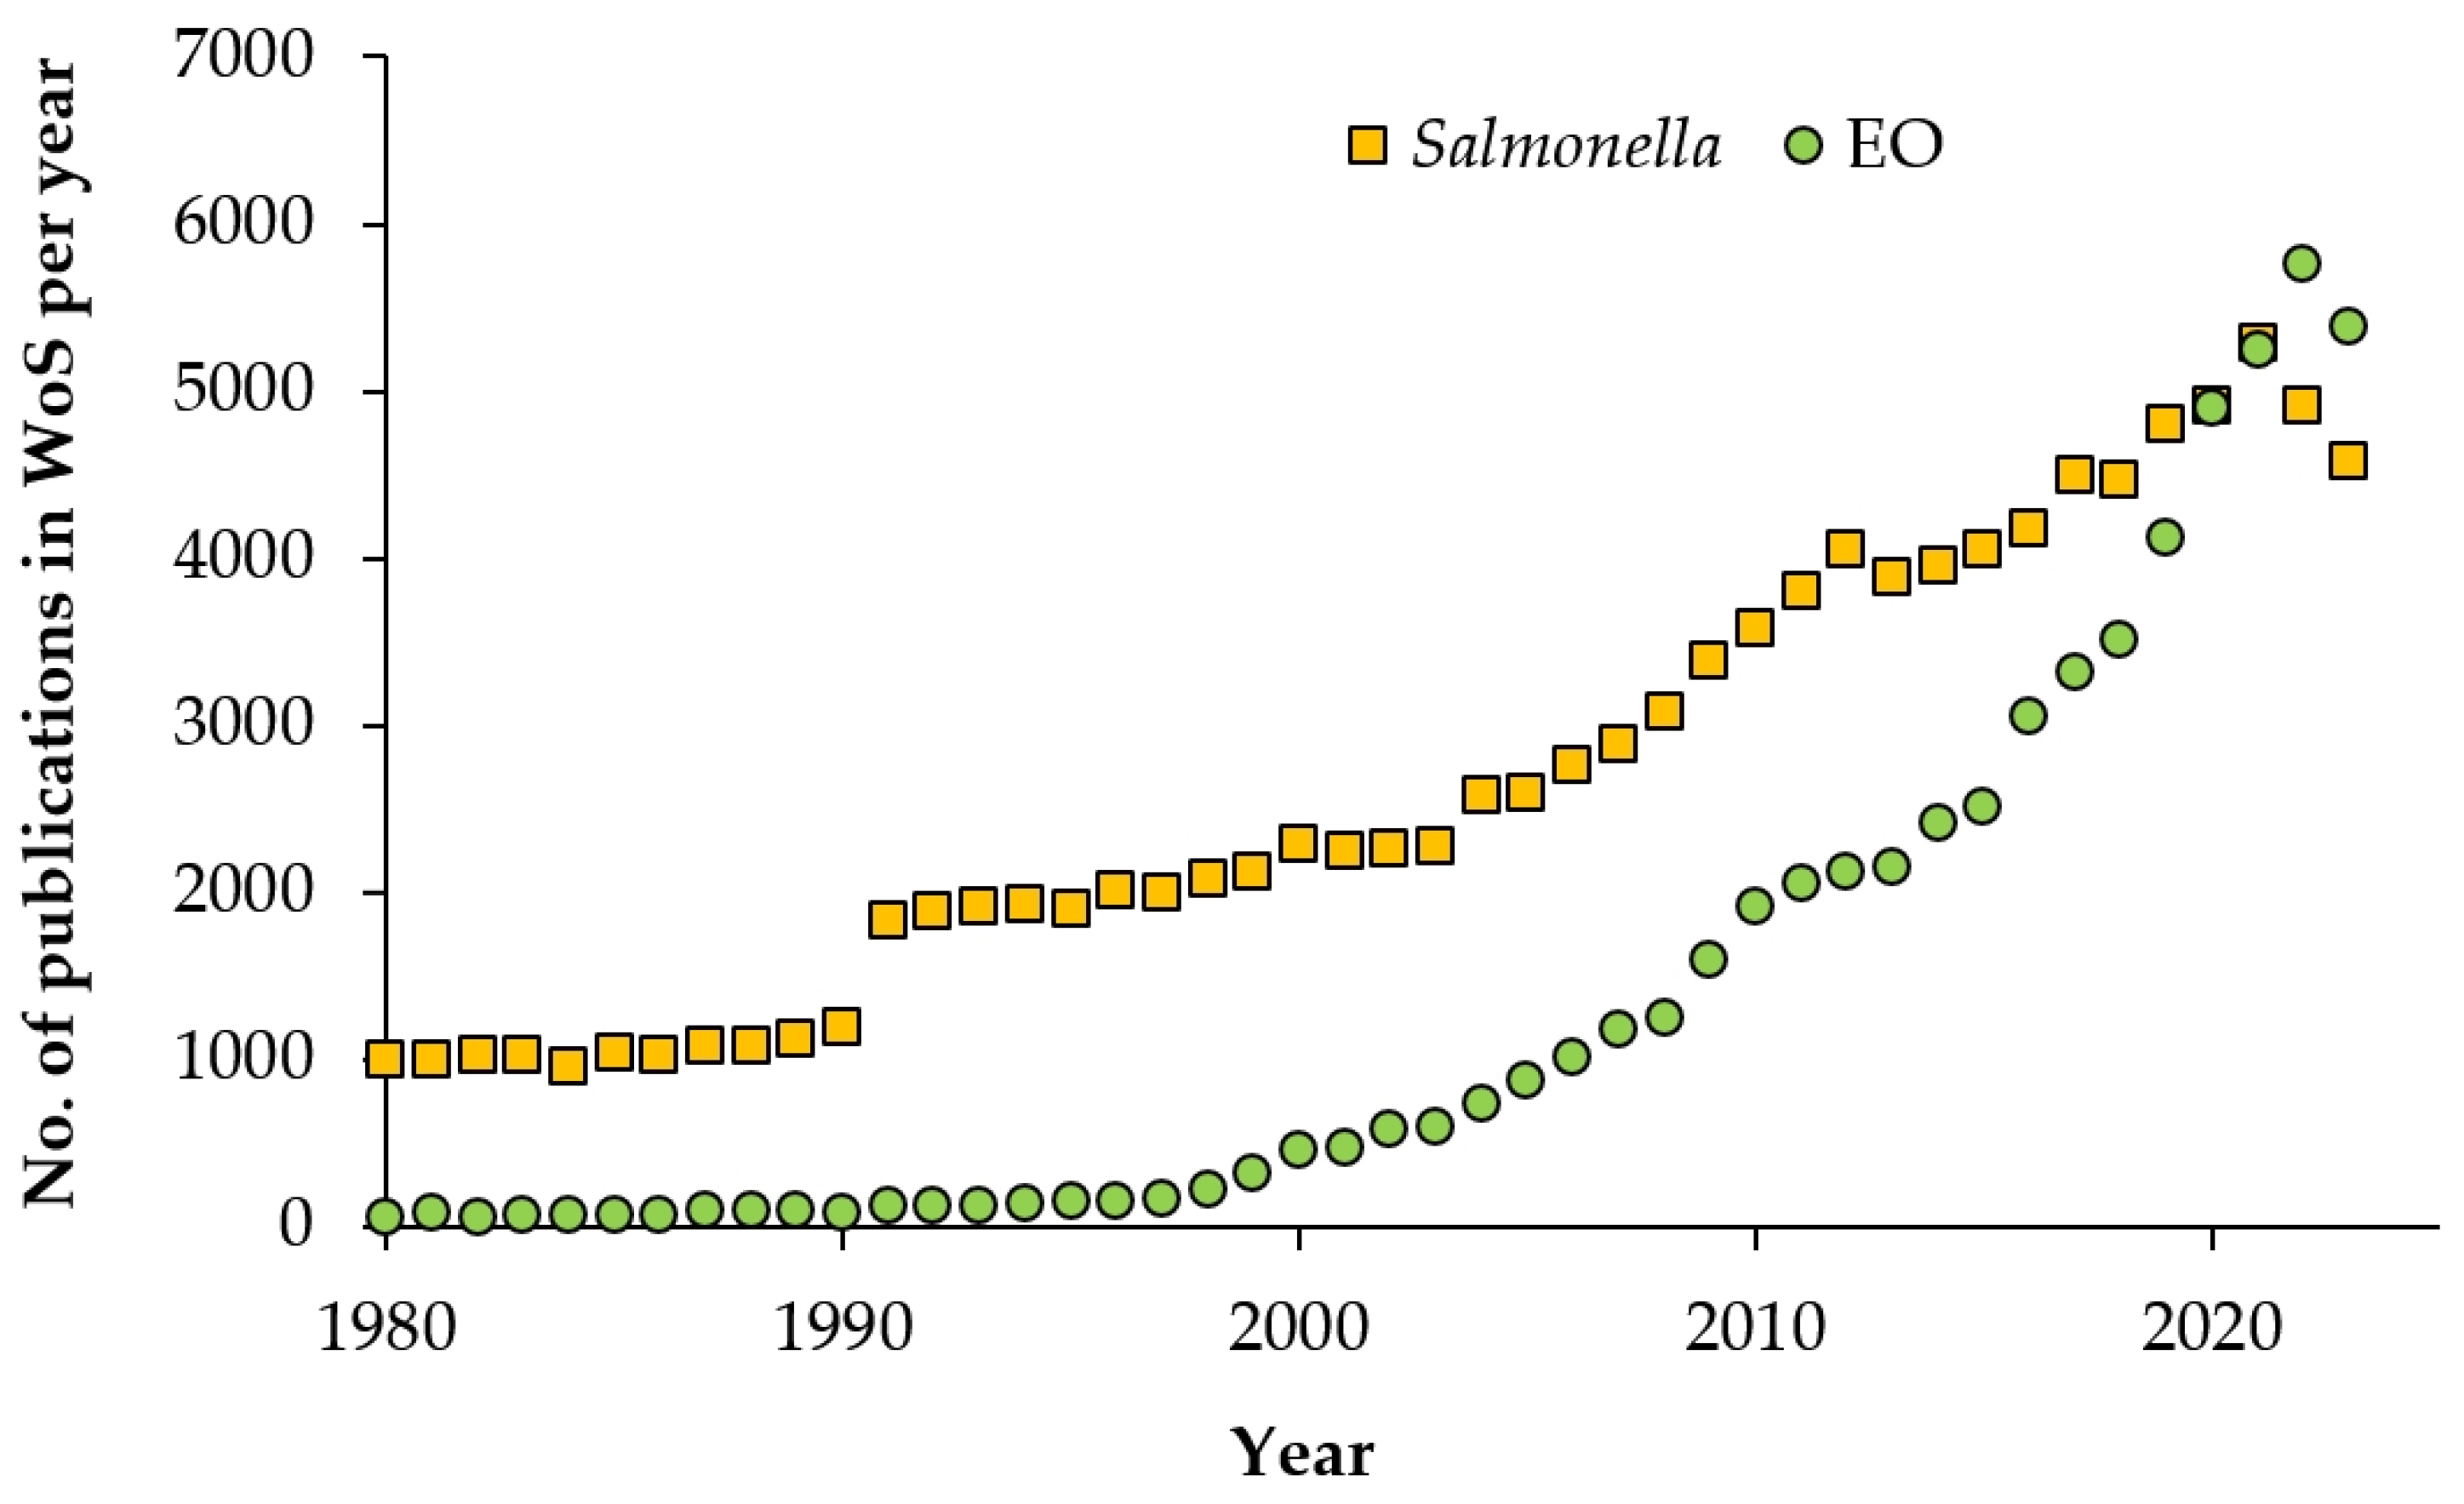
Figure 2.
Trends in reporting the antimicrobial effect of EOs (Scopus survey from 11/07/2024). Note that for v/v units, percentage is frequently used which cannot be the subject of a search.
Figure 2.
Trends in reporting the antimicrobial effect of EOs (Scopus survey from 11/07/2024). Note that for v/v units, percentage is frequently used which cannot be the subject of a search.
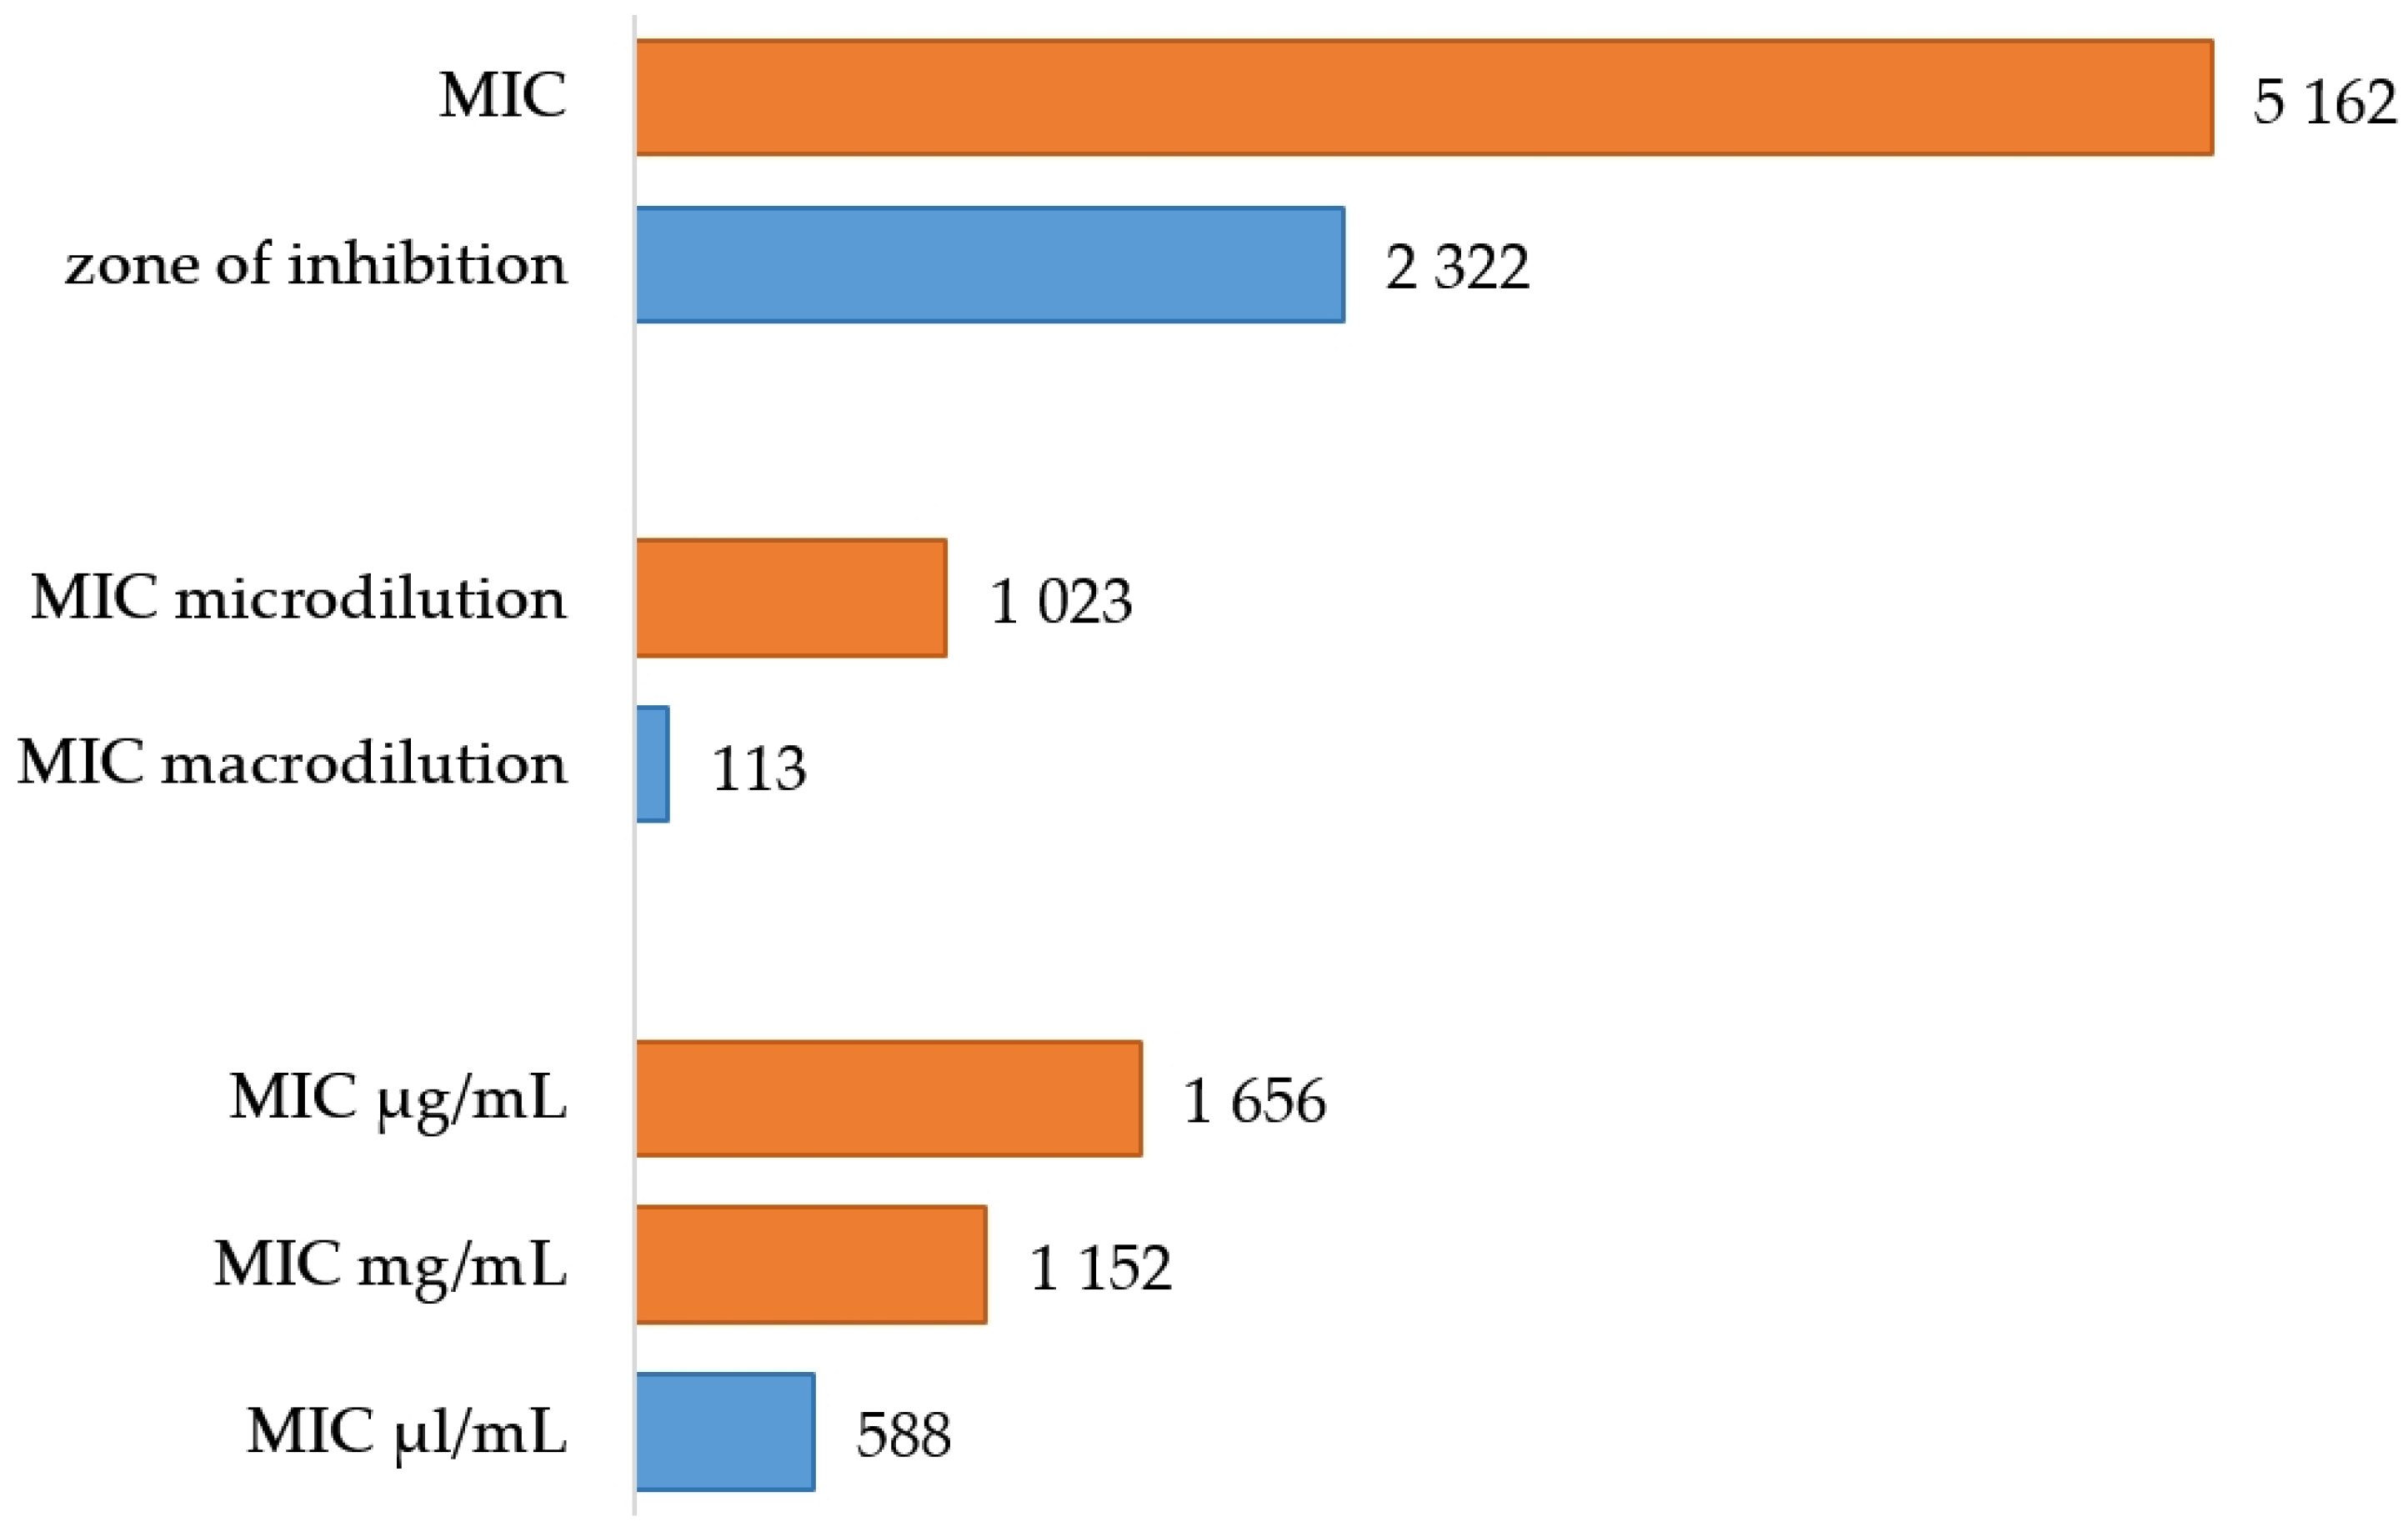
Figure 3.
Examples of broth microdilution assays used for testing of EOs with different end point determination: (a) MHB with 0.15% of agar (mMHB); (b) mMHB with resazurin added after incubation; (c) mMHB with tetrazolium (INT); (d) mMHB with phenol red; (e) mMHB with resazurin added before incubation.
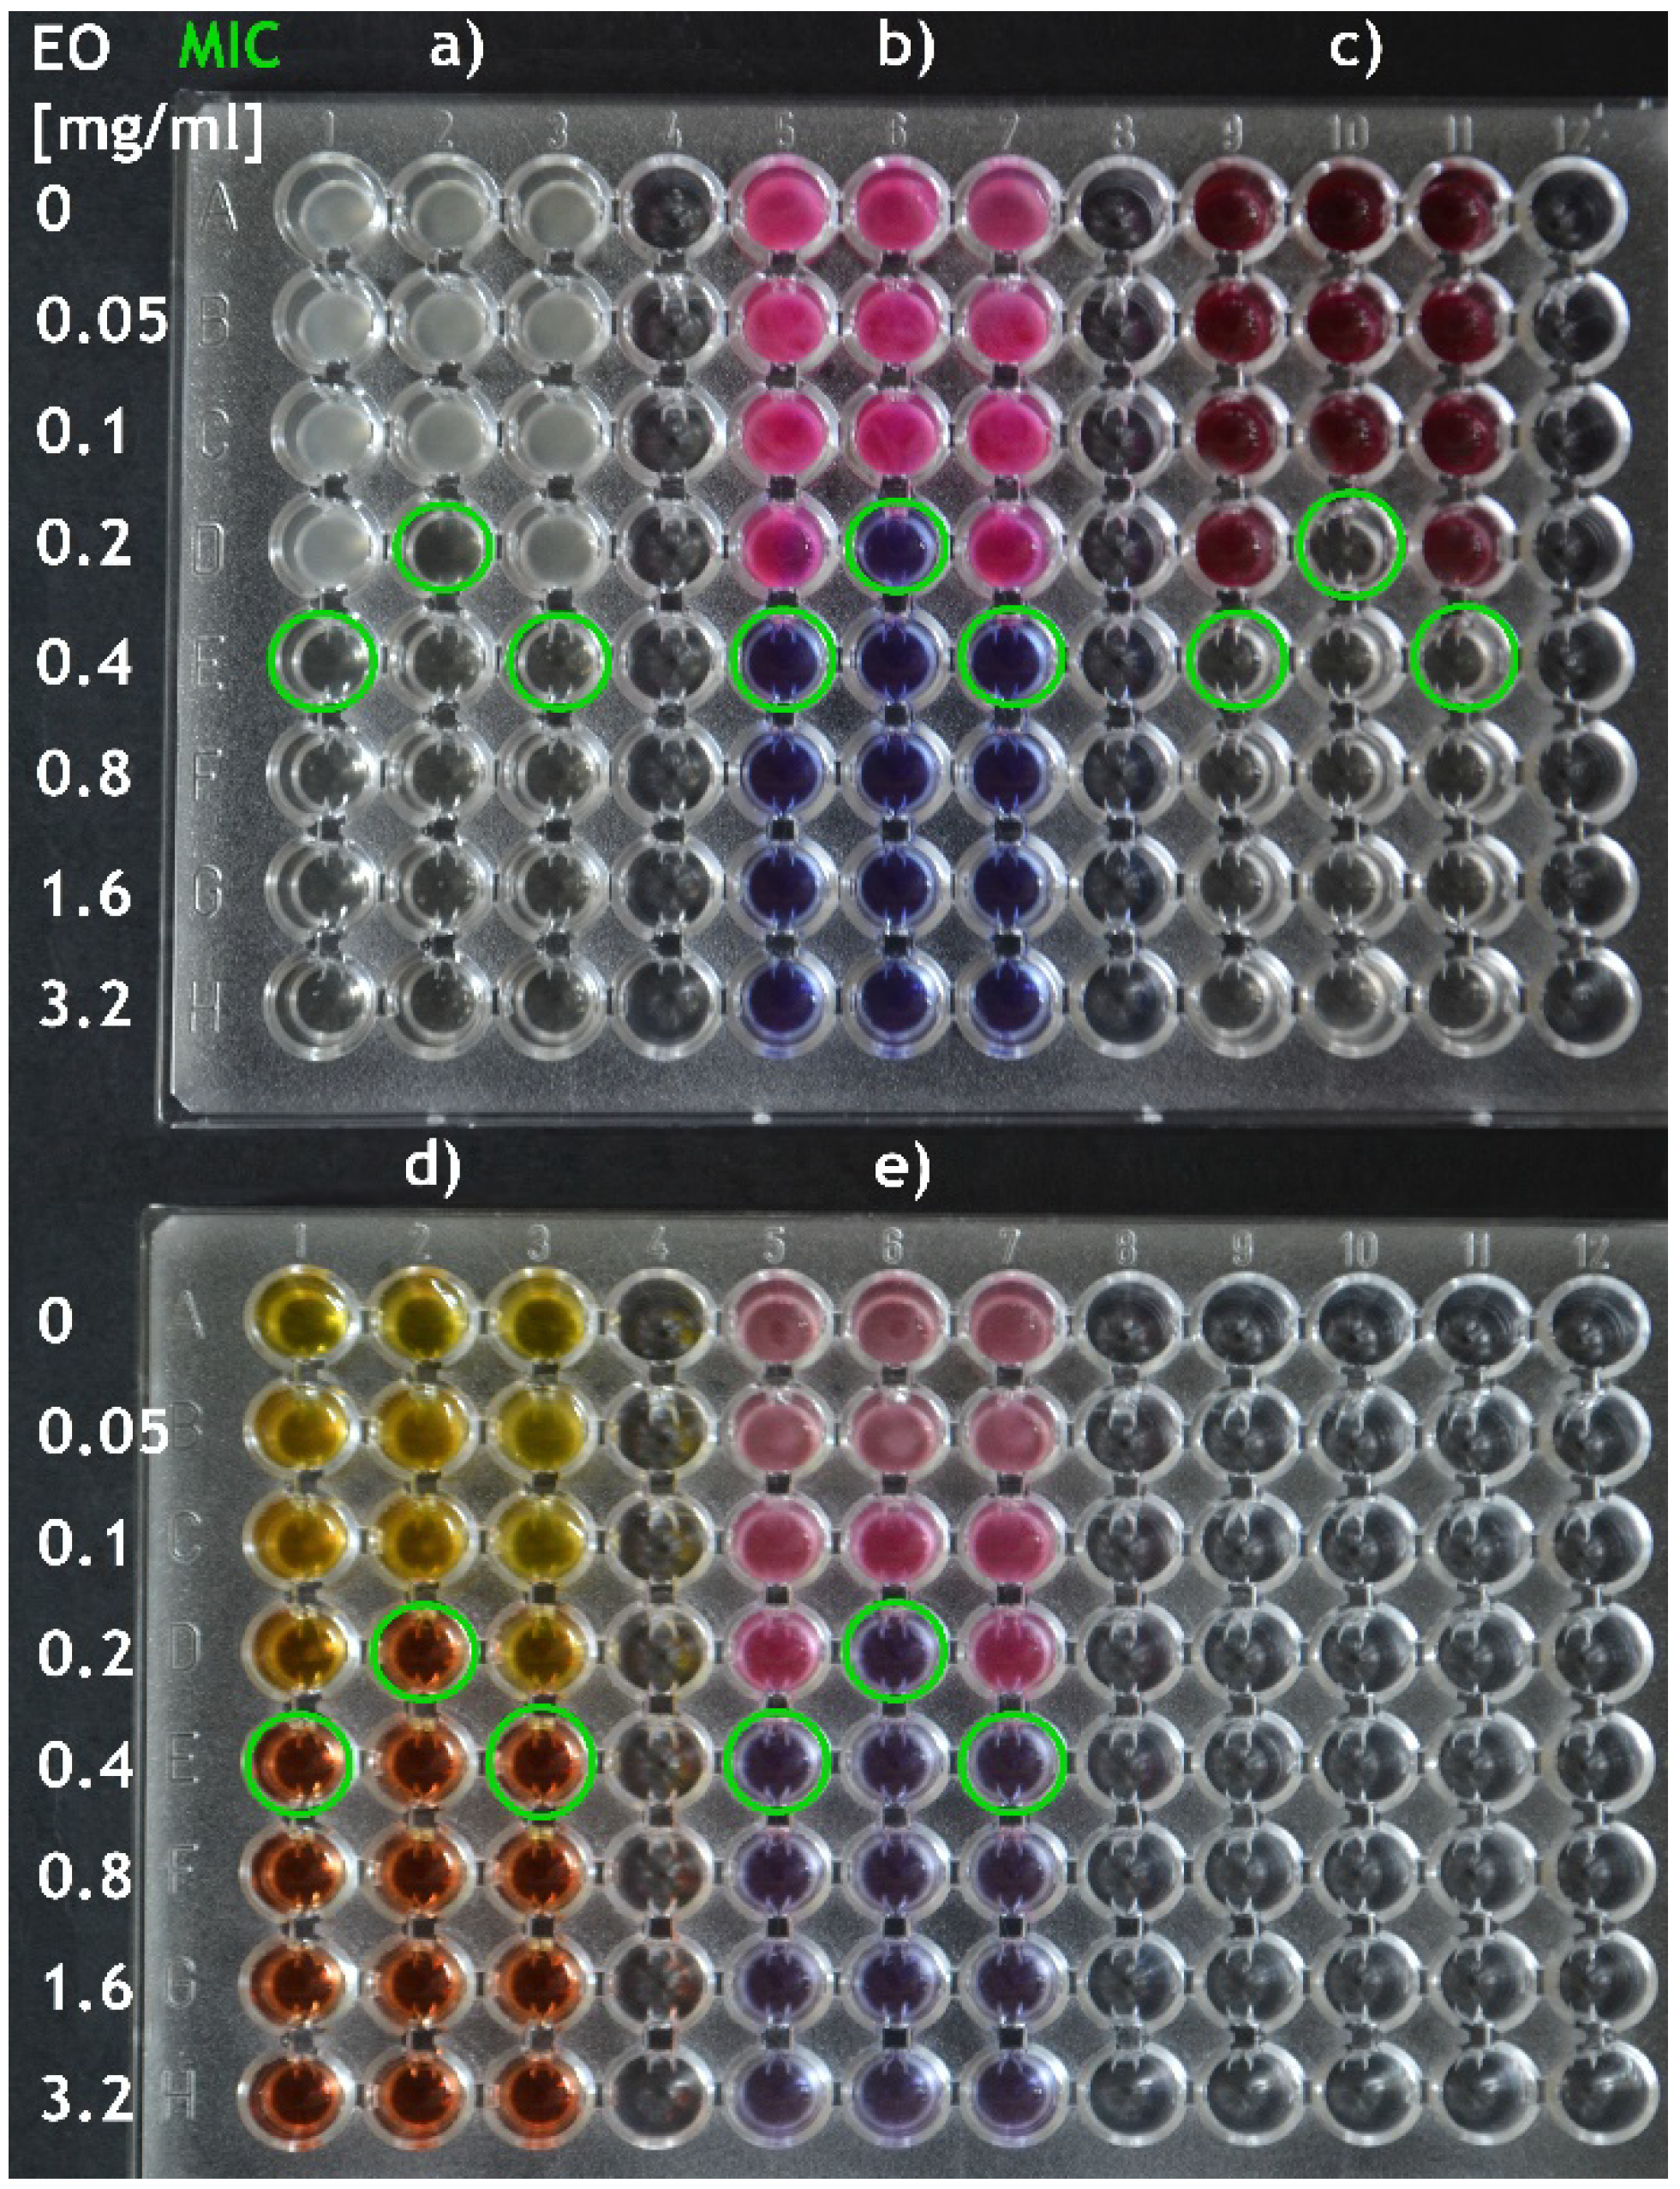
Figure 4.
Examples of agar dilution assays with visible growth/inhibition of the tested strains (1 μL of inoculum).
Figure 4.
Examples of agar dilution assays with visible growth/inhibition of the tested strains (1 μL of inoculum).
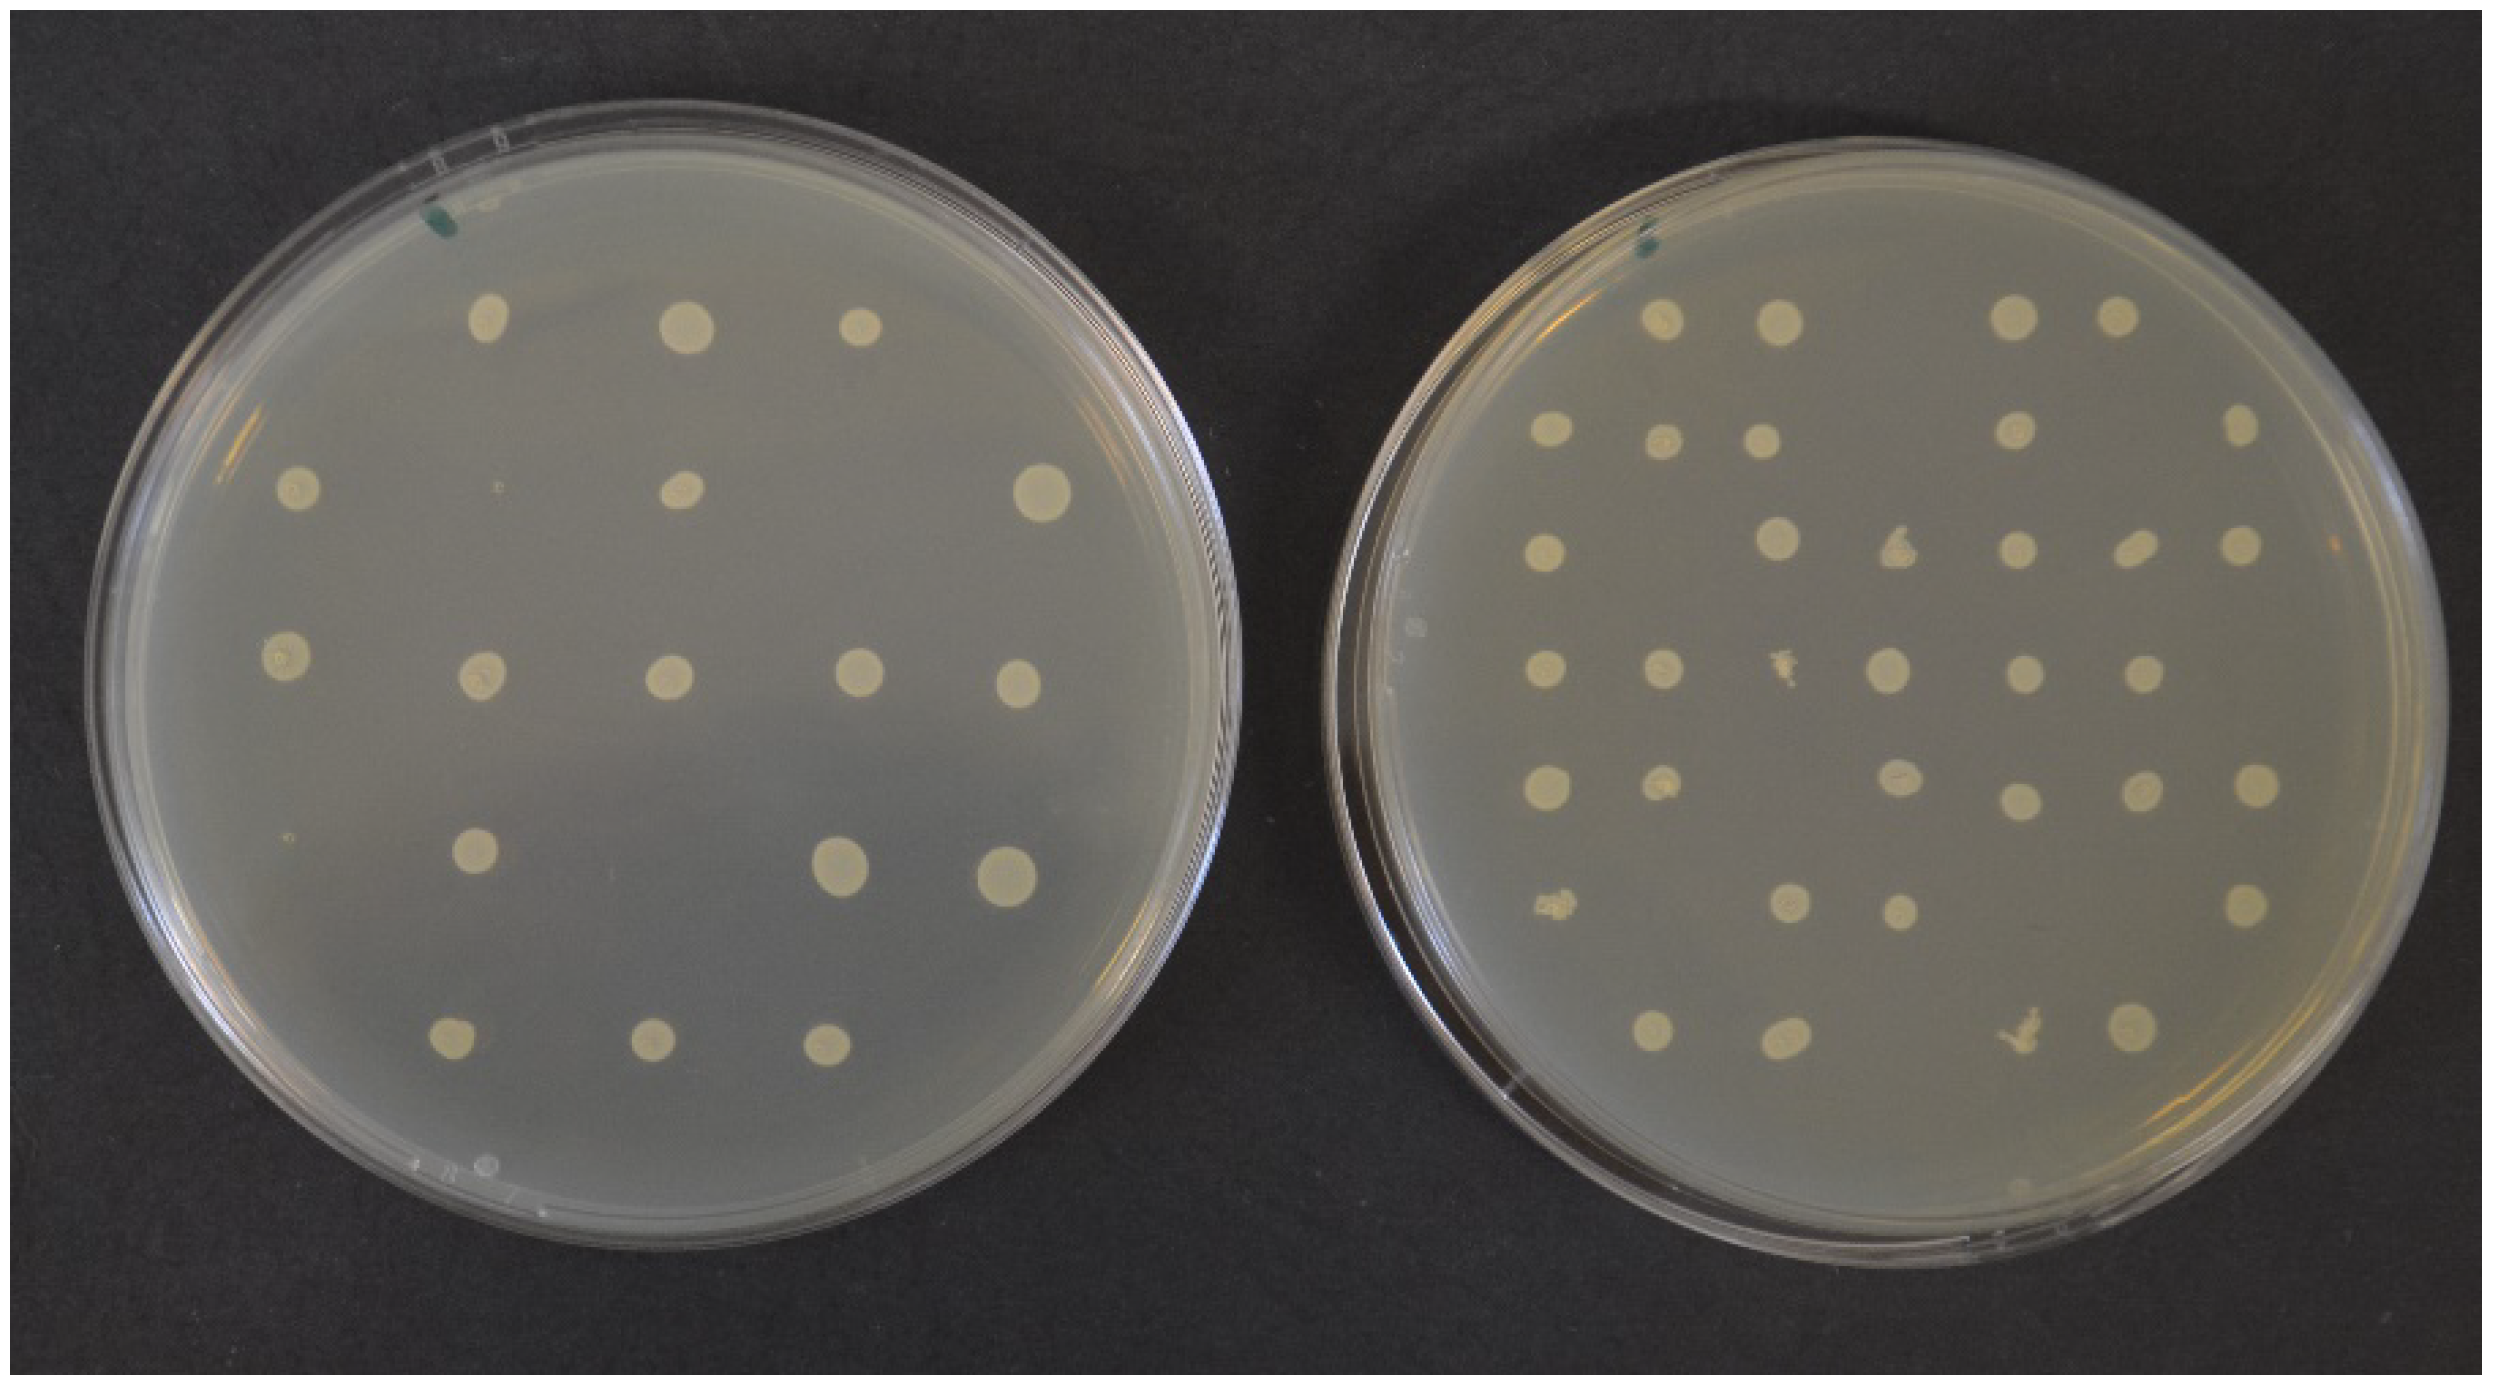
Figure 5.
Examples of agar diffusion assays with zones of inhibition: (a) agar disc diffusion; (b) agar well diffusion. 1 = cinnamon EO 10 μL (a) and 20 μL (b), 2 = positive control (tetracycline disc/solution), 3 = negative control (sterile distilled water). Disc/well diameter 6 mm.
Figure 5.
Examples of agar diffusion assays with zones of inhibition: (a) agar disc diffusion; (b) agar well diffusion. 1 = cinnamon EO 10 μL (a) and 20 μL (b), 2 = positive control (tetracycline disc/solution), 3 = negative control (sterile distilled water). Disc/well diameter 6 mm.
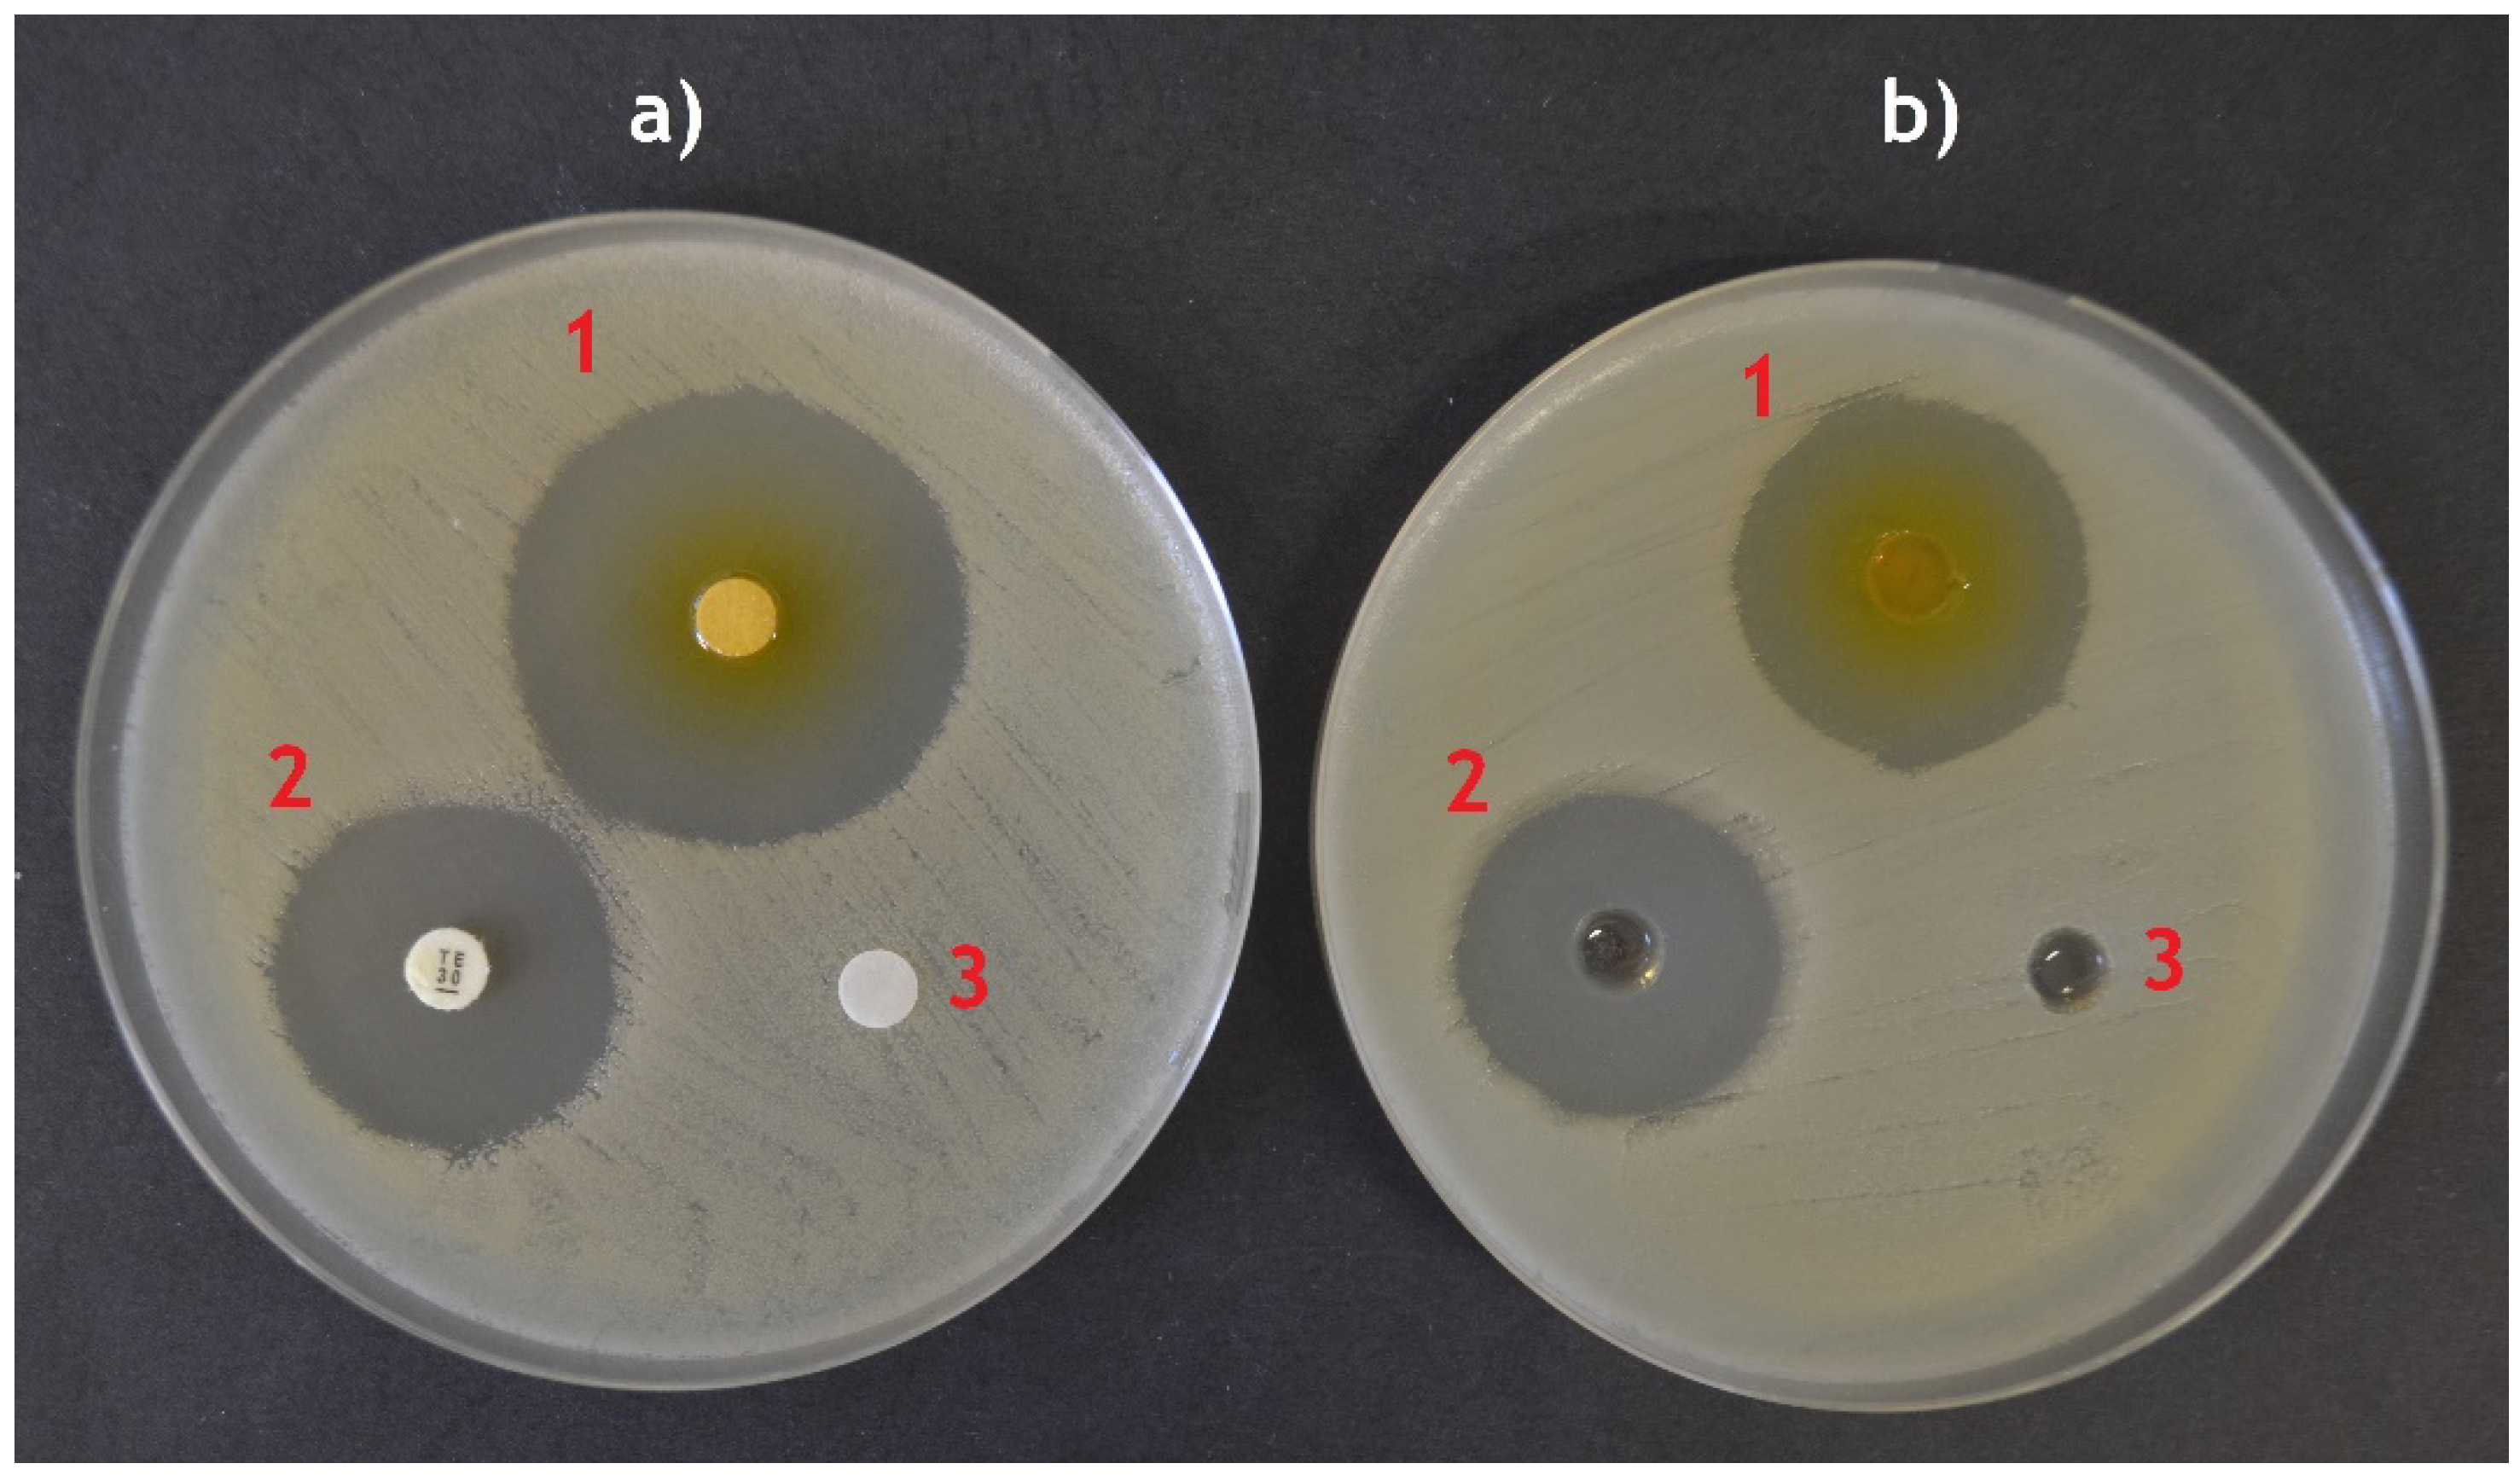

Table 1.
Table 1. Solubility of major EOs components in water at 25 °C [68].
Table 1.
Table 1. Solubility of major EOs components in water at 25 °C [68].
| Compound | CAS number | Solubility [mmol/l] | Solubility [mg/l] |
|---|---|---|---|
| α-pinene | 80-56-8 | 0.035 – 0.039 | 4.80 – 5.27 |
| Carvacrol | 499-75-2 | 6.65 – 8.32 | 999 – 1,250 |
| Carvone | 6485-40-1 | 8.65 – 11.0 | 1,300 – 1,652 |
| Citral | 5392-40-5 | 1.58 – 3.80 | 241 – 578 |
| Eucalyptol (1,8-cineole) | 470-82-6 | 20.1 – 22.0 | 3,100 – 3,388 |
| Eugenol | 97-53-0 | 15.0 | 2,463 |
| γ-Terpinene | 99-85-4 | 0.064 | 8.68 |
| Geraniol | 106-24-1 | 5.00 | 771 |
| Limonene | 138-86-3 | 0.064 – 0.220 | 8.71 – 30.0 |
| Linalool | 78-70-6 | 9.71 – 12.0 | 1,498 – 1,851 |
| Menthol | 89-78-1 | 2.92 | 456 |
| p-Cymene | 99-87-6 | 0.174 – 2.98 | 23.3 – 400 |
| Thymol | 89-83-8 | 5.70 – 6.65 | 856 – 999 |
| Trans-cinnamaldehyde | 14371-10-9 | 14.0 | 1,850 |
Disclaimer/Publisher’s Note: The statements, opinions and data contained in all publications are solely those of the individual author(s) and contributor(s) and not of MDPI and/or the editor(s). MDPI and/or the editor(s) disclaim responsibility for any injury to people or property resulting from any ideas, methods, instructions or products referred to in the content. |
© 2024 by the authors. Licensee MDPI, Basel, Switzerland. This article is an open access article distributed under the terms and conditions of the Creative Commons Attribution (CC BY) license (https://creativecommons.org/licenses/by/4.0/).
Copyright: This open access article is published under a Creative Commons CC BY 4.0 license, which permit the free download, distribution, and reuse, provided that the author and preprint are cited in any reuse.


