

Submitted:
27 July 2024
Posted:
30 July 2024
You are already at the latest version
Abstract
Recognizing the critical impact of environmental factors on individuals, this study explores the relationship between environmental indoor pollutants (PM1, PM2.5, PM10, and CO₂) and students' basic emotional responses based on Ekman’s categorization. Conducted in a secondary school in Spain, it integrates IoT and image processing technologies to monitor air quality and emotions in real-time. Participants included 76 secondary school students and three teachers, with data collected over two months. The results showed significant correlations between PM levels and negative emotions such as anger and disgust, while CO₂ levels were associated with both negative and positive emotions, including happiness. Regression models demonstrated that environmental variables significantly predict basic emotions, highlighting the influence of indoor air quality. These findings emphasize the need for proactive air quality management in educational settings to enhance learning environments and support students' emotional well-being.
Keywords:
Emotions
; Particular Matter
; CO₂
; Secondary School
; Indoor Air Quality
; Classroom
1. Introduction
Given that children spend many hours indoors at school, maintaining good indoor air quality is crucial not only for the well-being of students and teachers but also for the students’ academic performance. Numerous factors of the physical environmental may influence students’ academic achievement and academic background [1], but the indoor environmental quality of classrooms, including carbon dioxide (CO₂) and particulate matter (PM), can negatively impact teaching and learning [2].
In fact, special attention is given to environmental factors, as they are found to be influential in the teaching-learning process and constitute a significant opportunity for innovation in the classroom [3]; moreover, students’ emotions in the classroom are also of utmost importance, as we recently explored in another study [4].
It is documented that one of the most significant indoor pollutants is CO₂, and research indicates that many classrooms exhibit high levels of this gas [5]. These elevated CO₂ concentrations can compromise the well-being of students and, more critically, their school grades. Additionally, high levels of CO₂ in classrooms have been found to negatively impact students’ cognitive abilities, resulting in a decrease in correct responses and an increase in errors [6]. This issue is particularly concerning given the prevalence of negative emotional symptoms, such as anxiety, depression, and stress, among students during the COVID-19 lockdown [7]; for many, COVID-19 was a revelation about the importance of indoor air quality [8]. Moreover, a range of studies have explored the impact of indoor air quality on students’ emotions and well-being. [9] developed an IoT-based environmental monitoring system for educational facilities, which could be adapted to assess CO₂ levels and other parameters. [10] utilized a combination of sensors and wearables to monitor students’ physiological data, emotions, and engagement in a school setting, providing a rich dataset for analysis. [11] found that increased ventilation flow in computer classrooms led to improved air quality and thermal comfort, which could potentially influence students’ emotions. These studies collectively suggest that indoor air quality, including CO₂ levels and ventilation, may play a role in shaping students’ emotions and well-being. Poor indoor air quality is also evidenced by PM2.5 being associated with lower performance on cognitive tests [5]. Furthermore, various studies have revealed that children exposed to poor indoor air quality in schools perform worse in mathematics and reading comprehension tests [12].
The impact of CO₂ concentration on students’ well-being and performance is further highlighted [13], who found a correlation between increased CO₂ levels and lower performance.
Given the established links between indoor air quality and health outcomes, this study aims to explore the correlation between environmental pollutants, specifically PM and CO2 levels, and the basic emotional responses of students, providing a comprehensive assessment of how these factors interact in the classroom.
1.1. PM and CO₂
PM refers to all particles (solid particles and liquid droplets) that are suspended in ambient air, encompassing dust, dirt, soot, and smoke, and any other forms of aerosol particles [14], ozone, nitrogen dioxide, sulfur dioxide and carbon monoxide., n.d). PM is categorized into types based on the particle diameter, whereby PMx (with x=10, 2.5, 1, and 0.1) refers to the mass per unit volume of air of particles in sizes below x micrometers. PM10 are referred to as inhalable particles (generally depositing in the thoracic or upper respiratory tract), whereas PM2.5 are referred to as fine inhalable particles. Ultrafine particles are defined as those smaller than 0.1 µm (PM0.1), and represent a significant subset of airborne PM. (Schraufnagel, 2020) [15].
1.2. Basic emotions
According to Paul Ekman’s theory, basic emotions are biologically universal emotional experiences that are recognized across different cultures [16]. Ekman identified six primary emotions that are universally expressed and recognized: happiness, sadness, fear, disgust, anger, and surprise. These emotions are considered basic because they are associated with a distinct facial expression, which can be universally identified, regardless of cultural background. This recognition supports the idea that these emotions have evolutionary importance and are wired into our biology to help us respond to various stimuli from our environment [16].
In addition to the six basic emotions identified by Ekman, some extensions of Ekman’s work also include a "neutral" state, which is not characterized by a distinct universal facial expression associated with specific emotional content. The neutral state serves as a baseline or default expression when none of the identified basic emotions are being expressed.
1.3. The influence of CO₂ and PM on emotions and well-being
Various research suggests that exposure to elevated levels of CO₂ can have a negative impact on human emotions and well-being. As the student inhales less oxygen, less oxygen reaches the brain. If there is too much CO₂, students may find it difficult to pay attention to the teacher, or to concentrate on tests, or even to stay awake. In addition, high CO₂ levels can affect the ability to make decisions. [17] found that increased CO₂ concentrations led to decreased vigilance and more negative emotions in students. This is consistent with a review [18], which highlighted the aversive nature of CO₂ exposure in rats and its ability to elicit negative emotions. As [19] said, exposure to elevated levels of CO₂ can lead to emotional changes, including increased fear and discomfort. [20] provided a comprehensive review of the psychotropic effects of CO₂, including its ability to induce panic-like emotions. These findings collectively suggest that CO₂ can influence emotions and well-being, potentially leading to negative effects. In the context of the COVID-19 pandemic, [21] found that spending time outdoors was associated with improved emotional well-being, which may be relevant when considering how environmental factors such as CO₂ can impact emotions and well-being.
Regarding indoor PM, different studies consistently show that particularly PM2.5 has a significant impact on emotions and well-being. [22] found that increased PM2.5 levels are associated with negative emotions, with British observers showing a stronger response. This was further supported by [23], who observed a positive correlation between PM2.5 levels and negative social media posts. [24] and [25] found that emotional health can modify the effects of air pollution on physiological and psychological well-being, with Cakmak specifically noting that those who are less happy are more susceptible to suffer the adverse health effects of air pollution, and this has been demonstrated to have negative consequences for the learning process [23].
2. Materials and Methods
2.1. Participants
In this study, 76 students from a secondary school in an urban area of northeastern Spain participated. The age of the students ranged from 12 to 18 years old, so students were attending different levels. Precisely, 2 student groups belong to the first year of secondary school, one group to the fourth year, two groups to the first year of upper secondary school, and one student group to the second year of upper secondary school. The number of participating students per classroom was 24, with a range of 12 to 32 students per class. Groups are divided equally by gender. There were 3 teachers involved in the present study, all of them female.
2.2. Type of study
An exploratory observational design was done to obtain environmental data, such as CO₂ and particulates matter, and also to get emotions of students from six different class groups in a secondary school over 4 weeks. The present study was taken during the first term of the school course year. Technology and also another Technology-related subject, called SDG Project (Sustainable Development Goals - Green Project) were the subjects which students were attending during this study.
2.3. Ethics Statement
The researchers collected data during regular class hours, so Ethics approval was requested by the Ethics Committee of the University Rovira i Virgili. They reviewed and approved this experiment with the reference number: CEIPSA-2021-TD-0019. Moreover, at the beginning of each academic year, parents of all students at the school sign a consent form for or against their children being photographed or recorded. Students without parental consent sit out of camera range. For the collection of environmental data in the classroom, the study underwent an additional ethical review and was approved with the reference: CEIPSA-2021-PR-0018.
2.4. Emotion Recognition Data Collection
First of all, we developed a code capable of detecting and identifying faces and also analyzing facial expressions by a laptop camera. Python was used as the programming environment in which the code for detection, identification and recognition of emotions of faces was developed. Then, Py-Feat was the chosen tool to obtain the emotions of the attending class’s students and used to promptly process, analyze, and visualize the facial expression data. After that, the data was transferred into a database for further analysis. Also establishing the first approximations to the relationship between students’ emotions and other conditions such as the classroom environmental data [26,27].
The laptop camera pointed at and recorded the students, allowing for data acquisition. It covered as many students as were in the field of view of the webcam. The camera could bring both the front of the class and the back of the class into clear focus, although the students had to look straight ahead to be detected. The lessons were recorded and the videos were uploaded and stored digitally. In turn, the videos were split every 10 seconds into consecutive frames; this was made possible by our personalized code, converting the images into png files for subsequent data analysis. Finally, a csv file was extracted with all the emotions collected from the students detected in the image. Once the files with all the emotion data were obtained, all the images could be deleted.
2.5. Environmental Kit Data Collection
To obtain environmental data for the present study, a custom-designed device was used. It is labeled ACTUA-041 kit and belongs to the ACTUA Project. The project was started during the COVID-19 pandemic in May 2021. The project applies technology and data analysis to investigate the transmission of respiratory viruses, such as SARS-CoV-2, the virus causing COVID-19, in school classrooms. Identical devices to the ACTUA-041 kit were mainly placed in kindergarten and elementary school classrooms; but in our case, the device was placed in a secondary school as well. This project also includes the development of a monitoring tool that tracks various contextual variables, as well as a data analysis infrastructure to process the collected information.
The kit environmental monitoring (Figure 1) is a 20x20x10 cm box enclosed by a wooden base and perforated sheet, which contains a single-board computer, a Raspberry Pi, and a range of sensors that capture the contextual variables of the study, among others to measure CO₂ concentration and PM. These sensors are connected to the Raspberry Pi through cables inside the kit itself [28]. The specific relevant sensors for the present study are a Sensirion SCD30 for the CO₂ concentration, and a Plantower PMS5003 for the particulate matter.
To control the parameters and monitor the environmental parameters as efficiently as possible, the kit was placed at a strategic point; near the classroom entrance door to be able to connect it to an external sensor that detects whether the door is open or closed.
The kit measures every 10 minutes a range of variables to monitor conditions inside the classroom, such as temperature, ambient humidity, CO₂ concentration and various PMs, among others. To measure classroom conditions (see Table 1), the ACTUA project has developed an IoT-based contextual variable monitoring platform, which facilitates the achievement and deployment of sensory systems with network connectivity capabilities. This device sends the data collected every 8 hours to the ACTUA Project server via the Internet. The server stores all the information in a single database, and provides a web application capable of managing and visualizing all the system data (see Figures 2–5) [28].
2.6. Data Analysis
To address the asynchrony between environmental data, which tends to be less frequent compared to emotional measurements, the forward fill technique was adopted. This choice is grounded in the need to seamlessly fill temporal gaps in environmental data by leveraging the most recent available information. Employing this technique allows for maintaining a continuous and uniform temporal sequence, thereby facilitating the joint analysis of environmental and emotional data without compromising temporal coherence. Furthermore, aligning the data in this manner provides a solid foundation for investigating and understanding potential relationships and correlations between environmental factors and recorded emotions.
In addition, correlation and regression analyses were conducted to explore the relationships between environmental factors and emotional responses. To capture potential nonlinear associations, it was necessary to transform the variables into quadratic terms. This decision was motivated by the recognition that linear relationships may not fully capture the complexity of interactions between environmental variables and emotional states. By including quadratic terms, we aimed to account for potential curvature in the relationships, allowing for a more comprehensive analysis of the data and yielding insights into the nuanced dynamics between environmental factors and emotions.
3. Results
The correlation matrix showed several relationships between PM, CO₂ levels, and emotional responses.
PM1, PM2.5, and PM10 exhibit high and positive correlations among themselves, all with significant Spearman correlation coefficients (p < .001), suggesting a strong relationship between these air pollution variables. Additionally, a significant negative correlation is observed between PM1, PM2.5, and PM10 with CO₂ (p < .001), indicating an inverse relationship between particle concentration and CO₂.
Various correlations between emotions and environmental variables were observed in the study. Regarding PM (PM1, PM2.5, and PM10), some significant associations with certain emotions were found. For instance, PM2.5 showed a weak but significant correlation with emotions such as anger (rho = 0.016, p = 0.006), disgust (rho = 0.023, p < 0.001), and fear (rho = 0.017, p = 0.003), while PM10 exhibited similar correlations with disgust (rho = 0.029, p < 0.001) and fear (rho = 0.014, p = 0.015).
Furthermore, the concentration of CO₂ in the environment showed significant correlations with various emotions. Positive associations were found between CO₂ and emotions such as anger (rho = 0.098, p < 0.001), disgust (rho = 0.078, p < 0.001), fear (rho = -0.031, p < 0.001), happiness (rho = 0.018, p = 0.005), sadness (rho = -0.051, p < 0.001), and surprise (rho = -0.016, p = 0.013).
Table 2 is a summary of regression models for the basic emotions and highlights the efficacy of the environmental variables (CO₂, PM1, PM2.5 y PM10) in predicting emotional states. The models for neutral, fear, sadness, surprise, and happiness emotions show substantial R² values, ranging from 0.3641 for happiness to 0.6242 for neutral, indicating that a significant proportion of variance in these emotional responses is explained by the predictors used in the models. The coefficients of determination for these emotions are strongly supported by significant F-values, underscoring the statistical reliability of the models.
In contrast, the model for disgust shows a much lower R² value of 0.0728, suggesting that the predictors are less effective in capturing the variance in this emotion. However, it is still statistically significant. The model for anger is notably different, with an R² value of only 0.0002, and an Adjusted R² that is slightly negative. This suggests that the model is essentially ineffective at predicting anger, performing no better than a model with no predictors at all. The RMSE is exceedingly high, and the F-value is not statistically significant, indicating that the model predictors do not improve the fit in a meaningful way.
3.1. Fear
The regression analysis for the emotion of fear revealed that the model (Model H₁) is significant, explaining 56.04% of the variability in fear (R² = 0.5604, Adjusted R² = 0.5603), with a root mean square error (RMSE) of 0.1169. The ANOVA confirmed the significance of the model (F(8, 24448) = 3895.7853, p < .001), with a regression sum of squares of 425.723 and a residual sum of squares of 333.9531. The Durbin-Watson statistic indicated low autocorrelation in the residuals (1.8882, p < .001), validating the model assumptions.
The relationship between PM concentrations (PM1, PM2.5, PM10), CO₂, and their quadratic terms, and the emotion of fear showed varied results:
- PM1 and CO₂ had a significant positive impact on the emotion of fear.
- PM2.5 showed a non-significant trend towards a positive effect.
- PM10 was negatively associated with fear.
- The quadratic variables revealed significant nonlinear effects, except for sq_PM1.
The analysis of partial and part correlations highlighted the unique contribution of each variable. PM1 (Partial: 0.0224, Part: 0.0149) and CO₂ (Partial: 0.1724, Part: 0.1160) exhibited moderate to high positive partial correlations, indicating an increase in the emotion of fear with higher concentrations. In contrast, PM10 showed a strong negative relationship (Partial: -0.0614, Part: -0.0408), suggesting a decrease in fear with higher concentrations. These results underscore the complexity of environmental effects on emotional responses, demonstrating that both individual pollutants and their interactions significantly influence the emotion of fear.
3.2. Disgust
The linear regression model for predicting ’disgust’ (Model H₁) showed a significant relationship with the predictors. The model explained 7.28% of the variance in disgust scores, indicated by an R² of 0.0728, and an Adjusted R² of 0.0725. The root mean square error (RMSE) was 0.0563, reflecting the average deviation of the observed values from the predicted values.
The Durbin-Watson statistic was 1.9599, with a p-value of 0.0015, indicating a minimal level of autocorrelation in the residuals of the model, suggesting that the regression assumptions are met adequately.
The ANOVA for the regression revealed that the model was highly significant (F(8, 24449) = 240.034, p < .001). The regression sum of squares was 6.0838, explaining the variance attributed to the model, whereas the residual sum of squares was 77.4587, representing the unexplained variance.
- PM1: An increase in PM1 was significantly associated with a decrease in the emotion of disgust (β = -0.0051, SE = 0.002, p = 0.01).
- PM2.5: The concentration of PM2.5 showed a non-significant negative trend towards influencing disgust (β = -0.001, SE = 0.002, p = 0.6255).
- PM10: An increase in PM10 was associated with an increase in disgust, although not significantly (β = 0.0026, SE = 0.0015, p = 0.0766).
- CO₂: The concentration of CO₂ had a very slight and non-significant positive effect on disgust (β = 1.32E-05, SE = 1.73E-05, p = 0.4463).
Quadratic Variables:
- sq_PM1: Significantly positive (β = 0.0005, SE = 0.0002, p = 0.0023).
- sq_PM2.5: Non-significantly inversely related to disgust (β = -0.0001, SE = 0.0001, p = 0.1911).
- sq_PM10: Positively associated with disgust, but not significant (β = 3.85E-05, SE = 0.00008, p = 0.6207).
- sq_CO₂: Significantly positive effect on disgust (β = 7.79E-08, SE = 2.89E-08, p = 0.0071).
The findings indicate that higher concentrations of PM1 and quadratic terms of PM1 and CO₂ increase the emotion of disgust, while PM10 shows a positive but not significant effect. These relationships suggest nonlinear effects of these variables on the emotion of disgust, varying in direction depending on the PM or gas.
For PM1, both the partial and part correlations are negative (-0.0165 and -0.0159, respectively), indicating that when other variables are controlled, an increase in PM1 slightly reduces the emotion of disgust. PM2.5 also shows a slight negative influence on disgust with partial and part correlations of -0.0031 and -0.003, respectively, though the impact is minimal.
Conversely, PM10 exhibits a small positive effect on disgust, with partial and part correlations of 0.0113 and 0.0109, respectively. This suggests a mild increase in disgust as PM10 levels rise. Similarly, CO₂ levels are associated with a minor increase in disgust, as shown by partial and part correlations of 0.0049 and 0.0047.
Regarding the quadratic terms, sq_PM1 has a more substantial positive impact on disgust, with partial and part correlations of 0.0195 and 0.0188. This suggests a nonlinear relationship where higher squared values of PM1 are associated with an increase in disgust. On the other hand, sq_PM2.5 shows a negative influence, with correlations of -0.0084 for partial and -0.0081 for part, indicating a decrease in disgust with higher squared values of PM2.5.
Sq_PM10 and sq_CO₂ both show positive effects on disgust, with sq_PM10 having correlations of 0.0032 (partial) and 0.003 (part), and sq_CO₂ displaying more pronounced correlations of 0.0172 (partial) and 0.0166 (part). These results suggest that increases in the squared terms of PM10 and CO₂ are associated with slight increases in the intensity of disgust.
3.3. Happiness
The regression analysis for the emotion of happiness demonstrates notable associations with specific environmental pollutants, both in their direct concentrations and quadratic forms. This analysis identifies the complex relationships between PM, CO₂ levels, and their nonlinear transformations with the emotional response of happiness.
The model achieves a reasonable fit, explaining approximately 36.41% of the variance in happiness, as indicated by an R² value of 0.3641, with an adjusted R² very close at 0.3639. The root mean square error (RMSE) of 0.159 suggests moderate predictive accuracy.
Significant relationships observed include:
- PM1: A significant negative correlation with happiness, indicating that higher concentrations of PM1 are associated with lower happiness levels (β = -0.0625, p < .001).
- PM2.5: In contrast, PM2.5 shows a positive association with happiness, suggesting that increased levels of this particulate could correspond to higher happiness levels (β = 0.0588, p < .001).
- CO₂: Displays a small but statistically significant positive effect on happiness (β = 0.0002, p = 0.0011), indicating that as CO₂ levels rise, so does happiness, albeit slightly.
For the quadratic terms:
- sq_PM1 and sq_PM2.5 show significant effects on happiness with sq_PM1 increasing happiness (β = 0.0036, p < .001) and sq_PM2.5 decreasing it (β = -0.0024, p < .001), suggesting nonlinear responses to these particulate concentrations.
- sq_CO₂ also shows a slight negative effect on happiness (β = -2.35E-07, p = 0.004), pointing to a complex relationship where increases in the squared values of CO₂ levels slightly reduce happiness.
The data on part and partial correlations reveals how various pollutants are uniquely associated with an emotional response, even after controlling for the effects of other variables in the model. In this analysis, PM1 displays a negative relationship with the emotional response, as both partial (-0.0716) and part correlations (-0.0572) indicate that an increase in PM1 levels is associated with a decrease in the emotional response. Conversely, PM2.5 is positively correlated, with partial and part correlations of +0.0665 and +0.0532 respectively, suggesting that higher levels of PM2.5 increase the emotional response.
PM10 shows a negligible negative influence on the emotional response, with very small negative correlations. On the other hand, CO₂ has a moderate positive impact, as indicated by its partial and part correlations of +0.0208 and +0.0166 respectively. This suggests that CO₂ levels might slightly elevate the emotional response.
Interestingly, the squared terms of the pollutants (sq_PM1, sq_PM2.5, sq_PM10, and sq_CO₂) reveal more about the complexity of these relationships. The square of PM1 concentration correlates positively (partial correlation of +0.0470 and part correlation of +0.0375), implying a nonlinear relationship where higher squared values of PM1 increase the emotional response. In contrast, the square of PM2.5 levels shows a strong negative effect on the emotional response (partial correlation of -0.0551 and part correlation of -0.0440), indicating a pronounced decrease with higher squared PM2.5 levels.
Similarly, sq_PM10 displays a small positive effect, while sq_CO₂ shows a negative influence, indicating that higher squared levels of CO₂ might slightly dampen the emotional response.
3.4. Happiness
The regression analysis for sadness, using a linear regression model (Model H₁), yielded a substantial explanation of variance, with the model accounting for approximately 54.46% of the variation in sadness scores (R² = 0.5446). This model fit is further supported by a robust F-statistic (F(8, 24449) = 3654.0139, p < .001), indicating that the overall model is statistically significant.
The adjusted R² value of 0.5444 closely mirrors the unadjusted R², suggesting minimal overfitting and reliable variance explanation by the model. The root mean square error (RMSE) is 0.1497, reflecting the typical deviation of the predicted sadness values from the observed data, which provides a good indication of the model’s prediction accuracy.
The model’s Durbin-Watson statistic of 1.7936 with a p-value < .001 indicates a low to moderate level of autocorrelation among the residuals, which is generally acceptable and suggests that the model residuals are independent across observations.
Delving into the coefficients, PM1 is positively associated with sadness (β = 0.0884, p < .001), indicating that higher concentrations of PM1 particles could potentially increase the intensity of sadness. Conversely, both PM2.5 and PM10 are negatively associated with sadness, with coefficients of -0.0439 (p < .001) and -0.0282 (p < .001) respectively, suggesting that higher concentrations of these particles might mitigate the sadness response.
The effect of CO₂ on sadness is also noteworthy, with a significant positive coefficient (β = 0.0012, p < .001), which implies that increasing levels of CO₂ are associated with an increase in sadness.
Regarding the squared terms, which explore nonlinear effects, we observe varied influences: the squared term of PM1 (sq_PM1) shows a significant negative effect on sadness (β = -0.0062, p < .001), while the squared terms of PM2.5 (sq_PM2.5) and PM10 (sq_PM10) display positive relationships with sadness, with coefficients of 0.0012 (p < .001) and 0.0017 (p < .001), respectively. The squared term of CO₂ (sq_CO₂) significantly negatively impacts sadness (β = -1.13E-06, p < .001), suggesting that the relationship between CO₂ and sadness may have diminishing returns at higher concentrations.
3.5. Surprise
The linear regression model for the emotion of surprise (Model H₁) explains a substantial amount of variance, with an R² of 0.5045, indicating that approximately 50.45% of the variance in the surprise scores is accounted for by this model. The adjusted R² is very close at 0.5043, suggesting the model generalizes well without overfitting. The model’s robustness is further highlighted by a significant F statistic (F(8, 24449) = 3111.102, p < .001).
The Durbin-Watson statistic of 1.9071, with a low autocorrelation (p < .001), assures that the residuals of the model are independent, affirming the reliability of the regression analysis. This comprehensive analysis indicates a complex interplay of PM and CO₂ with the emotion of surprise, highlighting both linear and non-linear dynamics.
In terms of the coefficients, PM1 exhibits a negative association with surprise (β = -0.0137, p = 0.052), although it borders on non-significance, suggesting a marginal decrease in surprise with increased PM1 levels. On the other hand, PM2.5 has a slightly positive, though non-significant, influence on surprise (β = 0.0109, p = 0.1256). PM10 shows a more robust negative relationship with surprise (β = -0.027, p < .001), indicating that higher concentrations of PM10 may significantly reduce the level of surprise experienced.
The CO₂ levels have a significant positive effect on surprise (β = 0.0017, p < .001), suggesting that increases in CO₂ are associated with a greater expression of surprise. This relationship is supported by a strong t-value, indicating a robust and consistent effect across the model.
For the squared terms, which help explore non-linear relationships:
- sq_PM1 shows a slight positive effect, though not statistically significant (β = 0.0008, p = 0.2195).
- sq_PM2.5 has a minor negative impact on surprise, also not reaching statistical significance (β = -0.0005, p = 0.1396).
- sq_PM10, however, has a statistically significant positive effect (β = 0.0013, p < .001), suggesting a complex non-linear relationship with surprise where higher levels may increase the emotion.
- The squared CO₂ term (sq_CO₂) significantly negatively impacts surprise (β = -2.44E-06, p < .001), implying that at higher concentrations, CO₂ might dampen the intensity of surprise experienced.
3.6. Anger
For the anger model, the R² value of 0.0002 is extremely low, indicating that the model explains almost no variation in the anger variable. This is further confirmed by the negative adjusted R² (-0.0001), suggesting that the model might be worse than simply using the mean of the dependent variable for prediction. The F Change value of 0.7455 implies that the predictors do not significantly improve the model compared to a null model without predictors. The RMSE is extremely high (2.37E+07), indicating that the errors of the model are large in magnitude, which suggests poor predictive ability of the model. It is possible that the variables PM1, PM2.5, PM10, CO₂, and their squared terms are not relevant for explaining variations in the emotion of anger. This could be due to anger being more influenced by internal or situational factors that are not captured by these environmental variables.
3.7. Neutral
The linear regression model for the emotion of neutrality, as indicated by Model H1, exhibits strong predictive accuracy. The model accounts for approximately 62.42% of the variance in neutral emotion scores, evidenced by a R² of 0.6242, which aligns closely with the Adjusted R² value of 0.6241. This suggests that the model is effectively tailored to the data while controlling for the number of predictors used. The root mean square error (RMSE) stands at 0.1973, which indicates a reasonable error magnitude. Moreover, the Durbin-Watson statistic of 1.873 suggests minimal autocorrelation in the residuals, supporting the independence of observations, a key assumption in linear regression modeling.
The ANOVA results further reinforce the model’s robustness, with the regression sum of squares significantly high at 1580.9524 compared to the residual sum of squares of 951.777, resulting in a high F-statistic of 5076.3867 (p < .001). This indicates that the predictors contribute significantly to explaining the variability in neutral.
Reviewing the coefficients, PM10 and CO₂ are notable contributors to the model, both showing significant positive standardized coefficients, indicating a stronger impact on the neutral emotion as their levels increase. Specifically, PM10 has a standardized coefficient of 0.5583, and CO₂ has 0.1415, both significant at p < .001. This suggests that increases in PM10 and CO₂ are associated with increases in the likelihood of a neutral emotional response.
Conversely, sq_PM10 shows a significant negative impact (standardized coefficient = -1.0667, p < .001), indicating that as the square of PM10 increases, the likelihood of a neutral emotional response decreases. This could suggest a non-linear relationship where very high levels of PM10 might lead to less neutral emotional responses.
Other variables like PM1, PM2.5, and their squared terms show non-significant or minimal effects, as indicated by their p-values and small effect sizes. This implies that these PM, in their linear and squared forms, do not substantially influence the neutral emotion in the studied dataset.
4. Discussion
The results of our study reveal significant correlations between levels of CO₂ and various emotions, particularly those with negative connotations. Positive associations were found between CO₂ and emotions such as anger (rho = 0.098, p < 0.001), disgust (rho = 0.078, p < 0.001), and sadness (rho = -0.051, p < 0.001). These correlations suggest that higher levels of CO₂ may be associated with an increase in negative emotions among students in educational settings.
These findings are consistent with previous research that has documented the adverse effects of CO₂ on emotions and emotional well-being. [17] and [18] have reported that an increase in CO₂ concentrations may lead to a decrease in vigilance and more negative emotions in humans and rats, respectively. Additionally, the review conducted by [20] highlights the CO₂’s capacity to induce panic-like emotions. In this context, our results support the notion that air quality in educational environments can significantly influence the emotional state of students, underscoring the importance of measures to manage and improve air quality in these settings.
Various correlations between emotions and environmental variables were observed in this study. Regarding PM concentration (PM1, PM2.5, and PM10), some significant associations with certain emotions were found. For instance, PM2.5 showed a weak but significant correlation with emotions such as anger (rho = 0.016, p = 0.006), disgust (rho = 0.023, p < 0.001), and fear (rho = 0.017, p = 0.003), while PM10 exhibited similar correlations with disgust (rho = 0.029, p < 0.001) and fear (rho = 0.014, p = 0.015).
These findings align with existing research indicating the significant impact of indoor PM, particularly PM2.5, on emotions and well-being. [22] and [23] highlighted how increases in PM2.5 levels are correlated with negative emotional responses, both in direct observations and in analyses of behavior on social media. These findings align with our discovery that PM2.5 can alter emotions such as sadness, suggesting a detrimental influence on emotional well-being that could be magnified in settings with poor air quality. Additionally, studies by [24] and [25] have shown that emotional health can influence how air pollution affects physiological and psychological well-being. [24] specifically noted that individuals who are less happy are more vulnerable to the adverse health effects of air pollution. These findings underscore the potential negative consequences of indoor PM on emotional well-being, which can ultimately impact the learning process [25].
Regarding the results from the regression models, our findings indicate that CO₂ has a considerable effect on increasing the sensation of surprise and, contrary to what might be expected from the literature, also on enhancing neutrality instead of fostering negative emotions. This difference could be attributed to variations in exposure contexts or in the methodologies of measurement and analysis. According to studies such as those by [17] and [19], high levels of CO₂ generally lead to decreased vigilance and the emergence of negative emotions, such as fear and discomfort, which could culminate in states of panic as described by [20]. This contrast suggests that the emotional response to CO₂ might be more complex and varied than previously understood, potentially affected by environmental or personal factors not fully explored in earlier studies.
Furthermore, the impact of PM1 on emotions such as sadness and happiness, where we found that an increase in PM1 is associated with greater sadness and a decrease in happiness, reinforces the notion that finer particles can have deeper and more negative emotional effects. These results emphasize the importance of considering the specific characteristics of pollutants when assessing their emotional impact.
5. Conclusions
This study provides significant evidence of the relationship between environmental variables and emotions in educational settings, particularly concerning PM concentration (PM1, PM2.5, and PM10) and CO₂ in secondary school classrooms. Significant correlations were observed between these variables and a variety of emotions, highlighting positive associations between CO₂ and negative emotions such as anger, disgust, and sadness, as well as similar correlations between PM and emotions such as anger, disgust, and fear.
Our research illustrates the complex relationship between air pollutants and human emotions, showing that CO₂ can increase feelings of surprise and neutrality, which diverges from previous studies typically associating it with negative effects. The consistent negative impact of PM2.5 on emotional responses and the profound influence of finer particles like PM1 on sadness and happiness highlight the importance of considering air quality’s emotional repercussions.
These findings highlight the need for strategies that improve the design and environmental management of classrooms, promoting healthier and more effective learning environments. In this context, classroom design is becoming increasingly important, proposing recommendations for the design and use of classrooms to create stimulating, safe, and sustainable spaces, where the use of technology plays an essential role in optimizing learning [29].
A limitation of this study is its non-experimental method. Without direct manipulation of environmental variables or controlled exposure of participants to different conditions, causal relationships between environmental variables and observed emotions cannot be established. Although significant correlations have been identified, the presence of confounding variables or other uncontrolled factors that may influence the results cannot be ruled out. Additionally, the lack of experimental control limits our ability to make inferences about the direction or magnitude of the relationship between variables.
Furthermore, the contributions of this study lie in utilizing advanced technology to integrate it into the natural environment, bringing us closer to an intelligent learning environment [30]. The idea of monitoring environmental variables in schools is not only feasible but also beneficial. By implementing systems that continuously track levels of pollutants such as CO₂ and PM like PM2.5 and PM1, schools can gain valuable insights into the air quality within their facilities. This proactive approach allows for immediate responses to deteriorating conditions, potentially preventing the negative effects of poor air quality.
With real-time data, school administrators can take informed decisions about ventilation and air purification, among other factors, ensuring that the learning environment is conducive to both academic performance and emotional health. This can be particularly important during activities that increase indoor CO₂ levels, such as physical education or when rooms are densely populated. Furthermore, understanding the fluctuations in air quality throughout the day can help schools plan activities during times when air quality is better, or take corrective measures when pollution levels are high.
Funding
This research was partially funded by AGAUR, Generalitat de Catalunya, grant number 2020PANDE00103.
Institutional Review Board Statement
In this section, you should add the Institutional Review Board Statement and approval number, if relevant to your study. You might choose to exclude this statement if the study did not require ethical approval. Please note that the Editorial Office might ask you for further information. Please add “The study was conducted in accordance with the Declaration of Helsinki, and approved by the Institutional Review Board (or Ethics Committee) of NAME OF INSTITUTE (protocol code XXX and date of approval).” for studies involving humans. OR “The animal study protocol was approved by the Institutional Review Board (or Ethics Committee) of NAME OF INSTITUTE (protocol code XXX and date of approval).” for studies involving animals. OR “Ethical review and approval were waived for this study due to REASON (please provide a detailed justification).” OR “Not applicable” for studies not involving humans or animals.
Informed Consent Statement
Informed consent was obtained from all subjects involved in the study.
Data Availability Statement
Data is unavailable due to privacy or ethical restrictions.
Acknowledgments
The ACTUA project technical personnel and researchers from Universitat Rovira i Virgili, that made possible the development of the ACTUA kit are gratefully acknowledged; particularly Professors Agusti Solanas, Antoni Martínez-Ballesté, and Francisco J. Huera-Huarte, as well as Dr. Edgar Batista, and Oriol Vilanova.
Conflicts of Interest
The authors declare no conflict of interest.
References
- Dyment, J.E. Gaining Ground: The Power and Potential of School Ground Greening in the Toronto District School Board. Evergreen 2005, 15, 2, 435–437. [Google Scholar]
- Brink, H.W.; Loomans, M.G.L.C.; Mobach, M.P.; Kort, H.S.M. Classrooms’ Indoor Environmental Conditions Affecting the Academic Achievement of Students and Teachers in Higher Education: A Systematic Literature Review. Indoor Air 2021, 31, 2, 405–425. [Google Scholar] [CrossRef]
- Mogas-Recalde, J. (2021). Resum de la tesi doctoral «Smart Classrooms i l’adveniment de la Quarta Revolució Industrial: anàlisi dels factors clau per al disseny d’aules intel·ligents». UTE Teaching & Technology (Universitas Tarraconensis), 1(3), 61.
- Llurba, C.; Fretes, G.; Palau, R. Classroom Emotion Monitoring Based on Image Processing. Sustainability 2024, 16, 916. [Google Scholar] [CrossRef]
- Cedeño Laurent, J.G.; MacNaughton, P.; Jones, E.R.; Young, A.S.; Bliss, M.S.; Flanigan, S.; Vallarino, J.; Chen, L.; Cao, X.; Allen, J.G. Associations between acute exposures to PM2. 5 and carbon dioxide indoors and cognitive function in office workers: A multicountry longitudinal prospective observational study. Environ. Res. Lett. 2021, 16, 094047. [Google Scholar] [CrossRef]
- Sidorin, D.I. Dynamics of carbon dioxide concentrations in the air and its effect on the cognitive ability of school students. Izv. Atmos. Ocean. Phys. 2015. [CrossRef]
- Oliveira Carvalho, P.; Hülsdünker, T.; Carson, F. The Impact of the COVID-19 Lockdown on European Students’ Negative Emotional Symptoms: A Systematic Review and Meta-Analysis. Behav. Sci. 2021. [CrossRef] [PubMed]
- Wiryasaputra, R.; Chin-Yin, H.; Endah, K.; Po-Yu, L.; Ting-Kuang, Y.; Chao-Tung, Y. Review of an intelligent indoor environment monitoring and management system for COVID-19 risk mitigation. Front. Public Health 2023, 10. [Google Scholar] [CrossRef] [PubMed]
- K Kanál, A.K.; Kovácsházy, T. Assessment of Indoor Air Quality of Educational Facilities using an IoT Solution for a Healthy Learning Environment. In Proceedings of the International Instrumentation and Measurement Technology Conference; 2020. [Google Scholar]
- Gao, N.; Marschall, M.; Burry, J.; Watkins, S.; Salim, D.F. Understanding occupants’ behaviour, engagement, emotion, and comfort indoors with heterogeneous sensors and wearables. ArXiv 2021. [CrossRef] [PubMed]
- Norbäck, D.; Nordström, K. An experimental study on effects of increased ventilation flow on students’ perception of indoor environment in computer classrooms. Indoor Air: Int. J. Indoor Environ. Health 2008. [CrossRef]
- Shaughnessy, R.J.; Haverinen-Shaughnessy, U.; Nevalainen, A.; Moschandreas, D. A preliminary study on the association between classroom ventilation rates and student performance. Indoor Air 2006, 16, 6, 465–468. [Google Scholar] [CrossRef]
- Bogdanovica, S.; Zemitis, J.; Bogdanovičs, R. The Effect of CO2 Concentration on Children’s Well-Being during the Process of Learning. Energies 2020. [CrossRef]
- World Health Organization. WHO Global Air Quality Guidelines: Particulate Matter (PM2.5 and PM10), Ozone, Nitrogen Dioxide, Sulfur Dioxide and Carbon Monoxide; World Health Organization: Geneva, Switzerland, 2021. [Google Scholar]
- Schraufnagel, D.E. The health effects of ultrafine particles. Exp. Mol. Med. 2020, 52, 311–317. [Google Scholar] [CrossRef] [PubMed]
- Pang, L.; Zhang, J.; Cao, X.; Wang, X.; Liang, J.; Zhang, L.; Guo, L. The effects of carbon dioxide exposure concentrations on human vigilance and sentiment in an enclosed workplace environment. Indoor Air: Int. J. Indoor Environ. Health 2020. [CrossRef]
- Améndola, L.; Ratuski, A.; Weary, D.M. Individual differences in rat sensitivity to CO2. PLoS ONE 2021, 16, e0245347. [Google Scholar] [CrossRef] [PubMed]
- Leibold, N.K.; Viechtbauer, W.; Goossens, L.; De Cort, K.; Griez, E.J.; Myin-Germeys, I.; Steinbusch, H.W.M.; Van den Hove, D.L.A.; Schruers, K.R.J. Carbon dioxide inhalation as a human experimental model of panic: The relationship between emotions and cardiovascular physiology. Biol. Psychol. 2013. [CrossRef] [PubMed]
- Colasanti, A.; Esquivel, G.; Schruers, K.; Griez, E. On the psychotropic effects of carbon dioxide. Curr. Pharm. Des. 2012. [CrossRef] [PubMed]
- Lades, L.; Laffan, K.; Daly, M.; Delaney, L. Daily emotional well-being during the COVID-19 pandemic. Br. J. Health Psychol. 2020. [CrossRef] [PubMed]
- Li, Y.; Guan, D.; Yu, Y.; Westland, S.; Wang, D.; Meng, J.; Wang, X.; He, K.; Tao, S. A psychophysical measurement on subjective well-being and air pollution. Nat. Commun. 2019. [CrossRef] [PubMed]
- Shan, S.; Ju, X.; Wei, Y.; Wang, Z. Effects of PM2. 5 on People’s Emotion: A Case Study of Weibo (Chinese Twitter) in Beijing. Int. J. Environ. Res. Public Health 2021, 18, 5422. [Google Scholar] [CrossRef]
- Cakmak, S.; Dales, R.; Blanco, C. Does emotional health influence susceptibility to the physiologic effects of air pollution on adults. Sustain. Dev. Plan. 2016, 11, 537–545. [Google Scholar] [CrossRef]
- Bullinger, M. Relationships between air pollution and well-being. Soz. Praventivmed. 1989. [CrossRef]
- Wargocki, P.; Porras-Salazar, J.A.; Contreras-Espinoza, S.; Bahnfleth, W. The relationships between classroom air quality and children’s performance in school. Build. Environ. 2020, 106749. [Google Scholar] [CrossRef]
- Llurba, C.; Fretes, G.; Palau, R. Pilot study of real-time Emotional Recognition technology for Secondary school students. Interact. Des. Archit. 2022, 52, 61–80. [Google Scholar] [CrossRef]
- Fretes, G.; Llurba, C.; Palau, R. Influence of teaching activities, environmental conditions and class schedules on teacher stress measured with a smartwatch: a pilot study. J. Technol. Sci. Educ. 2023, 13, 775–787. [Google Scholar] [CrossRef]
- Batista, E.; Huera-Huarte, F.J.; Martínez-Ballesté, A.; Rosell-Llompart, J.; Solanas, A. El projecte ACTUA: Investigant la transmissibilitat dels virus respiratoris a les aules; Self-published by the authors: 2023.
- Moreno-Moreno, P.; Palau, R. Guía de diseño de Smart Classrooms basada en condiciones ambientales. Rev. Interuniv. Investig. Tecnol. Educ. 2023, 14, 138–158. [Google Scholar] [CrossRef]
- Palau, R.; Mogas, J. Systematic literature review for a characterization of the smart learning environments. In Propuestas multidisciplinares de innovación e intervención educativa; Cruz, A.M., Aguilar, A.I., Eds.; Universidad Internacional de Valencia: Valencia, Spain, 2019. [Google Scholar]
Figure 1.
ACTUA Kit device for contextual indoor monitoring.
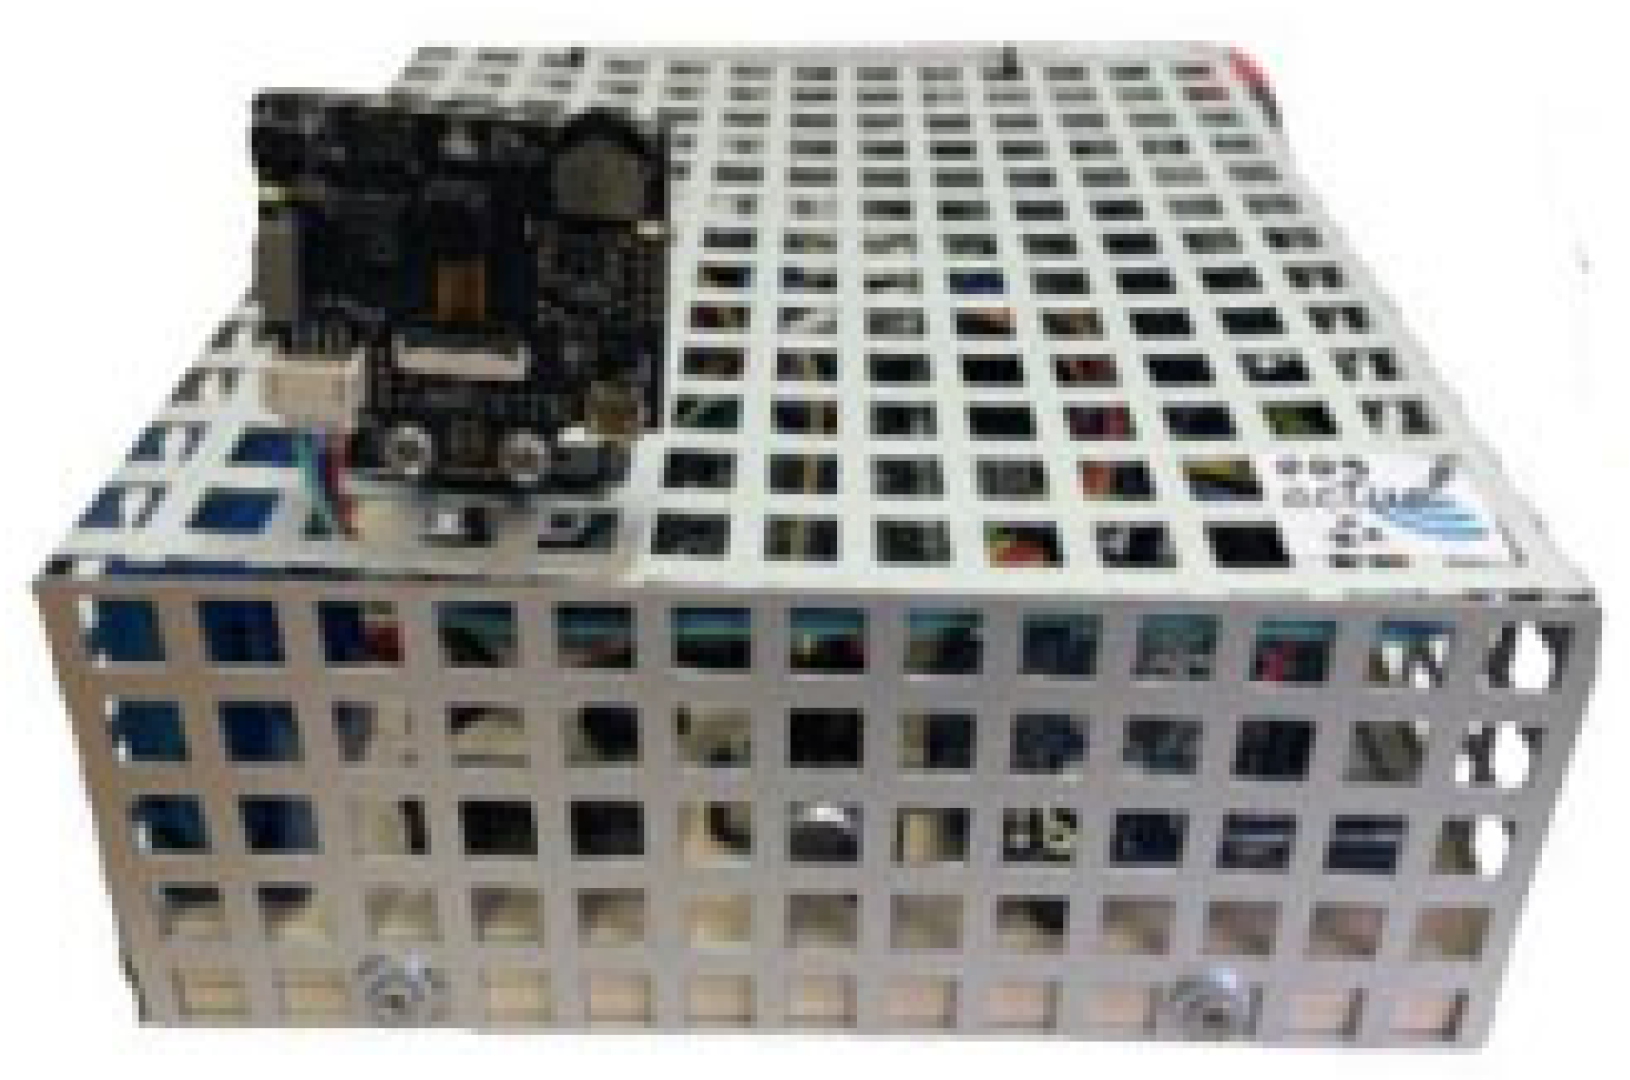

Table 1.
Spearman’s rho heatmap among PM, CO₂ and emotions.
| Spearman’s Correlations | |||||
|---|---|---|---|---|---|
| Spearman’s rho | p | ||||
| PM1 | - | PM2.5 | 0.972 | *** | < .001 |
| PM1 | - | PM10 | 0.955 | *** | < .001 |
| PM1 | - | C02 | -0.622 | *** | < .001 |
| PM2.5 | - | PM10 | 0.973 | *** | < .001 |
| PM2.5 | - | C02 | -0.548 | *** | < .001 |
| PM10 | - | C02 | -0.477 | *** | < .001 |
| PM1 | - | anger | 0.003 | 0.583 | |
| PM2.5 | - | anger | 0.016 | ** | 0.006 |
| PM10 | - | anger | 0.026 | *** | < .001 |
| CO2 | - | anger | 0.098 | *** | < .001 |
| PM1 | - | disgust | 0.013 | * | 0.027 |
| PM2.5 | - | disgust | 0.023 | *** | < .001 |
| PM10 | - | disgust | 0.029 | *** | < .001 |
| CO2 | - | disgust | 0.078 | *** | < .001 |
| PM1 | - | Fear | 0.019 | ** | 0.001 |
| PM2.5 | - | Fear | 0.017 | ** | 0.003 |
| PM10 | - | Fear | 0.014 | * | 0.015 |
| CO2 | - | Fear | -0.031 | *** | < .001 |
| PM1 | - | happiness | 0.007 | 0.249 | |
| PM2.5 | - | happiness | 0.028 | *** | < .001 |
| PM10 | - | happiness | 0.017 | ** | 0.004 |
| CO2 | - | happiness | 0.018 | ** | 0.005 |
| PM1 | - | sadness | 0.006 | 0.317 | |
| PM2.5 | - | sadness | -0.007 | 0.264 | |
| PM10 | - | sadness | -0.007 | 0.250 | |
| CO2 | - | sadness | -0.051 | *** | < .001 |
| PM1 | - | surprise | -0.032 | *** | < .001 |
| PM2.5 | - | surprise | -0.032 | *** | < .001 |
| PM10 | - | surprise | -0.035 | *** | < .001 |
| CO2 | - | surprise | -0.016 | * | 0.013 |
| PM1 | - | neutral | -0.006 | 0.309 | |
| PM2.5 | - | neutral | -0.015 | * | 0.012 |
| PM10 | - | neutral | -0.023 | *** | < .001 |
| CO2 | - | neutral | -0.099 | *** | < .001 |
* p < .05, ** p < .01, *** p < .001.
Table 2.
| Model summary H1 | Durbin-Watson | |||||||||||
|---|---|---|---|---|---|---|---|---|---|---|---|---|
| Emotion | R | R² | Adjusted R² | RMSE | R² Change | F Change | df1 | df2 | p | Autoco rrelation |
Statistic | p |
| Neutral | 0.7901 | 0.6242 | 0.6241 | 0.1973 | 0.6242 | 5076.3867 | 8 | 24449 | < .001 | 0.0635 | 1.873 | < .001 |
| Fear | 0.7486 | 0.5604 | 0.5603 | 0.1169 | 0.5604 | 3895.7853 | 8 | 24448 | < .001 | 0.0559 | 1.8882 | < .001 |
| Sadness | 0.7379 | 0.5446 | 0.5444 | 0.1497 | 0.5446 | 3654.0139 | 8 | 24449 | < .001 | 0.1032 | 1.7936 | < .001 |
| Surprise | 0.7103 | 0.5045 | 0.5043 | 0.2009 | 0.5045 | 3111.102 | 8 | 24449 | < .001 | 0.0464 | 1.9071 | < .001 |
| Happiness | 0.6034 | 0.3641 | 0.3639 | 0.159 | 0.3641 | 1749.8634 | 8 | 24449 | < .001 | 0.0413 | 1.9173 | < .001 |
| Disgust | 0.2699 | 0.0728 | 0.0725 | 0.0563 | 0.0728 | 240.034 | 8 | 24449 | < .001 | 0.0201 | 1.9599 | 0.0015 |
| Anger | 0.0145 | 0.0002 | -0.0001 | 2.37E+07 | 0.0002 | 0.639 | 8 | 24434 | 0.746 | -0.0002 | 2.0004 | 0.9905 |
Disclaimer/Publisher’s Note: The statements, opinions and data contained in all publications are solely those of the individual author(s) and contributor(s) and not of MDPI and/or the editor(s). MDPI and/or the editor(s) disclaim responsibility for any injury to people or property resulting from any ideas, methods, instructions or products referred to in the content. |
© 2024 by the authors. Licensee MDPI, Basel, Switzerland. This article is an open access article distributed under the terms and conditions of the Creative Commons Attribution (CC BY) license (http://creativecommons.org/licenses/by/4.0/).
Copyright: This open access article is published under a Creative Commons CC BY 4.0 license, which permit the free download, distribution, and reuse, provided that the author and preprint are cited in any reuse.


