
Submitted:
05 December 2024
Posted:
06 December 2024
You are already at the latest version
Abstract
Background: Multiple studies have found an association between ambient air quality, noise pollution, green spaces, and health. The underlying mechanisms of this association remain partly unknown. In this study, we focus on subjective perception as a potential underlying factor.
Methods: The data consisted of a linkage between the 2001 census, register mortality data from the 1st of October 2001 to the 31st of December 2016 and objective indicators of the residential living environment (air and noise pollution and green spaces). We used Cox regression to investigate the impact of objective and subjective indicators of the living environment and their potential interaction effect on all-cause mortality in the Brussels Capital Region.
Results: A negative subjective perception of the residential living environment is associated with a higher mortality hazard, even when controlling for socio-demographic parameters. Similarly, also objective indicators of air pollutants and green spaces are related to mortality. When studying the interaction effect, the beneficial effect of a neutral subjective perception stands out. Subjectively satisfied individuals living in the worst objective conditions showed the highest mortality hazard. Noise pollution was the only exception, characterised by a lack of an interaction effect.
Conclusion: This study showed that besides objective indicators, subjective perception of the residential environment also matters and that both interact in influencing life chances. Subjective indicators not only have a genuine independent impact, they also act as an underlying factor in the relationship between objective residential environment and health.
Keywords:
all-cause mortality
; Subjective perception
; Environmental health
; Air pollution
; Green spaces
; Noise pollution
; Resilience
1. Introduction
The link between objective indicators of the living environment and health is well established. Exposure to ambient air pollution is amongst others, significantly associated with an increased incidence of lung cancer in adults [1], disrupted lung development in children [2] and an increased incidence of premature births [3]. Noise pollution has been associated with an increased risk of cardiovascular diseases [4], increased incidence of diabetes [5] and an increased prevalence of isolated systolic hypertension [6]. In contrast, no significant association between long-term exposure to noise pollution and all-cause mortality was found [7]. For green spaces, there is accumulating evidence for a salutogenic effect on self-assessed health [8], a correlation with a lower mortality [9,10] and a beneficial effect on people with chronic heart failure [11].
The mechanisms underlying these associations are complex and partly unknown. According to the literature, subjective perception of the living environment might be crucial to understand the health effects of the living environment. This is shown by theories such as the stress reduction theory and attention restoration theory [12]. Lachowycz et al. (2013) found that the subjective perception of green spaces may modify the observed effect of green spaces on health outcomes [13]. Similarly, Babisch et al. (2013) found that the association between objective noise measurement (near airports) and hypertension was stronger for people who reported being more subjectively annoyed by aircraft noise pollution [14]. The influence of subjective perception could also be interpreted through Lazarus’ (1984) transactional model of coping and stress [15]. Lercher (1996), who further discussed this model, stated that perception or appraisal is a process through which a person evaluates an exposure. If an individual is aware of a stressful exposure this might lead to the adaptation of cognitive, behavioural, and emotional coping mechanisms [16]. A recent study in Kenya for instance found that the mere participation in air quality studies led residents to develop strategies to cope with air pollution in their neighbourhood [17].
Our study will further address this gap in literature, using the Brussels Capital Region (BCR) as a case study. BCR is the largest metropolitan area in Belgium, with clear divisions in environmental exposures and socio-economic variables. The aim of this paper is twofold: i) assess the association between the objective and the subjective perception of the residential (outdoor) living environment (i.e., air and noise pollution and green spaces) and all-cause mortality; and ii) examine if subjective perception modifies the relationship between objective indicators of the living environment and all-cause mortality.
2. Methodology
Data consist of a linkage between the Belgian 2001 census – including detailed information on socio-economic and demographic characteristics and subjective indicators of the residential living environment – and register data on mortality (and emigration) for the follow-up period 1st October 2001 until 31st December 2016. The data was further linked to objective residential environmental indicators using the residential address of each individual at baseline. We included all persons aged 25-79 officially residing in the Brussels Capital Region at baseline (1st October 2001).
Our study focuses on three environmental dimensions: ambient air pollution, noise pollution and green spaces. The objective indicators included estimates of air and noise pollution levels and a green density metric derived from satellite images. Ambient air pollution was measured using the 2005 average annual concentrations (µg/m³) of nitrogen dioxide (NO2) and particulate matter with an aerodynamic diameter of less than 2.5µm (PM2.5) (Belgian Interregional Environment Agency (IRCEL), https://www.irceline.be/nl). Noise pollution was operationalised by combining noise levels from air, road, and railway traffic into one indicator expressed as the 24-hour average [day-evening-night (Lden)] noise level in decibels (dB) (Environment.Brussels, https://environment.brussels/). Surrounding greenness was assessed using the Normalised Difference Vegetation Index (NDVI). The NDVI ranges from 0 to 1, with values closer to 1 indicating greater green density [18]. A more in-depth description of these indicators is available in the study by Rodriguez-Loureiro et al[19].
NO2 concentrations (threshold of 40µg/m³) and noise pollution (53dB Lden threshold) were dichotomised according to the WHO threshold (below/above WHO threshold). For PM2,5 concentrations we used quintiles since all values exceeded the 10µg/m³ annual average WHO-threshold in Belgium. Surrounding greenness was also categorised using quintiles as WHO does not define any thresholds for this variable.
The subjective perception of the living environment was derived from the 2001 Belgian census. For each household, respondents were asked to indicate how they perceived the air quality, noise pollution and surrounding greenness in their neighbourhood on a 3-points Likert scale (satisfied, neutral and not satisfied).
To investigate potential interaction effects between subjective and objective indicators of the living environment on all-cause mortality, we cross-classified both variables. Our reference category consisted of the combination of a satisfied subjective perception with the lowest concentration of air pollutants, the lowest amount of noise pollution and the highest amount of surrounding greenness. All categories contained more than 1,0% of the cases.
We included gender, age, migration background (Belgian and non-Belgian), household living arrangement (couple, single, other), highest educational level (tertiary, secondary, primary) and housing tenure (owners, tenants, other) as control variables. The dependent variable consisted of all-cause mortality during the 15-year follow-up period.
We used Cox proportional hazards regression models to investigate the association between each dimension of the outdoor living environment and all-cause mortality. Similarly, to Bauwelinck et al. (2021), we used age as an underlying time scale. Observations were censored when emigration or end of follow-up occurred. To account for differential baseline hazards by age groups, we included a strata term with a 10-year categorization (e.g., from [25-30[, [30, 40[ until [70, 79].
First, we assessed the association between each objective indicator (one at a time) and all-cause mortality. Second, we assessed the association between each subjective indicator (one at a time) and all-cause mortality. Finally, we used the combined indicator (objective + subjective) for each environmental dimension to assess the association with all-cause mortality. For each model, we specified a basic model M1 (including the exposure indicator and gender) and a fully adjusted model M2 (additionally adjusting for educational level, housing tenure, migrant background and household living arrangement).
3. Results
Table 1 contains a detailed description of the study population at baseline (2001), all-cause mortality during follow-up, and the objective and subjective indicators of the living environment. After excluding individuals with missing values (24,8%) on covariates, our study population consisted of 464,611 individuals aged 25-79 officially residing in the BCR at baseline (2001). During follow-up (2001-2016), 66,832 individuals died and 40,617 emigrated. The study population consisted mostly of women (52.3%), individuals with secondary education (43.4%), originating from Belgium (59.4%) and living with a partner (61.5%).
The median exposure to average annual concentrations of air pollutants was 19.27 µg/m³ (IQR: 0.85) for PM2.5 and 38.94 µg/m3 (IQR: 6.27) for NO2; the daily average exposure to multiple sources of noise pollution was 49.87 dB (IQR: 5.87); residential surrounding greenness within a 300-m buffer was 0.43 (IQR: 0.19).
Overall, individuals seemed to be mostly satisfied with the air and noise pollution levels and with green spaces’ provision in their neighbourhood. Respondents reported more frequently unpleasant levels of noise pollution (35.4%) than of air quality (29.4%) and having poorly equipped green spaces in their neighbourhood (24.3%).
Table 2 shows the results for the associations between the objective indicators and all-cause mortality. In the basic model, all indicators generate HRs in the expected direction with lower levels of air and noise pollution and a higher density of surrounding greenness being associated with lower mortality. Controlling for socio-demographic variables (M2) attenuated the effects, but associations remained significant (e.g., the quintile with the highest PM2.5 concentrations still has an increased mortality hazard of 16% compared with the reference category), except for noise pollution. For surrounding greenness within 300-m of residence, the largest excess mortality was observed for the two quintiles with the lowest residential greenness [1,15% (95%CI: 1.117;1.192) and 1,28% (95%CI: 1.232;1.320)].
The associations between the subjective indicators of the living environment and all-cause mortality are displayed in Table 3. Overall, rating any dimension of the living environment positively or neutral generated lower HR’s. After adjustment for covariates, the difference between rating the environment positively or neutrally disappeared [e.g., for green spaces: normally equipped HR 0.91 (95%CI: 0.885, 0.936), very well-equipped HR 0.91 (95%CI: 0.880, 0.933)]. Rating the noise pollution in the neighbourhood as very pleasant was not significantly associated with decreased risk of all-cause mortality.
Figure 1 presents the potential mediating effect of the subjective perception on the association between the objective residential living environment and mortality (results are fully reported in Table 1, 2 and 3 in the addendum).
|
Abbreviations: Subjective perception: S = Satisfied, N = Neutral and NS = Not satisfied; Objective indicators categorized into quintiles: Q1 = the most “optimal” quintile (i.e., least pollution, most surrounding greenness), … and Q5 = the least “optimal” quintile (i.e., most pollution, least surrounding greenness); Objective indicators categorized based on WHO threshold: Above = value is higher than the threshold value, below = value is lower than the WHO threshold value. Reference group: For each indicator, the reference group is the most “optimal condition” (I.e., a satisfied perception combined with the least pollution or most green space) Source: Belgian 2001 census linked to the mortality register (follow-up 1st October 2001 – 31st December 2016) and environmental exposure data. |
Overall, three general patterns arise. Unexpectedly, individuals who reported being satisfied with their living environment seemed affected by poorer conditions (more air pollution, more noise pollution or less surrounding greenness). The category combining a satisfied subjective perception with the least optimal objective conditions showed the highest HR (e.g., for surrounding greenness an HR of 1.34 [1.24 -1.45] was observed for this category).
Secondly, we found a positive effect (i.e., a decline in mortality hazard) of being normally satisfied (i.e., the neutral option) with air quality, noise pollution and surrounding greenness. Individuals reporting being “very satisfied” or “not satisfied” differ significantly from the reference category when they live in an area in the second or higher quintile in terms of surrounding greenness (S/Q2: HR 1.07 [1.03;1.12]; NS/Q2: HR 1.10 [1.02;1.18]). However, individuals with a neutral subjective perception living in Q2 (HR 1.02 [0.98; 1.07]) or even Q3 (HR 1.03 [0.99; 1.07] do not have a significantly increased mortality hazard in comparison with the reference category.
Thirdly, there does not seem to be an additive effect of reporting poor environmental quality and being exposed to it. For the non-satisfied categories, the results for the objective indicators and composed indicators are rather similar. E.g., for surrounding greenness, a HR of 1.15 [1.12;1.19] was observed for the 4th quintile. For the non-satisfied group of the composed variable, the HR was the same (HR 1. 15 [1.090;1.210]) for this same quintile.
To strengthen our findings, we conducted several sensitivity analyses (See Table 4, 5 and 6 in the addendum). First, we filtered out individuals that moved between 1991 and 2003 and repeated all analyses. The results for this subpopulation were in line with the results observed for the main population.
Secondly, we analysed with the subpopulation that assessed its health as “good” or “very good” in the 2001 census, in order to partially counter the lack of information on individual lifestyle factors (e.g., smoking, physical activity, etc.) that influence all-cause mortality [20]. Analysis for this subpopulation provided unexpected results. The influence of the objective indicators remained unchanged (i.e., more pollution and less surrounding greenness still resulted in a higher mortality hazard), but clear differences were found with respect to the influence of the subjective indicators. In contrast to the main analysis, individuals who were not satisfied with their living environment in terms of noise- and air pollution had significantly lower mortality hazards compared to the reference category (satisfied individuals), which also influenced the results for the composed variables. However, persons with a satisfied perception, residing in the least optimal objective conditions still had the highest mortality hazard.
4. Discussion
The results for the objective indicators align with current literature. Higher concentrations of air pollutants [1,21] and less surrounding greenness [9,10,22,23] were significantly related to higher all-cause mortality hazards [19]. These findings persist when controlling for socio-demographic variables. For noise pollution, we did not find a significant association with all-cause mortality. This result is in line with Tonne et al. (2016). Other studies on noise pollution mainly focus on specific pathologies which we could not verify in our study.
Babisch et al. (2013) found that a negative subjective perception (labelled “annoyance”) added to the risk of hypertension due to aircraft noise exposure [6]. This is a finding we could not replicate for all-cause mortality in our study. We found that mortality hazards obtained for the composed variables for individuals with an unsatisfied (“not satisfied”) perception of their neighbourhood did not differ substantially from the mortality hazards obtained for the objective indicators. In other words, there seemed to be no effect modification for individuals reporting being not satisfied with the quality of their residential living environment.
However, effect modification was noticeable for individuals with a satisfied or neutral perception. Among satisfied individuals, we observed that residing in the least optimal objective conditions (highest concentration of air pollutants or least surrounding greenness) had the highest mortality hazards. Additionally, we noticed a beneficial influence of a neutral perception. Objective categories with higher relative mortality no longer showed a significantly higher HR when combined with a neutral perception. Both of these findings can be explained via coping mechanisms[15,16] and the transactional model of coping and stress[15]. Satisfied individuals living in a poor objective environment, might not realise that the quality of their residential living environment is lacking. Therefore, they might see no reason to adopt coping mechanisms, which could result in the higher mortality hazards we found.
Individuals with a more neutral perception might, in this sense, be more aware of the objective conditions of their living environment and thus adopt coping strategies. This might explain why the relationship between surrounding greenness and all-cause mortality is strongly modified (and even neutralised in the first three quintiles) for individuals with a neutral subjective perception. Our interpretation is in line with the study by Ngo et al. (2017), who found that participants in a study on air pollution in Kenya were more aware of the relationship between air pollution and their health and thus were more actively looking for coping mechanisms [17].
The question then arises why this effect was not observed among individuals who were not satisfied with the quality of their living environment. One could expect that these individuals would adopt coping mechanisms as well and thus have lower mortality hazards than satisfied individuals. We hypothesize that this might be due to a selection effect. Individuals in poor health might, in general, perceive their neighbourhood more negatively because of being mentally (and physically) in bad shape. Au et al. (2014) demonstrated that self-assessed health is most strongly associated with vitality (energetic feeling), limiting mobility (physical functioning) and the presence of bodily pain [24]. These health conditions could in turn also influence the likelihood of an individual adopting coping mechanisms.
Further argumentation for the theory of coping mechanisms and the selection effect can be found in the results of the sensitivity analysis. We noticed that, in the healthy subpopulation, individuals with a neutral or even unsatisfied subjective perception had a lower mortality hazard than those with a satisfied perception. This in turn also influenced the results for the composed variables. We can expect that in a healthy subpopulation, subjectively unsatisfied individuals are more capable of developing and exercising coping strategies. Also, by filtering out individuals in poor health, we partially work around the potential selection effect where an individual’s health influences the perception of the residential living environment. Both interpretations can help to explain the different results obtained for the healthy subpopulation and the main population.
Strengths, Limitations and (Policy) Recommendations
In the discussion above we hypothesized on the influence of a selection effect, where poor health negatively influences subjective perception. Since we do not dispose of longitudinal data, we could not verify causation between both. We partially worked around this limitation by repeating the analysis for a healthy subpopulation. Another option would be to work with aggregated subjective perception instead of individual perception as demonstrated in other studies [25].
Another limitation is the lack of information on individual lifestyle factors. These factors can influence all-cause mortality [26], but also subjective perception [20] (e.g., someone prone to walking could be more sensitive to the quantity of green spaces in his or her neighbourhood). However, we did control for socioeconomic factors which have been shown to be related to these individual lifestyle factors [27]. Additionally, we performed a sensitivity analysis for a healthy subpopulation to partially circumvent this limitation.
We could not account for individuals moving from their residential address during follow-up (in our sensitivity analysis we focussed on individuals who moved before the 2001 census). Also, we did not study the effect of multiple exposures on mortality. To some extent, we might expect some collinearity between the exposure variables (e.g., between green space provision and air quality). But we did not assess what being exposed to, for example, air- and noise pollution meant in comparison with only being exposed to one of these
A strength of our study is related to our exhaustive dataset combined with a long mortality follow-up period. Additionally, exposure data were linked to the residential address and had a high spatial resolution. Finally, we could include both subjective and objective indicators of the residential living environment in our analysis. Studies of this kind are relatively scarce and, to our knowledge, had not yet been conducted in Belgium.
Our study showcases the importance that individual’s subjective perception plays when considering the relationship between the objective parameters of the residential living environment and health. By making individuals more aware of the quality of their living environment, they can develop and exercise coping mechanisms. Public initiatives, backed by policymakers, that directly involve residents in a discussion on the quality of their living environment could therefore have a beneficial effect. In this light, the emergence of more and more examples of public science can also be seen as a positive development.
Supplementary Materials
The following supporting information can be downloaded at the website of this paper posted on Preprints.org. The first three tables in the addendum show the same results as Figure 1 in the main text. However, the precise numerical values are more easily deducible from the tables. The first table in the addendum shows the results (Hazard Ratios and 95% CIs) for the composed variable on air pollution. The second supplementary table shows the results for the composed variable on noise pollution, and the third table in the addendum shows the results for the composed variable on green spaces. Supplementary Tables 4-6 are part of the sensitivity analysis. They show the results for the same indicators (objective indicators, subjective indicators, and composed indicators) under three conditions. The first condition (“Filter 1”) is the same as used in the main text (i.e., individuals aged 25-79, who have no missing values). The second condition (“Filter 2”) includes only individuals with self-reported health as either “good” or “very good.” The final condition builds on condition one but includes only individuals who did not move between 1993 and 2001.
Contributor statement (following the CReDiT framework)
JG: Conceptualization, Methodology, Formal analysis, Data Curation, Writing – Original draft, Visualization, Project administration.
LRL
Conceptualization: Methodology, Data curation, Resources, Writing – Review & Editing, Supervision, Project administration SG: Conceptualization, Methodology, Writing – Review & Editing, supervision, Project administration, Funding acquisition.
Funding
The Interface Demography (now BRISPO) research group (department of Sociology, Vrije Universiteit Brussel) funded this paper. Our research was conducted as part of a master’s thesis; therefore, there is no specific grant/award number.
Ethical approval and consent to participate
Ethical Committee approval for this study is not deemed necessary, since (1) This study was performed within the legal framework of the Belgian Cancer Registry (BCR). Based on the Coordinated Law of 10 May 2015 (art. 138), BCR has a legal task to collect data on cancer, subject it to quality control, process and analyze it, encrypt and store it, report on it, make it accessible for research and protect it; and (2) This retrospective study does not fall under the Belgian Law of 7 May 2004 regarding experiments on human persons (art. 3,§2). The data controller shall be exempt from the obligation to disclose information to the persons whose data are processed where notification to the data subject is impossible or takes disproportionate effort; in particular when data are processed for statistical purposes or for historical or scientific research (cfr. Art. 14.5, b. GDPR EU 2016/67). Additionally, consent prior to publication is unnecessary since only aggregated data and/or results are shown in this manuscript.
Availability of data and materials
Due to privacy concerns, data used for this current study can not be made publicly available.
Acknowledgments
we would like to acknowledge Mariska Bauwelinck for linking the data sources and preparing the data about the environmental exposures.
Competing Interests
There are no competing interests for any author.
References
- F. Laden, J. Schwartz, F. E. Speizer, and D. W. Dockery, “Reduction in fine particulate air pollution and mortality: Extended follow-up of the Harvard Six Cities Study,” Am. J. Respir. Crit. Care Med., vol. 173, no. 6, pp. 667–672, 2006. [CrossRef]
- W. J. Gauderman et al., “The Effect of Air Pollution on Lung Development from 10 to 18 Years of Age,” N. Engl. J. Med., 2004. [CrossRef]
- J. Wu, C. Ren, R. J. Delfino, J. Chung, M. Wilhelm, and B. Ritz, “Association between local traffic-generated air pollution and preeclampsia and preterm delivery in the South Coast Air Basin of california,” Environ. Health Perspect., vol. 117, no. 11, pp. 1773–1779, 2009. [CrossRef]
- W. Passchier-Vermeer and W. F. Passchier, “Noise exposure and public health,” Environ. Health Perspect., vol. 108, no. SUPPL. 1, pp. 123–131, 2000. [CrossRef]
- I. C. Eze et al., “Long-term exposure to transportation noise and air pollution in relation to incident diabetes in the SAPALDIA study,” Int. J. Epidemiol., vol. 46, no. 4, pp. 1115–1125, 2017. [CrossRef]
- W. Babisch, K. Wolf, M. Petz, J. Heinrich, J. Cyrys, and A. Peters, “Associations between traffic noise, particulate air pollution, hypertension, and isolated systolic hypertension in adults: The KORA study,” Environ. Health Perspect., vol. 122, no. 5, pp. 492–498, 2014. [CrossRef]
- C. Tonne et al., “Long-term traffic air and noise pollution in relation to mortality and hospital readmission among myocardial infarction survivors,” Int. J. Hyg. Environ. Health, vol. 219, no. 1, pp. 72–78, 2016. [CrossRef]
- D. E. Bowler, L. M. Buyung-Ali, T. M. Knight, and A. S. Pullin, “A systematic review of evidence for the added benefits to health of exposure to natural environments,” BMC Public Health, vol. 10, 2010. [CrossRef]
- M. Bauwelinck et al., “Residing in urban areas with higher green space is associated with lower mortality risk: A census-based cohort study with ten years of follow-up,” Environ. Int., vol. 148, p. 106365, 2021. [CrossRef]
- M. Gascon et al., “Residential green spaces and mortality: A systematic review,” Environ. Int., vol. 86, pp. 60–67, 2016. [CrossRef]
- G. Mao et al., “The salutary influence of forest bathing on elderly patients with chronic heart failure,” Int. J. Environ. Res. Public Health, 2017. [CrossRef]
- R. Berto, “The role of nature in coping with psycho-physiological stress: A literature review on restorativeness,” Behavioral Sciences. 2014. [CrossRef]
- K. Lachowycz and A. P. Jones, “Towards A Better Understanding Of The Relationship Between Greenspace And Health: Development Of A Theoretical Framework,” Landsc. Urban Plan., vol. 118, pp. 62–69, 2013. [CrossRef]
- W. Babisch et al., “Noise annoyance - A modifier of the association between noise level and cardiovascular health?,” Sci. Total Environ., vol. 452–453, pp. 50–57, 2013. [CrossRef]
- S. R. Lazarus and S. Folkman, Stress, Appraisal, and Coping, 1st ed. New York: Springer International Publishing, 1984.
- P. Lercher, “Environmental noise and health: An integrated research perspective,” Environ. Int., vol. 22, no. 1, pp. 117–129, 1996. [CrossRef]
- N. S. Ngo, S. Kokoyo, and J. Klopp, “Why participation matters for air quality studies: risk perceptions, understandings of air pollution and mobilization in a poor neighborhood in Nairobi, Kenya,” Public Health, vol. 142, no. August, pp. 177–185, 2017. [CrossRef]
- J. Weier and D. Herring, “Measuring Vegetation (NDVI & EVI) Normalized Difference Vegetation Index (NDVI),” NASA, Earth Observatory, 2000. .
- L. Rodriguez-Loureiro et al., “Social inequalities in the associations between urban green spaces, self-perceived health and mortality in Brussels: Results from a census-based cohort study,” Heal. Place, vol. 70, no. September 2020, p. 102603, 2021. [CrossRef]
- B. Jacquemin et al., “Annoyance due to air pollution in Europe,” Int. J. Epidemiol., vol. 36, no. 4, pp. 809–820, 2007. [CrossRef]
- P. J. Landrigan et al., “The Lancet Commission on pollution and health,” Lancet, vol. 391, no. 10119, pp. 462–512, 2018. [CrossRef]
- H. Frumkin et al., “Nature contact and human health: A research agenda,” Environ. Health Perspect., vol. 125, no. 7, pp. 1–18, 2017. [CrossRef]
- D. Rojas-Rueda, M. J. Nieuwenhuijsen, M. Gascon, D. Perez-Leon, and P. Mudu, “Green spaces and mortality: a systematic review and meta-analysis of cohort studies,” Lancet Planet. Heal., vol. 3, no. 11, pp. e469–e477, 2019. [CrossRef]
- N. Au and D. W. Johnston, “Self-assessed health: What does it mean and what does it hide?,” Soc. Sci. Med., vol. 121, pp. 21–28, 2014. [CrossRef]
- K. De Jong et al., “Area-aggregated assessments of perceived environmental attributes may overcome single-source bias in studies of green environments and health: Results from a cross-sectional survey in southern Sweden,” Environ. Heal. A Glob. Access Sci. Source, vol. 10, no. 1, pp. 1–11, 2011. [CrossRef]
- R. M. Van Dam, T. Li, D. Spiegelman, O. H. Franco, and F. B. Hu, “Combined impact of lifestyle factors on mortality: Prospective cohort study in US women,” Bmj, vol. 337, no. 7672, pp. 742–745, 2008. [CrossRef]
- J. T. Lynch, J. W.; Kaplan, G. A.; Salonen, “Why do poor people behave poorly? Variation in adult health behaviours and psychosocial characteristics by stages of the socioeconomic lifecourse,” Soc. Sci. Med., vol. 44, no. 6, pp. 809–819, 1997. [CrossRef]
Figure 1.
Hazard ratios (HR) of all-cause mortality and 95% confidence intervals (95% CI) for the composed variables of the residential living environment, BCR, 2001-2016.
Figure 1.
Hazard ratios (HR) of all-cause mortality and 95% confidence intervals (95% CI) for the composed variables of the residential living environment, BCR, 2001-2016.
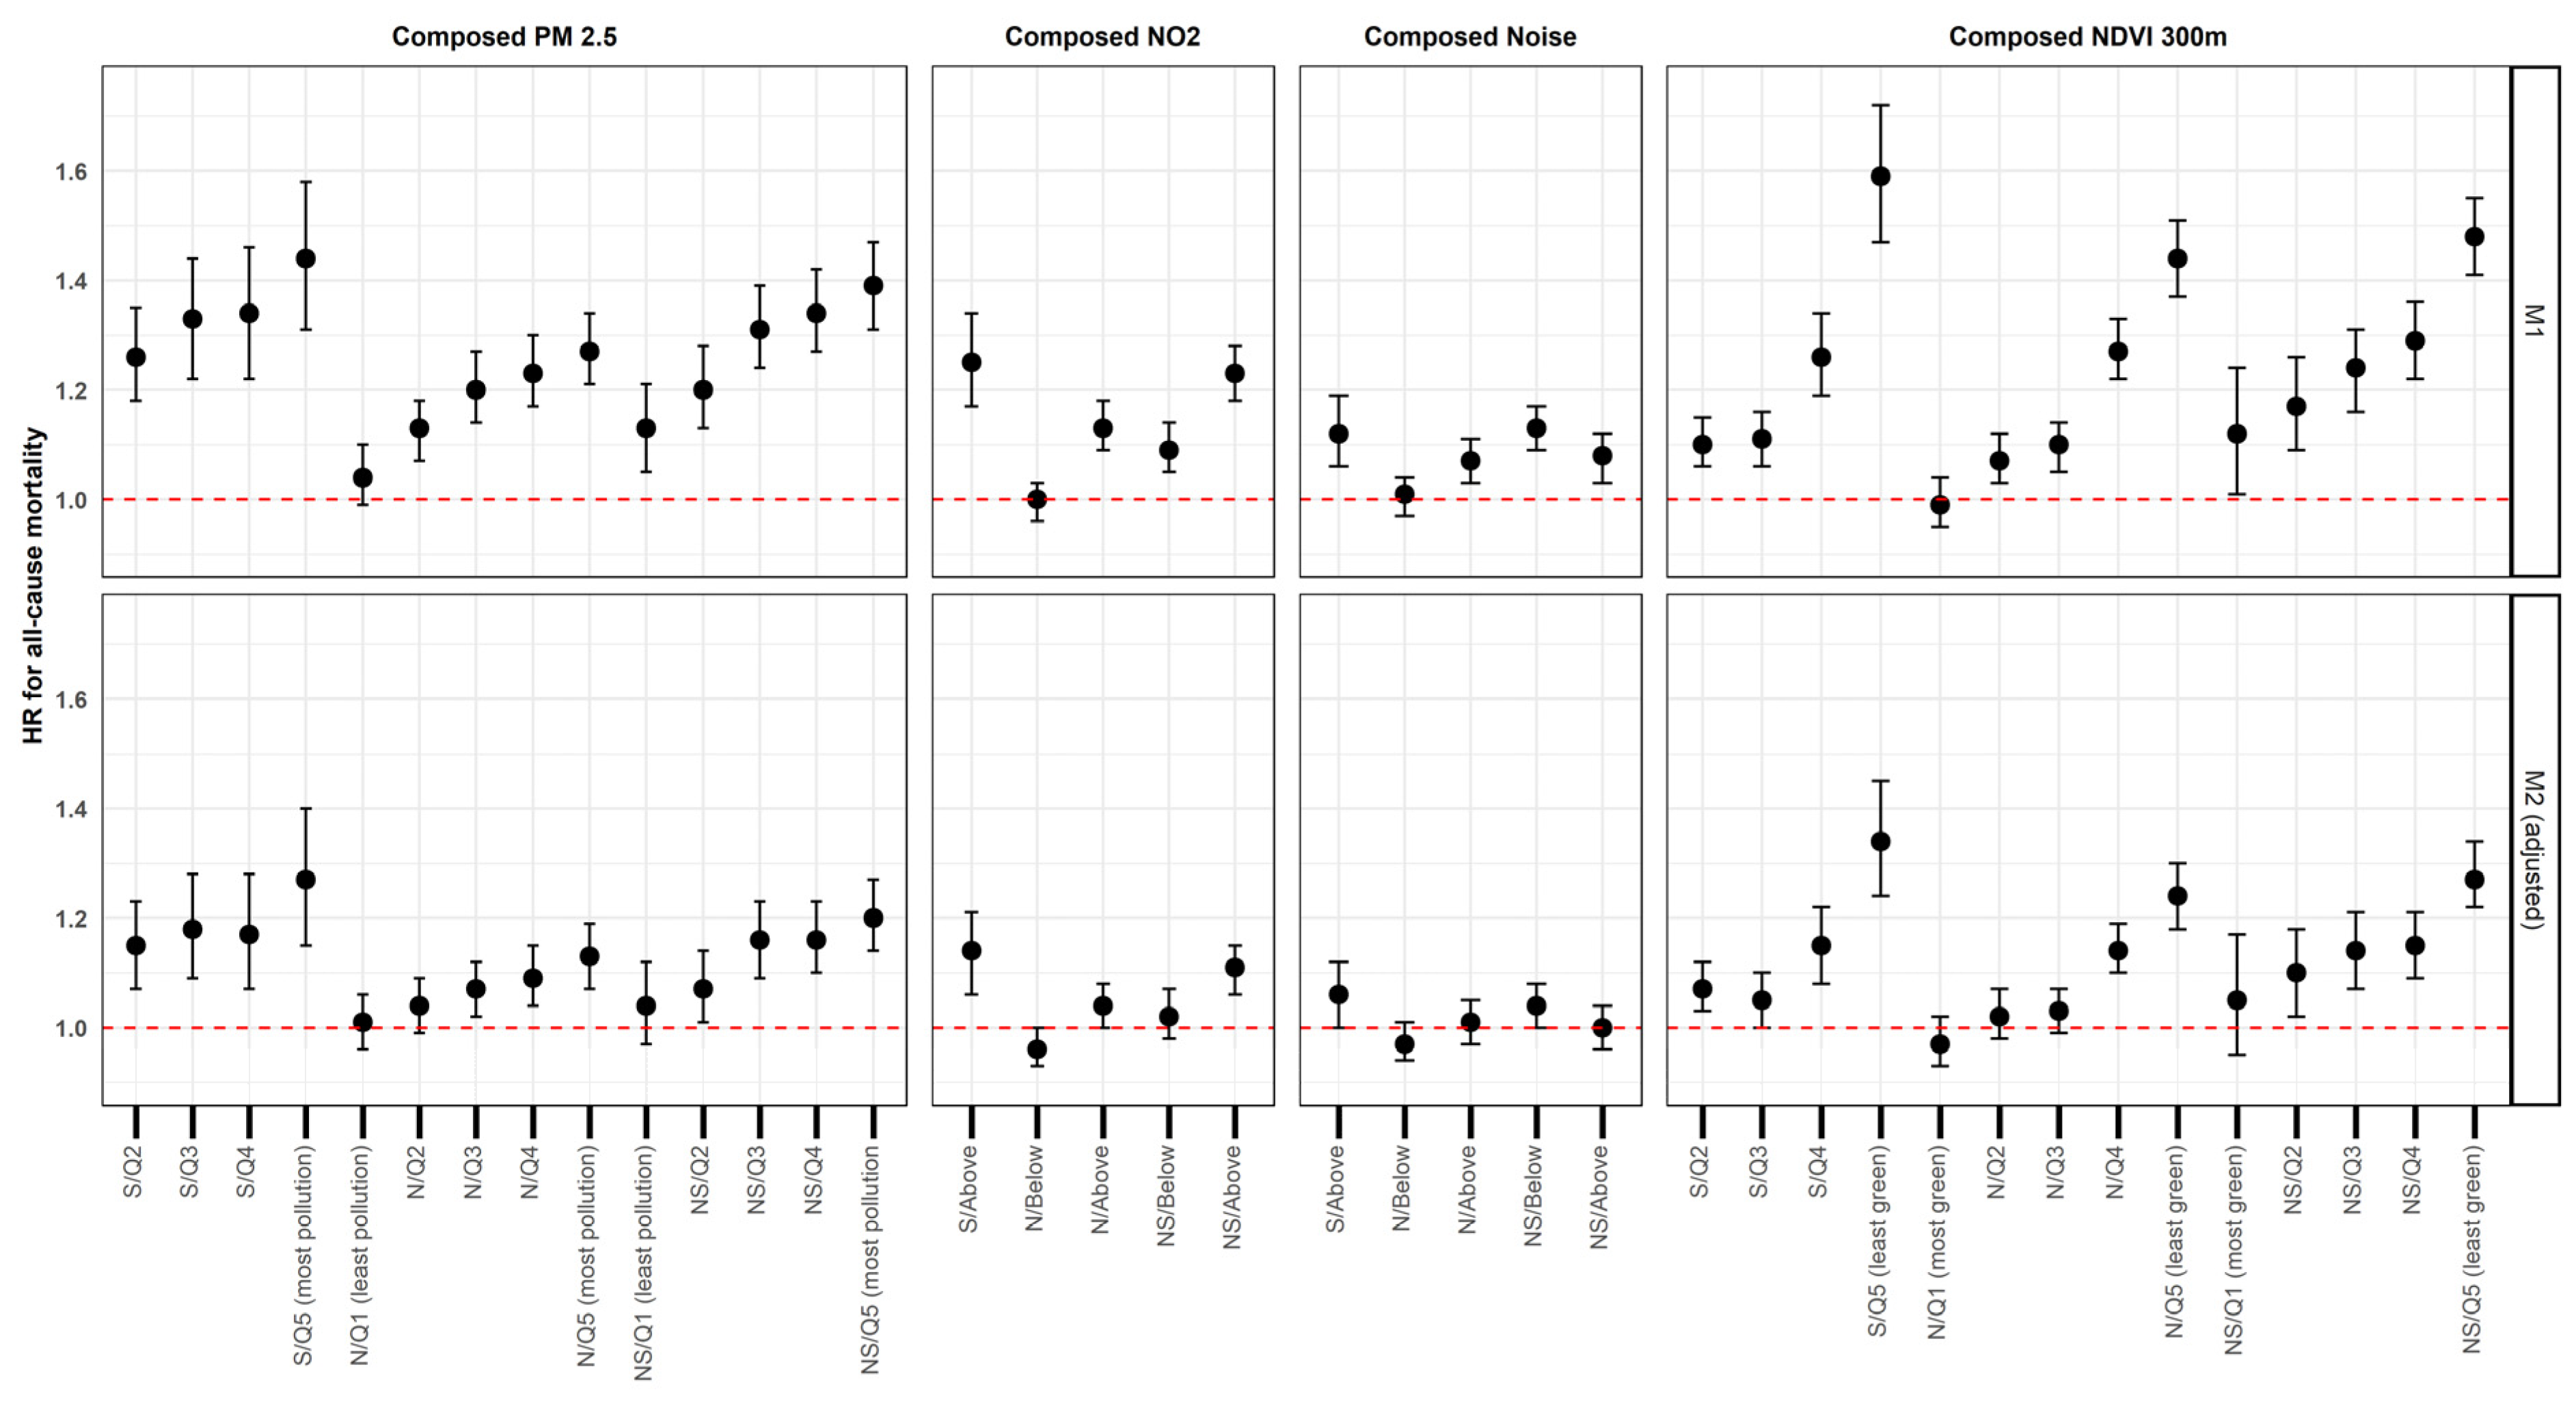

Table 1.
Socio-demographic characteristics of the population at baseline (2001), objective and subjective characteristics of the residential living environment and all-cause mortality (2001-2016).
Table 1.
Socio-demographic characteristics of the population at baseline (2001), objective and subjective characteristics of the residential living environment and all-cause mortality (2001-2016).
| Socio-demographic variable | Frequency | Percentage |
|---|---|---|
| Gender | ||
| Female | 242,953 | 52.3% |
| Male | 221,658 | 47,7% |
| Deaths from all causes during follow-up period 2001-2016, n (%) | ||
| Died | 66,832 | 14.4% |
| Emigration during follow-up period 2001-2016, n (%) | ||
| Emigrated | 40,617 | 8.7% |
| Highest educational attainment | ||
| Higher education | 173,778 | 37.4% |
| Secondary education | 201,536 | 43.4% |
| Primary education or less | 89,297 | 19.2% |
| Housing tenure | ||
| Owner | 224,712 | 48.4% |
| Tenant | 227,115 | 48.9% |
| Other | 12,784 | 2.8% |
| Household living arrangement | ||
| Couple | 285,719 | 61.5% |
| Single | 172,234 | 37.1% |
| Other | 6,658 | 1.4% |
| Migration background | ||
| Other | 188,743 | 40.6% |
| Belgium | 275,868 | 59.4% |
| Subjective perception variables | Frequency | Percentage |
| Air quality | ||
| Not pleasant | 136,596 | 29.4% |
| Satisfactory | 266,953 | 57.5% |
| Very pleasant | 61,062 | 13.1% |
| Noise pollution | ||
| Not pleasant | 164,525 | 35.4% |
| Satisfactory | 224,699 | 48.4% |
| Very pleasant | 75,387 | 16.2% |
| Green spaces | ||
| Poorly equipped | 113,030 | 24.3% |
| Normally equipped | 191,770 | 41.3% |
| Very well equipped | 159,811 | 34.4% |
| Objective variables | Median | Q1-Q3 |
| PM2.5 (µg/m³) annual average concentration, median (IQR) | 19.27 | 18.95 – 19.70 |
| NO2 (µg/m³) annual average concentration, median (IQR) | 38.94 | 35.45 – 41.72 |
| Daily average noise levels, multiple sources, Lden (dB) | 49.87 | 47.05 – 52.92 |
| Surrounding greenness: NDVI 300m | 0.43 | 0.34 – 0.53 |
Source: Belgian 2001 census linked to the mortality register (follow-up 1st October 2001 – 31st December 2016) and environmental exposure data.
Table 2.
Hazard ratios (HR) of all-cause mortality and 95% confidence intervals (95% CI) for the objective indicators of the residential living environment, BCR, 2001-2016.
Table 2.
Hazard ratios (HR) of all-cause mortality and 95% confidence intervals (95% CI) for the objective indicators of the residential living environment, BCR, 2001-2016.
| Variable | Description | Frequency (relative) | M1 HR (95%CI) |
M2 HR (95%CI) |
|
|---|---|---|---|---|---|
| Air pollution: PM2.5 (µg/m³) annual average concentration1 | Q1 (Least exposed) | 92913 | 1.00 (ref.) | 1.00 (ref.) | |
| Q2 | 92830 | 1.12** [1.08;1.15] | 1.05** [1.02;1.09] | ||
| Q3 | 92990 | 1.20** [1.16;1.23] | 1.09** [1.06;1.13] | ||
| Q4 | 92952 | 1.23** [1.19;1.27] | 1.11** [1.08;1.15] | ||
| Q5 (Most exposed) | 92926 | 1.28** [1.24;1.32] | 1.16** 1.12;1.20] | ||
| Air pollution: NO2 (µg/m³) annual average concentration | Below WHO guideline (40 µg/m³) | 282079 | 1.00 (ref.) | 1.00 (ref.) | |
| Above WHO guideline | 182532 | 1.16** [1.13;1.18] | 1.09** [1.07;1.12] | ||
| Noise pollution : Multi sources Lden (dB) | Below WHO guideline (53 dB) | 350690 | 1.00 (ref.) | 1.00 (ref.) | |
| Above WHO guideline | 113921 | 1.04** [1.01;1.06] | 1.01 [0.99;1.04] | ||
| Surrounding greenness: NDVI 300m2 | Most surrounding greenness (Q1) | 92920 | 1.00 (ref.) | 1.00 (ref.) | |
| Q2 | 92896 | 1.09** [1.06;1.12] | 1.06** [1.03;1.09] | ||
| Q3 | 92952 | 1.12** [1.09;1.15] | 1.06** [1.03;1.09] | ||
| Q4 | 92943 | 1.27** [1.23;1.31] | 1.15** [1.12;1.19] | ||
| Least surrounding greenness (Q5) | 92900 | 1.47** [1.42;1.52] | 1.28** [1.23;1.32] | ||
|
1PM2.5 annual average concentration (µg/m³) quintiles : Quintile 1 : [Min ;18.74], quintile 2 : ]18.74 ;19.10], quintile 3 : ]19.10 ;19.42], quintile 4 : ]19.42 ;19.82] and quintile 5 : ]19.82, Max] 2NDVI 300m surrounding greenness quintiles : Quintile 1 : [Max;0.56[, quintile 2 : [0.56;0.46[, quintile 3 : [0.46;0.39[, quintile 4 : [0.39;0.31[, quintile 5 : [0.31; Min] *Significance p<0.05. **Significance p<0.01. Results from Cox PH regression models using age as the underlying timescale for the follow-up period 2001-2016. M1 adjusted by gender, M2=M1 + migrant background, educational level, housing tenure and household living arrangement. | |||||
Source: Belgian 2001 census linked to the mortality register (follow-up 1st October 2001 – 31st December 2016) and exposure data.
Table 3.
Hazard ratios (HR) of all-cause mortality and 95% confidence intervals (95% CI) for the subjective perception of the residential living environment, BCR, 2001-2016.
Table 3.
Hazard ratios (HR) of all-cause mortality and 95% confidence intervals (95% CI) for the subjective perception of the residential living environment, BCR, 2001-2016.
| Variable | Description | M1 HR (95% CI) |
M2 HR (95% CI) |
|---|---|---|---|
| Perception: Air quality | Very pleasant | 1.00 (ref.) | 1.00 (ref.) |
| Satisfactory | 1.00 [0.97;1.03] | 0.97* [0.94;0.99] | |
| Not pleasant | 1.11** [1.08;1.15] | 1.04* [1.01;1.07] | |
| Perception: Noise pollution | Very pleasant | 1.00 (ref.) | 1.00 (ref.) |
| Satisfactory | 0.99 [0.97;1.02] | 0.97* [0.94;1.00] | |
| Not pleasant | 1.08** [1.05;1.11] | 1.01 [0.98;1.04] | |
| Perception: Green spaces | Very well equipped | 1.00 (ref.) | 1.00 (ref.) |
| Well equipped | 1.04** [1.02;1.07] | 1.01 [0.98;1.03] | |
| Poorly equipped | 1.20** [1.17;1.24] | 1.10** [1.07;1.14] | |
| *Significance p<0.05. **Significance p<0.01. Results from Cox PH regression models using age as the underlying timescale for the follow-up period 2001-2016. M1 adjusted by gender, M2=M1 + migrant background, educational level, housing tenure and household living arrangement. | |||
Source: Belgian 2001 census linked to the mortality register (follow-up 1st October 2001 – 31st December 2016) and exposure data.
Disclaimer/Publisher’s Note: The statements, opinions and data contained in all publications are solely those of the individual author(s) and contributor(s) and not of MDPI and/or the editor(s). MDPI and/or the editor(s) disclaim responsibility for any injury to people or property resulting from any ideas, methods, instructions or products referred to in the content. |
© 2024 by the authors. Licensee MDPI, Basel, Switzerland. This article is an open access article distributed under the terms and conditions of the Creative Commons Attribution (CC BY) license (http://creativecommons.org/licenses/by/4.0/).
Copyright: This open access article is published under a Creative Commons CC BY 4.0 license, which permit the free download, distribution, and reuse, provided that the author and preprint are cited in any reuse.


