
Submitted:
31 October 2025
Posted:
04 November 2025
You are already at the latest version
Abstract
The Eastern Mediterranean is a rapidly warming climate-change hotspot where heat and air pollution increasingly interact to affect human health. This study quantifies the mortality burden attributed to the synergistic effects of thermal stress and air pollution in Thessaloniki, Greece. Daily mortality data (2001–2019) were analyzed together with pollutant concentrations (PM10, NO₂, O₃) and the modified Physiologically Equivalent Temperature (mPET) using a hierarchical Generalized Additive Model with Distributed Lag Non-Linear terms to capture combined, lagged, and age-specific responses. A re-fined, count-independent definition of the Attributable Fraction (AF) was introduced to improve stability in small strata. Results show that heat and pollution act synergistically, explaining on average 20–30% of daily mortality during severe co-occurrence events. Seniors were most affected during hot, polluted summers (AF ≈ 27%), while adults showed higher burdens during cold, polluted winters (AF ≈ 30%). Intra-urban analyses revealed stronger compound effects in the western, more industrial districts, reflecting combined environmental and socioeconomic vulnerability. The findings demonstrate that temperature extremes amplify pollution-related mortality and underline the need to integrate air-quality and bioclimatic indicators into early-warning and adaptation systems in Eastern Mediterranean cities.
Keywords:
air pollution
; thermal bioclimate
; climate change
; human health
; statistical modeling
1. Introduction
The Mediterranean basin, and particularly Southeastern Europe, is widely recognized as climate change hot-spots, experiencing warming rates nearly twice the global average and a rapid increase in heat extremes [1,2,3,4]. In Greece, projections estimate a mean summer temperature rise exceeding 4 °C by the end of the 21st century under high-emission scenarios [5]. This trend is coupled with a twelve-fold increase in the frequency of heatwave days in Thessaloniki [6], posing escalating risks to human health and urban resilience.
Heat-related health impacts are not solely driven by climatic factors but are increasingly shaped by demographic change. In Greece and other countries of the area, population ageing is accelerating and substantially amplifies environmental health risks. A recent study using hourly thermo-physiological data from Athens demonstrated that seniors experienced up to 18 more days per year with strong heat stress between 1991 and 2020, compared to earlier decades [7]. Importantly, in many urban districts, more than 60% of the increase in heat-stress exposure among older adults was attributed to demographic change, rather than climate alone. This underscores the need to consider population vulnerability dynamics when assessing environmental risk.
At the same time, exposure to air pollution remains one of the leading public health threats in Greece [8]. According to recent estimates, up to 13,000 premature deaths annually, approximately 10% of national mortality, may be attributable to PM2.5 and ozone exposure [9]. While national air quality levels are projected to modestly improve under mitigation scenarios, excess mortality is expected to rise due to ageing and urban demographic trends. Central Macedonia, the administrative region encompassing Thessaloniki, is consistently among the highest-burden regions. Studies have shown that in Thessaloniki, a 1 °C rise above 22 °C is associated with a 1.95% increase in all-cause mortality [10], while a 10 µg/m3 increase in PM10 and O3 corresponds to 2.3% and 3.9% increases in mortality, respectively [11].
Despite mounting evidence linking heat and air pollution to health outcomes, most studies assess these exposures in isolation [12,13,14]. However, the synergistic co-occurrence of thermal stress and poor air quality is increasingly recognized as a non-linear amplifier of health risk [15,16,17]. The modified Physiologically Equivalent Temperature (mPET) index offers a thermo-physiologically consistent framework that better reflects the human body’s response to environmental stressors than air temperature alone [18,19,20]. Recent applications of mPET across demographic groups in Athens demonstrated its utility in quantifying demographic heat vulnerability trends, supporting both its scientific robustness and policy relevance [7], while its application in epidemiological studies has yielded more physiologically consistent and location-specific assessments of heat-related health risks, particularly when used in conjunction with hierarchical modeling frameworks [21].
To address the compounding public health threat posed by thermal stress and air pollution in Mediterranean cities, this study focuses on quantifying their synergistic impact on mortality in Thessaloniki, Greece. Building on our previous work [22], we introduce a refined, physiologically consistent framework that integrates mPET with a hierarchical Generalized Additive Model (GAM) and Distributed Lag Non-Linear Models (DLNMs) [23], tailored to capture seasonal, demographic, and intra-urban differences.
A key innovation of this study lies in its application of an extended definition of Attributable Fraction (AF) [24]: one that does not rely on observed daily mortality counts, but instead uses a counterfactual baseline derived from the model predictions under optimal exposure conditions. This approach provides greater robustness in the presence of low or zero mortality counts, which are common in stratified data, and allows for clearer spatial and seasonal attribution. By integrating mPET and pollutant concentrations (PM10, NO2, and O3) within a synergy-aware AF framework, we are able to identify critical exposure combinations and high-risk population segments.
Ultimately, the goal is to produce policy-relevant, spatially disaggregated estimates of mortality burden, highlighting when and where risk converges across environmental and demographic dimensions. This approach provides a scalable foundation for climate-health early warning systems and evidence-based adaptation planning, particularly in ageing and environmentally burdened urban areas.
2. Materials and Methods
2.1. Study Area
Thessaloniki Urban Area (TUA), which consists of six municipalities (Thessaloniki, Kalamaria, Neapoli-Sykies, Pavlos Melas, Ampelokipoi-Menemeni, and Kordelio-Evosmos) is the focus of our study. Between 2001 and 2021, the city has undergone a demographic shift toward an older population, with a 5% decline in the general population and a 45% rise in residents over 65 years old (Figures S2 and S3), reflecting the broader national trend [25,26]. In recent years, the city has been increasingly affected by rising temperatures due to climate change, which exacerbates human health risks [27], and -when combined with the poor air quality of the city [28,29,30]- it contributes to increased mortality, particularly under conditions of extreme heat stress and elevated pollution levels [22].
2.2. Mortality, Air Quality and Human Bioclimate Data
The mortality data used here were obtained by the Hellenic Statistical Authority. They span the period 2001–2019 (19 years) and include daily counts of deaths due to all-natural causes at municipality level in TUA. The data were stratified by sex (male; female) and age (adults < 65 years old; seniors ≥ 65 years old). In total, 134,003 deaths are included in the analysis, of which ~ 78% (105,420) correspond to seniors, and ~ 14% (19,253) correspond to adults.
Hourly values of PM10, O3, and NO2 concentrations (μg/m3) for the period 2001-2019 were obtained from three air quality monitoring stations, operated by the Ministry of the Environment and Energy. For the analysis, the daily average PM10 and NO2 values, and the daily mean 8-hour moving average for O3 over all stations were used.
The human-biometeorological data used in the present study were obtained from the publicly available dataset of [31], which contains hourly values of population-weighted mPET index, computed using the RayMan Pro model [32,33], for diverse populations in Greece, spanning the period from 1991 to 2020. mPET offers a physiologically relevant estimation of heat stress by considering all factors influencing the human thermal environment. It is calculated using a semi-steady human energy balance model, which accounts for variations in anthropometric data, activity levels, and clothing across different population groups [19,20]. For this study, we used the daily mean mPET values between 2001 and 2019 for the two targeted population classes (female and male seniors, female and male adults), following the methodology of [21].
Traditionally, the thermal stress classification based on mPET is based on a nine-category assessment scale, spanning from extreme cold stress to extreme heat stress. Here, to enhance the clarity and interpretability of our results, we combined some of the mPET categories per season, as outlined in Table 1.
2.3. GAM modeling Framework
In this study, we employed the statistical framework of penalized GAMs [34,35], which provides a flexible approach to modeling the heat-health nexus by accounting for non-linearity and lagged relationships, while objectively penalising for over-fitting. This method allows for the exploration of complex interactions between exposures, such as heat and air quality [36], while also capturing variations across different districts and population subgroups [23]. The hierarchical structure of the GAM framework is particularly useful for overcoming challenges related to small population sizes and low death counts in the examined regions [21]. The model was implemented in R using the mgcv package [35], with restricted maximum likelihood (REML) estimation to prevent overfitting [34]. REML enables approximate Bayesian inference, allowing us to produce uncertainty intervals for each estimated quantity [37].
For each season s (cold/warm), region r (CE, N, W) and pollutant P (PM10, O3, NO2) a different model is implemented. The model is defined mathematically as follows:
where is the mortality count for each the daily time step t and age group g (adults, seniors). Then, y(t) is a year counter and DoW(t) is the day-of-week. Morevoer, h() is a smooth function of mPET, pollutant and temporal lag. This is the term that allows for the synergistic effect of the two exposures across different temporal lags. This term is common to both age groups, whereas the function hg() is a “deviation” from h() for each group. This “main effect plus deviation” structure allows for pooling of risk information across the two age-groups, while still estimating a different risk profile for each. The term βDoW(t) captures the day-of-the-week effect in the reporting of mortality (weekends are slightly negatively biased).
Moreover, fy(t),g(t) is a smooth function of day, and there is one of these for each year and age-group. This term picks up the temporal day-to-day variability of mortality. Lastly, the term fg(y(t)) is a smooth function of the yearly time step for each group, which captures the long term trend in mortality (such as changes in population).
2.4. Attributable Fraction
The term exp(α) relates to the overall mean mortality (for the specific region and season), since all terms in equation (2) are centred on zero (they average to zero over the observed data). As such, the term
can be interpreted as the Relative Risk from mPET and pollutant at lag l, for the given age-group g. The cumulative risk
is an aggregated risk measure that integrates the RR across the temporal lags. Then, the exposure values of mPET and the pollutant P that minimise the CR, can be thought of as the “optimal” mPET and P [38] defined here as T(O) and P(O), on the basis that any other exposure value will lead to an increase in risk. Then, the RR can be expressed relative to these optimal exposures rather than the mean mortality [23].
The (forward) AF [24] is a quantity that measures the proportion of mortality that can be attributed to non-optimal conditions. Specifically, for any given day t in the observed time series (with observed exposure values mPETt and Pt), the AF is defined as:
This quantity, constrained between 0 and 1 (by definition of the optimum mPETt and Pt) is interpreted as the fraction of deaths that are attributed to non-optimal mPETt and Pt on a given day t. An overall measure of the AF across the observed time series is then defined as
where is the mean number of deaths in the time interval [t,t+L] and is the total number of deaths in the time series. In essence, for any day t, the attributable number of deaths is computed, then summed and scaled by the total number of deaths [24]. Despite its wide application, this quantity () is subject to sampling variability in the mortality counts. With low or zero death counts, the AF can be unstable as noise is introduced from the observed counts. Here, we alternatively define AF as
This is the mean attributable fraction across the observed time series. It is a more robust metric, especially for low mortality counts and one that gives results that are comparable to . To evidence this claim, we present a comparison between and using an open-source data set in the Appendix.
3. Results
3.1. Observations on Population Dynamics, Mortality Trends, and Statistical Confidence
Census data from 2001 and 2021 reveal a steady population decline of -5% in Thessaloniki Urban Area (Figure S1). However, despite the overall decline, the proportion of elderly residents has consistently increased by more than 45% (Figure S2). This demographic shift implies a growing vulnerability in the population, as older individuals are more susceptible to environmental and health-related stressors. This trend underscores the importance of accounting for age-related vulnerability when assessing mortality risks associated with air pollution and thermal stress.
From 2001 to 2019, the total number of deaths -aggregated across both warm and cold months- shows a clear upward trend (Figure S3). This increase further supports the notion of an increasingly vulnerable population and a growing public health burden. Consistently across all years, mortality during the cold season (70,031 across all years) exceeds that of the warm season (63,972), likely due to seasonal contributors such as respiratory infections, cardiovascular strain, and reduced indoor air quality. However, since approximately 2015, the gap between cold- and warm-season mortality appears to be narrowing. This may suggest rising exposure to heat-related health risks, including heatwaves and chronic disease exacerbation, potentially amplified by climate change.
95% confidence intervals and mortality risk significance for PM10 are displayed in Figure 1 (and Figures S4 and S5 for NO2 and O3, respectively). Seniors exhibit consistently higher confidence in RR estimates than adults. This can be attributed to both a higher absolute number of deaths in this age group and their increased physiological vulnerability to environmental stressors, which may strengthen the observed statistical associations. Across all three pollutants, the warm season is generally associated with greater risk than the cold season, particularly in seniors. Notably, regardless of age group, regions marked as “risky” (in red) are associated with 95% confidence, reinforcing the reliability of findings when significant associations are observed.
In contrast, adult-specific estimates during the cold season appear less robust, as reflected in the broader or weaker confidence intervals. Interestingly, grey areas indicating non-significant results (outside the 95% CI) are nearly absent in adult cold-season maps across all three pollutants. This may reflect the delayed physiological impact of cold exposure, which often extends over 2–3 weeks, whereas the analytical lags used here were shorter (7 days for PM10 and NO2, 9 days for O3). Furthermore, air pollution often exerts cumulative effects, possibly muting short-term associations. In seniors, however, the link between mortality and environmental risks remains strong enough to reach statistical significance even during the cold season, again underlining their heightened vulnerability.
3.2. Seasonal and Age-Specific Patterns of Attributable Mortality Fractions
The way we depict AF graphs (Figure 2 and Figure 3) provides a clear and informative visualization of combined effects of exposure to air pollution and thermal stress on mortality. The seasonal split is necessary, as the impacts of thermal stress and pollution vary significantly across warm and cold months. Age-stratified analysis reveals significant differences in vulnerability between adults and seniors.
PM10: The analysis reveals that both PM10 concentration levels and thermal stress significantly influence mortality, with notable differences across seasons and age groups. In the cold season, adults exhibit consistently high AFs across all PM10 levels, ranging 21.9% – 31.7%, with cold and warm thermal stress contributing substantially. Seniors, although displaying lower AFs overall in winter, show increasing vulnerability as PM10 levels rise, particularly under cold conditions (21.1%). In contrast, during the warm season, AFs increase markedly with PM10, especially among seniors, where hot conditions become the dominant contributor under high pollution (26.9%). Adults also exhibit rising AFs in warmer months, though to a lesser extent, with cool conditions playing a major role at lower PM10 levels (22.7% – 26.4%).
NO2: During the cold season, adults show consistently elevated AFs across all NO2 levels, with cold stress contributing most substantially (23.2% at Low level), followed by cool and comfortable conditions. Interestingly, warm stress also plays a non-negligible role, especially under high NO2 levels at almost 14%. In contrast, seniors exhibit lower overall AFs in winter, yet their vulnerability increases with rising NO2 levels, particularly under cold conditions, where the attributable fraction becomes predominant. During the warm season, mortality risk rises markedly with NO2 exposure, especially among seniors, where hot thermal stress dominates under high pollution, accounting for nearly one-third (29.4%) of the AF. Adults also exhibit increasing AFs with rising NO2 levels in summer (≈12% – 20%), though the distribution is more balanced, with contributions from hot, warm, and even cool conditions.
O3: Ozone-related mortality also exhibits distinct seasonal and age-dependent patterns. During the cold season, seniors face a substantially higher mortality burden compared to adults (at High level, 37.3% Cold stress for seniors compared to 29.4% for adults), with AFs rising consistently with O3 levels. Cold thermal stress is the dominant contributor among seniors (between 21% - 37%), reflecting their heightened vulnerability to winter conditions. In contrast, adult AFs are lower and more stable, with a modest increase under cold exposure (up to ≈ 25%). In the warm season, adults exhibit significantly higher AFs than seniors, particularly under hot and warm thermal conditions (≈20% – 32%). The adult burden increases with O3 levels, with heat-related stress accounting for over half the total AF at all pollution levels. Seniors show lower AFs during summer, with hot conditions contributing modestly (up to 19.3%). These patterns suggest that while cold-season O3 exposure disproportionately affects the elderly, heat-related effects during the warm season primarily impact adults.
Across pollutants, mortality risk shows a robust seasonal signature: heat-related impacts dominate in summer, while cold-related ones prevail in winter. Temperature extremes consistently amplify pollution-related mortality, confirming the modifying role of thermal stress. Seniors are generally more affected during the warm season, adults during the cold season, except for ozone where this pattern reverses.
The observed differences in AFs can be explained by a combination of physiological, behavioral, and environmental factors. Adults’ higher respiratory rates and greater outdoor activity increase inhalation of pollutants [39,40], especially in Thessaloniki’s mild winters, leading to higher winter AFs for PM10 and NO2. Conversely, seniors’ susceptibility rises in summer when heat stress exacerbates cardiovascular and respiratory fragility [41]. Despite spending more time indoors, older adults’ impaired thermoregulation and diminished adaptive capacity heighten their risk [42,43], particularly under high O3.
3.3. Intra-Urban Differences in Attributable Mortality
To complement the city-wide findings, we also conducted a supplementary intra-urban analysis, focusing on three subregions of Thessaloniki: Central-East (CE), North (N), and West (W) (Figures S6–S8). While the statistical confidence at this level was generally limited, some indicative spatial patterns emerged that provide useful context.
In Central-East Thessaloniki (Figure S6), the most densely populated part of the city, cold-season AFs showed clearer gradients across all pollutant levels, particularly PM10, O3, and NO2. Cold and cool mPET categories dominated the burden, especially among older adults (16% - 74%), reflecting the seasonal and physiological sensitivities of this age group. Despite a 13.5% drop in overall population since 2001, CE has seen a 31.5% increase in its elderly residents, suggesting a shifting vulnerability profile (Figures S1 and S2).
North Thessaloniki displayed more complex and inconsistent patterns across both seasons (Figure S7). Trends in AFs were generally weaker and less structured, possibly reflecting the region’s smaller population size and increased uncertainty. Nonetheless, its demographic trajectory, featuring a modest total population growth (+2.4%) and a substantial 68% rise in elderly residents, indicates a potentially growing public health concern that remains partially hidden in the current results.
In Figure S8, West Thessaloniki, an area with a mixed industrial-residential character, showed more consistent signals. Extreme mPET categories were prominent across all pollutant levels and both seasons. Interestingly, seniors in this region exhibited lower cold-season AFs than adults, which may suggest behavioral differences, such as spending more time indoors. The broader demographic shift here is also noteworthy, with the total population growing by 14.9% and the elderly population nearly doubling (+83%) over the past two decades.
One interesting observation is that seniors, despite their greater physiological vulnerability, tend to exhibit lower AFs in some intra-urban settings. This may be explained by differences in lifestyle and exposure: older adults might be more cautious, less mobile, or more sheltered during environmental stress events [44,45], while working-age adults are more likely to be exposed to outdoor air pollution and temperature extremes during daily activities [46].
4. Discussion
This study provides new evidence on the compounded health risks posed by simultaneous exposure to thermal stress and air pollution in a Mediterranean urban environment. By integrating the modified Physiologically Equivalent Temperature (mPET) with daily concentrations of PM10, NO2, and O3, we quantified the age-, season-, and region-specific mortality burden in Thessaloniki between 2001 and 2019. The results reveal that (i) mortality risk intensifies markedly under concurrent high temperature and pollution levels, with AFs reaching 26–29% under extreme summer PM10 and NO2 conditions and up to 37% under winter O3 peaks; (ii) vulnerability varies systematically by age and season, with seniors most affected during hot and polluted summer periods (AF ≈ 27%) and adults during cool polluted winters (AF ≈ 30%), and (iii) intra-urban patterns reflect both demographic ageing and socioeconomic heterogeneity across the city.
These findings are consistent with an expanding body of literature demonstrating that the joint impact of heat and air pollution on mortality exceeds the sum of their individual effects. A global systematic review by [47] concluded that co-exposure to heat and air pollutants, particularly ozone and particulate matter, produces synergistic rather than additive health effects. At the regional scale, [48] showed that in California, days with concurrent extreme heat and PM2.5 increased mortality by 21%, well above single-exposure estimates. Likewise, [49] analysed 620 cities worldwide and found consistent effect modification of temperature–mortality relationships by ambient pollution. Recent works by [50] and [51] further support these observations, indicating that high pollution amplifies the slope of heat-mortality curves by up to 15% and that the magnitude of synergy depends on urban morphology and greenness. Within this context, our findings extend the empirical basis for the South-Eastern Europe by providing physiologically consistent, quantified evidence of such compounding risks.
The amplification of mortality under combined stressors can be attributed to well-established physiological and chemical mechanisms. At the organism level, co-exposure strains thermoregulatory and cardiovascular systems, promoting oxidative stress and impaired gas exchange [41,42]. The strong summer signal in seniors observed here (AF≈27% for high PM10 level and mPET>35 °C) aligns with these mechanisms, as ageing reduces sweat response, cardiac reserve, and vascular plasticity. Similar patterns have been observed across European cities [43], where older adults experience disproportionate increases in hospitalisations and mortality during compound heat–pollution episodes.
Conversely, adults under cold, polluted conditions displayed higher AFs than seniors reaching 31% for PM10 and 23% for NO2, a reversal consistent with behavioural exposure patterns. Working-age adults spend longer periods outdoors, commute through traffic, and engage in moderate activity that increases minute ventilation. Evidence from [44,46] confirms that daily mobility and time–location patterns substantially shape exposure, often offsetting physiological resilience. In contrast, older adults’ lower AFs in some intra-urban settings (<20%) may reflect self-protective behavior (e.g., greater caution, limited mobility, and heat-avoidance strategies) [43,45] which reduce direct exposure even though their intrinsic susceptibility remains high. These interactions between physiology and behaviour underscore why age alone cannot fully predict vulnerability without considering exposure context.
The intra-urban gradients observed within Thessaloniki mirror broader environmental-justice patterns reported internationally. However, statistical confidence at this spatial scale was generally lower due to the smaller population sizes within each sub-region, which increased uncertainty in AF estimates. In the Central-East district, where population density is highest and the share of residents ≥65 years increased by 31.5% despite an overall 13.5% population decline, cold-season AFs for seniors reached up to 40% under O3 extremes. Western Thessaloniki, a mixed industrial-residential zone that saw 83% growth in its elderly population, exhibited pronounced hot-season AFs (>70%) and stronger responses to combined heat–pollution exposure. Northern Thessaloniki showed weaker but more variable trends, consistent with its smaller population base and lower data confidence. Such spatial contrasts likely reflect both micro-environmental variability and social inequalities. Internationally, [52] showed that low-income and minority U.S. communities face systematically higher PM2.5 and NO2 exposure; [53] confirmed similar patterns across European cities, and [54] linked urban poverty globally with proximity to emission sources. Thessaloniki’s demographic and land-use gradients thus provide a microcosm of these global inequities, highlighting the intersection of environmental and social vulnerability.
From a methodological perspective, the study contributes to advancing compound-risk assessment by employing an extended, count-independent definition of the Attributable Fraction, improving stability where daily deaths are few. This modification reduced variance in low-count strata compared with the classical AF definition (Appendix A). The combination of mPET with pollutant concentrations in a hierarchical GAM–DLNM framework offers a reproducible approach for other Mediterranean and European urban areas seeking to quantify compound exposures with demographic granularity.
The implications for policy and practice are substantial. Treating heat and air pollution as independent hazards likely under-estimates mortality during compound events. Integrating the two within early-warning systems (for instance, issuing joint heat-pollution alerts) could therefore enhance prevention. The distinct seasonal and demographic patterns observed here call for targeted interventions: heat-health action plans prioritising older populations during summer pollution peaks, and occupational or commuting protection measures for working-age adults during winter pollution episodes. The spatial heterogeneity across Thessaloniki further underscores the need for place-based mitigation, such as expanding urban greenery, improving ventilation corridors, and reducing emissions in densely populated western districts. These strategies align with equity-focused frameworks in European adaptation policy, which advocate explicit attention to socially vulnerable urban populations.
Despite its strengths, several limitations must be acknowledged. Reliance on fixed-site monitoring may under-represent personal exposure, especially indoors. Mortality data, aggregated at municipal level, could mask finer social gradients. Although mPET provides a more realistic indicator of human bioclimate than air temperature alone, residual confounding from humidity or unmeasured co-pollutants cannot be excluded. Future work should incorporate high-resolution exposure models, wearable sensor data, and socioeconomic indicators to clarify mechanisms driving intra-urban disparities. Longitudinal analyses could also explore how adaptation measures or behavioural change modify compound-risk relationships over time.
In summary, our quantified assessment demonstrates that combined heat and air-pollution exposures can account on average for 20–30% of total daily mortality during severe co-occurrence events. The Mediterranean basin, characterised by rapid warming, persistent air-quality challenges, and accelerating population ageing, stands at the frontline of this compound hazard. Quantifying and understanding these interactions are essential for developing equitable, evidence-based public-health strategies capable of safeguarding vulnerable communities in a changing climate.
5. Conclusions
The combined heat–pollution burden can account for up to one-fifth of all deaths during extreme co-occurrence episodes, particularly among older populations. The results confirm that temperature extremes amplify pollution-related mortality, with distinct seasonal and demographic patterns with seniors being more affected in summer, adults in winter. Although intra-urban estimates carry lower confidence due to smaller populations, they reveal clear spatial disparities linked to ageing and socioeconomic factors. In the context of the Eastern Mediterranean climate-change hotspot, these findings highlight that compound environmental stressors are becoming major drivers of health risk. Integrating air-quality and bioclimatic indicators into regional early-warning tools and adaptation frameworks is therefore essential to enhance climate resilience and public-health preparedness across vulnerable urban populations.
Supplementary Materials
The following supporting information can be downloaded at the website of this paper posted on Preprints.org.
Author Contributions
Conceptualization, D.P.; Data curation, D.P.; Methodology, D.P., T.E., C.G., A.M.; Project administration, A.M., D.M.; Software, D.P. and T.E.; Supervision, D.M.; Visualization, D.P.; Writing—original draft, D.P.; Writing—review and editing, D.P., T.E., C.G., A.M., D.M. All authors have read and agreed to the published version of the manuscript.
Funding
The research was supported by the LIFE Programme of the European Union in the framework of the project LIFE21-GIE-EL-LIFE-SIRIUS/101074365, and by CLIMPACT (support for enhancing the operation of the National Network for Climate Change), financed by the National Development Program, General Secretariat of Research and Innovation, Greece (2023NA11900001-N. 5201588).
Institutional Review Board Statement
Not applicable.
Informed Consent Statement
Not applicable.
Data Availability Statement
Mortality data provided by ELSTAT are confidential.
Acknowledgments
The authors would like to acknowledge the support of the Hellenic Statistical Service (ELSTAT) for providing the mortality data and the Region of Central Macedonia for providing the pollution data.
Conflicts of Interest
The authors declare no conflict of interest.
Abbreviations
The following abbreviations are used in this manuscript:
| AF | Attributable Fraction |
| DLNM | Distributed Lag Non-Linear Models |
| GAM | Generalized Additive Model |
| mPET | modified Physiologically Equivalent Temperature |
| TUA | Thessaloniki Urban Area |
Appendix A
Here we conduct an experiment to compare the attributable fraction metric proposed here (equation (7)) with the original definition given in equation (6). For this, we use open source daily mortality data time series from Chicago [55]. We fit a simple DLNM model where mean daily temperature (Tmean) is the sole exposure and we consider a maximum lag of 5 days (for demonstration):
We then proceed to estimate the attributable fraction using both metrics. For illustration, we focus on the heat-related AF, where we are interested in the metric for values of Tmean above a high threshold. Specifically we compute the metrics for a series of Tmean thresholds, starting from the 0.95 quantile all the way to the 0.9999 quantile, shown in Figure A1. The two metrics are almost the same until the very high quantiles, where original starts to take non-plausible values (i.e., exceeding 1). This is because there is no actual constraint to ensure the numerator in equation (6) is always smaller than the denominator.
Figure A1.
Heat-related Attributable Fraction for the Chicago data set, for a series of temperature thresholds.
Figure A1.
Heat-related Attributable Fraction for the Chicago data set, for a series of temperature thresholds.
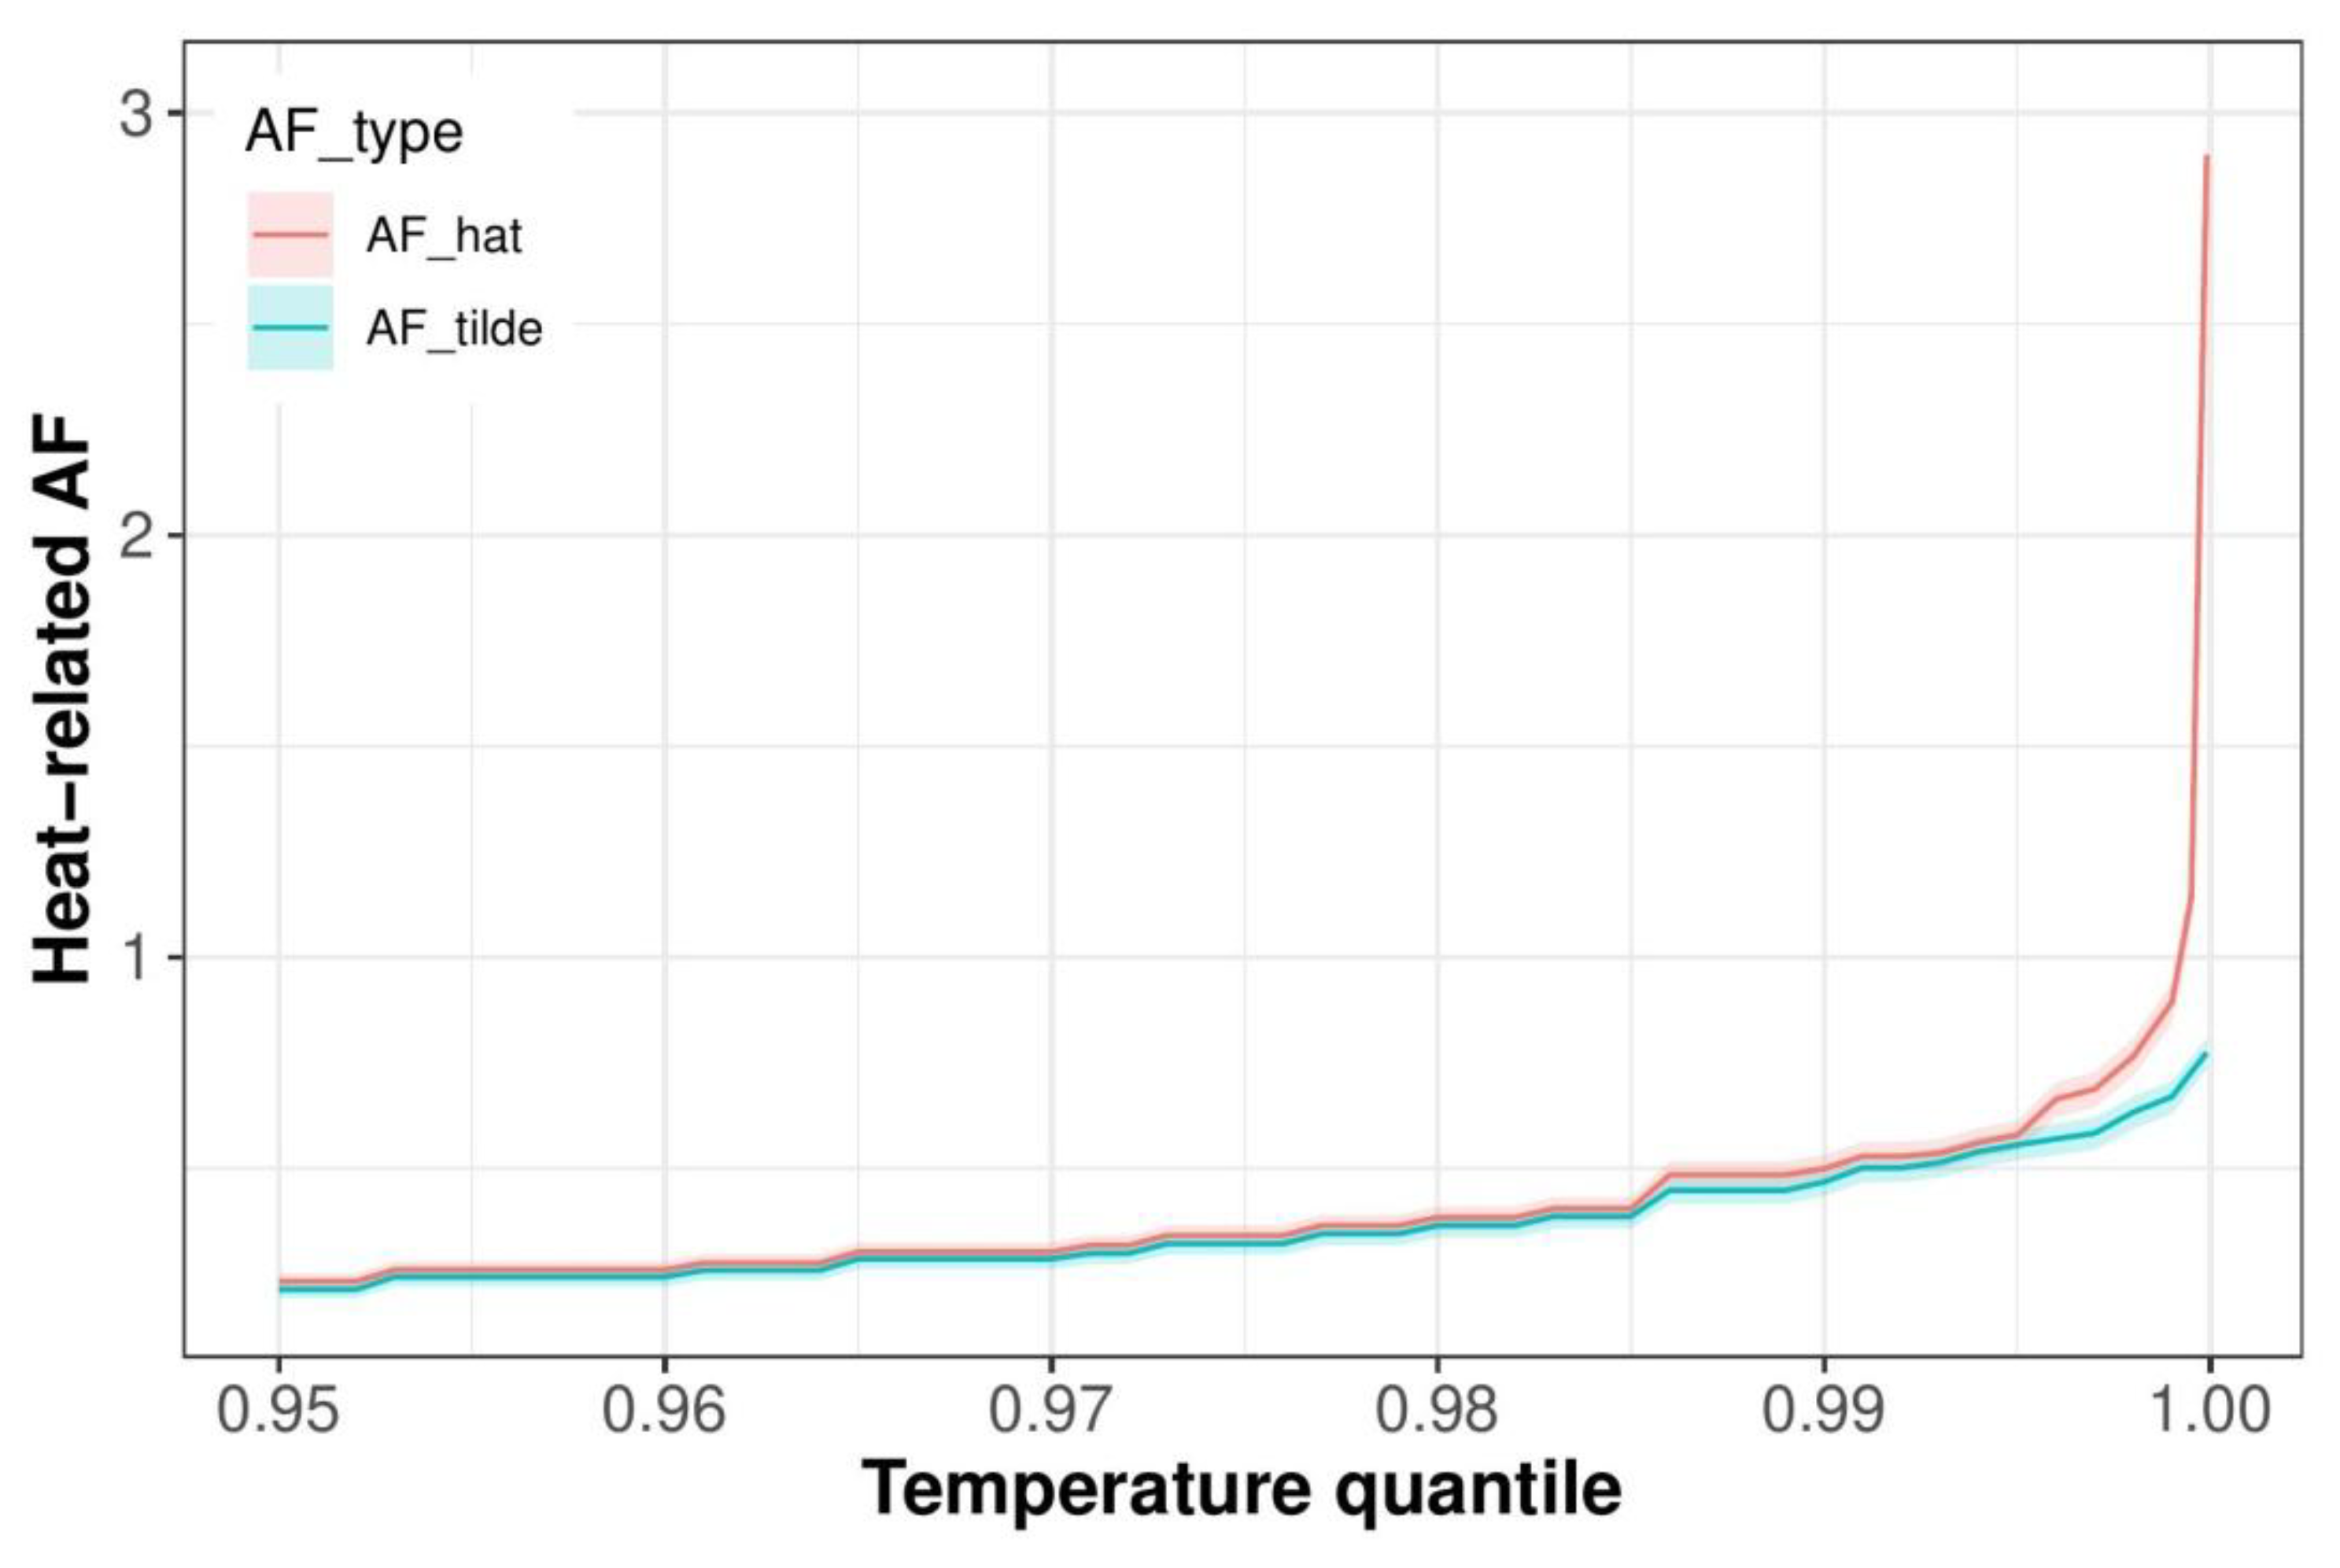
Upon closer inspection, the original metric is always slightly higher than . This however, is explained by 4 extremely large, consecutive (and probably suspicious) outliers in the data that occurred during very high temperatures and therefore skew upwards. Removing these 4 outliers gives Figure A2, where the two quantities are essentially the same, except for the very high quantiles where again deviates (misleadingly) due to the sampling variation in the counts. Note that the metric proposed here () is exactly the same in both Figure A1 and Figure A2 (blue line) as it is not a function of the counts.
Figure A2.
Heat-related Attributable Fraction for the Chicago data set, for a series of temperature thresholds, where the 4 suspicious outliers have been removed.
Figure A2.
Heat-related Attributable Fraction for the Chicago data set, for a series of temperature thresholds, where the 4 suspicious outliers have been removed.
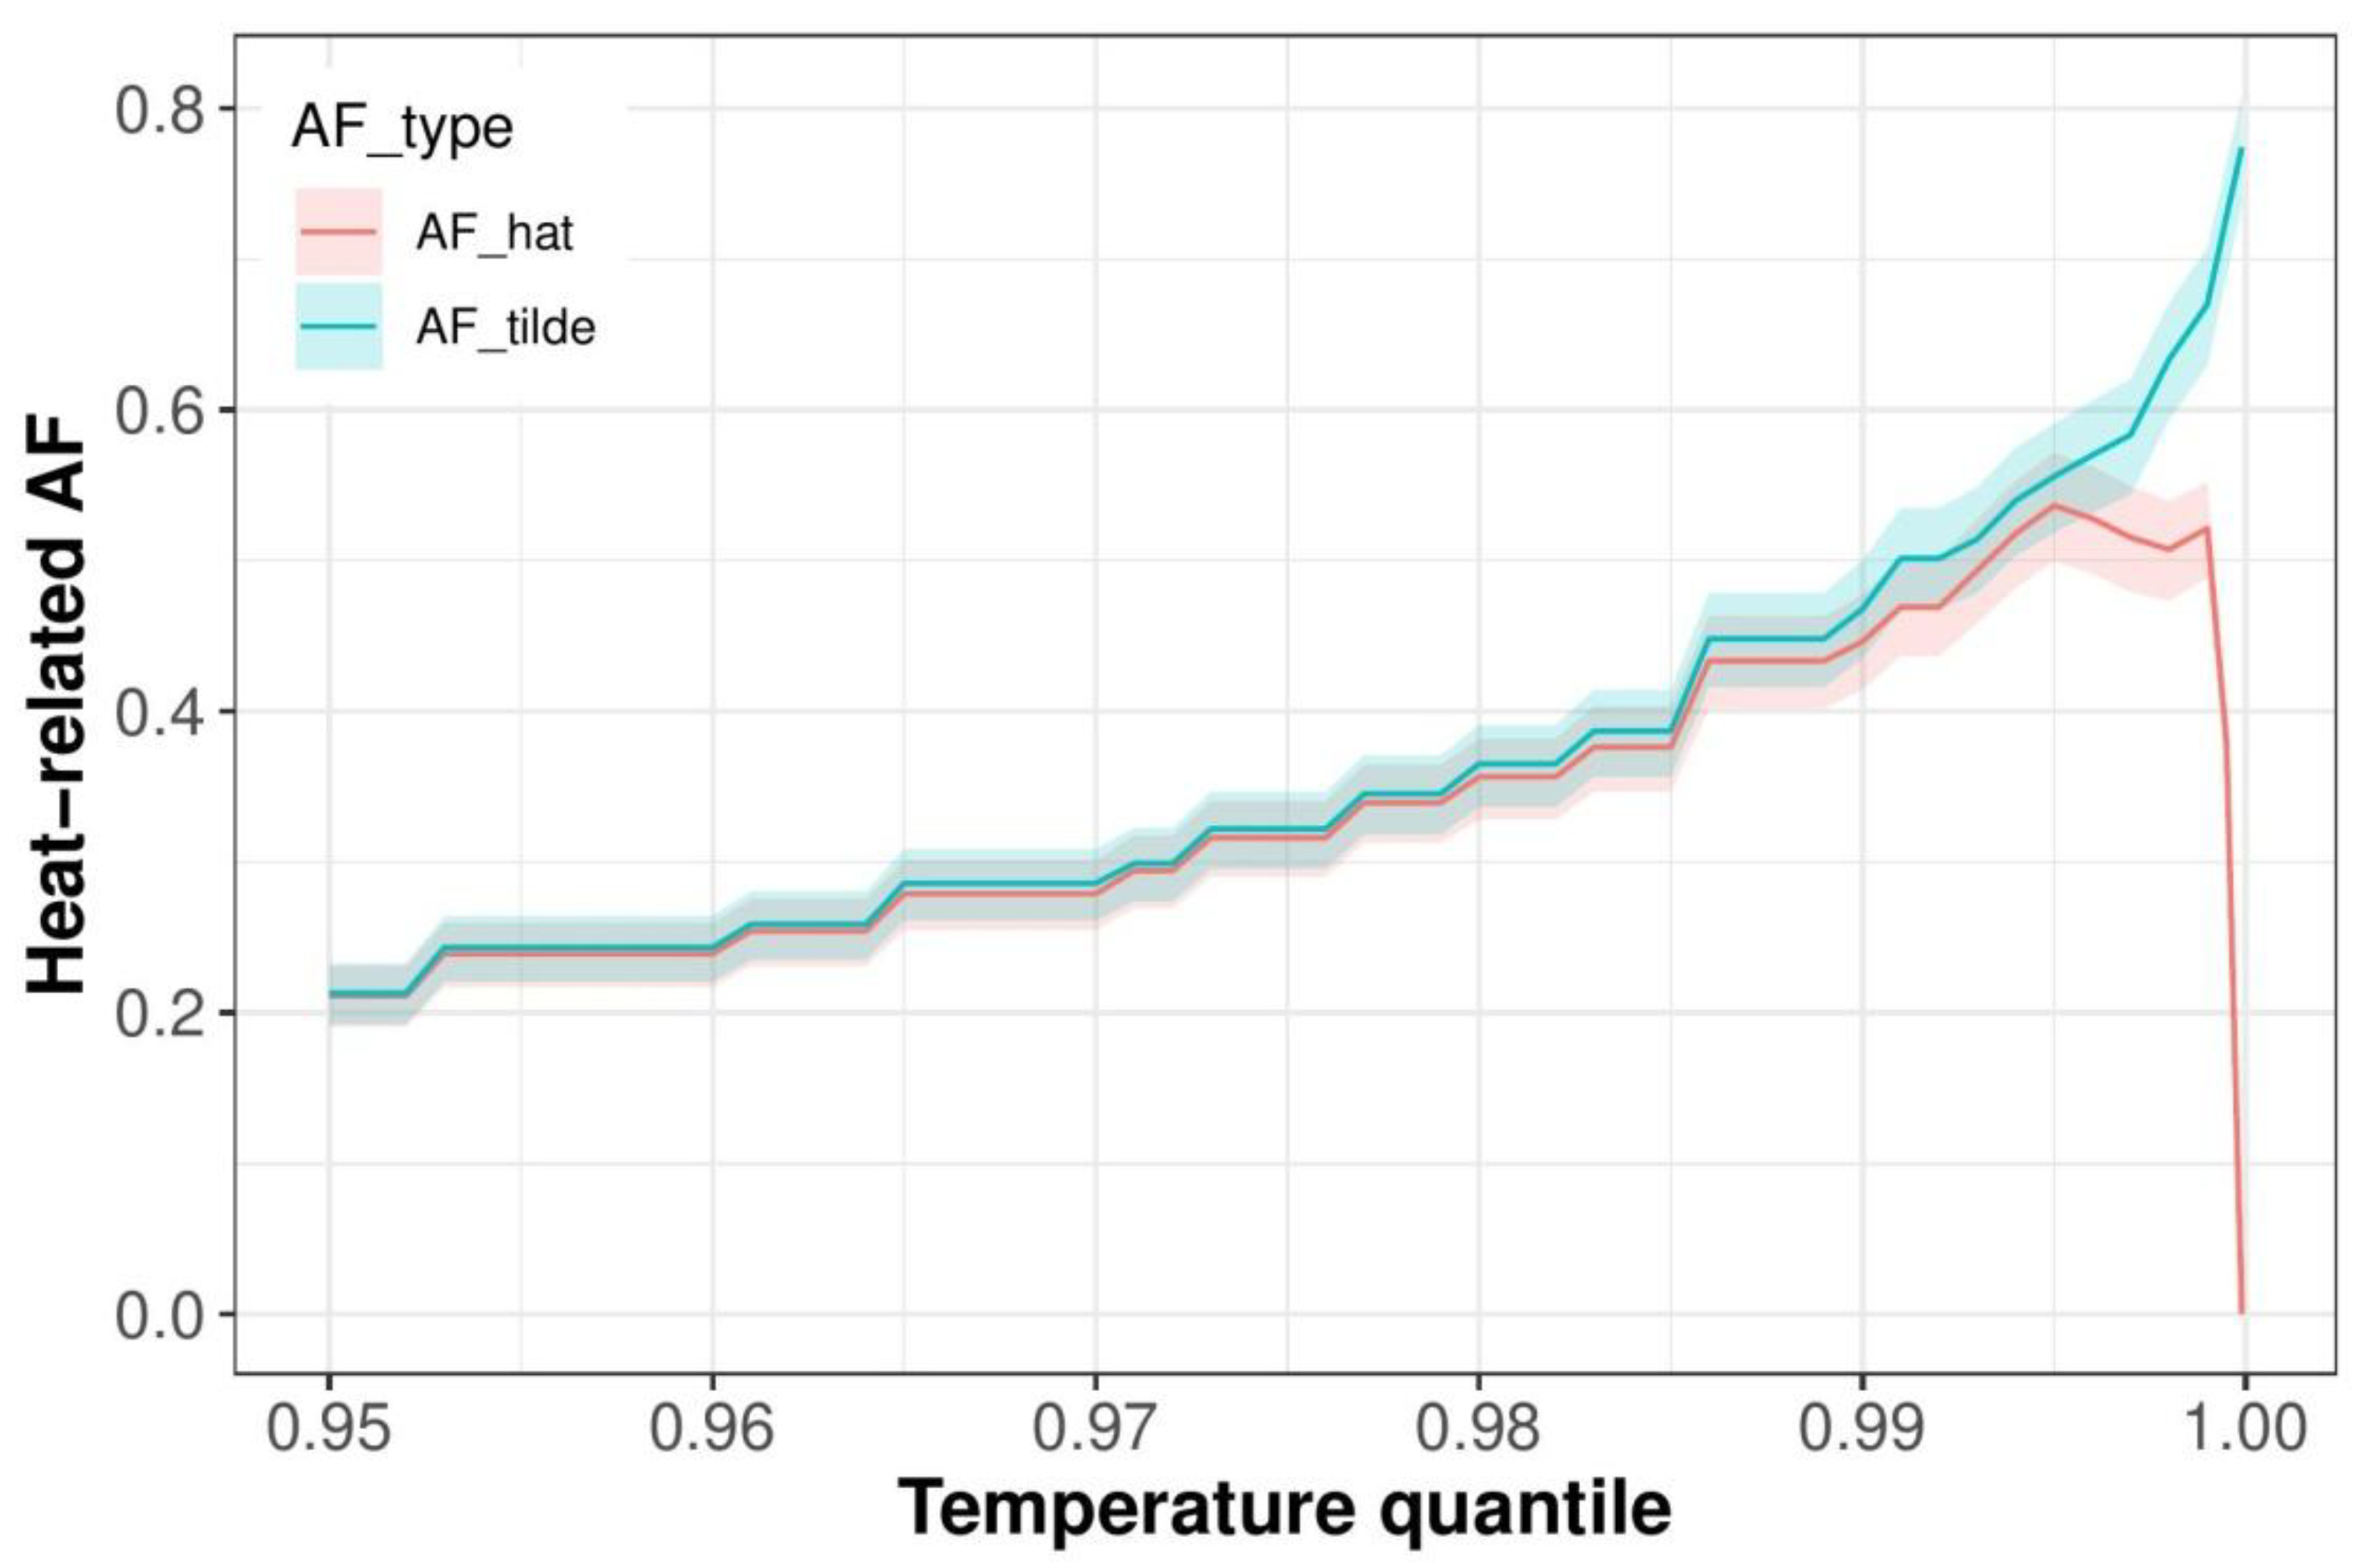
We can therefore conclude that is a more robust metric than (and one that effectively conveys the same information), simply by virtue of not depending on the observed counts. This makes it more useful in quantifying the synergistic effects, where computation of the attributable fraction is over increasingly smaller subsets of the exposure range space.
References
- G. Lazoglou et al., “Identification of climate change hotspots in the Mediterranean,” Sci. Rep., vol. 14, no. 1, pp. 1–11, 2024. [CrossRef]
- F. Kekkou, T. Economou, G. Lazoglou, and C. Anagnostopoulou, “Temperature Extremes and Human Health in Cyprus: Investigating the Impact of Heat and Cold Waves,” 2024. [CrossRef]
- G. Zittis et al., “Climate Change and Weather Extremes in the Eastern Mediterranean and Middle East,” Rev. Geophys., vol. 60, no. 3, 2022. [CrossRef]
- D. Founda, K. V. Varotsos, F. Pierros, and C. Giannakopoulos, “Observed and projected shifts in hot extremes’ season in the Eastern Mediterranean,” Glob. Planet. Change, vol. 175, no. February, pp. 190–200, 2019. [CrossRef]
- S. C. Keppas et al., “Future climate change impact on urban heat island in two mediterranean cities based on high-resolution regional climate simulations,” Atmosphere (Basel)., vol. 12, no. 7, 2021. [CrossRef]
- S. Keppas et al., “Urban Heat Island and Future Projections: A Study in Thessaloniki, Greece,” in International conference on Environmental protection and disaster RISKs, ENVIRORISK 2020, 2021, pp. 201–212. [CrossRef]
- C. Giannaros, E. Galanaki, and I. Agathangelidis, “Climatology and Long-Term Trends in Population Exposure to Urban Heat Stress Considering Variable Demographic and Thermo–Physiological Attributes,” Climate, vol. 12, no. 12, pp. 1–17, 2024. [CrossRef]
- European Environmental Agency, “Air quality status report 2025,” 2025. https://www.eea.europa.eu/en/analysis/publications/air-quality-status-report-2025 (accessed Apr. 25, 2025).
- D. Akritidis, A. K. Georgoulias, B. Steffens, A. Pozzer, and P. Zanis, “The future health burden of air pollution in Greece and the associated drivers,” Sci. Total Environ., vol. 994, no. March, p. 179897, 2025. [CrossRef]
- D. Parliari et al., “Short-Term Effects of Apparent Temperature on Cause-Specific Mortality in the Urban Area of Thessaloniki, Greece,” Atmosphere, 2022. [CrossRef]
- D. Parliari, C. Giannaros, S. Papadogiannaki, and D. Melas, “Short-Term Effects of Air Pollution on Mortality in the Urban Area of Thessaloniki, Greece,” Sustainability, vol. 15, no. 6, p. 548, 2023. [CrossRef]
- Elisa Gallo et al., “Heat-related mortality in Europe during 2023 and the role of adaptation in protecting health,” Nat. Med., 2024. [CrossRef]
- G. Loupa, Z. P. Kryona, V. Pantelidou, and S. Rapsomanikis, “Are PM2.5 in the Atmosphere of a Small City a Threat for Health?,” Sustainability, vol. 13, no. 20, p. 11329, 2021. [CrossRef]
- S. Khomenko et al., “Premature mortality due to air pollution in European cities: a health impact assessment,” Lancet Planet. Heal., vol. 5, no. 3, pp. e121–e134, 2021. [CrossRef]
- X. Hu et al., “Does air pollution modify temperature-related mortality? A systematic review and meta-analysis,” Environ. Res., vol. 210, no. November 2021, p. 112898, 2022. [CrossRef]
- M. Rai et al., “Heat-related cardiorespiratory mortality: effect modification by air pollution across 482 cities from 24 countries,” Environ. Int., vol. 174, 2023. [CrossRef]
- A. Matzarakis, “A note on the assessment of the effect of atmospheric factors and components on humans,” Atmosphere (Basel)., vol. 11, no. 12, pp. 1–18, 2020. [CrossRef]
- Matzarakis, “Curiosities about thermal indices estimation and application,” Atmosphere (Basel)., vol. 12, no. 6, pp. 1–7, 2021. [CrossRef]
- Y. C. Chen, W. N. Chen, C. C. K. Chou, and A. Matzarakis, “Concepts and new implements for modified physiologically equivalent temperature,” Atmosphere (Basel)., vol. 11, no. 7, pp. 1–17, 2020. [CrossRef]
- Y. C. Chen and A. Matzarakis, “Modified physiologically equivalent temperature—basics and applications for western European climate,” Theor. Appl. Climatol., vol. 132, no. 3–4, pp. 1275–1289, 2018. [CrossRef]
- Giannaros et al., “A thermo-physiologically consistent approach for studying the heat-health nexus with hierarchical generalized additive modelling : Application in Athens urban area ( Greece ),” Urban Clim., vol. 58, p. 102206, 2024. [CrossRef]
- Parliari et al., “Comprehensive Approach for Assessing the Synergistic Impact of Air Quality and Thermal Conditions on Human Mortality: Case of Thessaloniki, Greece,” 2024. [CrossRef]
- T. Economou et al., “Flexible distributed lag models for count data using mgcv,” Am. Stat., no. 856612, pp. 1–28, 2025. [CrossRef]
- A. Gasparrini and M. Leone, “Attributable risk from distributed lag models,” BMC Med. Res. Methodol., vol. 14, no. 1, pp. 1–8, 2014. [CrossRef]
- K. Kalogeropoulos, D. Fragkopoulos, P. Andreopoulos, and A. Tragaki, “Shifting Sands: Examining and Mapping the Population Structure of Greece Through the Last Three Censuses,” Economies, vol. 12, no. 11, 2024. [CrossRef]
- A. Papadimitriou et al., “Successful aging and lifestyle comparison of Greeks living in Greece and abroad: the epidemiological Mediterranean Islands Study (MEDIS),” Arch. Gerontol. Geriatr., vol. 97, no. June, p. 104523, 2021. [CrossRef]
- K. Psistaki, P. Kouis, A. Michanikou, P. K. Yiallouros, S. I. Papatheodorou, and A. Κ. Paschalidou, “Temporal trends in temperature-related mortality and evidence for maladaptation to heat and cold in the Eastern Mediterranean region,” Sci. Total Environ., vol. 943, no. March, p. 173899, 2024. [CrossRef]
- A. Progiou, N. Liora, I. Sebos, C. Chatzimichail, and D. Melas, “Measures and Policies for Reducing PM Exceedances through the Use of Air Quality Modeling : The Case of Thessaloniki, Greece,” Sustainability, no. 15, 2023. [CrossRef]
- Zyrichidou et al., “Adverse results of the economic crisis: A study on the emergence of enhanced formaldehyde (HCHO) levels seen from satellites over Greek urban sites,” Atmos. Res., vol. 224, no. March, pp. 42–51, 2019. [CrossRef]
- Rizos, C. Meleti, G. Kouvarakis, N. Mihalopoulos, and D. Melas, “Determination of the background pollution in the Eastern Mediterranean applying a statistical clustering technique,” Atmos. Environ., vol. 276, no. March, p. 119067, 2022. [CrossRef]
- A. Giannaros et al., “Hourly values of an advanced human-biometeorological index for diverse populations from 1991 to 2020 in Greece,” Sci. Data, vol. 11, no. 1, pp. 1–10, 2024. [CrossRef]
- Matzarakis, F. Rutz, and H. Mayer, “Modelling radiation fluxes in simple and complex environments: Basics of the RayMan model,” Int. J. Biometeorol., vol. 54, no. 2, pp. 131–139, 2010. [CrossRef]
- Matzarakis, F. Rutz, and H. Mayer, “Modelling radiation fluxes in simple and complex environments - Application of the RayMan model,” Int. J. Biometeorol., vol. 51, no. 4, pp. 323–334, 2007. [CrossRef]
- S. N. Wood, “Fast stable restricted maximum likelihood and marginal likelihood estimation of semiparametric generalized linear models,” J. R. Stat. Soc. Ser. B Stat. Methodol., vol. 73, no. 1, pp. 3–36, 2011. [CrossRef]
- S. . Wood, Generalized Additive Models: An Introduction with R, 2nd Editio. New York: Chapman and Hall/CRC, 2017. [CrossRef]
- Parliari et al., “A comprehensive approach for assessing synergistic impact of air quality and thermal conditions on mortality: The case of Thessaloniki, Greece,” Urban Clim., vol. 56, no. July, p. 102088, 2024. [CrossRef]
- T. Economou and F. Garry, “Probabilistic simulation of big climate data for robust quantification of changes in compound hazard events,” Weather Clim. Extrem., vol. 38, no. November, p. 100522, 2022. [CrossRef]
- Y. Honda et al., “Heat-related mortality risk model for climate change impact projection,” Env. Heal. Prev Med, no. 19, pp. 56–63, 2014. [CrossRef]
- A. Aglan et al., “Personal and community-level exposure to air pollution and daily changes in respiratory symptoms and oxygen saturation among adults with COPD,” Hyg. Environ. Heal. Adv., vol. 6, no. March, p. 100052, 2023. [CrossRef]
- Chen et al., “Breathing in danger: Understanding the multifaceted impact of air pollution on health impacts,” Ecotoxicol. Environ. Saf., vol. 280, no. April, 2024. [CrossRef]
- Y. Chang, A. X. Tan, K. C. Nadeau, and M. C. Odden, “Aging Hearts in a Hotter, More Turbulent World: The Impacts of Climate Change on the Cardiovascular Health of Older Adults,” Curr. Cardiol. Rep., vol. 24, no. 6, pp. 749–760, 2022. [CrossRef]
- R. D. Meade et al., “Physiological factors characterizing heat-vulnerable older adults: A narrative review,” Environ. Int., vol. 144, no. June, p. 105909, 2020. [CrossRef]
- Fastl, A. Arnberger, V. Gallistl, V. K. Stein, and T. E. Dorner, “Heat vulnerability: health impacts of heat on older people in urban and rural areas in Europe,” Wien. Klin. Wochenschr., vol. 136, no. 17–18, pp. 507–514, 2024. [CrossRef]
- Spalt et al., “Time-Location Patterns of a Diverse Population of Older Adults: The Multi-Ethnic Study of Atherosclerosis and Air Pollution (MESA Air),” J Expo Sci Env. Epidemiol., vol. 26, no. 4, pp. 349–355, 2016. [CrossRef]
- N. E. Klepeis et al., “The National Human Activity Pattern Survey (NHAPS): A resource for assessing exposure to environmental pollutants,” J. Expo. Anal. Environ. Epidemiol., vol. 11, no. 3, pp. 231–252, 2001. [CrossRef]
- T. Benoussaïd, I. Coll, H. Charreire, I. Makni, M. Costes, and A. Elessa Etuman, “Reassessing air pollution exposure: How daily mobility and activities shape individual risk in greater Paris,” Comput. Environ. Urban Syst., vol. 122, no. March, 2025. [CrossRef]
- S. C. Anenberg, S. Haines, E. Wang, N. Nassikas, and P. L. Kinney, “Synergistic health effects of air pollution, temperature, and pollen exposure: a systematic review of epidemiological evidence,” Environ. Heal. A Glob. Access Sci. Source, vol. 19, no. 1, 2020. [CrossRef]
- M. M. Rahman et al., “The Effects of Coexposure to Extremes of Heat and Particulate Air Pollution on Mortality in California Implications for Climate Change,” Am. J. Respir. Crit. Care Med., vol. 206, no. 9, pp. 1117–1127, 2022. [CrossRef]
- M. Stafoggia et al., “Joint effect of heat and air pollution on mortality in 620 cities of 36 countries,” Environ. Int., vol. 181, no. June, 2023. [CrossRef]
- S. Zhang et al., “Effect modification of air pollution on the association between heat and mortality in five European countries,” Environ. Res., vol. 263, no. P1, p. 120023, 2024. [CrossRef]
- E. S. Coker, S. E. Cleland, D. McVea, M. Stafoggia, and S. B. Henderson, “The synergistic effects of PM2.5 and high temperature on community mortality in British Columbia,” npj Clean Air, vol. 1, no. 1, 2025. [CrossRef]
- P. Clark, M. H. Harris, J. S. Apte, and J. D. Marshall, “National and Intraurban Air Pollution Exposure Disparity Estimates in the United States: Impact of Data-Aggregation Spatial Scale,” Environ. Sci. Technol. Lett., vol. 9, no. 9, pp. 786–791, 2022. [CrossRef]
- van den Brekel et al., “Ethnic and socioeconomic inequalities in air pollution exposure: a cross-sectional analysis of nationwide individual-level data from the Netherlands,” Lancet Planet. Heal., vol. 8, no. 1, pp. e18–e29, 2024. [CrossRef]
- J. Rentschler and N. Leonova, “Air pollution kills – Evidence from a global analysis of exposure and poverty,” 2022. https://blogs.worldbank.org/en/developmenttalk/air-pollution-kills-evidence-global-analysis-exposure-and-poverty?utm_source=chatgpt.com (accessed Oct. 31, 2025).
- A. Tobias, C. F. S. Ng, Y. Kim, M. Hashizume, and L. Madaniyazi, “Compilation of open access time-series datasets for studying temperature-mortality association,” Data Br., vol. 55, p. 110694, 2024. [CrossRef]
Figure 1.
Contour plot of the joint association of PM10 and mPET at different PM10 levels (5th, 30th, 60th and 95th percentiles of the PM10 distribution) in warm (left panel) and cold season (right panel). Statistical significance (95% CI) is indicated by grey points.
Figure 1.
Contour plot of the joint association of PM10 and mPET at different PM10 levels (5th, 30th, 60th and 95th percentiles of the PM10 distribution) in warm (left panel) and cold season (right panel). Statistical significance (95% CI) is indicated by grey points.
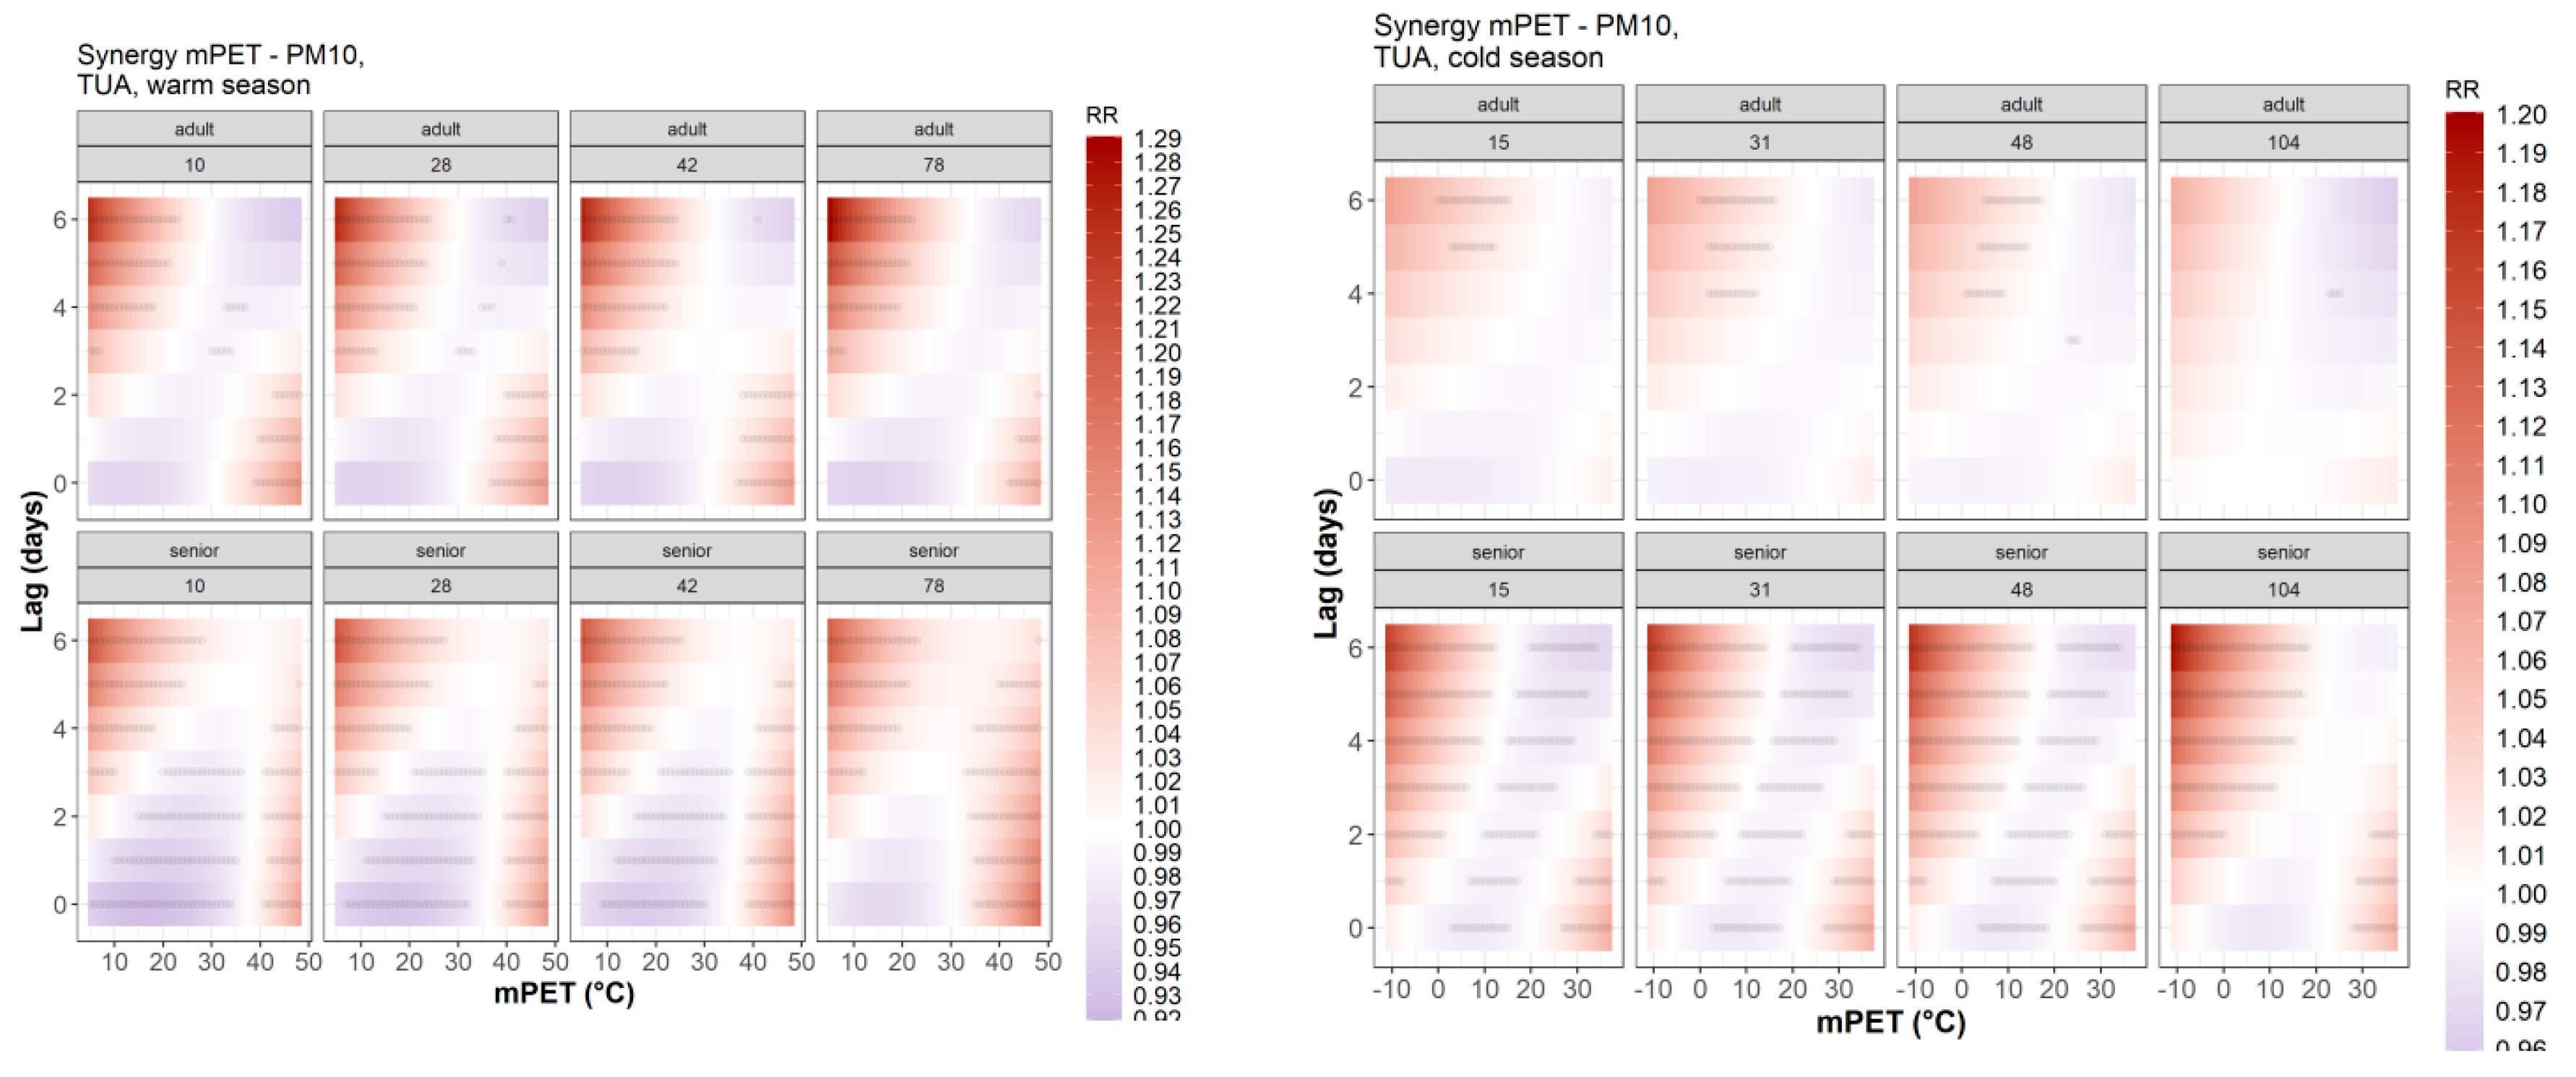
Figure 2.
Attributable Fraction across mPET-AQ space regions during the warm season (April–September). Stacked bars do not sum to 100%.
Figure 2.
Attributable Fraction across mPET-AQ space regions during the warm season (April–September). Stacked bars do not sum to 100%.
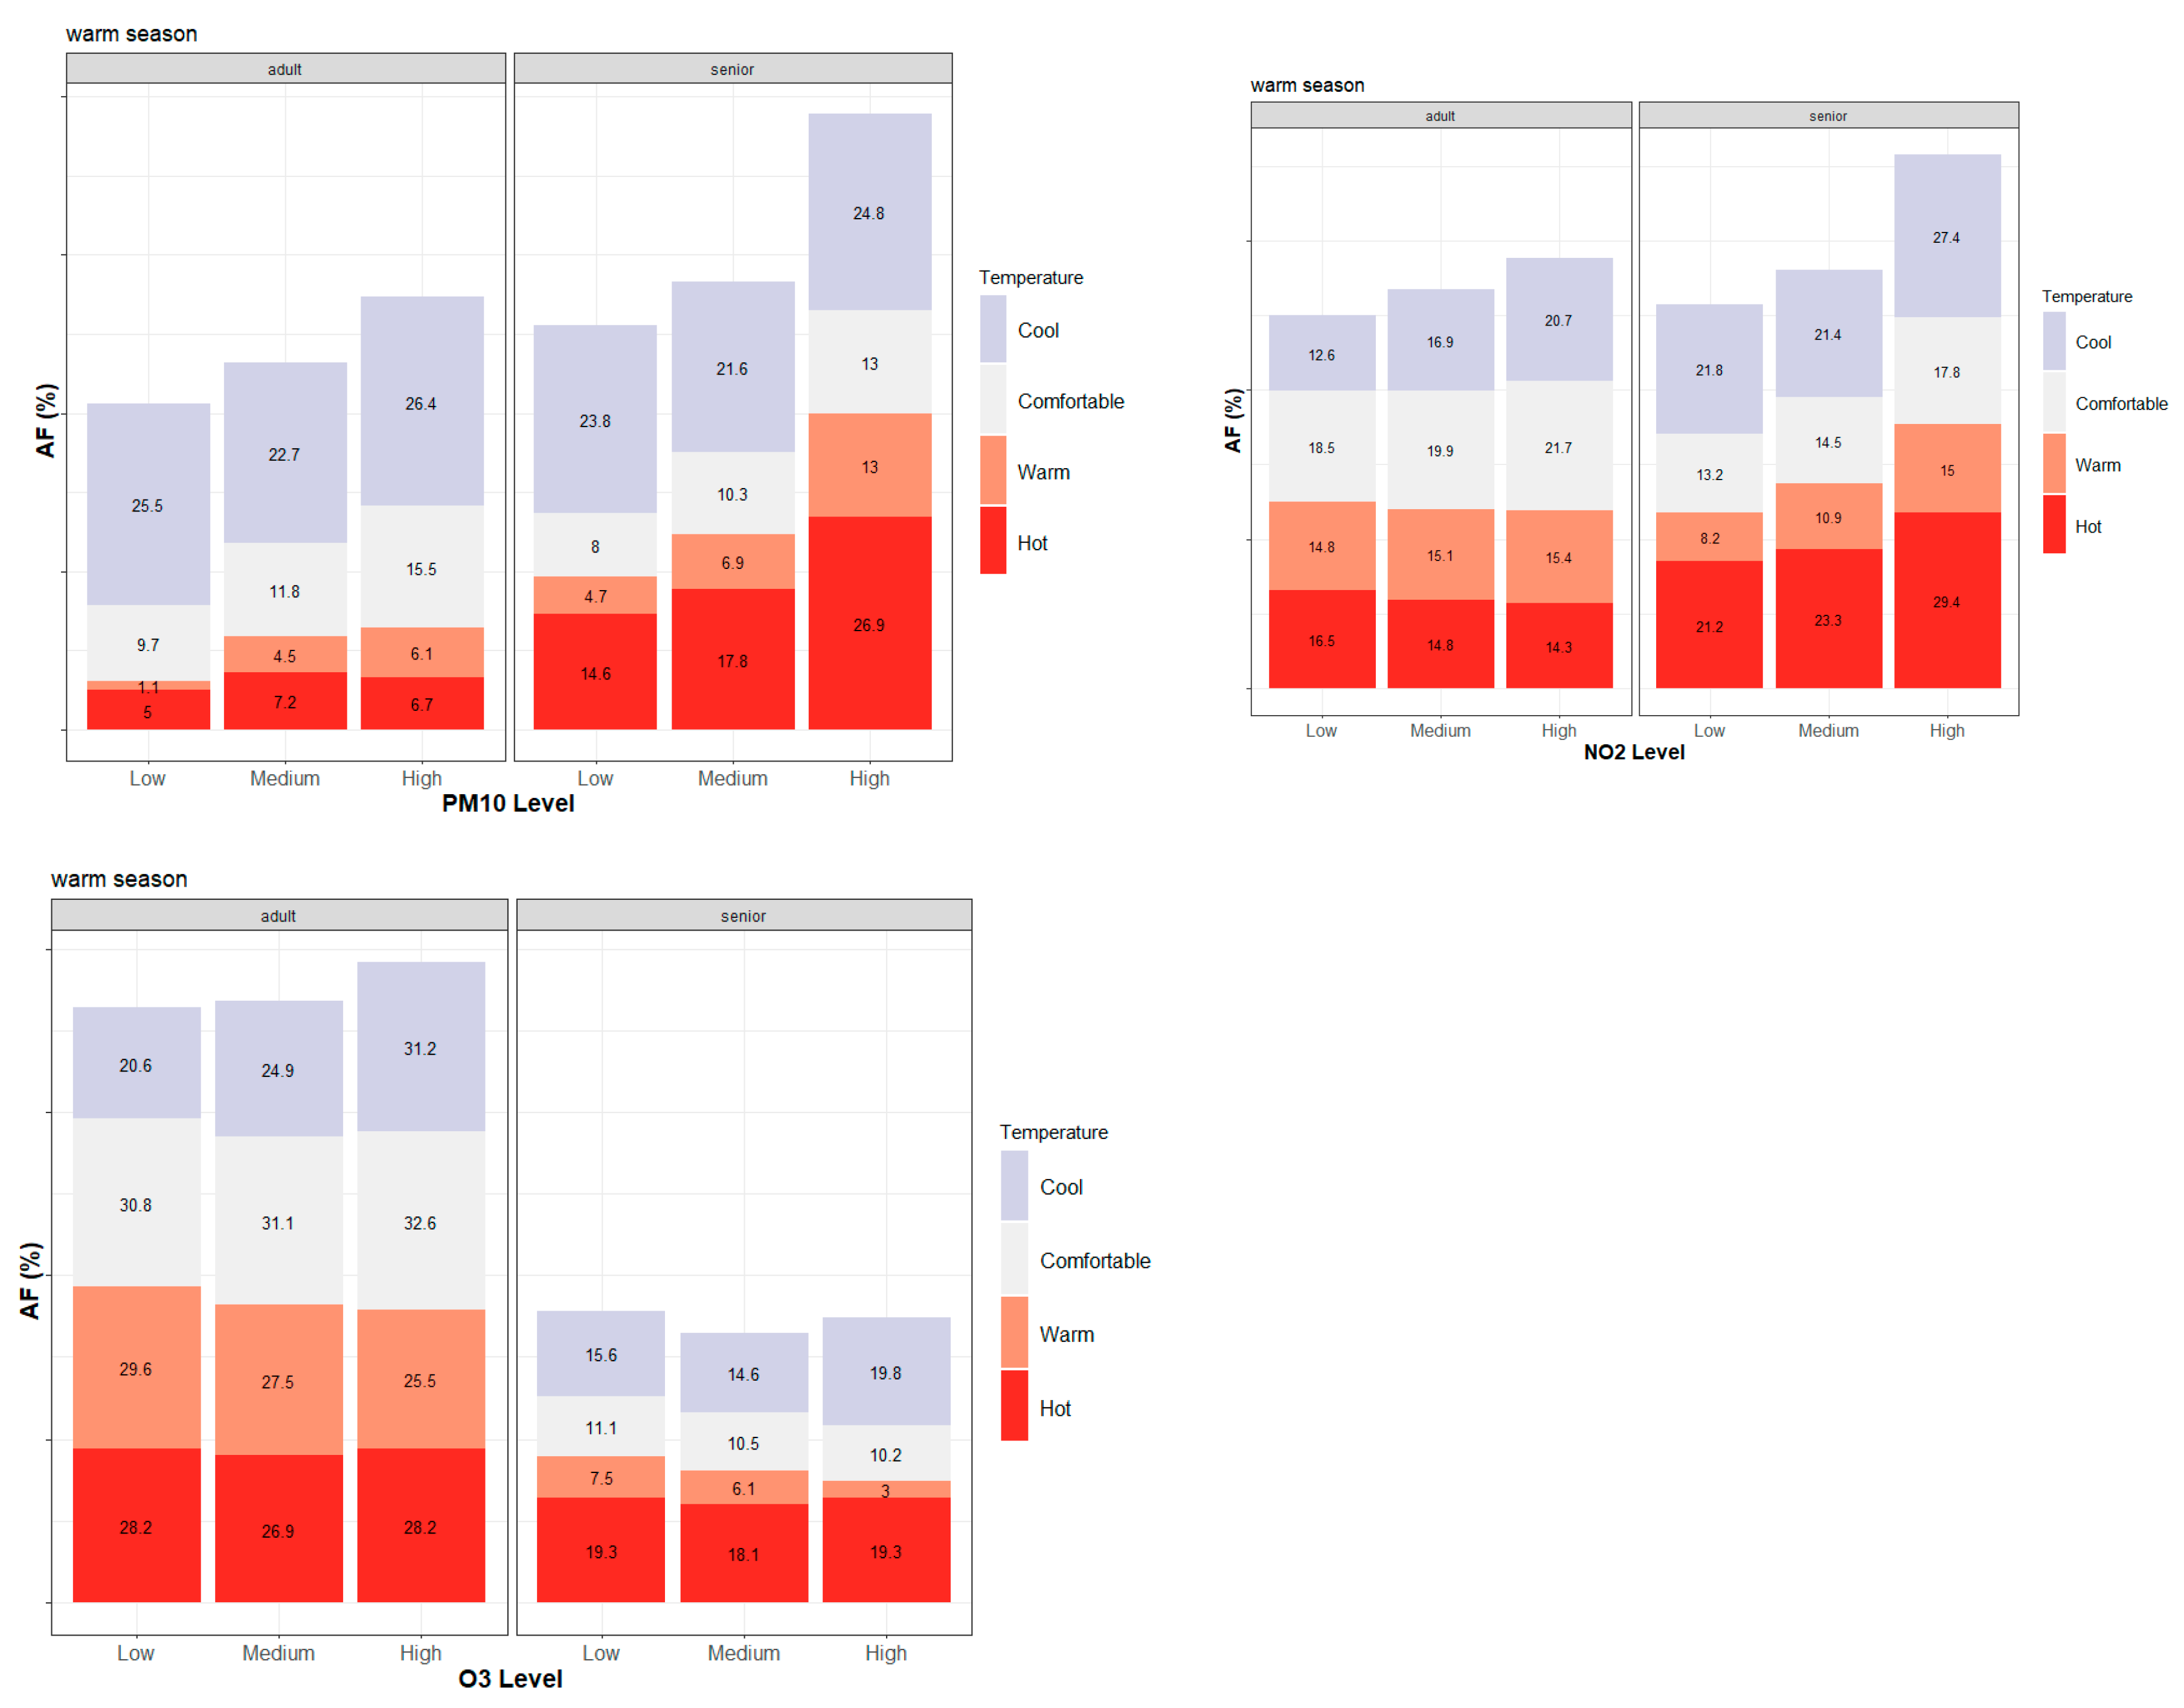
Figure 3.
Attributable Fraction across mPET-AQ space regions during the cold season (October–March). Stacked bars do not sum to 100%.
Figure 3.
Attributable Fraction across mPET-AQ space regions during the cold season (October–March). Stacked bars do not sum to 100%.
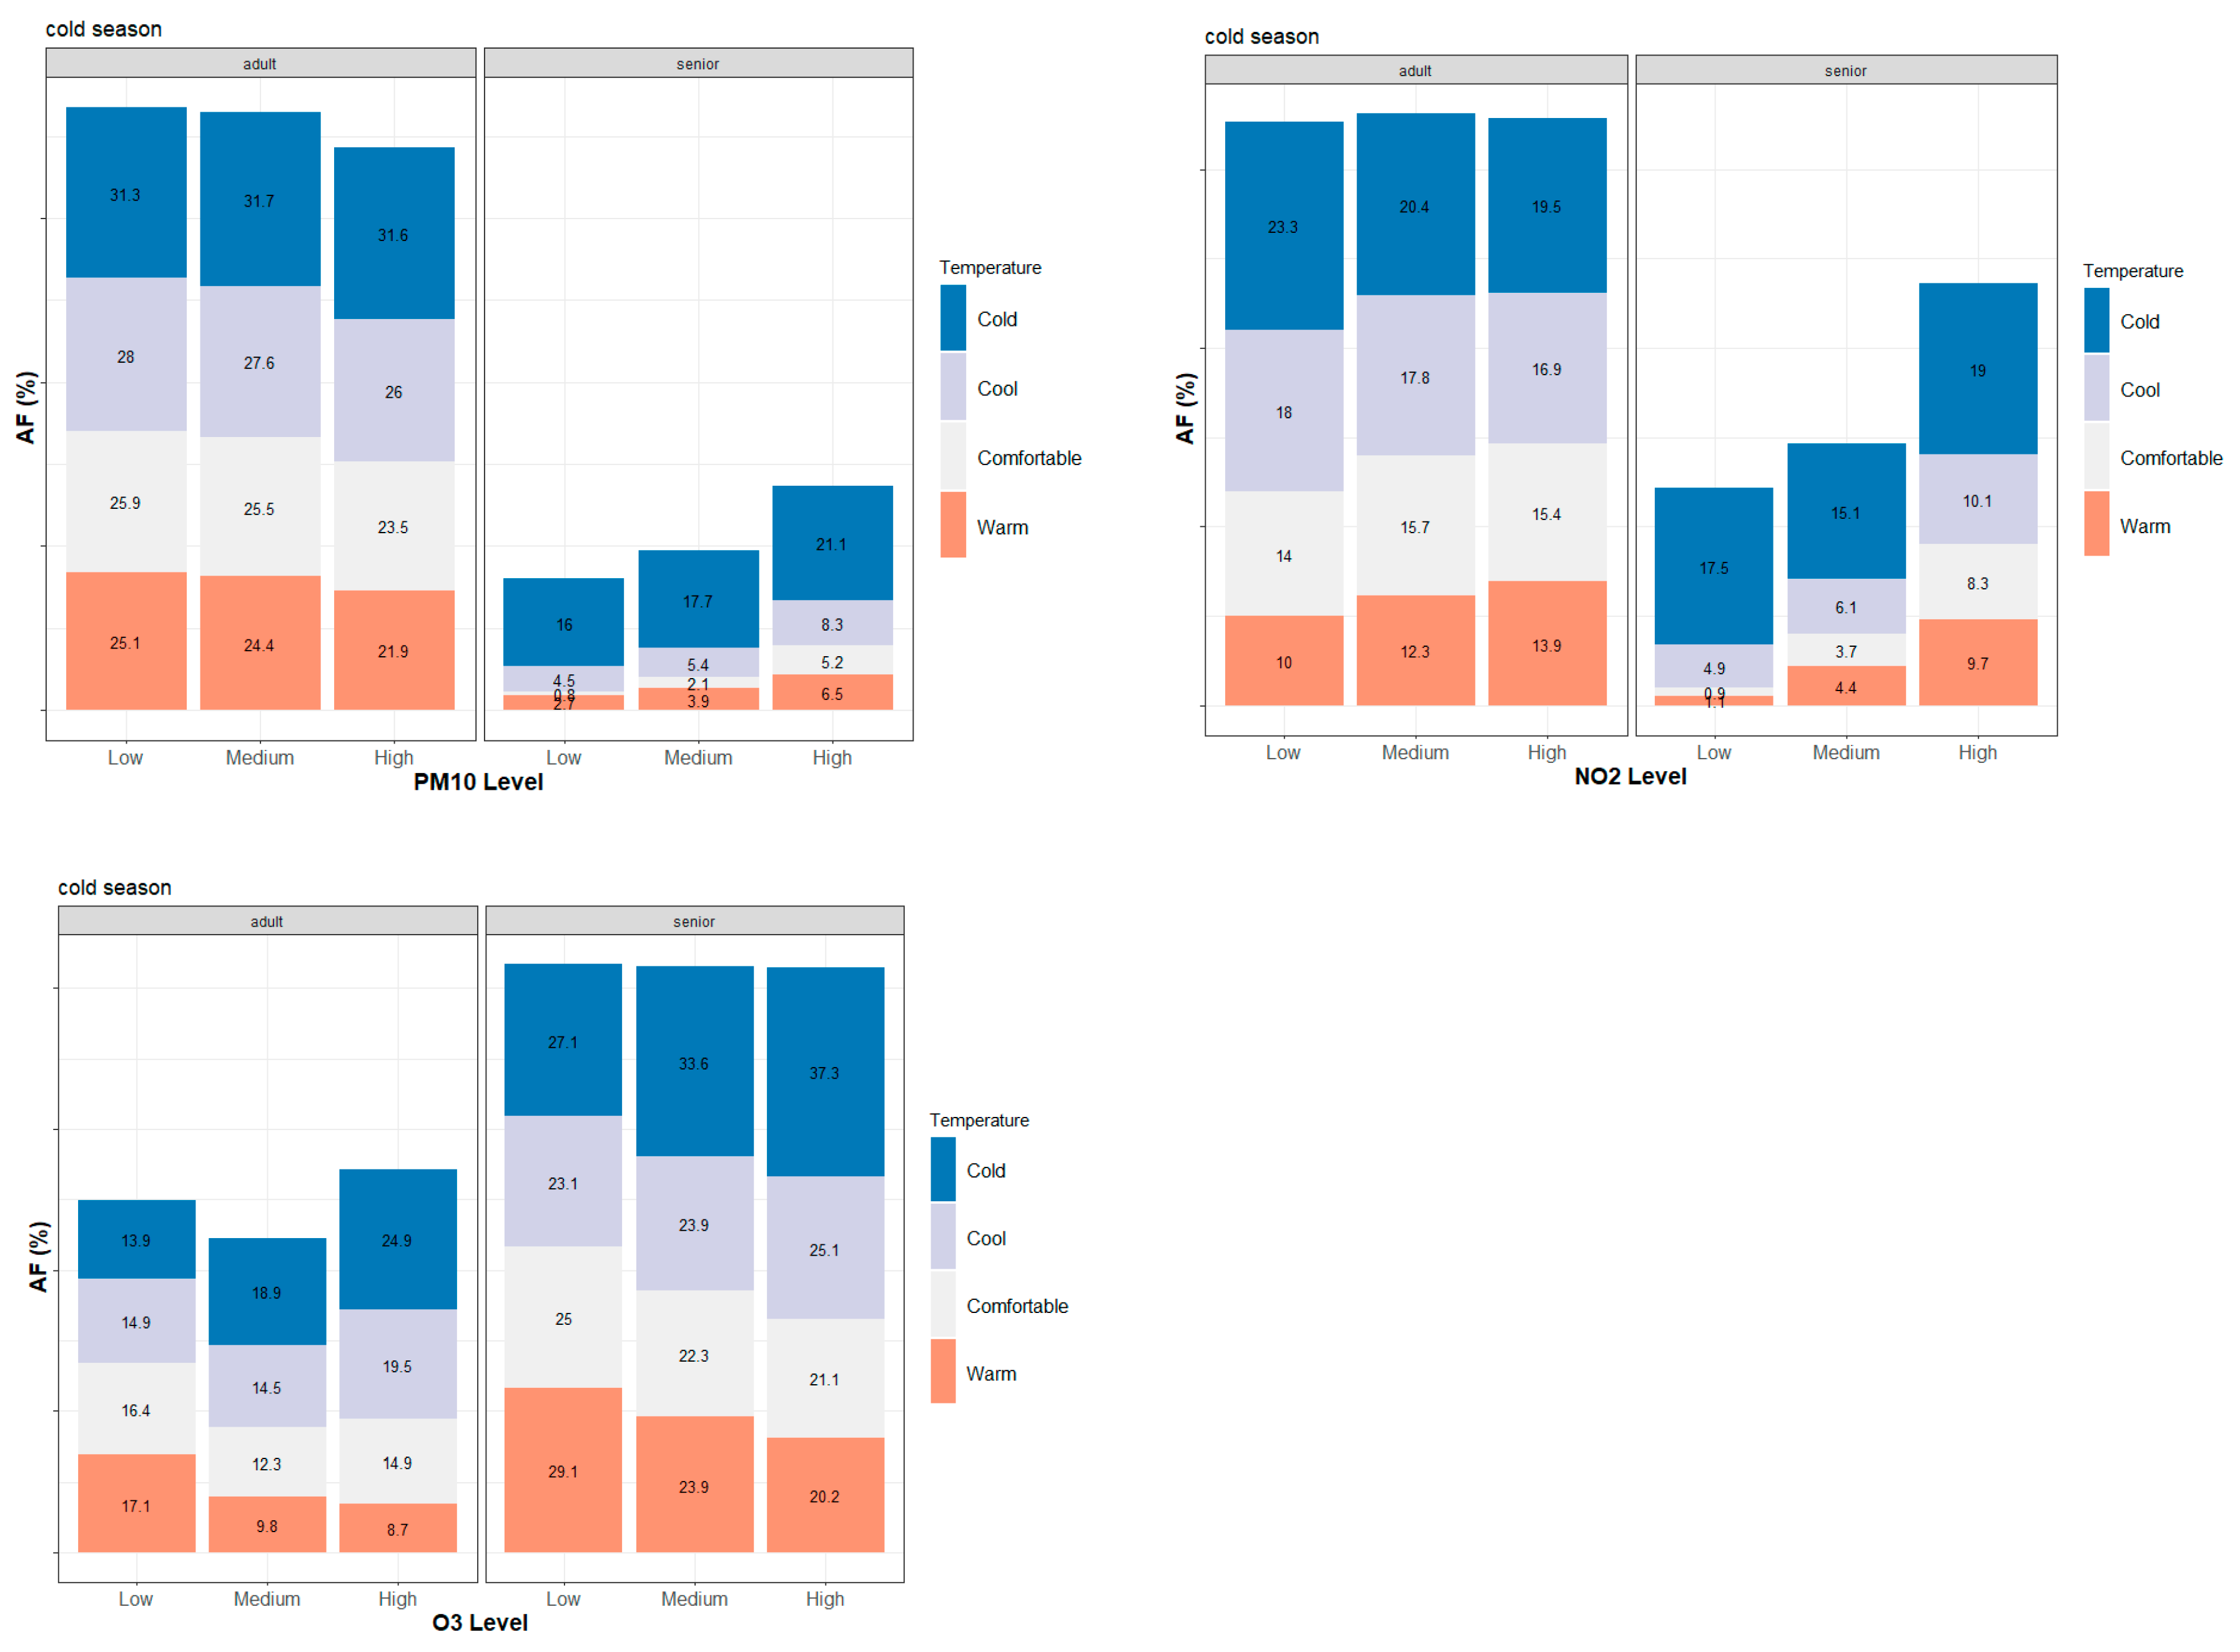

Table 1.
Adjusted mPET thresholds and thermal sensation classes used in the current study.
| Thermal sensation | Warm period mPET thresholds | Cold period mPET thresholds |
|---|---|---|
| “Cold” | - | < 8 °C |
| “Cool” | < 18 °C | 8 °C - 18 °C |
| “Comfortable” | 18 °C - 23 °C | 18 °C - 23 °C |
| “Warm” | 23 °C - 35 °C | > 23 °C |
| “Hot” | > 35 °C | - |
Disclaimer/Publisher’s Note: The statements, opinions and data contained in all publications are solely those of the individual author(s) and contributor(s) and not of MDPI and/or the editor(s). MDPI and/or the editor(s) disclaim responsibility for any injury to people or property resulting from any ideas, methods, instructions or products referred to in the content. |
© 2025 by the authors. Licensee MDPI, Basel, Switzerland. This article is an open access article distributed under the terms and conditions of the Creative Commons Attribution (CC BY) license (http://creativecommons.org/licenses/by/4.0/).
Copyright: This open access article is published under a Creative Commons CC BY 4.0 license, which permit the free download, distribution, and reuse, provided that the author and preprint are cited in any reuse.


