Submitted:
22 July 2024
Posted:
24 July 2024
You are already at the latest version
Abstract
This study explores the inelastic doubly differential transverse momentum spectra of the
primary charged particles, (π + + π − ), (K + + K − ) and (pp̄) as a function of underlying event
√
(UE) at s = 13 T eV . The particle production is measured on the basis of different angular
regions like toward, transverse and away, elucidated with respect to the direction of leading
particle of an event. To study the thermal freeze-out parameters, the non extensive Tsallis
distribution function is used, to extract the temperature Tef f , and chemical potential µ, which
provides a basis to explain the QCD matter. The Tsallis distribution function clearly describes
transverse momentum spectra in pseudorapidity region of |η| < 0.8. The best fit corresponds to
minimum χ2 /ndf value for the transverse momentum distribution. It is observed that effective
temperature Tef f changes from away to towards and forward region.
Keywords:
Transverse momentum
; Chemical potential
; Effective temperature
; Tsallis distribution function
; Colour coherence
1. Introduction
The identification of various stages of dense matter during the evolution of heavy-ion collisions [1] is a crucial task. At extremely high energy or density, a state of matter exists in which quarks and gluons are deconfined, forming Quark-Gluon Plasma (QGP) [2]. This state is also observed in the early universe, occurring microseconds (s) after the Big Bang before condensing into hadrons. Evaluating phase transitions in finite systems has been a longstanding focus, studied for decades through various phenomenological applications.
The Relativistic Heavy-Ion Collider (RHIC) [3] and the Large Hadron Collider (LHC) [4] provide useful tools for identifying the phase structure and investigating the properties of Quantum Chromodynamics (QCD) matter.
According to statistical thermal models, the initial stage of nuclei collisions at RHIC and LHC generates high temperatures, creating a dense "fireball" with a large radius in a short period (about seconds). This fireball consists of QGP, which subsequently cools and expands the system. Partons recombine to form a cascade of hadronic matter, and these hadrons continue to interact until these interactions cease, freezing the particle momenta. The temperature at this point decreases to a specific value known as the chemical freeze-out temperature (). However, the rescattering process continues to occur, contributing to the ongoing development of collective (hydrodynamical) expansion. Consequently, the matter becomes more dilute, and the mean free path of the given hadrons in elastic reaction processes becomes comparable to the size of the system. At this stage, the rescattering process ceases, resulting in the separation of hadrons from the rest of the system [5,6]. This phase is termed as kinetic or thermal freeze-out stage, and the temperature at this point is denoted as the kinetic or thermal freeze-out temperature (). Following this stage, the particle’s energy/momentum spectrum becomes fixed in time, marking the concluding phase of the system’s evolution. If flow effect is included at the stage of kinetic freeze-out along with the degree of excitation of the interacting system, then that temperature is called the effective temperature (), and it is generally greater that the .
As the purpose of heavy-ion collision is to study the QGP probed through its signatures. However the small collision system like [7] shows the similar features as observed in heavy-ions like [8], [9] and [10] collisions. The signatures like anisotropic radial flow and strangeness enhancement are associated with the formation of quark gluon plasma(QGP) [11], is also observed in and systems.
In this paper, we have investigated the thermodynamic characteristics of interacting systems. For this purpose, several statistical models, including the Boltzmann-Gibbs distribution [13], have been employed. Notably, the Tsallis distribution function [14] has proven to be an excellent representation of particle spectra for values. By applying the non-extensive Tsallis distribution function for ALICE data fitting purposes [12], we have determined various thermodynamic parameters such as effective temperature (), chemical potential (), and volume (V) of the system. The non-extensive Tsallis distribution function is utilized for combined minimum fits.
2. Methodology
The study of underlying events(UE) [12] is proposed to understand the effect observed in small collision system. The UE consists of initial state radiation (ISR), final state radiation (FSR), beam remnant and multiparticle interactions (MPIs). The particles produced as a function of UE activity allows to probe the properties in MPI suppressed environment. This experiment yields a similar signal to radial flow, but with increased multiplicity due to jet hardening.
At LHC, enormous number of particles are produced. We analysed the primary charged particles, , and as a function of UE at [8] in this work. The UE activity is probed through particle event topology, where leading charged particle carries the highest transverse momentum within in the pseudorapidity interval of . The lower threshold of guarantees the multiple soft scattering while the upper threshold is used to reduce the effects of wide angle radiation which is significant for and associated with hard scattering.
The three different topological regions away, towards and transverse regions are reported in this paper. These are determined by comparing the azimuthal angles of the leading and associated particles = . The associated particles lying in the kinematic range of and . The away, towards and transverse regions are defined as , and . The particles produced in away and toward region contain constituents from away-side and leading jets, whereas the transverse region is sensitive to ISR, FSR and MPI’s.
In this paper, we have used the non extensive Tsallis distribution function [14] to extract the thermodynamic information for primary charged particle and produced as a function of over a wide range of transverse momentum for pseudorapidity region , at center of mass energy . These primary charged particles have mean life time , larger than which is produced in interactions or from the decay of particles with life time smaller than .
2.1. Particle Distribution in Tsallis statistics
Various statistical models are used to extract the thermodynamical parameters like T, and e.g. Boltzmann Gibbs statistics and Tsallis non extensive statistics. Generally two main processes i.e., soft excitation (contributes the soft component of low region) and hard excitation (contributes to the hard component in the region) are involved in transverse momentum spectra [8]. For a soft excitation one could possibly used the Boltzmann-Gibbs statistics, while if the reaches upto in the collision at collider, than one needs to use Tsallis statistics. In this study the transverse momentum spectra of the final state particles produced in collision at high energy can be explored using Tsallis statistics[14].The number of particles are given as:
where g, and T are degeneracy, chemical potential and temperature respectively, Where and q is the fitting parameter which tells us deviation from Boltzmann Gibbs distribution. The particular form which satisfies the thermodynamic consistency is given as:
where V is the volume, is the transverse mass and y is rapidity.
3. Results
Figure 1a–c depicts the particle yield as a function of relative transverse momentum classifier , for primary charged particles like produced in high energy collisions at fitted with thermodynamically consistent Tsallis distribution function with chemical potential . The observables reported are measured in three different topological region Away, Towards and Transverse region. The circles display the experimental data in the pseudorapidity range of used in this analysis at LHC by ALICE collaborations [11]. The curve represents the fitting of the data by using eq.(3), the values of extracted parameters; Tsallis temperature, Radius, non-extensive parameter, degeneracy () and are presented in Table 1.
It is seen clearly that the Tsallis distribution function describes the measured experimental data at the pseudorapidity region of in collisions very well. The best fit corresponds to minimum . It is observed that the is higher for transverse region due to presence of more UE events like contribution from ISR, FSR and MPIs. While for the away and towards regions, the is lower because of the fragmentation particle production.
Figure 2a–c presents the particle yield as a function of relative transverse momentum classifier , for strange particles like produced in high energy collisions at fitted with thermodynamically consistent Tsallis distribution function with chemical potential . The observables reported are measured in three different topological region Away, Towards and Transverse region. The circles display the experimental data in the pseudorapidity range of used in this analysis at LHC by ALICE collaborations [11]. The curve represents the fitting of the data by using eq.(3), the values of extracted parameters; Tsallis temperature, Radius, non-extensive parameter, degeneracy () and are presented in Table 2.
Figure 3a–c shows the particle yield as a function of relative transverse momentum classifier , for primary charged particles like produced in high energy collisions at fitted with thermodynamically consistent Tsallis distribution function with chemical potential . The observables reported are measured in three different topological region Away, Towards and Transverse region. The circles display the experimental data in the pseudorapidity range of used in this analysis at LHC by ALICE collaborations [11]. The curve represents the fitting of the data by using eq. (3), the values of extracted parameters; Tsallis temperature, Radius, non-extensive parameter, degeneracy () and are presented in Table 3.
It is clear from Table 1, Table 2 and Table 3 that the changes with regions. The values for the non-extensive parameter, q ranges between , acceptable within the high energy limit and matches to the values obtained in literature [5,15,16].
Figure 4a–c depicts the variation of chemical potential , non-extensive parameter q and effective temperature with for primary charged particles like produced in high energy collisions at .
Figure 5a–c depicts the variation of chemical potential , non-extensive parameter q and temperature with for strange particles like produced in high energy collisions at .
Figure 6a–c depicts the variation of chemical potential , non-extensive parameter q and temperature with for baryon like produced in high energy collisions at .
4. Conclusion
In this paper we have presented the transverse momentum spectra of primary charged particles like , and produced in high energy collision at center of mass energy of . The momentum spectra of particles is classified according to the classes and fitted with non extensive Tsallis distribution function. Two main parameters i.e. and are under discussion which are very important in the discussion of QCD matter. We have extracted the thermodynamical parameters from the fitted spectra and observed that the is higher for the transverse region where multiple parton interactions, initial and final state radiations are more sensitive.
Data Availability Statement
This manuscript has associated data in a data repository. [Author’s comment: All data included in this manuscript are available upon request by contacting the corresponding author.]
References
- Braun-Munzinger, et al., Quark–Gluon Plasma 3 pp. 491-599 (2004).
- McLerran, L., Reviews of Modern Physics, 58 4, 1021 (1986).
- Harrison, M., et al., Annual Review of Nuclear and Particle Science, 52(1), 425-469 (2002).
- Ellis, J., The European Physical Journal C-Particles and Fields, 34, 51-56 (2004).
- U. Tabassam et al., Eur. Phys. J. Plus, 138 367 (2023).
- Muhammad Waqas et al., Advances in High Energy Physics Volume 2020, Article ID 8198126, 15 pages, (2020).
- Khachatryan, V., et al., Physics Letters B, 765, 193-220 (2017).
- Floris, M., the ALICE Collaboration, Journal of Physics G: Nuclear and Particle Physics, 38(12), 124025 (2011).
- Muller, B., et al., Annual Review of Nuclear and Particle Science, 62, 361-386 (2012).
- Zain Ul Abidin, Eur. Phys. J. Plus, 137:115 (2022).
- McLerran, L., Reviews of Modern Physics, 58(4), 1021 (1986).
- ALICE Collaboration, arXiv preprint (2023). arXiv:2301.10120.
- J. S. Rowlinson, Mol. Phys. 103(21-23), (2005) 2821.
- J. Cleymans, D. Worku, JPhysG. 39.2, (2012) 025006.
- M. Waqas et al., Eur. Phys. J. Plus, 138 (2023) 450.
- U. Tabassam et al., Eur. Phys. J. Plus, 138 (2023) 394.
Figure 1.
Combined minimum fits (solid lines) of the transverse momentum distribution of using the Tsallis distribution function with at the center of mass energies for (a) Away, (b) Toward (c) Transverse regions.
Figure 1.
Combined minimum fits (solid lines) of the transverse momentum distribution of using the Tsallis distribution function with at the center of mass energies for (a) Away, (b) Toward (c) Transverse regions.
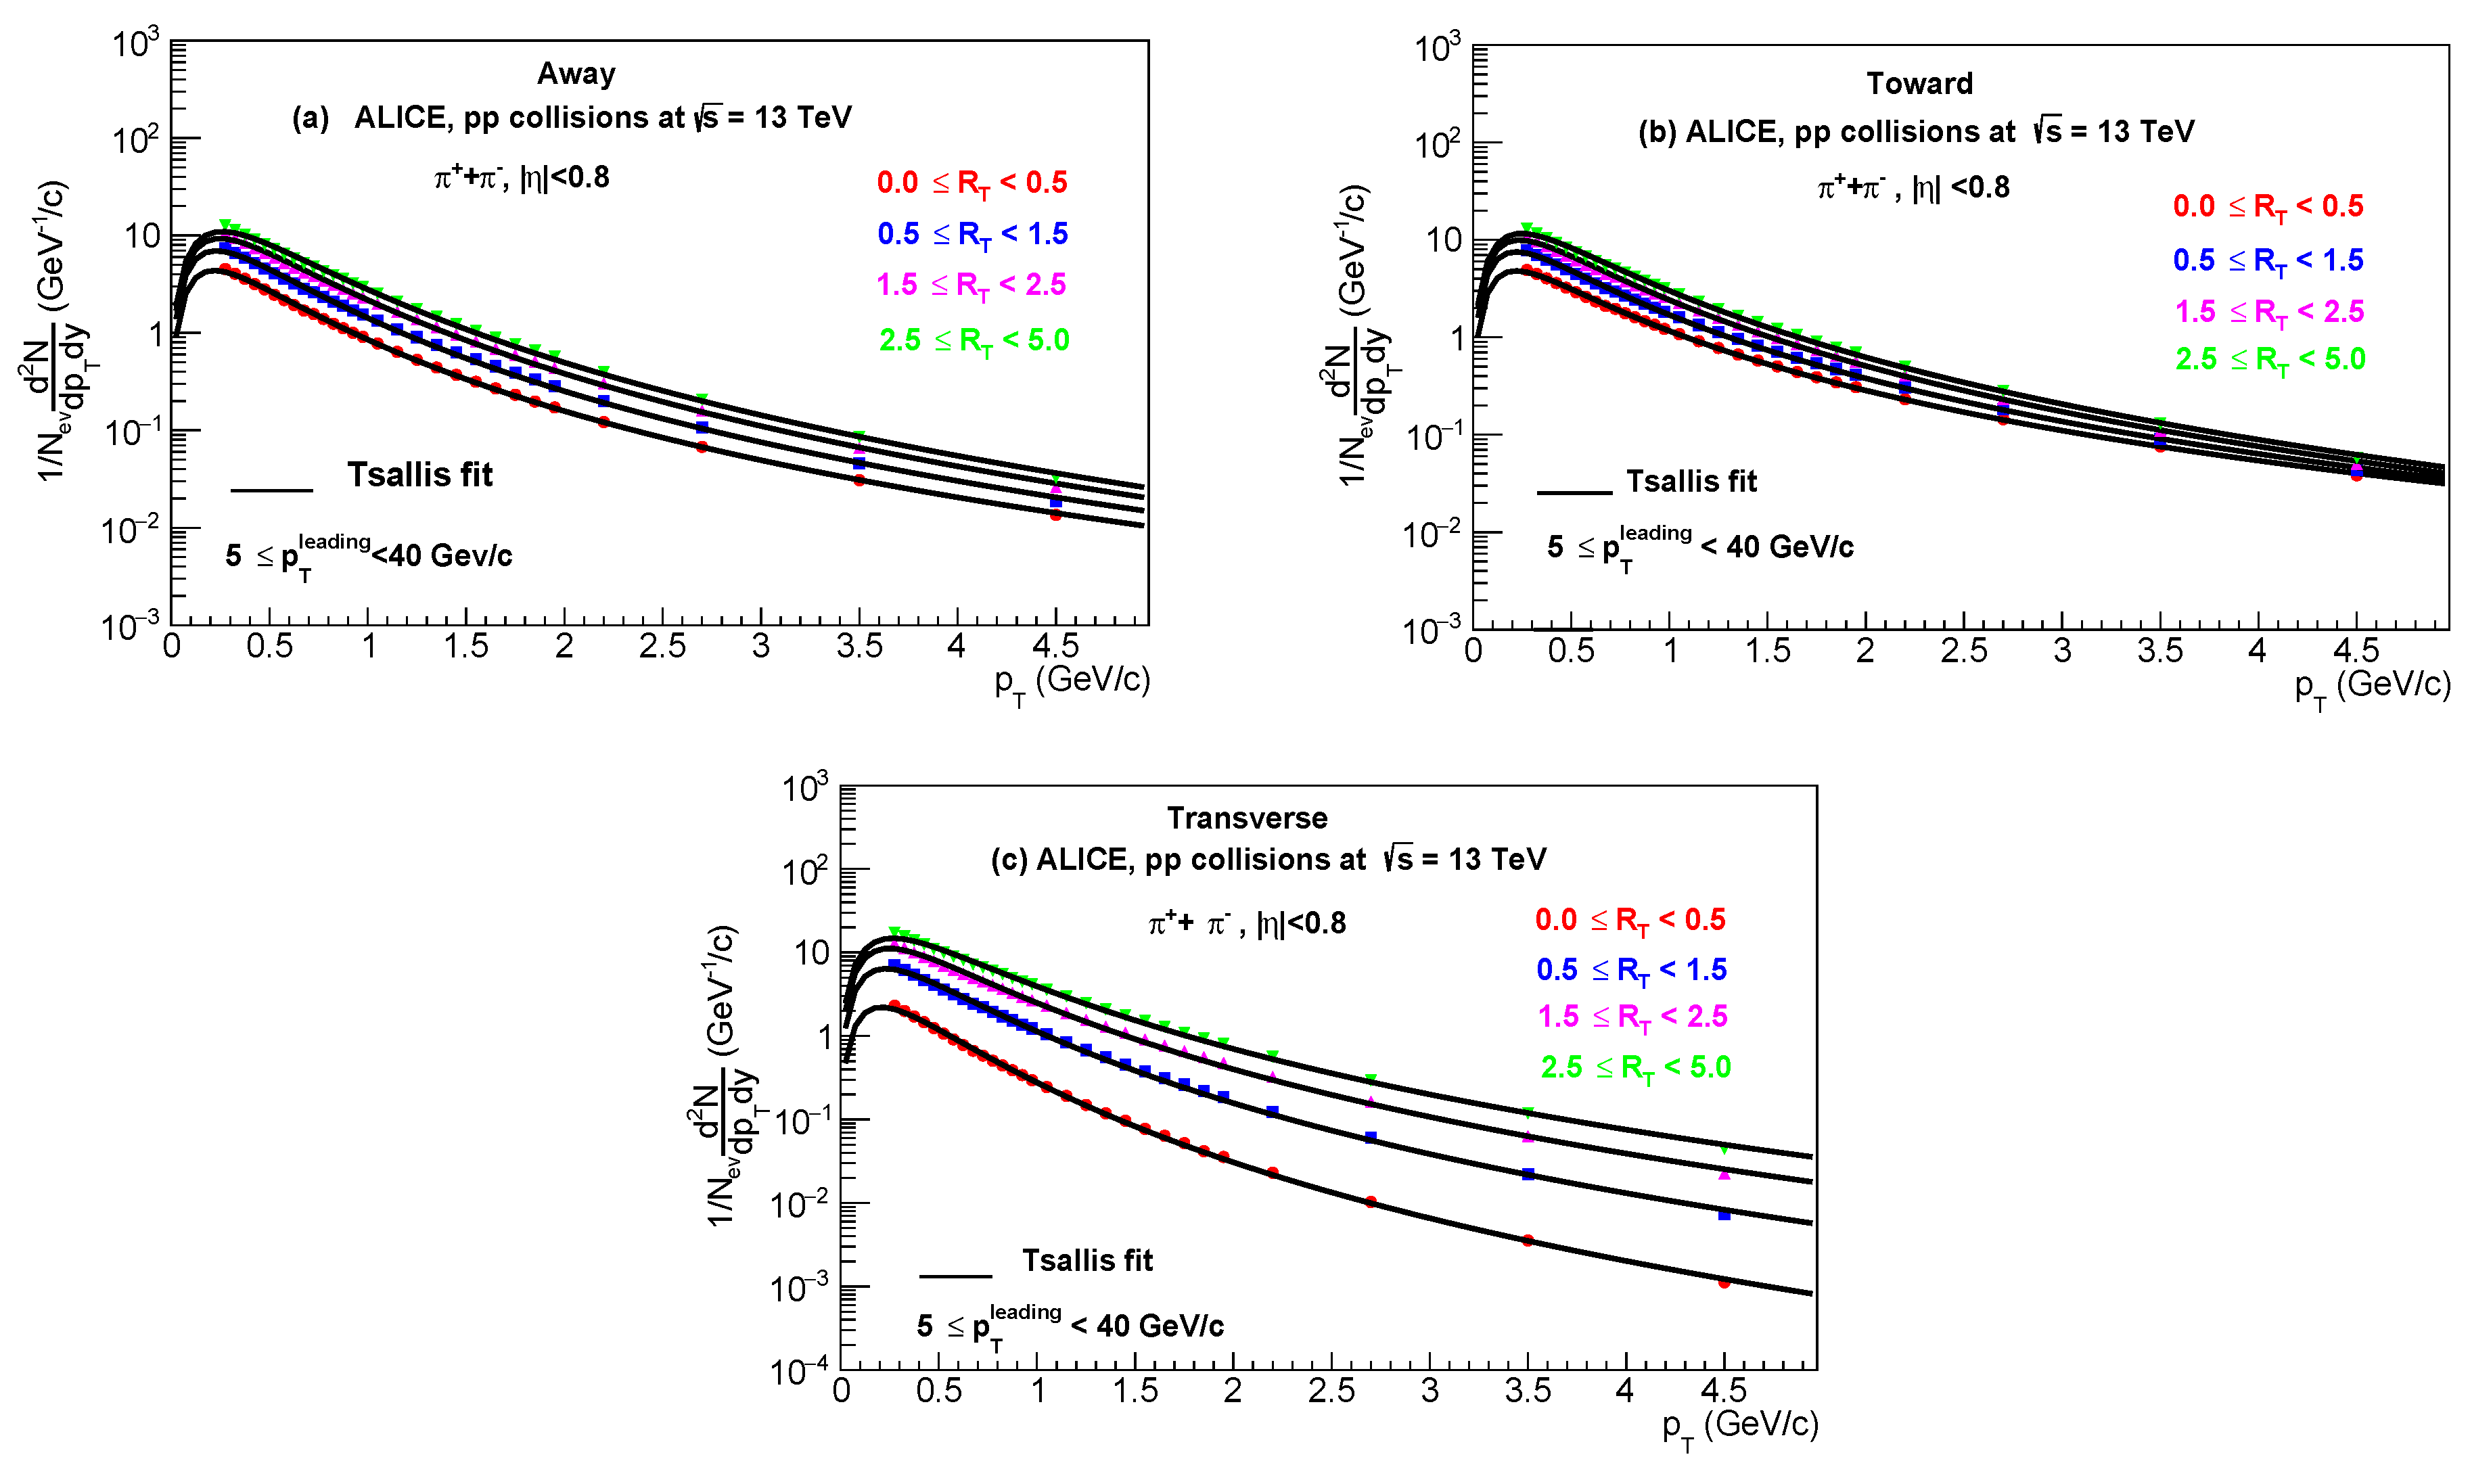
Figure 2.
Combined minimum fits (solid lines) of the transverse momentum distribution of using the Tsallis distribution function with at the center of mass energies for (a) Away, (b) Toward and (c) Transverse regions.
Figure 2.
Combined minimum fits (solid lines) of the transverse momentum distribution of using the Tsallis distribution function with at the center of mass energies for (a) Away, (b) Toward and (c) Transverse regions.
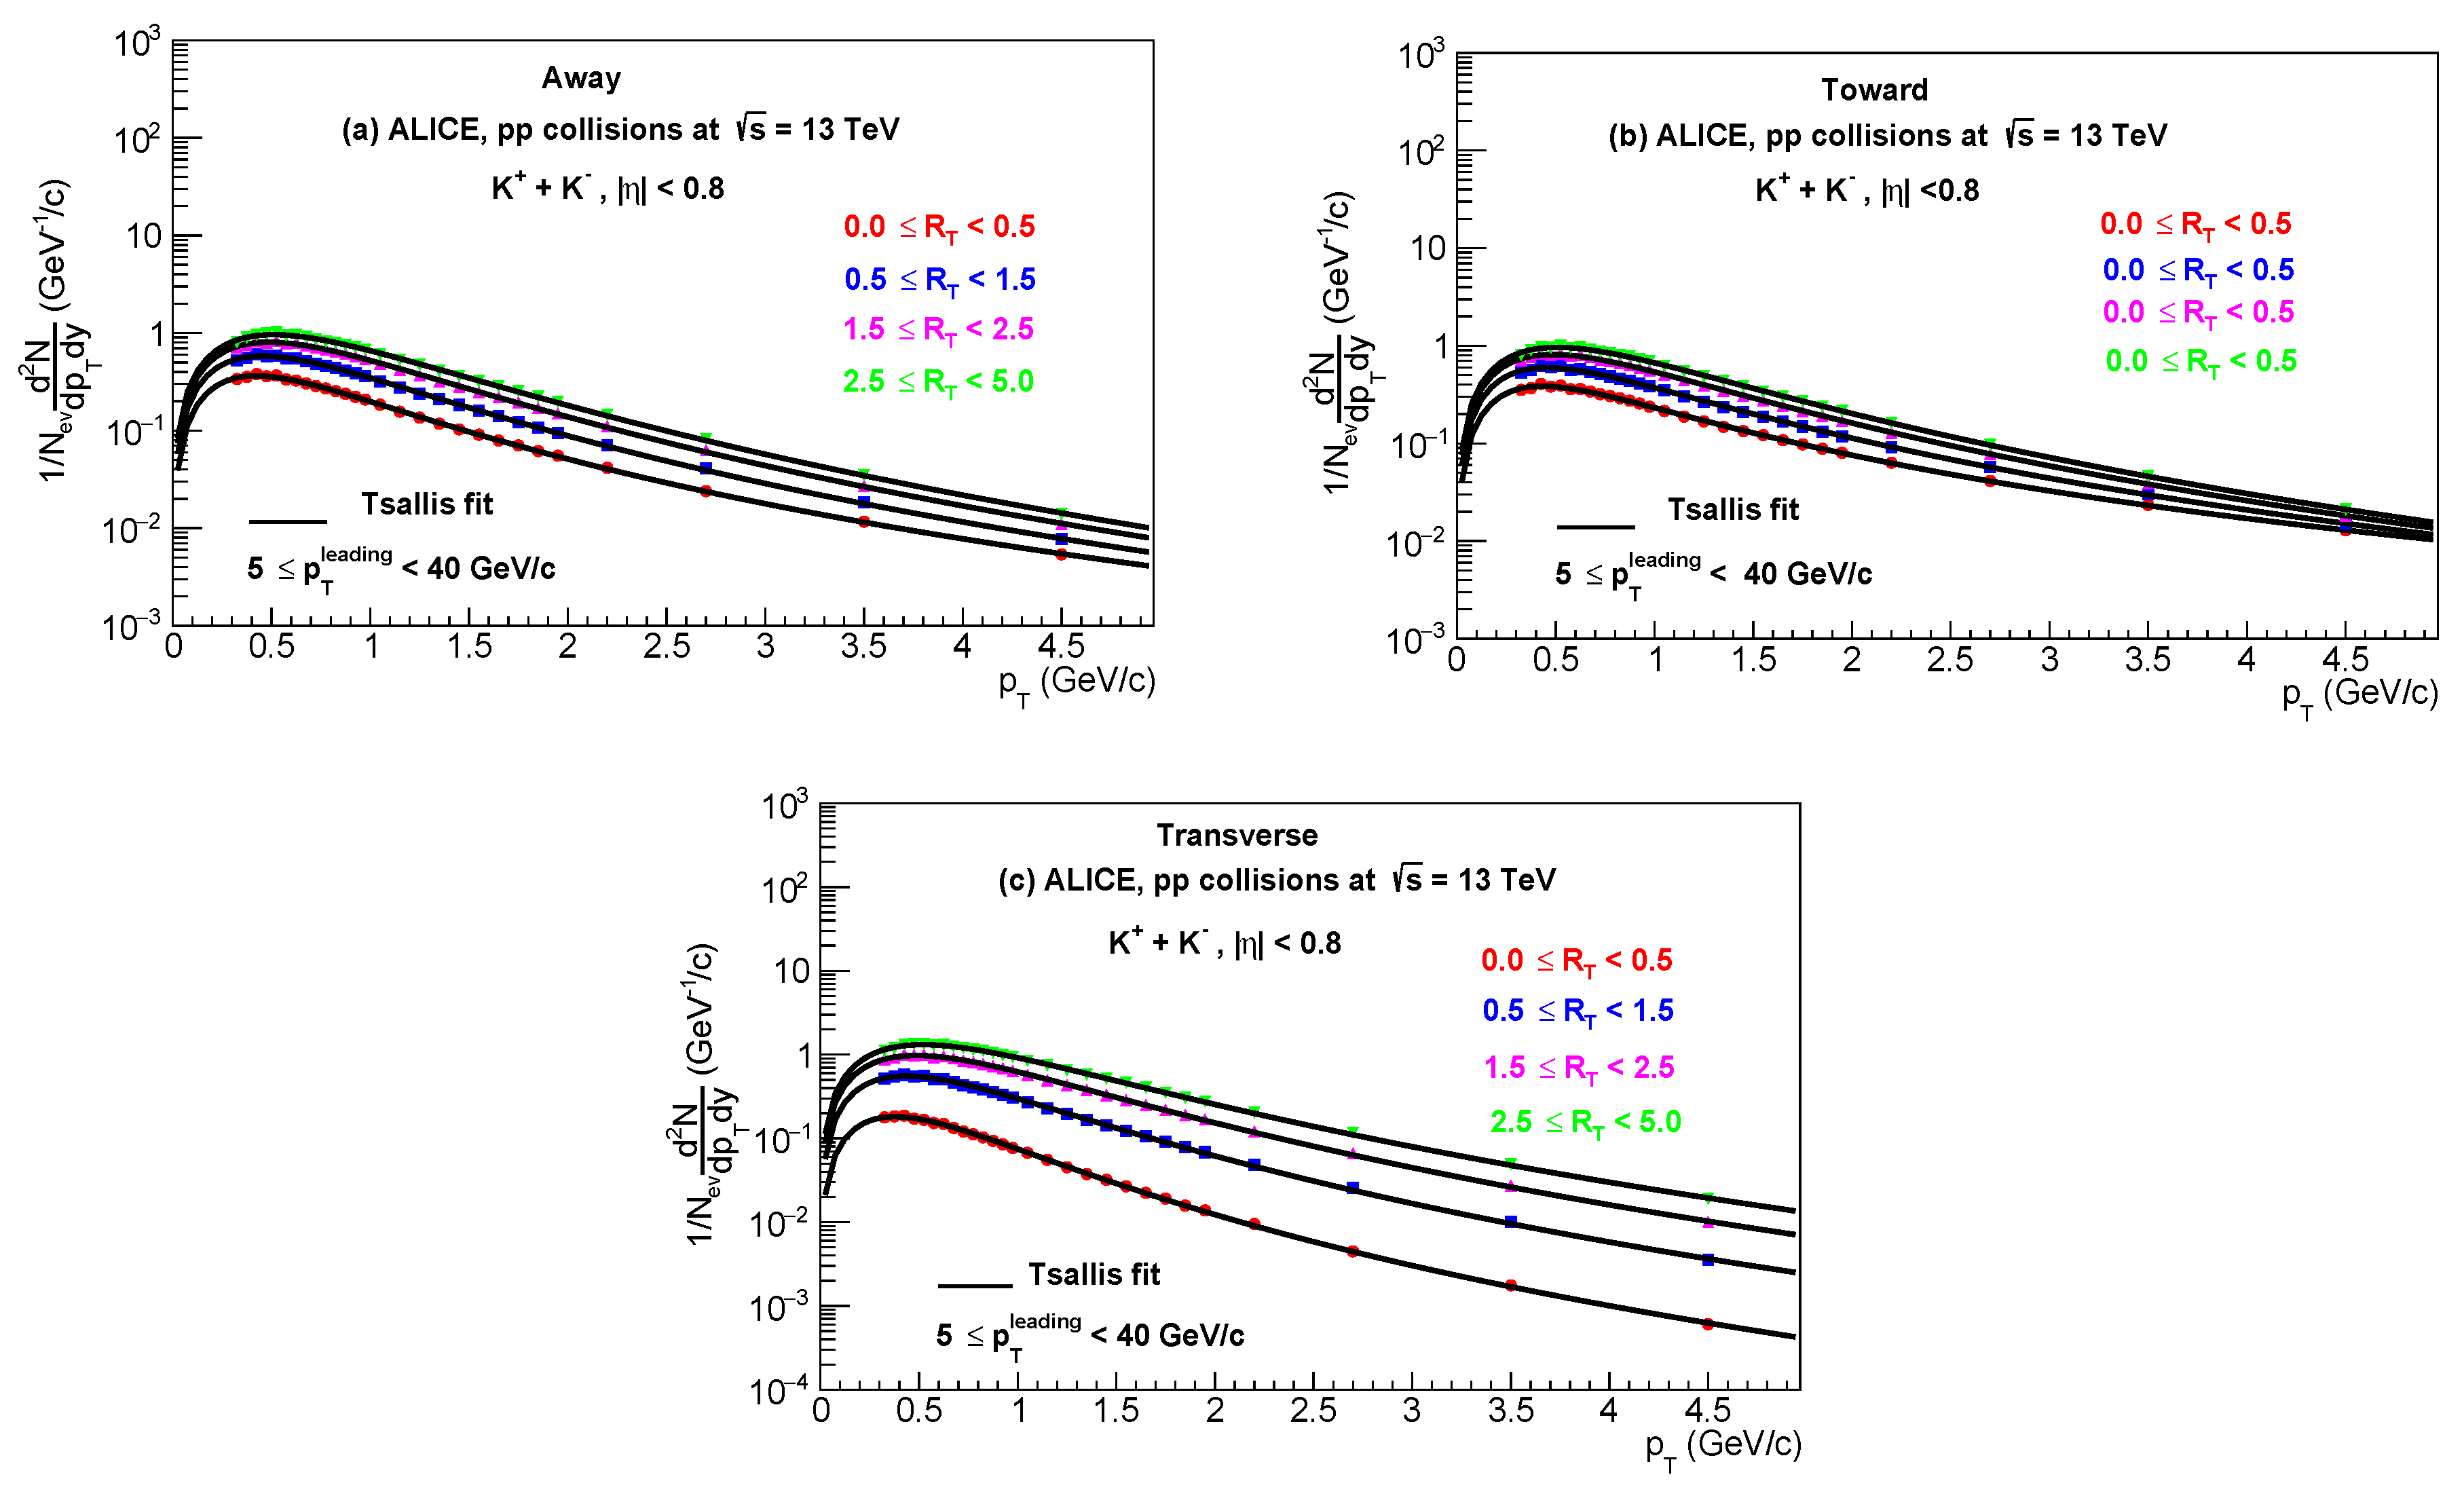
Figure 3.
Combined minimum fits (solid lines) of the transverse momentum distribution of using the Tsallis distribution function with at the center of mass energies for (a) Away, (b) Toward (c) Transverse regions.
Figure 3.
Combined minimum fits (solid lines) of the transverse momentum distribution of using the Tsallis distribution function with at the center of mass energies for (a) Away, (b) Toward (c) Transverse regions.
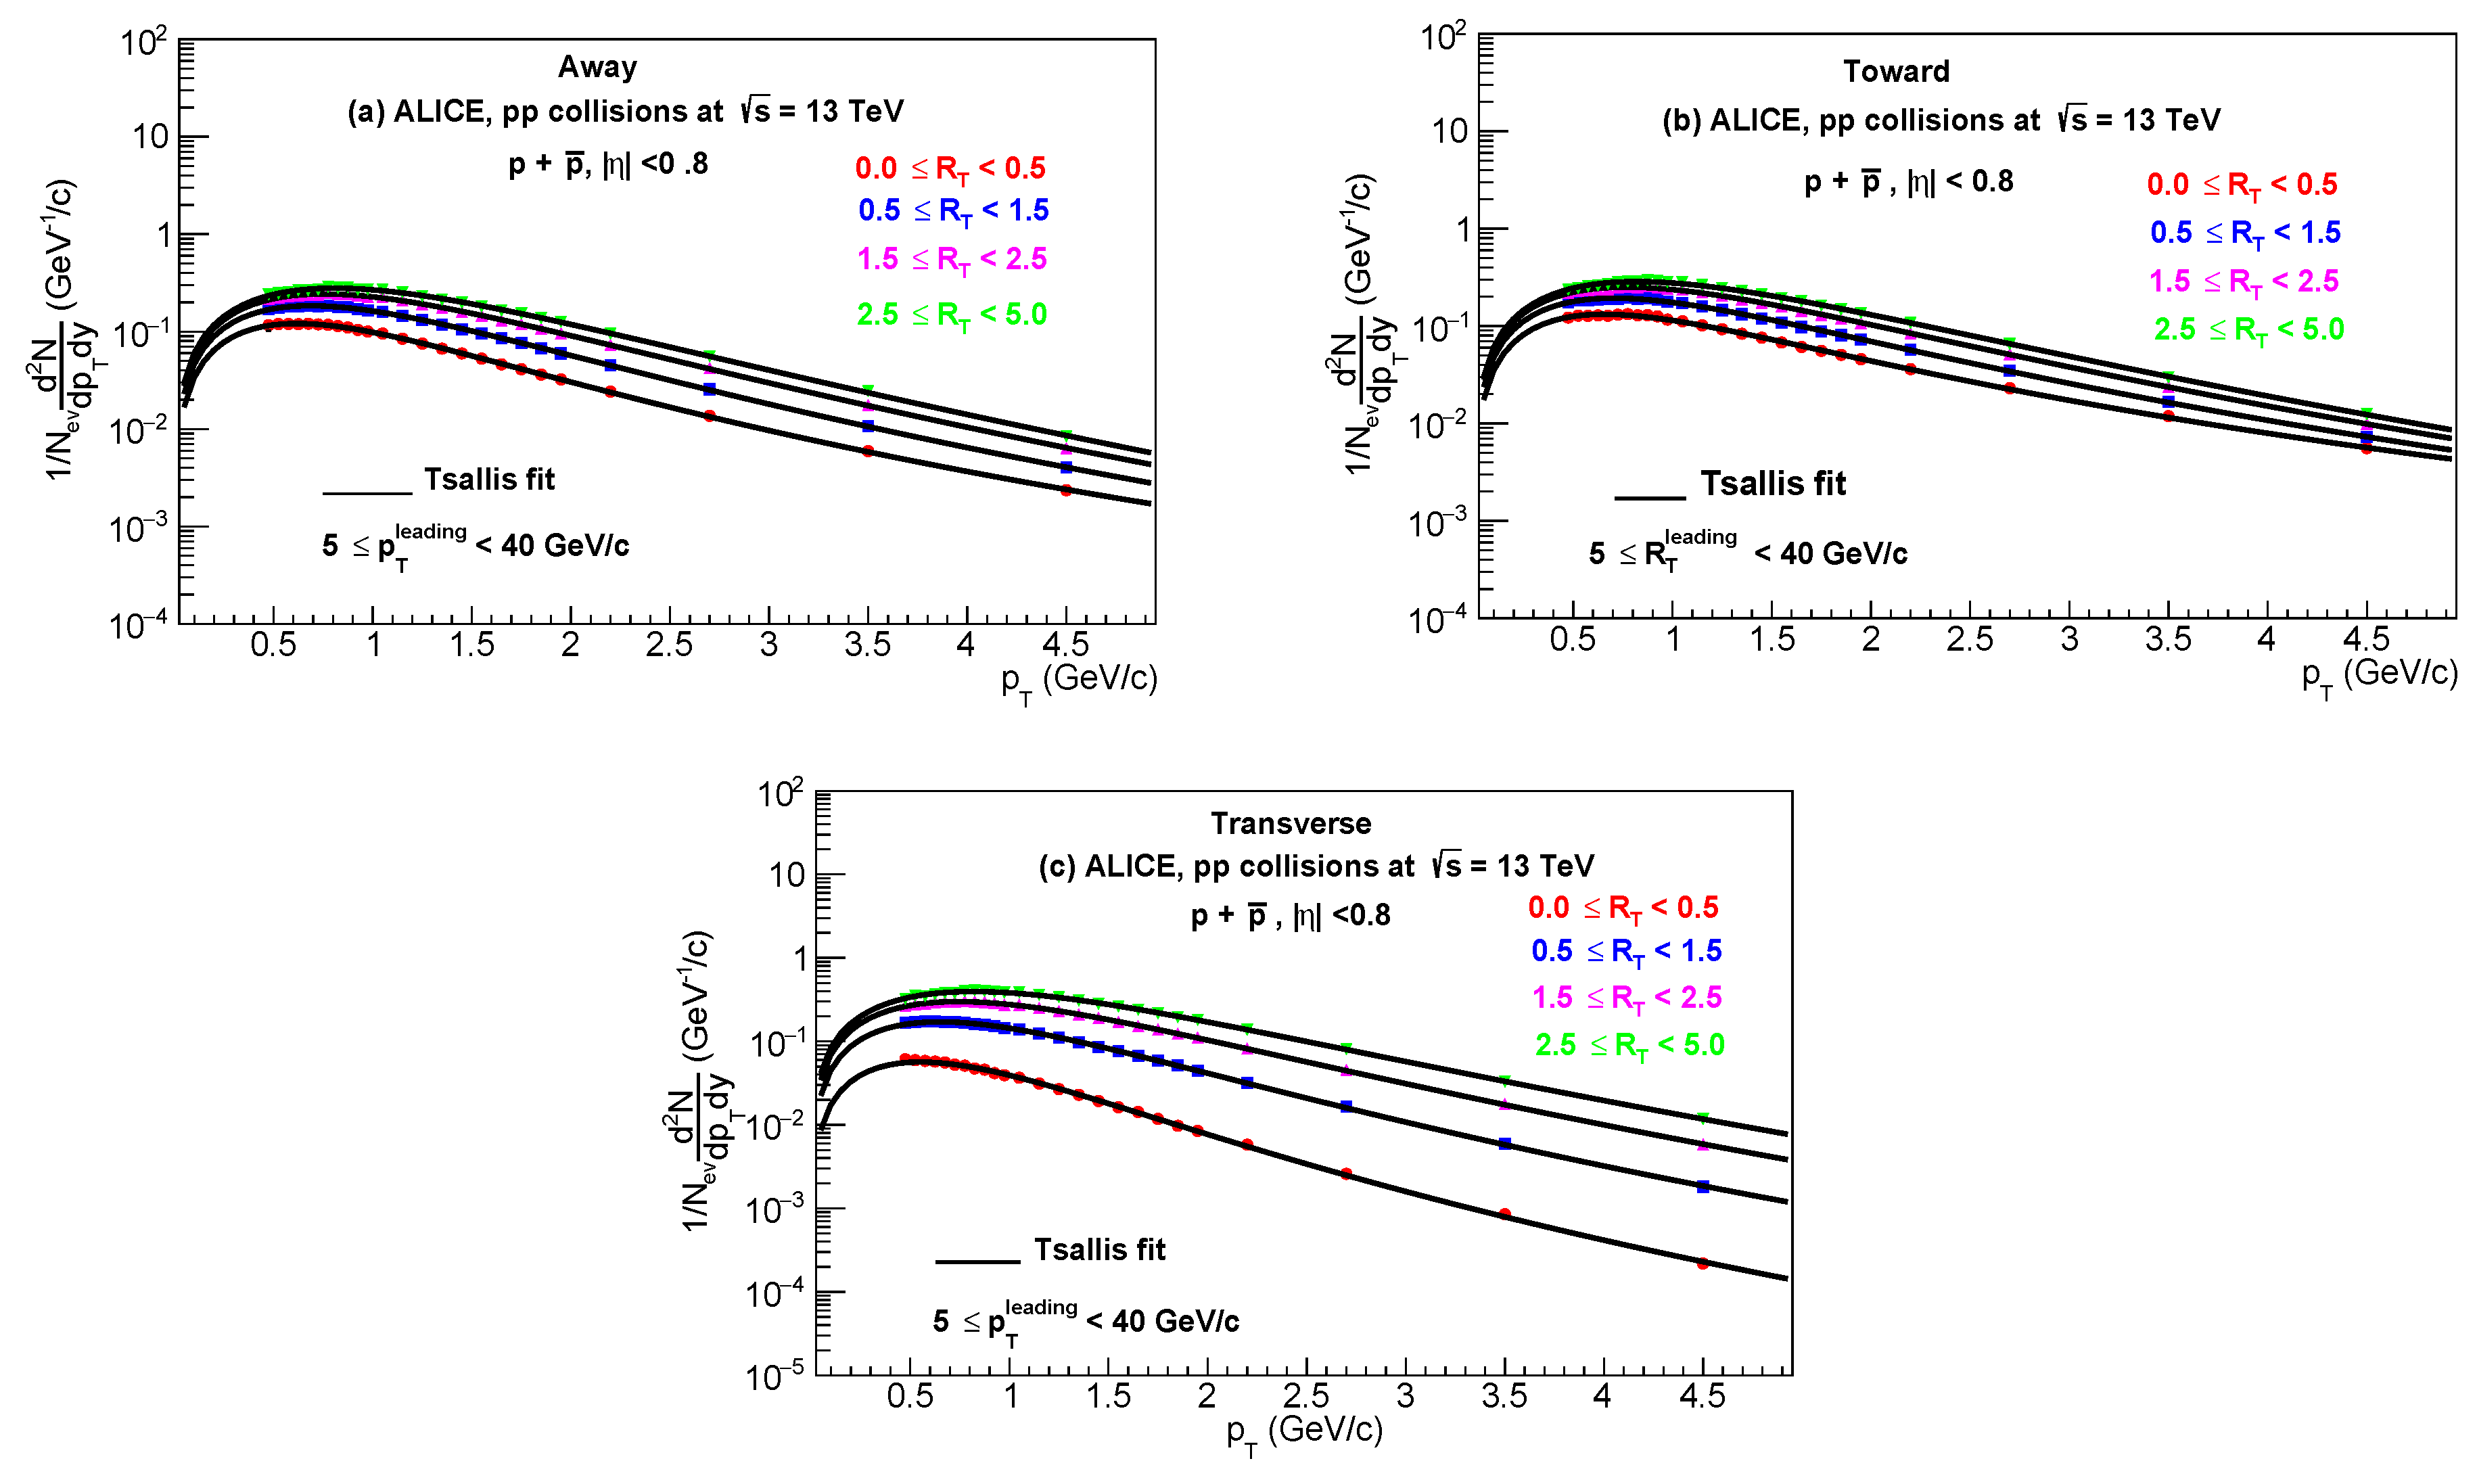
Figure 4.
Dependence of , q and on in pp collision for at for (a) Away, (b) Toward (c) and Transverse regions.
Figure 4.
Dependence of , q and on in pp collision for at for (a) Away, (b) Toward (c) and Transverse regions.
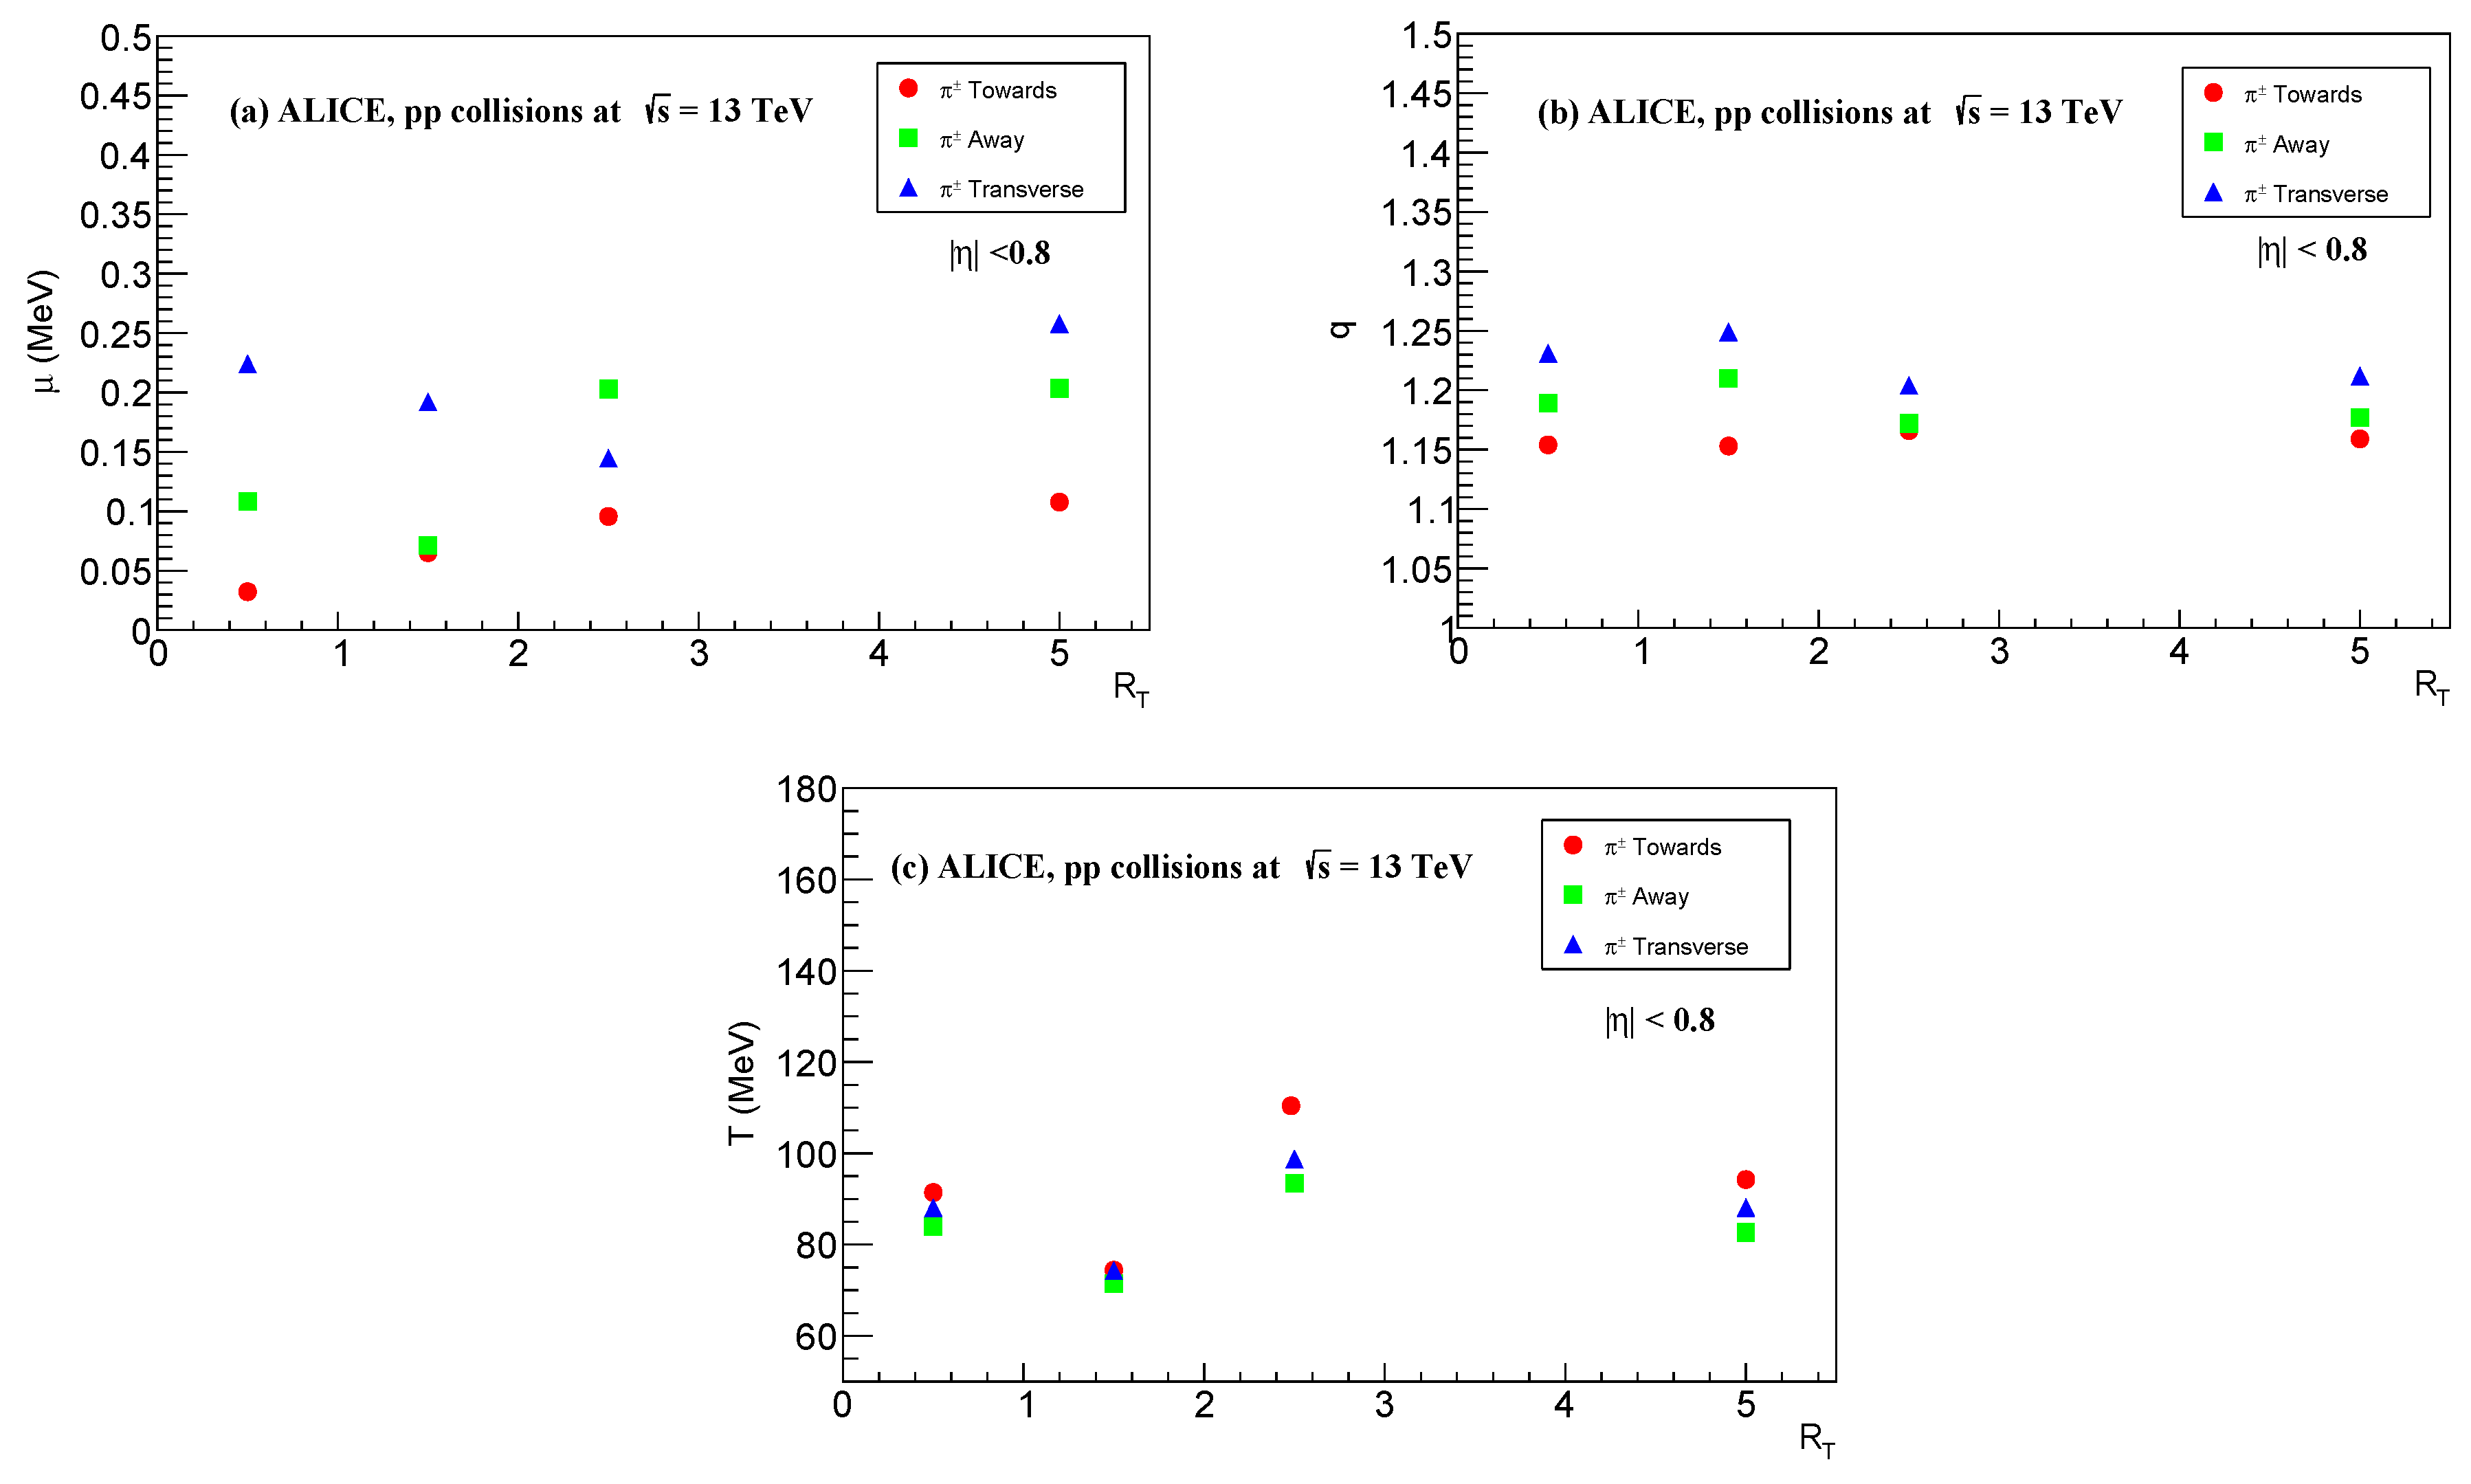
Figure 5.
Dependence of , q and on in pp collision for at for (a) Away, (b) Toward (c) and Transverse regions.
Figure 5.
Dependence of , q and on in pp collision for at for (a) Away, (b) Toward (c) and Transverse regions.
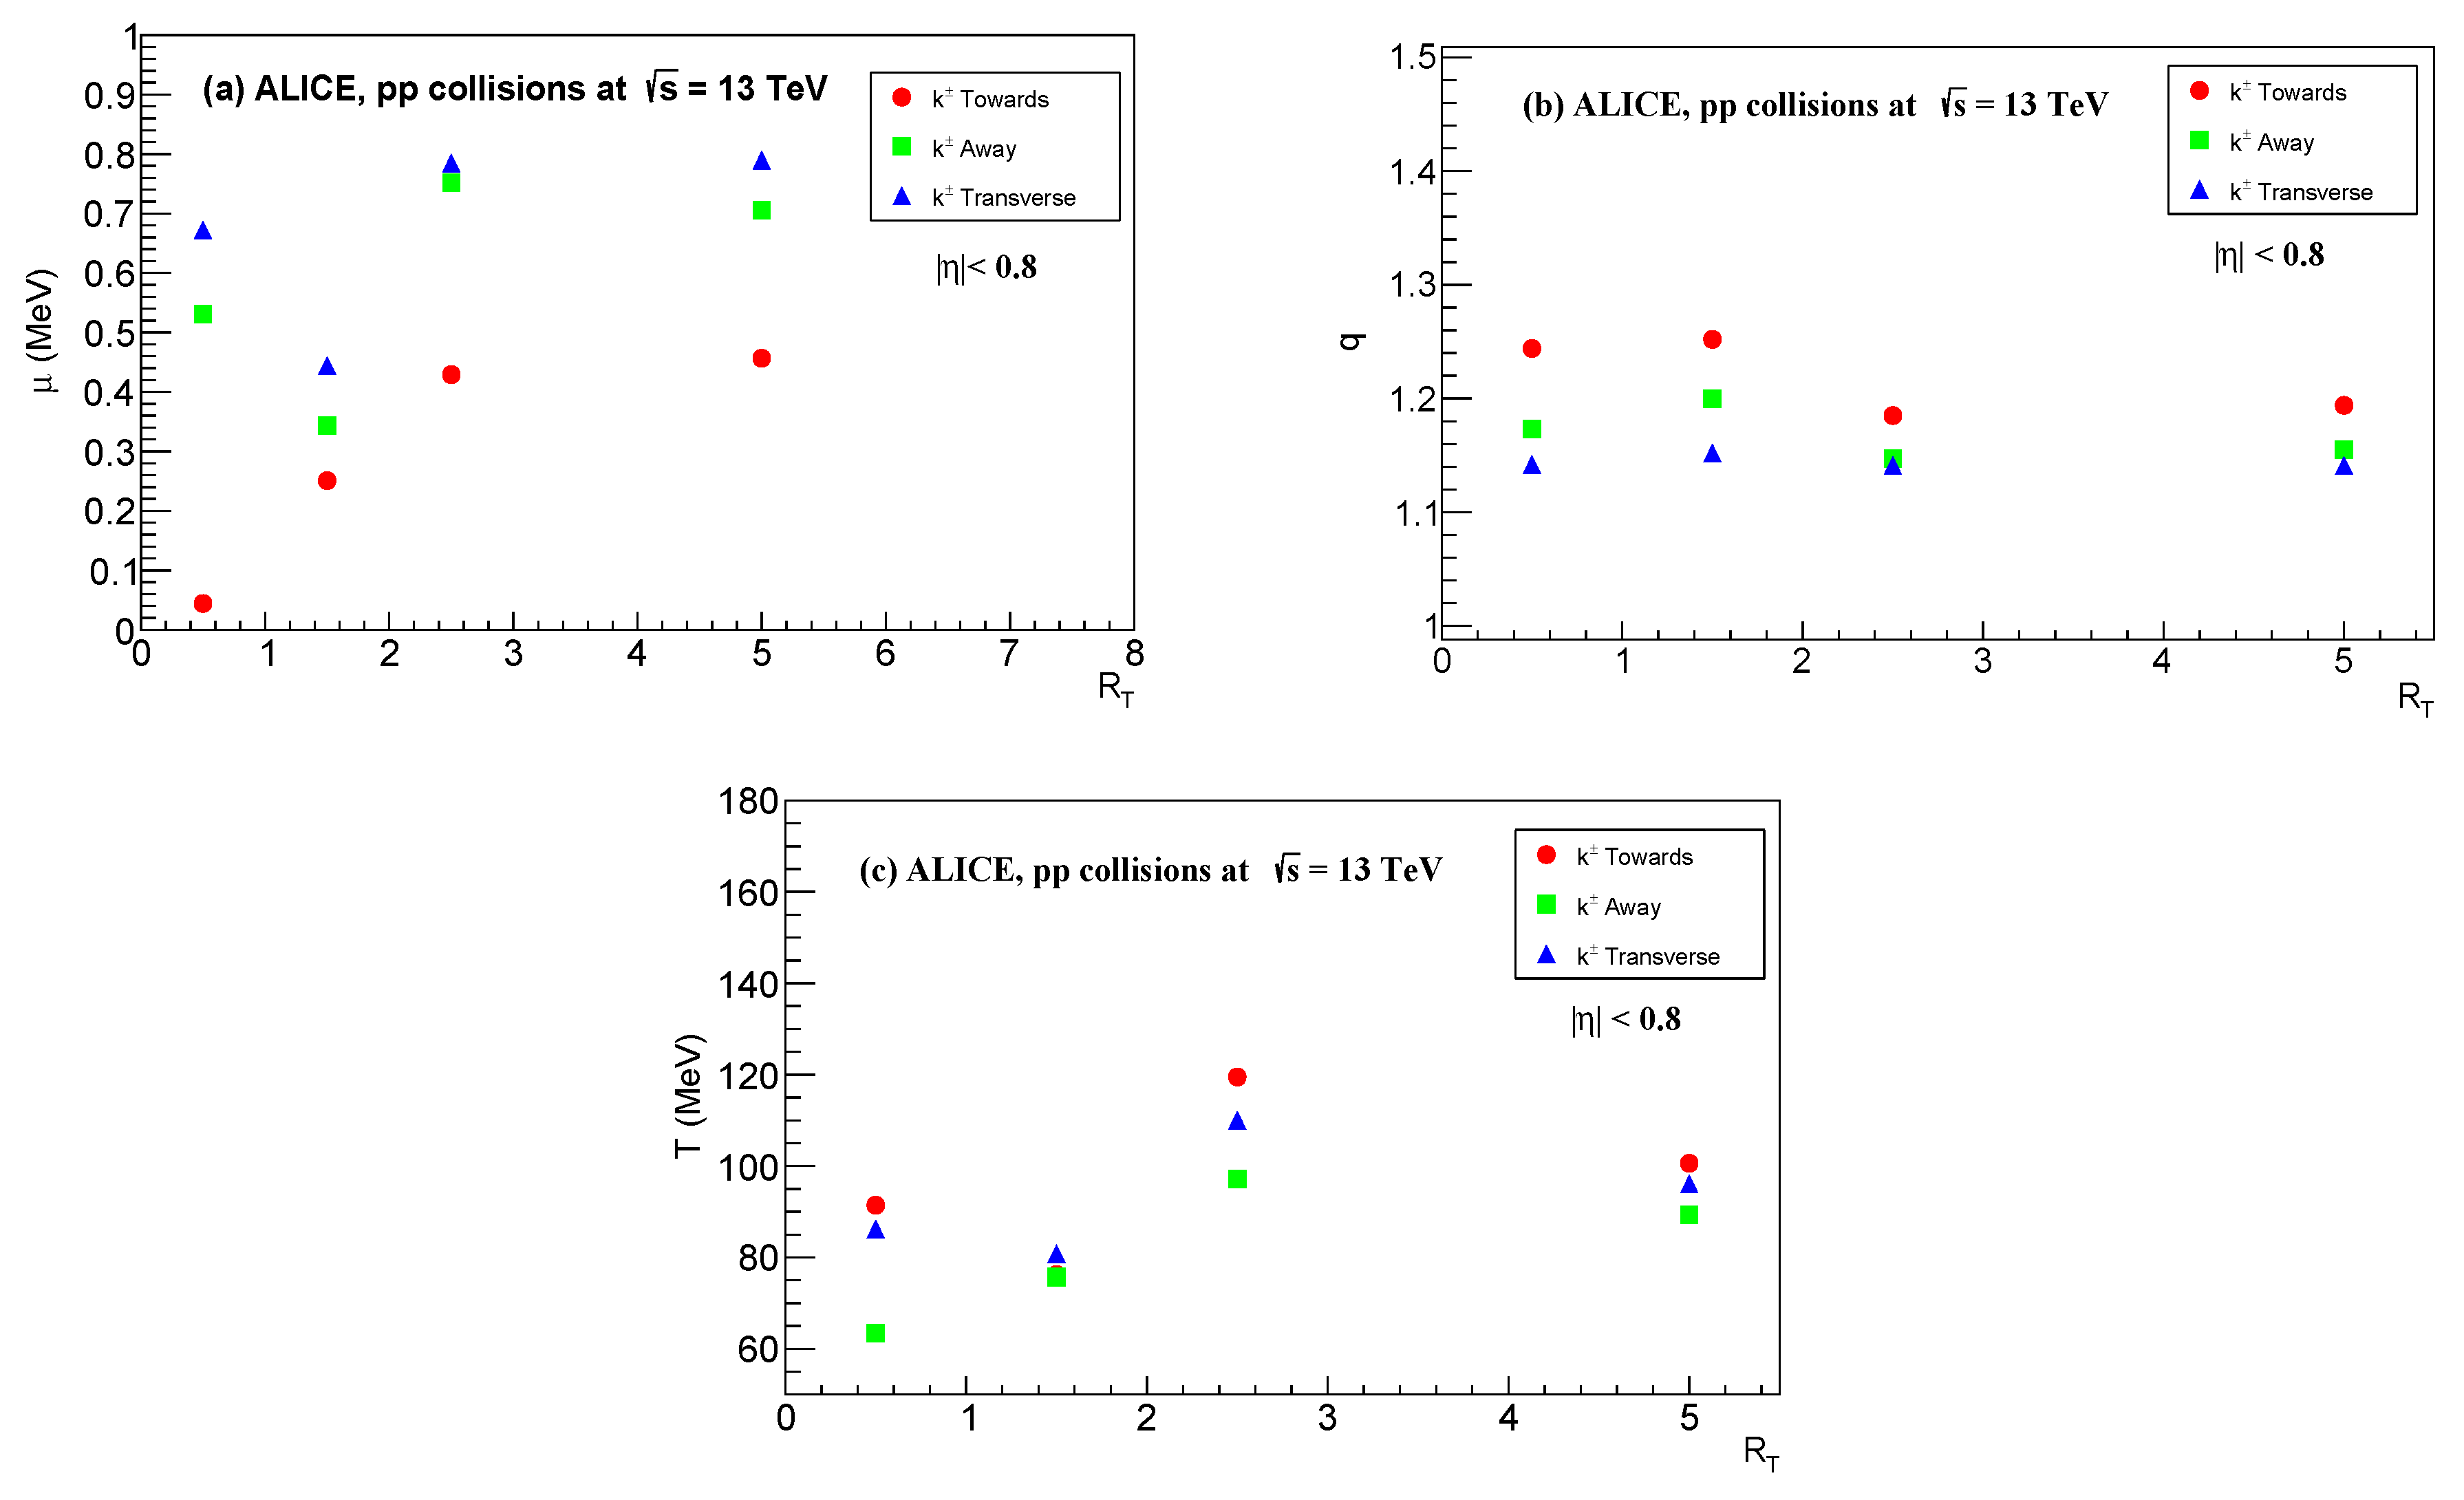
Figure 6.
Dependence of , q and on in pp collision for at for (a) Away, (b) Toward (c) and Transverse regions.
Figure 6.
Dependence of , q and on in pp collision for at for (a) Away, (b) Toward (c) and Transverse regions.
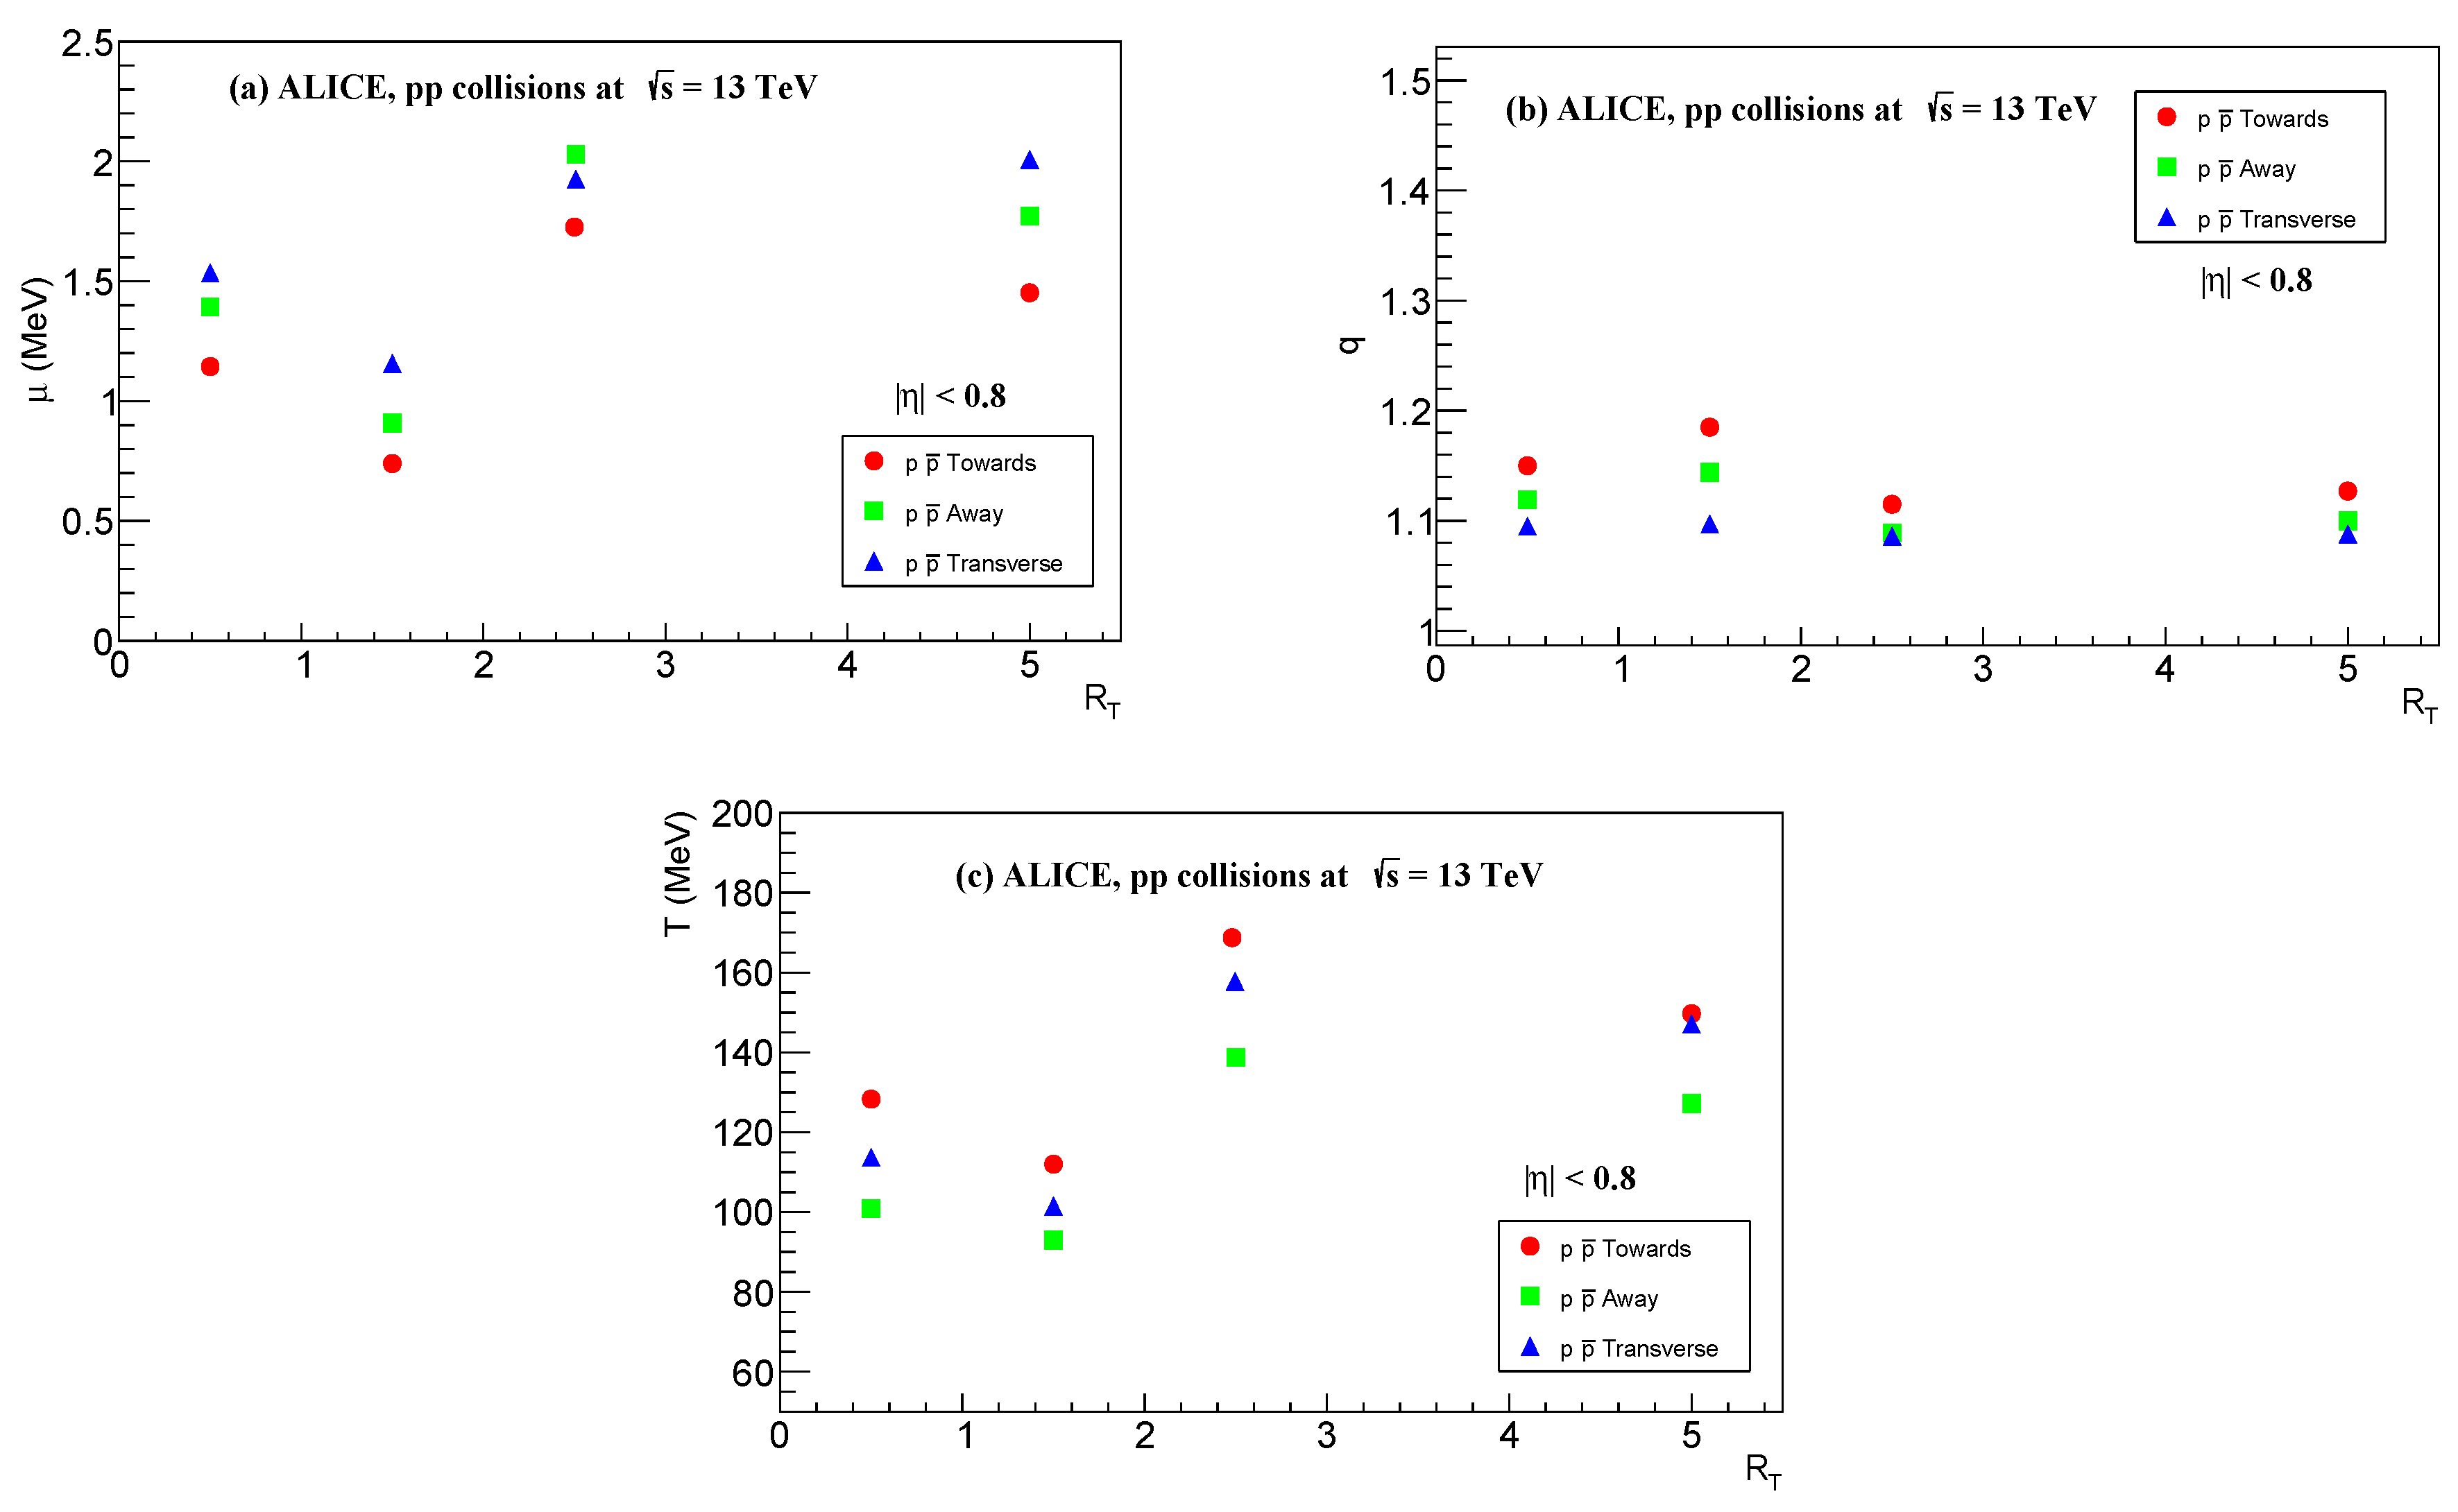

Table 1.
The thermodynamic parameters , R, q, and for in collision.
| T(GeV) | R (fm) | q | (GeV) | |||
|---|---|---|---|---|---|---|
| Away | 0.0-0.5 | 0.088±0.002 | 3.394±0.146 | 1.189±0.003 | 0.108±0.028 | 0.150 |
| 0.5-1.5 | 0.074±0.003 | 3.605±0.286 | 1.21±0.006 | 0.071±0.051 | 0.053 | |
| 1.5-2.5 | 0.098±0.003 | 3.831±0.271 | 1.172±0.005 | 0.202±0.048 | 0.179 | |
| 2.5-5.0 | 0.088±0.002 | 4.272±0.233 | 1.177±0.003 | 0.203±0.003 | 0.103 | |
| Towards | 0.0-0.5 | 0.083±0.002 | 3.181±0.136 | 1.231±0.004 | 0.032±0.028 | 0.131 |
| 0.5-1.5 | 0.071±0.003 | 3.505±0.231 | 1.249±0.007 | 0.065±0.044 | 0.212 | |
| 1.5-2.5 | 0.093±0.003 | 3.559±0.234 | 1.204±0.006 | 0.095±0.046 | 0.114 | |
| 2.5-5.0 | 0.082±0.002 | 3.983±0.206 | 1.212±0.004 | 0.107±0.034 | 0.098 | |
| Transverse | 0.0-0.5 | 0.091±0.002 | 3.703±0.166 | 1.154±0.002 | 0.224±0.028 | 1.095 |
| 0.5-1.5 | 0.074±0.002 | 3.658±0.214 | 1.153±0.002 | 0.192±0.033 | 0.839 | |
| 1.5-2.5 | 0.166±0.003 | 3.484±0.206 | 1.166±0.004 | 0.144±0.042 | 0.196 | |
| 2.5-5.0 | 0.094±0.002 | 4.583±0.209 | 1.159±0.002 | 0.257±0.030 | 0.617 |
Table 2.
The thermodynamic parameters , R, q, and ,for in collision.
| (GeV) | R (fm) | q | (GeV) | |||
|---|---|---|---|---|---|---|
| Away | 0.0-0.5 | 0.086±0.003 | 3.615±0.272 | 1.173±0.004 | 0.530±0.056 | 0.160 |
| 0.5-1.5 | 0.080±0.004 | 3.445±0.363 | 1.127±0.008 | 0.343±0.077 | 0.091 | |
| 1.5-2.5 | 0.11±0.005 | 4.031±0.389 | 1.147±0.005 | 0.751±0.080 | 0.115 | |
| 2.5-5.0 | 0.096±0.004 | 4.281±0.369 | 1.155±0.004 | 0.705±0.369 | 0.168 | |
| Towards | 0.0-0.5 | 0.063±0.002 | 3.229±0.228 | 1.244±0.007 | 0.044±0.077 | 0.163 |
| 0.5-1.5 | 0.075±0.004 | 3.268±0.284 | 1.252±0.009 | 0.250±0.067 | 0.074 | |
| 1.5-2.5 | 0.097±0.005 | 3.561±0.323 | 1.185±0.007 | 0.429±0.103 | 0.072 | |
| 2.5-5.0 | 0.089±0.002 | 3.821±0.211 | 1.194±0.005 | 0.456±0.089 | 0.071 | |
| Transverse | 0.0-0.5 | 0.091±0.003 | 4.24±0.317 | 1.142±0.003 | 0.672±0.054 | 0.445 |
| 0.5-1.5 | 0.076±0.003 | 3.66±0.315 | 1.152±0.004 | 0.444±0.055 | 0.449 | |
| 1.5-2.5 | 0.119± 0.005 | 4.191±0.376 | 1.141±0.376 | 0.784±0.076 | 0.279 | |
| 2.5-5.0 | 0.100±0.003 | 5.137±0.319 | 5.137±0.391 | 0.789±0.060 | 0.294 |
Table 3.
The thermodynamic parameters , R, q, and , for in collision.
| (GeV) | R (fm) | q | (GeV) | |||
|---|---|---|---|---|---|---|
| Away | 0.0-0.5 | 0.113±0.002 | 4.997±0.279 | 1.119±0.002 | 1.393±0.050 | 0.126 |
| 0.5-1.5 | 0.101±0.004 | 4.274±0.408 | 1.144±0.005 | 0.908±0.079 | 0.061 | |
| 1.5-2.5 | 0.167±0.004 | 6.237±0.468 | 1.089±0.002 | 2.153±0.080 | 0.523 | |
| 2.5-5.0 | 0.147±0.003 | 5.651±0.352 | 1.1±0.002 | 1.772±0.062 | 0.139 | |
| Towards | 0.0-0.5 | 0.100±0.002 | 4.239±0.239 | 1.15±0.003 | 1.144±0.050 | 0.161 |
| 0.5-1.5 | 0.092±0.004 | 3.807±0.300 | 1.185±0.005 | 0.739±0.067 | 0.198 | |
| 1.5-2.5 | 0.138±0.031 | 5.44±1.595 | 1.115±0.026 | 1.726±0.903 | 0.193 | |
| 2.5-5.0 | 0.127±0.016 | 5.065±0.962 | 1.127±0.012 | 1.452±0.223 | 0.067 | |
| Transverse | 0.0-0.5 | 0.128±0.002 | 5.806±0.329 | 1.095±0.001 | 1.534±0.049 | 0.191 |
| 0.5-1.5 | 0.112±0.002 | 4.46±0.267 | 1.097±0.001 | 1.157±0.045 | 1.199 | |
| 1.5-2.5 | 0.180±0.014 | 6.199±0.459 | 1.086±0.008 | 2.104±0.235 | 0.602 | |
| 2.5-5.0 | 0.149±0.002 | 6.739±0.378 | 1.088±0.001 | 2.008±0.055 | 0.223 |
Disclaimer/Publisher’s Note: The statements, opinions and data contained in all publications are solely those of the individual author(s) and contributor(s) and not of MDPI and/or the editor(s). MDPI and/or the editor(s) disclaim responsibility for any injury to people or property resulting from any ideas, methods, instructions or products referred to in the content. |
© 2024 by the authors. Licensee MDPI, Basel, Switzerland. This article is an open access article distributed under the terms and conditions of the Creative Commons Attribution (CC BY) license (http://creativecommons.org/licenses/by/4.0/).
Copyright: This open access article is published under a Creative Commons CC BY 4.0 license, which permit the free download, distribution, and reuse, provided that the author and preprint are cited in any reuse.


