
Submitted:
17 July 2024
Posted:
19 July 2024
You are already at the latest version
Abstract
Background: The aim of this study is to explore the independent and joint associations between physical activity (PA) and sleep duration with depressive symptoms.
Methods: We included and analyzed 18,052 participants (age ≥ 20 years) from the cross-sectional National Health and Nutrition Examination Survey (NHANES) conducted between 2007 and 2014.
Results: After adjustment, both males and females showed a significant correlation between PA, sleep duration, and depressive symptoms. In the joint association analysis, we found: 1. The interaction between PA and sleep duration was statistically significant in males but not significant in females (P=0.380). 2. Compared to individuals with the lowest PA level and not meeting the National Sleep Foundation's (NSF) guidelines, those with the highest PA level and recommended sleep duration had a 79% decrease in depression risk in males (odds ratio [OR] 0.21, 95% confidence interval [CI] 0.14-0.32) and a 74% decrease in females (OR 0.26, 95% CI 0.20-0.35). 3. In male participants adhering to NSF guidelines, each increase in PA quartile is associated with a 19% reduction in the risk of depression (OR 0.81, 95% CI 0.71-0.92). Conversely, among male participants not adhering to NSF guidelines, there is a 23% decrease in depression risk (OR 0.77, 95% CI 0.69-0.86). For female participants, the respective reductions in depression risk are 20% (OR 0.80, 95% CI 0.73-0.89) and 14% (OR 0.86, 95% CI 0.80-0.93).
Conclusion: For males, adherence to recommended sleep duration weakens the relationship between physical activity and depression, while the opposite is observed for females.
Keywords:
Physical activity
; Sleep
; Depressive symptoms
; Gender disparities
1. Introduction
Depression is a prevalent and disabling mental disorder worldwide, impacting approximately 300 million individuals.[1] The Global Burden of Disease study identifies depression as a primary contributor to the global burden of mental health-related disabilities.[2] Depression hinders individuals from realizing their full potential, results in loss of human capital investment, and is associated with premature mortality through suicide and other diseases.[1] Therefore, effective intervention strategies are crucial for the prevention or treatment of depressive symptoms.[3] A growing body of research has revealed associations between depression and various factors such as poverty,[4] sleep,[5] and physical activity.[6,7,8]
Physical activity (PA) is widely recognized as a health-promoting factor, with insufficient physical activity being a major risk factor for non-communicable diseases and having negative effects on mental health.[9] The American Cancer Society provides cancer-specific recommendations for physical activity to reduce recurrence and cancer-specific as well as overall mortality.[10] The American College of Sports Medicine has also updated its exercise guidelines for the prevention and treatment of various cancer-related outcomes, including fatigue, anxiety, depression, function, and quality of life.[11] Data from different countries support the association between physical activity and depression. Studies from the UK emphasize the importance of objectively measuring physical activity in epidemiological research on mental health,[6] a study on the US population found a relationship between questionnaire-assessed physical activity and depression,[12] and European studies suggest the mental health benefits of appropriate physical activity.[13,14,15] Meta-analyses also indicate a lower likelihood of depression in individuals with higher levels of physical activity compared to those with lower activity levels.[16]
Recently, researchers discovered a joint relationship between physical activity and sleep duration in relation to cognitive aging.[17] However, the joint effects of physical activity and sleep duration on depression remain unclear. To address this gap, this study aims to investigate the independent and joint associations of physical activity (PA) and sleep duration with depressive symptoms in a nationally representative sample of adults in the United States. Additionally, it is noteworthy that the likelihood of females experiencing depression is twice that of males,[18] and gender-specific differences in physical activity levels exist. Therefore, to minimize the potential impact of gender differences on our study, all analytical processes were conducted separately for males and females.
2. Methods
2.1. Study Population
Our data comes from a publicly available database, the National Health and Nutrition Examination Survey (NHANES), which is a nationally representative cross-sectional survey. In this study, we utilized data from NHANES 2007 to 2014 in four cycle (Figure 1). Our study included individuals aged 20 to 80 years, who possessed complete sleep questionnaires, self-reported physical activity (PA) questionnaires, Patient Health Questionnaire-9 (PHQ-9) assessments and covariate data. The final sample size comprised 18,052 individuals. Since NHANES obtained approval from the Ethics Review Board (ERB) prior to data collection and the data was publicly accessible, no further ethical review was required for our study.
2.2. Physical Activity and Sleep Duration
The assessment of physical activity was conducted using the Global Physical Activity Questionnaire (GPAQ) as the foundational tool. It evaluated three domains of physical activity: Occupational Physical Activity (OPA), Transportation Physical Activity (TPA), and Leisure-Time Physical Activity (LTPA). Specifically, questionnaires inquired about the typical weekly frequency (per week), duration (in minutes per session), and intensity (categorized as vigorous or moderate) for OPA and LTPA. The maximal intensity minutes for physical activity were doubled and subsequently added to the moderate-intensity minutes for OPA and LTPA.[19] Total PA was defined as the sum of OPA, TPA, and LTPA.[12] To assess the dose-response relationship between PA and depressive symptoms, we categorized participants into quartiles (Q1 to Q4) following the approach used by Celis-Morales et al. in their study on the relationship between physical activity and all-cause mortality,[20] separately for men and women.
Sleep habits and behaviors were assessed through the Computer-Assisted Personal Interview (CAPI) system. Participants' sleep duration was determined by the question, "How many hours of sleep do you usually get on a workday or weekday?" A recent meta-analysis, encompassing 1.1 million individuals, revealed that a quarter of the population had sleep durations shorter than recommended for their specific age, with only 5.8% exceeding the "acceptable" sleep duration.[21] Thus, we categorized participants as either " Meet NSF " or " Non-meet NSF " based on the recommended sleep duration values specific to different age groups, as advised by the NSF.[22,23]
2.3. Depressive Symptoms
The outcome of depression was assessed with the Patient Health Questionnaire (PHQ-9), which evaluated the frequency of certain symptoms experienced over the past two weeks. Responses were rated on a scale from 0 ("not at all") to 3 ("nearly every day"). These questionnaires were self-administered, the PHQ score for each participant is the sum of all answers to the PHQ question (range 0-27). We divided the participants’PHQ-9 scores into < 10 (no depression) and ≥ 10 (depression), with a sensitivity of 88% and specificity of 88%. [24,25]
2.4. Assessment of covariates
Covariates included demographic characteristics, NHANES survey years, lifestyle factors, and chronic medical conditions. Specifically, demographic characteristics comprised age (20-44, 45-65, ≥65), marital status (married or cohabitating vs. single), education level (less than college vs. college or higher), race/ethnicity (Mexican-American, other Hispanic, non-Hispanic White, non-Hispanic Black, and other), and poverty income ratio (<1, 1-1.99, 2-4, and ≥4). Lifestyle factors encompassed smoking status (yes or no) and body mass index (underweight/normal, overweight, and obese). Chronic medical conditions included hypertension, diabetes, arthritis, heart disease, stroke, and lung disease. The definitions of these chronic conditions were based on self-reports of being told by a healthcare professional or physician that they had the condition.
2.5. Patient and public involvement
Neither patients nor the general public were directly involved in the design, implementation, reporting, or dissemination of this study.
2.6. Statistical analysis
Categorical variables were presented using frequency and percentage (%). Inter-group differences were analyzed using the chi-squared test. Initially, a multivariable logistic regression model was employed to assess the independent associations between physical activity (PA), sleep duration, and depressive symptoms. To investigate whether sleep duration moderated the association between physical activity and depression, interaction terms between PA and sleep were included, and the statistical significance of the interaction was evaluated through likelihood ratio tests comparing models with and without the interaction term.
All analyses were conducted using three adjustment models: Model 1: Adjustment based on age, gender, race, education, and marital status. Model 2: In addition to Model 1, adjustments included smoking status, body mass index (BMI), and NHANES survey years. Model 3: Further adjustments were made to Model 2, including chronic disease data (hypertension, diabetes, arthritis, heart disease, stroke, and lung disease).
All analyses were carried out separately for men and women. Statistical tests were two-tailed, with statistical significance set at a p-value less than 0.05. All analyses were performed using the R statistical software (version 2023.06.1+524; www.r-project.org).
3. Results
In this study, we compiled a dataset consisting of 18,052 participants from the National Health and Nutrition Examination Survey (NHANES) for the years 2007 to 2014. Among these participants, 8,889 were male (49.24%), and 9,163 were female (50.76%) (Figure 1 and Table 1). The participants were categorized into three age groups: 7,721 (42.77%) young adults (20-44 years), 6,184 (34.26%) middle-aged adults (45-64 years), and 4,147 (22.97%) elderly adults (age ≥ 65 years). Overall, 1,676 participants (9.28%) were identified as having symptoms of depression, with 584 males and 1,092 females.
3.1. Independent Associations of Physical Activity (PA) and Sleep Duration with Symptoms of Depression
Table 2 presents the results of a multivariate logistic regression analysis, examining the independent associations of physical activity (PA) and sleep duration with symptoms of depression. After adjusting for demographic data, NHANES years, lifestyle factors, and chronic conditions, both increased physical activity and normal sleep duration were associated with a reduced risk of depression in both males and females. Specifically, in the male group, compared to those in the Q1 category of physical activity, the risk of depression decreased by 30% in the Q2 group (odds ratio [OR] 0.70, 95% confidence interval [CI] 0.55-0.90), 41% in the Q3 group (OR 0.59, 95% CI 0.46-0.77), and 51% in the Q4 group (OR 0.49, 95% CI 0.38-0.63). In the female group, the risk of depression decreased by 18% in the Q2 group (OR 0.82, 95% CI 0.68-0.98), 29% in the Q3 group (OR 0.71, 95% CI 0.58-0.86), and 41% in the Q4 group (OR 0.59, 95% CI 0.48-0.71).
Participants with normal sleep duration had a 46% lower risk of depression in the male group (OR 0.54, 95% CI 0.45-0.65) and a 51% lower risk in the female group (OR 0.49, 95% CI 0.43-0.57).
3.2. Joint Associations of PA and Sleep Duration with Symptoms of Depression
Table 3 displays the results of a multivariate logistic regression analysis, assessing the joint associations of physical activity (PA) and sleep duration with symptoms of depression, stratified by sleep duration. In the male group, a significant interaction between PA and sleep duration was observed (p-int < 0.05). Specifically, in the group with non-normal sleep duration, those in the Q2-Q4 categories of PA had a 33% reduction in the risk of depression (OR 0.67, 95% CI 0.49-0.92), 56% reduction (OR 0.44, 95% CI 0.31-0.63), and 51% reduction (OR 0.49, 95% CI 0.36-0.68), respectively. In the group with normal sleep duration, there was no statistically significant difference between the Q2 and Q3 categories (p > 0.05), but the Q4 category showed a 55% reduction in the risk of depression (OR 0.45, 95% CI 0.29-0.70). Figure 2 illustrates the joint associations between PA and sleep duration with symptoms of depression in the male group. Notably, those with the highest level of physical activity (Q4) and compliant sleep duration had a 79% reduction in the risk of depression (OR 0.21, 95% CI 0.14-0.32). Furthermore, under the same sleep duration conditions, the relationship between physical activity and the risk of depression in males exhibited a non-linear trend, modulated by sleep duration.
In the female group, there was no significant interaction between PA and sleep duration (p-int > 0.05). However, within sleep duration strata, a significant correlation was observed between higher PA and a lower risk of depression (p-trend < 0.05). Specifically, in the group with non-normal sleep duration, those in the Q2-Q4 categories of PA had a 23% reduction in the risk of depression (OR 0.77, 95% CI 0.60-0.99), 26% reduction (OR 0.74, 95% CI 0.57-0.96), and 37% reduction (OR 0.63, 95% CI 0.50-0.81), respectively. In the group with normal sleep duration, there was no statistically significant difference between the Q2 and Q3 categories (p > 0.05), but the Q4 category showed a 32% reduction in the risk of depression (OR 0.68, 95% CI 0.50-0.91) and the Q4 category showed a 48% reduction in the risk of depression (OR 0.52, 95% CI 0.38-0.70). Figure 3 presents the joint associations between PA and sleep duration with symptoms of depression in the female group. Specifically, those with the highest level of physical activity (Q4) and compliant sleep duration had a 74% reduction in the risk of depression (OR 0.26, 95% CI 0.20-0.35). Moreover, under the same sleep duration conditions, the relationship between physical activity and the risk of depression in females exhibited a linear decreasing trend, with an evident reduction in the risk of depression as PA levels increased.
4. Discussion
To the best of our knowledge, this study marks the first exploration of gender disparities in the relationship between various domains of physical activity, sleep duration, and depressive symptoms within a large-scale, nationally representative study. In this nationally representative sample of U.S. adults, substantial disparities in the quartiles of Physical Activity (PA) were observed between men and women. Notably, the prevalence of depression among women was almost twice that of men, necessitating separate analyses for each gender. In our independent associations, higher levels of physical activity and normal sleep duration were both significantly associated with a reduced risk of depressive symptoms in both men and women. Moreover, our joint association analysis revealed a significant interaction between physical activity and sleep duration in relation to depression, which was significant in men but not in women. Nevertheless, higher physical activity remained associated with a reduced risk of depression in both genders.
Depression is a prevalent, disabling mental disorder globally, and suicide rates continue to rise, making it the tenth leading cause of death in the United States.[26] Consequently, the prevention and treatment of depression are of paramount importance. A psychiatric meta-analysis on lifestyle factors found consistent evidence for the usefulness of physical activity in primary prevention and clinical treatment of various mental disorders, while also highlighting poor sleep as a risk factor for mental illnesses.[8] Park and Zarate underscored the significance of sleep and behavioral activation in the treatment of depression,[27] mirroring our findings on the independent associations between physical activity (PA), sleep duration, and depressive symptoms.
Numerous studies have linked physical activity with the prevention and treatment of depression. For instance, a Mendelian randomization analysis suggested that increasing physical activity might be an effective strategy for preventing depression.[6] A prospective cohort study highlighted the importance of reducing sedentary behavior and increasing light physical activity during adolescence as a public health intervention to reduce the incidence of depression.[7] Another cohort study revealed that even modest changes in physical activity levels among a relatively sedentary population may have substantial public mental health benefits, preventing a substantial number of new cases of depression.[28] Vancampfort et al. emphasized the necessity of interventions targeting physical inactivity and sedentary behavior, particularly in severe mental illness patients, given the established benefits of physical activity for overall health.[29] Moreover, multiple studies have identified a connection between sleep and depression. Goldstein and Walker, for instance, highlighted the role of sleep in emotional brain function as early as 2014.[30] Plante found a close association between sleep disturbances and depression, with a bidirectional relationship.[31] Ben et al. suggested that even moderate reductions in sleep duration in the general population were associated with daily increases in anxiety,[32] a related risk factor for depression. In summary, there is ample evidence supporting the role of physical activity and good sleep as beneficial lifestyle factors for mental health. A recent study of 287,282 participants from the UK Biobank further confirmed the importance of a healthy lifestyle. Researchers employed Mendelian randomization to establish a causal relationship between lifestyle and depression and discovered a wide array of brain regions and peripheral biomarkers associated with lifestyle, including the pallidum, precentral cortex, triglycerides, and C-reactive protein.[33]
Gender differences have been observed in various fields, such as cardiovascular health and physical activity. O'Neil et al. discussed the role of gender in psychosocial stress and explored potential biological pathways, with a particular focus on autonomic nervous function, which could support gender as a social determinant of cardiovascular health.[34] In the context of cardiovascular disease, Xia et al. found substantial gender disparities in primary and secondary prevention across seven geographic regions in China, especially among women.[35] Regarding physical activity, a meta-analysis revealed no gender differences in adherence to PA guidelines among adolescents but significant differences among adults and Type 2 diabetes patients, with women consistently engaging in lower levels of moderate-to-vigorous physical activity throughout the lifespan,[36] mirroring the physical activity differences observed in our study. In the context of depression, Kuehner noted that women were twice as likely to experience depression throughout their lifetime compared to men,[37] a finding consistent with our sample. Another meta-analysis suggested that gender differences in the severity of depression were more pronounced in countries with higher gender equality, with no differences in depressive symptoms; nonetheless, male depression should not be disregarded.[38] In light of these gender disparities in cardiovascular health, physical activity, and depression, our study opted for separate analyses for men and women to avoid interference from these factors. Similarly, gender differences were observed in our study as well.
Our study offers several strengths. Firstly, it draws from a large, nationally representative dataset. The sampling methodology of NHANES ensured that our sample was randomly selected and represented the entire U.S. population, enabling us to investigate the relationships between physical activity, sleep duration, and depressive symptoms in the adult population of the United States. Secondly, the sample was stratified by gender to account for differences in physical activity and depression between men and women, thereby minimizing potential biases. Thirdly, we conducted separate analyses for men and women, unveiling gender differences in the joint association between physical activity, sleep duration, and depressive symptoms. Nonetheless, our study has certain limitations. Firstly, due to its cross-sectional design, it cannot establish causation, which underscores the need for further prospective and Mendelian randomization studies to evaluate the potential role of physical activity and sleep duration in depression and validate our findings. Secondly, sleep duration, physical activity domains, and depression were self-reported, potentially introducing recall bias and lack of objectivity. Future research should involve clinical assessment data to validate our findings.
5. Conclusion
In the independent association between physical activity (PA), sleep duration, and depressive symptoms, regardless of gender, both PA and adherence to sleep time duration recommendations are significantly negatively correlated with the risk of depression. In the joint association between PA, sleep duration, and the risk of depression, recommended sleep duration attenuates the relationship between physical activity and depression in males, while the opposite is observed in females. Nevertheless, irrespective of gender and sleep duration status, a certain level of PA is associated with a lower risk of depression compared to the lowest level of PA.
References
- Patel V, Chisholm D, Parikh R, Charlson FJ, Degenhardt L, Dua T, et al. Addressing the burden of mental, neurological, and substance use disorders: key messages from Disease Control Priorities, 3rd edition. LANCET. 2016; 387: 1672-85. [CrossRef]
- Global, regional, and national burden of 12 mental disorders in 204 countries and territories, 1990-2019: a systematic analysis for the Global Burden of Disease Study 2019. Lancet Psychiatry. 2022; 9: 137-50.
- Malhi GS, Mann JJ. Depression. LANCET. 2018; 392: 2299-312.
- Lund C, De Silva M, Plagerson S, Cooper S, Chisholm D, Das J, et al. Poverty and mental disorders: breaking the cycle in low-income and middle-income countries. LANCET. 2011; 378: 1502-14. [CrossRef]
- Baglioni C, Nanovska S, Regen W, Spiegelhalder K, Feige B, Nissen C, et al. Sleep and mental disorders: A meta-analysis of polysomnographic research. PSYCHOLOGICAL BULLETIN. 2016; 142: 969-90. [CrossRef]
- Choi KW, Chen CY, Stein MB, Klimentidis YC, Wang MJ, Koenen KC, et al. Assessment of Bidirectional Relationships Between Physical Activity and Depression Among Adults: A 2-Sample Mendelian Randomization Study. JAMA Psychiatry. 2019; 76: 399-408.
- Kandola A, Lewis G, Osborn D, Stubbs B, Hayes JF. Depressive symptoms and objectively measured physical activity and sedentary behaviour throughout adolescence: a prospective cohort study. Lancet Psychiatry. 2020; 7: 262-71. [CrossRef]
- Firth J, Solmi M, Wootton RE, Vancampfort D, Schuch FB, Hoare E, et al. A meta-review of "lifestyle psychiatry": the role of exercise, smoking, diet and sleep in the prevention and treatment of mental disorders. World Psychiatry. 2020; 19: 360-80. [CrossRef]
- Guthold R, Stevens GA, Riley LM, Bull FC. Worldwide trends in insufficient physical activity from 2001 to 2016: a pooled analysis of 358 population-based surveys with 1.9 million participants. Lancet Global Health. 2018; 6: e1077-86. [CrossRef]
- Rock CL, Thomson CA, Sullivan KR, Howe CL, Kushi LH, Caan BJ, et al. American Cancer Society nutrition and physical activity guideline for cancer survivors. CA-A CANCER JOURNAL FOR CLINICIANS. 2022; 72: 230-62. [CrossRef]
- Schmitz KH, Campbell AM, Stuiver MM, Pinto BM, Schwartz AL, Morris GS, et al. Exercise is medicine in oncology: Engaging clinicians to help patients move through cancer. CA-A CANCER JOURNAL FOR CLINICIANS. 2019; 69: 468-84. [CrossRef]
- He F, Li Y, Hu Z, Zhang H. Association of domain-specific physical activity with depressive symptoms: A population-based study. EUROPEAN PSYCHIATRY. 2022; 66: e5. [CrossRef]
- Espana-Romero V, Artero EG, Lee DC, Sui X, Baruth M, Ruiz JR, et al. A prospective study of ideal cardiovascular health and depressive symptoms. PSYCHOSOMATICS. 2013; 54: 525-35. [CrossRef]
- Hughes KC, Gao X, Molsberry S, Valeri L, Schwarzschild MA, Ascherio A. Physical activity and prodromal features of Parkinson disease. NEUROLOGY. 2019; 93: e2157-69. [CrossRef]
- Chang SC, Pan A, Kawachi I, Okereke OI. Risk factors for late-life depression: A prospective cohort study among older women. PREVENTIVE MEDICINE. 2016; 91: 144-51. [CrossRef]
- Schuch FB, Vancampfort D, Firth J, Rosenbaum S, Ward PB, Silva ES, et al. Physical Activity and Incident Depression: A Meta-Analysis of Prospective Cohort Studies. AMERICAN JOURNAL OF PSYCHIATRY. 2018; 175: 631-48. [CrossRef]
- Bloomberg M, Brocklebank L, Hamer M, Steptoe A. Joint associations of physical activity and sleep duration with cognitive ageing: longitudinal analysis of an English cohort study. The Lancet Healthy Longevity. 2023; 4: e345-53. [CrossRef]
- Kessler RC, Berglund P, Demler O, Jin R, Koretz D, Merikangas KR, et al. The epidemiology of major depressive disorder: results from the National Comorbidity Survey Replication (NCS-R). JAMA-JOURNAL OF THE AMERICAN MEDICAL ASSOCIATION. 2003; 289: 3095-105.
- Divney AA, Murillo R, Rodriguez F, Mirzayi CA, Tsui EK, Echeverria SE. Diabetes Prevalence by Leisure-, Transportation-, and Occupation-Based Physical Activity Among Racially/Ethnically Diverse U.S. Adults. DIABETES CARE. 2019; 42: 1241-7. [CrossRef]
- Celis-Morales CA, Lyall DM, Anderson J, Iliodromiti S, Fan Y, Ntuk UE, et al. The association between physical activity and risk of mortality is modulated by grip strength and cardiorespiratory fitness: evidence from 498 135 UK-Biobank participants. EUROPEAN HEART JOURNAL. 2017; 38: 116-22. [CrossRef]
- Kocevska D, Lysen TS, Dotinga A, Koopman-Verhoeff ME, Luijk M, Antypa N, et al. Sleep characteristics across the lifespan in 1.1 million people from the Netherlands, United Kingdom and United States: a systematic review and meta-analysis. Nature Human Behaviour. 2021; 5: 113-22.
- Hirshkowitz M, Whiton K, Albert SM, Alessi C, Bruni O, DonCarlos L, et al. National Sleep Foundation's sleep time duration recommendations: methodology and results summary. Sleep Health. 2015; 1: 40-3.
- Hirshkowitz M, Whiton K, Albert SM, Alessi C, Bruni O, DonCarlos L, et al. National Sleep Foundation's updated sleep duration recommendations: final report. Sleep Health. 2015; 1: 233-43. [CrossRef]
- Kroenke K, Spitzer RL, Williams JB. The PHQ-9: validity of a brief depression severity measure. JOURNAL OF GENERAL INTERNAL MEDICINE. 2001; 16: 606-13.
- Spitzer RL, Kroenke K, Williams JB. Validation and utility of a self-report version of PRIME-MD: the PHQ primary care study. Primary Care Evaluation of Mental Disorders. Patient Health Questionnaire. JAMA-JOURNAL OF THE AMERICAN MEDICAL ASSOCIATION. 1999; 282: 1737-44.
- Kessler RC, Petukhova M, Sampson NA, Zaslavsky AM, Wittchen HU. Twelve-month and lifetime prevalence and lifetime morbid risk of anxiety and mood disorders in the United States. INTERNATIONAL JOURNAL OF METHODS IN PSYCHIATRIC RESEARCH. 2012; 21: 169-84. [CrossRef]
- Park LT, Zarate CJ. Depression in the Primary Care Setting. NEW ENGLAND JOURNAL OF MEDICINE. 2019; 380: 559-68.
- Harvey SB, Overland S, Hatch SL, Wessely S, Mykletun A, Hotopf M. Exercise and the Prevention of Depression: Results of the HUNT Cohort Study. AMERICAN JOURNAL OF PSYCHIATRY. 2018; 175: 28-36. [CrossRef]
- Vancampfort D, Firth J, Schuch FB, Rosenbaum S, Mugisha J, Hallgren M, et al. Sedentary behavior and physical activity levels in people with schizophrenia, bipolar disorder and major depressive disorder: a global systematic review and meta-analysis. World Psychiatry. 2017; 16: 308-15.
- Goldstein AN, Walker MP. The role of sleep in emotional brain function. Annual Review of Clinical Psychology. 2014; 10: 679-708. [CrossRef]
- Plante DT. The Evolving Nexus of Sleep and Depression. AMERICAN JOURNAL OF PSYCHIATRY. 2021; 178: 896-902. [CrossRef]
- Ben SE, Rossi A, Harvey AG, Walker MP. Overanxious and underslept. Nature Human Behaviour. 2020; 4: 100-10.
- Zhao Y, Yang L, Sahakian BJ, Langley C, Zhang W, Kuo K, et al. The brain structure, immunometabolic and genetic mechanisms underlying the association between lifestyle and depression. Nature Mental Health. 2023; 1: 736-50.
- O'Neil A, Scovelle AJ, Milner AJ, Kavanagh A. Gender/Sex as a Social Determinant of Cardiovascular Risk. CIRCULATION. 2018; 137: 854-64. [CrossRef]
- Xia S, Du X, Guo L, Du J, Arnott C, Lam C, et al. Sex Differences in Primary and Secondary Prevention of Cardiovascular Disease in China. CIRCULATION. 2020; 141: 530-9. [CrossRef]
- Whipple MO, Pinto AJ, Abushamat LA, Bergouignan A, Chapman K, Huebschmann AG, et al. Sex Differences in Physical Activity Among Individuals With Type 2 Diabetes Across the Life Span: A Systematic Review and Meta-analysis. DIABETES CARE. 2022; 45: 2163-77. [CrossRef]
- Kuehner C. Why is depression more common among women than among men? Lancet Psychiatry. 2017; 4: 146-58.
- Salk RH, Hyde JS, Abramson LY. Gender differences in depression in representative national samples: Meta-analyses of diagnoses and symptoms. PSYCHOLOGICAL BULLETIN. 2017; 143: 783-822. [CrossRef]
Figure 1.
Flow diagram of the included survey participants.
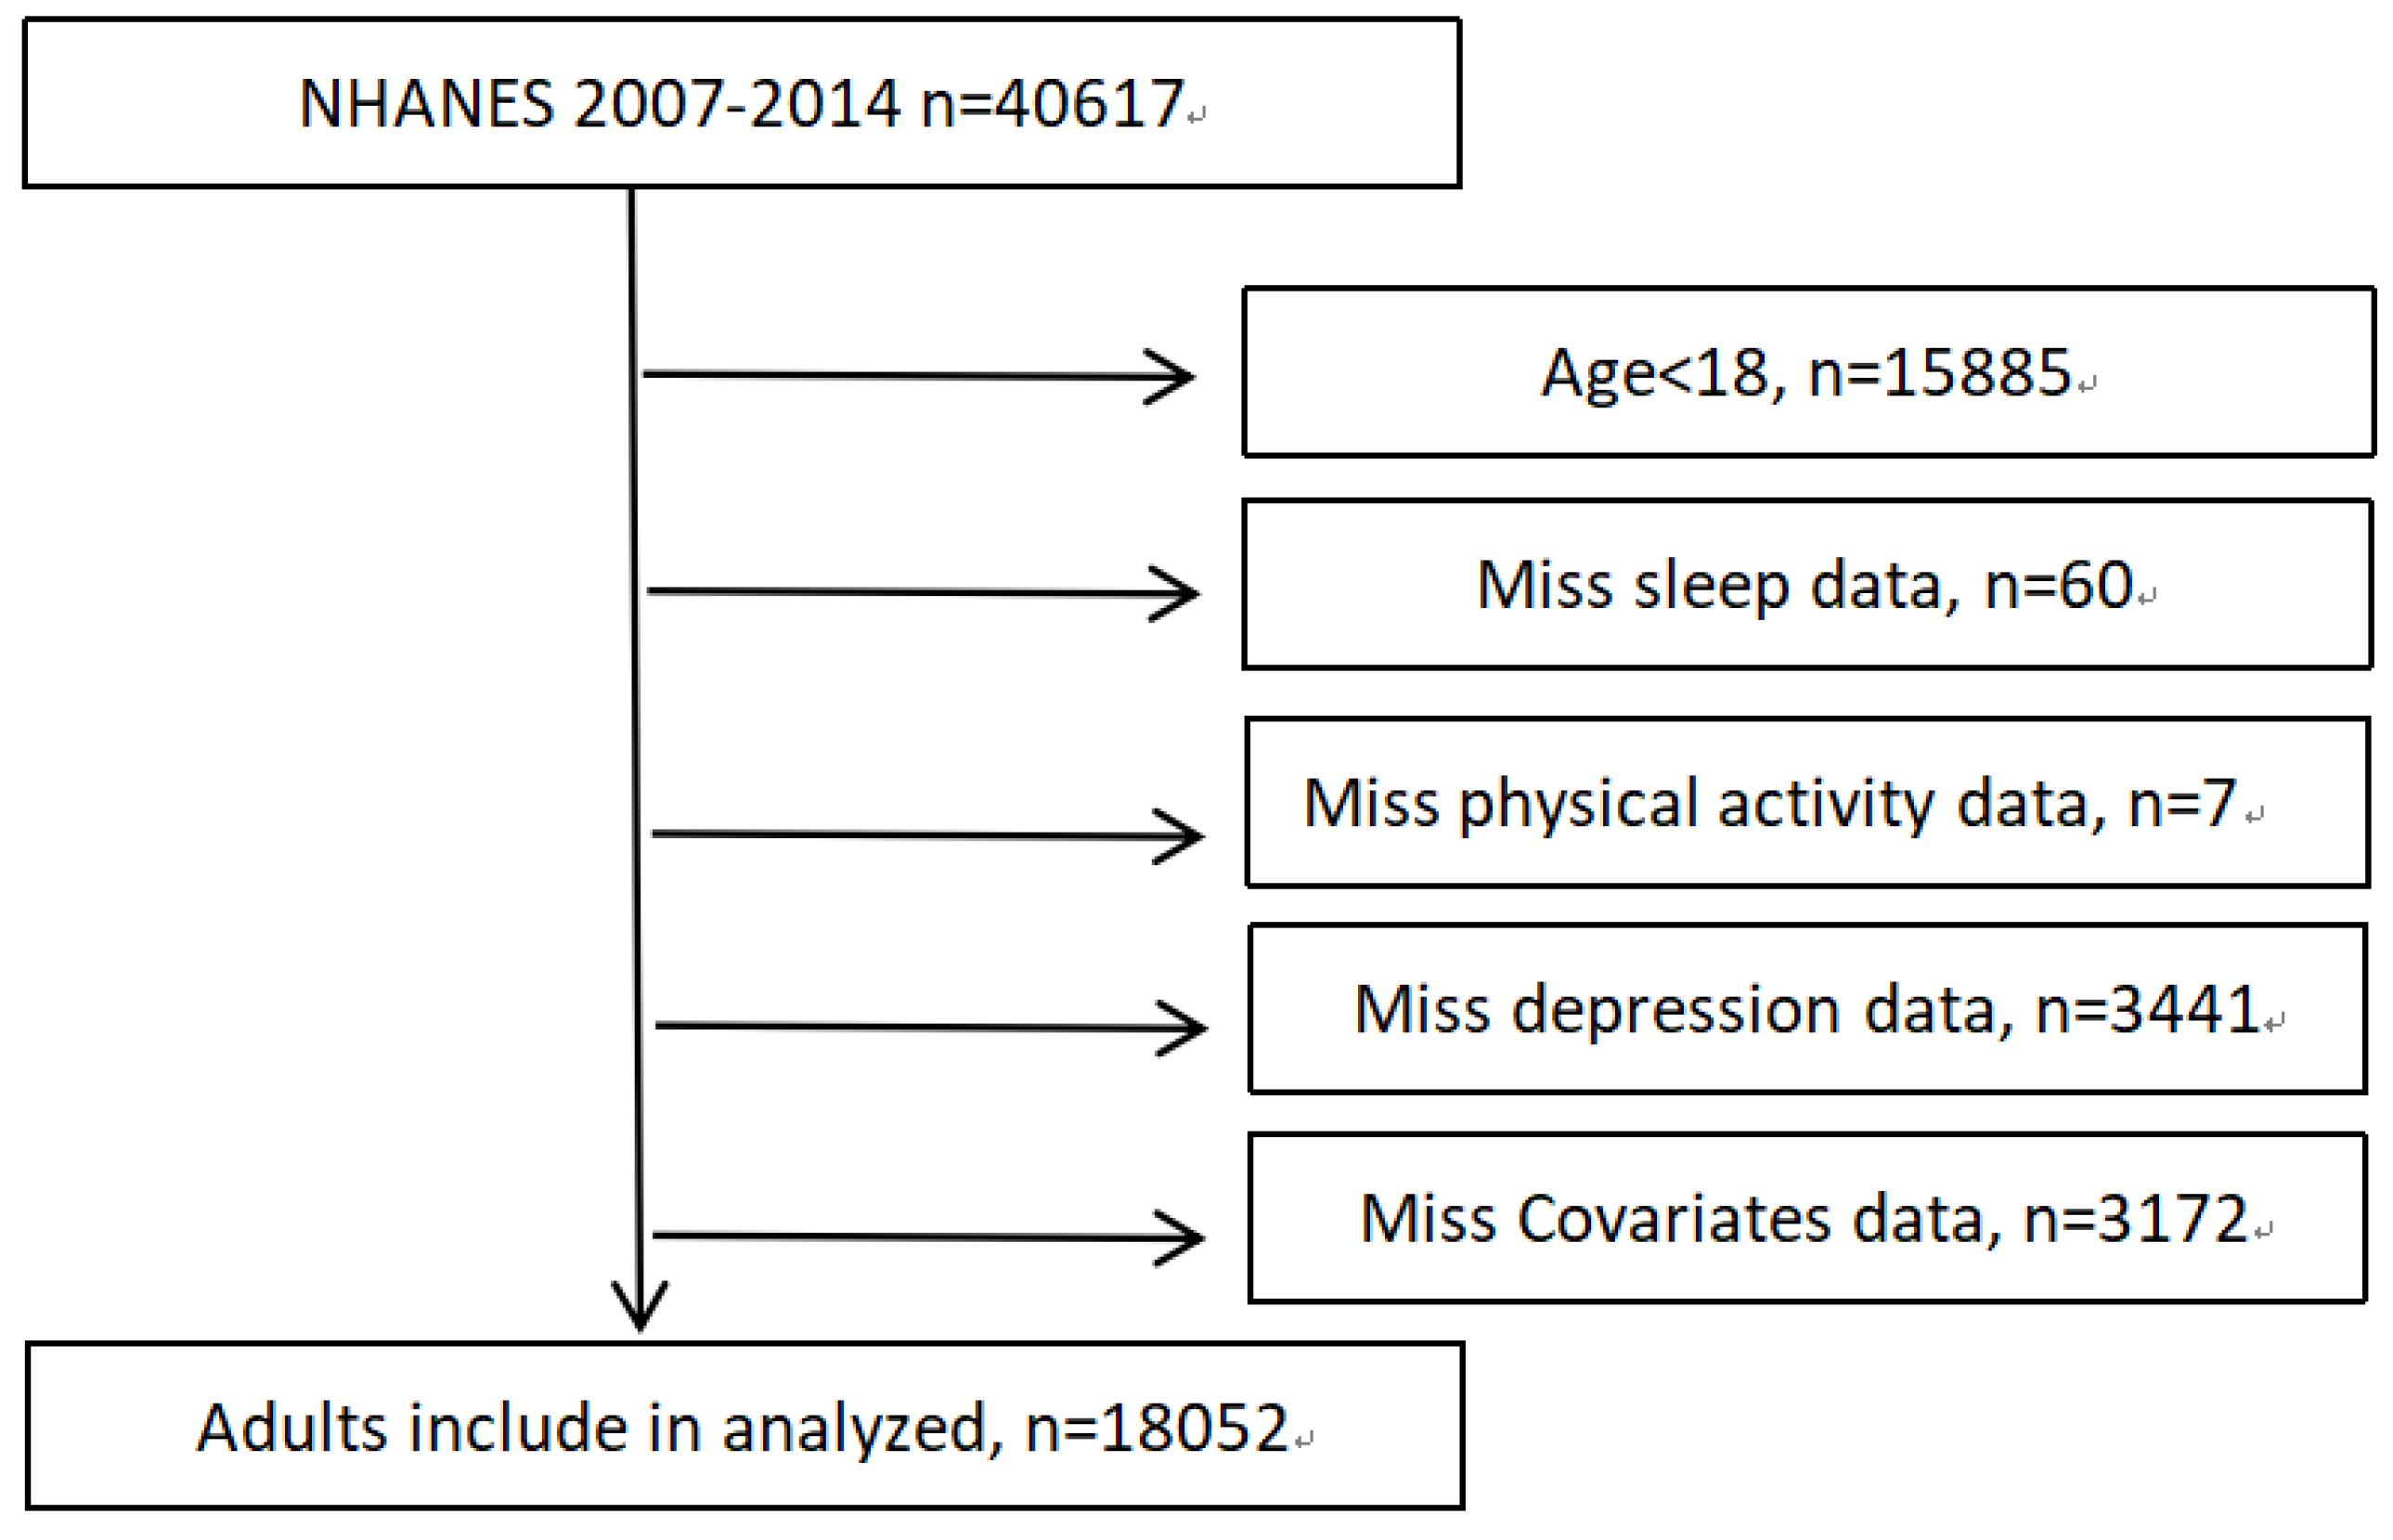
Figure 2.
Association between depressive symptoms and physical activity within sleep duration in male group. Data presented as hazard ratio (95% CI), adjusted for age, race, education level, marital status, poverty ratio, smoking status, BMI, years of NHANES, stroke, diabetes, arthritis pulmonary disease, hypertension and heart disease. Q4 represents highly active individuals and Q1 highly inactive individuals. Individuals in the lowest quartile of physical activity (Q1) and non-normal sleep duration were used as the reference group.
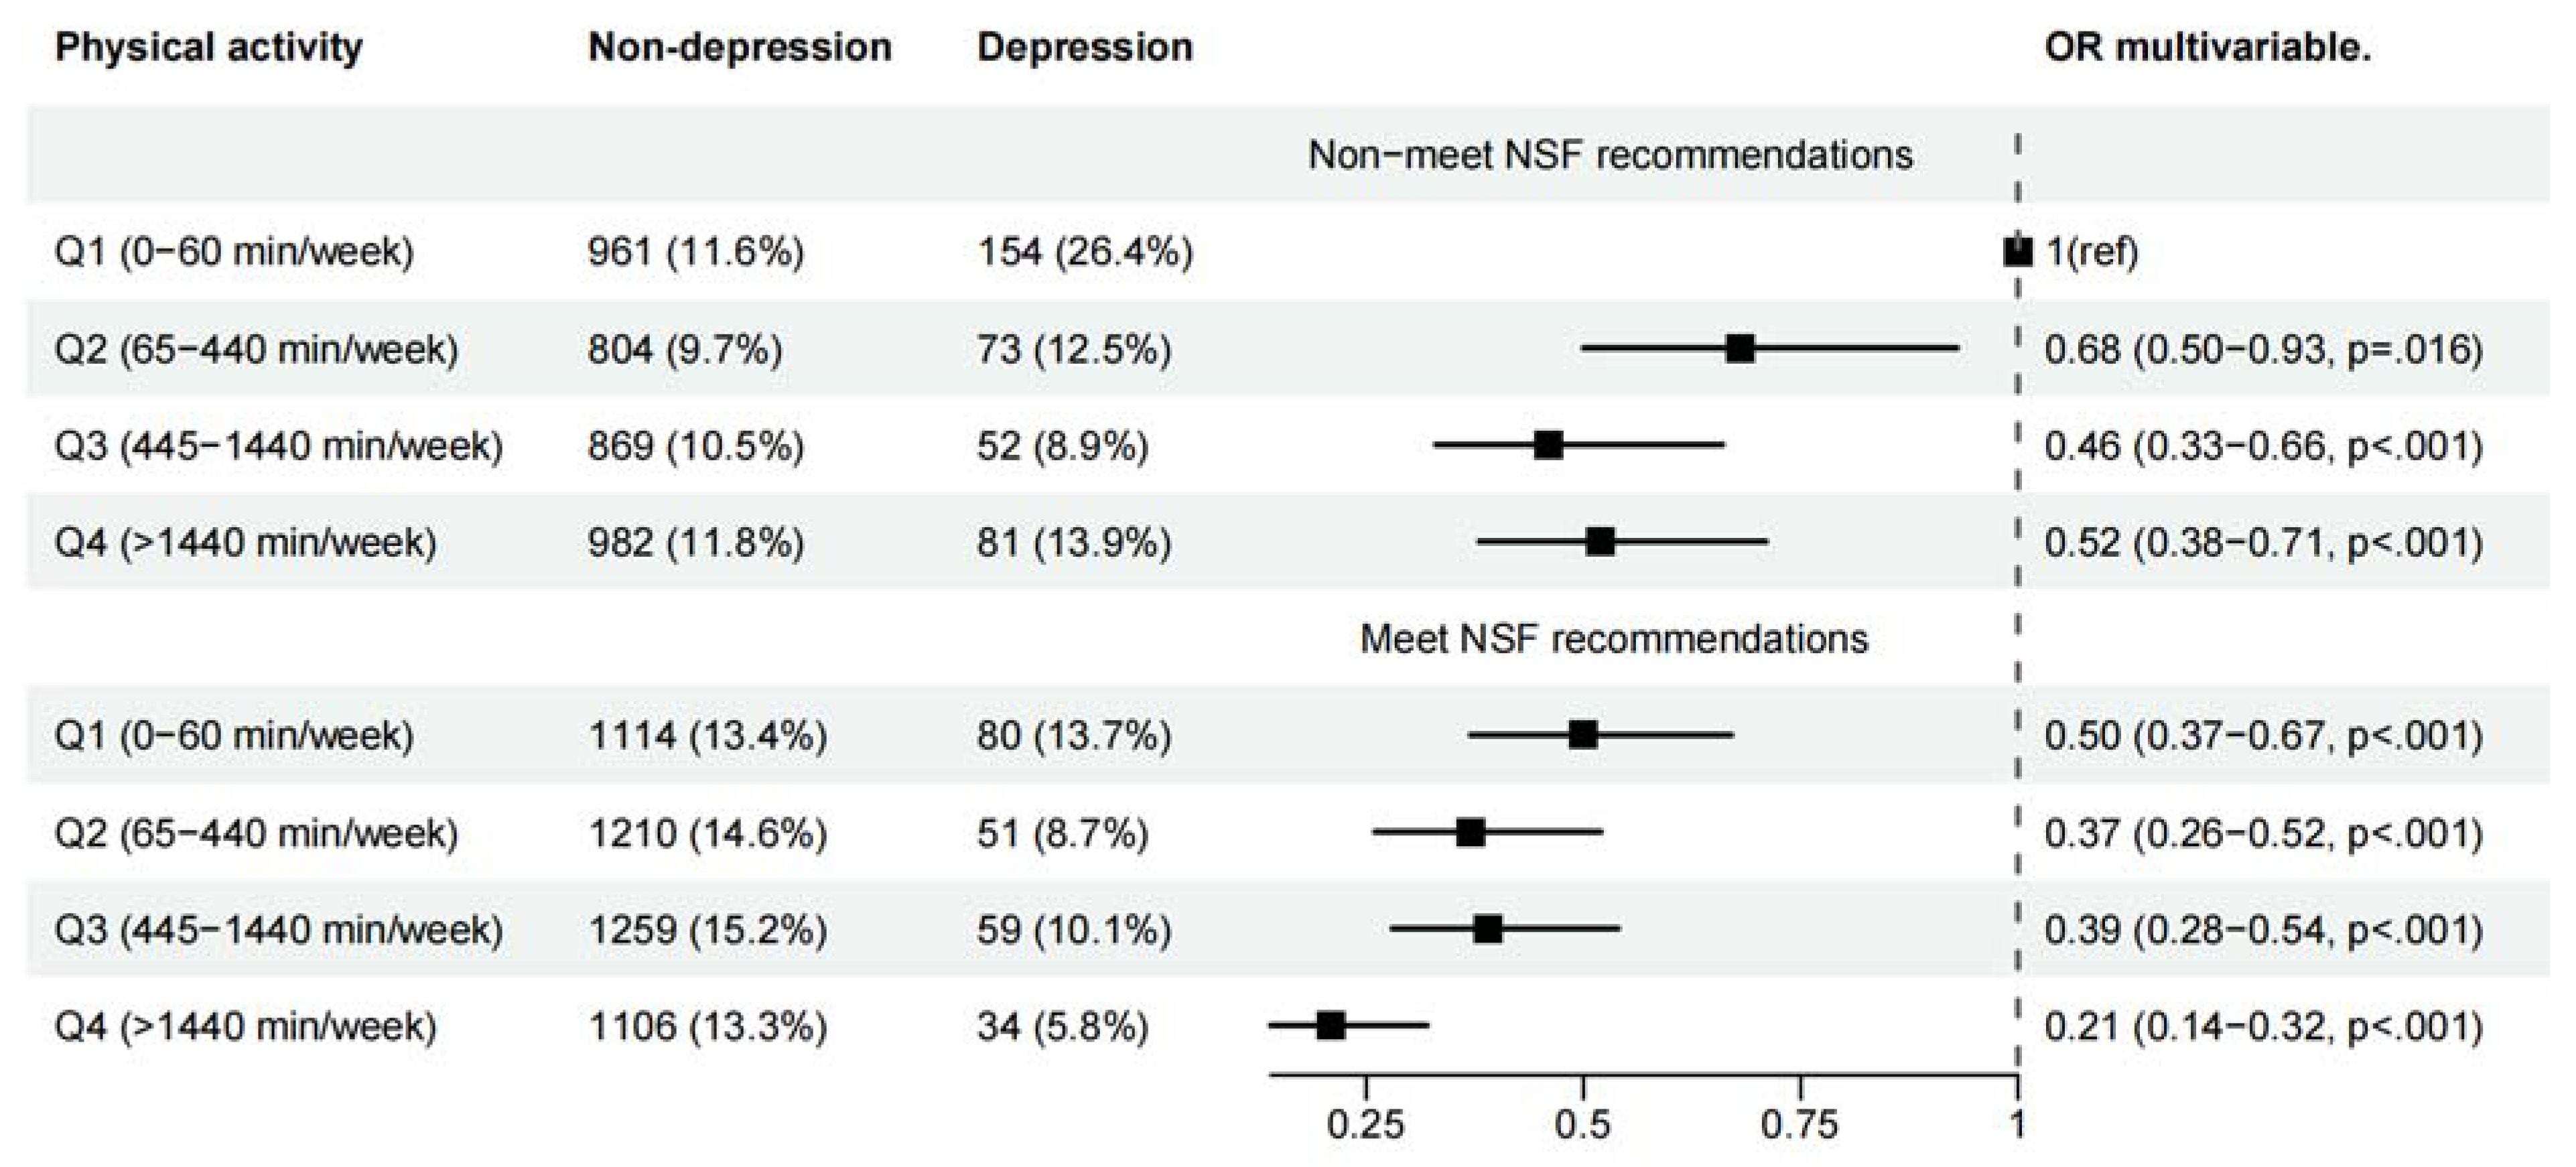
Figure 3.
Association between depressive symptoms and physical activity within sleep duration in female group. Data presented as hazard ratio (95% CI), adjusted for age, race, education level, marital status, poverty ratio, smoking status, BMI, years of NHANES, stroke, diabetes, arthritis pulmonary disease, hypertension and heart disease. Q4 represents highly active individuals and Q1 highly inactive individuals. Individuals in the lowest quartile of physical activity (Q1) and non-normal sleep duration were used as the reference group.
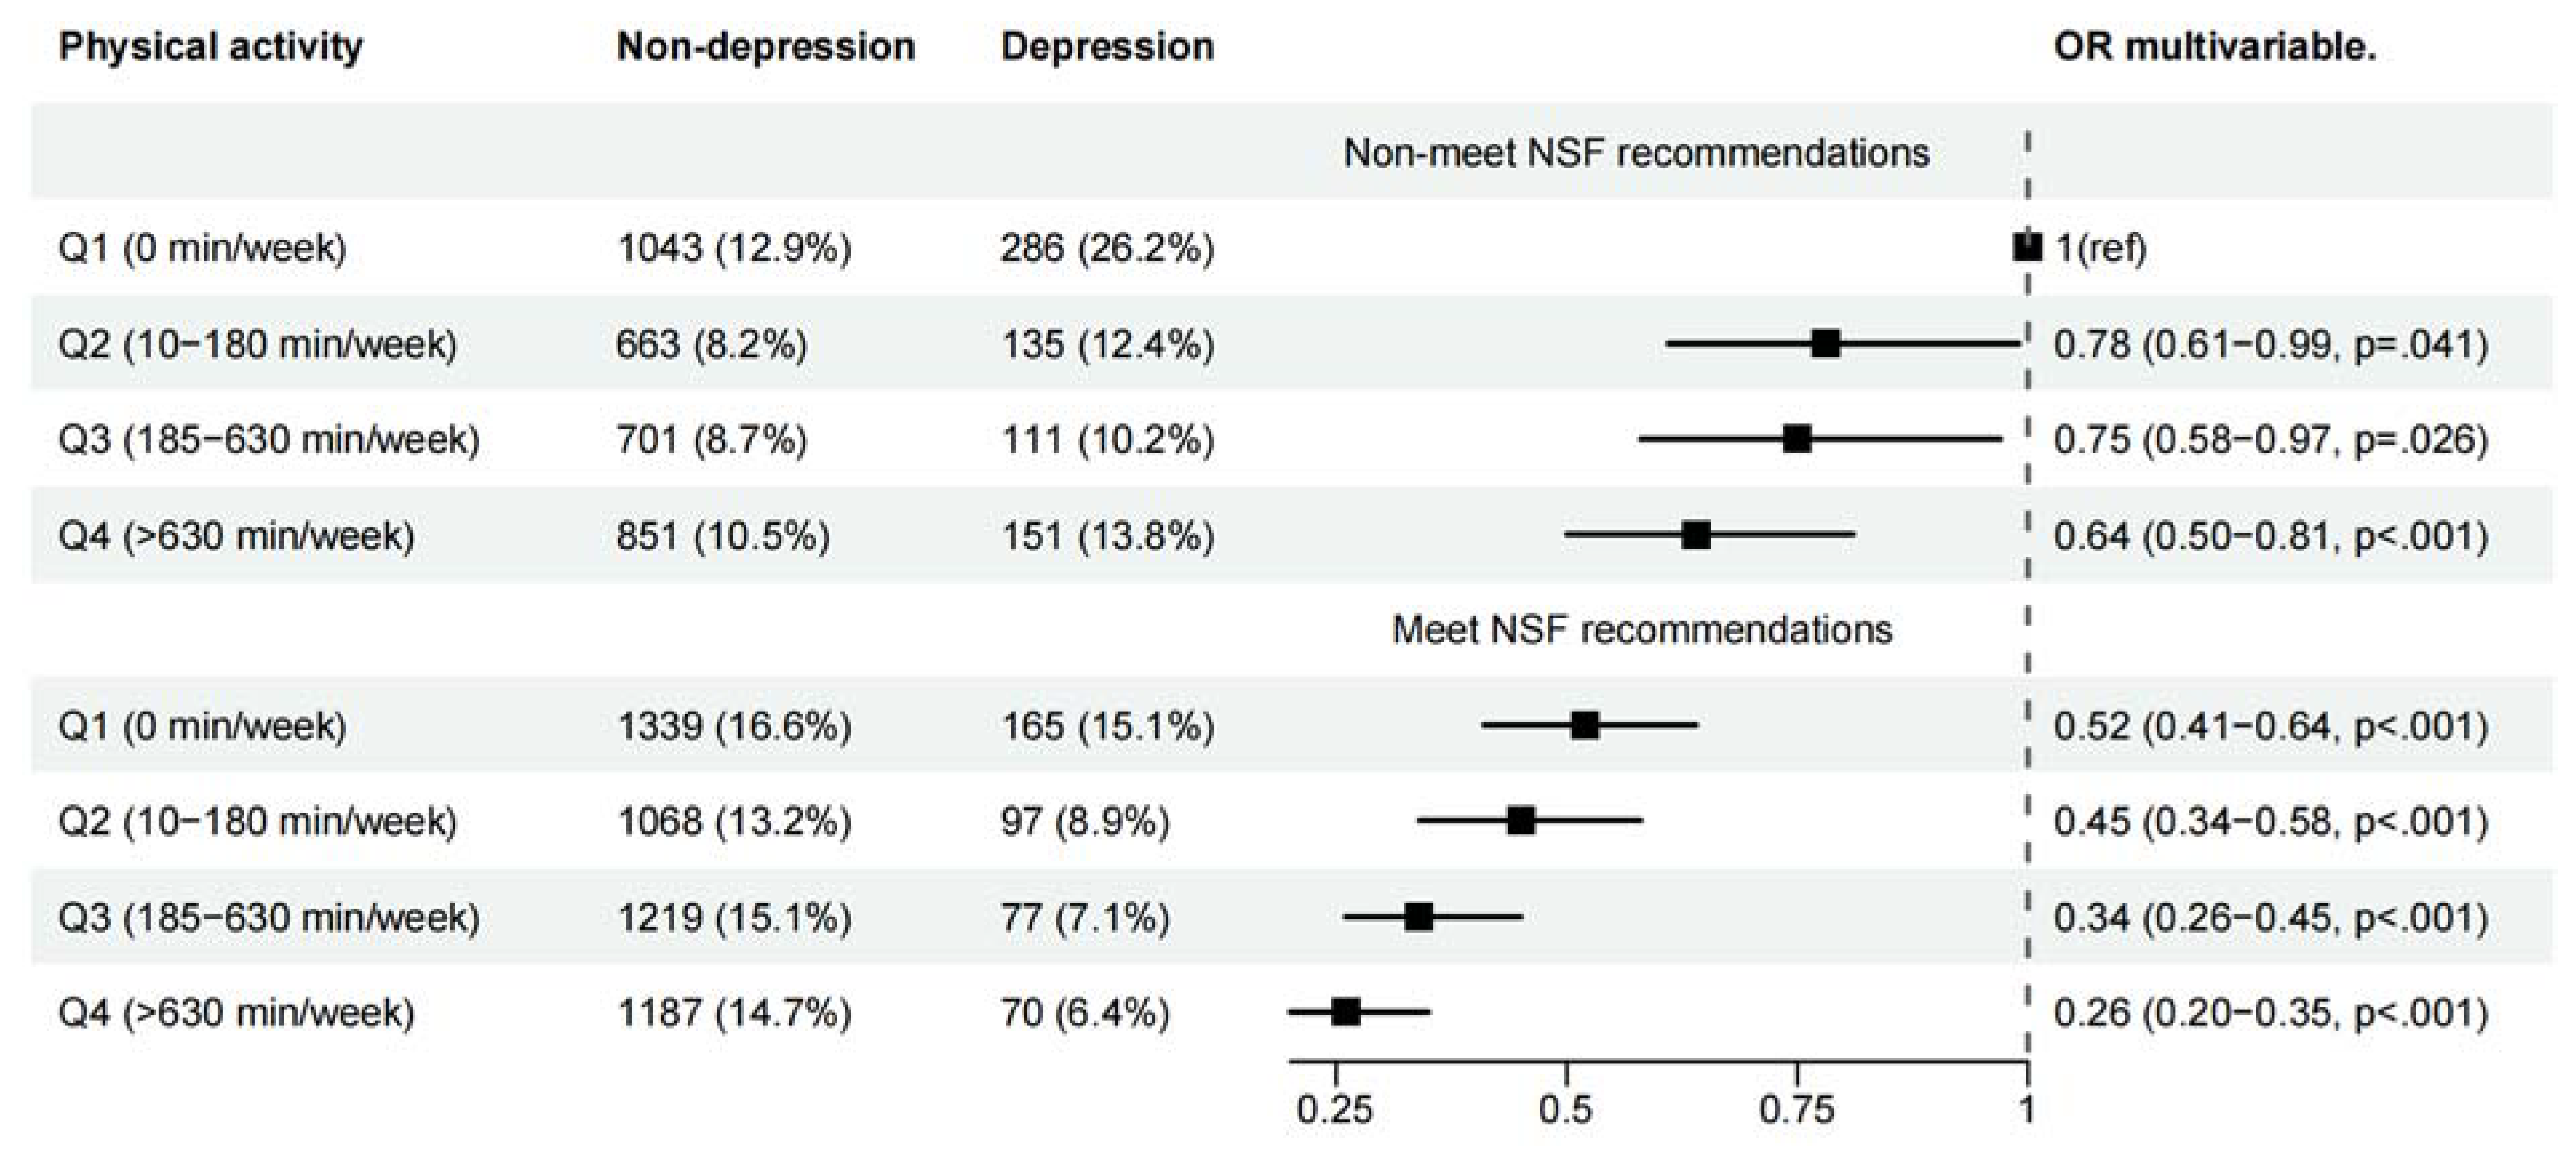

Table 1.
Characteristics of study population. (n=18052).
| All (%) | Male (N=8889(49.24%)) | Female(N=9163(50.76)) | |||||
|---|---|---|---|---|---|---|---|
| Non-depression | Depression | p | Non-depression | Depression | p | ||
| (N=8305) | (N=584(6.57)) | (N=8071) | (N=1092(11.92)) | ||||
| Age, year | |||||||
| 20-44 | 7721 (42.77) | 3587 (43.2) | 233 (39.9) | <.001 | 3442 (42.6) | 459 (42.0) | <.001 |
| 45-65 | 6184 (34.26) | 2768 (33.3) | 254 (43.5) | 2696 (33.4) | 466 (42.7) | ||
| >=65 | 4147 (22.97) | 1950 (23.5) | 97 (16.6) | 1933 (23.9) | 167 (15.3) | ||
| Race/ethnicity | |||||||
| Mexican American | 2532 (14.03) | 1191 (14.3) | 76 (13) | 0.042 | 1102 (13.7) | 163 (14.9) | <.001 |
| Other Hispanic | 1726 (9.56) | 720 (8.7) | 65 (11.1) | 788 (9.8) | 153 (14.0) | ||
| Non-Hispanic White | 8357 (46.29) | 3875 (46.7) | 283 (48.5) | 3728 (46.2) | 471 (43.1) | ||
| Non-Hispanic Black | 3769 (20.88) | 1717 (20.7) | 121 (20.7) | 1687 (20.9) | 244 (22.3) | ||
| Other race | 1668 (9.24) | 802 (9.7) | 39 (6.7) | 766 (9.5) | 61 (5.6) | ||
| BMI | |||||||
| <25 | 5289 (29.30) | 2337 (28.1) | 162 (27.7) | <.001 | 2550 (31.6) | 240 (22.0) | <.001 |
| 25-30 | 5971 (33.08) | 3179 (38.3) | 182 (31.2) | 2345 (29.1) | 265 (24.3) | ||
| >=30 | 6792 (37.62) | 2789 (33.6) | 240 (41.1) | 3176 (39.4) | 587 (53.8) | ||
| Education | |||||||
| Less than college | 8466 (46.90) | 3978 (47.9) | 378 (64.7) | <.001 | 3475 (43.1) | 635 (58.2) | <.001 |
| College or more | 9586 (53.10) | 4327 (52.1) | 206 (35.3) | 4596 (56.9) | 457 (41.8) | ||
| PIR | |||||||
| <1 | 3913 (21.68) | 1557 (18.7) | 215 (36.8) | <.001 | 1690 (20.9) | 451 (41.3) | <.001 |
| 1-1.99 | 4675 (25.90) | 2387 (28.7) | 55 (9.4) | 2121 (26.3) | 112 (10.3) | ||
| 2-3.99 | 4789 (26.53) | 2135 (25.7) | 200 (34.2) | 2105 (26.1) | 349 (32.0) | ||
| >=4 | 4675 (25.90) | 2226 (26.8) | 114 (19.5) | 2155 (26.7) | 180 (16.5) | ||
| Marital status | |||||||
| Married | 10674 (59.13) | 5468 (65.8) | 279 (47.8) | <.001 | 4464 (55.3) | 463 (42.4) | <.001 |
| Single | 7378 (40.87) | 2837 (34.2) | 305 (52.2) | 3607 (44.7) | 629 (57.6) | ||
| Smoking status | |||||||
| No | 9826 (54.43) | 3901 (47) | 185 (31.7) | <.001 | 5253 (65.1) | 487 (44.6) | <.001 |
| Yes | 8226 (45.57) | 4404 (53) | 399 (68.3) | 2818 (34.9) | 605 (55.4) | ||
| Years for NHANES | |||||||
| 2007-2008 | 4576 (25.35) | 2101 (25.3) | 154 (26.4) | 0.903 | 2042 (25.3) | 279 (25.5) | 0.707 |
| 2009-2010 | 4704 (26.06) | 2169 (26.1) | 152 (26) | 2091 (25.9) | 292 (26.7) | ||
| 2011-2012 | 4179 (23.15) | 1959 (23.6) | 139 (23.8) | 1848 (22.9) | 233 (21.3) | ||
| 2013-2014 | 4593 (25.44) | 2076 (25) | 139 (23.8) | 2090 (25.9) | 288 (26.4) | ||
| Hypertension | |||||||
| No | 11557 (64.02) | 5449 (65.6) | 323 (55.3) | <.001 | 5223 (64.7) | 562 (51.5) | <.001 |
| Yes | 6495 (35.98) | 2856 (34.4) | 261 (44.7) | 2848 (35.3) | 530 (48.5) | ||
| Diabetes | |||||||
| No | 15673 (86.82) | 7251 (87.3) | 471 (80.7) | <.001 | 7099 (88) | 852 (78) | <.001 |
| Yes | 2379 (13.18) | 1054 (12.7) | 113 (19.3) | 972 (12) | 240 (22) | ||
| Arthritis | |||||||
| No | 13157 (72.88) | 6525 (78.6) | 372 (63.7) | <.001 | 5704 (70.7) | 556 (50.9) | <.001 |
| Yes | 4895 (27.12) | 1780 (21.4) | 212 (36.3) | 2367 (29.3) | 536 (49.1) | ||
| Heart disease | |||||||
| No | 16639 (92.17) | 7564 (91.1) | 477 (81.7) | <.001 | 7640 (94.7) | 958 (87.7) | <.001 |
| Yes | 1413 (7.83) | 741 (8.9) | 107 (18.3) | 431 (5.3) | 134 (12.3) | ||
| Stroke | |||||||
| No | 17429 (96.55) | 8046 (96.9) | 544 (93.2) | <.001 | 7823 (96.9) | 1016 (93) | <.001 |
| Yes | 623 (3.45) | 259 (3.1) | 40 (6.8) | 248 (3.1) | 76 (7) | ||
| Pulmonary disease | |||||||
| No | 14736 (81.63) | 7078 (85.2) | 402 (68.8) | <.001 | 6530 (80.9) | 726 (66.5) | <.001 |
| Yes | 3316 (18.37) | 1227 (14.8) | 182 (31.2) | 1541 (19.1) | 366 (33.5) | ||
Table 2.
Association of sleep duration and PA with depressive symptoms among U.S. adults ≥20 years, NHANES 2007-2014.
Table 2.
Association of sleep duration and PA with depressive symptoms among U.S. adults ≥20 years, NHANES 2007-2014.
| n | event (%) | OR For Depression (95%CI) | |||
|---|---|---|---|---|---|
| Model 1 | Model 2 | Model 3 | |||
| Male | |||||
| Physical activity a | |||||
| Q1 (0-60 min/week) | 2,309 | 234(10.13) | 1.00 (reference) | 1.00 (reference) | 1.00 (reference) |
| Q2 (65-440 min/week) | 2,138 | 124(5.80) | 0.61 (0.49-0.78) ** | 0.63 (0.50-0.80) ** | 0.70 (0.55-0.90) * |
| Q3 (445-1440 min/week) | 2,239 | 111(4.96) | 0.50 (0.39-0.64) ** | 0.52 (0.40-0.66) ** | 0.59 (0.46-0.77) ** |
| Q4 (>1440 min/week) | 2,203 | 115(5.22) | 0.40 (0.31-0.51) ** | 0.42 (0.32-0.53) ** | 0.49 (0.38-0.63) ** |
| Sleep time duration recommendations b | |||||
| Non-meet NSF | 3,976 | 360(9.05) | 1.00 (reference) | 1.00 (reference) | 1.00 (reference) |
| Meet NSF | 4,913 | 224(4.56) | 0.50 (0.42-0.59) ** | 0.51 (0.42-0.61) ** | 0.54 (0.45-0.65) ** |
| Female | |||||
| Physical activity a | |||||
| Q1 (0 min/week) | 2,833 | 451(15.92) | 1.00 (reference) | 1.00 (reference) | 1.00 (reference) |
| Q2 (10-180 min/week) | 1,963 | 232(11.82) | 0.76 (0.64-0.91) * | 0.77 (0.64-0.92) * | 0.82 (0.68-0.98) * |
| Q3 (185-630 min/week) | 2,108 | 188(8.96) | 0.60 (0.50-0.73) ** | 0.63 (0.52-0.77) ** | 0.71 (0.58-0.86) ** |
| Q4 (>630 min/week) | 2,259 | 221(9.78) | 0.53 (0.44-0.64) ** | 0.54 (0.45-0.65) ** | 0.59 (0.48-0.71) ** |
| Sleep time duration recommendations b | |||||
| Non-meet NSF | 3,914 | 683(17.33) | 1.00 (reference) | 1.00 (reference) | 1.00 (reference) |
| Meet NSF | 5,222 | 409(7.83) | 0.44 (0.39-0.51) ** | 0.46 (0.41-0.53) ** | 0.49 (0.43-0.57) ** |
|
Note: *p<0.05, **p<0.001 Model 1 was adjusted for age, race, education level, marital status and poverty ratio. Model 2 was adjusted for smoking status, BMI and years of NHANES in addition to model 1. Model 3 was adjusted for Model 2 plus stroke, diabetes, arthritis pulmonary disease, hypertension and heart disease. aAnalyses were adjusted for sleep time duration in addition to all models. bAnalyses were adjusted for physical activity in addition to all models Abbreviations: CI, confidence interval; OR, odds ratio. | |||||
Table 3.
A Multivariate Logistic Regression Model for the Association between Physical Activity and Depression in Male and Female Groups and Sleep Duration Groups.
Table 3.
A Multivariate Logistic Regression Model for the Association between Physical Activity and Depression in Male and Female Groups and Sleep Duration Groups.
| n | Event (%) | Quintiles of physical activity | Hazard ratio per one quartile a change in physical activity | P-trend | P-int | ||||
|---|---|---|---|---|---|---|---|---|---|
| Q1((lowest) | Q2 | Q3 | Q4((highest) | ||||||
| Male | |||||||||
| Sleep time duration recommendations | |||||||||
| Non-meet NSF | 3,976 | 360(9.05) | 1.00 (reference) | 0.67 (0.49-0.92) * | 0.44 (0.31-0.63) ** | 0.49 (0.36-0.68) ** | 0.77 (0.69-0.86) ** | <.001 | 0.046 |
| Meet NSF | 4,913 | 224(4.56) | 1.00 (reference) | 0.75 (0.51-1.10) | 0.82 (0.56-1.19) | 0.45 (0.29-0.70) ** | 0.81 (0.71-0.92) * | 0.001 | |
| Female | |||||||||
| Sleep time duration recommendations | |||||||||
| Non-meet NSF | 3,914 | 683(17.33) | 1.00 (reference) | 0.77 (0.60-0.99) * | 0.74 (0.57-0.96) * | 0.63 (0.50-0.81) ** | 0.86 (0.80-0.93) ** | <.001 | 0.380 |
| Meet NSF | 5,222 | 409(7.83) | 1.00 (reference) | 0.86 (0.65-1.14) | 0.68 (0.50-0.91) * | 0.52 (0.38-0.70) ** | 0.80 (0.73-0.89) ** | <.001 | |
|
Note: *p<0.05, **p<0.001 Analyses were adjusted for age, race, education level, marital status, poverty ratio, smoking status, BMI, years of NHANES, stroke, diabetes, arthritis pulmonary disease, hypertension and heart disease. P-trend has calculated separately in different sleep duration groups. P-int (p for interaction) has calculated by the likelihood ratio test. | |||||||||
Disclaimer/Publisher’s Note: The statements, opinions and data contained in all publications are solely those of the individual author(s) and contributor(s) and not of MDPI and/or the editor(s). MDPI and/or the editor(s) disclaim responsibility for any injury to people or property resulting from any ideas, methods, instructions or products referred to in the content. |
© 2024 by the authors. Licensee MDPI, Basel, Switzerland. This article is an open access article distributed under the terms and conditions of the Creative Commons Attribution (CC BY) license (http://creativecommons.org/licenses/by/4.0/).
Copyright: This open access article is published under a Creative Commons CC BY 4.0 license, which permit the free download, distribution, and reuse, provided that the author and preprint are cited in any reuse.


