Submitted:
15 July 2024
Posted:
16 July 2024
You are already at the latest version
Abstract
:. Background and Objectives: Pulmonary embolism, PE, incidence had been increasing in the last ten years. Computed thoracic pulmonary angiography, CTPA, had a major role in confirming PE di-agnosis.The main purpose of the study was to establish the prognostic value of a CTPA parameter: pulmonary artery obstruction index, PAOI, for PE risk assessment . A second objective of the re-search was to investigate the predictive accuracy of biomarkers (D-dimer, and cardiac Troponin T, c-TnT ), and PAOI, in 7-day mortality. The third objective of the study was the relationship between PAOI, and these biomarkers, in different etiologies of PE. Materials and Methods: The study com-prised 109 patients with PE, hospitalized, and treated between February 2021, and August 2022. They had different etiologies: deep vein thrombosis, DVT; persistent atrial fibrillation, AF; chronic obstructive pulmonary disease, COPD, exacerbation; Covid; and cancers. The investigations were the following: clinical examination; D-dimer testing, as a mandatory method for PE suspicion( values ≥ 500 µg/L were highly suggestive for PE); c-TnT , as a marker of myocardial injury(values ≥ 14 ng/L were abnormal); CTPA, with right ventricle dysfunction, RVD, signs, and PAOI. Treat-ments were according to PE risk: systemic thrombolysis (in high risk , and hemodynamic instability); low weight molecular heparins, LWMH, after systemic thrombolysis, or in high risk PE, with he-modynamic stability; direct oral anticoagulants, DOAC (in low, and intermediate risk). Results: The relationship PAOI- D-dimer, and PAOI- c-TnT, had very strong statistical correlation, for the entire sample, and for DVT, AF, COPD, Covid subgroups ( Rho = 0.815-0.982). PAOI had a high predic-tive accuracy for intermediate , and high risk together (area under curve, AUC=0.948), and high risk PE (AUC= 0.993). For 7-day mortality, D-dimer , and c-TnT had high predictive accura-cy(AUC=0.921, and 0.979). PAOI had statistical significance for 7-day mortality in Covid (p=0.045), and cancer (p=0.038) patients. Conclusions: PAOI was an important tool for PE risk as-sessment. D-dimer , and c-TnT were valuable predictors, for 7-day mortality in PE. PAOI, and D-dimer; PAOI, and c-TnT were strongly correlated, for the entire PE sample, and for DVT, AF, COPD, and Covid patients.
Keywords:
pulmonary embolism
; pulmonary artery obstruction index
; D-dimer
; cardiac troponinT
1. Introduction
PE is usually suspected when the patient has dyspnoea, chest pain, syncope, or hemoptysis [1]. The continuing awarness of PE, and increased accessibility for CTPA, inhanced the true positive diagnosis of the disease. Last decade brought us new insights about PE. Earlier diagnosis, and modern therapeutic approach, decreased mortality rates from 20% to 1-3%[2]. There are two major types of PE: isolated PE, and DVT- associated PE.
For isolated PE, thrombus is formed in situ, due to a local process; or an embolus which is formed elsewhere, arrives in the pulmonary arteries. Isolated PE is recording 50% of total cases of PE [3]. Rarely, ethiopathogeny can be factor V Leiden, or prothrombin mutation (inherited thrombophilia) or antiphosholipidic syndrome (acquired thrombophillia).Very rarely, antithrombin, protein C, or S deficiencies can be implicated [4]. Even procoagulant status is driven PE in these types of isolated PE, provoking factors are usually necessary : recent surgery or immobilization [5].
Respiratory diseases like chronic bronchial asthma, chronic obstructive pulmonary disease (COPD) can be a frequent etiology, for isolated PE. Around 30% of COPD patients associates isolated PE, with in situ pulmonary thrombosis. Especially in acute exacerbations of COPD, PE screening is mandatory [6].
Cardiovascular diseases like myocardial infarction (MI), AF, coronary artery disease (CAD), and left-sided cardiomyopathy (CMP) can be another frequent etiology for isolated PE [7]. Both respiratory and cardiovascular diseases, previously mentioned, exhibit high levels of proinflammatory proteins. Oxidative stress determines upregulation of inflammation, and in situ thrombosis [8]. In cardiovascular diseases, in situ thrombosis can be inside the heart chambers, with successive embolism in pulmonary arteries. Also, in situ thrombosis, for PE-related to cardiovascular diseases, can be inside pulmonary arteries, from the beginning, due to upregulation of inflammation, previously described.
In Covid-19 patients, the virus itself, can provoke pulmonary microvascular dysfunction, followed by local thrombosis, and PE [9,10,11]. This complication in Covid-19 patients increases exponentially the mortality [12,13,14]; de Godoy et al. noticed that 58% of Covid -19 patients with PE died [15].
Table 1 summarizes the previous affirmations about isolated-PE.
For DVT- associated PE, an embolic event is producing. The thrombus is formed inside a deep vein (usually inferior limbs), and arrives in the pulmonary artery tree through bloodstream. The most common risk factors for DVT are the following: obesity, which increases fibrinogen levels, and provokes mechanical vein compression [16]; immobility, which reduces blood flow [17,18]; surgery, which provokes mechanical injury of the vein [19,20,21,22]; cancer, which creates hypercoagulable state [23], previous DVT.
D-dimer levels are elevated in PE because of simultaneous activation of coagulation and fibrinolysis [24]. Specific medical conditions as infections, cancer [25,26], pregnancy [27] can increase D-dimer levels. Normal levels of D-dimer makes unlikely PE diagnosis (high negative predictive value). Conversely, the positive predicted values of D-dimer testing is low [28].
Elevated markers of myocardial injury (cardiac troponins) are noticed in 30-60% of PE patients. The highest percentages (60%) are seen in high-sensitivity assays for troponins. When conventional assays are utilized for troponin concentration in PE , the percentages diminished around 30%[29]. A worse prognosis may be revealed in the patients with elevated cardiac troponins in PE [30,31,32].
CTPA is the gold standard for PE diagnosis . The major criterion for PE is endoluminal filling defect on CTPA.The following parameters are collected by CTPA: 1. ratio between transversal diameter of right ventricle, and left ventricle ; 2.ratio between transversal dimension for pulmonary artery trunk, and aorta; 3. septal deviation; 4. contrast reflux in inferior vena cava ; 5. PAOI, or Qanadli score. The first four CTPA parameters are utilized for right ventricle dysfunction, RVD, assessment [33]. PAOI is calculated by this formula= embolism number(n) x embolism degree(d)/ 40x 100%. Embolism number is value of the proximal thrombus site, and this is equal to the number of segmental pulmonary arteries, arising distally to the thrombus site. Values from n range from a minimum of 1 (one segment obstructed), to a maximum of 20 obstructed arteries. Each segment of the pulmonary arteries is score 1].; the sum of pulmonary segment arteries is PAOI or Qanadli score.Embolism degree is 1 for partial obstruction , and 2 for total obstruction [34].
Risk assessment in PE can be stratified by specific investigations: elevated cardiac troponin levels; RVD on CTPA, or on transthoracic echocardiography [35,36].
The main objective of our study was to find out the prognostic value of PAOI , for risk assessment in PE; D-dimer, c-TnT, and PAOI predictive accuracy for 7-day mortality in PE was the second objective. Thirdly, the relationship between PAOI, and biomarkers (D-dimer, cTnT) in different etiologies of PE, was another objective of our study.
2. Materials and Methods
The research comprised 109 patients , diagnosed, and treated for PE, in “St. Spiridon” Emergency Hospital, Iasi , between February 2021, and August 2022. The data collection methods ensured patient anonymity. The inclusion criteria were: positive PE diagnosis on CTPA; 7- day follow up duration. At the beginning of the research, we had 111 patients with confirmed PE; 3 patients were excluded, due to poor quality of CTPA images.
The following methods were utilized in our patients:
1. Clinical examination was focused on dyspnoea, hemoptysis, heart failure signs (dilation of jugulair veins; cyanosis; tachycardia; hepatomegaly; hepatic jugular reflux; cardiac edema), blood pressure, body mass index calculation, BMI=weight (in kilograms)/height2(squared metres). Obesity was defined if BMI was over 30 kg/m2.
2. CTPA was performed with a Philips Incisive 64 detector CT scan with the following protocol:
- the patient was lying in a supine position, with the arms above the head
- antero-posterior chest scout from the apices to the costo-phrenic angles
- cranio-caudal thoracic scan from the chest aperture to the costo-phrenic angles, in post inspiratory apnea
- noncontrast enhanced scan
- bolus tracking technique: we depict the pulmonary trunk, and place the region of interest, ROI, there to measure the computed tomography densities during contrast injection
- up to 100 ml (1 ml/kg body weight) of iodinated contrast medium (concentration of 370–400 mg iodine/ml) was injected intravenously with an automatic injector, at a speed of 3–4 ml/second , followed by 50 ml of saline chaser at the same speed
- the arterial phase scan delay was 7 s after the density in the pulmonary artery reaches 180 HU (Hounsfield units)
- the venous phase at 20 s after the arterial phase
After CTPA, the patient was monitored for 15 minutes to depict the eventual adverse contrast reactions, and was instructed to hydrate with 1000 ml of water in 12 hours.
The following parameters were collected by CTPA, and were usefull for RVD assesment: ratio between transversal diameter of right ventricle, and left ventricle(values above 1 were sugestive for RVD) ; 2.ratio between transversal dimension for pulmonary artery trunk, and aorta (value above 1 was a CT sign for RVD); septal deviation (its presence was suggestive for RVD); contrast reflux in inferior vena cava (its presence was a CT sign for RVD). PAOI was a major CTPA parameter, which splited the sample in minor PE, if PAOI < 35%, and massive PE if PAOI ≥ 35%.
4.D-dimer testing utilized Fiatest AFT-300. The quantitative enzyme-linked immunosorbent assay (ELISA) was made in the emergency department. D-dimer value > 500 µg/L were considered abnormal.
5. Cardiac troponin testing utilized Fiatest AFT-300, ELISA technique, high -sensitivity assay. C-TnT cut-off value was above 14ng/L.
6. Risk stratification, and treatment
Risk stratification was calculated according to European Society of Cardiology guidelines. Hemodynamics, and right ventricle function were the most important parameters for the risk assessment. Treatment recommendations were made in concordance with risk stratification [37,38,39,40]. These are summarized in Table 2.
Treatment for PE was represented by the following medication, in our research:
- systemic thrombolysis, with recombinant tissue plasminogen activator (rTPA) Alteplase 100 mg in 2 hours, via intravenous administration, in high risk PE, with hemodynamic instability
- LWMH Enoxaparine 1mg/kg twice daily, subcutaneous injection, after systemic thrombolysis, for the first week(in high risk PE, with hemodynamic instability, and in high risk PE , with hemodynamic stability, and no indication for systemic thrombolysis, for the first week); LWMH were followed after the first week by DOAC
- DOAC, Apixaban 10 mg twice daily, for the first 7 days, in low, and intermediate risk PE, via oral administration After the first week , the patients received Apixaban 5 mg twice daily, or 2.5 mg twice daily. Apixaban 2.5 mg twice daily was given in the following circumstances: age ≥ 80 years, weight ≤ 60kg, creatinine values >1.5 mg/dl. Apixaban was contraindicated in gastro-intestinal cancer, so these patients received LWMH.
The duration of anticoagulation was 6 months, for reversible conditions for PE (DVT, Covid, COPD exacerbations). Long term administration was necessary in chronic, and irreversible conditions for PE (persistent AF, cancer with metastasis).
7. Statistical Analysis
SPSS 29.0 was the software for statistical analysis . For D-dimer -PAOI relationship we used Mann Whitney test (p value < 0.05 indicated statistical significance, while p < 0.01 indicated high statistical significance), and Spearman’s correlation coeficient (Rho; 0.8 ≤ Rho ≤ 1 signified a very strong statistical correlation). For c-TnT- PAOI relationship we used Pearson chi-squared test (p value < 0.05 indicated statistical significance, while p < 0.01 indicated high statistical significance), and Spearman’s correlation coeficient , Rho (0.8 ≤ Rho ≤ 1 defined a very strong statistical correlation). Kruskall-Wallis test analyzed the relationship PAOI- D-dimer- c-TnT (p value < 0.05 suggested statistical significance, while p < 0.01 indicated high statistical significance). AUC, and receiver operating characteristic curve, ROC, analyzed prediction accuracy of PAOI, for PE risk assesment, and prediction accuracy of D-dimer, and c-TnT, for PE 7-day mortality. Pearson chi-squared test was also utilised for the relantionship between D-dimer, c-TnT, PAOI, and 7-day mortality in PE (p value < 0.05 indicated statistical significance, while p < 0.01 suggested high statistical significance).
3. Results
3.1. The Characteristics of the Sample
Females were predominant in our study (55%). The mean age was 66.79 ± 14.017 years (range, 28 - 93 years). Obesity was noticed in 62 of 109 patients (58.7%). Dyspnoea has been revealed in 73 of 109 patients (66.9%). Heart failure signs (during clinical examination) were noticed in 40.3% of our patients. Hemodinamic instability at admission was frequent: 38 of 109 patients (34.9%) had systolic blood pressure < 90 mmHg. The comonest etiology for PE was DVT (32.1%), followed by persistent AF (29.4%). Our study lasted during Covid pandemia, and a quarter of the sample had this etiology for PE (25.7%). Pulmonary cancer, malignant lymphomas, pancreatic/ rectal/ breast, and uterine cancers were neoplastic diseases, with PE in our study (12.8%). COPD exacerbations had the lowest percentage in PE etiology (6.4%). All these results are summarized in Table 3.
RVD was revealed by CTPA on 46 of 109 patients (42.2%). PAOI < 35% (minor PE) had 73 of 109 patients (67%), and PAOI ≥ 35% (massive PE) had 36 of 109 patients (33%).
3.2. The Correlations between Biomarkers (D-dimer, c-TnT), and PAOI
In minor PE patients, the highest value for D-dimer was noticed in cancer etiology (median= 923µg/L). The lowest value for D-dimer was revealed in AF etiology, in minor PE. (median=711µg/L). In massive PE patients, the highest value for D-dimer has been recorded in Covid etiology (median= 1493 µg/L), and the lowest value, in DVT etiology (median=1257 µg/L).
The correlation between PAOI, and D-dimer, had high statistical significance for the entire sample, and for DVT, AF, Covid etiologies. For COPD, and cancer etiologies this correlation didn’t have statistical significance. Very strong statistical correlation (Rho) had PAOI, and D-dimer, for the entire sample, and for each subgroup (DVT, AF, COPD, Covid), with one exception: cancer etiology. These results are illustrated in Table 4.
C-TnT was increased in 50.4% of the patients (33% with massive PE, and 17.4% with minor PE).The correlation between PAOI, and c-TnT had high statistical significance for all the sample, and for DVT, AF, Covid etiologies, as same as the correlation between PAOI, and D-dimer. In COPD, and cancer etiologies, the correlation PAOI - cTnT had no statistical significance. Rho revealed a very strong correlation between PAOI – cTnT, for the entire sample, and for each etiology, with one exception - cancer etiology. These results are summarized in Table 5.
The correlation between PAOI, and D-dimer, in cancer etiology, had high statistical significance, when c-TnT was added to PAOI and D-dimer, for statistical analysis. Previously, the correlation between PAOI, and each biomarker (D-dimer, and c-TnT) had no statistical significance in cancer etiology (see Table 5, and Table 6). The correlation between PAOI, and D-dimer, had also high statistical significance, when we added c-TnT, for the entire sample, and for DVT, AF, Covid, cancer etiologies. Only COPD etiology had no statistical significance for the correlation PAOI - D-dimer – c-TnT. These results are illustrated in Table 6.
3.3. Risk, and Mortality Assesment
Risk assesment was made according to Table 2. High risk PE was noticed for 33% of the patients. High risk, and unstable patients were 31.1% patients and they received systemic thrombolysis. The four patients with intermediate risk PE, had minor PE at CTPA, and their PE etiology was COPD exacerbation. The DVT patients had the highest percentage for high risk, among all the patients (11.9%). Six patients had double etiology for PE: three patients with cancer, had also DVT (all these 3 patients had low risk PE; one of them, with a malignant lymphoma, died in the 1st day of hospitalization); two patients with Covid, had also cancer, one of them (this patient had low risk PE), and AF, the other one (this patient had high risk PE, and he died on the 2nd day of hospitalization); one patient with meningitis, had also AF (this patient had low risk PE , but he died on the 2nd day of hospitalization). One patient had triple etiology for PE: AF, Covid, and cancer (this patient had low risk PE).
Mortality rate was 8.25% (9 of 109 patients). Two deceased patients with AF(1.82%) had also Covid, one of them, and meningitis, the other one. One deceased patient with DVT(0.91%) had also cancer, a malignant lymphoma. Among Covid patients, 5 of them deceased(4.58%), and 4 patients had massive PE at CTPA. There were 2 deaths among cancer patients (1.82%): they had pulmonary, cerebral, and hepatic metastasis. Among the deceased patients, they had massive PE with Covid (3.66%)/ double etiology of PE(2.73%)/ metastatic cancer(1.82%).
The results about PE risk assesment are summarized in Table 7.
We investigated PAOI predictive accuracy, in PE risk. For intermediate, and high risk, toghether, PAOI cutt-off value was 34%, and AUC = 0.948 (very high accuracy). The sensitivity was 89.1%, and specificity was 100%. For high risk PE, PAOI cutt-off value was 32.5%, and AUC=0.993 (also very high accuracy). The sensitivity was 100%, and specificity was 97.1%. Table 8 and Table 9 and Figure 1 and Figure 2 illustrated these results.
We investigated the predictive accuracy of biomarkers (D-dimer and c-TnT), for 7-day mortality. D-dimer cutt-off value was 1420 µg/L, and AUC= 0.921. C-TnT cutt-off value was 131ng/L, and AUC= 0.979 (very high accuracy, for both biomarkers). These results are illustrated in Table 10 and Table 11, and Figure 3 and Figure 4.
D-dimer, and cTnT had a statistical significant relationship with 7-day mortality for the
4. Discussion
Obesity had a high prevalence in our sample (58%), but it had no relevance for 7-day mortality . All the deceased patients had normal BMI in our resarch.This is so called “the obesity paradox in PE”. Alkhalfan et al. concluded that obese patients had a lower risk of PE-mortality, despite the higher prevalence of PE in obese than in non-obese patients [41]. Tamimi et al. precised the increased haemodynamic instability of obese patients with PE, without increased mortality rate [42].
Dyspnoea was a common symptom in our patients, with a high prevalence (66.9%). All the patients with high risk PE, had this presenting symptom (39.4%). Only half of low risk PE patients complained by dyspnoea (27.5%). The incidence of dyspnoea increased with the risk of PE, and this observation was also noticed by Khasin et al. [43].
The third part of our patients revealed hemodynamic instability at hospital admission. Other authors reported lower percentages, around 12%, for this condition in PE [44,45].
RVD was a major parameter in PE risk stratification. The prevalence of RVD among our patients was 42%, comparative with the values around 30%, revealed by other authors [46,47].
Comparing our CTPA protocol with those in the literature, we discovered several differences:
- a cranio-caudal thoracic scan was performed in our clinic (depicting better the contrast in the inferior segmental pulmonary arteries) compared with the caudo-cranial scan preferred by Nguyen et al. [48].This cranio-caudal scan in our protocol prevented the respiratory artifacts in the lower lobes, and avoided the artifact from the high intensity contrast in the superior vena cava
- our protocol includes a venous phase. This has the following advantages: seeing the pulmonary arteries twice (in both arterial and venous phases); resolves some opacification problems given by common physics artifacts, and patient characteristics (body habitus, motion artifacts, and cardiac output). The disavantage of venous phase from our protocol is higher radiation exposure for the patient.
We noticed a very strong statistical correlation between PAOI, and biomarkers (D-dimer and c-TnT). The correlation was significant for each biomarker, and for the association of both biomarkers to PAOI. The entire sample revealed this correlation, and also the subgroups with different etiologies. Only for cancer patients the relationship had no statistical significance. D-dimer, and c-TnT could be used as prognostic markers in PE, as their values were correlated with PE extent, expressed by PAOI. A positive correlation between PAOI and D-dimer, PAOI and troponin I, was also noticed by other authors [49,50].
PAOI was a powerfull, and accurate predictor, in intermediate and high risk PE, in our research. AUC, and ROC sustained this affirmation. In other studies, PAOI was also an important tool to stratify the severity of PE [51,52].
Both biomarkers (D-dimer, and c-TnT) were accurate predictors in PE 7-day mortality. This affirmation was sustained by AUC, and ROC. C-TnT had an independent prognostic value in PE, and cardiogenic shock was more prevalent when c-TnT values were elevated [53]. Conversely, low c-TnT values were associated with low risk of mortality in PE [54].
In our research, the deceased pacients recorded higher values for D-dimer , and c-TnT, than the survivors. These results were noticed for the entire sample, and for all the etiological subgroups: AF, DVT, Covid, cancer patients. D-dimer, and c-TnT were valuable biomarkers for 7-day mortality prediction in our research. Other studies evaluated the 30-day, 90-day or 180-mortality in PE, and the positive correlation with biomarkers [55,56,57].
PAOI had statistical significance on 7-day mortality, for Covid, and cancer patients in our research. Zorlu noticed that PAOI > 46.2% was an independent predictor for 30-day mortality in PE [58].
Our research has the following limitations: surgical patients postoperatively were not included; natriuretic peptides were not measured; the comparison between RVD on CTPA, and RVD on echocardiography, was not discussed. Future directions will include these subjects.
5. Conclusions
D-dimer, and c-TnT had a very strong correlation with PE extent (PAOI), for the entire sample, and for specific etiologies: AF, DVT, COPD, Covid. These biomarkers were powerfull, and accurate predictors for 7-day mortality in PE. PAOI was an accurate predictor for intermediate, and high risk PE. PAOI had statistical significance in 7-day mortality, in Covid, and cancer patients. Laboratory biomarkers were important tools for 7-day mortality assesment, while PAOI was a valuable tool for PE risk assesment.
Author Contributions
Conceptualization, P.M. and I.J.; methodology, A.G.N.; software, A.M.U.; validation, P.M., I.J. and L.M.; formal analysis, A.G.N.; investigation, L.M. and I.J; resources, A.G.N.; data curation, A.M.U.; writing—original draft preparation,P.M.; writing—review and editing,P.M.; visualization, L.M.; supervision, I.J. and P.M.; project administration, A.G.N.; funding acquisition, I.J. All authors have read and agreed to the published version of the manuscript.
Funding
This research received no external funding.
Institutional Review Board Statement
The study was conducted in accordance with the Declaration of Helsinki, and approved by the Ethics Committee of ” Saint Spiridon” Emergency Hospital Iasi , no. 42, 27 May 2024.
Informed Consent Statement
Informed consent was obtained from all subjects involved in the study. Written informed consent has been obtained from the patients to publish this paper.
Acknowledgments
The authors are grateful for the technical support provided by Cristina Dascalu, “Gr.T.Popa” University of Medicine and Pharmacy, Iasi, Romania, Medical Informatics and Biostatistical Department; Andreea Beatrice Manea, Handshake Company, San Francisco, California, United States of America; and Eduard Moisii, Iasi, Romania.
Conflicts of Interest
The authors declare no conflicts of interest.
References
- Pollack, C.V.; Schreiber, D.; Goldhaber, S.Z.; Slattery, D.; Fanikos, J.; O’Neil, B.J.; Thompson, J.R.; Hiestand, B.; Briese, B.A.; Pendleton, R.C.; Miller, C.D.; Kline, J.A. Clinical characteristics, management, and outcomes of patients diagnosed with acute pulmonary embolism in the emergency department: initial report of EMPEROR (Multicenter Emergency Medicine Pulmonary Embolism in the Real World Registry). J Am Coll Cardiol 2011, 8;57(6), 700-706. [CrossRef] [PubMed]
- Tsao, C.W.; Aday, A.W.; Almarzooq, Z.I.; Alonso, A.; Beaton, A.Z.; Bittencourt, M.S.; Boehme, A.K.; Buxton, A.E.; Carson, A.P.; Commodore-Mensah, Y.; Elkind, M.S.V.; Evenson, K.R.; Eze-Nliam, C.; Ferguson, J.F.; Generoso, G.; Ho, J.E.; Kalani, R.; Khan, S.S.; Kissela, B.M.; Knutson, K.L.; Levine, D.A.; Lewis, T.T.; Liu, J.; Loop, M.S.; Ma, J.; Mussolino, M.E.; Navaneethan, S.D., Perak AM, Poudel R, Rezk-Hanna M, Roth GA, Schroeder EB, Shah SH, Thacker EL, VanWagner LB, Virani SS, Voecks JH, Wang, N.Y.; Yaffe, K.; Martin, S.S. Heart Disease and Stroke Statistics-2022 Update: A Report From the American Heart Association. Circ 2022, 22;145(8):e153-e639. Erratum in: Circ 2022, 6;146(10):e141. doi: 10.1161/CIR.0000000000001074. PMID: 35078371. [CrossRef]
- Ten Cate, V.; Prochaska, J.H.; Schulz, A.; Nagler, M.; Robles, A.P.; Jurk, K.; Koeck, T.; Rapp, S.; Düber, C.; Münzel, T.; Konstantinides, S.V.; Wild, P.S. Clinical profile and outcome of isolated pulmonary embolism: a systematic revie and meta-analysis. E Clin Med 2023, 27;59:101973. [CrossRef] [PubMed] [PubMed Central]
- de Moerloose P, Reber G, Perrier A, Perneger T, Bounameaux H. Prevalence of factor V Leiden and prothrombin G20210A mutations in unselected patients with venous thromboembolism. Br J Haematol 2000, 110(1), 125–129. [CrossRef] [PubMed]
- Grifoni, E.; Marcucci, R.; Ciuti, G.; Cenci, C.; Poli, D.; Mannini, L.; Liotta, A.A.; Miniati, M.; Abbate, R.; Prisco, D. The thrombophilic pattern of different clinical manifestations of venous thromboembolism: a survey of 443 cases of venous thromboembolism. Semin Thromb Hemost 2012, 38(2):230-234. [CrossRef] [PubMed]
- Yang C.; Tuo, Y.; Shi, X.; Duo, J.; Liu, X.; Zhang, F.; Feng, X. Prevalence, risk factors, and clinical characteristics of pulmonary embolism in patients with acute exacerbation of COPD in Plateau regions: a prospective cohort study. BMC Pulm Med 2024, 27;24(1):102. [CrossRef] [PubMed]
- Ten Cate, V.; Eggebrecht, L.; Schulz, A.; Panova-Noeva, M.; Lenz, M.; Koeck, T.; Rapp, S.; Arnold, N.; Lackner, K.J.; Konstantinides, S.; et al. Isolated Pulmonary Embolism Is Associated With a High Risk of Arterial Thrombotic Disease: Results From the VTEval Study. CHEST 2020, 158(1), 341–349. [Google Scholar] [CrossRef] [PubMed]
- Ten Cate ,V.; Prochaska, J.H.; Schulz, A.; Koeck, T.; Pallares Robles, A.; Lenz, M.; Eggebrecht, L.; Rapp, S.; Panova-Noeva, M.; Ghofrani, H.A.; Meyer, F.J.; Espinola-Klein, C.; Lackner, K.J.; Michal, M.; Schuster, A.K.; Strauch, K.; Zink, A.M.; Laux, V.; Heitmeier, S.; Konstantinides, S.V.; Münzel, T.; Andrade-Navarro, M.A.; Leineweber, K.; Wild, P.S. Protein expression profiling suggests relevance of noncanonical pathways in isolated pulmonary embolism. Blood 2021, 13;137(19), 2681-2693. [CrossRef] [PubMed]
- Bonaventura, A.; Vecchié, A.; Dagna, L.; Martinod, K.; Dixon, D.L.; Van Tassell, B.W.; Dentali, F.; Montecucco, F.; Massberg, S.; Levi, M.; et al. Endothelial dysfunction and immunothrombosis as key pathogenic mechanisms in COVID-19. Nat Rev Immunol 2021, 21(5):319-329. [CrossRef] [PubMed]
- Levi, M.; Thachil, J.; Iba, T.; Levy, J.H. Coagulation abnormalities and thrombosis in patients with COVID-19. Lancet Haematol. 2020, 7(6): e438-e440. [CrossRef] [PubMed]
- Klok, F.A.; Kruip, M.J.H.A.; van der Meer, N.J.M.; Arbous, M.S.; Gommers, D.A.M.P.J.; Kant, K.M.; Kaptein, F.H.J.; van Paassen, J.; Stals, M.A.M.; Huisman, M.V.; et al. Incidence of thrombotic complications in critically ill ICU patients with COVID-19. Thromb Res 2020, 191, 145–147. [Google Scholar] [CrossRef] [PubMed]
- Abou-Ismail, M.Y.; Diamond, A.; Kapoor, S.; Arafah, Y.; Nayak, L. The hypercoagulable state in COVID-19: Incidence, pathophysiology, and management. Thromb Res 2020, 194, 101–115, Erratum in: Thromb Res 2021, 204,146. doi: 10.1016/j.thromres.2020.11.012. [Google Scholar] [CrossRef] [PubMed]
- Hajra, A.; Mathai, S.V.; Ball, S.; Bandyopadhyay, D.; Veyseh, M.; Chakraborty, S.; Lavie, C.J.; Aronow, W.S. Management of Thrombotic Complications in COVID-19: An Update. Drugs 2020, 80(15), 80(15),1553–1562. [Google Scholar] [CrossRef] [PubMed] [PubMed Central]
- Sakr, Y.; Giovini, M.; Leone, M.; Pizzilli, G.; Kortgen, A.; Bauer, M.; Tonetti, T.; Duclos, G.; Zieleskiewicz, L.; Buschbeck, S.; et al. Pulmonary embolism in patients with coronavirus disease-2019 (COVID-19) pneumonia: a narrative review. Ann Intensive Care 2020, 10, 124. [Google Scholar] [CrossRef] [PubMed] [PubMed Central]
- de Godoy, J.M.P.; Dizero, A.G.; Lopes, M.V.C.A. Prevalence of Pulmonary Embolism in COVID-19 at Quaternary Hospital Running Head: Pulmonary Embolism in COVID-19. Med Arch 2024, 78(2), 146–148. [Google Scholar] [CrossRef] [PubMed] [PubMed Central]
- Eichinger, S.; Hron, G.; Bialonczyk, C. Overweight, obesity, and the risk of recurrent venous thromboembolism. Arch Intern Med. 2008, 168(15), 1678–1683. [Google Scholar] [CrossRef] [PubMed]
- Stubbs, M.J.; Mouyis, M.; Thomas, M. Deep vein thrombosis. BMJ 2018, 360:k351. Erratum in: BMJ 2018, 360:k1335. doi: 10.1136/bmj.k1335. [CrossRef] [PubMed]
- Weinberg, I., Elgendy, I.Y.; Dicks, A.B.; Marchena, P.J.; Malý, R.; Francisco, I.; Pedrajas, J.M.; Font, C.; Hernández-Blasco. L.; Monreal, M. RIETE Investigators. Comparison of Presentation, Treatment, and Outcomes of Venous Thromboembolism in Long-Term Immobile Patients Based on Age. J Gen Intern Med 2023, 38(8):1877-1886. [CrossRef] [PubMed]
- Alamri, A.S.; Alamri, M.S.; Al-Qahatani, F.; Alamri, A.S.; Alghuthaymi, A.M.; Alamri ,A.M.; Albalhsn, H.M.; Alamri, A.N. Prevalence and Risk Factors of Deep Vein Thrombosis Among Adult Surgical Patients in Aseer Central Hospital, Saudi Arabia. Cureus 2023, 15(10):e47856. [CrossRef] [PubMed]
- Singh, T.; Lavikainen, L.I.; Halme, A.L.E.; Aaltonen, R.; Agarwal, A.; Blanker, M.H.; Bolsunovskyi, K.; Cartwright, R.; García-Perdomo, H.; Gutschon, R.; et al. Timing of symptomatic venous thromboembolism after surgery: meta-analysis. Br J Surg 2023, 110(5), 553–561. [Google Scholar] [CrossRef] [PubMed]
- McAlpine, K .; Breau, R.H.; Werlang, M.;, Carrier, M.; Le Gal, G.; Fergusson, D.A.; Shorr, R.; Cagiannos, I.; Morash, C.; Lavallée, LT. Timing of Perioperative Pharmacologic Thromboprophylaxis Initiation and its Effect on Venous Thromboembolism and Bleeding Outcomes: A Systematic Review and Meta-Analysis. J Am Coll Surg, 2021, 233(5), 619-631. e14. [CrossRef] [PubMed]
- Felder, S.; Rasmussen, M.S.; King, R.; Sklow, B.; Kwaan, M.; Madoff, R.; Jensen, C. Prolonged thromboprophylaxis with low molecular weight heparin for abdominal or pelvic surgery. Cochrane Database Syst Rev. 2019, 3(3): CD004318. Update in: Cochrane Database Syst Rev. 2019, 8: CD004318. doi: 10.1002/14651858.CD004318. pub5. [CrossRef] [PubMed]
- Blom, J.W.; Doggen, C.J.; Osanto, S.; Rosendaal, F.R. Malignancies, prothrombotic mutations, and the risk of venous thrombosis. JAMA 2005, 293(6), 715–722. [Google Scholar] [CrossRef] [PubMed]
- Carrier, M.; Righini, M.; Djurabi, R.K.; Huisman, M.V.; Perrier, A.; Wells, P.S.; Rodger, M.; Wuillemin, W.A.; Le Gal, G. VIDAS D-dimer in combination with clinical pre-test probability to rule out pulmonary embolism. A systematic review of management outcome studies. Thromb Haemost 2009, 101(5), 886–892. [Google Scholar] [CrossRef] [PubMed]
- Di Nisio, M.; Sohne, M.; Kamphuisen, P.W.; Büller, H.R. D-Dimer test in cancer patients with suspected acute pulmonary embolism. J Thromb Haemost 2005, 3(6), 1239–1242. [Google Scholar] [CrossRef] [PubMed]
- Righini, M.; Le Gal, G.; De Lucia, S.; Roy, P.M.; Meyer, G.; Aujesky, D.; Bounameaux, H.; Perrier, A. Clinical usefulness of D-dimer testing in cancer patients with suspected pulmonary embolism. Thromb Haemost 2006, 95(4), 715–719. [Google Scholar] [PubMed]
- Chabloz, P.; Reber, G.; Boehlen, F.; Hohlfeld, P.; de Moerloose, P. TAFI antigen and D-dimer levels during normal pregnancy and at delivery. Br J Haematol 2001,115(1):150-152. [CrossRef] [PubMed]
- Falster, C.; Hellfritzsch, M.; Gaist, T.A.; Brabrand, M.; Bhatnagar, R.; Nybo, M.; Andersen, N.H.; Egholm, G. Comparison of international guideline recommendations for the diagnosis of pulmonary embolism. Lancet Haematol 2023, 10(11), e922-e935. [CrossRef] [PubMed]
- Bikdeli, B.; Muriel, A.; Rodríguez, C.; González, S.; Briceño, W.; Mehdipoor, G.; Piazza, G.; Ballaz, A.; Lippi, G.; Yusen, R.D.; et al. High-Sensitivity vs Conventional Troponin Cutoffs for Risk Stratification in Patients With Acute Pulmonary Embolism. JAMA Cardiol 2024, 9(1), 64–70. [Google Scholar] [CrossRef] [PubMed] [PubMed Central]
- Bajaj, A.; Saleeb, M.; Rathor, P.; Sehgal, V.; Kabak, B.; Hosur, S. Prognostic value of troponins in acute nonmassive pulmonary embolism: A meta-analysis. Heart Lung 2015, 44(4), 327–334. [Google Scholar] [CrossRef] [PubMed]
- Sonne-Holm, E.; Winther-Jensen, M.; Bang, L.E.; Køber, L.; Fosbøl, E.; Carlsen, J.; Kjaergaard, J. Troponin dependent 30-day mortality in patients with acute pulmonary embolism. J Thromb Thrombolysis 2023, 56(3), 485–494. [Google Scholar] [CrossRef] [PubMed] [PubMed Central]
- Kaeberich, A.; Seeber, V.; Jiménez, D.; Kostrubiec, M.; Dellas, C.; Hasenfuß, G.; Giannitsis, E.; Pruszczyk, P.; Konstantinides, S.; Lankeit, M. Age-adjusted high-sensitivity troponin T cut-off value for risk stratification of pulmonary embolism. Eur Respir J 2015, 45(5), 1323–1331. [Google Scholar] [CrossRef] [PubMed]
- Kang, D.K.; Thilo, C.; Schoepf, U.J.; Barraza, J.M., Jr.; Nance, J.W., Jr.; Bastarrika, G.; Abro, J.A.; Ravenel, J.G.; Costello, P.; Goldhaber, S.Z. CT signs of right ventricular dysfunction: prognostic role in acute pulmonary embolism. JACC Cardiovasc Imaging 2011, 4(8), 841–849. [Google Scholar] [CrossRef] [PubMed]
- Qanadli, S.D.; El Hajjam, M.; Vieillard-Baron, A.; Joseph, T.; Mesurolle, B.; Oliva, V.L.; Barré, O.; Bruckert, F.; Dubourg, O.; Lacombe, P. New CT index to quantify arterial obstruction in pulmonary embolism: comparison with angiographic index and echocardiography. AJR 2001, 176(6), 1415–1420. [Google Scholar] [CrossRef] [PubMed]
- Barco, S.; Mahmoudpour, S.H.; Planquette, B.; Sanchez, O.; Konstantinides, S.V.; Meyer, G. Prognostic value of right ventricular dysfunction or elevated cardiac biomarkers in patients with low-risk pulmonary embolism: a systematic review and meta-analysis. Eur Heart J 2019, 40(11), 902–910. [Google Scholar] [CrossRef] [PubMed]
- Becattini, C.; Agnelli, G.; Lankeit, M.; Masotti, L.; Pruszczyk, P.; Casazza, F.; Vanni, S.; Nitti, C.; Kamphuisen, P.; Vedovati, M.C.; et al. Acute pulmonary embolism: mortality prediction by the 2014 European Society of Cardiology risk stratification model. Eur Respir J 2016, 48(3), 780–786. [Google Scholar] [CrossRef] [PubMed]
- Meyer, G.; Vicaut, E.; Danays, T.; Agnelli, G.; Becattini, C.; Beyer-Westendorf, J.; Bluhmki, E.; Bouvaist, H.; Brenner, B.; Couturaud, F.; Dellas, C.; Empen, K.; Franca, A.; Galiè, N.; Geibel, A.; Goldhaber, S.Z. Jimenez, D.; Kozak, M.; Kupatt, C.; Kucher, N.; Lang, I.M,; Lankeit, M.; Meneveau, N.; Pacouret, G.; Palazzini, M.; Petris, A.; Pruszczyk, P.; Rugolotto, M.; Salvi, A.; Schellong, S.; Sebbane, M.; Sobkowicz, B.; Stefanovic, B.S.; Thiele, H.; Torbicki, A.; Verschuren, F.; Konstantinides, S.V. PEITHO Investigators. Fibrinolysis for patients with intermediate-risk pulmonary embolism. N Engl J Med 2014,370(15), 1402-1411. [CrossRef] [PubMed]
- Jimenez, D.; Lobo, J.L.; Fernandez-Golfin, C.; Portillo, A.K.; Nieto, R.; Lankeit, M.; Konstantinides, S.; Prandoni, P.; Muriel,A.; Yusen, R.D. PROTECT investigators. Effectiveness of prognosticating pulmonary embolism using the ESC algorithm and the Bova score. Thromb Haemost 2016, 115(4),827-834. [CrossRef] [PubMed]
- Hobohm, L.; Hellenkamp, K.; Hasenfuß, G.; Münzel, T.; Konstantinides, S.; Lankeit, M. Comparison of risk assessment strategies for not-high-risk pulmonary embolism. Eur Respir J 2016, 47(4), 1170–1178. [Google Scholar] [CrossRef] [PubMed]
- Piazza G. Advanced Management of Intermediate- and High-Risk Pulmonary Embolism: JACC Focus Seminar. J Am Coll Cardiol 2020, 76(18):2117-2127. [CrossRef] [PubMed]
- Alkhalfan, F.; Bukhari, S.; Rosenzveig, A.; Moudgal, R.; Khan, S.Z.; Ghoweba, M.; Chaudhury, P.; Cameron, S.J.; Tefera, L. The Obesity Mortality Paradox in Patients with Pulmonary Embolism: Insights from a Tertiary Care Center. J Clin Med 2024, 13, 2375. [Google Scholar] [CrossRef] [PubMed]
- Tamami, O.; Tamami, F.; Gotur, D.B. Clinical impact of morbid obesity on pulmonary embolism hospitalizations. CHEST 2023, 164(4), supplement A 5949. [CrossRef]
- Khasin, M.; Gur, I.; Evgrafov, E.V.; Toledano, K.; Zalts, R. Clinical presentations of acute pulmonary embolism: A retrospective cohort study. Medicine (Baltimore) 2023, 102(28), e34224. [Google Scholar] [CrossRef] [PubMed] [PubMed Central]
- Quezada, A.; Jiménez, D.; Bikdeli, B.; Moores, L.; Porres-Aguilar, M.; Aramberri, M.; Lima, J.; Ballaz, A.; Yusen, R.D.; Monreal, M. RIETE investigators. Systolic blood pressure and mortality in acute symptomatic pulmonary embolism. Int J Cardiol 2020, 2020 302, 157–163. [Google Scholar] [CrossRef] [PubMed]
- Stein, P.D.; Matta, F.; Hughes, M.J. Hospitalizations for High-Risk Pulmonary Embolism. Am J Med 2021, 134(5), 621–625. [Google Scholar] [CrossRef] [PubMed]
- Ballas, C.; Lakkas, L.; Kardakari, O.; Konstantinidis, A.; Exarchos, K.; Tsiara, S.; Kostikas, K.; Naka, K.Κ.; Michalis, L.K.; Katsouras, C.S. What is the real incidence of right ventricular affection in patients with acute pulmonary embolism? Acta Cardiol 2023, 78(10), 1089–1098. [Google Scholar] [CrossRef] [PubMed]
- Hu, J.; Tian, X.; Liu, X.W.; Liu, Y.Z.; Gao, B.L.; Li, C.Y. Markers of right ventricular dysfunction predict 30-day adverse prognosis of pulmonary embolism on pulmonary computed tomographic angiography. Medicine 2023, 102(28), p e34304. [CrossRef]
- Nguyen, E.T.; Hague, C.; Manos, D.; Memauri, B.; Souza, C.; Taylor, J.; Dennie, C. Canadian Society of Thoracic Radiology/Canadian Association of Radiologists Best Practice Guidance for Investigation of Acute Pulmonary Embolism, Part 1: Acquisition and Safety Considerations. Can Assoc Radiol J 2022, 73(1), 203–213. [Google Scholar] [CrossRef] [PubMed]
- Çil, E.; Çoraplı, M.; Karadeniz, G.; Çoraplı, G.; Başbuğ Baltalı,T. The relationship between pulmonary artery obstruction index and troponin in thorax computed tomography in pulmonary embolism. J Health Sci Med / JHSM 2022, 5(5),1361-1365. [CrossRef]
- Ghanima,W.; Abdelnoar,M.;Holmen, L.O.; Nielssen, B.E.; Ross, S.; Sandset,P.M. D-dimer level is associated with the extent of PE. Throm Res, 2007, 120(2), 281-288. [CrossRef]
- Inönü, H.; Acu, B.; Pazarlı,A.C.; Doruk, S.; Erkorkmaz, Ü.; Altunkaş, A. The value of the computed tomographic obstruction index in the identification of massive pulmonary thromboembolism. Diagn Interv Radiol 2012, 18(3), 255-60. [CrossRef] [PubMed]
- Jia, D.; Li, X.L.; Zhang, Q.; Hou, G.; Zhou, X.; Kang, J. A decision tree built with parameters obtained by computed tomographic pulmonary angiography is useful for predicting adverse outcomes in non-high-risk acute pulmonary embolism patients. Respir Res 2019, 20(1), 187. [Google Scholar] [CrossRef] [PubMed] [PubMed Central]
- Giannitsis, E.; Müller-Bardorff, M.; Kurowski, V .; Weidtmann, B.; Wiegand, U.; Kampmann, M.; Katus, H.A. Independent prognostic value of cardiac troponin T in patients with confirmed pulmonary embolism. Circ 2000, 102(2), 211-217. [CrossRef] [PubMed]
- Karolak, B.; Ciurzyński, M.; Skowrońska, M.; Kurnicka, K.; Pływaczewska, M.; Furdyna, A.; Perzanowska-Brzeszkiewicz, K.; Lichodziejewska, B.; Pacho, S.; Machowski, M.; et al. Plasma Troponins Identify Patients with Very Low-Risk Acute Pulmonary Embolism. J Clin Med 2023, 12(4), 1276. [Google Scholar] [CrossRef] [PubMed]
- Jiménez, D .; de Miguel-Díez, J.; Guijarro, R.; Trujillo-Santos, J.; Otero, R.; Barba, R.; Muriel ,A.; Meyer, G.;Yusen ,R.D.; Monreal, M. RIETE Investigators. Trends in the Management and Outcomes of Acute Pulmonary Embolism: Analysis From the RIETE Registry. J Am Coll Cardiol 2016, 67(2), 162-170. [CrossRef] [PubMed]
- Akhoundi, N.; Faghihi Langroudi ,T.; Rezazadeh, E.; Rajebi, H.; Komijani Bozchelouei, J.; Sedghian, S.; Sarfaraz, T.; Heydari, N. Role of Clinical and Echocardiographic Findings in Patients with Acute Pulmonary Embolism: Prediction of Adverse Outcomes and Mortality in 180 Days. Tanaffos 2021, 20(2),99-108. [PubMed]
- Brunton, N.; McBane, R.; Casanegra, A.I.; Houghton, D.E.; Balanescu, D.V.; Ahmad, S.; Caples, S.; Motiei, A.; Henkin, S. Risk Stratification and Management of Intermediate-Risk Acute Pulmonary Embolism. J Clin Med 2024, 13(1), 257. [Google Scholar] [CrossRef] [PubMed] [PubMed Central]
- Zorlu, S.A. Value of computed tomography pulmonary angiography measurements in predicting 30-day mortality among patients with acute pulmonary embolism. Pol J Radiol 2024, 89, e225–e234. [Google Scholar] [CrossRef] [PubMed] [PubMed Central]
Figure 1.
ROC curve for PAOI in intermediate, and high risk PE prediction.
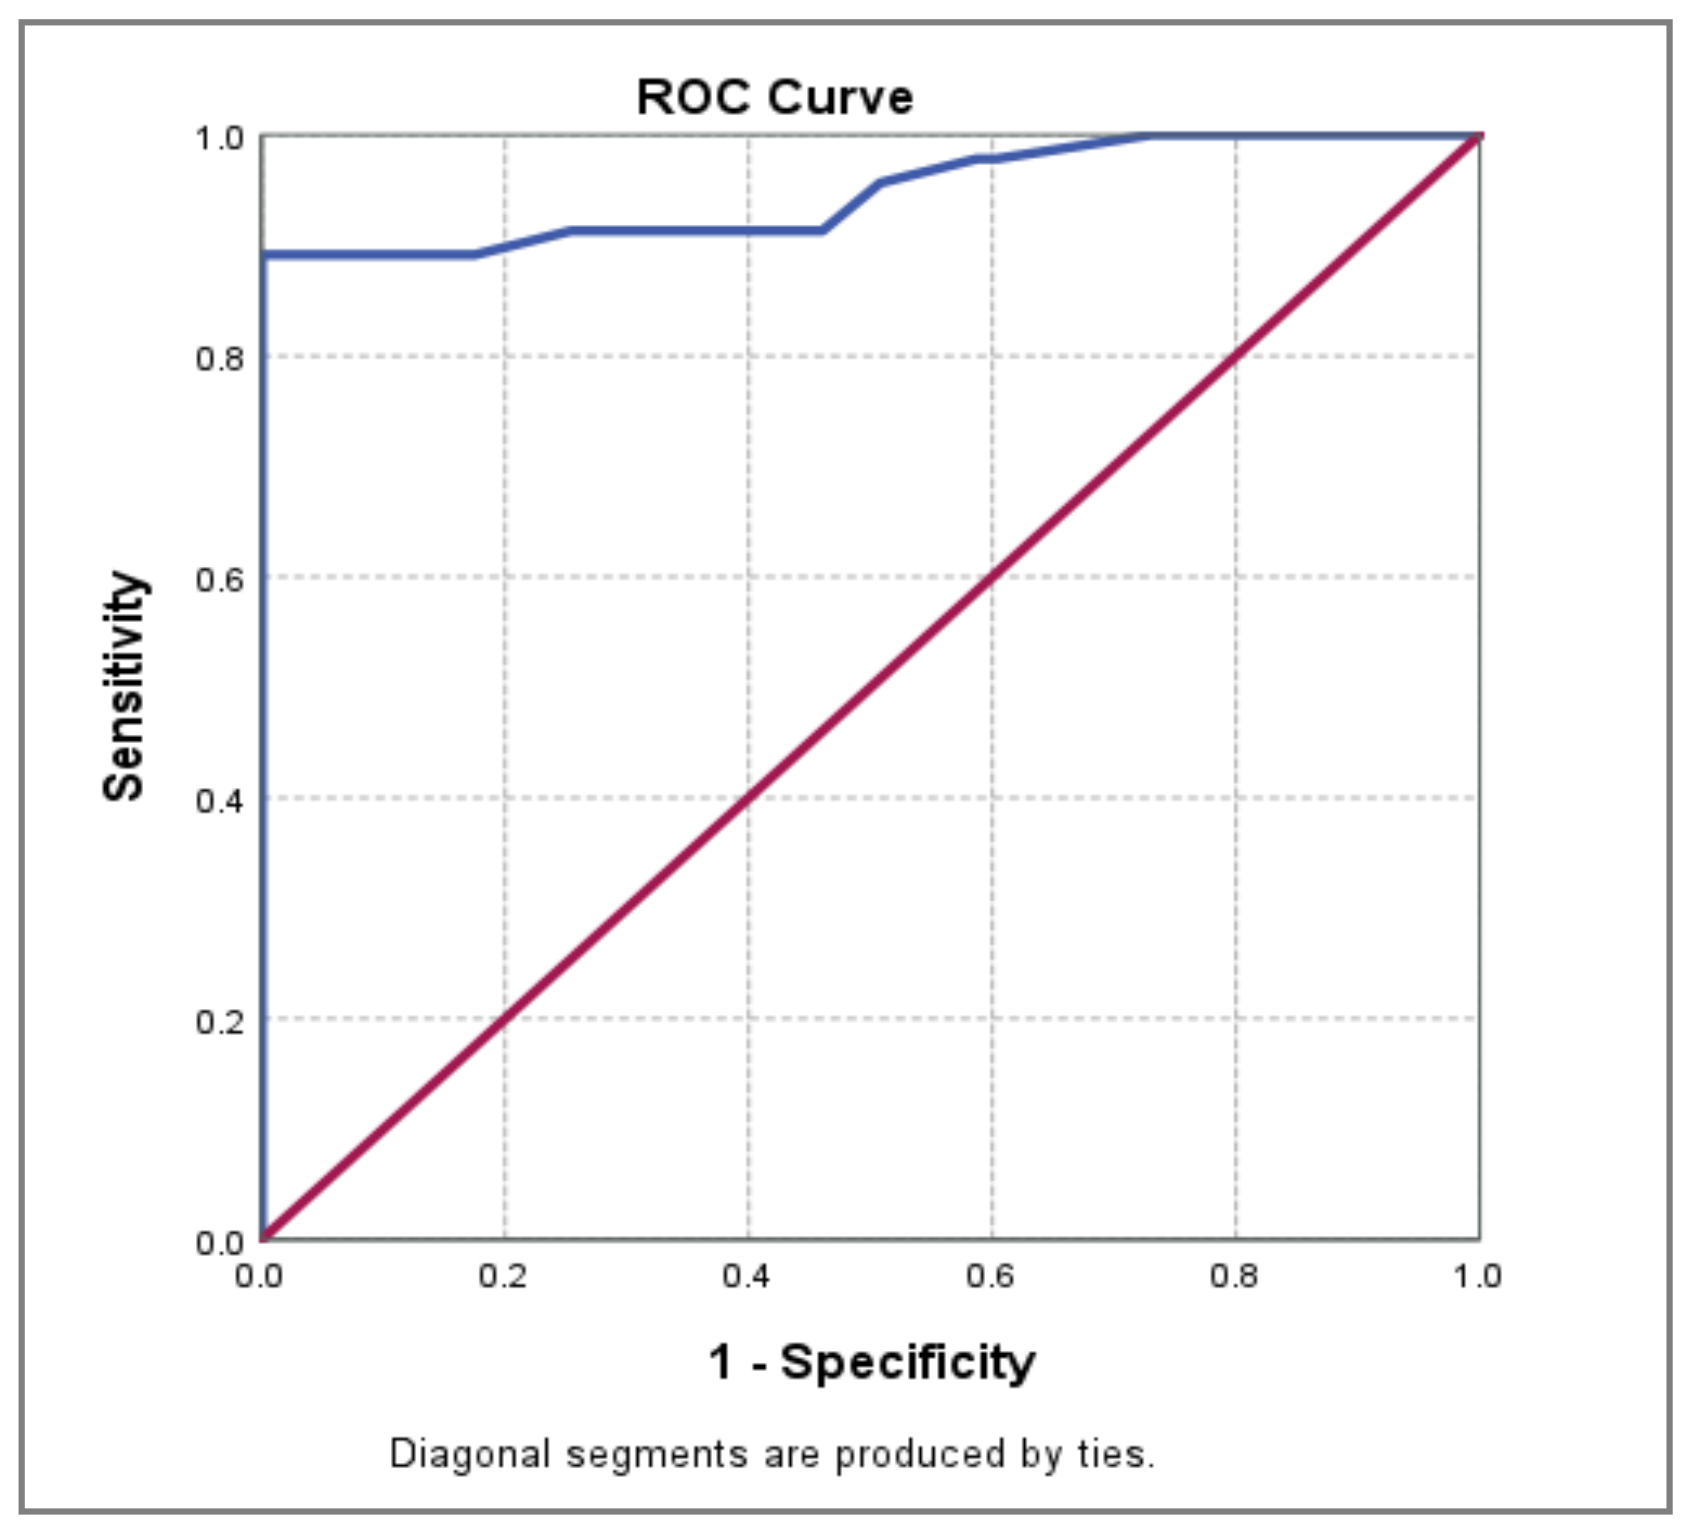
Figure 2.
ROC curve for PAOI in high risk PE prediction.
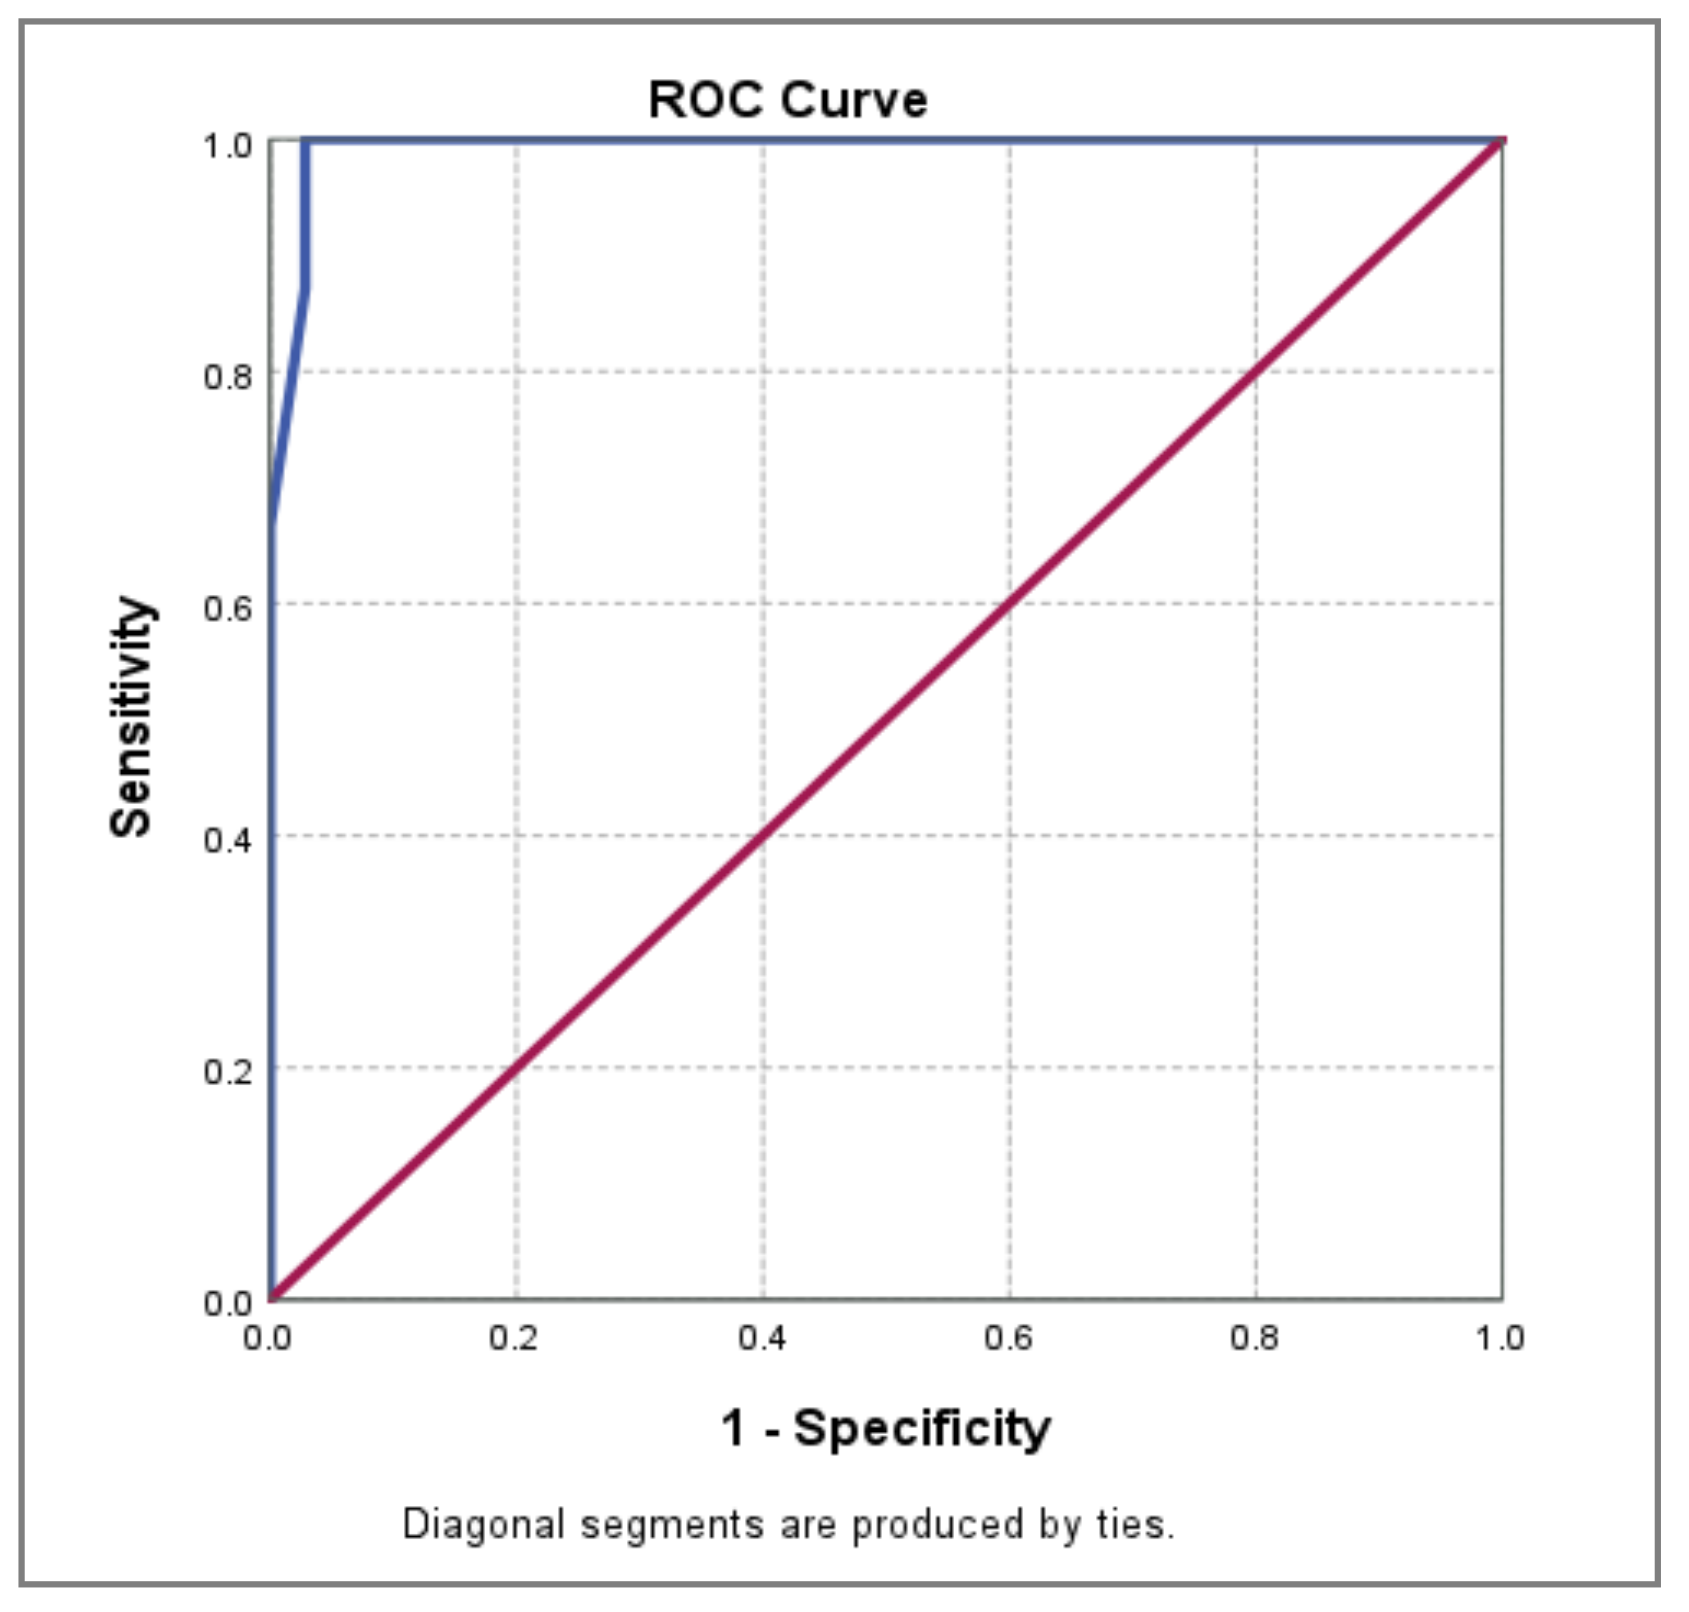
Figure 3.
ROC curve for D-dimer in PE 7-day mortality prediction.
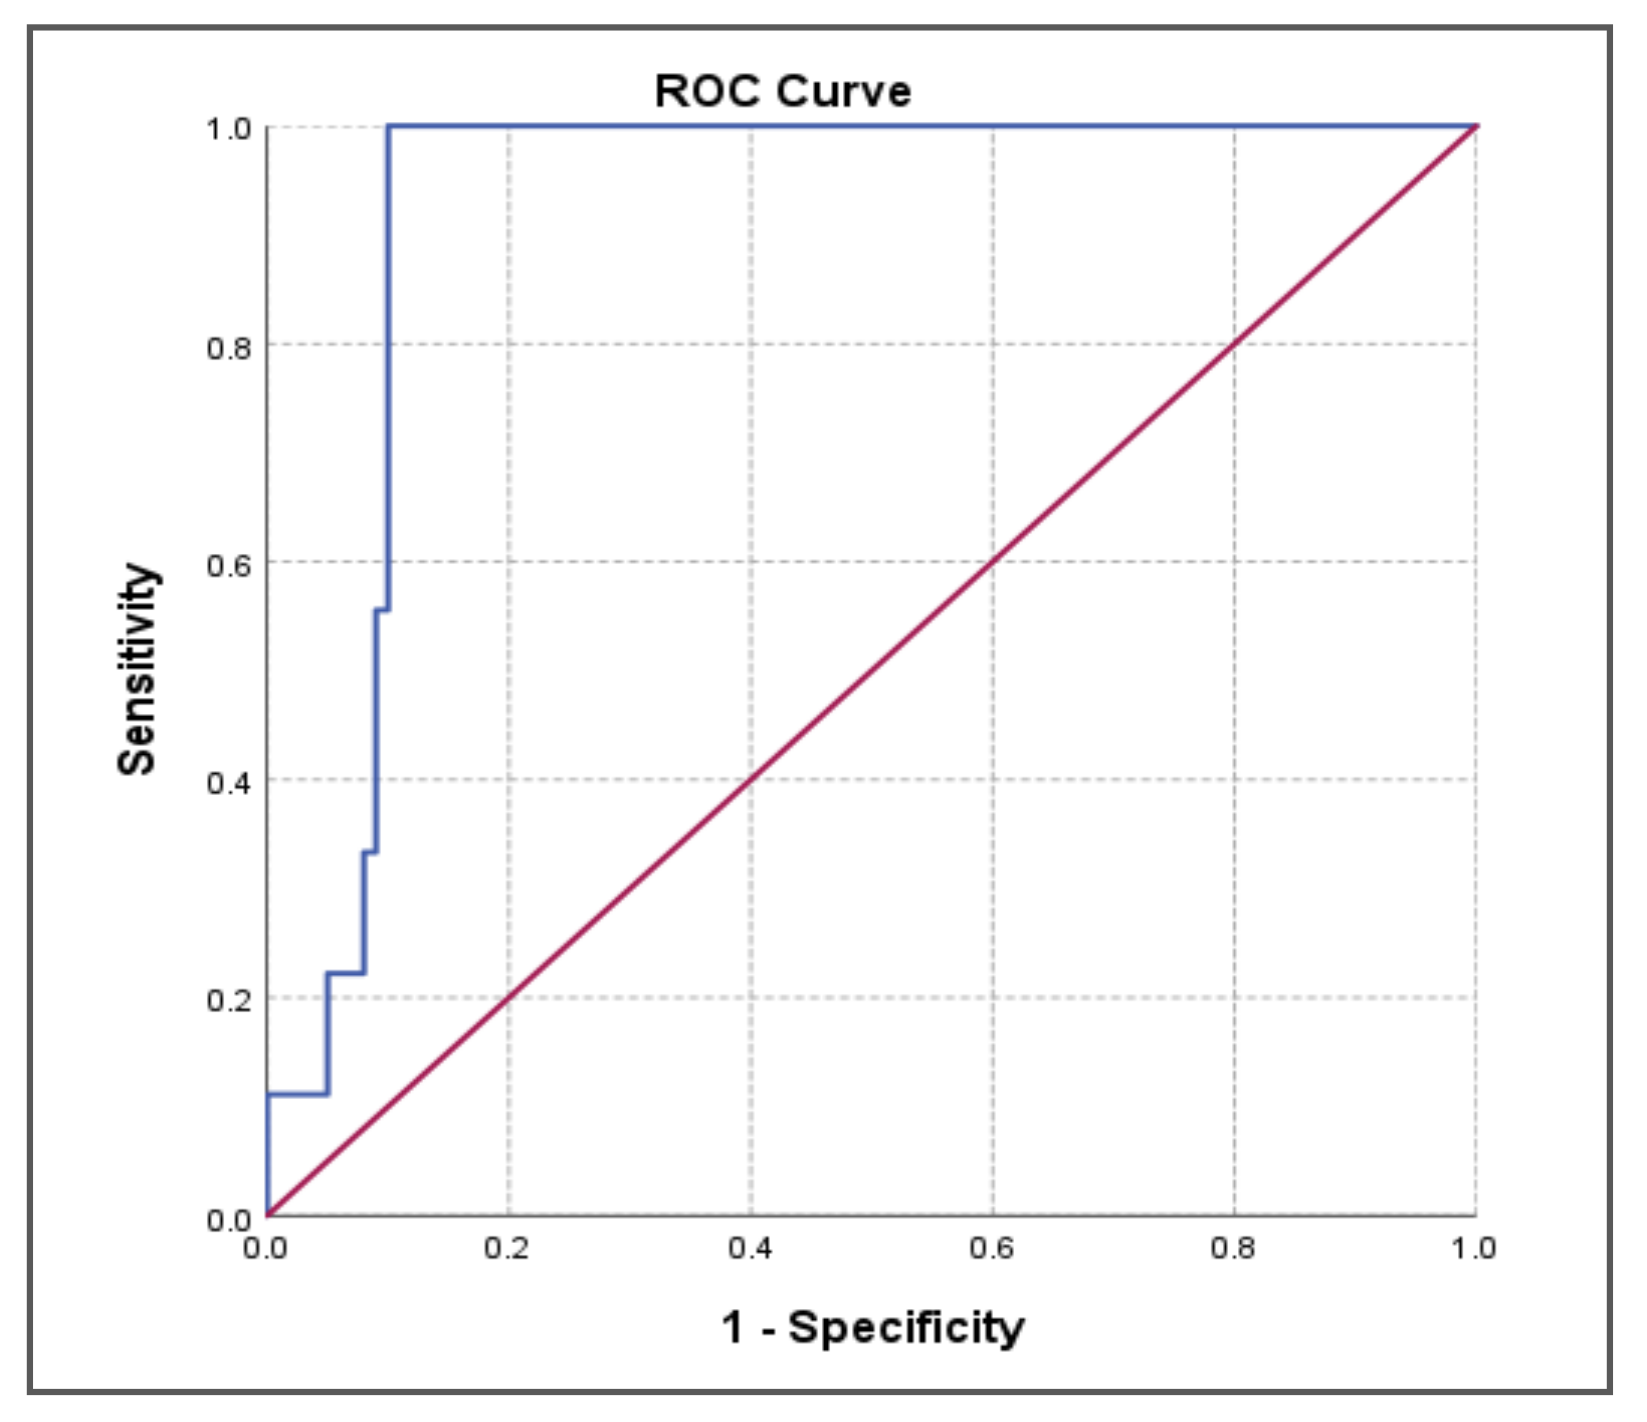
Figure 4.
ROC curve for c-TnT in PE 7-day mortality prediction.
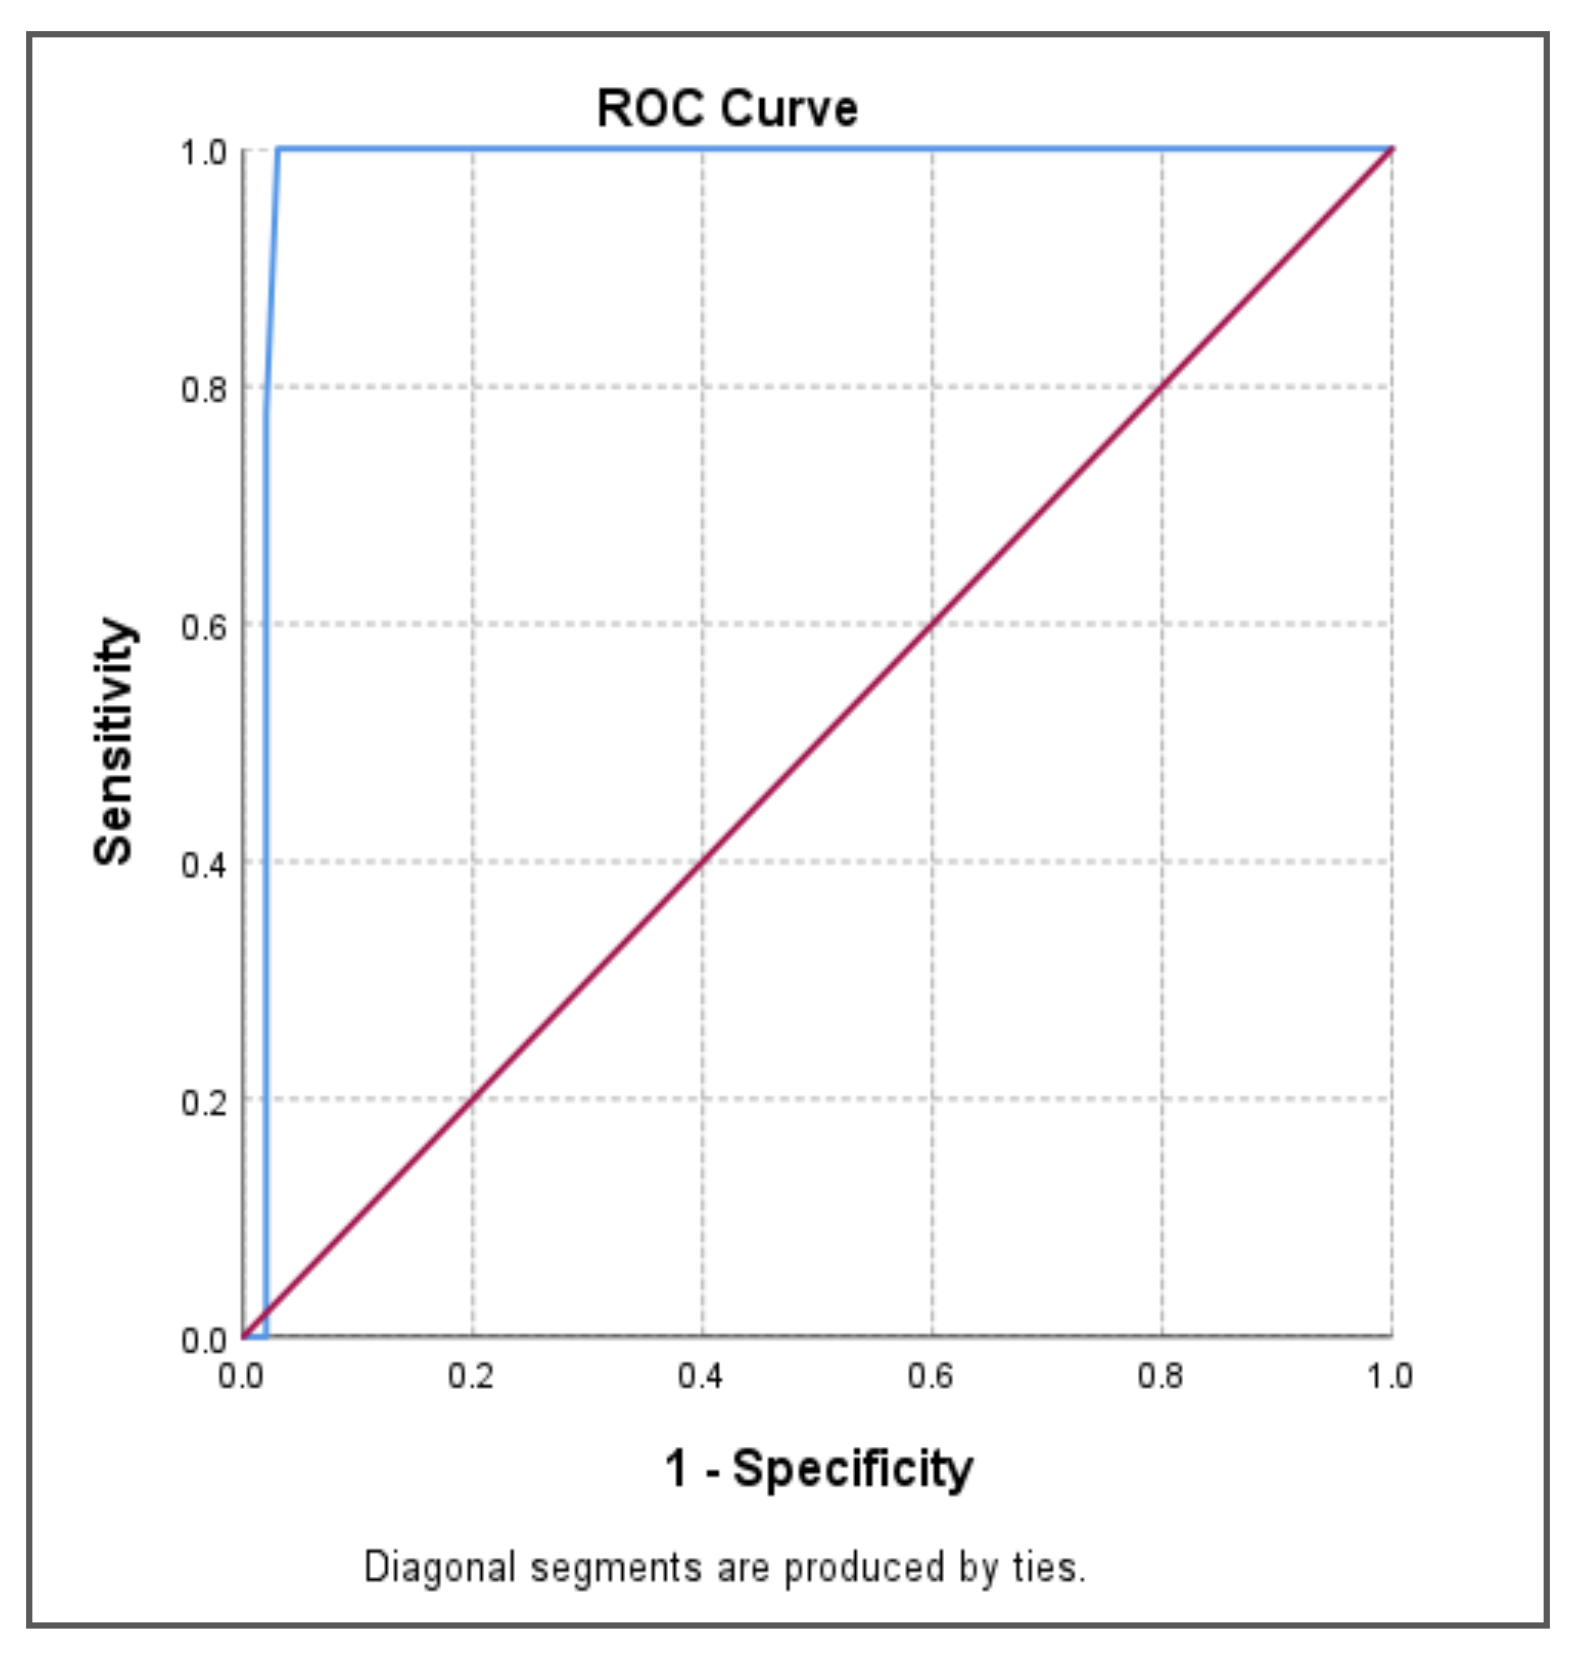

Table 1.
Etiology for isolated-PE.
| Frequency | Pathological condition |
| Rarely | Factor V Leiden mutation |
| Rarely Rarely |
Prothrombin mutation Anti-phosholipid syndrome |
| Very rarely | Antithrombin/protein C /protein S deficiency |
| Frequently | Chronic bronchial asthma/ COPD/ infectious respiratory disease |
| Frequently | AF, CAD, MI, CMP |
Table 2.
PE risk stratification and treatment.
| Risk | Hemodynamics | Right ventricle | Treatment |
| Low | Stable | Normal function | DOAC |
| Intermediate | Stable | Dysfunction | DOAC |
| High | Unstable | Dysfunction | Systemic thrombolysis/ I / S |
DOAC = direct oral anticoagulants; I = interventional; S= surgery.
Table 3.
Characteristics of the sample.
| Characteristics | n | % |
| Gender | ||
| Male | 49 | 45.0 |
| Female | 60 | 55.0 |
| Age(mean ± SD) | 66.79 ± 14.017 | |
| Obesity | 64 58.7 | |
| Dyspnoea | 73 | 66.9 |
| Heart failure clinical signs | 44 | 40.3 |
| Hemodynamic instability | 38 | 34.9 |
| DVT | 35 | 32.1 |
| AF | 32 | 29.4 |
| COVID | 28 | 25.7 |
| Cancer | 14 | 12.8 |
| COPD | 7 | 6.4 |
n=number; SD= standard deviation.
Table 4.
The correlation between PAOI, and D-dimer.
| m ± SD | 95% CI | Median | Q1÷Q3 | p-value† | Rho‡ | ||
| Entire sample (n = 109) D-dimer | |||||||
| PAOI | <35% | 835.55 ± 244.533 | 778.49 ÷ 892.60 | 798.00 | 659.50 ÷ 942.00 | <0.001** | 0.855** |
| ≥35% | 1376.25 ± 181.981 | 1314.68 ÷ 1437.82 | 1387.00 | 1216.50 ÷ 1527.00 | |||
| DVT (n = 35) D-dimer | |||||||
| PAOI | <35% | 782.36 ± 211.364 | 688.65 ÷ 876.08 | 794.00 | 595.75 ÷ 884.25 | <0.001** | 0.908** |
| ≥35% | 1327.54 ± 215.926 | 1197.06 ÷ 1458.02 | 1257.00 | 1128.00 ÷ 1525.00 | |||
| AF (n = 32) D-dimer | |||||||
| PAOI | <35% | 761.09 ± 223.029 | 662.21 ÷ 859.98 | 711.00 | 581.50 ÷ 906.00 | <0.001** | 0.942** |
| ≥35% | 1349.10 ± 165.779 | 1230.51 ÷1467.69 | 1372.00 | 1184.00 ÷ 1456.75 | |||
| COPD (n = 7) D-dimer | |||||||
| PAOI | <35% | 788.80 ± 116.395 | 644.28 ÷ 933.32 | 823.00 | 684.00 ÷ 876.50 | 0.095 | 0.982** |
| ≥35% | 1313.50 ± 9.192 | 1230.91 ÷1396.09 | 1313.50 | 1307.00 ÷ 1320.00 | |||
| COVID (n = 28) D-dimer | |||||||
| PAOI | <35% | 953.24 ± 251.433 | 823.96 ÷ 1082.51 | 918.00 | 728.50 ÷ 1099.50 | <0.001** | 0.913** |
| ≥35% | 1472.82 ± 143.500 | 1376.41 ÷ 1569.22 | 1493.00 | 1356.00 ÷ 1552.00 | |||
| Cancer (n = 14) D- dimer | |||||||
| PAOI | <35% | 1000.50 ± 286.747 | 818.31 ÷ 1182.69 | 923.00 | 778.75 ÷ 1398.00 | 0.352 | 0.091 |
| ≥35% | 1364.00 ± 48.083 | 931.99 ÷ 1796.01 | 1364.00 | 1330.00 ÷ 1322.00 | |||
| †Mann-Whitney test; p < 0.05* statistical significance; p < 0.01** high statistical significance; ‡Spearman’s correlation coefficient; 0.8 ≤ Rho ≤ 1.00 very strong statistical correlation;Q1 minimum value;Q3 maximum value | |||||||
Table 5.
The correlation between PAOI, and c-TnT.
| c-TnT | Total | p-value† | Rho‡ | ||||||
| Normal | Increased | ||||||||
| n | % | n | % | N | % | ||||
| Entire sample (n = 109) | |||||||||
| PAOI | <35% | 54 | 100.0% | 19 | 34.5% | 73 | 67.0% | <0.001** | 0.815** |
| ≥35% | - | - | 36 | 65.5% | 36 | 33.0% | |||
| Total | 54 | 100.0% | 55 | 100.0% | 109 | 100.0% | |||
| DVT (n = 35) | |||||||||
| PAOI | <35% | 19 | 100.0% | 3 | 18.8% | 22 | 62.9% | <0.001** | 0.882** |
| ≥35% | - | - | 13 | 81.3% | 13 | 37.1% | |||
| Total | 19 | 100.0% | 16 | 100.0% | 35 | 100.0% | |||
| AF (n = 32) | |||||||||
| PAOI | <35% | 17 | 100.0% | 5 | 33.3% | 22 | 68.8% | <0.001** | 0.937** |
| ≥35% | - | - | 10 | 66.7% | 10 | 31.3% | |||
| Total | 17 | 100.0% | 15 | 100.0% | 32 | 100.0% | |||
| COPD (n = 7) | |||||||||
| PAOI | <35% | - | - | 5 | 71.4% | 5 | 71.4% | - | 0.982** |
| ≥35% | - | - | 2 | 28.6% | 2 | 28.6% | |||
| Total | - | - | 7 | 100.0% | 7 | 100.0% | |||
| COVID (n = 28) | |||||||||
| PAOI | <35% | 13 | 100.0% | 4 | 26.7% | 17 | 60.7% | <0.001** | 0.828** |
| ≥35% | - | - | 11 | 73.3% | 11 | 39.3% | |||
| Total | 13 | 100.0% | 15 | 100.0% | 28 | 100.0% | |||
| Cancer (n = 14) | |||||||||
| PAOI | <35% | 9 | 100.0% | 3 | 60.0% | 12 | 85.7% | 0.110 | 0.118 |
| ≥35% | - | - | 2 | 40.0% | 2 | 14.3% | |||
| Total | 9 | 100.0% | 5 | 100.0% | 14 | 100.0% | |||
| †Pearson Chi-squared test; p< 0.05*statistical significance; p< 0.01**high statistical significance; ‡Spearman’s correlation coefficient; 0.8≤ Rho ≤1.00 very strong statistical correlation | |||||||||
Table 6.
The correlation between PAOI - D-dimer – c-TnT.
| D-dimer | p-value† | |||||
| Mean ± SD | 95% CI | Median | Q1÷Q3 | |||
| Entire sample (n = 109) | ||||||
| PAOI < 35% normal cTnT |
742.69 ± 140.768 | 704.26 ÷ 781.11 | 736.50 | 604.50 ÷ 855.00 | <0.001** | |
| PAOI < 35% elevated cTnT |
1099.47 ± 285.381 | 961.92 ÷ 1237.02 | 1032.00 | 846.00 ÷ 1438.00 | ||
| PAOI ≥35% elevated cTnT |
1376.25 ± 181.981 | 1314.68 ÷ 1437.82 | 1387.00 | 1216.50 ÷ 1527.00 | ||
| DVT (n = 35) | ||||||
| PAOI < 35% normal cTnT |
728.00 ± 144.463 | 658.37 ÷ 797.63 | 790.00 | 574.00 ÷ 864.00 | <0.001** | |
| PAOI < 35% elevated cTnT |
1126.67 ± 274.527 | 444.70 ÷ 1808.63 | 1032.00 | - | ||
| PAOI ≥35% elevated cTnT |
1327.54 ± 215.926 | 1197.06 ÷ 1458.02 | 1257.00 | 1128.00 ÷ 1525.00 | ||
| AF (n = 32) | ||||||
| PAOI < 35% normal cTnT |
672.29 ± 125.463 | 607.79 ÷ 736.80 | 628.00 | 572.00 ÷ 753.00 | <0.001** | |
| PAOI < 35% elevated cTnT |
1063.00 ± 225.241 | 783.33 ÷ 1342.67 | 985.00 | 915.50 ÷ 1249.50 | ||
| PAOI ≥35% elevated cTnT |
1349.10 ± 165.779 | 1230.51 ÷ 1467.69 | 1372.00 | 1184.00 ÷ 1456.75 | ||
| COPD (n = 7) | ||||||
| PAOI < 35% normal cTnT | - | - | - | - | 0.053 | |
| PAOI < 35% elevated cTnT | 788.80 ± 116.395 | 644.28 ÷ 933.32 | 823.00 | 684.00 ÷ 876.50 | ||
| PAOI ≥ 35% elevated cTnT |
1313.50 ± 9.192 | 1230.91 ÷ 1396.09 | 1313.50 | 1307.00 ÷ 1320.00 | ||
| COVID (n = 28) | ||||||
| PAOI < 35% normal cTnT | 836.23 ± 117.683 | 765.12 ÷ 907.35 | 807.00 | 726.50 ÷ 969.00 | <0.001** | |
| PAOI < 35% elevated cTnT | 1333.50 ± 172.171 | 1059.54 ÷ 1607.46 | 1331.00 | 1183.25 ÷ 1486.25 | ||
| PAOI ≥ 35% elevated cTnT | 1472.82 ± 143.500 | 1376.41 ÷ 1569.22 | 1493.00 | 1356.00 ÷1552.00 | ||
| Cancer (n = 14) | ||||||
| PAOI < 35% normal cTnT | 850.33 ± 106.937 | 768.13 ÷ 932.53 | 852.00 | 738.00 ÷ 957.00 | 0.009** | |
| PAOI < 35% elevated cTnT | 1451.00 ± 24.269 | 1390.71 ÷ 1511.29 | 1438.00 | 1436.00 ÷ 1458.50 | ||
| PAOI ≥35% elevated cTnT | 1364.00 ± 48.083 | 931.99 ÷ 1796.01 | 1364.00 | 1330.00 ÷ 1398.00 | ||
| †Kruskal-Wallis test; p<0.05* statistical significance; p<0.01** high statistical significance; | ||||||
Table 7.
PE risk assesment, for the entire sample, and for different etiologies .
| PE etiology | Low risk(n,%) | Intermediate risk(n,%) | High risk(n,%) |
| Entire sample | 69(63.3) | 4(3.66) | 36(33) |
| DVT | 22(20.1) | - | 13(11.9) |
| AF | 22(20.8) | - | 10(9.17) |
| COPD | 1(0.91) | 4(3.66) | 2(1.82) |
| Covid | 17(15.5) | - | 11(10) |
| Cancer | 12(11) | - | 2(1.83) |
Table 8.
AUC, and PAOI cutt-off value in intermediate, and high risk PE prediction.
| Area under Curve | p-value | 95% CI | ||||
| Lower Bound | Upper Bound | Sensitivity | Specificity | PAOI cut-off value | ||
| 0.948 | 0.000** | 0.901 | 0.995 | 89,1% | 100% | 33% |
Table 9.
AUC, and PAOI cutt-off value, in high risk PE prediction.
| Area under Curve | p-value | 95% CI | ||||
| Lower Bound | Upper Bound | Sensitivity | Specificity | PAOI cut-off value | ||
| 0.993 | 0.000** | 0.983 | 1.000 | 100.0% | 97.1% | 32.5% |
Table 10.
AUC, and D-dimer cutt-off value in PE 7-day mortality prediction.
| Area under Curve | p-value | 95% CI | ||||
| Lower Bound | Upper Bound | Sensitivity | Specificity | D-dimer cut-off value | ||
| 0.921 | 0.000** | 0.869 | 0.973 | 100.0% | 90.0% | 1420.00 |
Table 11.
AUC, and c-TnT cutt-off value in 7-day mortality.
| Area under Curve | p-value | 95% CI | ||||
| Lower Bound | Upper Bound | Sensitivity | Specificity | cTnT cut-off value | ||
| 0.979 | 0.000** | 0.951 | 1.000 | 100.0% | 97.0% | 131.00 |
Table 12.
Biomarkers, PAOI, and 7-day mortality in the entire sample with PE.
| Entire sample (n = 109) |
7-day mortality | p-value† | |
| Yes (n=9) |
no (n=100) |
||
| D-dimer (m ± SD) | 1502.78 ± 102.303 | 970.15 ± 319.202 | <0.001** |
| cTnT (m ± SD) | 134.78 ± 2.279 | 44.86 ± 46.601 | <0.001** |
| PAOI (m ± SD) | 31.94 ± 27.607 | 27.06 ± 20.664 | 0.741 |
| †Pearson Chi-squared test; p<0.01** high statistical significance; m ± SD = mean ± standard deviation; n-number | |||
Table 13.
Biomarkers, PAOI, and 7-day mortality in AF patients with PE.
| AF (n = 32) | 7-day mortality | p-value† | |
| Yes (n=2) |
no (n=30) |
||
| D-dimer (m ± SD) | 1436.00 ± 8.485 | 912.10 ± 329.800 | 0.036* |
| cTnT (m ± SD) | 133.50 ± 2.121 | 39.97 ± 46.714 | 0.004** |
| PAOI (m ± SD) | 33.75 ± 22.981 | 26.17 ± 22.008 | 0.532 |
| †Pearson Chi-squared test; p<0.05* statistical significance; p<0.01** high statistical significance; ; m ± SD = mean ± standard deviation; n-number | |||
Table 14.
Biomarkers, PAOI, and 7-day mortality in Covid patients with PE.
| Covid (n = 28) | 7- day mortality | p-value† | |
| Yes (n=5) |
no (n=23) |
||
| D-dimer (m ± SD) | 1546.00 ± 123.968 | 1072.87 ± 304.477 | 0.003** |
| cTnT (m ± SD) | 135.60 ± 1.517 | 49.04 ± 50.963 | 0.002** |
| PAOI (m ± SD) | 49.50 ± 25.274 | 26.20 ± 18.963 | 0.045* |
| †Pearson Chi-squared test; p<0.05* statistical significance; p<0.01** high statistical significance; m ± SD = mean ± standard deviation; n-number | |||
Table 15.
Biomarkers, PAOI, and 7-day mortality in cancer patients with PE.
| Cancer (n = 14) | 7-day mortality | p-value† | |
| Yes (n=3) |
No (n=11) |
||
| D-dimer (m ± SD) | 1451.00 ± 24.269 | 943.73 ± 229.250 | 0.005* |
| cTnT (m ± SD) | 134.33 ± 3.215 | 26.36 ± 37.294 | 0.005** |
| PAOI (m ± SD) | 7.50 | 22.95 ± 14.655 | 0.038* |
| †Pearson Chi-squared test; p<0.05* statistical significance; p<0.01** high statistical significance; m ± SD = mean ± standard deviation; n-number | |||
Disclaimer/Publisher’s Note: The statements, opinions and data contained in all publications are solely those of the individual author(s) and contributor(s) and not of MDPI and/or the editor(s). MDPI and/or the editor(s) disclaim responsibility for any injury to people or property resulting from any ideas, methods, instructions or products referred to in the content. |
© 2024 by the authors. Licensee MDPI, Basel, Switzerland. This article is an open access article distributed under the terms and conditions of the Creative Commons Attribution (CC BY) license (http://creativecommons.org/licenses/by/4.0/).
Copyright: This open access article is published under a Creative Commons CC BY 4.0 license, which permit the free download, distribution, and reuse, provided that the author and preprint are cited in any reuse.


