
Submitted:
15 July 2024
Posted:
16 July 2024
You are already at the latest version
Abstract
The present paper deals with research on maintenance strategy and maintenance process improvement procedures to increase the efficiency and quality of the production system. It includes the design of maintenance performance indicators relevant to today's manufacturing systems to track improvements in the sustainable development of the manufacturing system. There are also the basic principles of maintenance strategy with linkages to the manufacturing system and selecting the strategy for the organization. The paper emphasizes maintenance management auditing and quality implementation in maintenance. Further, there is the process of changing the maintenance strategy described. This process includes reassessing the criticality of machines and equipment and their design units, then resource and capacity planning and input for maintenance management. It describes the impact of changing the maintenance management organization and maintenance capacity considering the change of strategy and the evaluation of maintenance choice alternatives, together with an analysis of the optimization procedure, which has an impact on social implication. The paper concludes by presenting the achieved impacts of maintenance strategy are: (1) increase in production efficiency (10%), (2) quality improvement in production (20%), (3) performance improvement (30%), (4) reduction of maintenance process costs (35%).
Keywords:
effectiveness
; management
; planning
; organizational strategy
; organizational challenges
1. Introduction
In recent years, we have experienced a tremendous boom in the digitalization of processes that speed up decision-making processes in manufacturing companies. The use of machine learning algorithms and artificial intelligence is gradually becoming a normal part of our lives. At the same time, new designed production and assembly systems need maintenance systems for maintenance management and diagnostics of production equipment. Enterprises [1] need to identify tools and technologies for maintenance planning and management in line with Industry 4.0 approaches. The focus is on the application of a maintenance prediction program, the implementation of technical diagnostics equipment, the implementation of smart sensors, the interconnection of equipment using the Internet of Things, and the use of mobile applications in maintenance.
The concept of Industry 4.0. [2,3,4,5] helps industrial enterprises to achieve rapid adaptation of new production and enable timely response against occurring faults caused by new production ramp-up and emerging production equipment failures by using an intelligent maintenance system integrated into a digital twin. The maintenance manager uses standard indicators such as OEE (Overall Equipment Effectiveness), MTTR (Mean Time to Repair), MTBF (Mein Time Between Failure), R (t) (Probability of trouble-free operation), F(t) (Probability of Failure), A (Availability), λ (Intensity of disturbances), availability and reliability of machines and equipment. These indicators take a picture of the state of operation of the production and assembly lines in detail, for decision-making. The above indicators are obtained from data sensed by sensors on the plant floor.
Maintenance departments are still "fighting fires" instead of tackling their problems systematically. Instead of waiting for problems to occur, prevention is a better goal. Although this strategy may be a bit costly initially, but it is much less costly compared to waiting for problems [6,7].
Maintenance performance is concerned with four areas: maintaining critical systems, fixing the problem faster than before, determining the causes of frequent failures, and finally identifying the 20% of failures that occupy 80% of the available resources.
The most common troubleshooting process in maintenance includes identifying faults and where machine failures occur, analysing faults, defining cause relationships, defining goals, and planning resources to eliminate and prevent faults [8].
The above procedure is defined as a set maintenance management strategy, which needs to be re-evaluated depending on the fulfilment of key production system indicators such as efficiency and quality.
Maintenance is the combination of all practical, managerial, and administrative activities throughout the life cycle of an installation to maintain or restore it to a state in which it can perform its required function. It is also defined as all the necessary and essential activities that are required to maintain a system throughout its life cycle in an operational and functional state or to restore it to a state in which it can perform its intended function [9,10]. The importance of the maintenance function has increased over time due to its role and impact on the rest of the working environment in the organization, i.e., by improving product quality and machine availability. Effective maintenance contributes to increased value through more profitable use of resources, improved product quality, and reduced rework and scrap [11]. The maintenance is categorized into two main areas, i.e., preventive maintenance, which includes all planned maintenance activities such as condition monitoring and periodic inspection, while corrective maintenance has to do with all unplanned maintenance activities to restore failure (Figure 1).
As always, the basic commitment of creation is to deliver the goods, but an effective maintenance strategy affects the production capacity of the machines used to produce these products [12]. Therefore, maintenance can be considered as an organizational purpose that works in concert with production. When others reiterate that production produces products, others also say that maintenance produces the capacity for production.
A company's profitability and survival may not be sustained without maintaining product quality. High quality can serve as a major edge to a company's competitive advantage and long-term profitability in the modern global economy. Normally, they say that equipment/machines that lack maintenance and break down often lose speed and therefore cause defects (breakdowns). This equipment usually out of control production processes. Obviously, a process that is out of control leads to the production of defective products and increases the cost of production, which minimizes profit. [13,14].
Profitability is the result of price and productivity recovery. Consequently, productivity determines the efficiency and effectiveness of the production process. According to APQC (American Productivity & Quality Center) cited [15] when analyzing the profitability of maintenance, the impact of the work area is also measured, for example, by guaranteeing the role of maintenance within the life cycle of the machine. In general, maintenance improvement aims to reduce operating costs and increase product quality. [16,17]
Certainly, if there is a connection or rather a link between maintenance and profitability. The diagram of Figure 2 shows how these two objectives are linked together.
Maintenance activities are managed in accordance with the established maintenance policy and with the intention of achieving the desired objectives. The maintenance strategy for the production support process (as part of the company's strategy) can be based on and support the company's objectives and strategy, perspectives, and background.
For the development of the maintenance strategy, the enterprise strategy provides information on the expected production and product portfolio, expected production expansion and contraction programs, expected changes in production equipment and other tangible assets, logistical aspects of production processes, expected financial resources, the way production equipment is operated and used (it provides information on the expected variability in the use of production equipment and the resulting expected intensity of use of the calendar time pool, the required times of use and operation and the consequent required volumes of maintenance activities, etc.).
For the purposes of the maintenance strategy, these data are expanded into a more detailed and specific form (e.g. the structure and number of production facilities, data on their reliability, in particular the requirements for the volume of preventive and corrective maintenance in standard hours, possibly also in financial terms, the requirements for mechanical, electrical and other maintenance, the expected structure of internal and external maintenance, outsourcing, serviceability, criticality of inclusion in production lines and processes, the effects of downtime, etc.).
The results achieved in the medium and long term depend on the maintenance strategy. It is mainly about efficiency, productivity, economic efficiency, and the fulfilment of basic maintenance requirements, in particular:
- keeping assets in a serviceable and adequate condition,
- preventing breakdowns,
- operational troubleshooting,
- reducing the environmental impact of the operation of the equipment,
- ensuring operational safety,
- incurring optimum maintenance costs.
The objectives should be hierarchical, quantified, realistic and mutually aligned. If a company chooses a strategy, it must implement it consistently if it is to be successful.
Strategies can focus on, for example:
- seeking opportunities that make the most of strengths,
- overcoming weaknesses to exploit opportunities,
- using strengths to eliminate risks,
The required level of maintenance of the long-term asset, the model of excellence is based on:
- from a methodological point of view, it is more efficient and practical to determine the levels of excellence directly by individual audit criteria and for individual management audit questions,
- this process is extremely difficult, objective information is often lacking, it is necessary to take an expert to intuitive approach to determining the level of excellence,
- benchmarking can be a great help if the required data can be obtained.
The expected benefit, provided the organization’s strategy is properly integrated into maintenance management, is a significant improvement in its performance, efficiency, and overall economic effectiveness. If the implementation of the strategy is to be successful, it must be known in the organization and supported by maintenance management. [22,23]
It is about creating a sense of belonging amongst the workforce with the company and the workplace. Motivation should be the feeling that their work is meaningful.
In the process of developing a strategy, a long-term programme of improvement and change is created, including a change in working style. In the long term, a flat organizational structure and the use of small, autonomous, and flexible groups are best suited to achieving this in a flexible way. It is common to see a change in organizational structure with a change in management. Thus, if maintenance is centralized, it is changed to decentralized and vice versa. Similarly, the trend in companies is to focus on the "core business" and to separate other activities - in the case of maintenance, not to outsource them. [24,25,26,27]
There is currently no coherent view of the different organizational structures and their models for businesses, and, in principle, there should be no reason why. Each form of maintenance organization has its pros and cons. Similarly, in-house maintenance is not automatically better or worse than contractor maintenance. It is up to the management of the enterprise to consider the specific conditions, make the most of the strengths, and counteract the weaknesses of each system.
2. Materials and Methods
The maintenance objectives and strategies are intended to guide maintenance management to achieve 'excellence' in the maintenance of physical assets. The strategy developed requires the development of supporting programs for its implementation. This output should take the form of topics for improvement of maintenance with a time horizon for solutions generally within one year (exceptionally longer), with defined responsibilities of researchers and implementers, resources, and individual milestones for implementation. The same attention as the design of support programs must be given to their implementation.
2.1. Maintenance Strategy for Long-Term Asset (LTA)
The marketing strategy is based on the organization’s municipal business strategy, which describes the organization and the services provided, the key customers and their degree of satisfaction. It describes an analysis of financial performance and a survey of the competitive and market environment plus strengths, weaknesses, and key business competitive factors. The organization's strategy provides the business vision of the organization, the specifics of the mission, the major objectives, and the business plan to achieve them.
Characteristics of manufacturing facilities and other fixed assets emerge from the business strategy:
- the structure and numbers of production facilities,
- data on their reliability, durability, sustainability, maintenance, and availability, in particular the requirements for preventive maintenance and maintenance volume in standard hours, post-failure maintenance, in standard hours and, where appropriate, in financial terms,
- mechanical, electrical, and other maintenance requirements,
- the expected structure of internal and external maintenance, service provision,
- criticality of equipment to production lines and machines,
- the impact of downtime on production.
Long-term asset maintenance steps:
- -
- Maintenance management encompasses all management activities that determine the objectives, strategies and responsibilities of maintenance and that management applies by such means as planning, directing, and controlling maintenance and improving methods in the organization, including economic considerations.
- -
- Maintenance objectives represent the goals assigned and adopted for maintenance activities; these objectives may include, for example, availability, cost reduction, product quality, environmental protection, safety.
- -
- The maintenance plan is a structured set of tasks that includes the activities, procedures, resources, and scheduling required carrying out maintenance.
- -
- The development of a specific LTA maintenance strategy could be based on the proposed corporate strategy development model. The basis for the design of the maintenance strategy is the acquisition of correct and objective input data and information and its transformation into the required maintenance strategy and subsequent maintenance improvement projects based on it.
2.2. Design of an Algorithm for the Development of a Maintenance Strategy and Concept
The methodology for the development of the maintenance strategy and concept defined the input data, information and starting points. The development of the 'Maintenance Strategy' document can be based on team-work and in cooperation with the various departments that are either directly or indirectly affected by the processes. Prior to release, the document should be reviewed by the organization’s senior management, regarding the feasibility and security of the required resources. It should be borne in mind that this document is intended to set the guidelines for maintenance management to achieve excellence in long-term asset maintenance. The final output must be the identification of key tasks to bridge the gap between the current state and the target state of maintenance management excellence in the organization. This output should take the form of maintenance improvement in project themes with a time horizon for resolution of generally up to one year and exceptionally longer, and with defined responsibilities of the developers and implementers of these projects, re-sources, and individual milestones for implementation.
The output of the Figure 3 algorithm is a "Maintenance Strategy" document with a time horizon of up to three years and a "Maintenance Concept Development" document with a horizon of about 1 to 1.5 years and a "Maintenance Strategy" for 10 years. Algorithm indicates the creation of a strategy that begins with the analysis of the basic characteristics of production equipment and their maintenance requirements and the current results of maintenance audits. This strategy is based on the excellence model and the maintenance audit. Subsequently, a maintenance strategy concept is created, which contains selected elements - areas of strategy excellence (graphically marked part - gray color). The output of the maintenance concept is a 3-year strategy proposal. Subsequently, projects are proposed for implementation on an annual basis, which are then evaluated, and the current maintenance strategy is updated.
2.3. Maintenance Management Audit
An audit is a systematic, independent, and documented process of obtaining objective evidence and evaluating it objectively to determine the extent to which audit criteria are being met. Audit criteria is a set of policies, procedures or requirements that are used as evidence against which objective evidence is compared. [28,29,30,31,32,33,34] Records, reports, statements of fact, or other information that relate to the audit criteria and are verifiable may be considered as audit evidence. Audit findings are then the results of the evaluation of the collected audit evidence against the audit criteria. An audit finding may be:
- compliance or non-compliance (with the audit criteria),
- compliance or non-compliance (with regulatory requirements or with regulatory requirements),
- an opportunity for improvement,
- a record of good practice.
Based on the above criteria for maintenance audits, a system of questions (indicators) and their assessment should be designed to enable practical auditing of possession management in organizations of different types and focuses.
The biggest challenge is evaluating the answers to these questions and quantifying the level of fulfilment of the criteria and requirements contained therein. The evaluation should consider the rating (1 - low importance, 2 - medium importance, 3 - high importance). The questions containing the criteria and the actual answer must be formulated not only in qualitative terms, but also evaluated in terms of percentage points (0% is absolute non-fulfilment of the criterion and 100% is absolute perfect fulfilment of the required criterion).
An even more challenging problem is the determination of the ideal value of the ideal quality criterion of maintenance management. This involves knowing such ideal values as the optimal proportion of preventive maintenance, the optimal proportion of external (outsourced) maintenance, the optimal size of maintenance resources, the optimal ratio of the number of managers and technicians to the number of manual maintainers, etc. An important aid in this area is the benchmarking of maintenance management, carried out at the level of plants in one organization, then between organizations of the same production focus at national level and, where appropriate, at international level. Work of this type is currently in its infancy.
A team-based way of handling responses is preferable to a single worker's solution. Each question represents one quality indicator of maintenance management, and in addition to the qualitative answer, the quality level Q in percentage is to be assigned based on expert judgement of the level achieved for that indicator (question). The average quality level of the indicator for each area of maintenance management shall be determined by a weighted average (1):
where: (Q - the average quality level of indicator i - that area of maintenance management,
W (i - the value of the j-th indicator (question) in the i-th maintenance management area.
Qij - the quality level of the j-th indicator (answer to the question) in the i-th maintenance management area and not the number of indicators (questions) set in the i-th maintenance management area. For example:
Qi = (2*95+3*85+3*W+3*70+3*65+2*78+3*90)/(2+3+3+3+3+2+3) = 1565/19 ≈ 81%
The calculation is done by averaging the quality level of the indicators of the first maintenance management area.
The basis for the evaluation of the maintenance audit is the qualitative and quantitative written responses (Figure 4) and external benchmarking Table 1.
These quantitative results give an immediate insight into the weaknesses of maintenance management. The most important part of the audit is the qualitative answers to the individual questions and their thorough evaluation. The set of questions (indicators) presented is certainly not definitive and exhaustive. It should be considered as an open system that can be further expanded and refined based on experience. The result of this maintenance audit must be a proposal for corrective action to eliminate the causes of the identified deficiencies and to prevent their recurrence. To ensure competent and reliable production facilities while eliminating material and human factors, to maintain absolute quality (100% excellent product condition), it is necessary to implement quality maintenance [22,23] for which it is necessary to determine:
- conditions for lining up and setting up for the first time,
- conditions for preventive maintenance to achieve a state of zero defects,
- determine the causes and consequences that affect the magnitude of deviation from the nominal value,
- determine the control and measurement of defined operating and technical conditions of the equipment at time intervals,
- based on the magnitude of the deviations, a maintenance plan for the machinery and equipment.
3. Results
The research in maintenance strategy and the procedure of improving maintenance processes to increase the efficiency and quality of the production system is based on the audits carried out in Slovak companies, where the projects of maintenance strategy development were implemented. At the same time, knowledge from APVV and VEGA grant projects was applied. Potential areas of improvement and maintenance problems were identified:
- Lack of planning of maintenance activities, weaker planning (lack of planning).
- Informal communication of the work to be done with maintenance (flow of requirements).
- Lack of leadership of maintenance staff on afternoon and night shifts. Most work done ad-hoc, without work orders.
- Working independently, without collaboration.
- Lack of a plan for work to be performed outside of breakdowns.
- Insufficient, weak reporting.
- Lack of autonomous maintenance.
- Duplicated work, many things are controlled by the supervisor and by the maintenance person.
- No defined standards for specific work.
- Lack of motivation of shift maintenance for doing the work. They could perform it faster.
- Lack of criteria for evaluating the productivity of the maintenance worker. (What he wrote down did not correspond with what he did).
- Work by individuals or small groups without collaboration.
- Multi-level hierarchical structure of maintenance.
- Lack of planning worker.
- Failure to carry out preventive maintenance and planned repairs due to:
- planned preventive maintenance and planned repairs - production does not make equipment available,
- production puts equipment on standby - no maintenance capacity,
- planned repairs - maintenance capacity is available; production makes the equipment available - Spare part (SP) according to EN13306 is not in stock.
3.1. Proposed Change to the Maintenance Strategy
By analysing the potential for improvement, by analysing the processes carried out by which the company organizes its activities and resources to achieve its long-term goals. To ensure the competitiveness and profit of the company, the steps to change the strategy have been proposed Figure 7. Strategy change steps:
- Analysis of the current situation, maintenance audit.
- Benchmarking.
- Criticality assessment of machinery and equipment.
- Evaluation of current maintenance processes.
- Selection of a new maintenance strategy
- Comparison of the existing maintenance system and the proposed maintenance system.
- Implementation of a new maintenance strategy.
Before choosing a strategy, it is necessary to familiarize yourself with the individual concepts of strategies. In brief, the following are presented:
- FFM Failure Finding Maintenance i.e., a functional test or inspection of a hidden failure of the equipment. Depending on the results, repairs are carried out.
- CBM Condition Based Maintenance i.e., the maintenance activities consist of periodical, inspections, or on-line measurement of the technical condition of the equipment. Depending on the measured condition, repairs are planned or carried out.
- TBM Time Based Maintenance i.e. this means regular periodic maintenance.
- SM Scheduled Maintenance i.e., the maintenance activities are carried out based on the use of the equipment (i.e., time, hours, operations etc.). They are independent of the condition of the equipment.
- MOD Modification i.e., it must be changed. This does not mean it has to be technical -it can be a change of spare parts or instruction.
- RTF Run to Failure i.e., the failure will be solved when it occurs. No preventive maintenance.
Based on the benefits and reduction of maintenance costs, a suitable strategy concept is selected. As a result of analyses of studies from past periods and current experience, a recommended annual plan for changing the maintenance strategy was proposed (Figure 9). Control milestones are defined to verify the task performance of the strategy development project Figure 8. In designing the schedule, we focused on the maintenance system, the maintenance processes, and the maintenance staff, who are scheduled to perform each task on a week-by-week basis.
It is necessary to develop a RACI matrix (Responsible, Accountable, Consulted, Informed) for the different maintenance processes and responsibilities for activities within the maintenance management system (Figure 9). The sequence of steps begins with the indicator design system.
Current maintenance management indicators need to be reviewed. Table 2 presents a proposal of maintenance indicators to meet the milestones of the new strategy development project. To effectively commission the system and maintain it at optimum life-cycle cost in the long term, maintenance and provisioning activities need to be planned and the necessary resources procured.
These activities start early in the conception and development phase and continue throughout the subsequent stages of the life cycle. The objectives of maintenance activity planning and maintenance assurance are as follows:
- develop a maintenance concept and add maintenance and maintenance assurance requirements to the system requirements,
- to determine the effect of system maintainability design in the form of maintenance requirements and to optimise the maintenance concept,
- define the maintenance provisioning requirements and the maintenance plan,
- specify the resources required.
3.2. Evaluation of Maintenance Choice Alternatives and Analysis of the Optimisation Procedure
The objective of the evaluation of alternatives is to select a maintenance assurance system. The analysis of the optimization procedure for operation and maintenance provisioning is part of the inherent development system. Optimal benefits are obtained when these analyses consider all system factors (cost, schedule, operational characteristics, and maintenance provisioning) before system development is completed. The following steps are to be performed in the evaluation and analysis of the optimization procedure:
- identify criteria that are related to maintenance provisioning requirements, cost, and availability,
- select or develop models or analytical relationships between the maintenance provisioning design and the operational or any other identified evaluation criteria,
- perform an optimisation procedure or evaluation that uses the developed relationships or models, and select the best alternative(s) based on the developed criteria,
- perform sensitivity analyses of those variables that have a high degree of risk or a significant impact on the maintenance provision, cost, or availability of the new system,
- document the results of the optimisation procedure and evaluation, including any risks and assumptions involved.
4. Conclusions and Discussion
Research in maintenance strategy and maintenance process improvement procedure to increase the efficiency and quality of the production system through the application of the proposed methodology/algorithm for changing the maintenance strategy, results were achieved, which showed a positive impact on production efficiency and quality. As part of the project solution, control meetings of the project team and company management took place on a regular basis, where the results achieved during the change of the maintenance strategy were positively evaluated and further improvements were proposed.
4.1. Achieved Impact of Maintenance Strategy Change on Production Efficiency
The Overall Equipment Effectiveness (OEE) rating on is a function of losses due to faults (interruptions), power losses due to reduced speeds and queuing times and low quality of the products produced (Figure 10).
Maximizing the efficiency of equipment operations and minimizing costs over its life cycle could be ensured by eliminating the "six major losses" that significantly affect the efficiency of equipment on schedule. It was mainly about reducing failures resulting from equipment defects, rearranging, and setting up (changing jig, tool, etc.), eliminating inactivity, idling and small breaks, process errors and repairs (screw-ups and quality defects in need of correction), reduction of time between machine start-up and stable operation. The determined critical OEE value of 72% was reached to the level of 82% during the project solution.
4.2. Impact of a Change in Maintenance Strategy on Production Quality
Through the new designs and the entire methodology of PPM (preventive planned maintenance), as well as all other supporting processes, detailed analysis of line object failures has been enabled. New possibilities have been opened for more efficient and faster problem analysis and corrective action to improve and stabilize the process, especially the production quality process.
However, due to the implementation of the so-called zero interval, improvements can already be seen in some indicators after a shorter period. Other important indicators can be estimated, or the expected improvement can be determined, but only after a certain period. The indicators that can be realistically assessed now relate to the number of materials discarded in the six-hour interval before the failure occurred. As can be seen in Table 3, the improvement in this indicator is approximately 24% compared to the initial situation. This means that 23.76% more blanks were discarded in the six-hour interval before the failure than before the introduction of the new preventive planned maintenance. This is also because its introduction has reduced the frequency of failures. The new preventive maintenance has thus had a positive impact on both factors, resulting in the improvement in the indicator.
A follow-up indicator that can also be measured in a shorter period after the introduction of PPM is the number of meters of semi-finished products discarded due to machinery.
The improvement in the two-week interval can be seen in Table 4. After the introduction of the proposals, the incidence of semi-finished products scrapped due to machinery decreased by 23.01% and the number of all semi-finished products scrapped, irrespective of the reason for scrapping, decreased by about 16%. These are significant improvements, which may be slightly distorted by the shortness of the monitoring interval, but the improving trend is evident. Talking not only about semi-finished products discarded due to machines is important because machines can still have an impact on other cases as well.
The previous indicators and improvements were expressed only for the production line whose winding station design was the subject of a pilot verification of the proposed methodology.
The financial evaluation of the design solutions and estimates of improvements have already been calculated for all five-extrusion lines. This is because most of the quality indicators are related to the whole process and the new PPM plan will be gradually introduced on the other lines as well.
This financial assessment and the estimate of expected savings can be seen in Table 5. Three basic indicators (Scrap I, WOT - Work off, Downtime/Faults) have been selected. For all indicators, improvements were estimated based on the changes made, experience and especially in view of the improving indicators interpreted above. For Scrap I, the expected improvement after a certain period is at the level of 4 to 7 percent. In this case, this is a lower expectation percentage because only tread and sidewall wastes do not enter Scrap I. The price saving is thus at a level of around €20,000 per month on average. For WOT, based on intermediate results, improvements of up to 13 to 17 percent are expected. This amounts to an average of around €16,500 per month for both semi-finished products together with rework costs. A final indicator that directly reflects potential savings is the duration of downtime caused by failures. Here again, according to the assumptions and intermediate results, a reduction of 10 to 15 per cent in the duration of breakdowns is expected. In financial terms, this translates into an average of around € 1 150.
The cost of implementing design solutions is minimal. There is no need to purchase new equipment, software, or external help. Everything will be done within the shutdown lines as before, with the same number of internal staff, etc. The only cost has been the salaries of the staff in setting up the PPM plan and training them. This cost was estimated at approximately € 1 100.
As a result, an average monthly saving of € 36 500 is expected after the implementation of the proposed solutions on all lines. This represents an average annual saving of €438 200. It can be argued that this is a significant cost saving, which is mainly due to the improvement in the quality of the production process by using the newly designed PPM plan in the context of quality. It should be noted that everything so far only applies to the single most critical design unit within all five production lines of the production system.
Once the PPM plan is extended to the whole lines, even greater savings, and improvements in the quality of the production process can be expected Figure 11.
4.3. Impact of the Strategy Change on Spare Parts
As we found from the analysis of the current situation in the enterprises, most of the interviewed enterprises determine the size of the insurance stock and the associated signal level only by estimation, which is not supported either by calculation or by statistical methods.
Therefore, for a more objective and professional determination of the basic data for ND inventory management, we recommend their determination by calculation. However, the value determined by calculation may not be final, but may still be adjusted as necessary by the responsible staff but based on the underlying calculations.
In the enterprise under analysis, they determine signal levels and order sizes by estimation, which is not very accurate, and some values may be incorrect. Therefore, we want to use calculations to determine the safety stock, signal levels, etc. and then compare the two options.
The following algorithm will be used for the calculations, for which data such as historical consumption data, the criticality of the ND SP and the delivery time from the supplier are important. The algorithm can be seen in Figure 12. In Table 7 we can see based on which criteria we divide the items into groups A, B, C.
The ABCX spare parts categorization is a comprehensive SP analysis where various data is examined such as how the part affects the functionality of the machine, the lead time of the part, the failure rate of the part, whether there is a replacement for the part, whether it is used in critical machines, whether it can be manufactured or refurbished, whether it is a standard standardized part or a consumable part. The categorization can be seen in Table 6.
In Table 7, we see that category A are the most critical parts and category X the least. The overall criticality of spare parts (SP) is based on several criteria which are then input into a matrix to determine the resulting SP criticality value. The criteria are shown in Table 6.
After evaluating these sub-criteria; we develop a matrix that shows the real criticality of the work. The matrix is shown in Figure 13. We also call the criticality of the SP determined in this way the safety factor, which we then use to calculate the safety margins and signal levels
The part located at position A1D shows the highest criticality and the part located at position C3F shows the lowest criticality. The overall criticality of the parts is more complex and is recommended for implementation in the SP Logistics Procurement and Management System. However, it can also be combined with other methods. The individual criteria are also assigned a score, after summing which the most critical part has a score of 4 and conversely the least critical part has a score of -1.
Having made calculations based on the criticality of the SP, past consumption, and lead times to determine the new safety stock, signal levels, batch sizes, minimum and maximum stock; we can say that for several items the values were unreasonably high. The total value of the stock items decreased from € 62 258, 70 to € 38 684, 78 for the new variant, which is a reduction of € 23 573,92. The comparison can be seen in Table 8 and Figure 14.
4.4. Impact of the Change in Strategy on the New Maintenance Organization
The proposed phased sequence of planned maintenance change steps, the change in staffing levels, is per Figure 12. This results in a reduction of maintenance staff from 77 to 53. The above change followed the plan to change the maintenance strategy by milestones (Figure 9). The change was implemented by reducing shift maintenance workers and sending workers to preventive maintenance tasks Figure 15, Figure 16. This achieves the same production and quality efficiency (or higher) with fewer workers, reduction in direct maintenance costs, reduction in the need for SP. The reduction of maintenance capacities during the strategy plan change is shown in Table 9.
This change in strategy determines the comprehensive operation of the emergency strategy Table 10. The method of implementation, the measures, and the distribution of responsibilities in accordance with the requirements of the current internal and external environment. The aim is to provide the necessary resources for the different facilities to make the production process work and to ensure competitiveness.
Procedure: The above table describes how a company's emergency strategy works in a crisis environment.
In the current economic problems with the emergence of COVID, the energy crisis and the war, every company should re-evaluate its maintenance strategy to update its maintenance processes and to determine a so-called emergency maintenance strategy to remain competitive. It is necessary to focus on the data that provide us with the required information. At the same time, we will prepare for the implementation of an intelligent maintenance system.
Author Contributions
For research articles with several authors, a short paragraph specifying their individual contributions must be provided. The following statements should be used “Conceptualization, M.R. and P.B.; methodology, M.R.; software, P.B.; validation, M.R., P.B.; formal analysis, K.S.; investigation, V.B.; resources, M.R.; data curation, M.R.; writing—original draft preparation, V.B.; writing—review and editing, V.B.; visualization, K.S.; supervision, G.G.; project administration, V.B.; funding acquisition, V.B.
Funding
This work was supported by the VEGA 1/0524/22 and VEGA 1/0633/24.
Institutional Review Board Statement
Not applicable.
Informed Consent Statement
Not applicable.
Data Availability Statement
Data sharing not applicable.
Acknowledgments
In this section, you can acknowledge any support given which is not covered by the author contribution or funding sections. This may include administrative and technical support, or donations in kind (e.g., materials used for experiments).
Conflicts of Interest
“The authors declare no conflicts of interest.”
References
- Bubeníková, E. and Bubeník, P. (2017). Internet of things (IoT). Technológ, Roč. 9, č. 1 (2017), s. 131-134, ISSN 1337-8996.
- P. Peniak - E. Bubeníková. (2019). Validation of IoT secure communication gateway for constrained devices, International Conference on Applied Electronics (AE), Pilsen, Czech Republic, 2019, pp. 1-5, doi: 10.23919/AE.2019.8866990. [CrossRef]
- Rakyta, M. – Fusko, M. (2016). Manažment konfigurácie údržby pre "Priemysel 4.0", In: Údržba 2016 = Mainte-nance 2016: sborník mezinárodní odborné konference: 12. a 13. října 2016, Konferenční centrum AV ČR - zámek Liblice. - Praha: Česká zemědělská univerzita, 2016. - ISBN 978-80-213-2668-2. - S. 25-33.
- Campbell, J. D., Reyes-Picknell, J. V., & Kim, H. S. (2015). Uptime: Strategies for excellence in maintenance man-agement. CRC Press.
- Legát, V. (2016). Management a inženýrství údržby. Kamil Mařík-Professional Publishing.
- Mushavhanamadi, K., & McGloin, K. (2018). Investigating the Risk Management Systems in the South African Banking Industry.
- Mushavhanamadi, K., & Selowa, T. B. (2018). The impact of plant maintenance on quality productivity in Gaut-eng breweries. In Proceedings of the International Conference on Industrial Engineering and Operations Management (pp. 1743-1753).
- Dowler, P. (2012). CAOM-2.0: the inevitable evolution of a data model. Astronomical Data Analysis Software and Systems XXI, 461, 339.
- Blanchard, B. S., Verma, D. C., & Peterson, E. L. (1995). Maintainability: a key to effective serviceability and maintenance management (Vol. 13). John Wiley & Sons.
- Alsyouf, I. (2004). Cost effective maintenance for competitve advantages (Doctoral dissertation, Växjö univer-sity press).
- Al-Najjar, B. (2007). The lack of maintenance and not maintenance which costs: A model to describe and quan-tify the impact of vibration-based maintenance on company's business. International Journal of Production Economics, 107(1), 260-273.
- Duffuaa, S. O., & El-Ga’aly, A. (2015). Impact of inspection errors on the formulation of a multi-objective optimization process targeting model under inspection sampling plan. Computers & Industrial Engineer-ing, 80, 254-260.
- Bubeník, P. – Horák, F. (2014). Knowledge-based systems to support production planning. Tehnički vjesnik, ISSN 1330-3651, ISSN 1848-6339.
- Rakyta, M. – Binasova, V. (2016). Totálne produktívna údržba – TPM, Žilina: EDIS, ISBN 978-80-554-1210-8.
- Grencik, J. et al. (2020). Manažérstvo údržby 2: synergia teórie a praxe - 1. vyd. –Košice: BEKI Design, 2020. – p. 697. ISBN 978-80-553-3539-1.
- Rakyta M. (2002). Údržba ako zdroj produktivity, GEORG, Žilina 2002, ISBN 80-968324-3-3.
- Lee, J.- Ni, J.- Qio, H. (2006). Intelligent prognostics tools and e-maintenance. Wichita University, USA, 487 s.
- Preez, J. (2011). Thesis presented in partial fullment of the requirements for the degree of Master of Science in the faculty of industrial engineering at Stellenbosch university. Stellenbosch University, South Africa, 123s.
- Supadulchai, P. (2008). Reasoning-based capability configuration management in adaptable service systems. NTNU, Nórsko, Trondheim, 2008, 238 s.
- Vyatkin, V. (2011). Function blocks for embedded and distributed control systems design. ISA, New Zealand, 2011, 260 s., (ISBN 978-1-936007-93-6).
- Shirose, K. (1995). TPM Team Guide. Productivity Press, Inc. Cambridge, USA, 1995. (digital twin).
- Peniak, P. Rástočný, K.; Kanáliková, A.; Bubeníková, E. (2022). Simulation of Virtual Redundant Sensor Models for Safety-Related Applications. Sensors 2022, 22, 778. (IoT). [CrossRef]
- Peniak, P. - Bubenikova, E. - Kanalikova, A. (2021). Extended gateway model for OPC UA/IoT device integration, In: 2021 IEEE 19th World Symposium on Applied Machine Intelligence And Informatics (SAMI 2021), Page155-159. [CrossRef]
- Durica, L., Micieta, B., Bubenik, P., & Binasova, V. (2015). Manufacturing Multi-Agent System With Bio-Inspired Techniques: Codesa-Prime. MM science journal.
- Micieta, B., et al. The approaches of advanced industrial engineering in next generation manufacturing systems. Communications-Scientific Letters of the University of Zilina, 2014, 16.3A: 101-105.
- Micieta, B., et al. Modular Intelligent Control System in the Pre-assembly Stage. Electronics, 2024, 13.9: 1609.
- Micieta, B., et al. Interfacing the Control Systems of Enterprise-Level Process Equipment with a Robot Operating System. Electronics, 2023, 12.18: 3871.
- Micieta, B., et al. Product segmentation and sustainability in customized assembly with respect to the basic elements of industry 4.0. Sustainability, 2019, 11.21: 6057.
- Micieta, B., et al. Indication, Solution, Prevention: a Holistic Approach to Financial, Industrial Engineering, and Business Problem Analysis. Scientific Papers of Silesian University of Technology. Organization & Management/Zeszyty Naukowe Politechniki Slaskiej. Seria Organizacji i Zarzadzanie, 2023, 188.
- Dulina, L., et al. Improving Material Flows in an Industrial Enterprise: A Comprehensive Case Study Analysis. Machines, 2024, 12.5: 308.
- Dulina, L., Krajcovic, M., Binasova, V., Zuzik, J., & Chladekova, D. 2024. Enhancing transportation through route strategy proposal using localization measurement technology: a case study. MM Science Journal.
- Kuric, I., et al. Analysis of the possibilities of tire-defect inspection based on unsupervised learning and deep learning. Sensors, 2021, 21.21: 7073.
- Krajčovič, M., et al. Utilization of Immersive Virtual Reality as an Interactive Method of Assignment Presentation. Electronics, 2024, 13.8: 1430.
- Kuric, I., et al. Analysis of diagnostic methods and energy of production systems drives. Processes, 2021, 9.5: 843.
Figure 1.
Overview of maintenance.
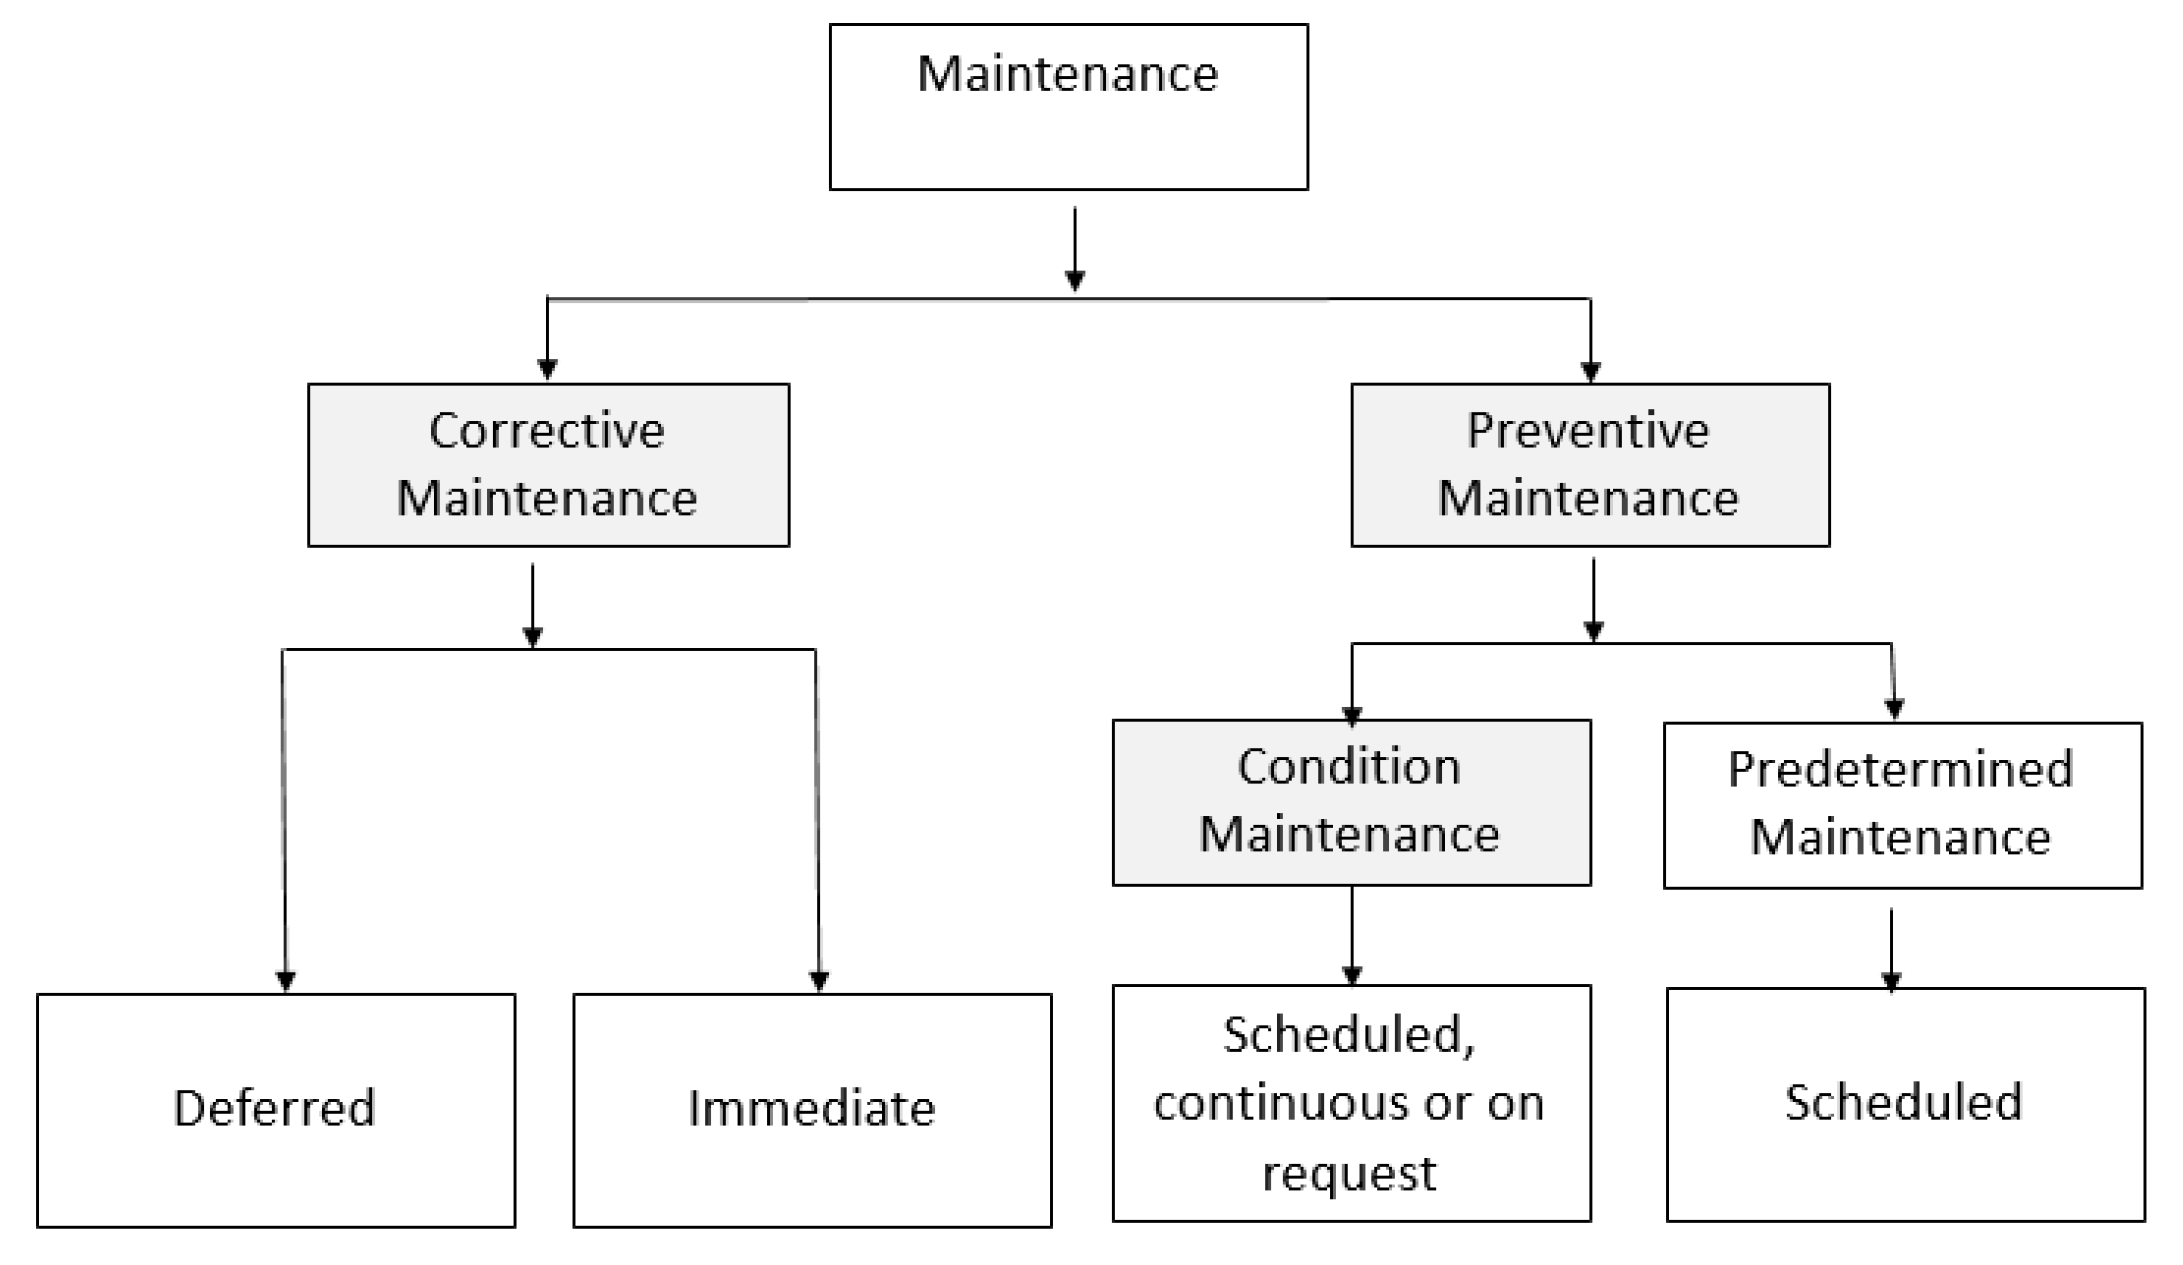
Figure 2.
Connection between maintenance and profitability.
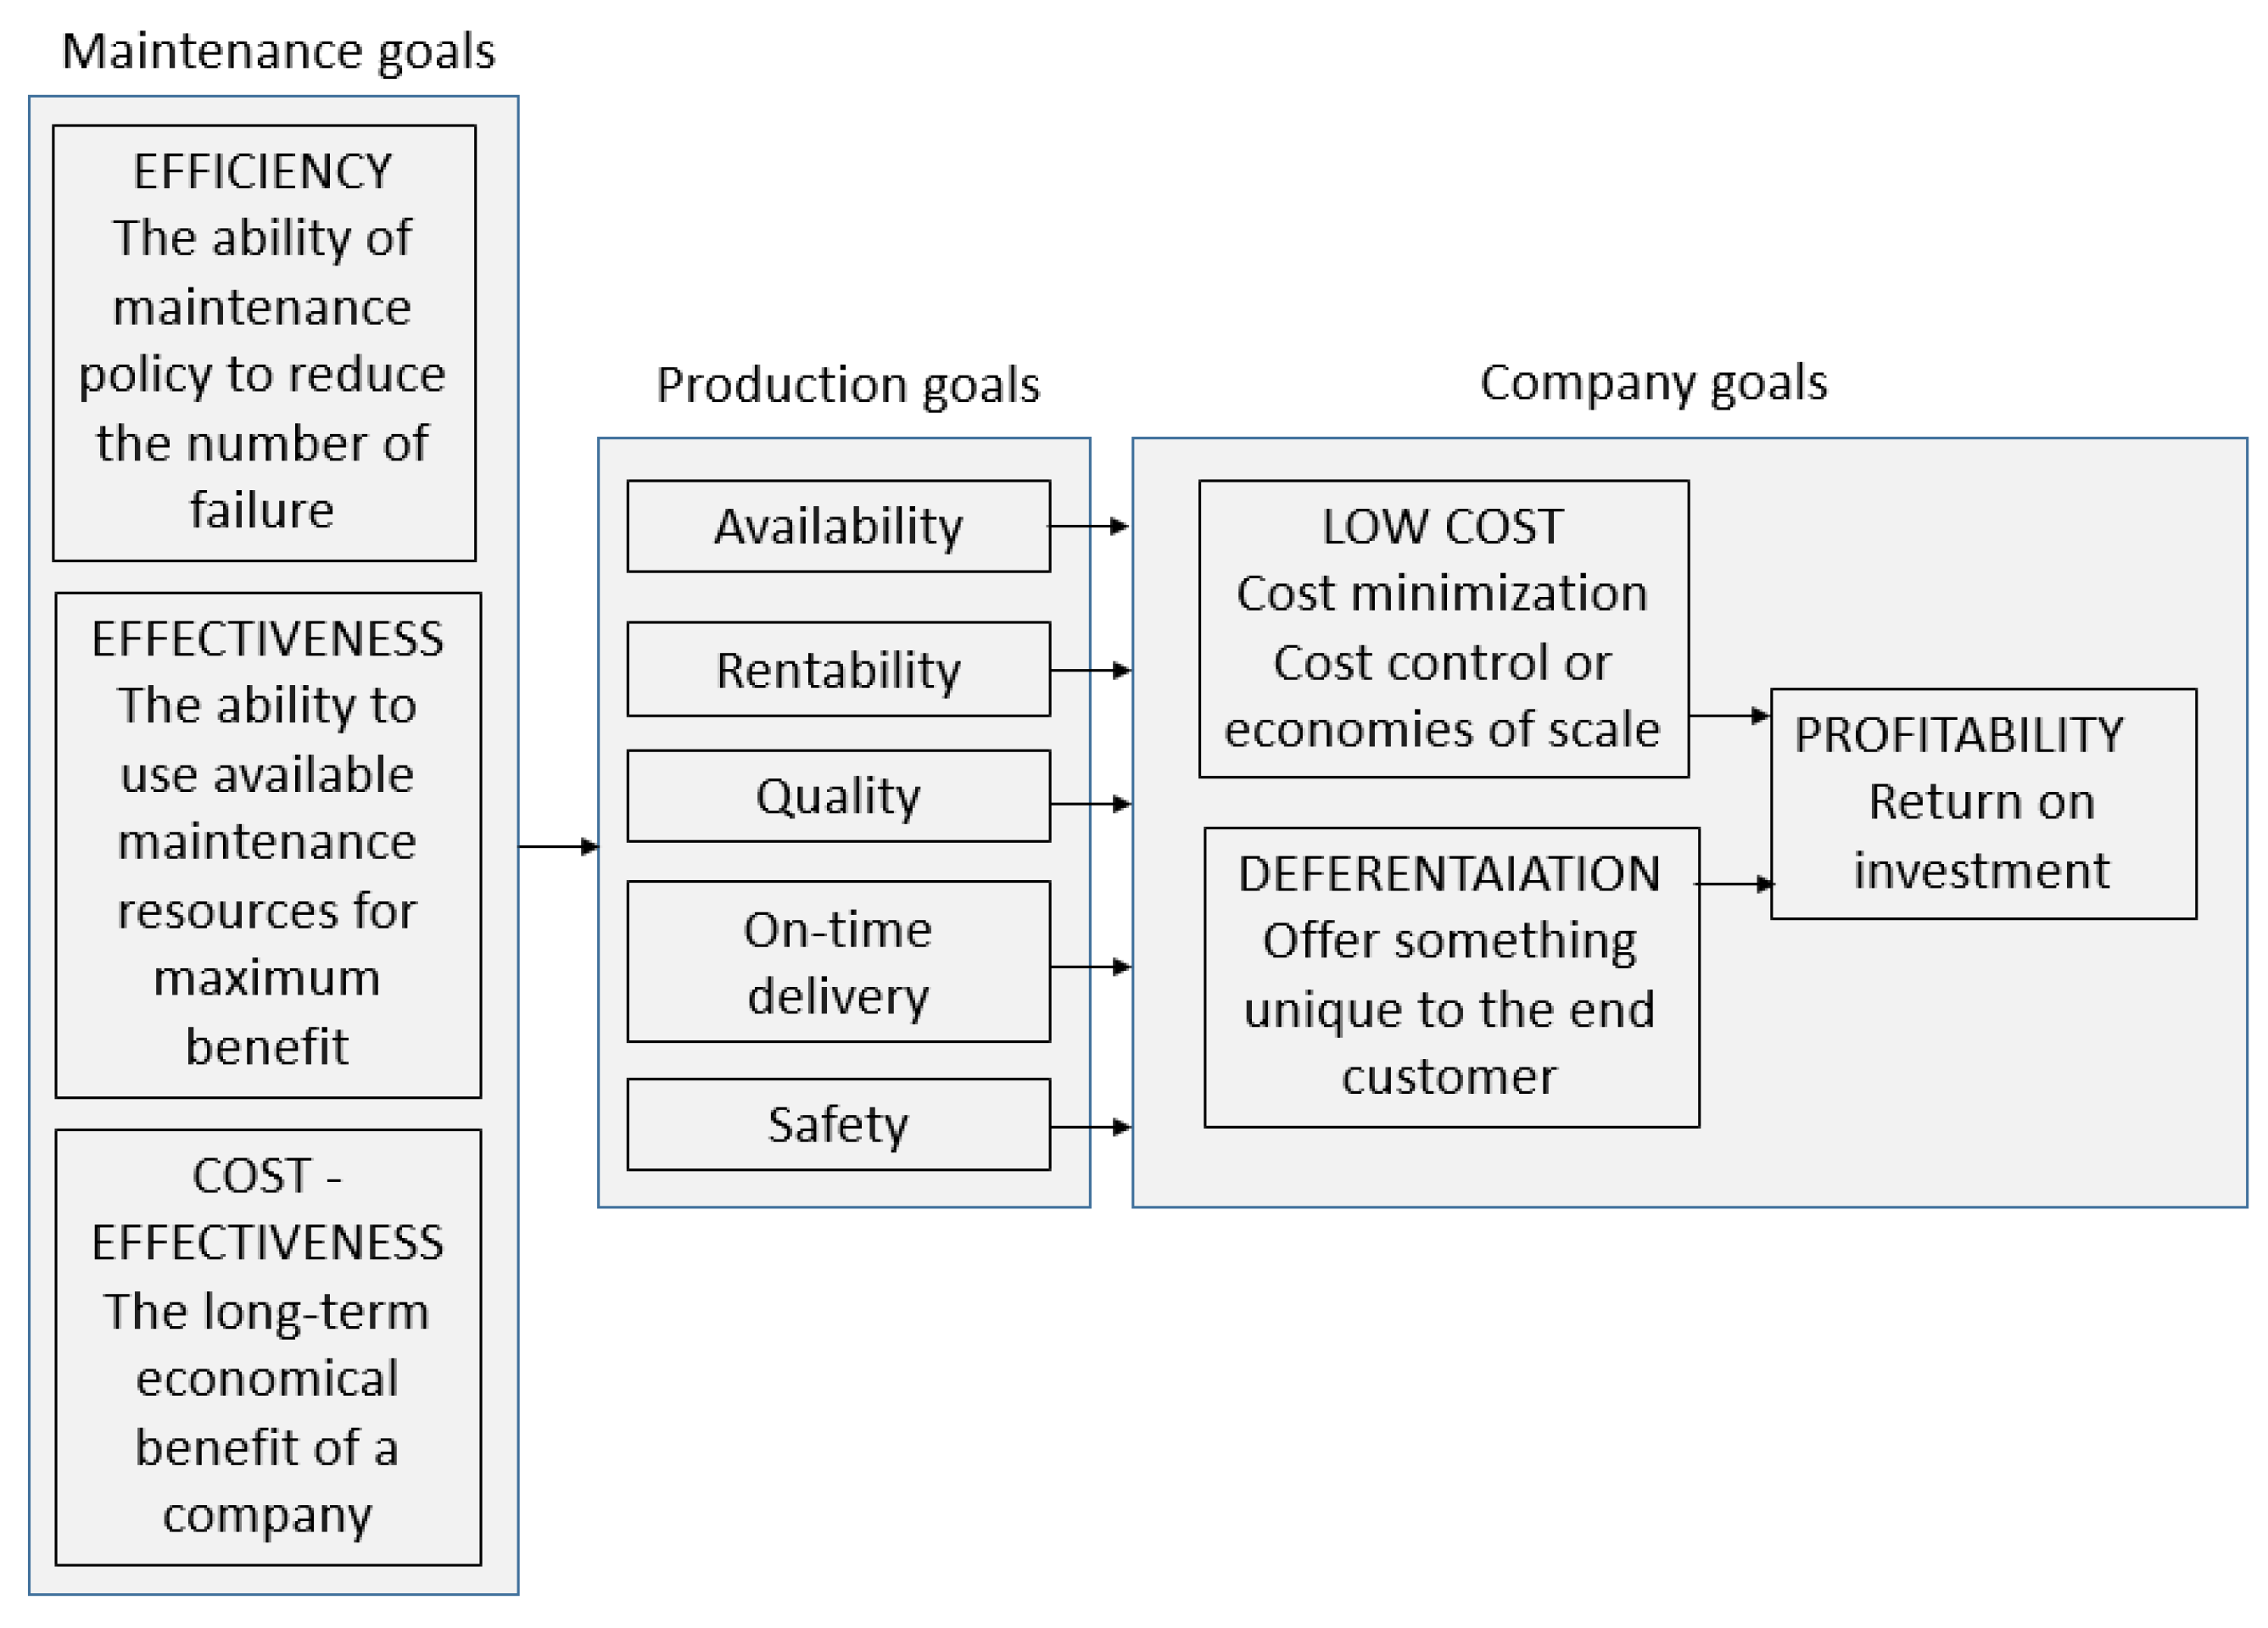
Figure 3.
Algorithm for creating a maintenance strategy and concept.
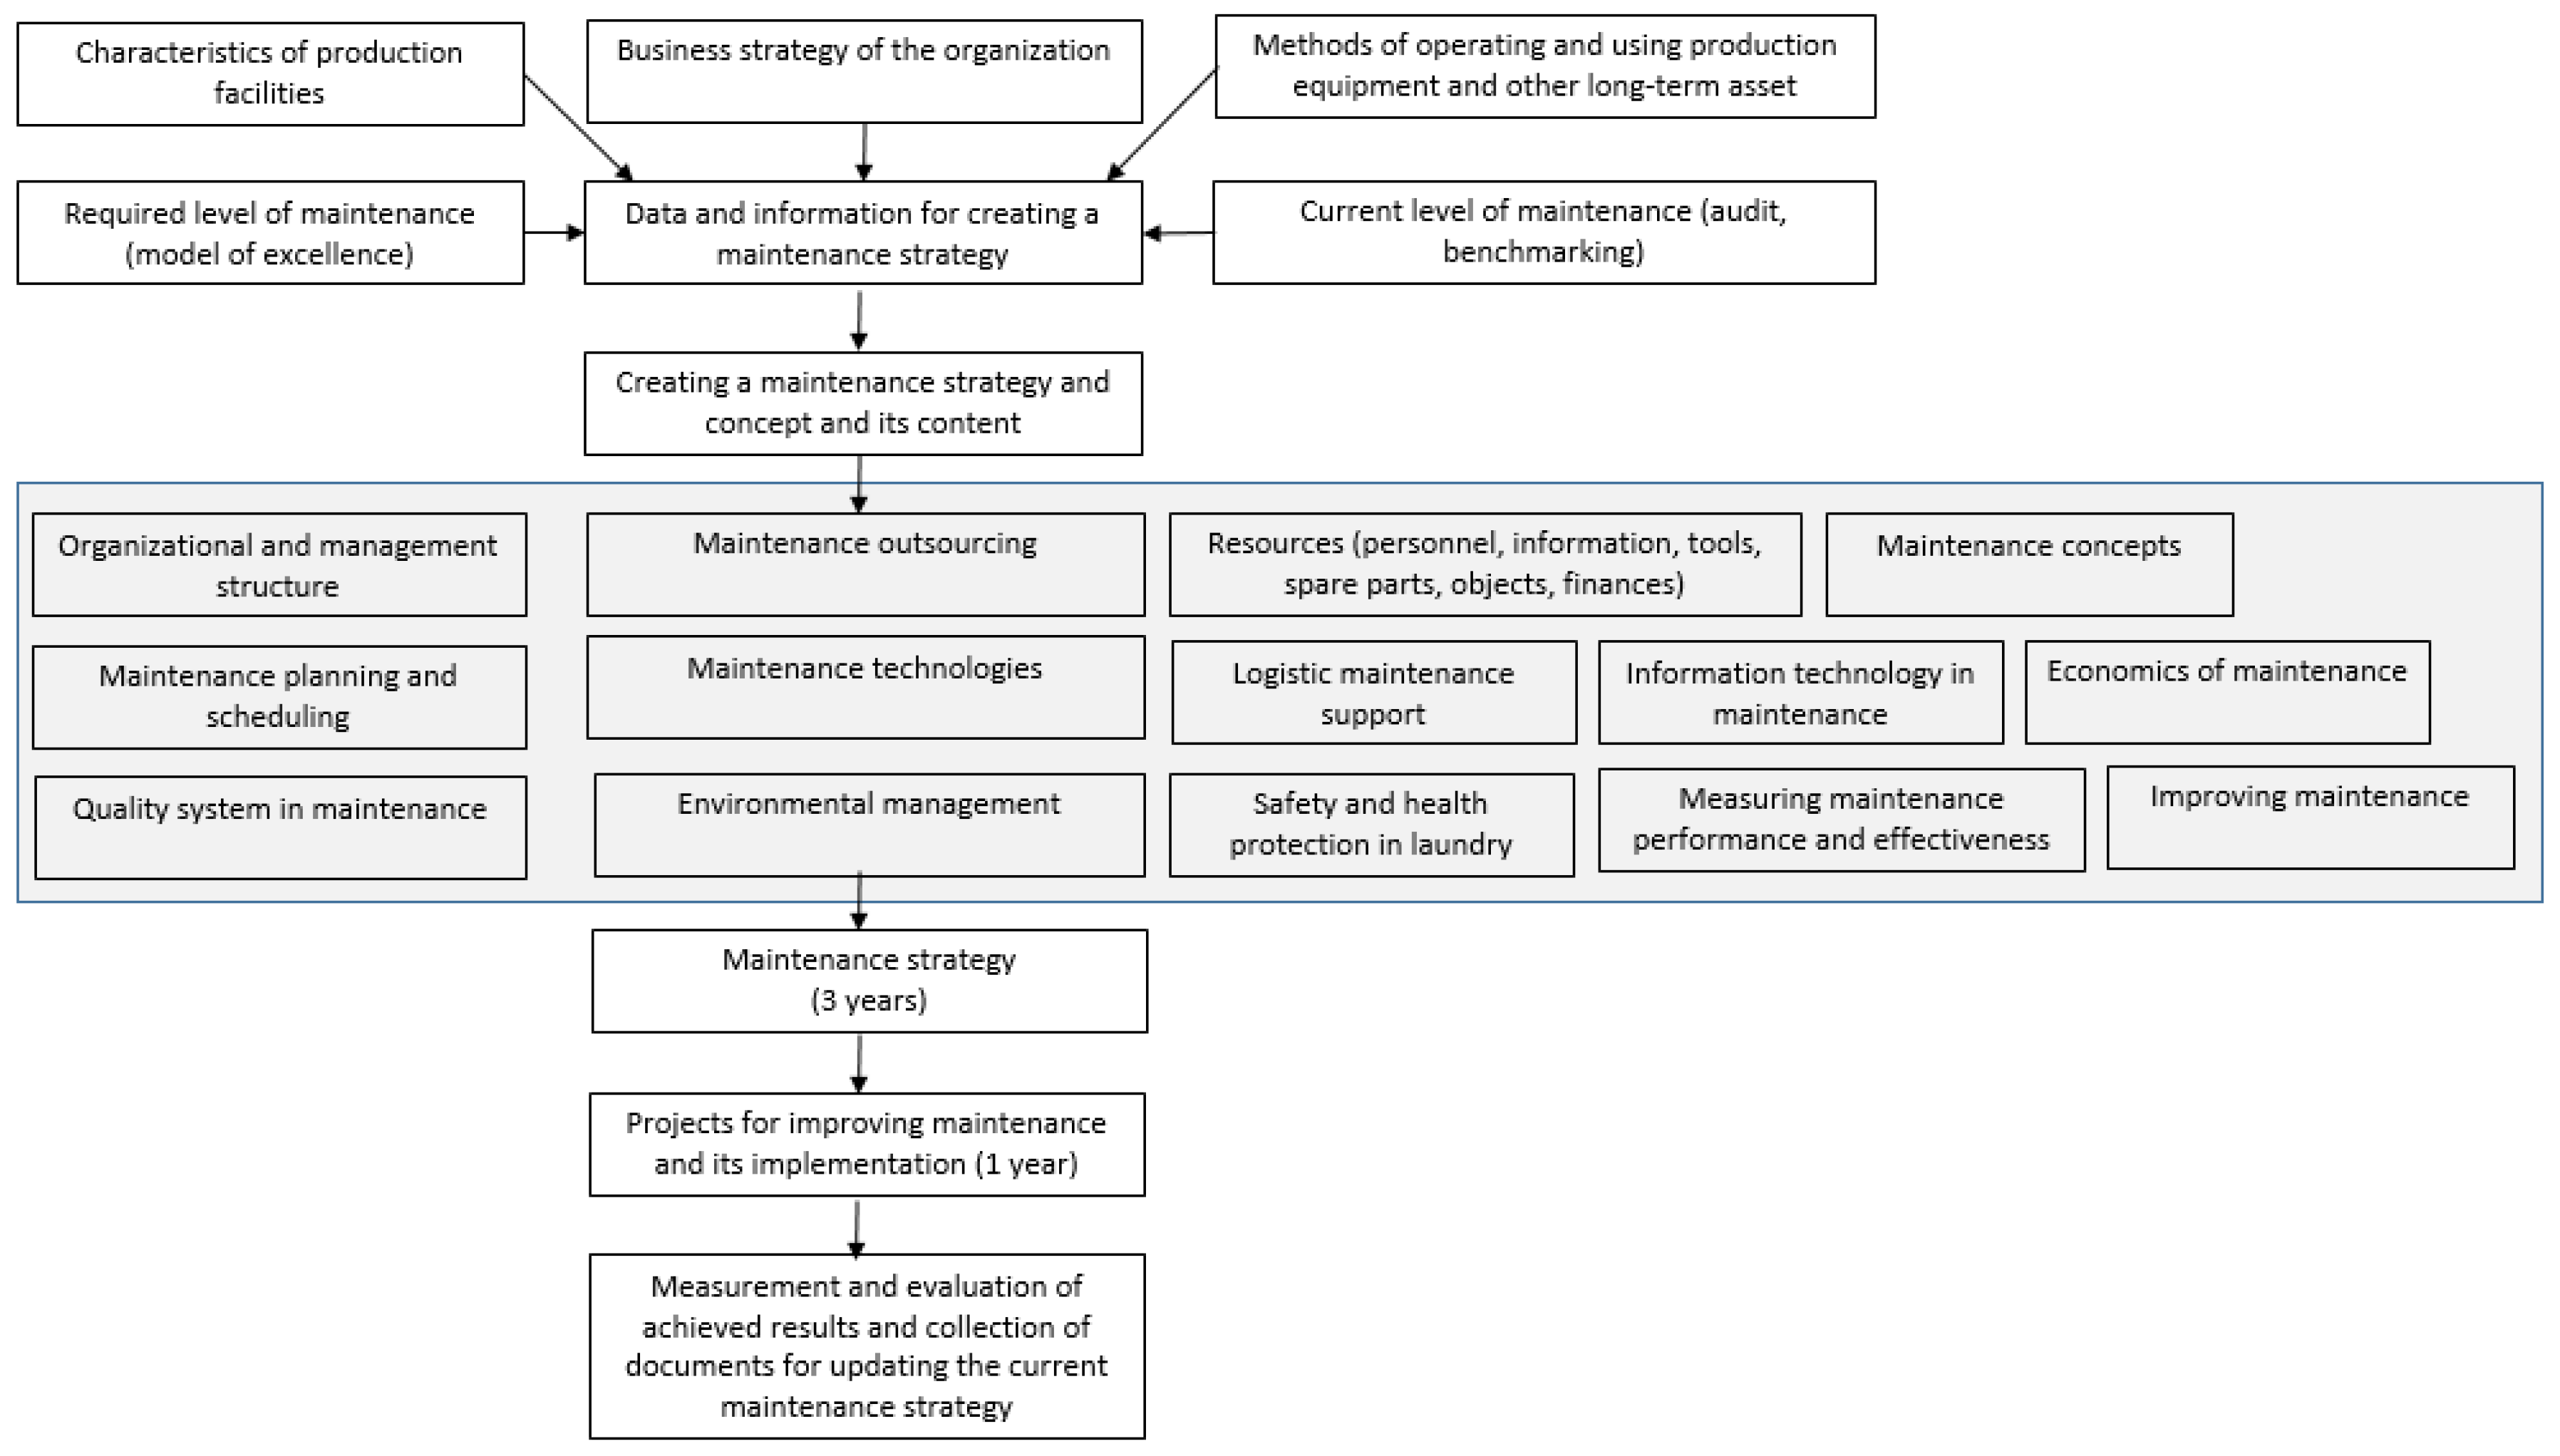
Figure 4.
Internal audit.
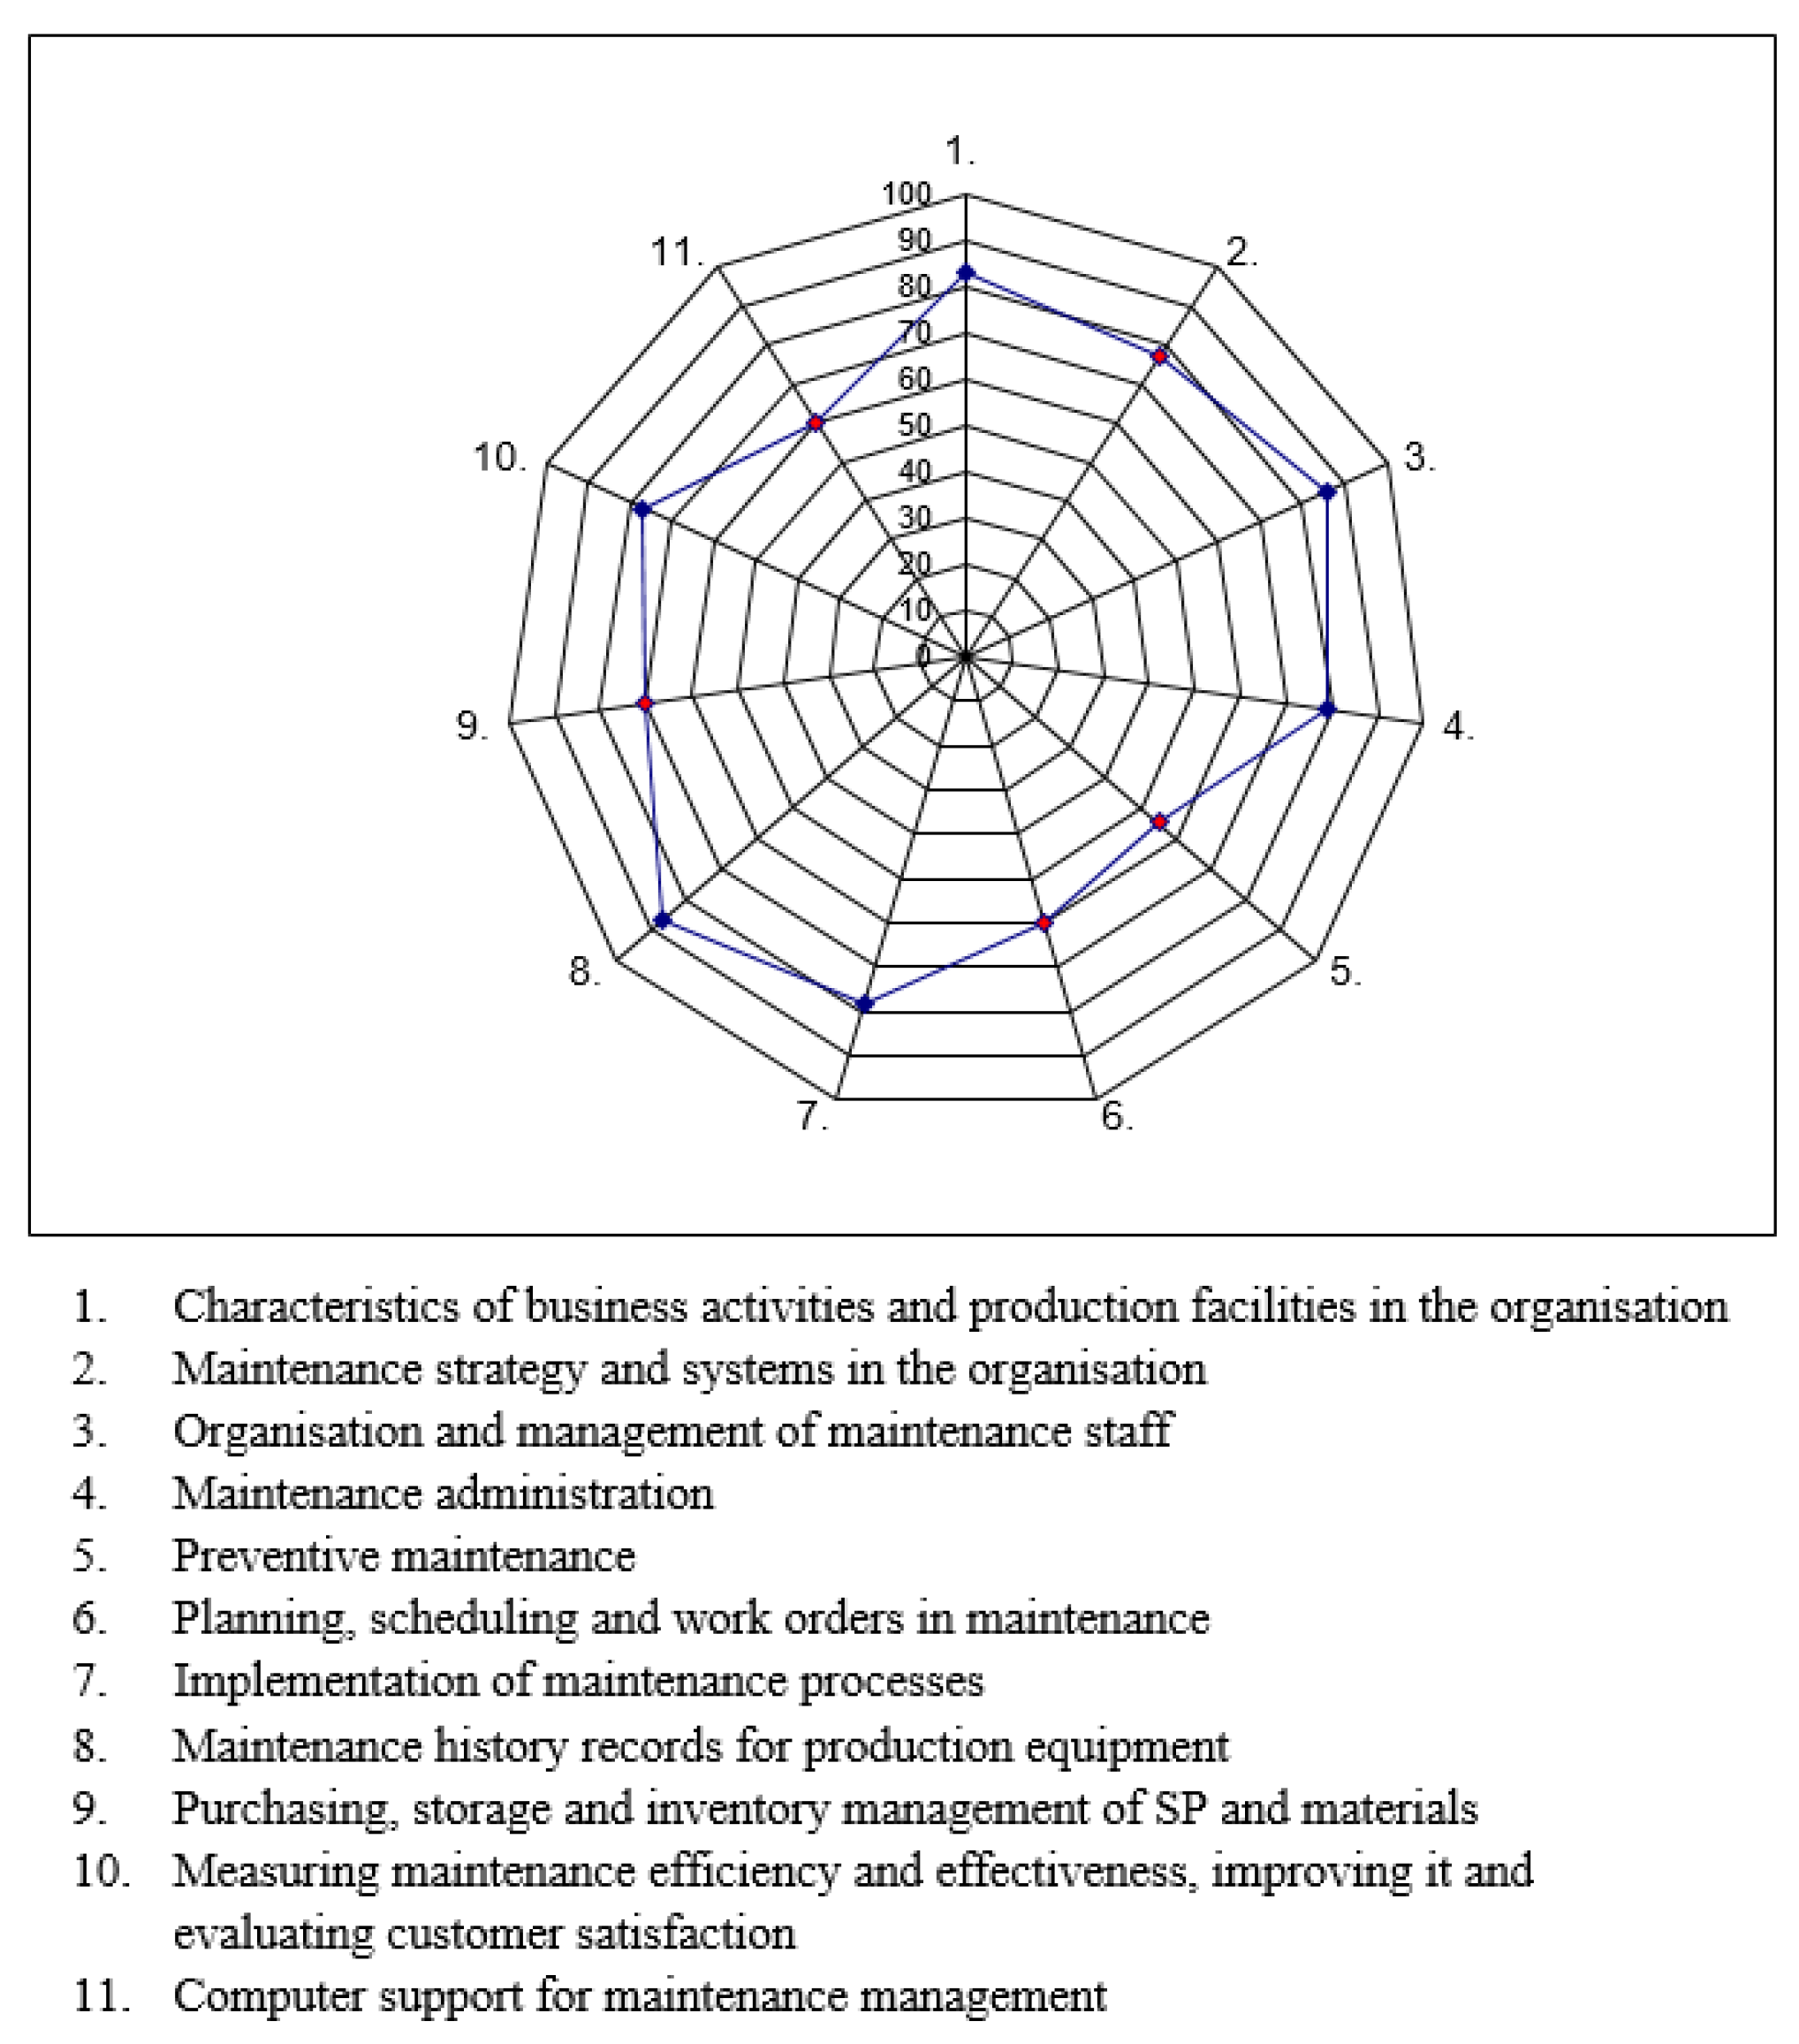
Figure 5.
Daily snapshot of a Measurement and Regulatory Technology (MART) maintenance worker.
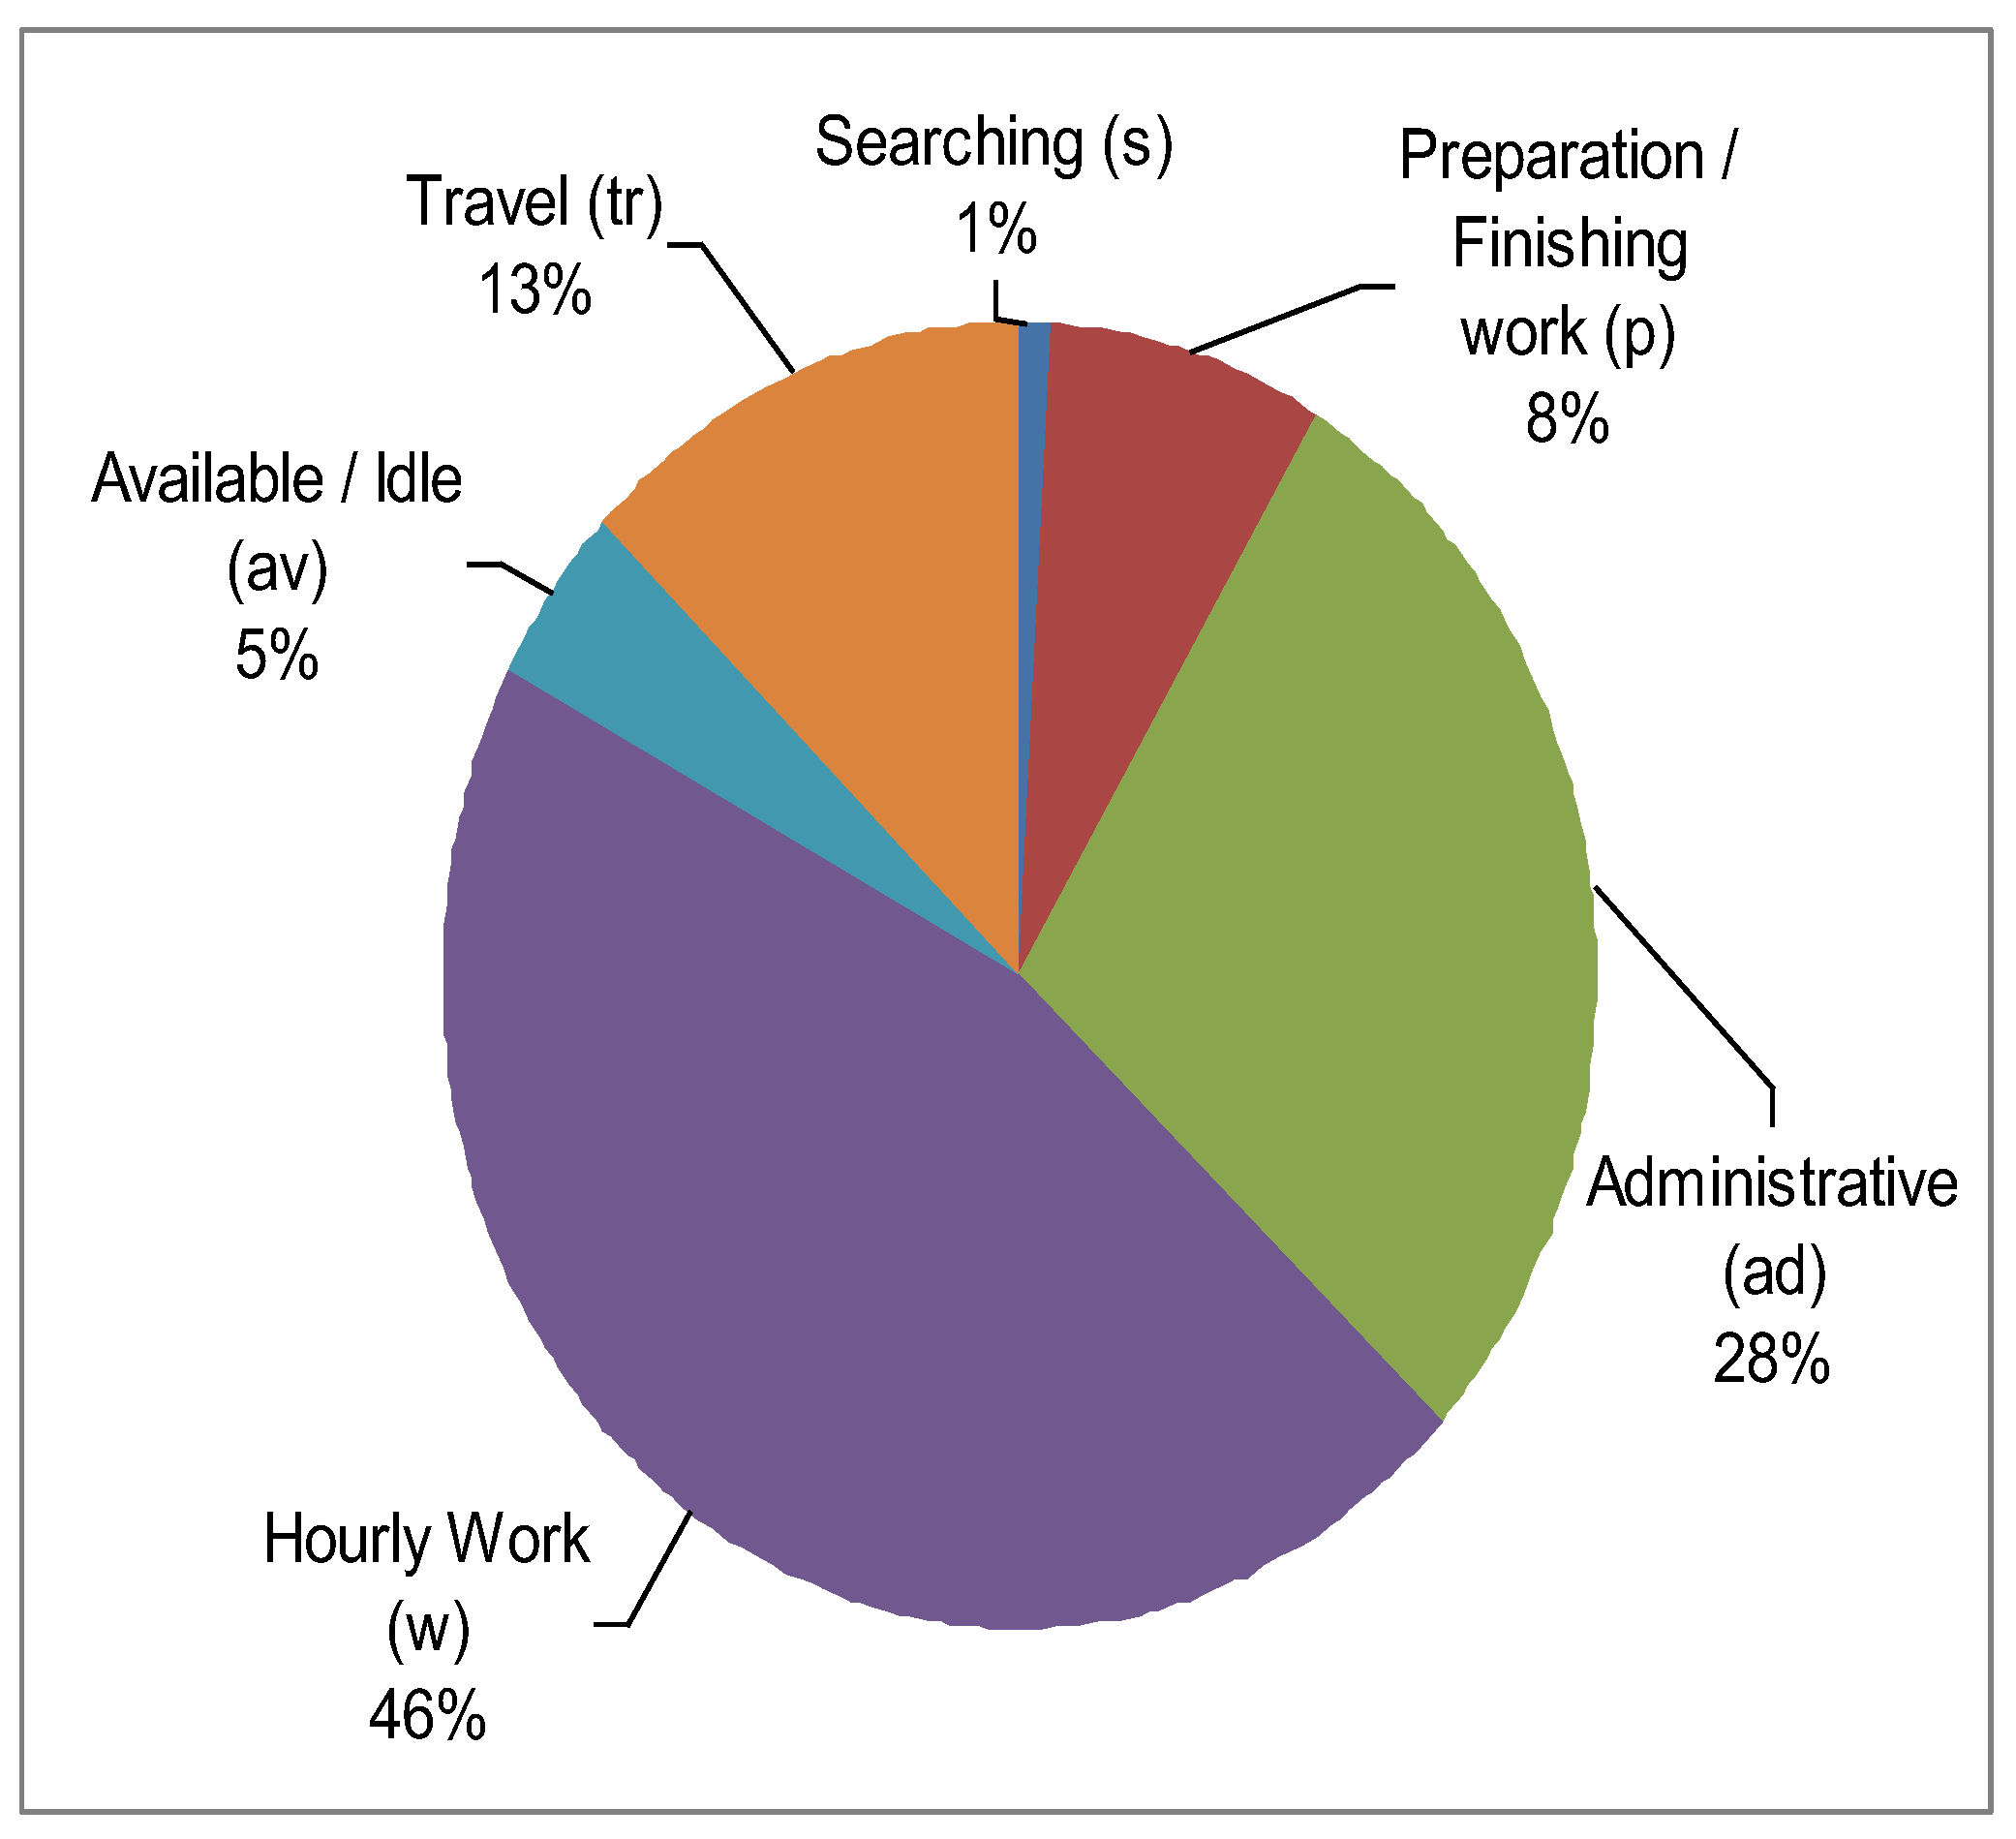
Figure 6.
Daily snapshot of a shift maintenance worker.
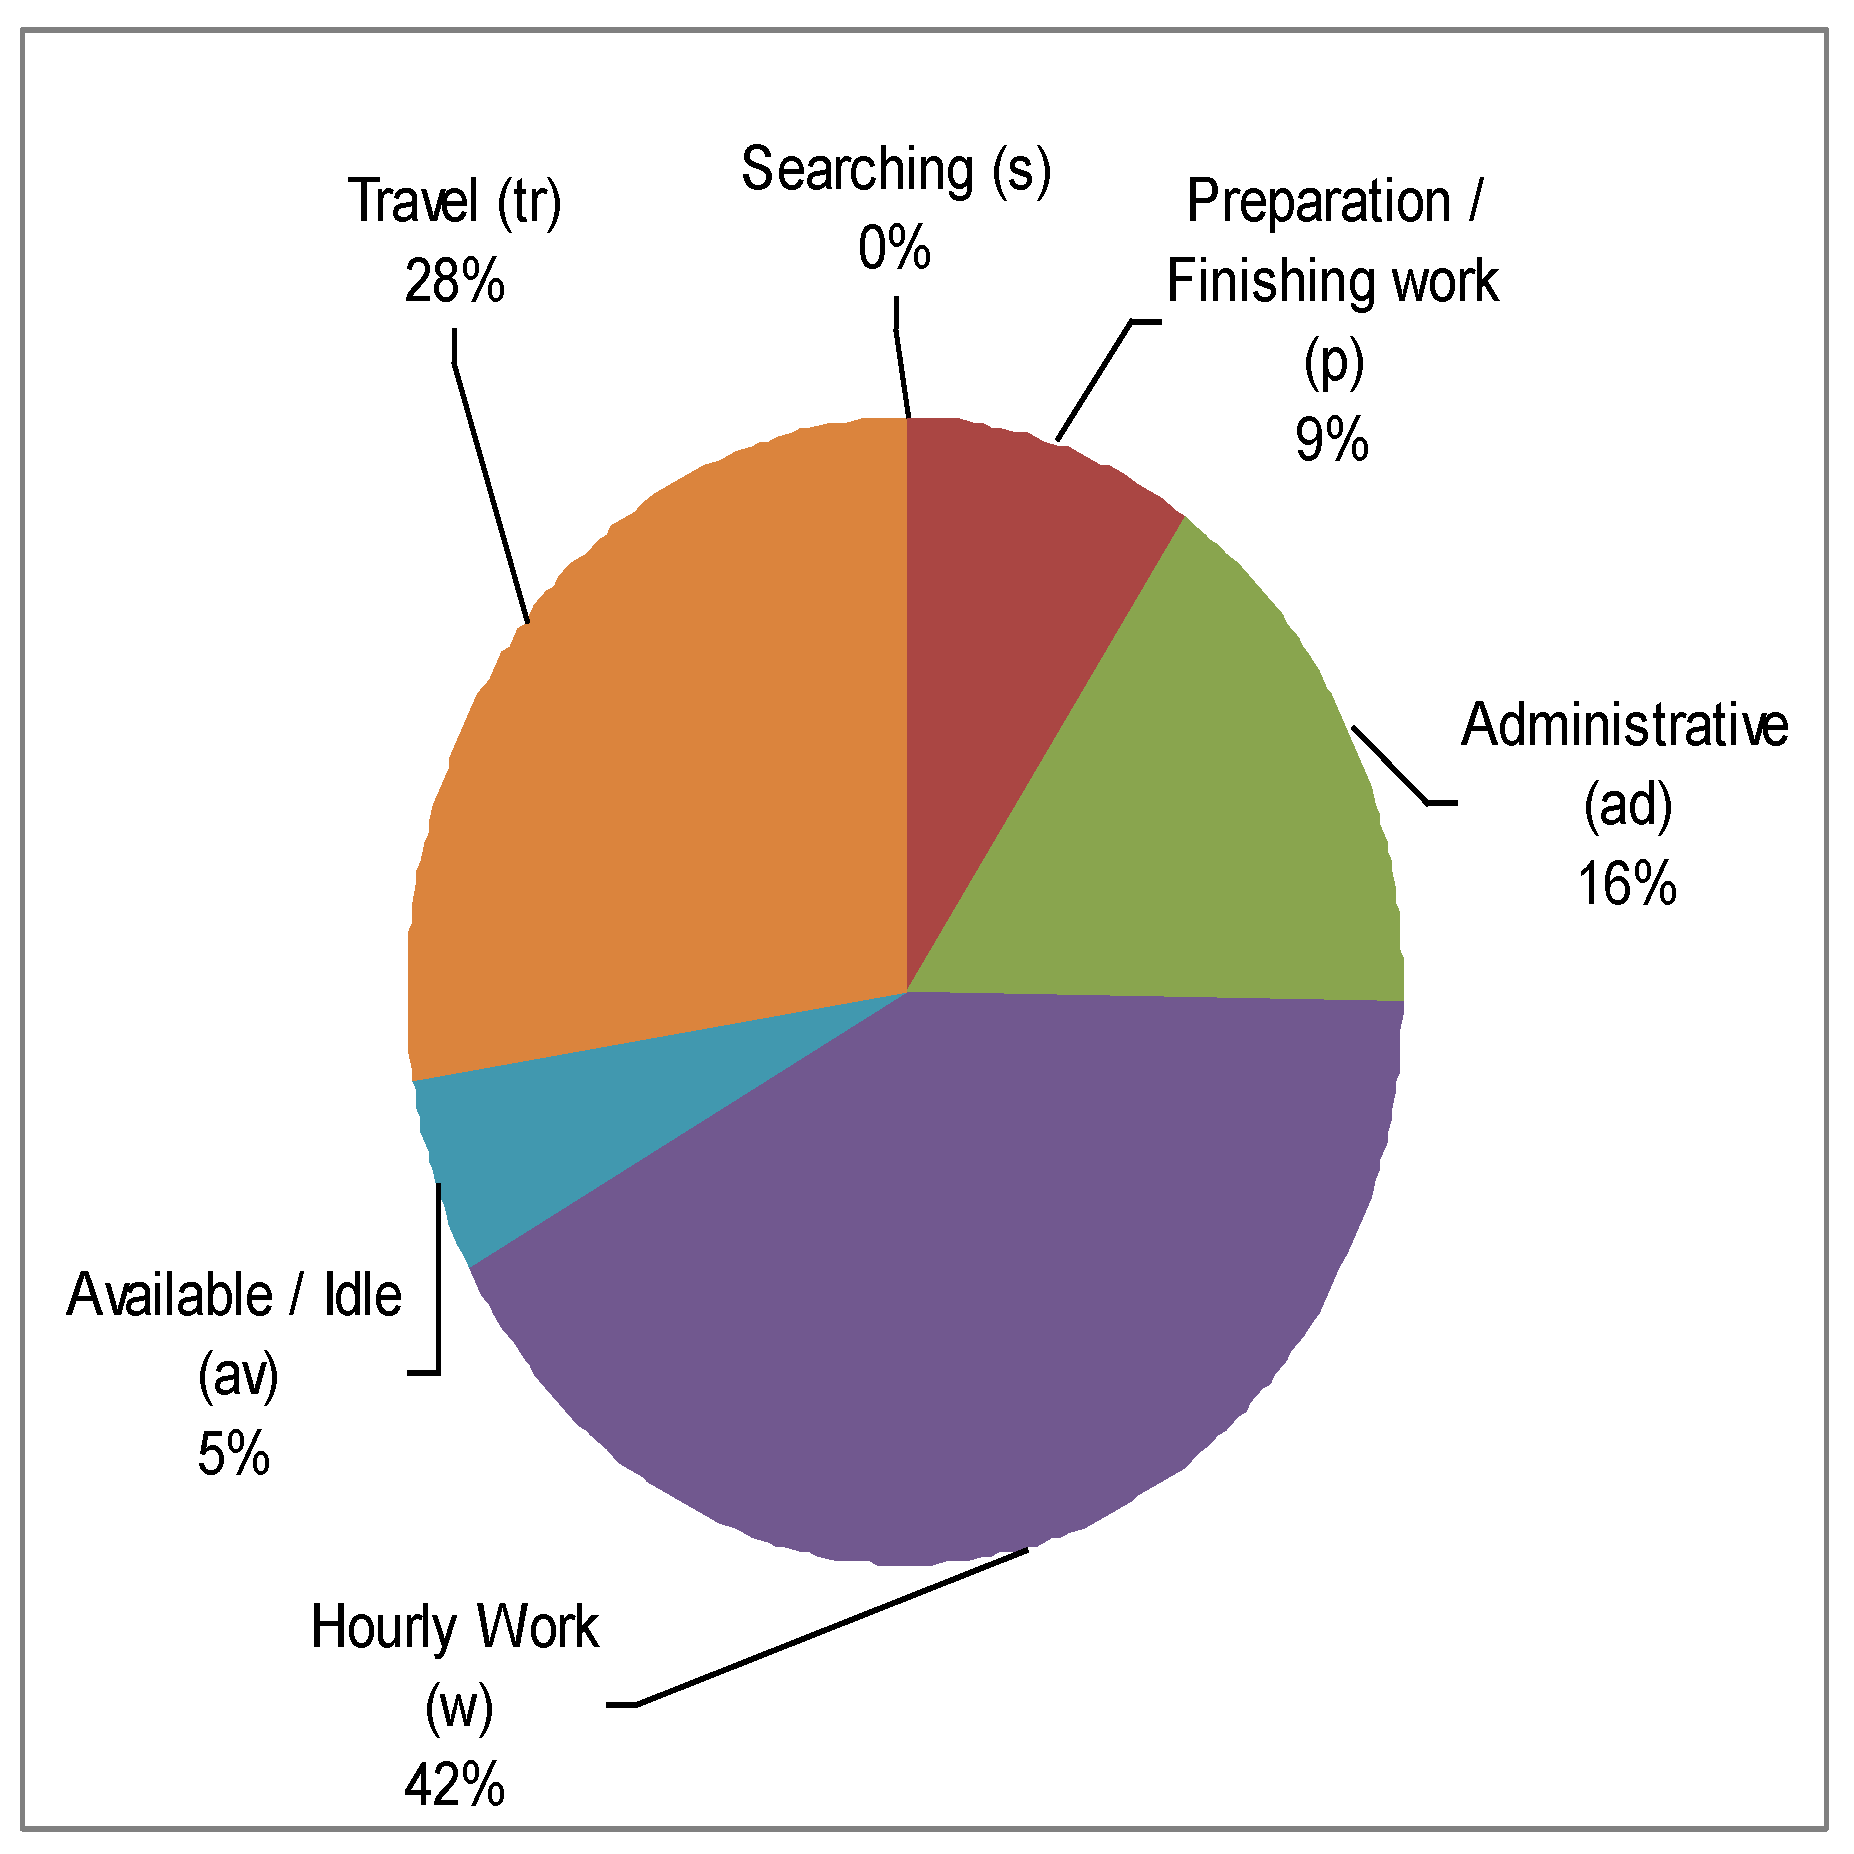
Figure 7.
Maintenance strategy change algorithm.
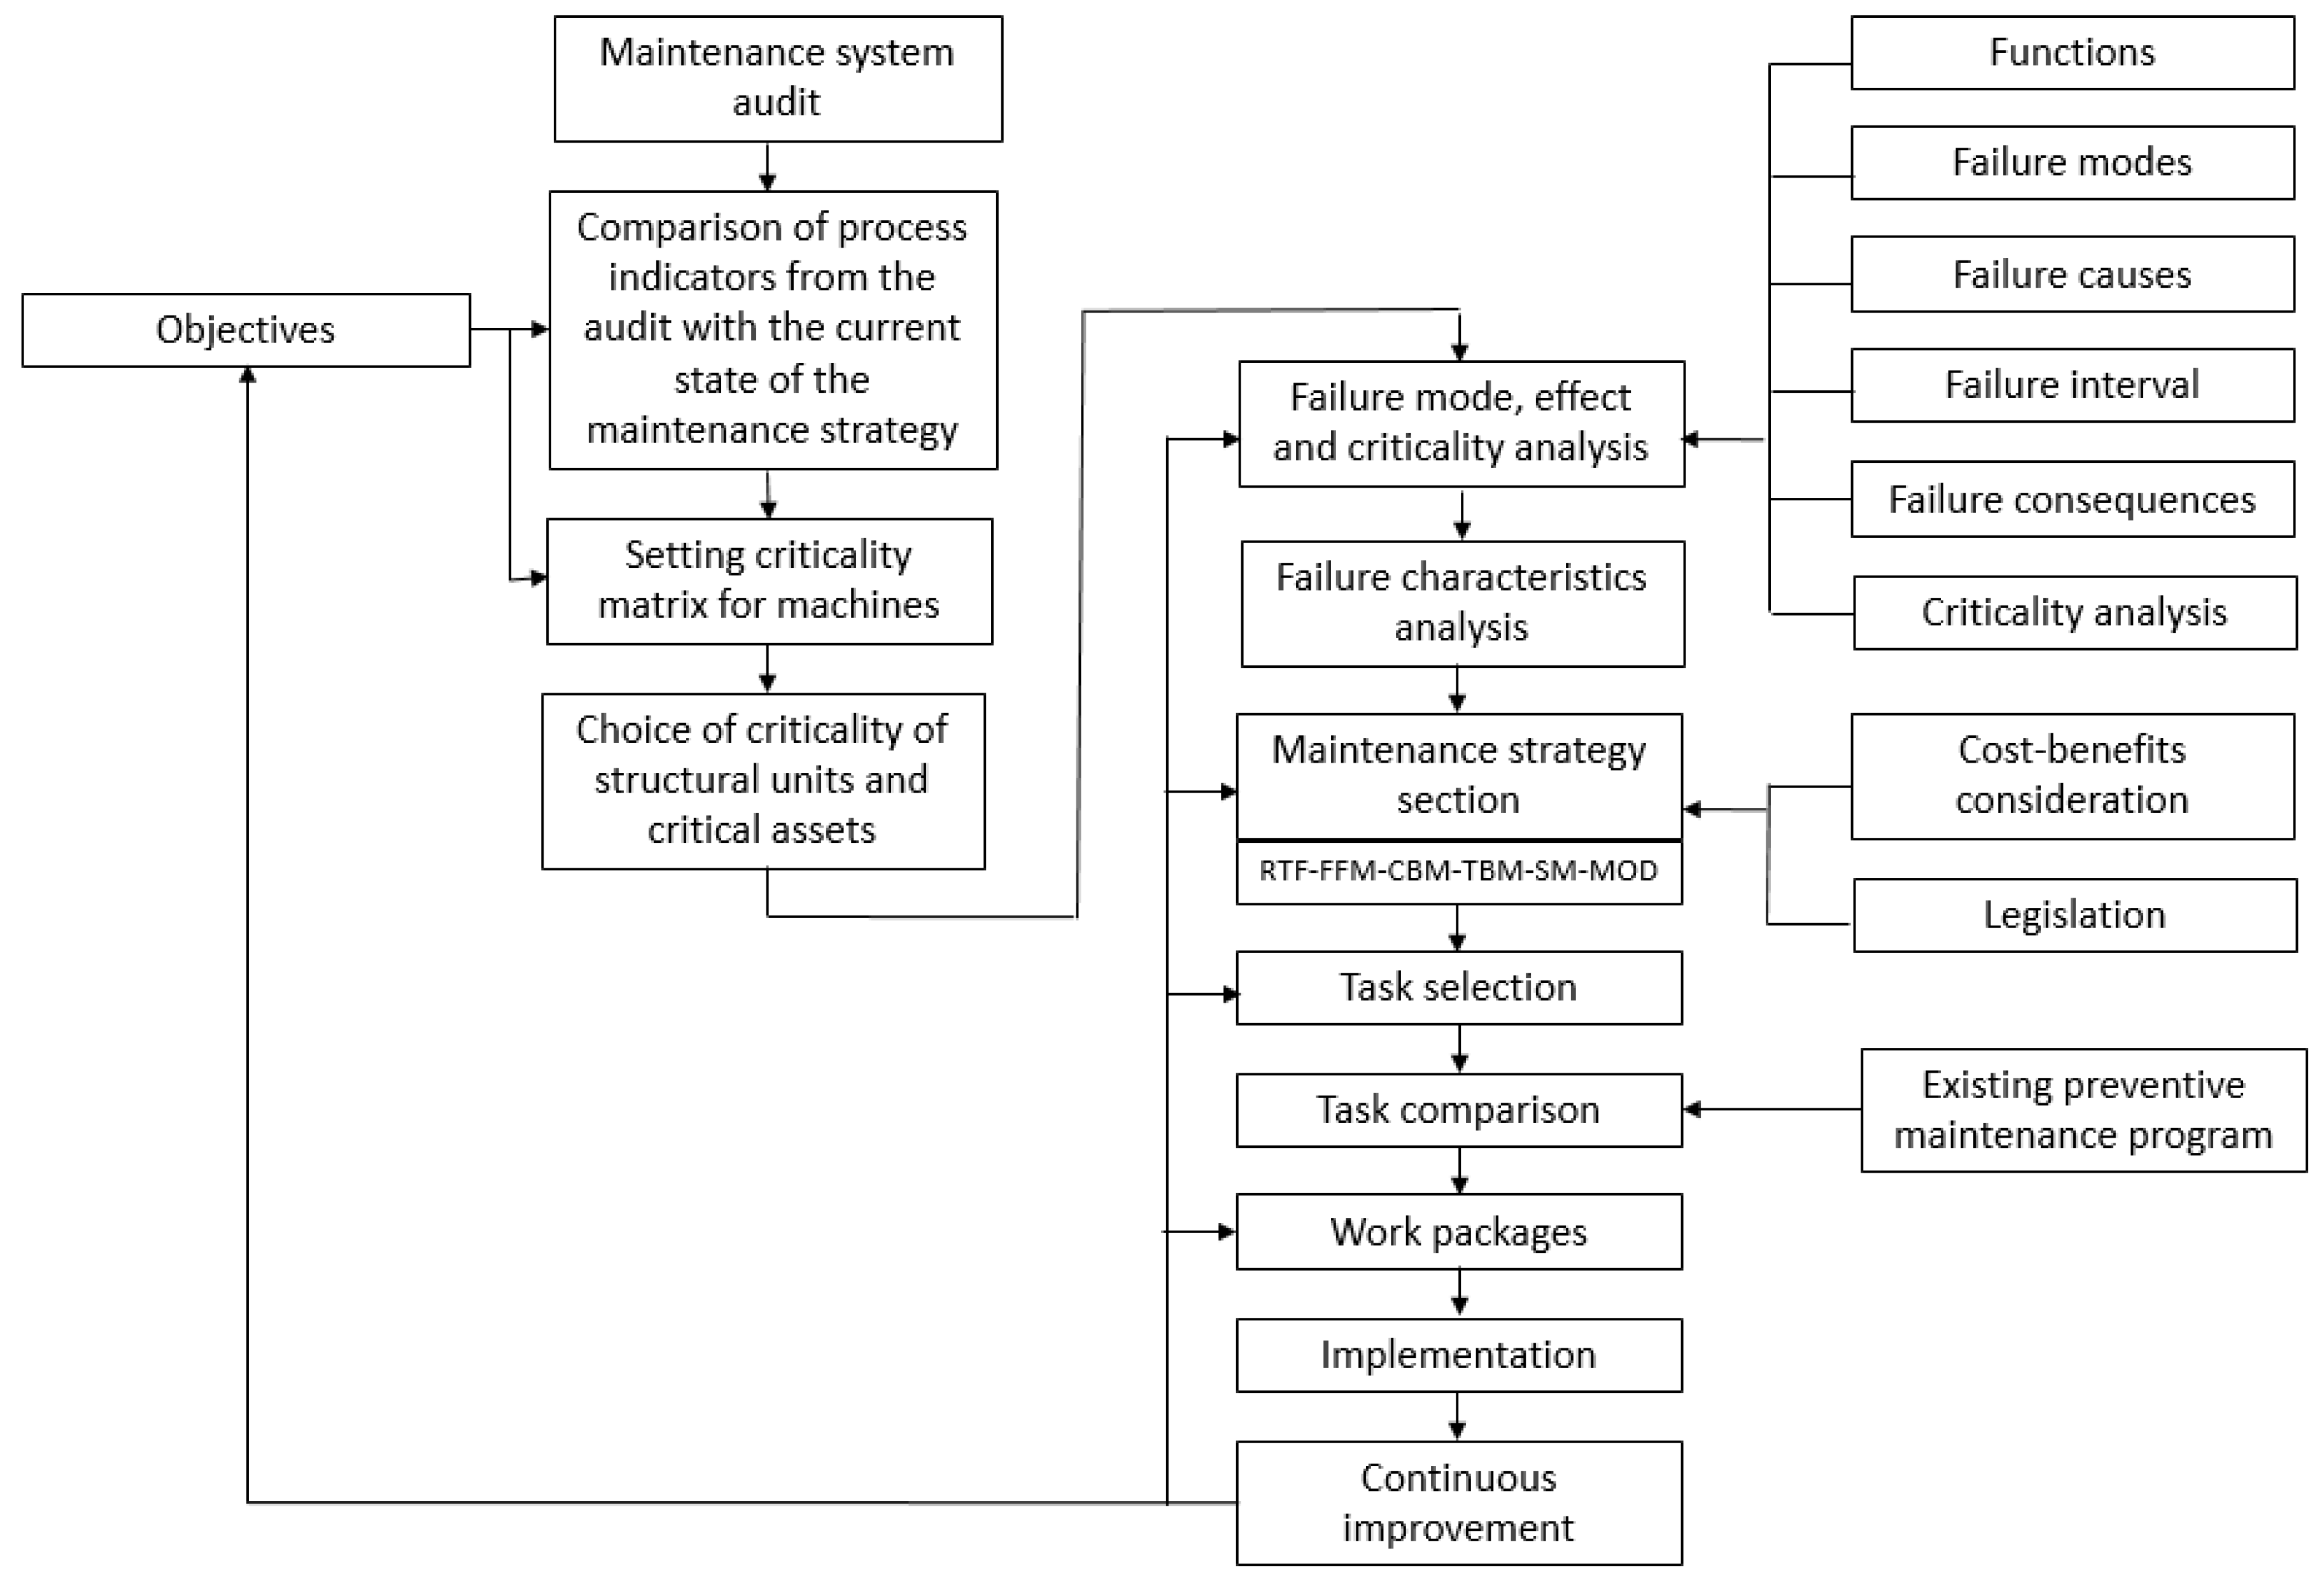
Figure 8.
Maintenance strategy change plan.
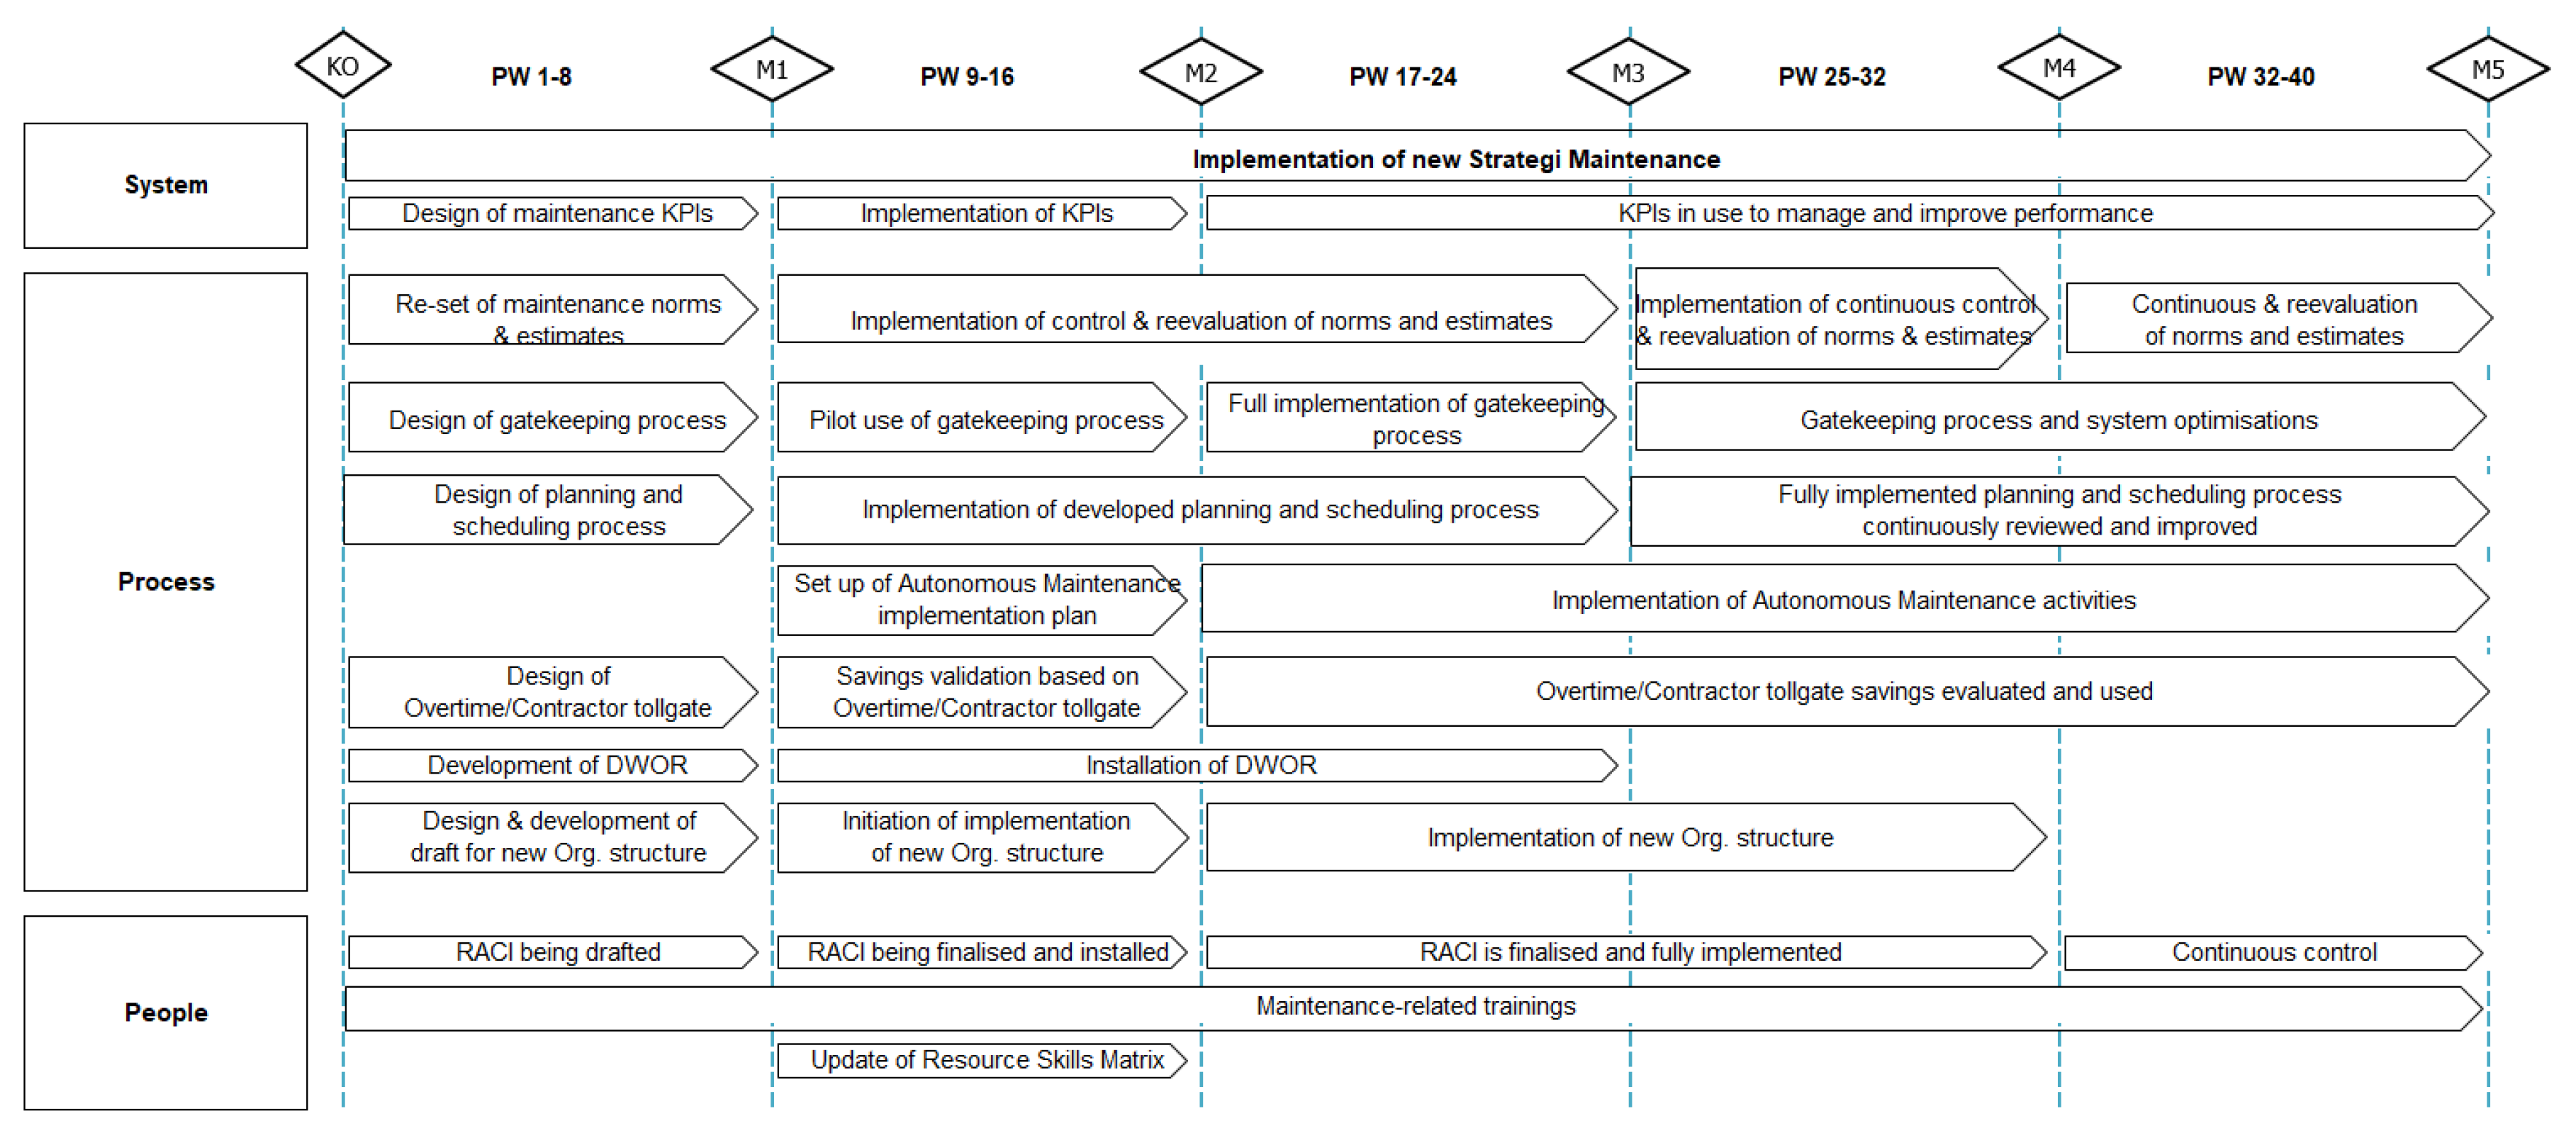
Figure 9.
RACI matrix.
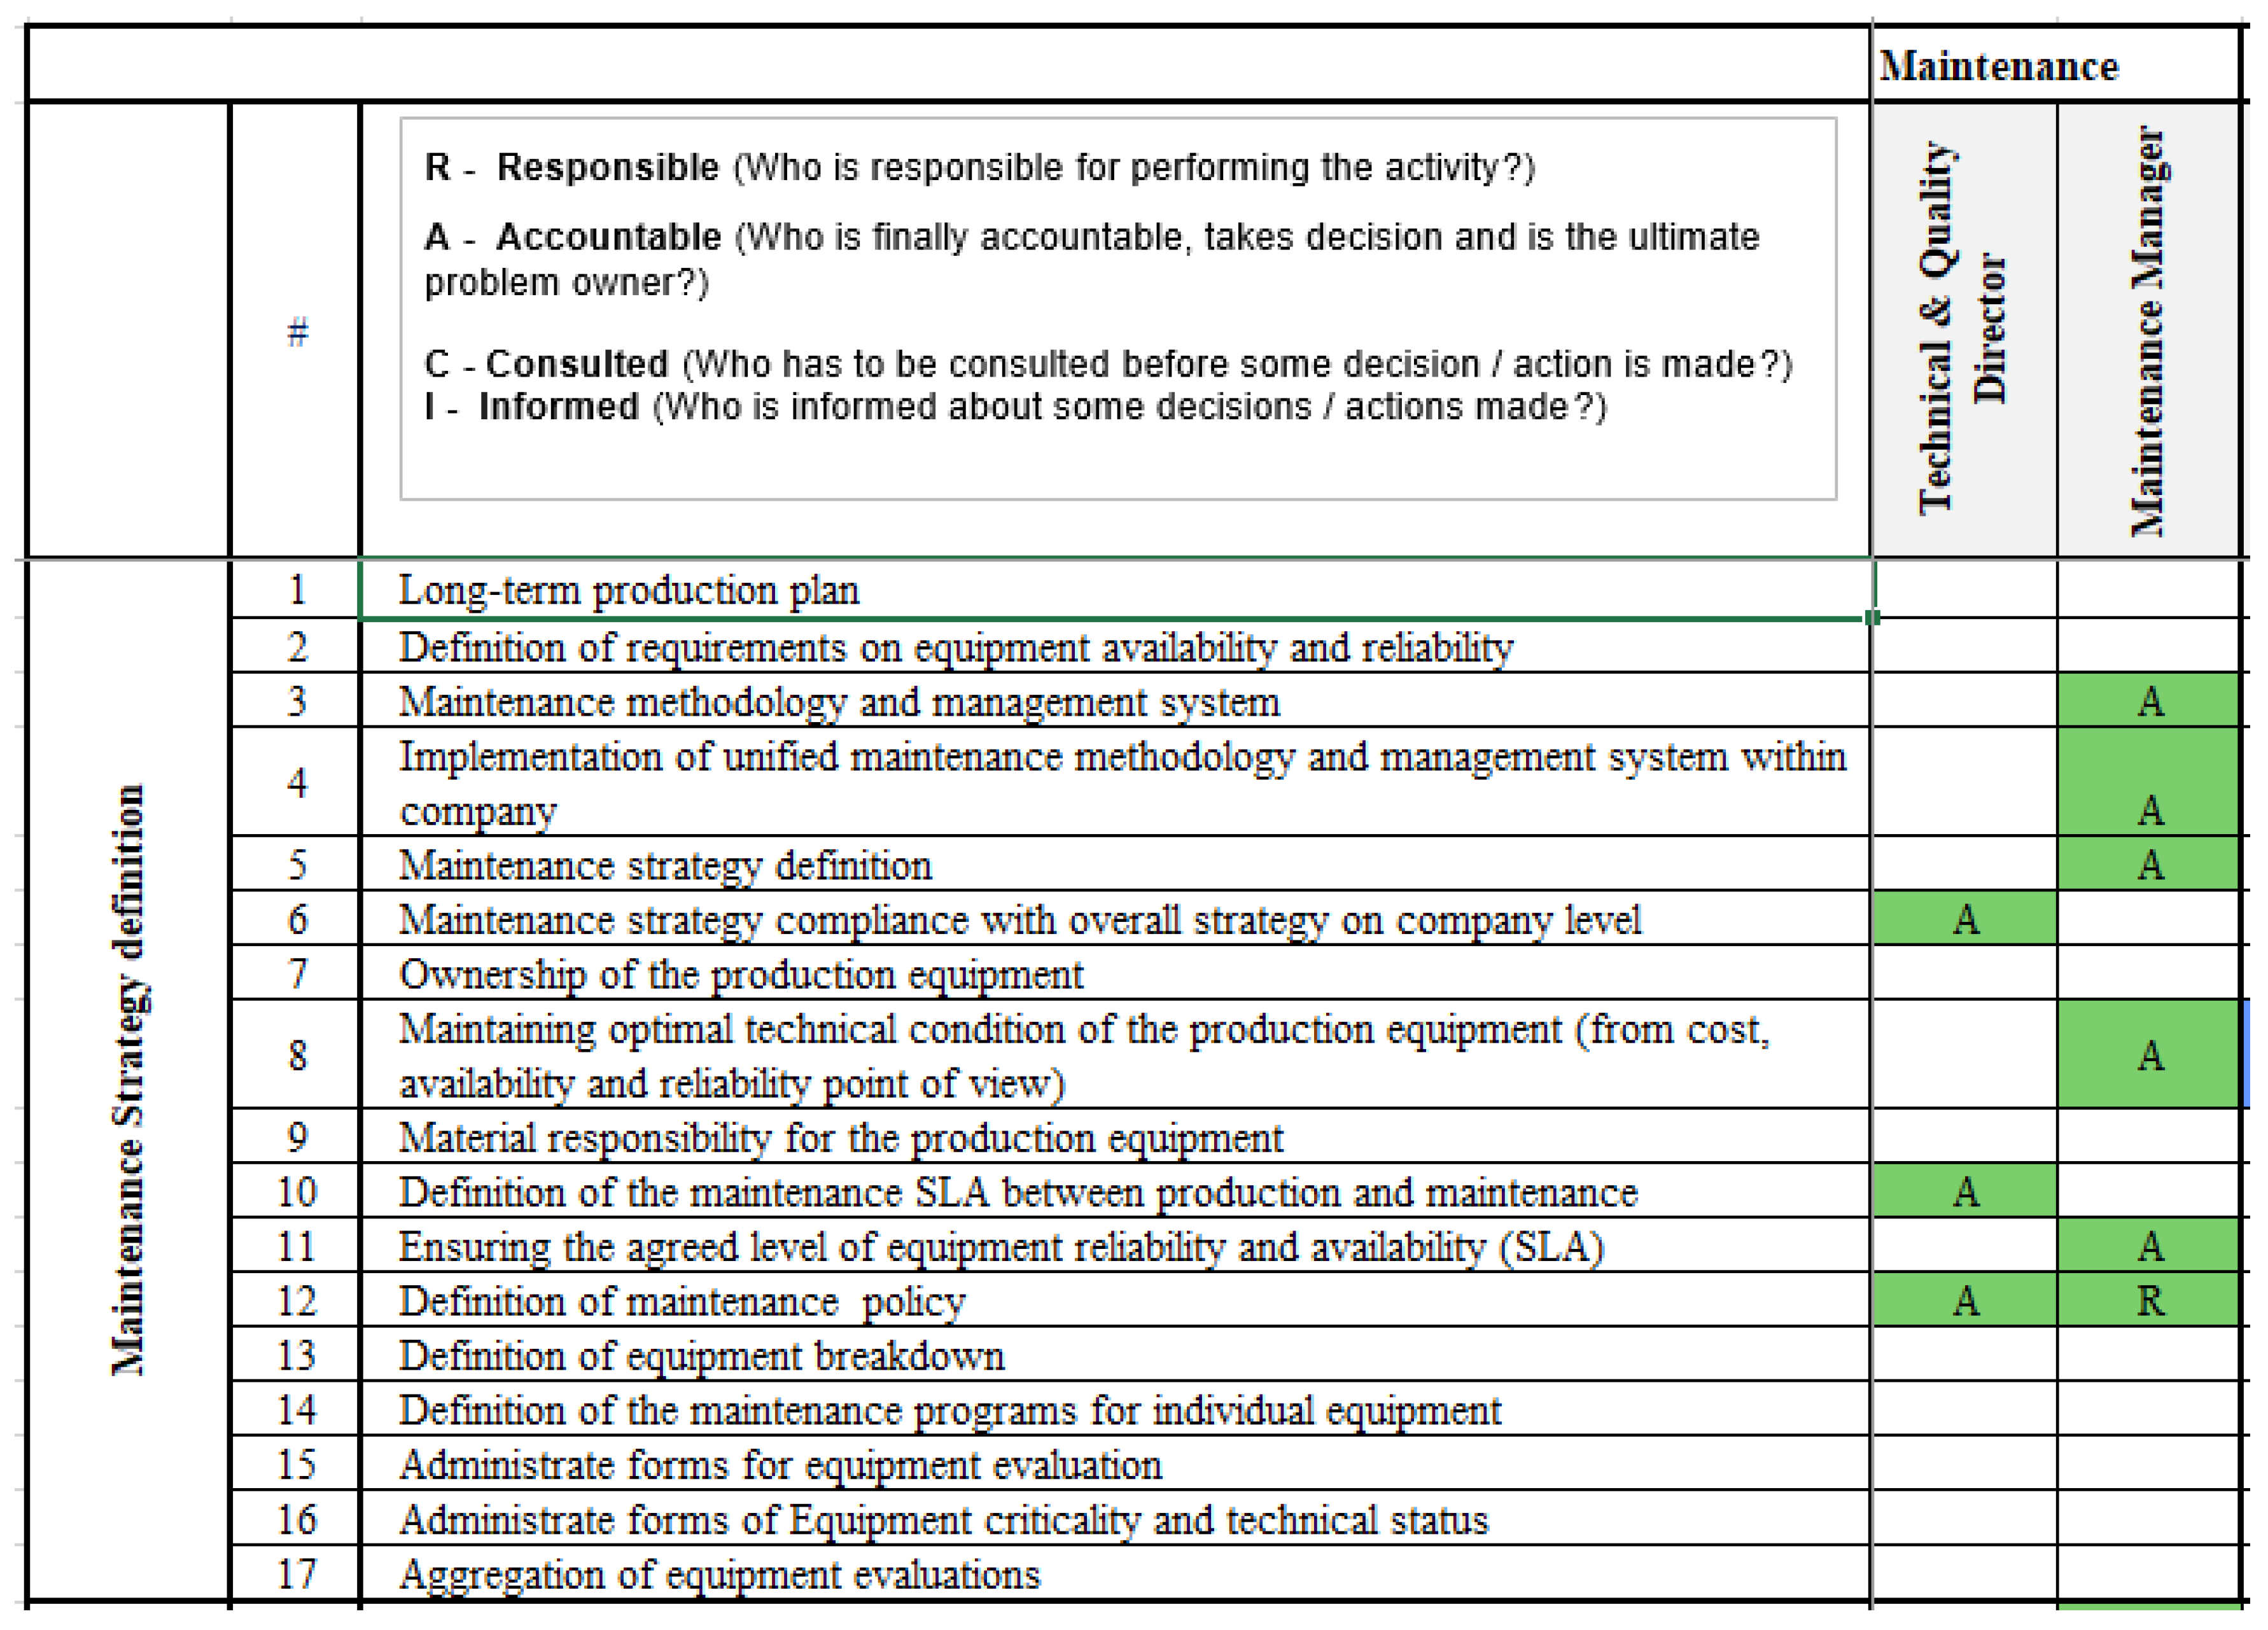
Figure 10.
Graph OEE.
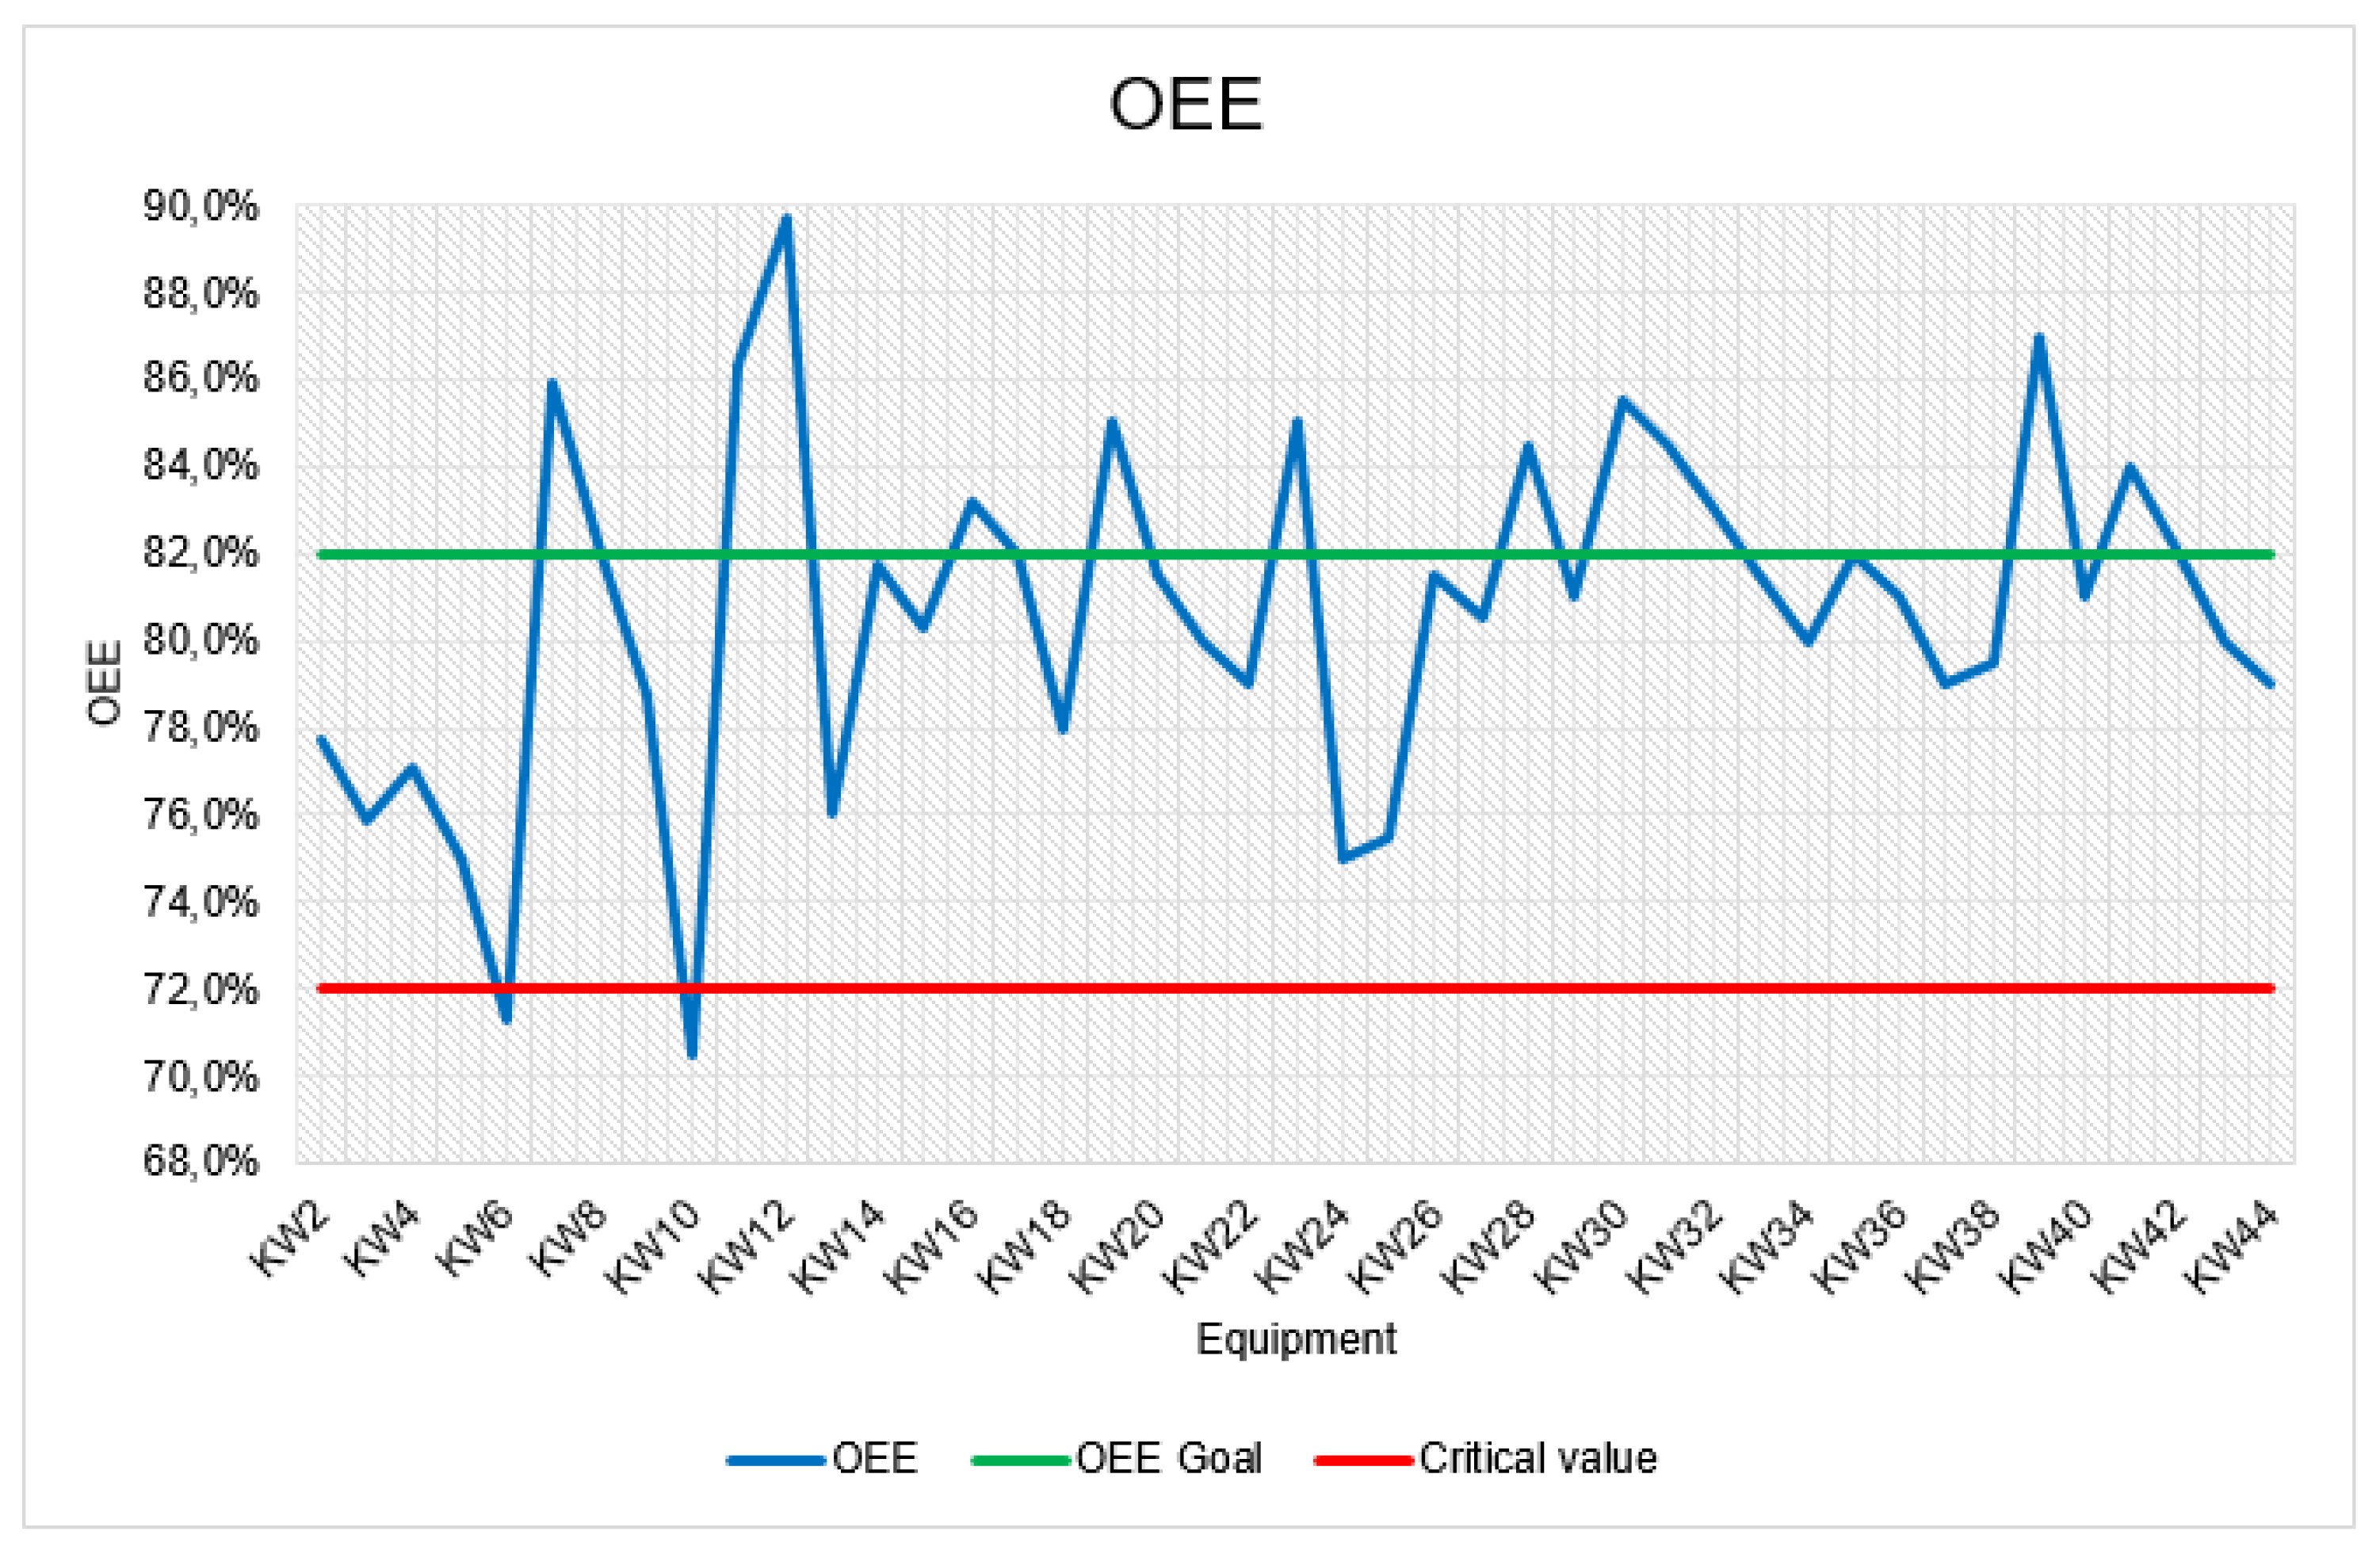
Figure 11.
The impact of a change in maintenance strategy on the production quality of a production system.
Figure 11.
The impact of a change in maintenance strategy on the production quality of a production system.
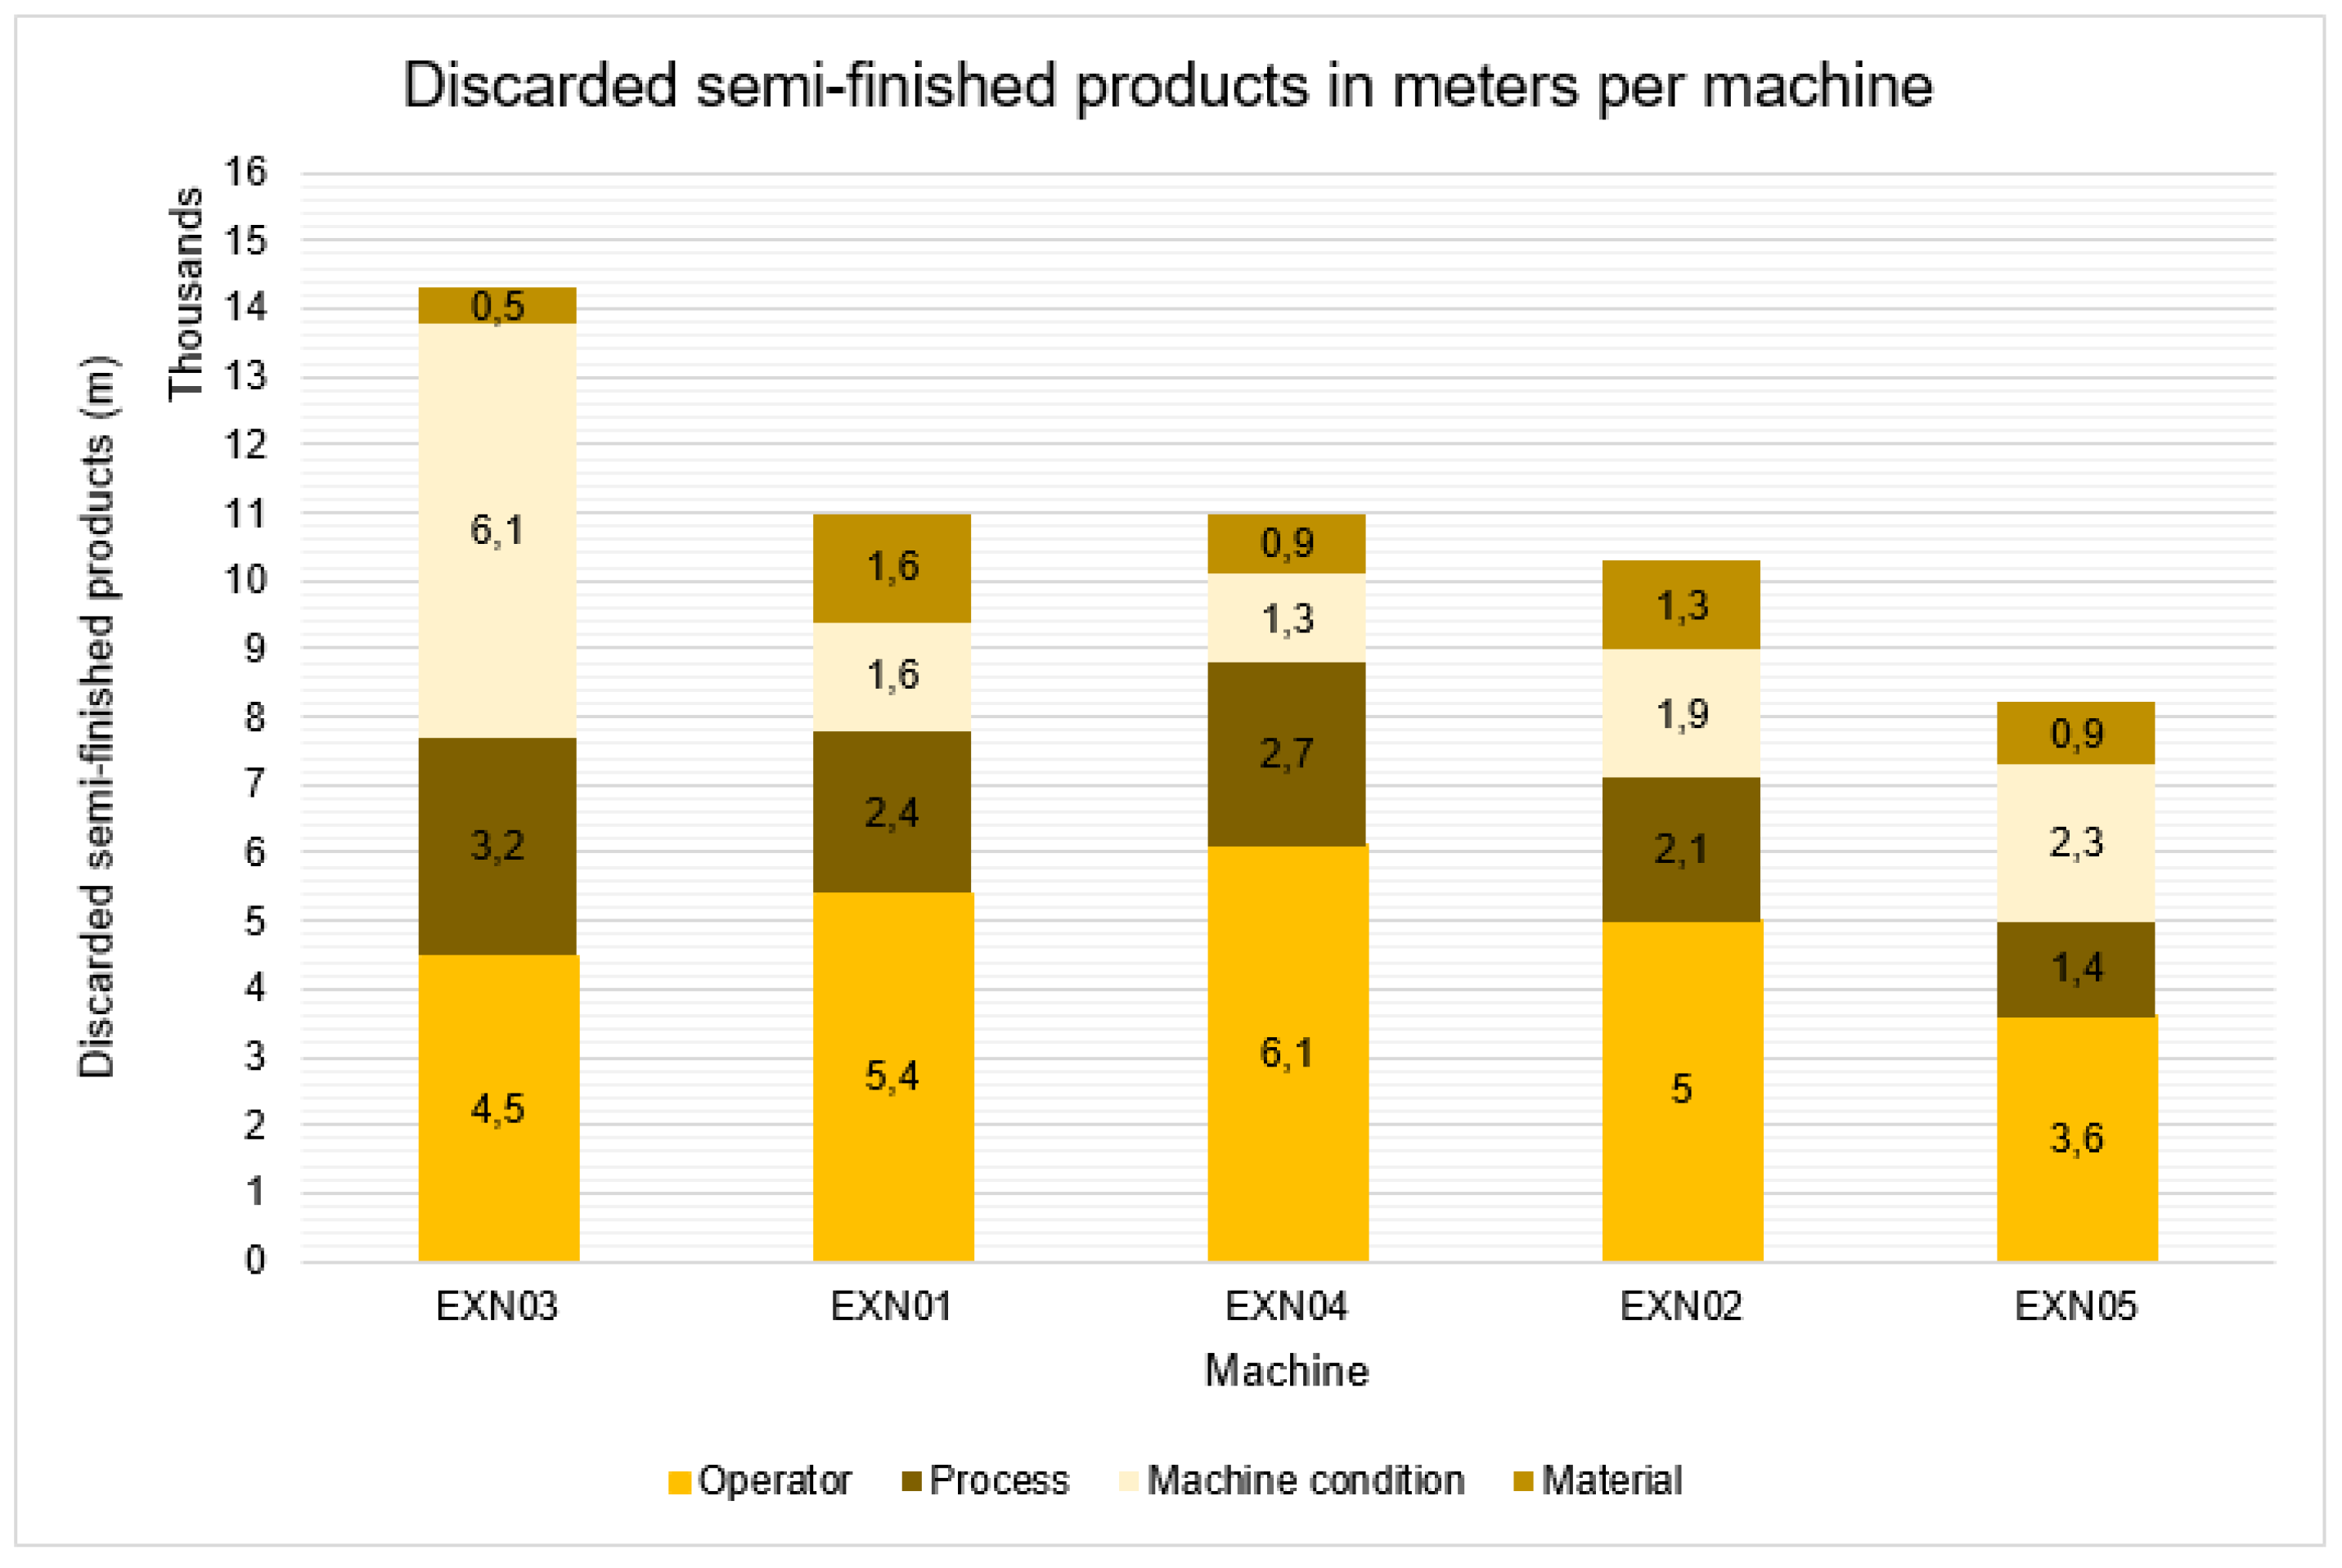
Figure 12.
Parameter determination algorithm for SP inventory management.
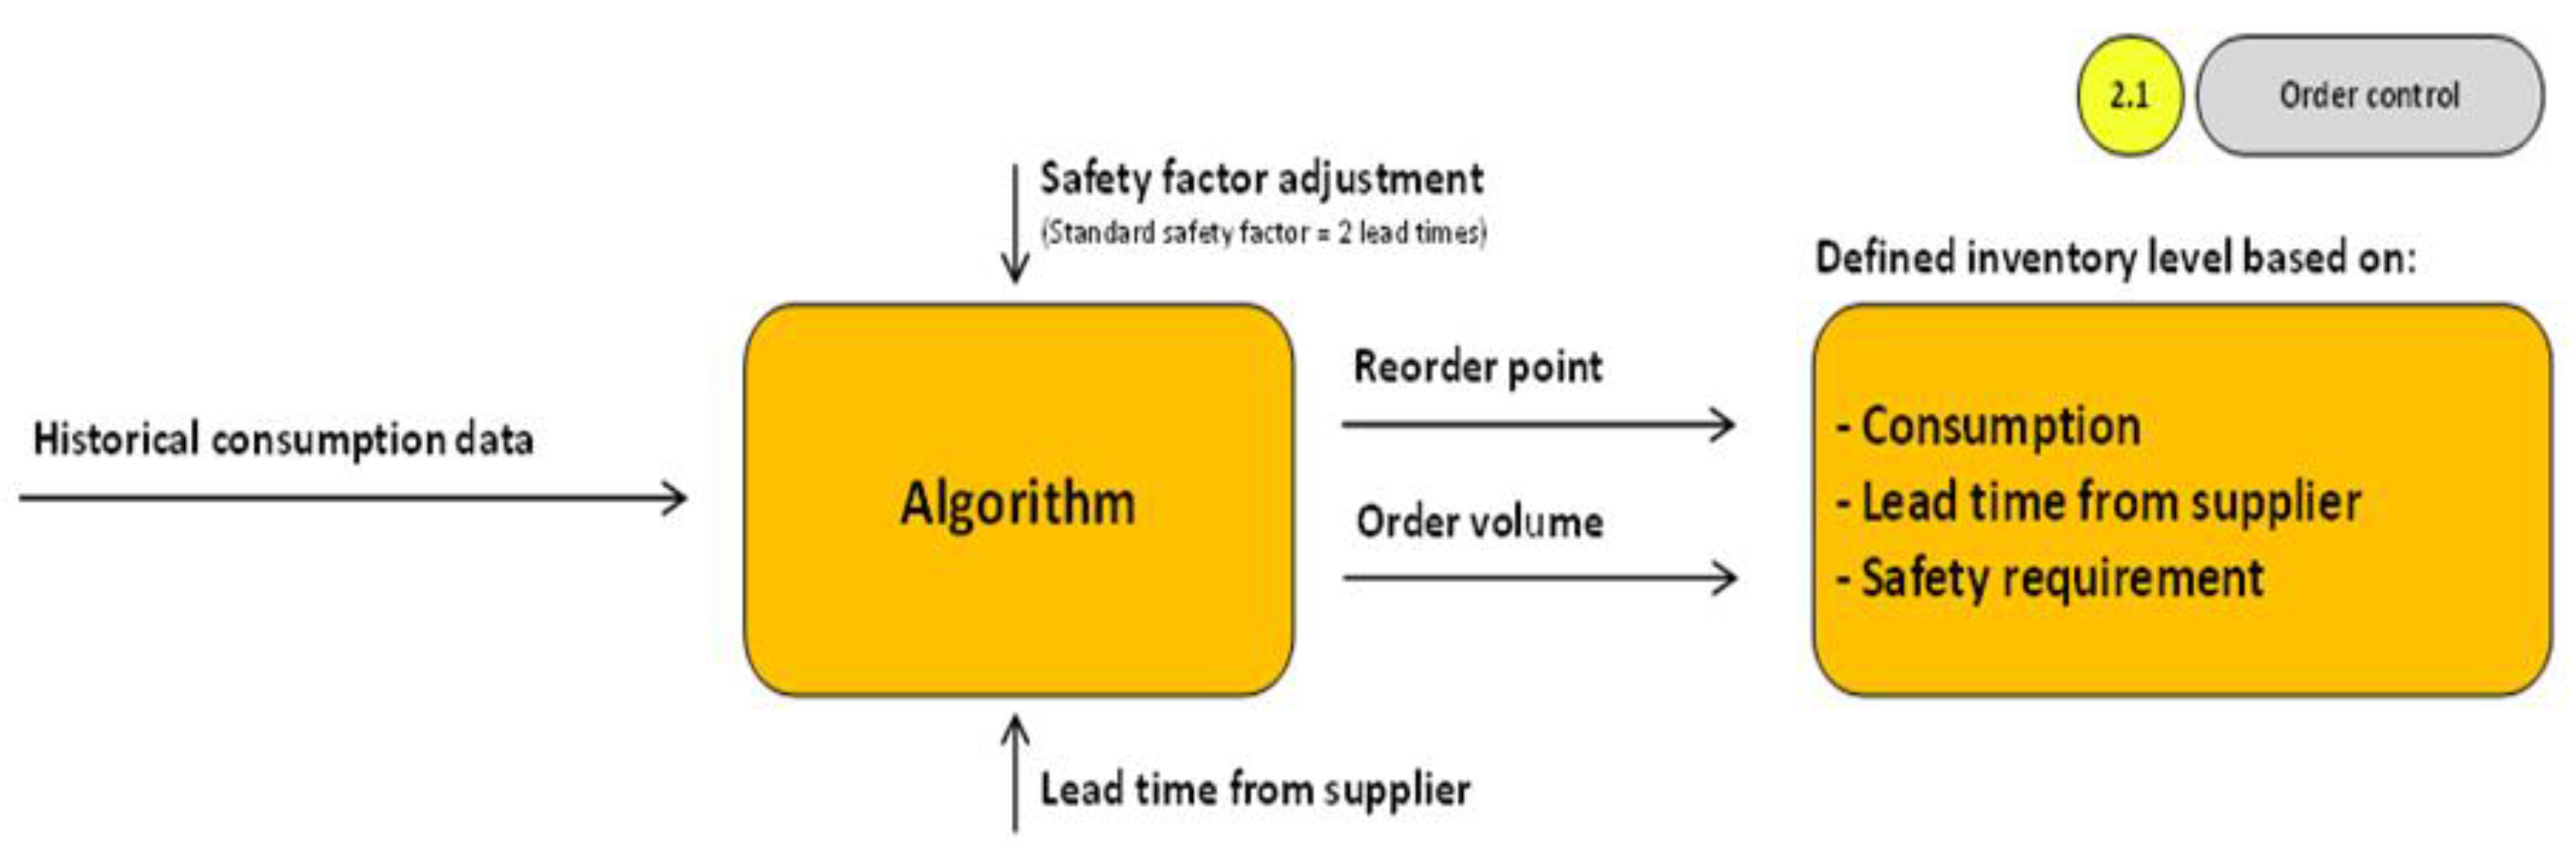
Figure 13.
Proposed spare parts criticality matrix.
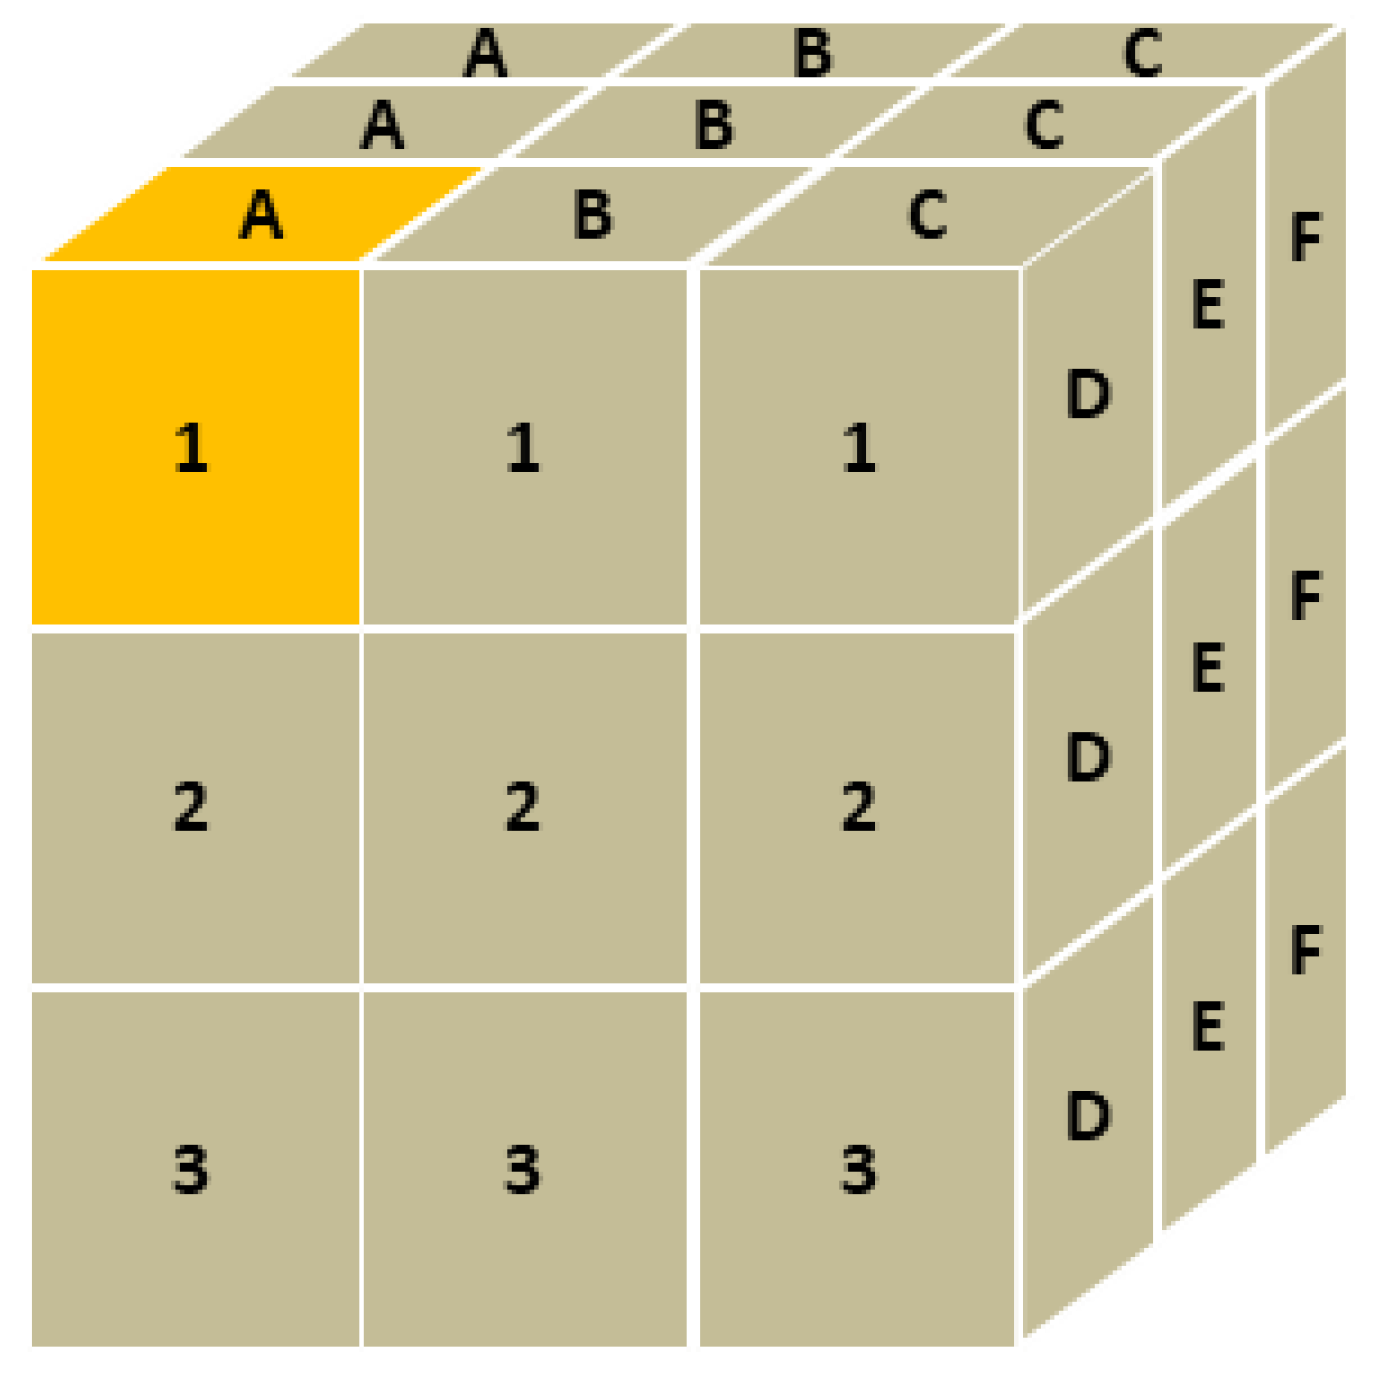
Figure 14.
Comparison of inventory values.
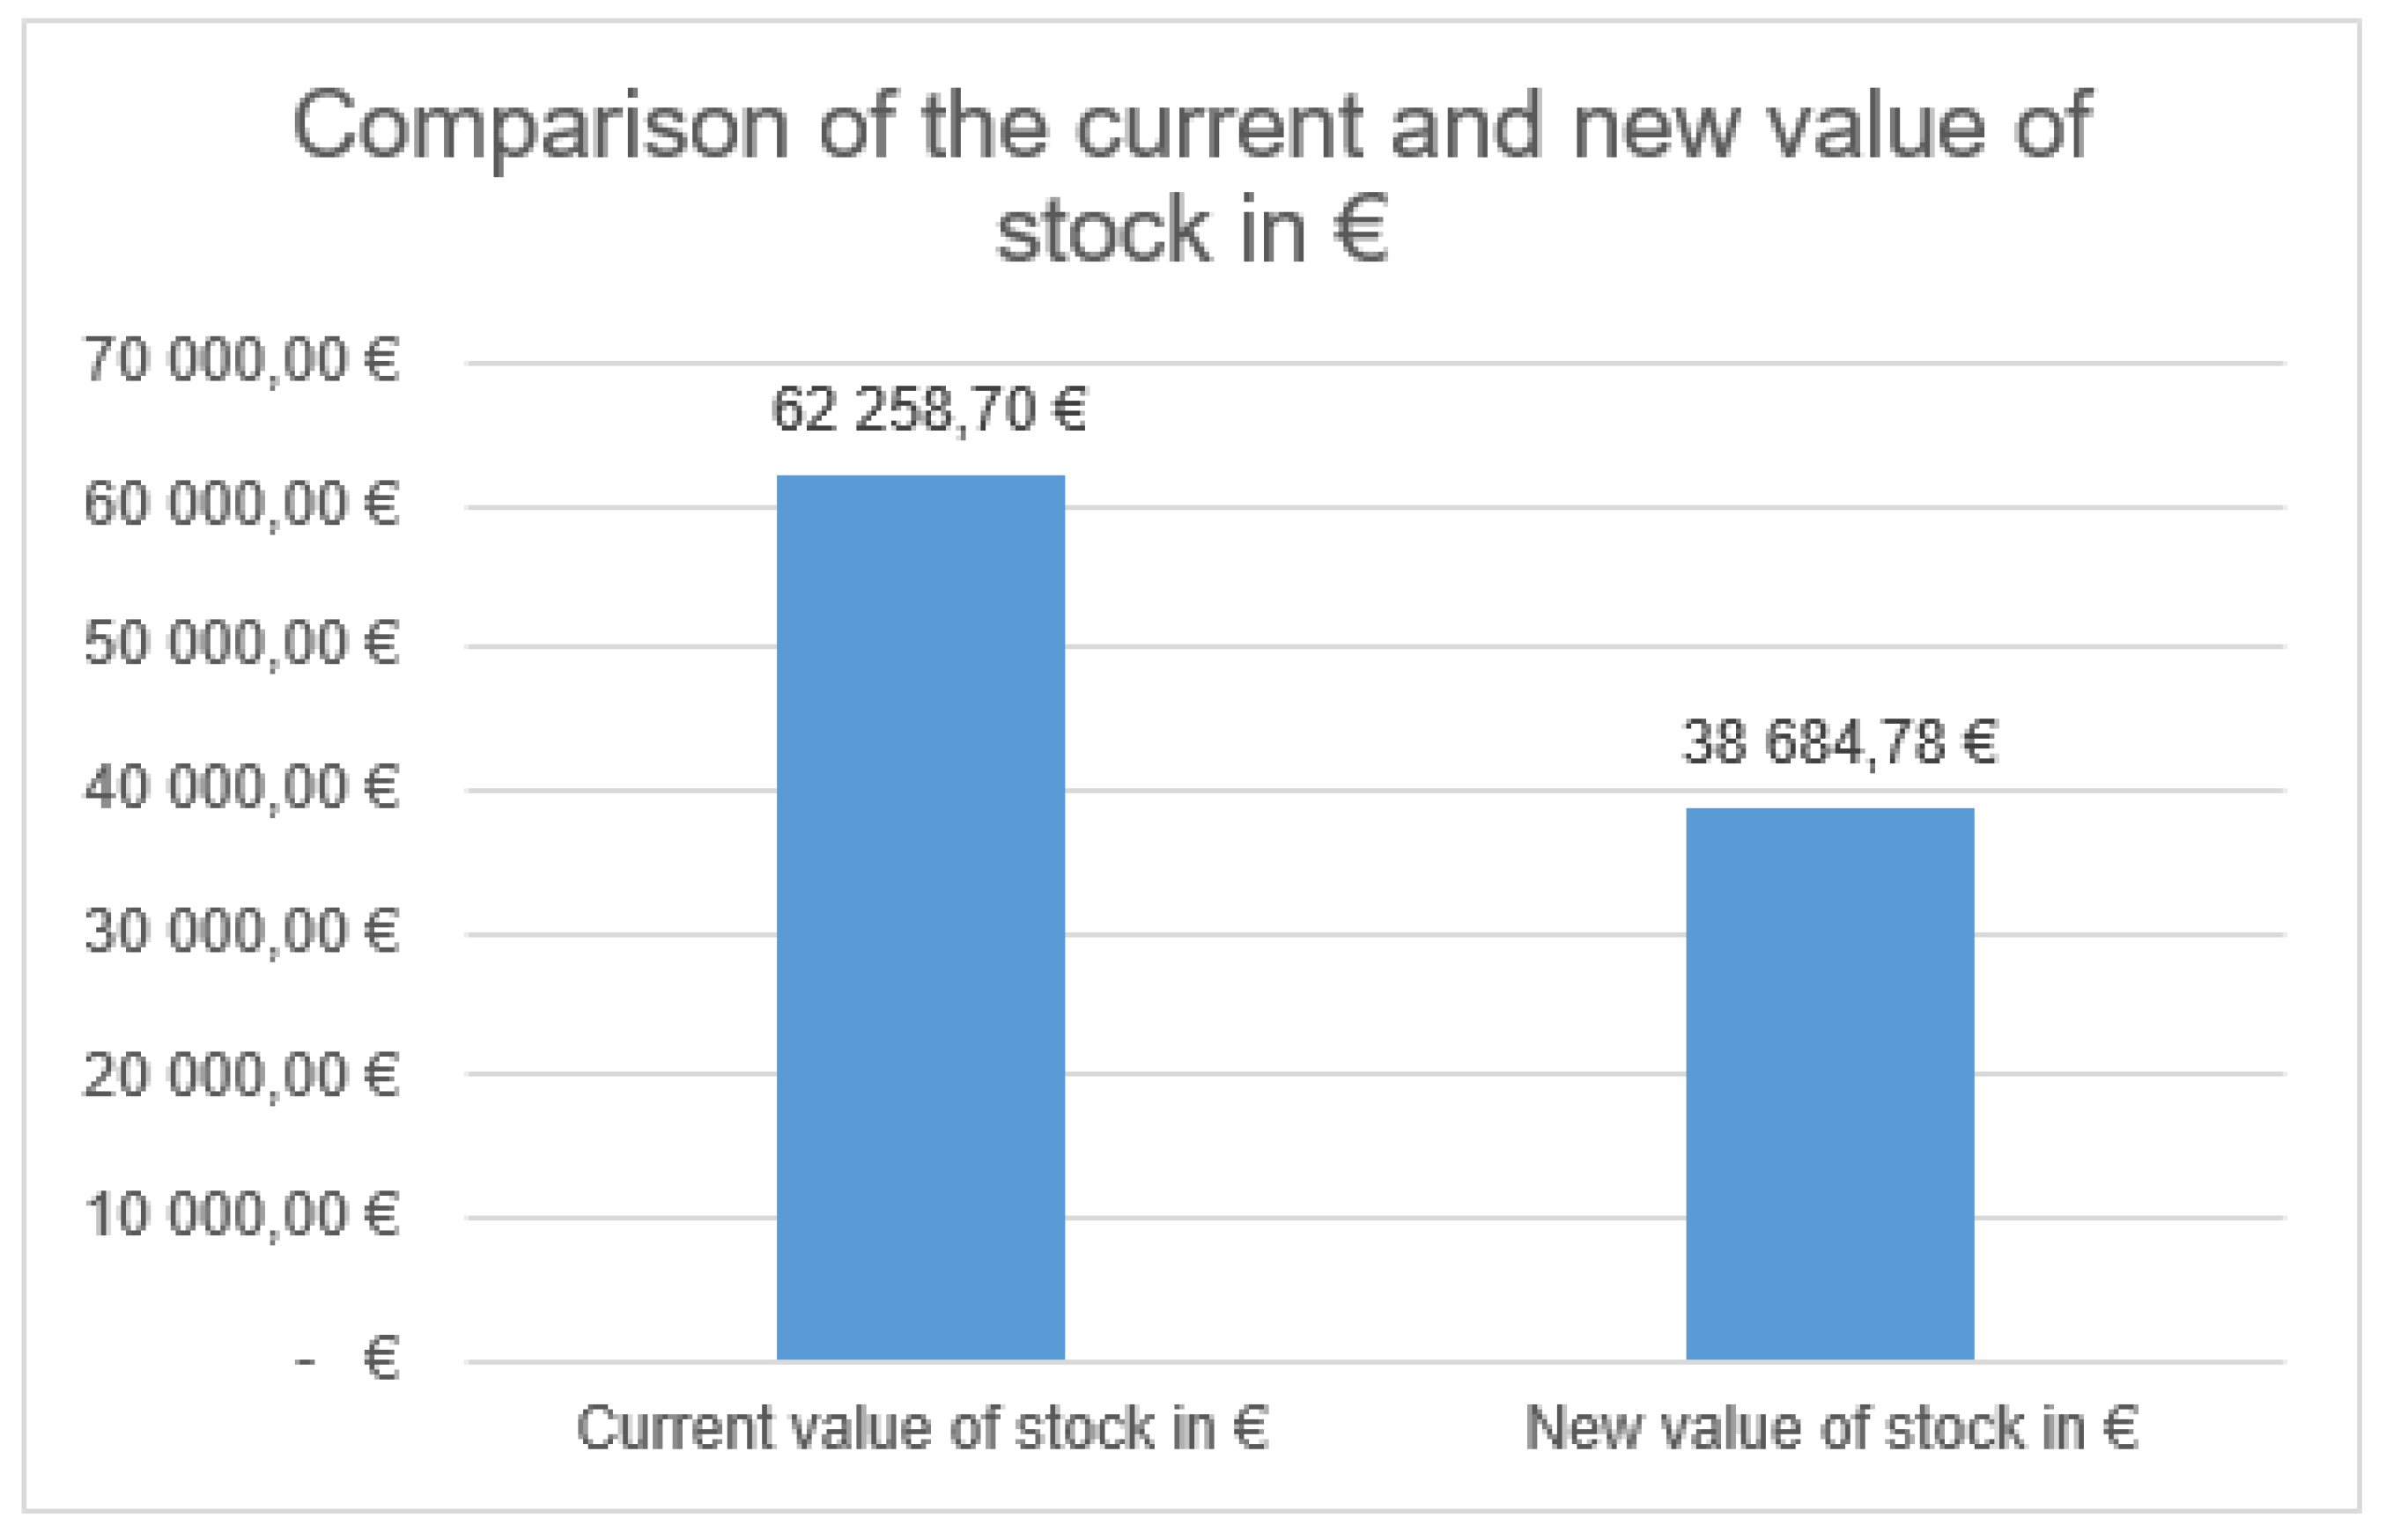
Figure 15.
Procedure for reducing maintenance capacity.
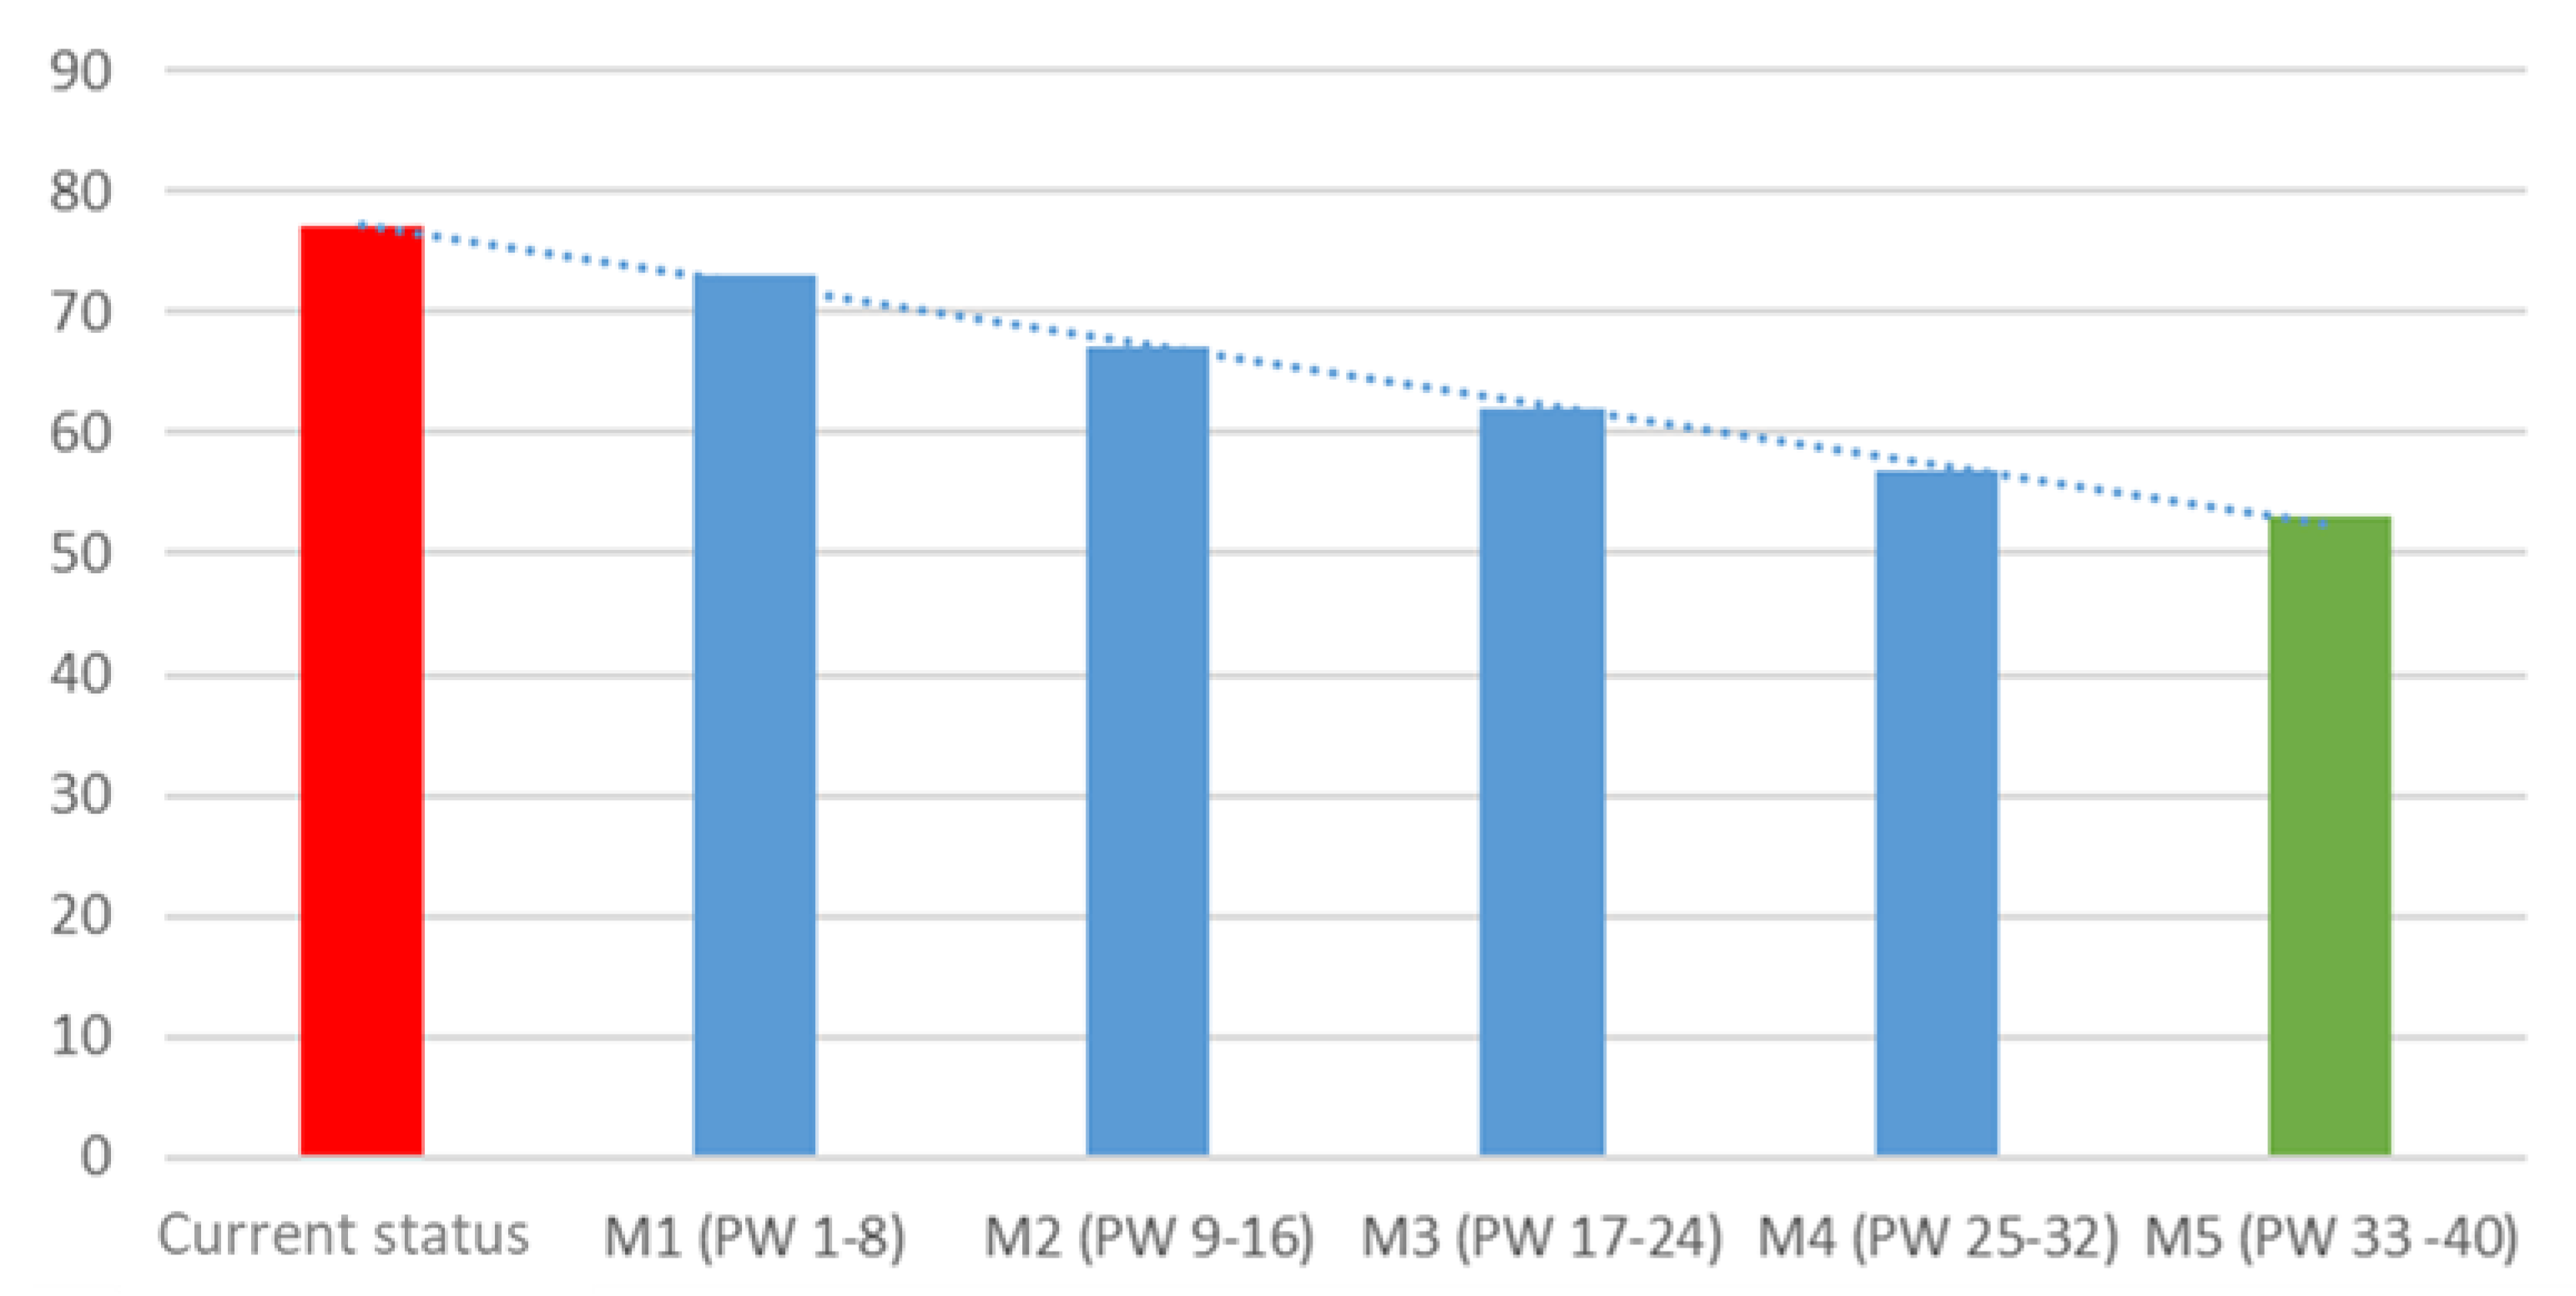
Figure 16.
Reduction of maintenance capacities by profession.
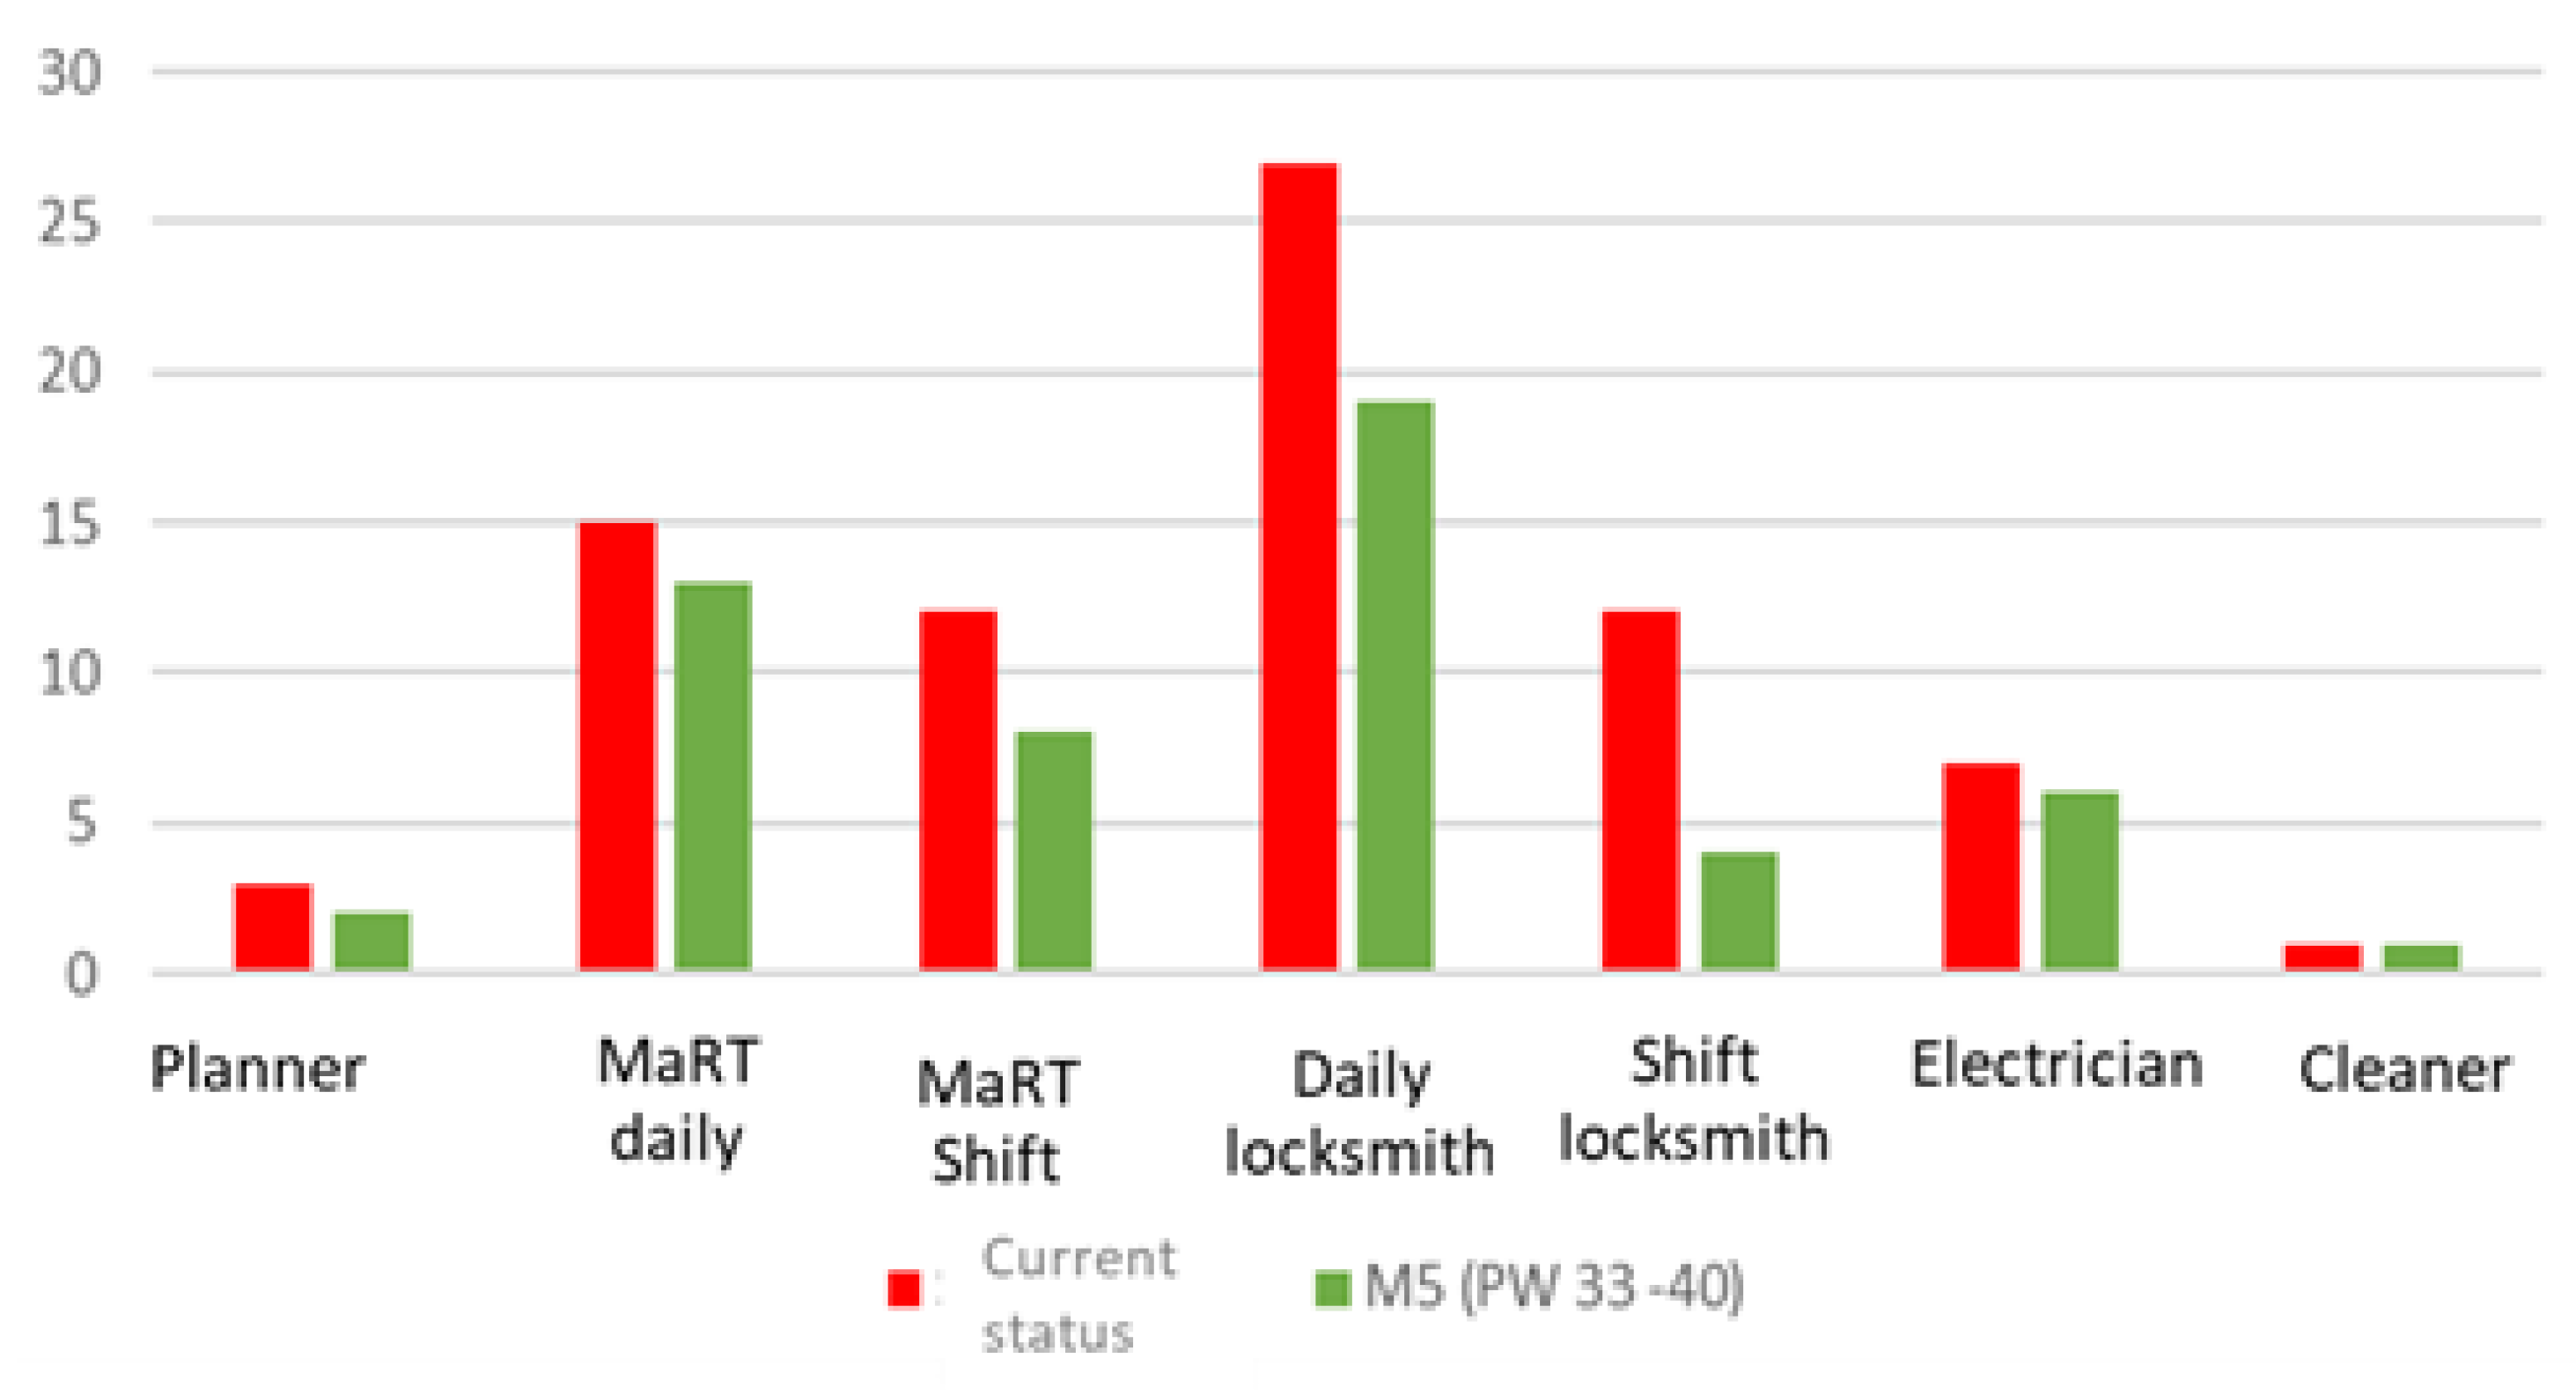

Table 1.
External benchmarking.
| Indicator | Nordic benchmarking analysis | World Class |
|---|---|---|
| Overall equipment efficiency (OEE) | 76,4 | > 90 % |
| Actual running time as % of planned running time (Emergency) | 88,1 | > 90 - 95 % |
| Maintenance costs as % of company turnover | 4,1 | < 3 |
| Maintenance costs as % of the replacement value of fixed assets | 3,0 | < 1,8 % |
| Inventory of spare parts and materials as % of man-hours for maintenance | 0,8 | < 0,25 % |
| Man-hours for preventive maintenance as % of man-hours for maintenance | 38,4 | 40 % |
| Maintenance man-hours after failure as % of maintenance man-hours | 29,8 | 5 % |
| Man-hours planned and scheduled as % of man-hours for maintenance | 63,0 | > 90 - 95 % |
Table 2.
KPI's indicators for management (BSC maintenance).
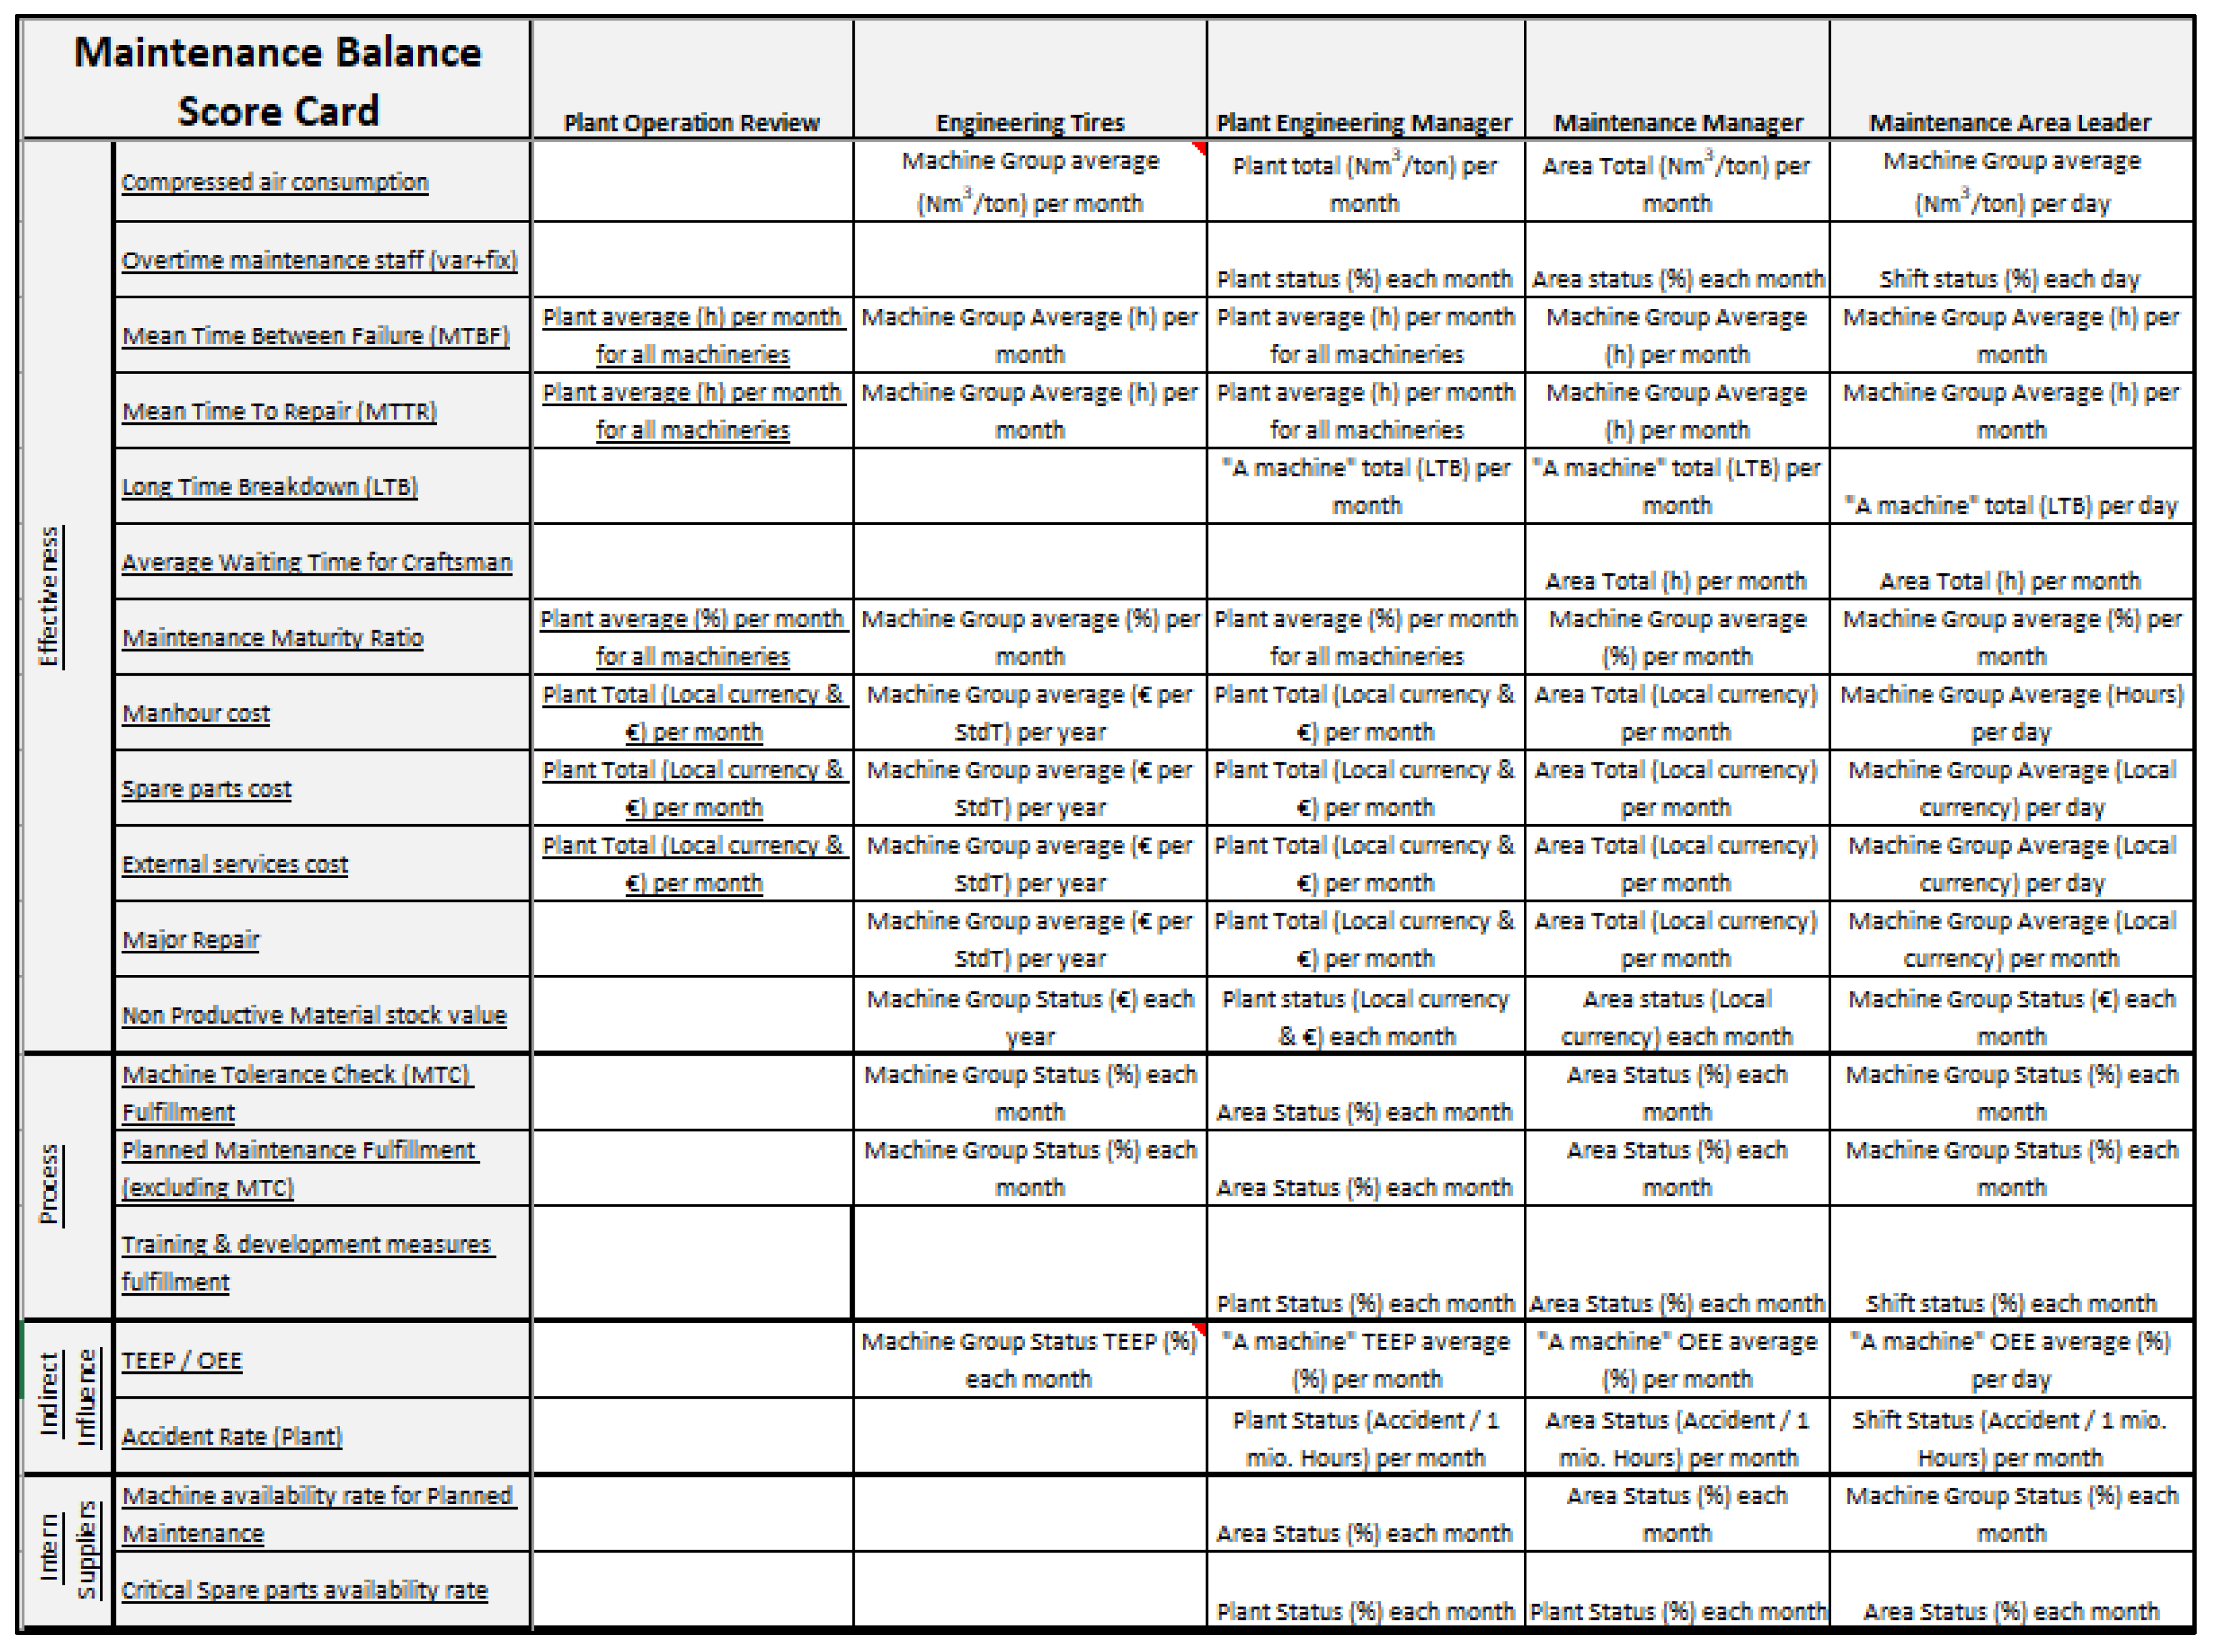
Table 3.
Comparison of discarded materials after the introduction of the new PPM.
| Discarded material before failure | ||
|---|---|---|
| Original state (%) | Status (%) | Improvement (%) |
| 29,84 | 22,75 | 23,76 |
Table 4.
Comparison of the number of rejected semi-finished products.
| The number of rejected semi-finished products | |||
| A type of elimination | Original state (%) | Status (%) | Improvement (%) |
| As a results of machinery and equipment | 804 | 619 | 23,01% |
| All the reasons | 5821 | 4887 | 16,05% |
Table 5.
Table of economic evaluation of proposals.
| Economic evaluation of design solutions | ||||
| Indicator | Expected improvement (%) | Expected savings (€) | Average (€) | |
| Min. | Max. | |||
| Scrap I | 4%-7% | 14 566,39 € | 25 491,19 € | 20 028,79 € |
| WOT | 13%-17% | 14 244,82 € | 18 627,84 € | 16 436,33 € |
| Downtime/Disruptions | 10%-15% | 921,32 € | 1 381,99 € | 1 151,66 € |
| Cost | 1 100,00 € | 1 100,00 € | 1 100,00 € | |
| Monthly saving | 28 632,53 € | 44 401,01 € | 36 516,77 € | |
| Annual saving | 343 590,40 € | 532 812,14 € | 438 201,27 € | |
Table 6.
Categories for determining the criticality of SP ABCX.
| Category | Description |
|---|---|
| A | A spare part without which a machine cannot function, with a high failure rate, with a long procurement time, without replacement, used in critical machines. |
| B | A spare part without which the machine can run (at least suboptimal), which has high reliability, which can be manufactured/purchased repaired in a short time, and which have a replacement. |
| C | Consumables, wear parts (filters, bits, belts) |
| X | Obsolete or never used spare parts. |
Table 7.
Criteria for determining the overall criticality of SP.
| Category | Description |
|---|---|
| A | A spare part without which a machine cannot function, with a high failure rate, with a long procurement time, without replacement, used in critical machines. |
| B | A spare part without which the machine can run (at least suboptimal), which has high reliability, which can be manufactured/purchased repaired in a short time, and which have a replacement. |
| C | Consumables, wear parts (filters, bits, belts) |
| X | Obsolete or never used spare parts. |
Table 8.
Comparison of the current situation with the new situation.
| Original values | New values | |
| Total value of stock items in € | 62 258,70 € | 38 684,78 € |
| Total number of stock items | 31 401 | 6 998 |
Table 9.
Reduction of maintenance capacities during the strategy plan change.
| Profession | Current status | M1 (PW 1-8) | M2 (PW 9-16) | M3 (PW 17-24) | M4 (PW 25-32) | M5 (PW 33-40) | pre-post period |
|---|---|---|---|---|---|---|---|
| Planner | 3 | 3 | 3 | 2 | 2 | 2 | 1 |
| MaRT daily | 15 | 18 | 14 | 14 | 14 | 13 | 2 |
| MaRT shift | 12 | 8 | 8 | 8 | 8 | 8 | 4 |
| Daily locksmith | 27 | 24 | 23 | 23 | 18 | 19 | 8 |
| Shift locksmith | 12 | 12 | 12 | 8 | 8 | 4 | 8 |
| Electrician | 7 | 7 | 6 | 6 | 6 | 6 | 1 |
| Cleaner | 1 | 1 | 1 | 1 | 1 | 1 | 0 |
| Total | 77 | 73 | 67 | 62 | 57 | 53 | 24 |
Table 10.
Description of emergency strategy.
| Description | Approves | Frequency | Document |
|---|---|---|---|
| 1. Risk factors influencing the emergency maintenance strategy are defined for lines, machines and equipment, maintenance processes | MC/MM | 1 x a year | List of risk factors, processes |
| 2. Elaboration of a matrix of responsibility and authority in the event of a maintenance emergency. | MM | 1 x a year | Matrix of responsibilities for handling a maintenance emergency |
| 3. Elaboration of the categorization of critical lines of machines and equipment in lines (A, B, C). | MT/MM | 1 x a year | List of machines by priority |
| 4. Declaring the maintenance system for individual categories of machines. | MC/MM | 1 x a year | Maintenance concept for machines and equipment |
| 5. For critical machines of category A, development of a flow chart of duties and responsibilities for emergency removal. | MC/MM | 1 x a year | Continuous process diagram of the realization of the created emergency state |
| 6. On category A machinery and equipment, development of a list of critical structural units. | MT/MM | 1 x a year | List of critical structural units |
| 7. Develop a list of risky spare parts for category A machines and critical structural units. | MT/MM | 1 x a year | List of critical spare parts |
Disclaimer/Publisher’s Note: The statements, opinions and data contained in all publications are solely those of the individual author(s) and contributor(s) and not of MDPI and/or the editor(s). MDPI and/or the editor(s) disclaim responsibility for any injury to people or property resulting from any ideas, methods, instructions or products referred to in the content. |
© 2024 by the authors. Licensee MDPI, Basel, Switzerland. This article is an open access article distributed under the terms and conditions of the Creative Commons Attribution (CC BY) license (http://creativecommons.org/licenses/by/4.0/).
Copyright: This open access article is published under a Creative Commons CC BY 4.0 license, which permit the free download, distribution, and reuse, provided that the author and preprint are cited in any reuse.


