
Submitted:
15 July 2024
Posted:
15 July 2024
You are already at the latest version
Abstract
Mercury (Hg) is a toxic element impacting on biological systems and ecosystems. Because the toxicity of Hg species is highly dependent on concentration levels and chemical forms, sensitive identification of chemical forms for Hg, i.e., Hg speciation, is of major significance in providing meaningful information about the source of Hg exposure. In this study, a microfluidic-based device made of high clarity poly(methyl methacrylate) (PMMA) was fabricated. Then titanium dioxide nanoparticles (nano-TiO2) were attached to the treated channel interior with the aid of poly(diallyldimethylammonium chloride) (PDADMAC). After coupling the nano-TiO2-coated microfluidic-based photocatalyst-assisted reduction device (the nano-TiO2-coated microfluid-ic-based PCARD) with high-performance liquid chromatography (HPLC) and inductively coupled plasma-mass spectrometry (ICP-MS), a selective and sensitive hyphenated system for Hg specia-tion was established. Validation procedures demonstrated that the method could be satisfactorily applied to the determination of mercuric ion (Hg2+) and methylmercury ion (CH3Hg+) in both human urine and water samples. Remarkably, the zeta potential measured clearly indicated the PDADMAC-capped nano-TiO2 with predominance of positive charges indeed provided steady force for firm attachment to the negatively charged device channel. The cause for the durability of the nano-TiO2-coated microfluidic-based PCARD was clarified thus.
Keywords:
mercury (Hg) speciation
; microfluidic-based device
; poly(methyl methacrylate) (PMMA)
; tita-nium dioxide nanoparticles (nano-TiO2)
; poly(diallyldimethylammonium chloride) (PDADMAC)
; inductively coupled plasma-mass spectrometry (ICP-MS)
1. Introduction
Mercury (Hg) is a naturally-occurring element found in rock in the earth’s crust and highly toxic to living organisms and the environment [1]. Due to enormous environmental and biological impacts caused by Hg exposure, monitoring of Hg levels in either biological systems or ecosystems has long been recognized as a critical issue all over the world. Over past few decades, competent authorities in several countries have developed a comprehensive body of legislation governing the maximum permissible levels of Hg [2,3,4]. However, Hg is often found in many forms including elemental mercury (Hg0), mercuric ion (Hg2+), methylmercury ion (CH3Hg+) and so on both in the environment and in living organisms, and that the toxicity of Hg species is highly dependent on concentration levels and chemical forms [5,6]. For example, the Hg in the inorganic form binding with a methyl group is known as a developmental neurotoxin, i.e., CH3Hg+, with efficient absorption by the gastrointestinal tract and easy transport across cellular membranes owning to its intensive lipophilicity [7]. In addition, the determination of Hg species is typically challenging due to limited content of each species in most instances [8]. Therefore, sensitive identification of chemical forms for Hg, i.e., Hg speciation, is of major significance in providing meaningful information about the source of Hg exposure.
Nowadays, inductively coupled plasma-mass spectrometry (ICP-MS) is widely recognized as one of the most powerful methods for element determination by virtue of its superior analytical features, such as low detection limit, wide linear dynamic range, ultra high sensitivity and so on [9,10]. Even so, same elements but different chemical forms can not be simultaneously identified relied on ICP-MS instrumentation due to completed dissociation of sample analytes achieving during ICP atomization. Although combinations of separation techniques such as high-performance liquid chromatography (HPLC) with ICP-MS detection are frequently utilized for Hg speciation [11,12,13,14], there is a growing awareness for the impropriety involving direct introduction of the salt- or organic-matter-rich effluent from HPLC into ICP-MS instrumentation [15,16,17].
Till date, several vapor generation (VG) techniques have been proposed to interface with HPLC and ICP-MS for efficient sample introduction, which attributed to the advantages of alleviation of matrix effects and enhancement of analyte transportation [18,19]. Among the VG techniques available, photoinduced VG techniques has emerged as one of the most popular techniques compared to those using chemical reducing agent (e.g., sodium tetrahydroborate (NaBH4) or tin chloride (SnCl2)) [20]. In 2003, Sturgeon’s group initiated the related research of the development of the photoinduced VG for elemental analysis [21]. Analytes of interest can be transformed into gaseous species with aid of free radicals generated by dissociation of low molecular weight (Mw) organic acids (e.g., formic acid (HCOOH), acetic acid (CH3COOH) and so on) under “pure” ultraviolet (UV) irradiation. Then the volatile products are separated from liquid sample matrix for subsequent measurement. The determination of Hg based on such analytical strategy was then successfully achieved by Hou’s group [22,23,24,25]. In 2004, Wang et al. further proposed a new methodology combining photocatalysts titanium dioxide nanoparticles (nano-TiO2) with the “pure” photoinduced VG, i.e., the nano-TiO2-enhanced photoinduced VG technique, for analytical sensitivity improvement [26]. Afterward, different photocatalysts such as bare/silver-modified nano-TiO2 and zirconium dioxide nanoparticles (nano-ZrO2) were applied to similar work for the same purpose [27,28]. Anyhow, due to illumination being the key to the initiation of the photocatalytic reaction, quartz with excellent optical properties is often used in the fabrication of photoreactors. In other words, the expensive nature of quartz reactors continues to limit the widespread use of the two photoinduced VG techniques.
In the following years, Sun’s group make a lot of effort to explore the possibilities of using various materials (e.g., poly(tetrafluoroethylene) (PTFE) [29,30,31,32] and Pyrex glass [33]) in reactor fabrication for the development of the nano-TiO2-enhanced photoinduced VG technique. However, the analytical sensitivity is compromised attributed to the mismatch in terms of wavelength between the transmittance of reactors and the photocatalytic activation reaction by nano-TiO2 even the fabrication cost of the photoreactors is dramatically reduced. Additionally, either tangle-prone reactors or fragile tubes are troublesome issues during operation procedures.
The deadlock of the photoinduced VG technique has been rescued until the advent of suitable microfluidic systems. In 2013, Shih et al. first developed a poly(methyl methacrylate) (PMMA) reactor, i.e., microfluidic-based photocatalyst-assisted reduction device (microfluidic-based PCARD), based on its outstanding clarity [34]. Meanwhile, additional accessories were eliminated because operational functionalities like mixing tees were integrated into a microfluidic system. After coupling HPLC separation with ICP-MS detection, a selective and sensitive speciation technique for the two inorganic selenium (Se) species was constructed. In views of excessive consumption of photocatalysts resulting from consecutive loading during analytical procedures, a microfluidic-based PCARD coated with nano-TiO2 catalysts was developed thus [35]. To simplify the coating procedure and improve the stability of the coating materials, a charge-rich polyelectrolyte, namely poly(diallyldimethylammonium chloride) (PDADMAC), was employed to cap nano-TiO2 catalyst for firm attachment to the treated channel interior. In other words, the PDADMAC-capped nano-TiO2 catalyst can be tightly embedded on the selected substrate via strong electrostatic attraction for the development of efficient VG. Although the applicability of the nano-TiO2-coated microfluidic-based PCARD has been demonstrated [35], the working theory of the coating method was not clearly clarified till date. Therefore, this work aimed to verify the property of the PDADMAC-capped nano-TiO2 catalyst and further apply the established system to Hg speciation for human urine and environmental water samples.
2. Materials and Methods
2.1. Chemicals and Materials
All chemicals were analytical reagent grade and used as received unless otherwise stated. High-purity water was obtained from a Milli-Q apparatus (Millipore, Bedford, MA, USA). Hydrochloric acid (HCl, 36.5–38.0%), methanol (CH3OH, ≧99.9%), nitric acid (HNO3, 69.0–70.0%), sodium dodecyl sulfate (SDS), and sodium hydroxide (NaOH) were obtained from J. T. Baker (Phillipsburg, NJ, USA). Acetic acid (≧99.7%), ammonium acetate (≧97%), ammonium hydroxide (NH4OH, 30–33%), L-cysteine (≧98.5%), formic acid (HCOOH, ≧98%), 2-mercaptoethanol (≧99.0%), methylmercury(II) chloride (PESTANAL™, analytical standard, ≧98.0%), poly(diallyldimethylammonium chloride) (PDADMAC, MWav: 100000–200000, 20wt% in H2O, d=1.040), and sulfuric acid (H2SO4, 95.0–97.0%) were purchased from Sigma–Aldrich (St. Louis, MO, USA). Titanium dioxide nanoparticles (nano-TiO2, Aeroxide® TiO2 P25, average primary particle size: ~21 nm, specific surface area: 50 ± 15m2 g–1) was purchased from Evonik Industries AG (Essen, Germany). Stock Hg solution (1000 ± 6 μg mL–1, Hg metal in 2% HNO3) was purchased from High-Purity Standards (North Charleston, SC, USA). A certified reference material (CRM, Seronorm™ Trace Elements Urine L-2, freeze-dried human urine) was obtained from SERO (Billingstad, Norway).
2.2. Construction of the HPLC/Nano-TiO2-Coated Microfluidic-Based PCARD/ICP-MS System
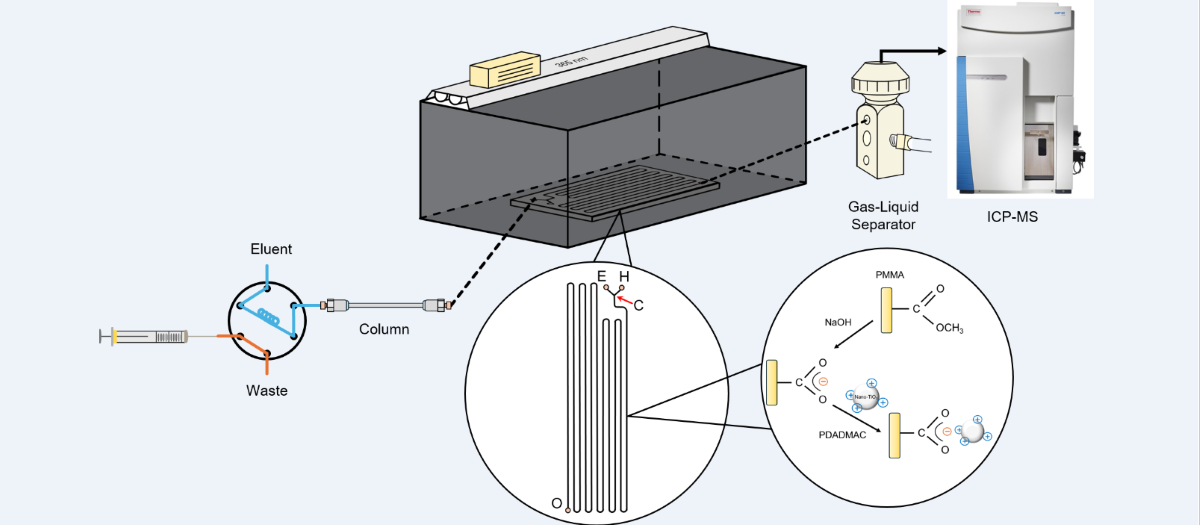
A diagram of the HPLC/nano-TiO2-coated microfluidic-based PCARD/ICP-MS system is depicted in Figure 1. The system can be divided into three main parts: the separation unit, the detection unit, and the VG unit interfaced with the two units described above.
The chromatographic separation unit consisted of an HPLC pump (S 1125-G, Sykam GmbH, Eresing, Germany), a six-port electric actuator valve (C22Z-3186E, VICI Valco Instruments Co. Inc., Houston, TX, USA) equipped with a 50-μL poly(aryletherketone) (PEEK) sample loop, and a guard column (XBridge® BEH C18, 3.5 µm, 5 × 2.1 mm, Waters Corp., Milford, MA, USA) attached to an analytical column (XBridge® C18, 3.5 µm, 150 × 3.0 mm i.d., Waters Corp., Milford, MA, USA). The detection was achieved by ICP-MS instrumentation (iCAP RQ, Thermo Fisher Scientific GmbH, Bremen, Germany).
The VG unit consisted of an in-house-fabricated nano-TiO2-coated microfluidic-based PCARD, an ultraviolet (UV) irradiation source (UV-A lamp, 40 W, maximum emission at 365 nm, Great Lighting Corp., Taipei, Taiwan) mounted in an opaque box, a mixing tee (Upchurch Scientific, Oak Harbor, WA, USA), and a gas–liquid separator (GLS) (B0507959, PerkinElmer Inc., Hopkinton, MA, USA). Briefly, the network of the microfluidic-based PCARD was designed using basic geometric modeling software and then patterned on PMMA substrates (Kun Quan Engineering Plastics Co. Ltd., Hsinchu, Taiwan) using a commercial carbon dioxide laser micromachining system (EBF-090060-60R, Laser Life Co. Ltd., Taipei, Taiwan). The channel interior of the developed device was modified with TiO2 photocatalysts via two-step dynamic coating procedures (saturated NaOH for 12 h and the reagent containing 500 mg L−1 nano-TiO2 and 0.5% (w/v) PDADMAC for 8 h); after which the channel was flushed with high-purity water and dried under a gentle stream of air. Detailed fabrication procedures of the nano-TiO2-coated microfluidic-based PCARD were described elsewhere [35].
On the other hand, PEEK tubes (Upchurch Scientific Inc., Oak Harbor, WA, USA) were used to connect all the components of the units. Peristaltic pumps (Minipuls 3, Gilson Inc., Middleton, WI, USA) with peristaltic tubing (Gilson Inc., Middleton, WI, USA) were employed to deliver sample solutions and reagents. The outlet of the peristaltic tubing was modified for attachment to the PEEK tube via a conical adapter (Upchurch Scientific Inc., Oak Harbor, WA, USA).
2.3. Analytical Protocol
First, the sample was delivered into the chromatographic system for species separation. Afterward, the Hg species in the effluent were loaded into the nano-TiO2-coated microfluidic-based PCARD, followed by vaporizing in the presence of HCOOH under UV irradiation. Then the volatile Hg products were separated from sample matrix via the GLS and carried into the ICP-MS system by a stream of Ar for subsequent measurement. (Caution! An appropriate exhaust system is recommended because of the generation of ozone and volatile Hg products during UV irradiation.) Adjustment of the sampling position and ion lenses for the optimal signal for Hg at m/z 202 was performed using an Hg standard solution. Detailed operation conditions for achieving optimal sensitivity and low background noise are provided in Table 1.
2.4. Characterization of the PDADMAC-Capped Nano-TiO2 Catalyst
The PDADMAC-capped nano-TiO2 catalyst was investigated using a particle analyzer (NanoBrook 90Plus PALS, Brookhaven Instrument Co., Holtsville, NY, USA) based on phase analysis light scattering (PALS). Test samples containing aliquot of nano-TiO2 and PDADMAC were dissolved in high-purity water and then adjusted to the desired pH using HNO3 and NaOH solutions. Data obtained during measurement were processed using built-in software (BIC Particle Solutions v. 3.6.0.7079 version 7.12.).
2.5. Sample Preparation
The urine samples were collected from volunteers in our research group. The water samples were collected from the water dispenser at the Department of Biomedical Engineering and Environmental Sciences, National Tsing Hua University (Hsinchu City, Taiwan) and effluents near industrial outfalls (New Taipei City, Taiwan). All samples were stored in glass bottles/vials (Yeong-Shin Co. Ltd., Hsinchu City, Taiwan) along with an aliquot of concentrated HCl, followed by wrapping with aluminum foil and storing at 4°C in the dark [31]. The collected samples were filtered through a PTFE membrane (Acrodisc, 0.45 μm, 25 mm O.D., Pall Corp., Port Washington, NY, USA) before use. (Note: The bottles/vials were immersed in 40% HNO3 and then flushed with high-purity water. The bottles/vials were rinsed thoroughly with the designated samples prior to sample collection.)
3. Results and Discussion
3.1. Verification of the PDADMAC-Capped Nano-TiO2 Catalyst
Actually, numerous clusters of PDADMAC-capped nano-TiO2 catalysts forming a continuous bed inside the channel have been validated by scanning electron microscope (SEM), energy dispersive X-ray analysis (EDAX), and a laser ablation (LA) system coupled with ICP-MS measurements [35]. Even so, the working theory of such method was still not clearly clarified. Thus the causes that provided unique characteristics with the PDADMAC-capped nano-TiO2 catalyst should be identified. Figure 2 presents the variation in the zeta potential of samples with respect to the pH of the solution. As indicated in Figure 2, no significant change in the potential of samples was observed in the region ranging from 3.0 to 10.0, revealing that the strong cationic polyelectrolyte PDADMAC stabilized the nano-TiO2 catalyst against surrounding pH changes via cluster formation. In other words, the PDADMAC-capped nano-TiO2 with predominance of positive charges indeed provided steady force for firm attachment to the negatively charged device channel treated, leading to high tolerance of flush with strongly acidic and/or basic reagents.

Table 2.
Comparison of the TiO2 coating method for PMMA substrates proposed in this study with those reported in other literature.
Table 2.
Comparison of the TiO2 coating method for PMMA substrates proposed in this study with those reported in other literature.
| Coating mechanism | Chemicals | Substrate form | Incubation temperature | Step | Additional equipment | Citation |
|---|---|---|---|---|---|---|
| electrostatic attraction | NaOH, TiO2a, PDADMAC, high-purity water | channel | R.T.b | 2 | peristatic pump | this study |
| covalent bonding | hexamethylene diamine, borate buffer, glutaraldehyde, phosphate buffer, dopamine hydrochloride, dimethyl formamide, TSUc, DIPAd, TiO2a, glycidyl isopropyl ether, NaCl, tris-EDTA buffer, DNA | sheet | R.T.–94℃ | 9 | [36] | |
| sol-gel entrapment | TiCl4a, tert-butanol | powder | R.T.–75℃ | 4 | rotary evaporator, oven | [37] |
| sol-gel entrapment | AIBNe, TiO2a | monomer | 40–50℃ | 3 | oven, centrifuge | [38] |
| sol-gel entrapment | ethanol, CH2Cl2, Ti(C4H9)4a, glacial acetic acid | powder | R.T.–135℃ | 6 | Teflon-lined stainless-steel, oven, electrospinning system | [39] |
| sol-gel entrapment | TiO2a, methacrylic acid, isopropanol | powder | 80–85℃ | 5 | stereolithography (SLA) 3D printer | [40,41] |
| sol-gel entrapment | TiO2a, acetone, ethyl lactate, ethanol, diazonaphtoquinone | powder | 80℃ | 2 | spin coater/screen-printer, oven | [42] |
| sol-gel entrapment | TiO2a, triethyl phosphate | powder | R.T. | 3 | manual casting knife | [43] |
| sol-gel entrapment | N-TiO2f, iso- butanol | sheet | 80℃ | 3 | dip coater, ultrasonicator | [44] |
| adhesive | Ti[OCH(CH3)2]4a, colloidal SiO2, HClO4, absolute ethanol, tetraethyl orthosilicate, HCl, isopropanol, propanol, 2-propoxyethanol | sheet | R.T. | 4 | heat-gun, dip coater | [45] |
| adhesive | TiO2a, Ti4O7a, acetone, silicon-based commercial glue | sheet | 30℃ | 3 | oven | [46] |
| deposition | Ti[OCH(CH3)2]4a | sheet | 25–50℃ | 1 | atmospheric-pressure plasma jet generator | [47] |
a Commercially available products. b Room temperature. c O-(N-Succinimidyl)-N, N, N, N-tetramethylammonium tetrafluoroborate. d N, N-diisopropyl amine. e Azobisisobutyronitrile. f In-lab-prepared products.
In contrast to the TiO2 coating methods for PMMA substrates reported in the literature [36,37,38,39,40,41,42,43,44,45,46], either the preparation steps or additional equipment were dramatically simplified. Table 2 provides comparison of the TiO2 coating methods for PMMA substrates proposed in this study with those reported in other literature. On the other hand, the chemicals during preparation procedures employed in this study was also much less than those reported in other literature, and thus could be considered to fulfill the goals of green nanotechnology. Remarkably, because the preparation conditions for the TiO2 coating was quite gentle, i.e., all processes are carried out in the aqueous phase and at room temperature, the morphology of PMMA substrates was preserved. In other words, the method employed in this study indeed provided a promising strategy for the development of the nano-TiO2-enhanced photoinduced VG in microfluidic devices due to the elimination of channel deformation.
3.2. Optimization of Operating Conditions for Chromatographic Separation
3.2.1. Influence of L-Cysteine and 2-Mercaptoethanol Concentration on the Separation Efficiency of Hg Species
Because the nano-TiO2-coated microfluidic-based PCARD was used for vaporizing Hg species after the chromatographic separation, the operation conditions for chromatographic separation were an important issue for Hg speciation. Typically, the chromatographic separation of Hg species is achieved by reversed-phase methods and ion-exchange methods. Among the methods mentioned above, reversed-phase chromatography with stable analytical performance is especially popular [48]. In general, thiol-containing compounds (e.g., L-cysteine [49,50], 2-mercaptoethanol [51,52] or both [53]) are added into the mobile phase for complexing with Hg species (shown below).
R-SH + CH3Hg+ → R-S-Hg-CH3
R-SH + Hg2+ → R-S-Hg-S-R
Then separation of each thiol-complexed Hg species can be achieved according to mobility difference caused by varying degrees of interactions between thiol-complexed Hg species and the stationary phase.
Considering the use of a single thiol-containing compound as a complexing reagent is often associated with a prolonged retention time (tR) [54], two thiol-containing compounds, i.e., L-cysteine and 2-mercaptoethanol were simultaneously used for the separation of CH3Hg+ and Hg2+. Figure 3a, b displays the variation in tR of the two Hg species as functions of L-cysteine and 2-mercaptoethanol concentration. As shown in Figure 3a, b, maximum difference of tR between CH3Hg+ and Hg2+ could be observed when 100 µM L-cysteine and 1500 µM 2-mercaptoethanol applied. Therefore, the abovementioned concentration for L-cysteine and 2-mercaptoethanol was selected for subsequent experiments.
3.2.2. Influence of CH3OH Concentration on the Separation Efficiency of Hg Species
Apart from the use of complexing reagents, addition of CH3OH is thought as another strategy for improving separation efficiency [55]. Figure 4a displays the chromatograms of CH3Hg+ and Hg2+ standards under the conditions with the modifier CH3OH or not. Compared to the chromatographic conditions without addition of CH3OH, ether the baseline stability or the signals profile was dramatically improved when CH3OH was applied. Furthermore, to ensure that CH3OH added was favorable for both the analytical throughput and the separation efficiency, the influence of CH3OH concentration on the retention behavior of the two Hg species was investigated. As shown in Figure 4b, a decreasing trend in either tR of the two Hg species or the difference of tR between CH3Hg+ and Hg2+ appeared when the CH3OH concentration was increased from 1 to 5%. Because undesired deposition resulting from excess organic modifier in sample matrix may cause permanent damage to ICP-MS instrumentation [56], a tradeoff between the analytical throughput and the separation efficiency was adopted by using a CH3OH concentration of 2% for the subsequent experiments.
3.3. Optimization of Operating Conditions for Photocatalyst-Assisted VG
3.3.1. Influence of HCOOH Concentration on the Vaporization Efficiency of Hg Species
Typically, photocatalytic reactions are triggered by electrons and holes when photocatalysts are treated with UV irradiation. The holes are generally considered to initiate the oxidation reactions whereas the electrons are responsible for the photoreduction pathways. Because the photogenerated electrons and the holes may rapidly recombine leading to inferior photocatalytic efficiency, the use of additives that can retard the recombination of electrons and holes are usually conducted. As reported by Tan et al. [57], low molecular weight organic substances such as HCOOH have been demonstrated to be useful for improvement of the photocatalytic reduction efficiency of analytes due to their relatively high hole-scavenging efficiency. To determine the optimal concentration of HCOOH for the reduction of the Hg species, the influence of HCOOH concentration on the signal intensity of the analytes was evaluated. As shown in Figure 5a, a significant enhancement in the signals of the two Hg species was obtained when HCOOH was added, reaching a plateau at the HCOOH concentration of 400 mM. Therefore, an optimal HCOOH concentration of 400 mM, which provided maximum signals for CH3Hg+ and Hg2+, was selected for subsequent experiments.
3.3.2. Influence of the pH on the Vaporization Efficiency of Hg Species
It has been recognized that adsorption among analytes of interest, hole scavengers (i.e., HCOOH), and nano-TiO2 catalysts via electrostatic interactions is the key for success in the photocatalyst-assisted reduction reaction. Because the charge statuses of all species were strongly determined by the acidity of the reaction environment, the pH of the mixture resulted from the column effluent and the hole-scavenger was investigated. As indicated in Figure 5b, an increasing trend in the intensity of the two Hg Species appeared when the pH was increased from 2.0 to 4.0. In contrast, a deterioration of the signal intensity for both Hg species was observed as the pH exceeded 5.0. The phenomenon could be explained in terms of the degree of deprotonation of HCOOH, leading to competitive adsorption between the analyte species and HCOOH on nano-TiO2 photocatalysts. Therefore, the optimal value of pH 4.0, which provided the highest intensity signals for CH3Hg+ and Hg2+, was selected for subsequent experiments.
3.4. Analytical Performance
After optimizing the operation conditions, the analytical performance of the proposed system was evaluated. Table 3 presents the analytical features of merit of the developed system operated under optimum conditions. Satisfactory linearities in the region from 0.01 to 1.0 μg L−1 for the two Hg species were observed, with correlation coefficients higher than 0.9998. Figure 6 displays the corresponding chromatograms under the optimized conditions. The method detection limits (MDLs) for CH3Hg+ and Hg2+ were 2.95 and 1.39 ng L−1, respectively. (Note: The MDLs were determined based on the 3σ criterion, where the standard deviation was obtained from the results of seven repeated measurements of a mixture of column effluent.) Moreover, 15 replicate injections of 0.2 μg L−1 samples of each species were conducted to estimate both the stability of the system during the analytical procedures and the drift for the Hg response caused by the memory effect. The obtained repeatability for successive measurements presents a coefficient of variation (CV) of less than 3%, demonstrating the precision of this method for durable analyses. The accuracy of the proposed method was then validated by analyzing a sample of the CRM Seronorm™ Trace Elements Urine L-2 (freeze-dried human urine). Because the detailed concentration information of Hg species in the CRM was absent, comparison between the certified value of Hg concentration and the summation of the measured values of individual species was adopted. Based on the analytical results, the summation of each measured value agreed reasonably well with the certified Hg concentration (see Table 3). Moreover, the CRM was determined with intentional 1000-fold dilution to verify the detection capability of the developed system for quantitatively determining ultratrace levels of Hg species.
To further demonstrate the utility of the proposed system, urine samples obtained from three healthy volunteers and water samples collected from the water dispenser and effluents near industrial outfalls were analyzed following the optimized procedures. As indicated in Table 4, the concentration of Hg2+ was ranged from 0.036 to 0.112 μg L–1 in the collected samples, and that the CH3Hg+ content being much lower than the Hg2+ content in either urine samples or water samples. It is hypothesized that such diverse distributions of CH3Hg+ and Hg2+ are closely related to the unique metabolic mechanisms of the two species [1,7]. Even so, acceptable spike recovery of Hg species revealed that the method employed in this study would be useful in practice.
4. Conclusions
In this study, a selective and sensitive hyphenated system including the nano-TiO2-coated microfluidic-based PCARD, HPLC and ICP-MS for Hg speciation was established. To fabricate the nano-TiO2-coated microfluidic-based PCARD, an alternative involving a charge-rich polyelectrolyte PDADMAC was employed to stabilize the nano-TiO2 catalyst via cluster formation and provide steady force for firm attachment to the channel interior via electrostatic interactions. The MDLs for CH3Hg+ and Hg2+ achieved by the established system were 2.95 and 1.39 ng L−1, demonstrating that the capability of such system for quantitatively determining ultratrace levels of Hg species. A series of validation experiments in terms of precision, accuracy, and so on indicated that the method could be also satisfactorily applied to the determination of the two Hg species in both human urine and water samples. Remarkably, the durability of the nano-TiO2-coated microfluidic-based PCARD caused by unique properties of the PDADMAC-capped nano-TiO2 catalyst was also verified.
Author Contributions
Investigation, methodology, project administration, writing - original draft preparation, J.-H. C.; investigation, visualization, writing - original draft preparation, Y.-T. L.; methodology, writing - original draft preparation, Y.-A. S.; investigation, visualization, Y.-R. K.; resources, writing - review and editing, M.-J. D.; resources, validation, writing - review and editing, W.-Y. C.; investigation, visualization, C.-Y. W.; investigation, visualization, J.-L. T.; methodology, validation, writing - original draft preparation, C.-H. L.; conceptualization, funding acquisition, methodology, project administration, resources, supervision, writing - review and editing, T.-T. S.. All authors have read and agreed to the published version of the manuscript.
Funding
This research was funded by the National Science and Technology Council of the Republic of China (Taiwan) (NSTC 108-2113-M-030 -010 -MY2) and the APC was funded by Office of Research and Development of Fu Jen Catholic University.
Data Availability Statement
The data presented in this study are available on request from the corresponding author.
Acknowledgments
The authors would like to convey their immense gratitude to the late Professor Yuh-Chang Sun for his expert advice. The authors also grateful for the technique support of instrumentation maintenance provided by Thermo Fisher Scientific (Taiwan).
Conflicts of Interest
The authors declare no conflicts of interest.
References
- Beckers, F.; Rinklebe, J. Cycling of mercury in the environment: Sources, fate, and human health implications: A review. Crit Rev Environ Sci Technol 2017, 47, 693–794. [Google Scholar] [CrossRef]
- Regulation (EU) 2017/852 of the European Parliament and of the Council of 17 May 2017 on mercury, and repealing Regulation (EC) No 1102/2008 (Text with EEA relevance). Available online: https://eur-lex.europa.eu/legal-content/EN/ALL/?uri=CELEX:32017R0852 (accessed on 16 Oct 2023).
- The regulations and laws of mercury management in Taiwan. Available online: https://topic.moenv.gov.tw/hg/lp-93-3.html (accessed on 18 June 2024).
- The regulations and laws that apply to mercury in United States. Available online: https://www.epa.gov/mercury/environmental-laws-apply-mercury (accessed on 18 June 2024).
- Mercury Study Report to Congress, Volume V: Health Effects of Mercury and Mercury Compounds, United States Environmental Protection Agency: New York, US, 1997.
- Risher, J.F. Elemental mercury and inorganic mercury compounds: human health aspects, World Health Organization: Geneva, Switzerland, 2003.
- Zafar, A.; Javed, S. Akram, N.; Naqvi, S.A.R. Health Risks of Mercury in Mercury Toxicity Mitigation: Sustainable Nexus Approach, Kumar, N., Eds.; Springer Cham: Cham, Switzerland, 2024, pp. 67–92.
- Saleh, T.A.; Fadillah, G.; Ciptawati, E.; Khaled, M. Analytical methods for mercury speciation detection, and measurement in water, oil, and gas. Trends Analyt Chem 2020, 132, 116016. [Google Scholar] [CrossRef]
- Nelms, S.M. Inductively Coupled Plasma Mass Spectrometry Handbook, Wiley-Blackwell: Oxford, United Kingdom, 2005.
- Thomas, R. Overview of the ICP-MS Application Landscape. In Practical Guide to ICP-MS and Other Atomic Spectroscopy Techniques, 4th ed.; CRC Press: Florida, United States, 2023. [Google Scholar]
- Zou, H.; Zhou, C.; Yang, X.; Wen, J.; Li, C.; Song, S.; Sun, C. Speciation analysis of mercury in wild edible mushrooms by high-performance liquid chromatography hyphenated to inductively coupled plasma mass spectrometry. Anal. Bioanal. Chem. 2020, 412, 2829–2840. [Google Scholar] [CrossRef] [PubMed]
- Narukawa, T.; Iwai, T.; Chiba, K. Simultaneous speciation analysis of inorganic arsenic and methylmercury in edible oil by high-performance liquid chromatography-inductively coupled plasma mass spectrometry. Talanta 2020, 210, 120646. [Google Scholar] [CrossRef] [PubMed]
- Zhang, D.; Yang, S.; Ma, Q.; Sun, J.; Cheng, H.; Wang, Y.; Liu, J. Simultaneous multi-elemental speciation of As, Hg and Pb by inductively coupled plasma mass spectrometry interfaced with high-performance liquid chromatography. Food Chem. 2020, 313, 126119. [Google Scholar] [CrossRef] [PubMed]
- Favilli, L.; Giacomino, A.; Malandrino, M.; Inaudi, P.; Diana, A. Strategies for mercury speciation with single and multi-element approaches by HPLC-ICP-MS. Front. Chem. 2022, 10, 1082956. [Google Scholar] [CrossRef] [PubMed]
- Caruso, J.A.; Montes-Bayon, M. Elemental speciation studies-new directions for trace metal analysis. Ecotoxicol. Environ. Saf. 2003, 56, 148–163. [Google Scholar] [CrossRef] [PubMed]
- Wang, T. Liquid Chromatography-Inductively Coupled Plasma Mass Spectrometry (LC-ICP-MS). J.Liq. Chromatogr. Relat. Technol. 2007, 30, 807–831. [Google Scholar] [CrossRef]
- Thomas, R. Practical Guide to ICP-MS A Tutorial for Beginners, 3rd ed.; CRC Press: Boca Raton, United State, 2013. [Google Scholar]
- Gao, Y.; Liu, R. , Yang, L. Application of chemical vapor generation in ICP-MS: A review. Chin. Sci. Bull. 2013; 58, 1980–1991. [Google Scholar]
- Brindle, I.D. Vapor generation. In Sample Introduction Systems in ICPMS and ICPOES, Beauchemin, D., Eds.; Elsevier: Amsterdam, Netherlands, 2020; pp. 381–409. [Google Scholar]
- Yin, Y.; Liu, J.; Jiang, G. Photo-induced chemical-vapor generation for sample introduction in atomic spectrometry. Trends Analyt Chem 2011, 30, 1672–1684. [Google Scholar] [CrossRef]
- Guo, x.; Sturgeon, R.E.; Mester, Z.; Gardner, G.J. UV Vapor Generation for Determination of Selenium by Heated Quartz Tube Atomic Absorption Spectrometry. Anal. Chem. 2003, 75, 2092–2099. [Google Scholar] [CrossRef]
- Zheng, C.; Li, Y.; He, Y.; Ma, Q.; Hou, X. Photo-induced chemical vapor generation with formic acid for ultrasensitive atomic fluorescence spectrometric determination of mercury: potential application to mercury speciation in water. J. Anal. At. Spectrom. 2005, 20, 746–750. [Google Scholar] [CrossRef]
- Han, C.; Zheng, C.; Wang, J.; Cheng, G.; Lv, Y.; Hou, X. Photo-induced cold vapor generation with low molecular weight alcohol, aldehyde, or carboxylic acid for atomic fluorescence spectrometric determination of mercury. Anal. Bioanal. Chem. 2007, 388, 825–830. [Google Scholar] [CrossRef] [PubMed]
- Su, Y.; Xu, K.; Gao, Y.; Hou, X. Determination of trace mercury in geological samples by direct slurry sampling cold vapor generation atomic absorption spectrometry. Microchimica Acta 2008, 160, 191–195. [Google Scholar] [CrossRef]
- He, C.; Cheng, G.; Zheng, C.; Wu, L.; Lee, Y.I.; Hou, X. Photochemical vapor generation and in situ preconcentration for determination of mercury by graphite furnace atomic absorption spectrometry. Anal. Methods 2015, 7, 3015–3021. [Google Scholar] [CrossRef]
- Wang, Q.; Liang, J.; Qiu, J.; Huang, B. Online pre-reduction of selenium(VI) with a newly designed UV/TiO2 photocatalysis reduction device. J. Anal. At. Spectrom. 2004, 19, 715–716. [Google Scholar] [CrossRef]
- Yin, Y.; Liang, J.; Yang, L.; Wang, Q. Vapour generation at a UV/TiO2 photocatalysis reaction device for determination and speciation of mercury by AFS and HPLC-AFS. J. Anal. At. Spectrom. 2007, 22, 330–334. [Google Scholar] [CrossRef]
- Li, H.; Luo, Y.; Li, Z.; Yang, L.; Wang, Q. Nanosemiconductor-Based Photocatalytic Vapor Generation Systems for Subsequent Selenium Determination and Speciation with Atomic Fluorescence Spectrometry and Inductively Coupled Plasma Mass Spectrometry. Anal. Chem. 2012, 84, 2974–2981. [Google Scholar] [CrossRef] [PubMed]
- Sun, Y.C.; Chang, Y.C.; Su, C.K. On-Line HPLC-UV/Nano-TiO2-ICPMS System for the Determination of Inorganic Selenium Species. Anal. Chem. 2006, 78, 2640–2645. [Google Scholar] [CrossRef]
- Sun, Y.C.; Chen, Y.J.; Tsai, Y.N. Determination of urinary arsenic species using an on-line nano-TiO2 photooxidation device coupled with microbore LC and hydride generation-ICP-MS system. Microchem. J. 2007, 86, 140–145. [Google Scholar] [CrossRef]
- Chen, K.J.; Hsu, I.H.; Sun, Y.C. Determination of methylmercury and inorganic mercury by coupling short-column ion chromatographic separation, on-line photocatalyst-assisted vapor generation, and inductively coupled plasma mass spectrometry. J. Chromatogr. A 2009, 1216, 8933–8938. [Google Scholar] [CrossRef]
- Tsai, T.N.; Lin, C.H.; Hsu, I.H.; Sun, Y.C. Sequential photocatalyst-assisted digestion and vapor generation device coupled with anion exchange chromatography and inductively coupled plasma mass spectrometry for speciation analysis of selenium species in biological samples. Anal. Chim. Acta 2014, 806, 165–171. [Google Scholar] [CrossRef] [PubMed]
- Tsai, M.W.; Sun, Y.C. On-line coupling of an ultraviolet titanium dioxide film reactor with a liquid chromatography/hydride generation/inductively coupled plasma mass spectrometry system for continuous determination of dynamic variation of hydride- and nonhydride-forming arsenic species in very small microdialysate samples. Rapid Commun. Mass Spectrom. 2008, 22, 211–216. [Google Scholar] [PubMed]
- Shih, T.T.; Hsu, I.H.; Wu, J.F.; Lin, C.H.; Sun, Y.C. Development of chip-based photocatalyst-assisted reduction device to couple high performance liquid chromatography and inductively coupled plasma-mass spectrometry for determination of inorganic selenium species. J.Chromatogr. A 2013, 1304, 101–108. [Google Scholar] [CrossRef] [PubMed]
- Shih, T.T.; Lin, C.H.; Hsu, I.H.; Chen, J.Y.; Sun, Y.C. Development of a Titanium Dioxide-Coated Microfluidic-Based Photocatalyst-Assisted Reduction Device to Couple HighPerformance Liquid Chromatography with Inductively Coupled Plasma-Mass Spectrometry for Determination of Inorganic Selenium Species. Anal.Chem. 2013, 85, 10091–10098. [Google Scholar] [CrossRef] [PubMed]
- Vasudev, M.; Yamanaka, T.; Yang, J.; Ramadurai, D.; Stroscio, M. A.; Globus, T.; Khromova, T.; Dutta, M. Optoelectronic Signatures of Biomolecules Including Hybrid Nanostructure-DNA Ensembles. IEEE Sens. J. 2008, 8, 743–749. [Google Scholar] [CrossRef]
- Morselli, D.; Bondioli, F.; Fiorini, M. ; Messori. M. Poly(methyl methacrylate)–TiO2 nanocomposites obtained by non-hydrolytic sol–gel synthesis: the innovative tert-butyl alcohol route. J. Mater. Sci. 2012; 7003–7012. [Google Scholar]
- El-Bashir, S.M.; Al-Harbi, F.F.; Elburaih, H.; Al-Faifi, F.; Yahia, I.S. Red photoluminescent PMMA nanohybrid films for modifying the spectral distribution of solar radiation inside greenhouses. Rewnw. Energ. 2016, 85, 928–938. [Google Scholar] [CrossRef]
- Li, Y.; Zhao, H.; Yang, M. TiO2 nanoparticles supported on PMMA nanofibers for photocatalytic degradation of methyl orange. J. Colloid Interface Sci. 2017, 508, 500–507. [Google Scholar] [CrossRef] [PubMed]
- Totu, E.E.; Cristache, C.M.; Voicila, E.; Oprea, O.; Agir, I.; Tavukcuoglu, O.; Didilescu, A.C. On Physical and Chemical Characteristics of Poly(methylmethacrylate) Nanocomposites for Dental Applications. I. Mater. Plast. 2017, 54, 666–672. [Google Scholar] [CrossRef]
- Totu, E.E.; Cristache, C.M.; Isildak, S.; Tavukcuoglu, O.; Pantazi, A.; Enachescu, M.; Buga, R.; Burlibasa, M.; Totu, T. Structural Investigations on Poly(methyl methacrylate) Various Composites Used for Stereolithographyc Complete Dentures. Mater. Plast. 2018, 55, 616–619. [Google Scholar] [CrossRef]
- Song, J.H.; Yim, S.J.; Lim, S.J.; Yu, J.W. Polymer Masking Method for a High Speed Roll-to-Roll Process. Macromol Res 2018, 26, 838–843. [Google Scholar] [CrossRef]
- Errahmani, K.B.; Benhabiles, O.; Bellebia, S.; Bengharez, Z.; Goosen, M.; Mahmoudi, H. Photocatalytic Nanocomposite Polymer-TiO2 Membranes for Pollutant Removal from Wastewater. Catalysts 2021, 11, 402. [Google Scholar] [CrossRef]
- Yen, L.T.; Weng, C.H.; Tzeng, J.H.; Chen, Y.C.; Jacobson, A.R.; Lin, Y.T. Substantial improvement in photocatalysis performance of N-TiO2 immobilized on PMMA: Exemplified by inactivation of Staphylococcus aureus and Escherichia coli. Sep. Purif. Technol. 2024, 345, 127298. [Google Scholar] [CrossRef]
- Vodišek, N.; Šuligoj, A.; Korte, D.; Štangar, U.L. Transparent Photocatalytic Thin Films on Flexible Polymer Substrates. Materials 2018, 11, 1945. [Google Scholar] [CrossRef]
- Becerril-Estrada, V.; Robles, I.; Martínez-Sanchez, C.; Godínez, L.A. Study of TiO2/Ti4O7 photo-anodes inserted in an activated carbon packed bed cathode: Towards the development of 3D-type photo electro-Fenton reactors for water treatment. Electrochim. Acta 2020, 340, 135972. [Google Scholar] [CrossRef] [PubMed]
- Xu, J.; Nagasawa, H.; Kanezashi, M.; Tsuru, T. TiO2 Coatings Via Atmospheric-Pressure Plasma-Enhanced Chemical Vapor Deposition for Enhancing the UV-Resistant Properties of Transparent Plastics. ACS Omega 2021, 6, 1370–1377. [Google Scholar] [CrossRef] [PubMed]
- McNeff, C.; Zigan, L.; Johnson, K.; Carr, P.W.; Wang, A.; Weber-Main, A.M. Analytical Advantages of Highly Stable Stationary Phases for Reversed-Phase LC. LC GC N Am 2000, 18, 514–529. [Google Scholar]
- Jia, X.; Han, Y.; Wei, C.; Duan, T.; Chen, H. Speciation of mercury in liquid cosmetic samples by ionic liquid based dispersive liquid–liquid microextraction combined with high-performance liquid chromatography-inductively coupled plasma mass spectrometry. J. Anal. At. Spectrom. 2011, 26, 1380–1386. [Google Scholar] [CrossRef]
- Zhang, S.; Luo, H.; Zhang, Y.; Li, X.; Liu, J.; Xu, Q.; Wang, Z. In situ rapid magnetic solid-phase extraction coupled with HPLC-ICP-MS for mercury speciation in environmental water. Microchem. J. 2016, 126, 25–31. [Google Scholar] [CrossRef]
- Jia, X.; Han, Y.; Liu, X.; Duan, T.; Chen, H. Speciation of mercury in water samples by dispersive liquid–liquid microextraction combined with high performance liquid chromatography-inductively coupled plasma mass spectrometry. Spectrochim Acta Part B At Spectrosc 2011, 66, 88–92. [Google Scholar] [CrossRef]
- Souza, S.S.; Campiglia, A.D.; Barbosa Jr, F. A simple method for methylmercury, inorganic mercury and ethylmercury determination in plasma samples by high performance liquid chromatography–cold-vapor-inductively coupled plasma mass spectrometry. Anal. Chim. Acta 2013, 761, 11–17. [Google Scholar] [CrossRef]
- Batista, B.L.; Rodrigues, J.L.; Souza, S.S.; Souza, V.C.O.; Barbosa Jr, F. Mercury speciation in seafood samples by LC–ICP-MS with a rapid ultrasound-assisted extraction procedure: Application to the determination of mercury in Brazilian seafood samples. Food Chem. 2011, 126, 2000–2004. [Google Scholar] [CrossRef] [PubMed]
- Minnich, M.G.; McLean, J.A.; Montaser, A. Spatial aerosol characteristics of a direct injection high efficiency nebulizer via optical patternation. Spectrochim Acta Part B At Spectrosc 2001, 56, 1113–1126. [Google Scholar] [CrossRef]
- Jia, X.Y.; Gong, D.R.; Han, Y.; Wei, C.; Duan, T.C.; Chen, H.T. Fast speciation of mercury in seawater by short-column high-performance liquid chromatography hyphenated to inductively coupled plasma spectrometry after on-line cation exchange column preconcentration. Talanta 2012, 88, 724–729. [Google Scholar] [CrossRef] [PubMed]
- Chen, J.; Chen, H.; Jin, X.; Chen, H. Determination of ultra-trace amount methyl-, phenyl- and inorganic mercury in environmental and biological samples by liquid chromatography with inductively coupled plasma mass spectrometry after cloud point extraction preconcentration. Talanta 2009, 77, 1381–1387. [Google Scholar] [CrossRef]
- Tan, T.; Beydoun, D.; Amal, R. Effects of organic hole scavengers on the photocatalytic reduction of selenium anions. J. Photochem. Photobiol. A 2003, 159, 273–280. [Google Scholar] [CrossRef]
Figure 1.
Schematic illustration of the HPLC/nano-TiO2-coated microfluidic-based PCARD/ICP-MS system.
Figure 1.
Schematic illustration of the HPLC/nano-TiO2-coated microfluidic-based PCARD/ICP-MS system.
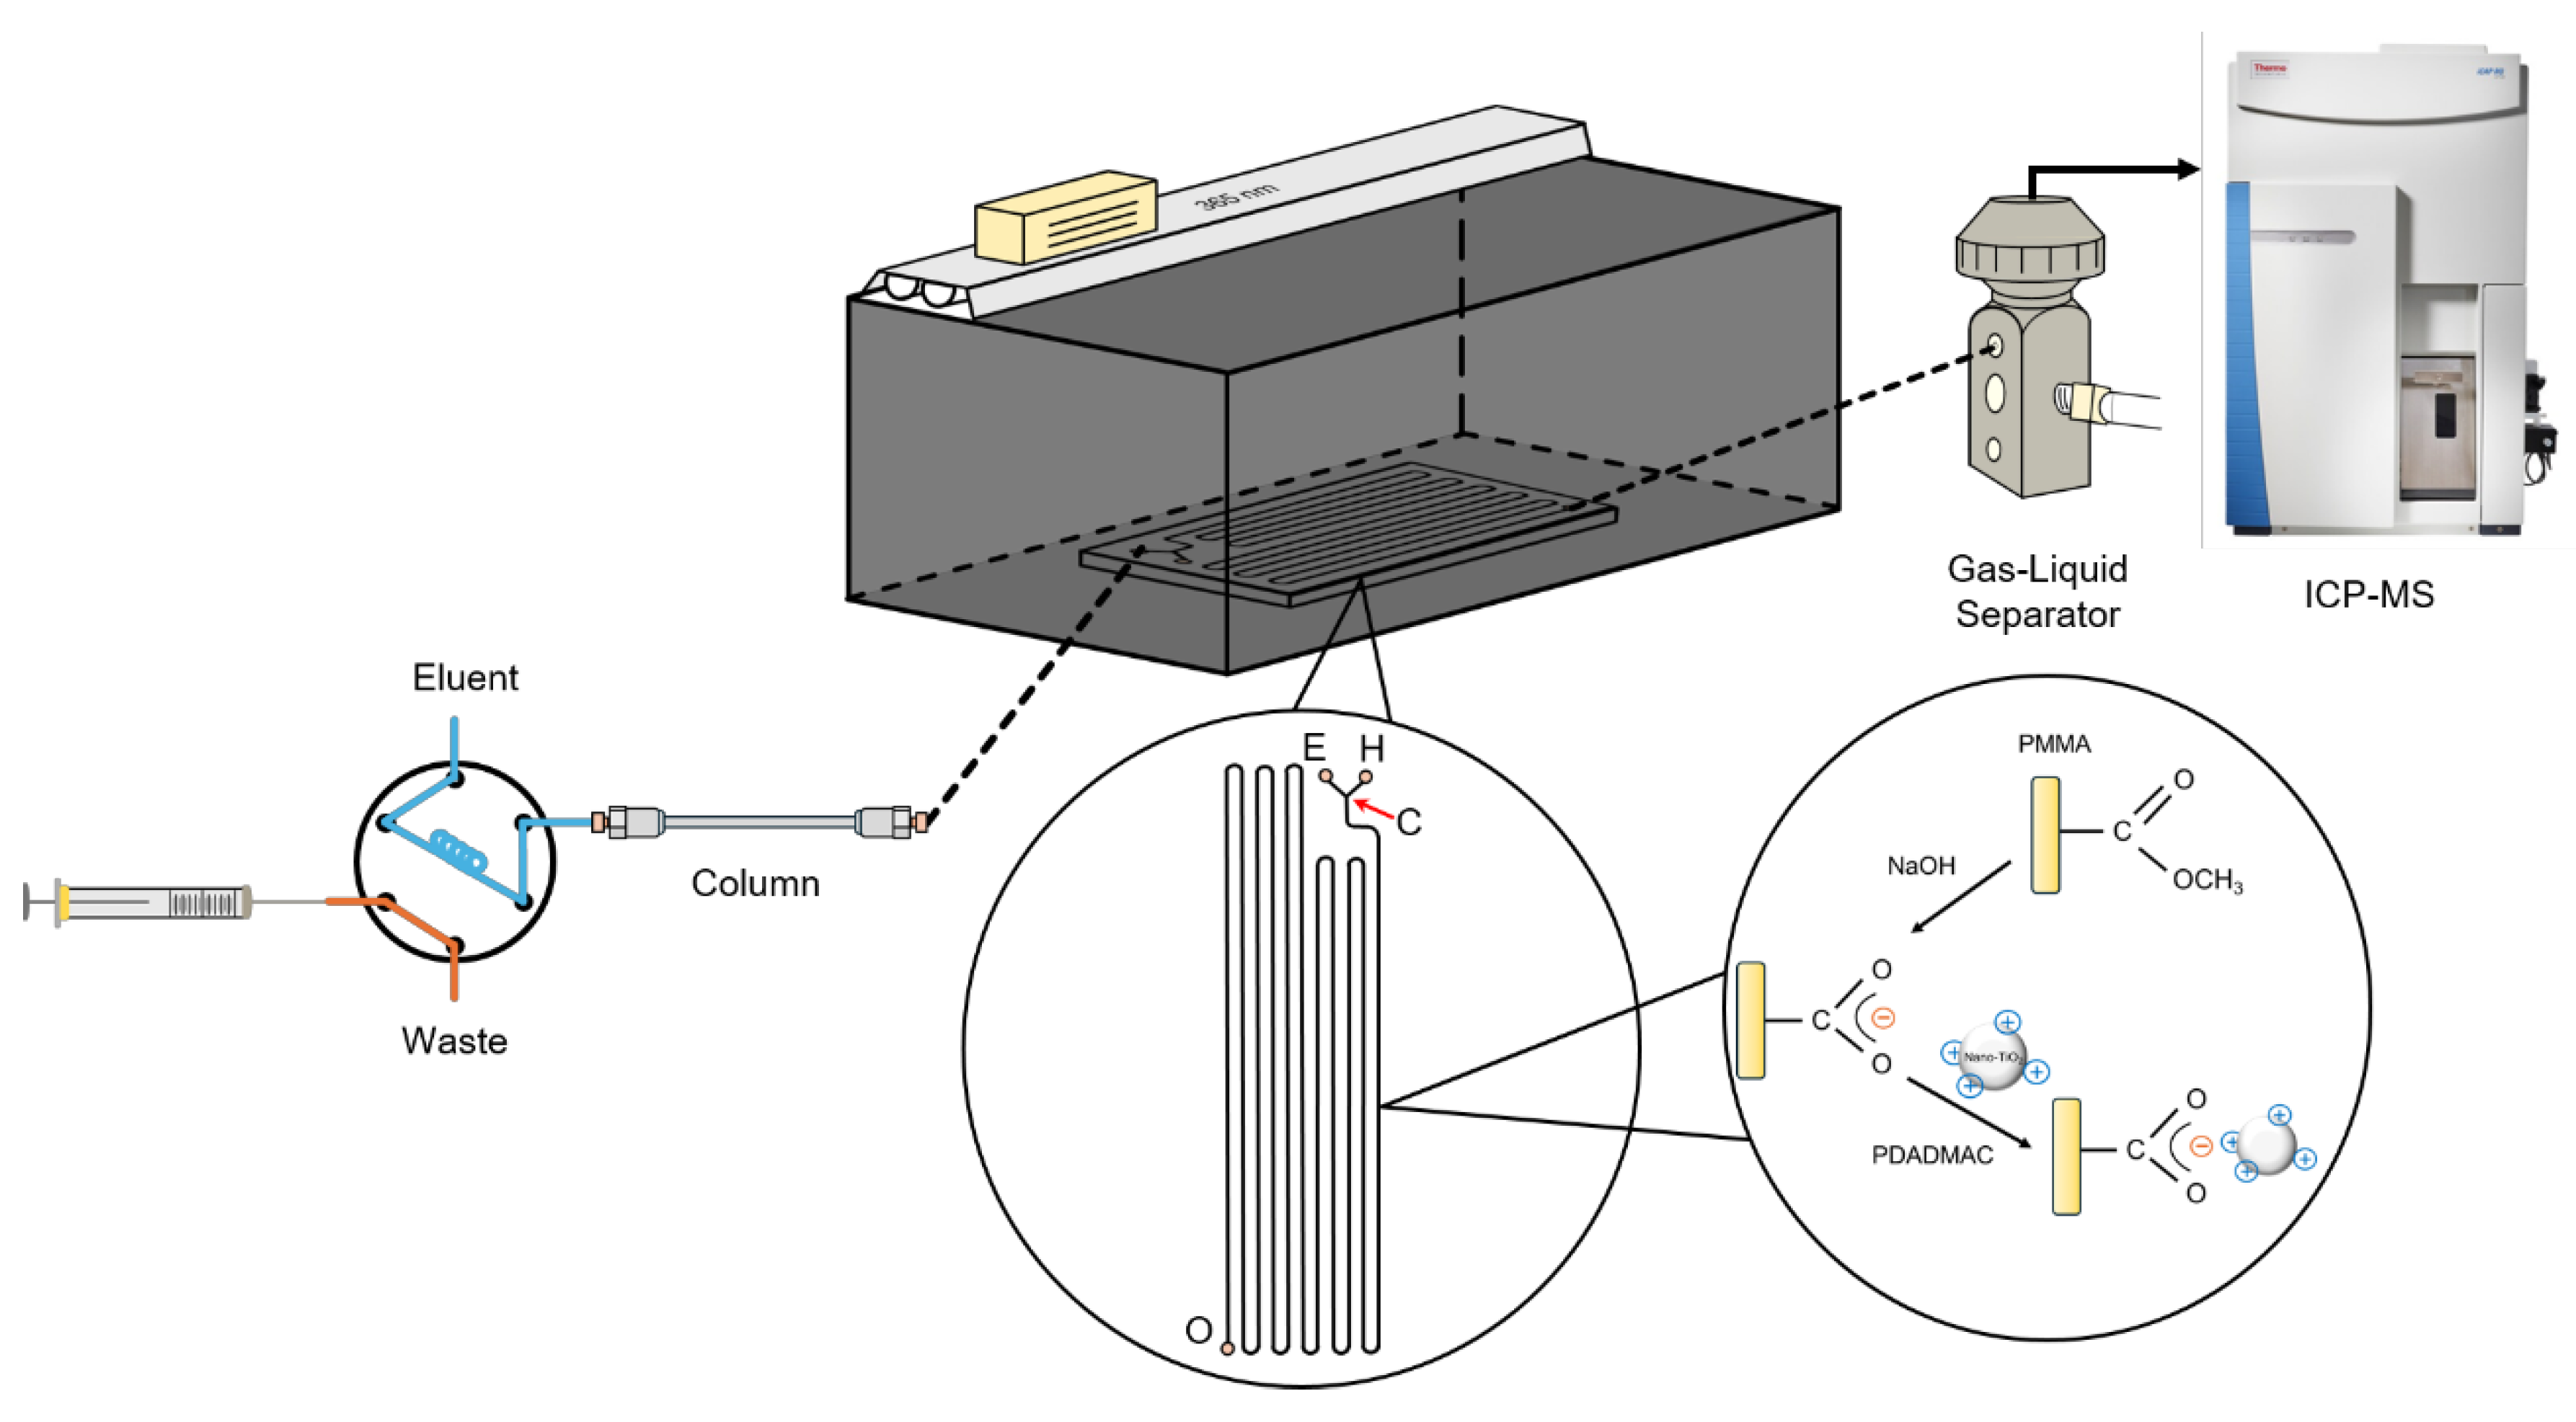
Figure 2.
Variation in the zeta potential of samples with respect to the pH of the solution. Uncertainty for each point shown by the error bar is expressed as standard deviation when n = 3.
Figure 2.
Variation in the zeta potential of samples with respect to the pH of the solution. Uncertainty for each point shown by the error bar is expressed as standard deviation when n = 3.
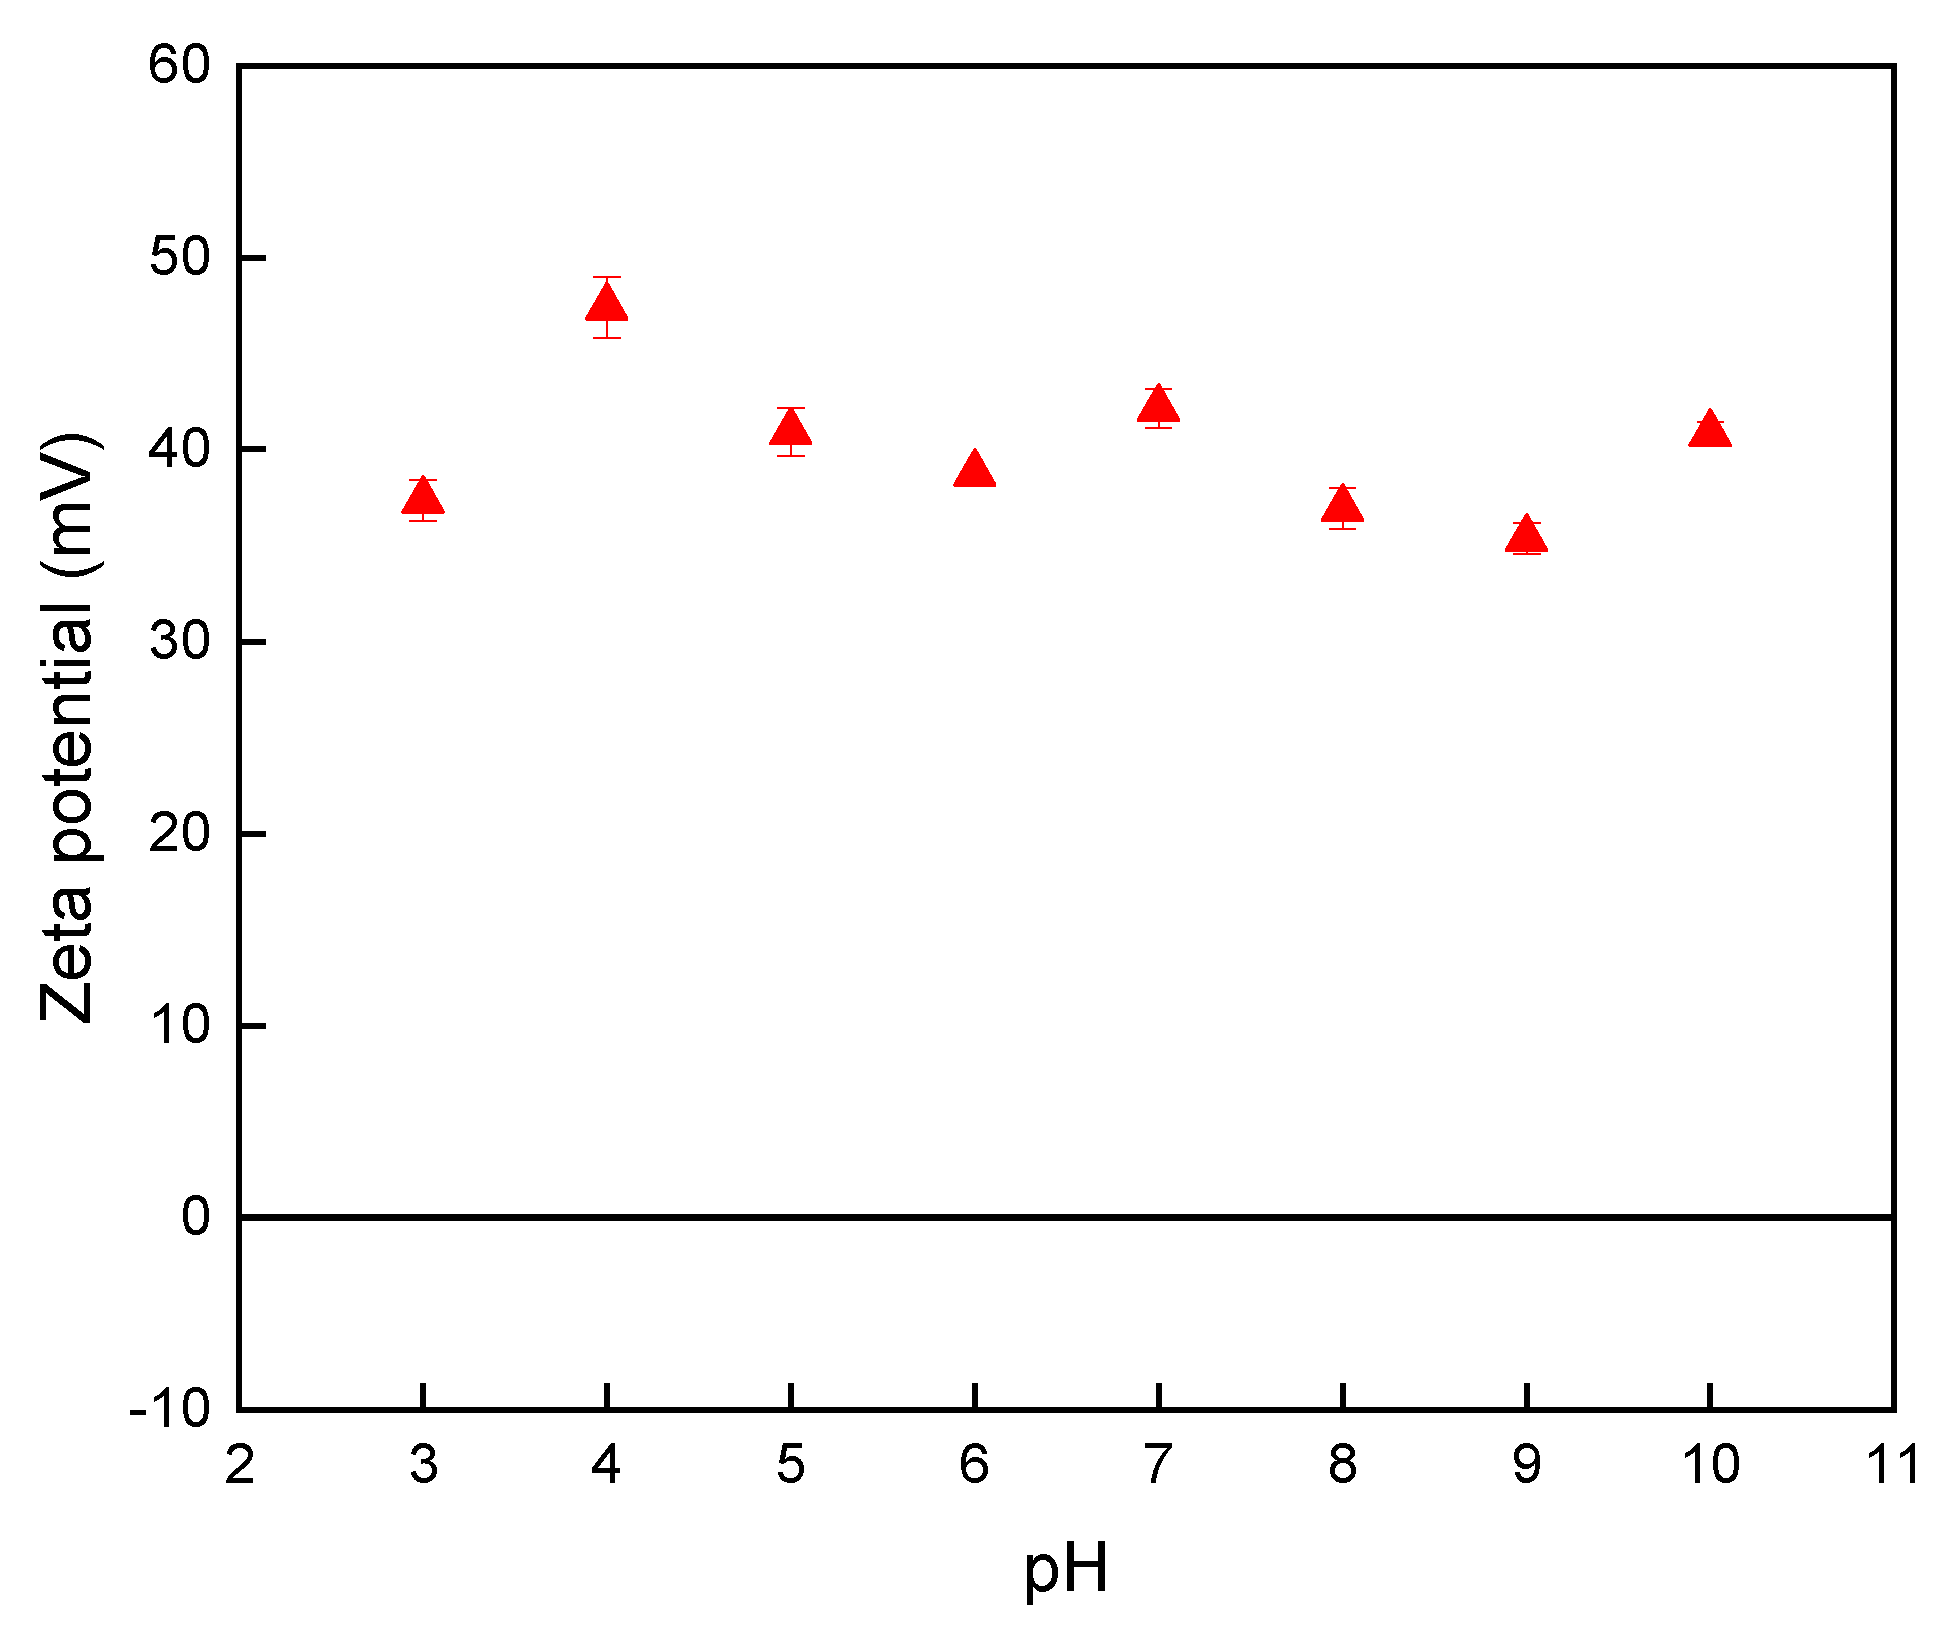
Figure 3.
Variation in the retention time (tR) of the two Hg species with respect to the concentration of (a) L-cysteine and (b) 2-mercaptoethanol. Uncertainty for each point shown by the error bar is expressed as standard deviation when n = 3.
Figure 3.
Variation in the retention time (tR) of the two Hg species with respect to the concentration of (a) L-cysteine and (b) 2-mercaptoethanol. Uncertainty for each point shown by the error bar is expressed as standard deviation when n = 3.
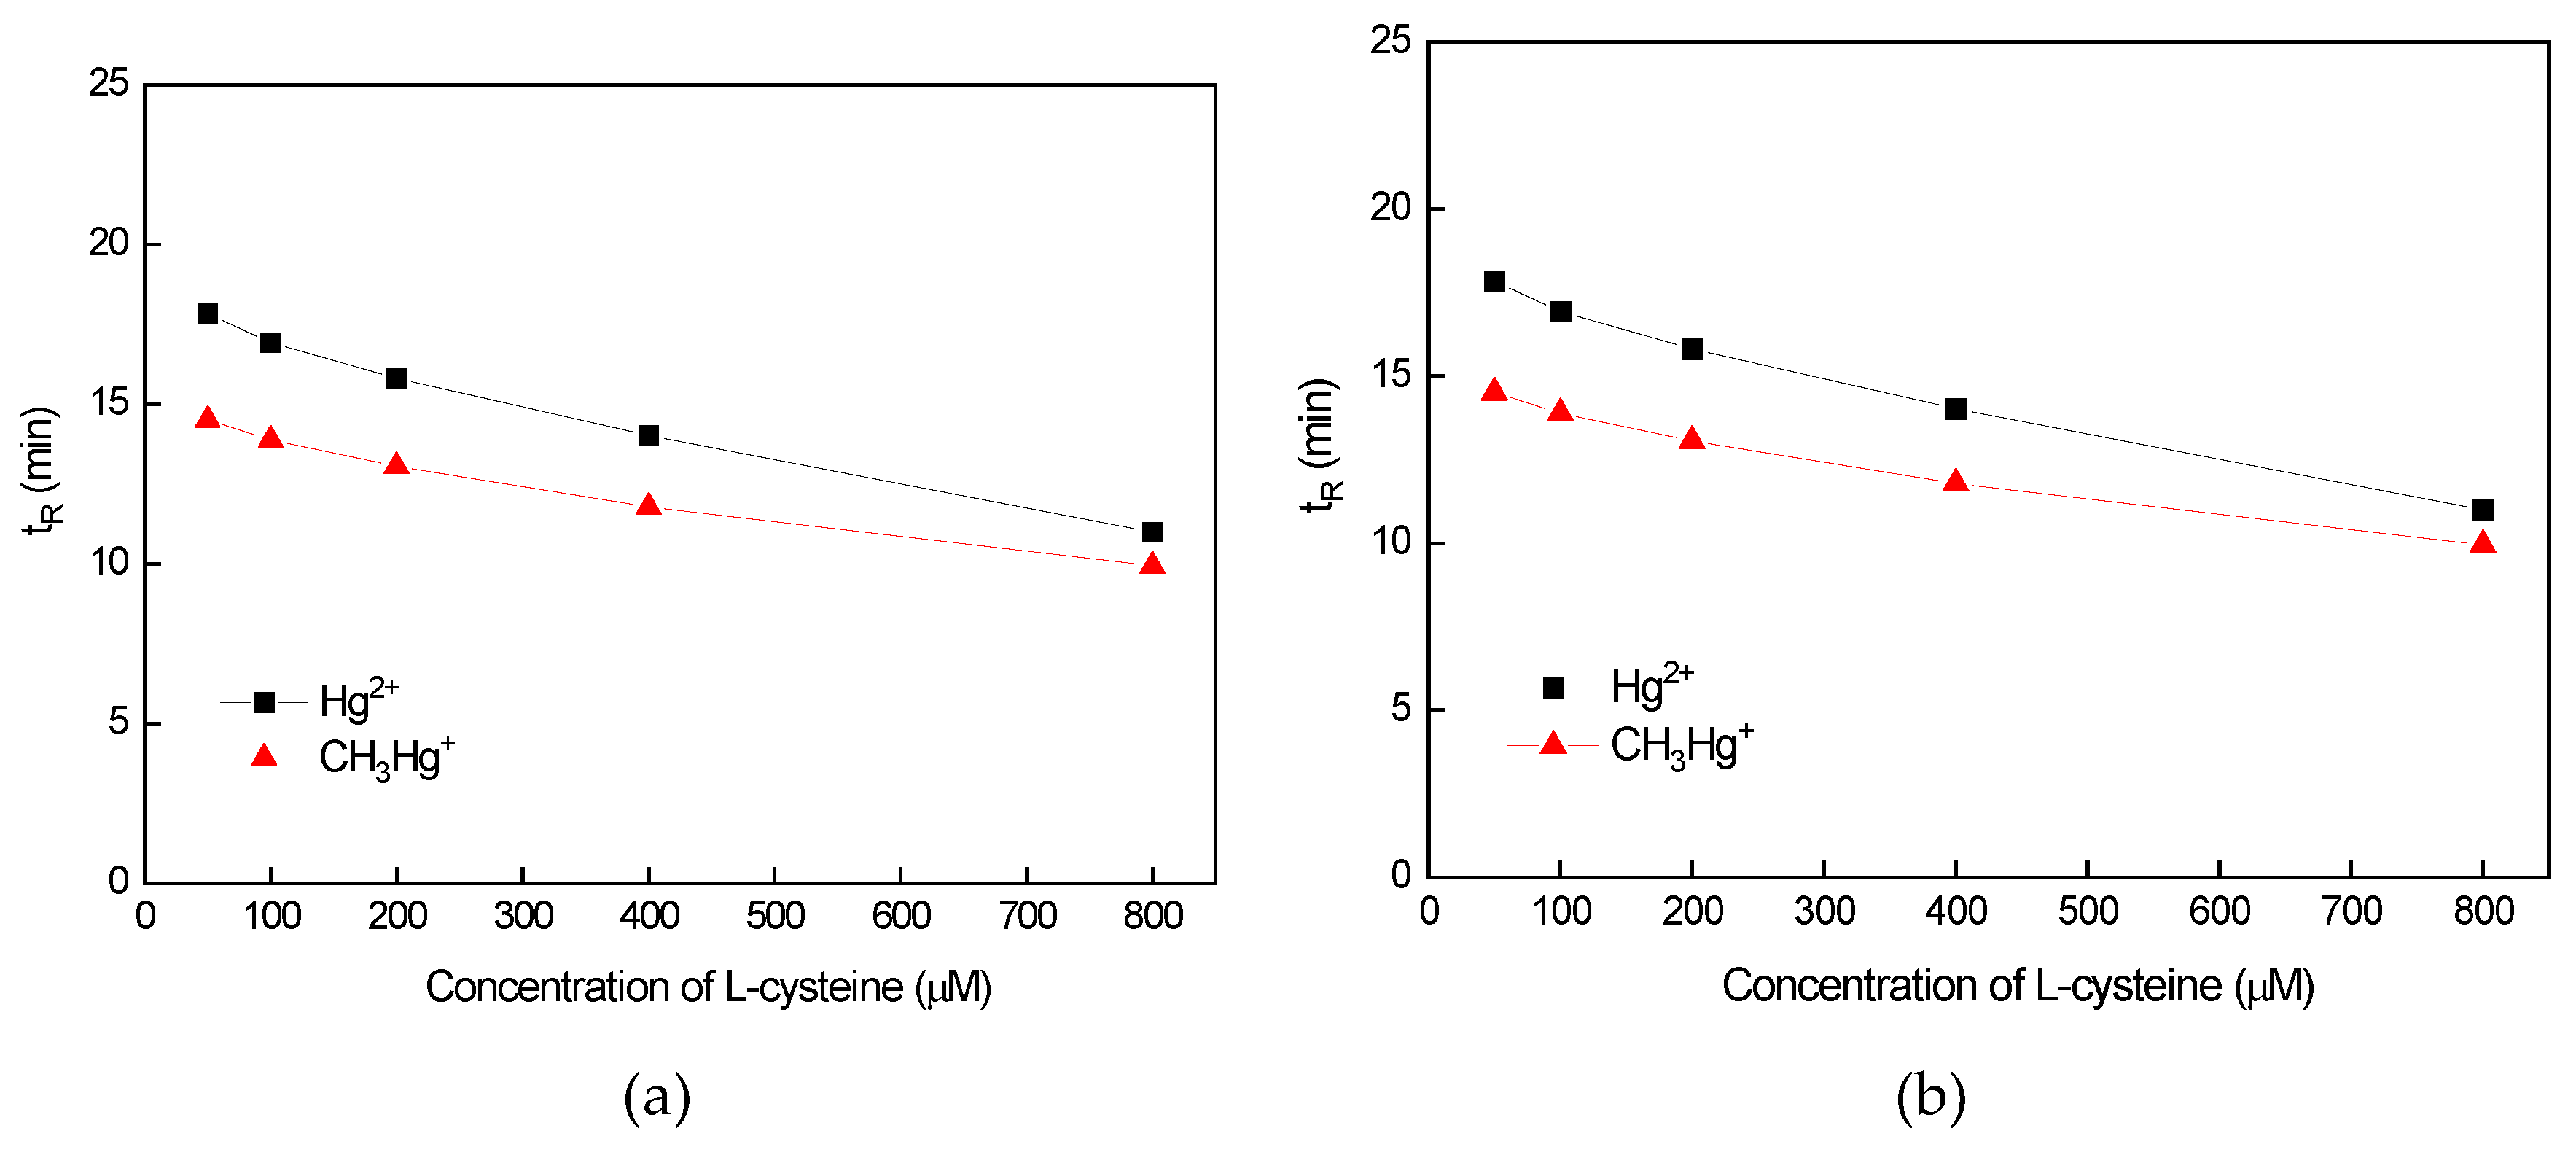
Figure 4.
(a) Chromatograms of CH3Hg+ and Hg2+ under the conditions with/without CH3OH. (b) Variation in the retention time (tR) of the two Hg species with respect to the concentration of methanol. Uncertainty for each point shown by the error bar is expressed as standard deviation when n = 3.
Figure 4.
(a) Chromatograms of CH3Hg+ and Hg2+ under the conditions with/without CH3OH. (b) Variation in the retention time (tR) of the two Hg species with respect to the concentration of methanol. Uncertainty for each point shown by the error bar is expressed as standard deviation when n = 3.
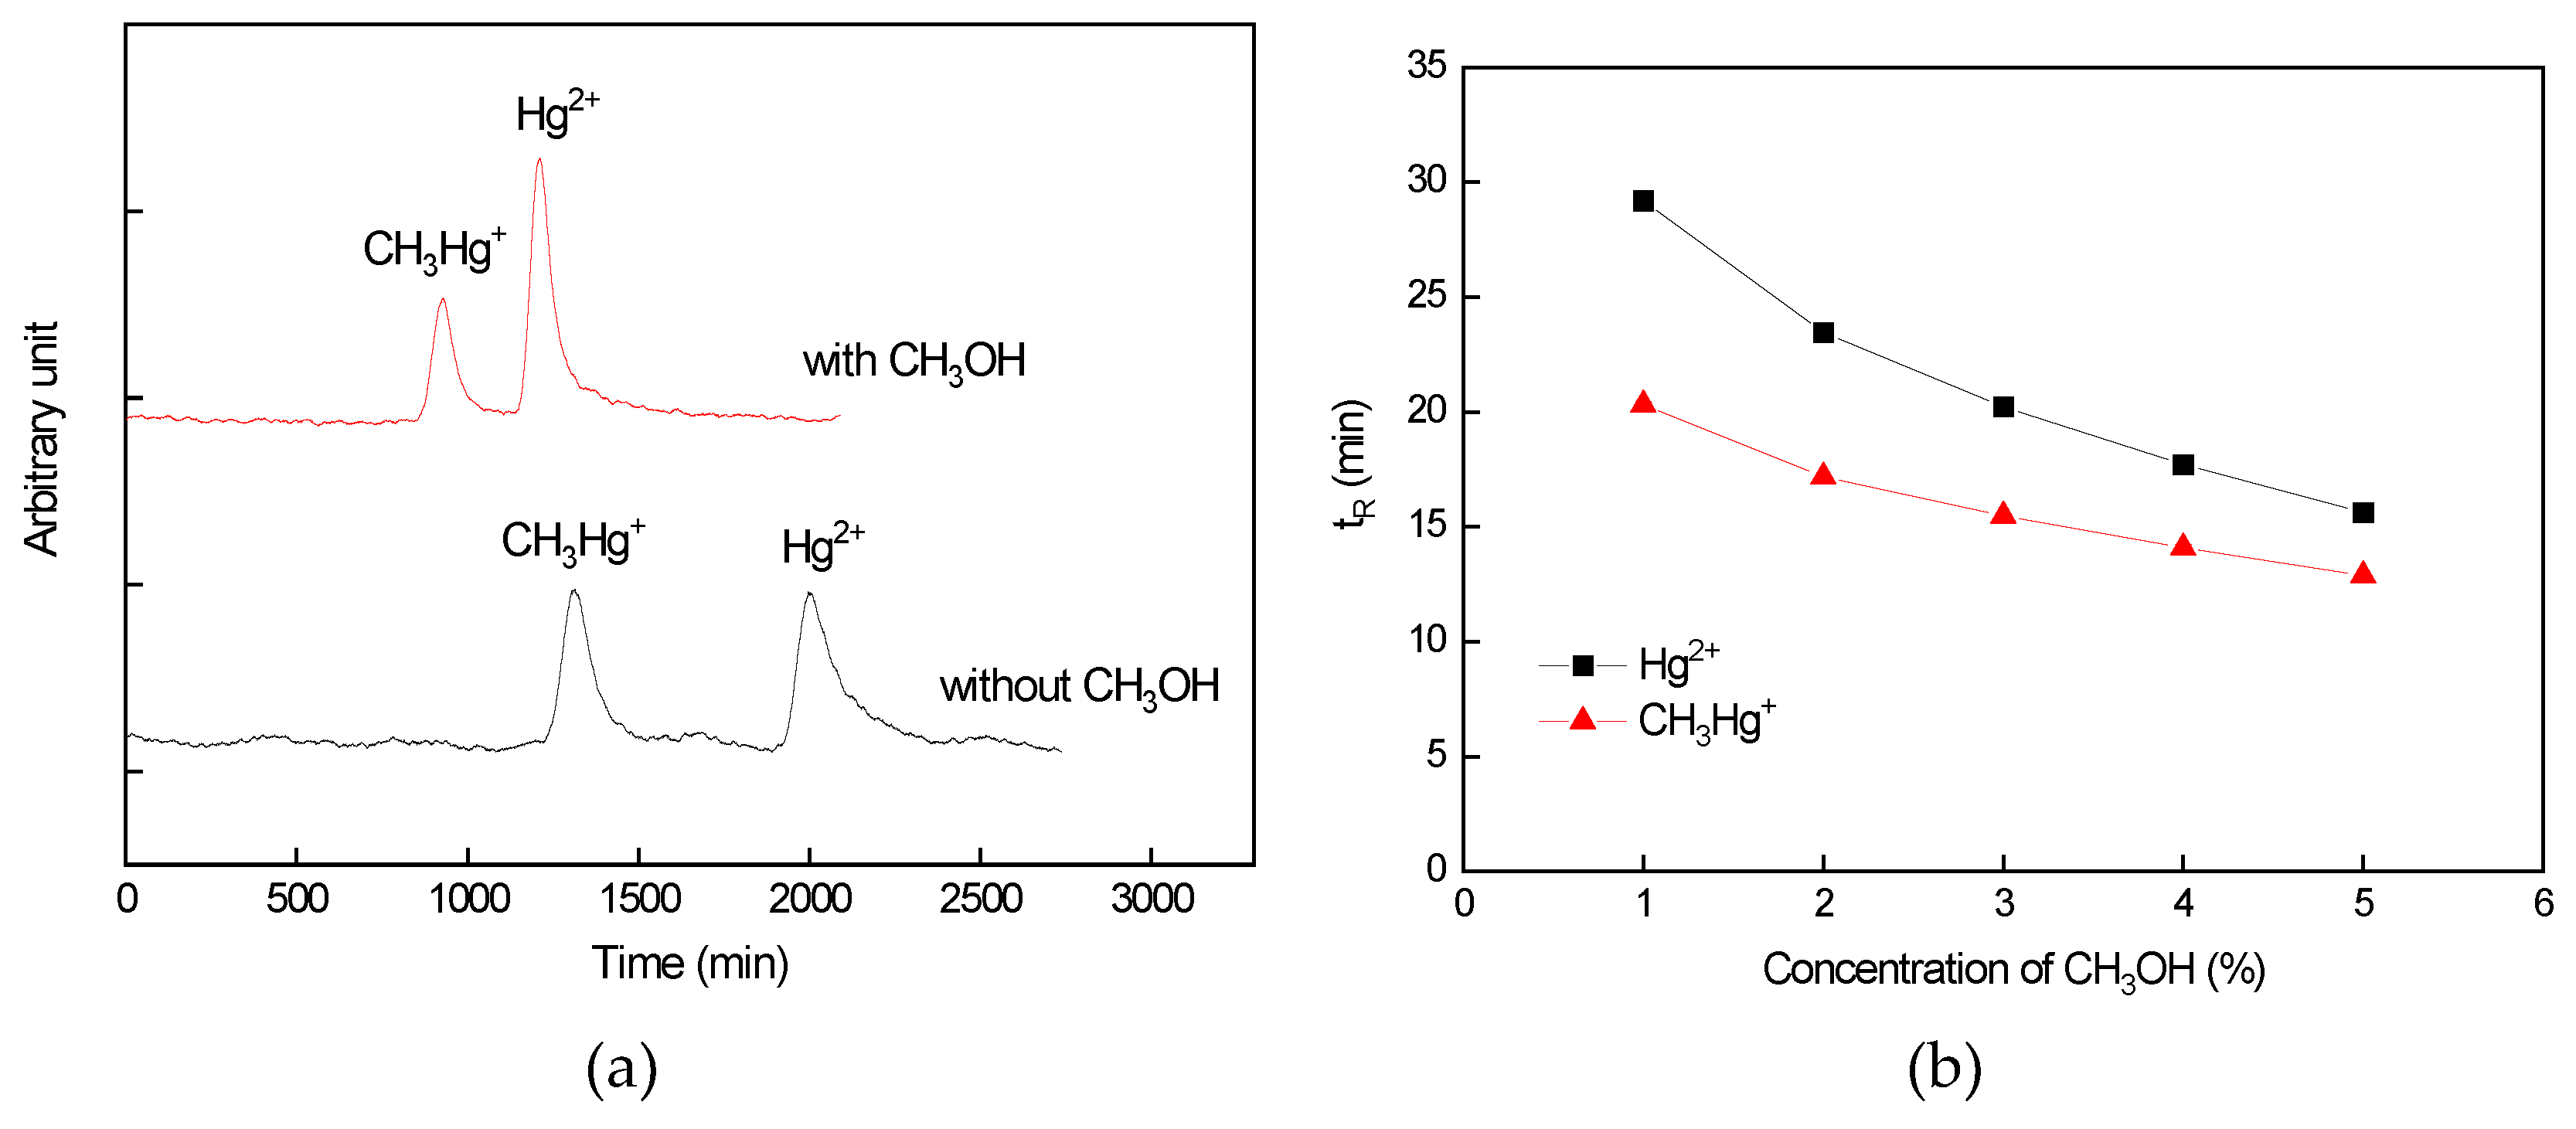
Figure 5.
Variation in the signal intensity of the two Hg species with respect to (a) the concentration of HCOOH and (b) the pH. Uncertainty for each point shown by the error bar is expressed as standard deviation when n = 3. All the data were normalized to the maximal value.
Figure 5.
Variation in the signal intensity of the two Hg species with respect to (a) the concentration of HCOOH and (b) the pH. Uncertainty for each point shown by the error bar is expressed as standard deviation when n = 3. All the data were normalized to the maximal value.
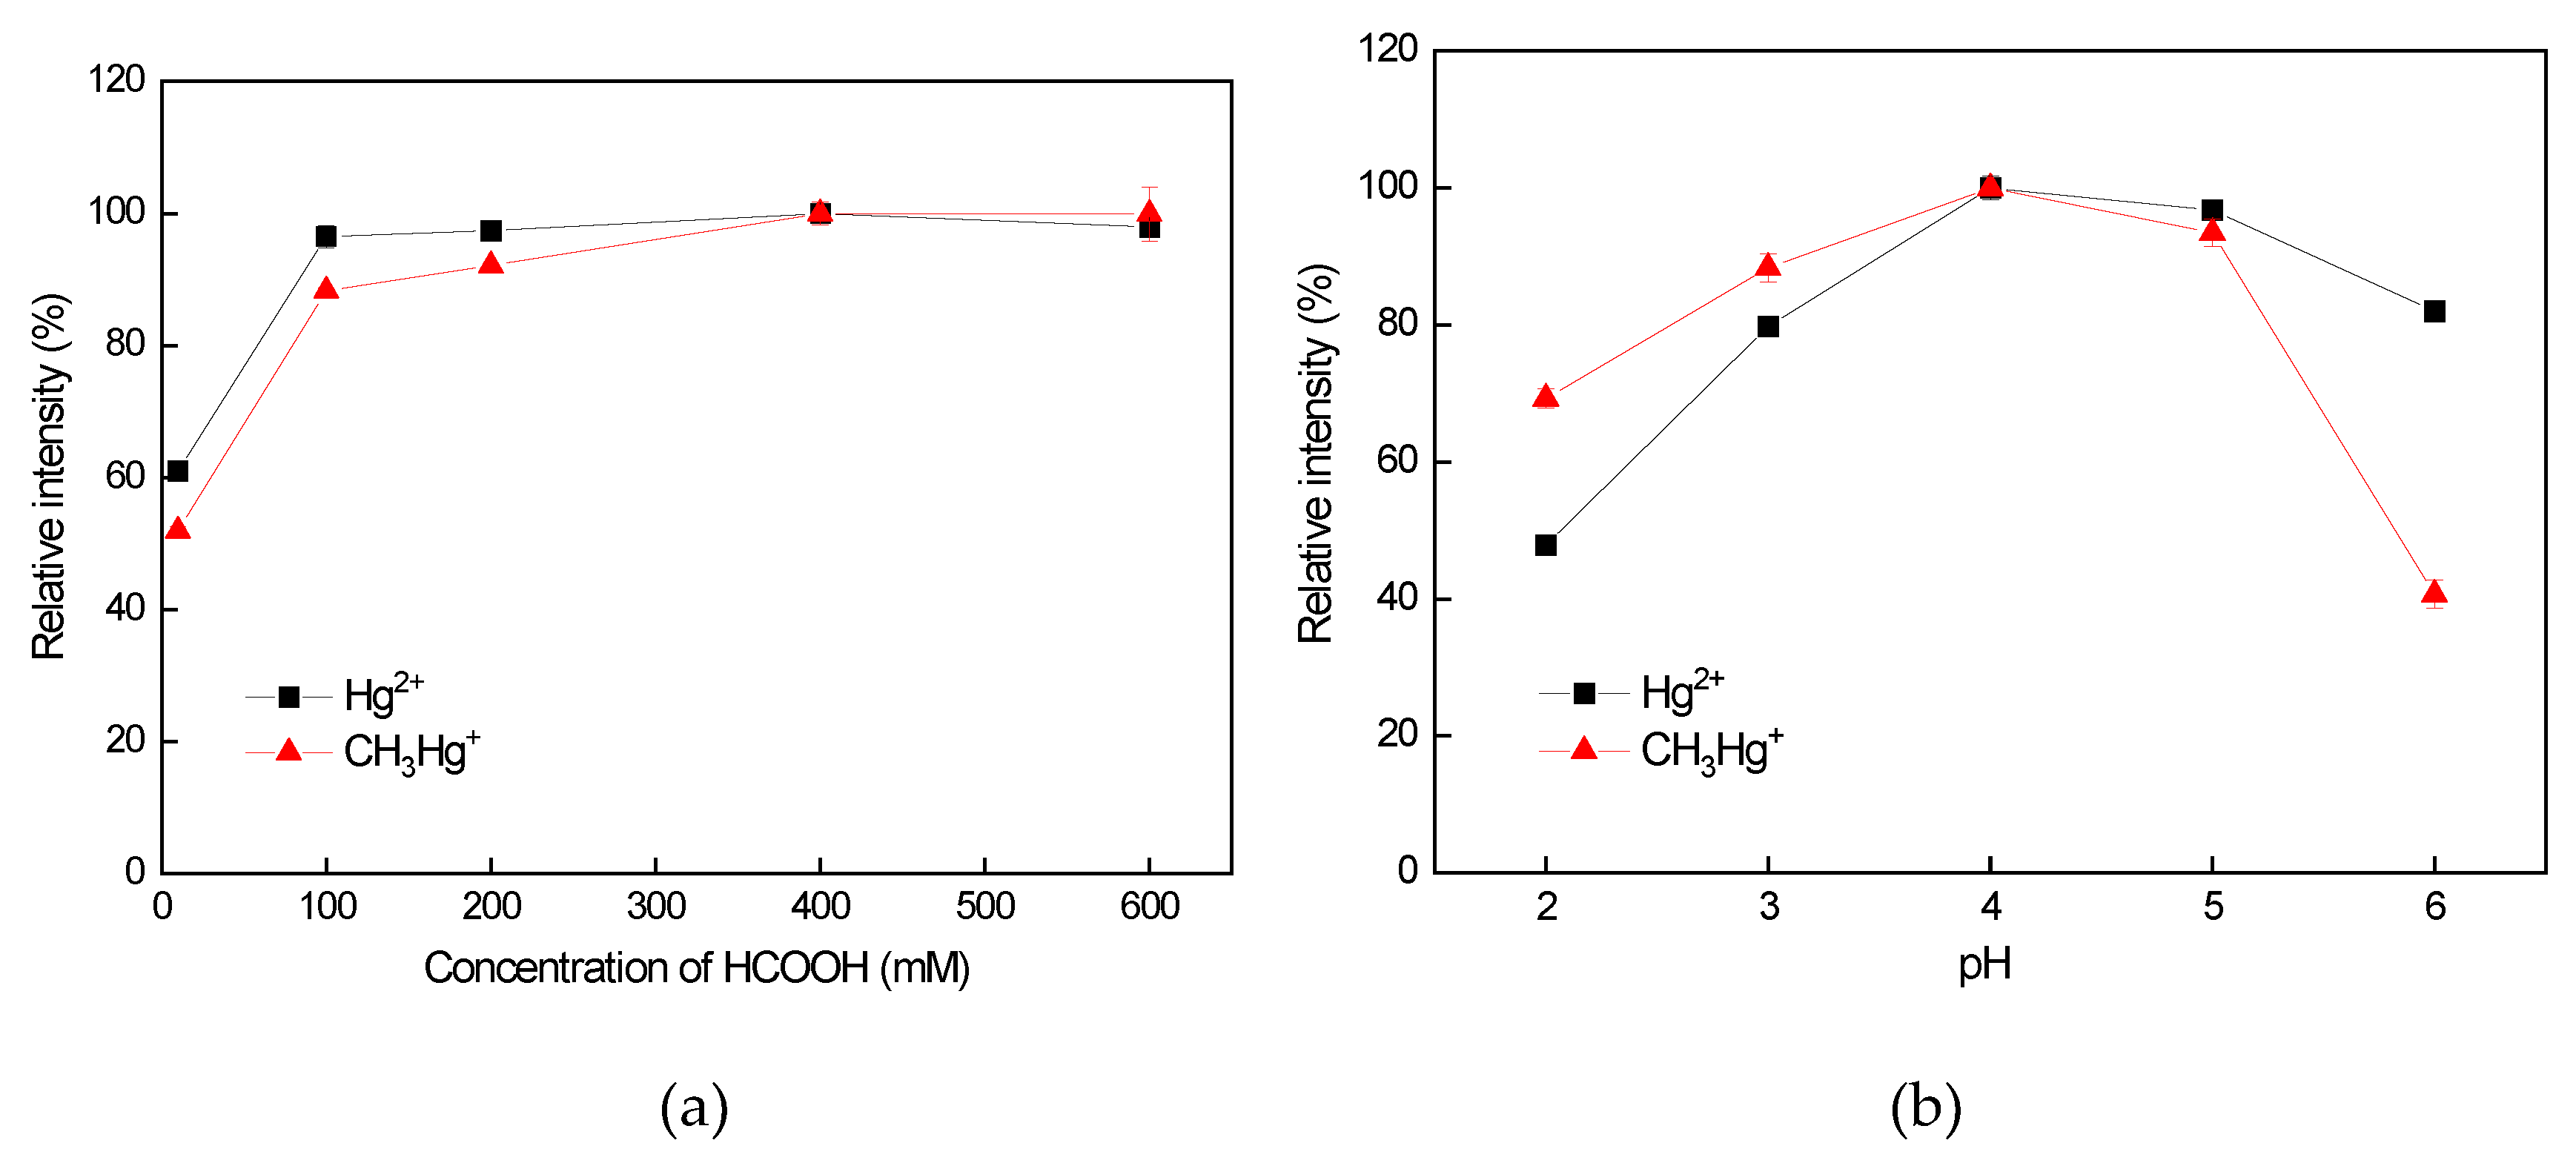
Figure 6.
Chromatograms of the two Hg species obtained using the HPLC/nano-TiO2-coated microfluidic-based PCARD/ICP-MS system.
Figure 6.
Chromatograms of the two Hg species obtained using the HPLC/nano-TiO2-coated microfluidic-based PCARD/ICP-MS system.
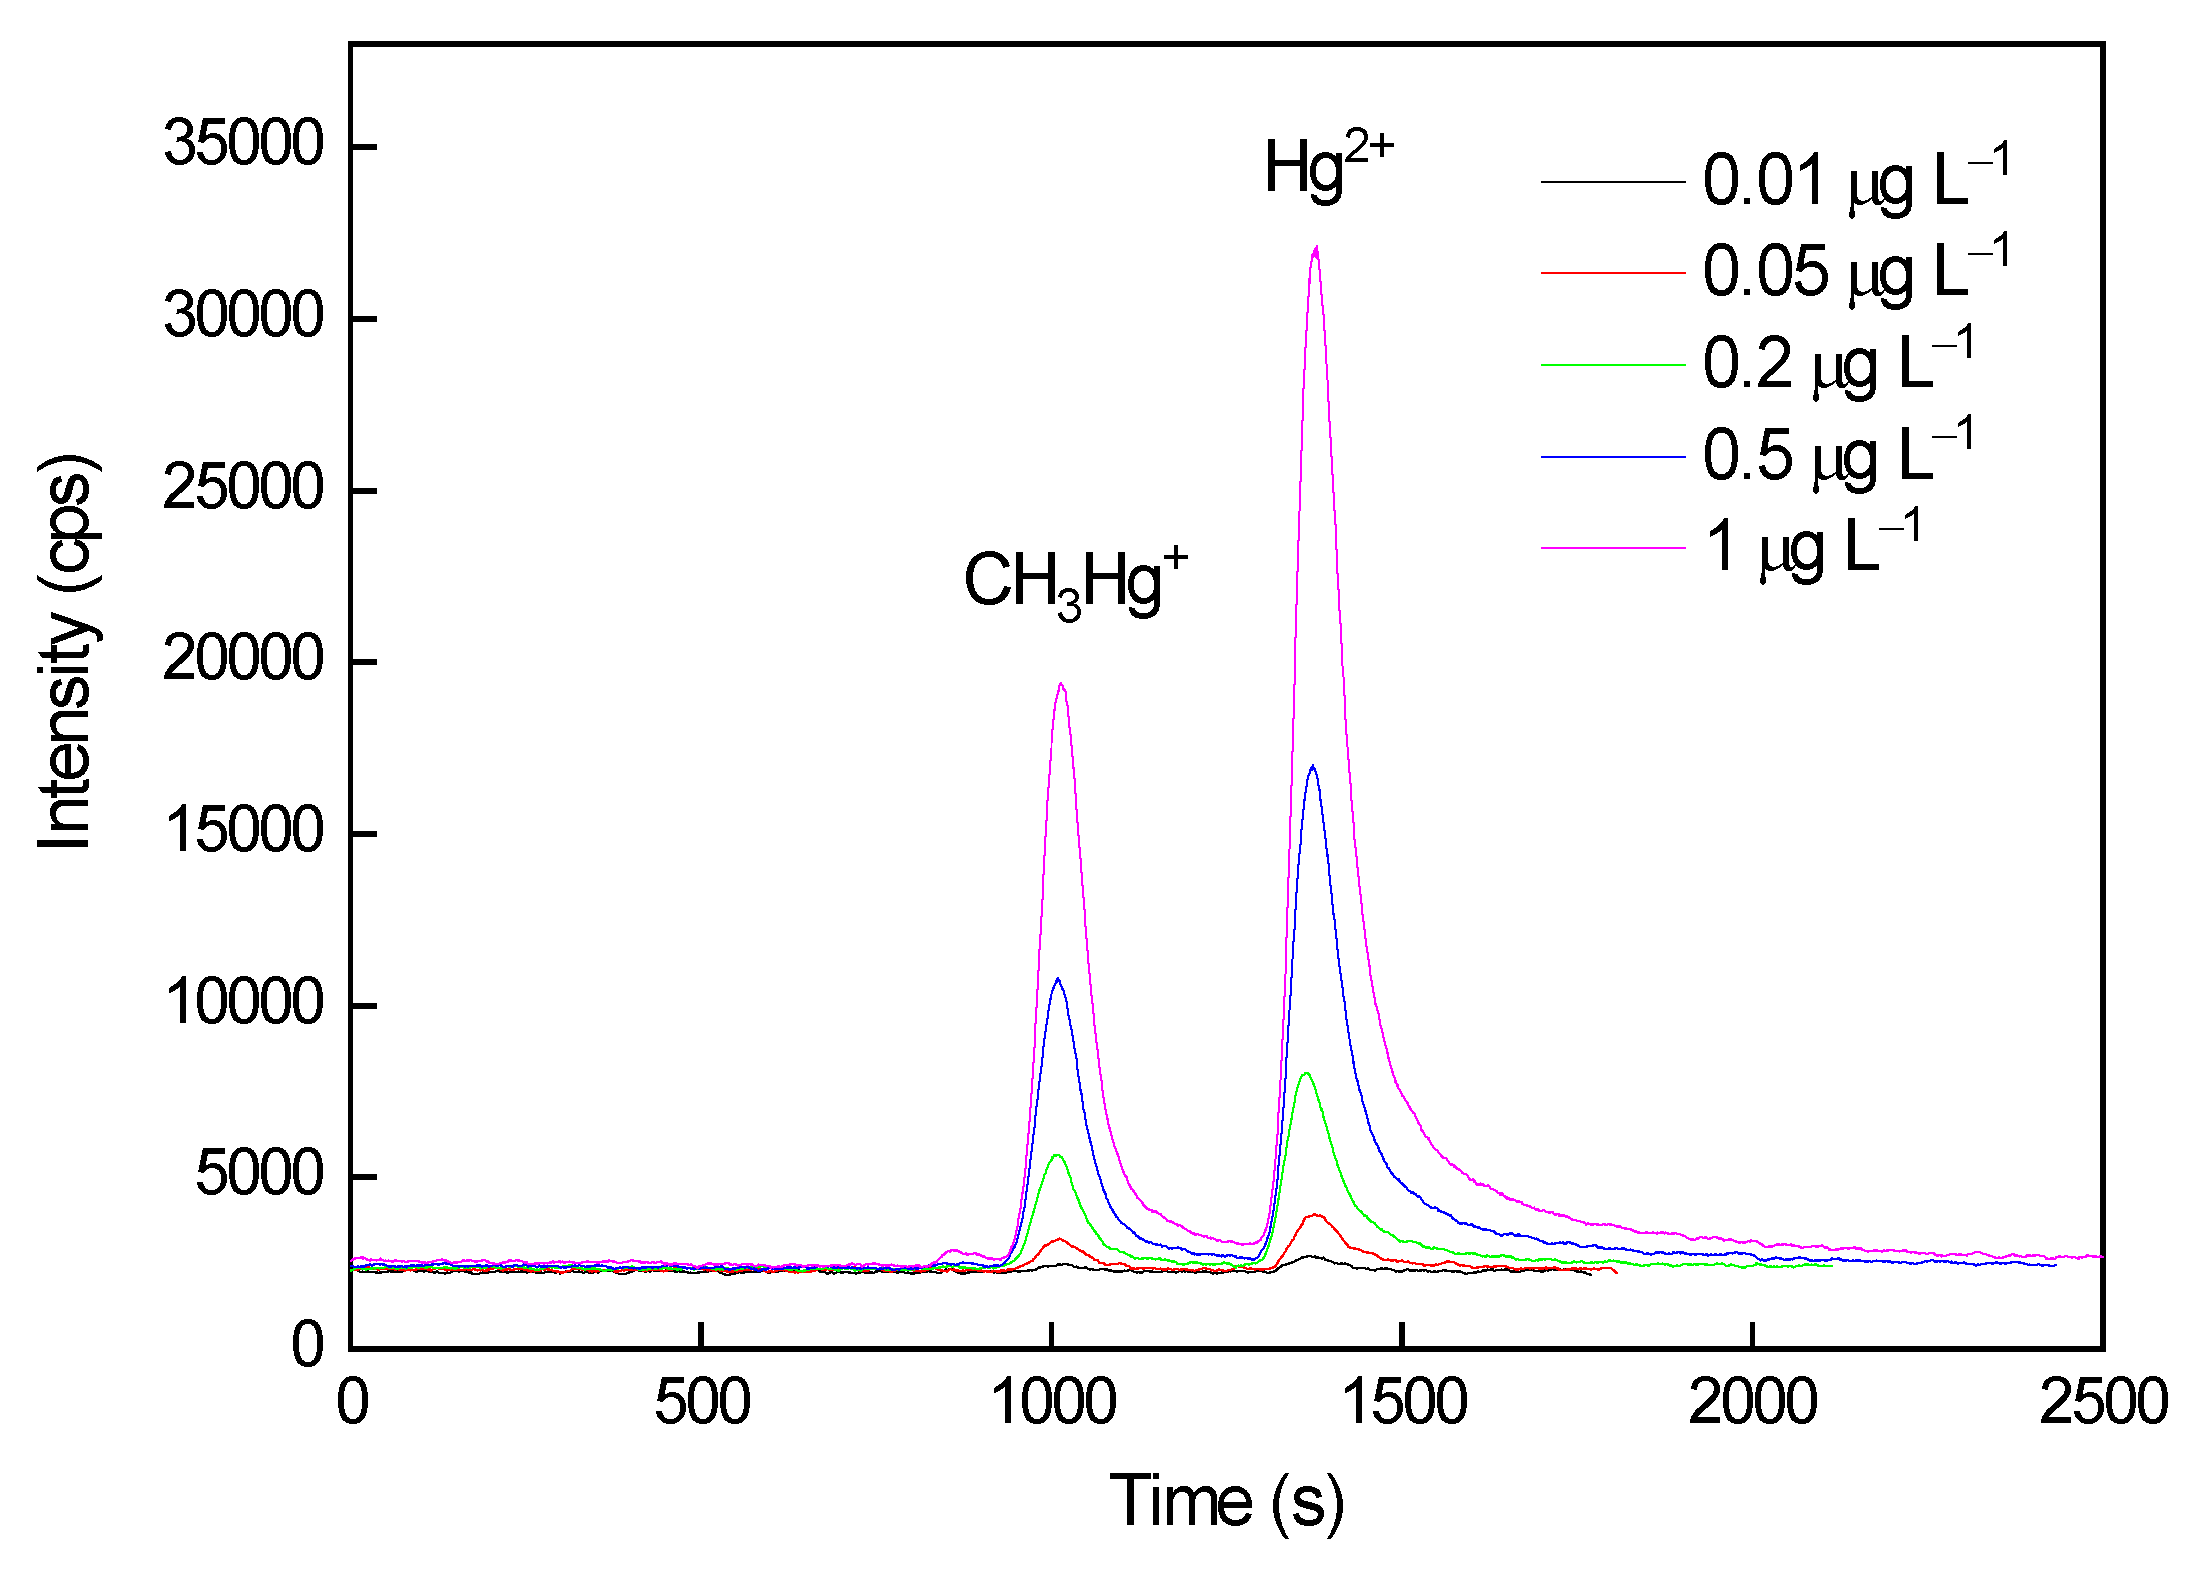
Table 1.
Operation conditions for the HPLC/nano-TiO2-coated microfluidic-based PCARD /ICP-MS system.
Table 1.
Operation conditions for the HPLC/nano-TiO2-coated microfluidic-based PCARD /ICP-MS system.
| Chromatographic Separation | |
|---|---|
| chromatographic column | XBridge® C18, 3.5 µm, 150 × 3.0 mm i.d. |
| mobile phase solution | 2% CH3OH, 100 μM L-cysteine, 1500 μM 2-mercaptoethanol, 10 mM CH3COONH4, pH 4 |
| separation flow rate | 0.3 mL min–1 |
| sample volume | 50 μL |
| Nano-TiO2-Coated Microfluidic-Based PCARD | |
| dimension of reaction channel | 544 mm (W) x 907 mm (D) x 26mm (L) |
| hole-scavenger reagent resulting mixture for photoreduction | 400 mM HCOOH, pH 4, 1 mL min–1 |
| reaction time | 15 s |
| illumination density | 10 mW cm–2 |
| iCAP RQ ICP-MS Detection | |
| plasma power | 1550 W |
| cool flow | 14 L min–1 Ar |
| auxiliary flow | 0.8 L min–1 Ar |
| nebulizer gas | 1.065 L min–1 Ar |
| sampling cone | nickel |
| skimmer cone | nickel |
Table 3.
Analytical characteristics of the proposed HPLC/nano-TiO2-coated microfluidic-based PCARD /ICP-MS system.
Table 3.
Analytical characteristics of the proposed HPLC/nano-TiO2-coated microfluidic-based PCARD /ICP-MS system.
| Species | Linear equation | R2a | Linear range, μg L–1 | MDLb, ng L–1 | Precisionc, % | Seronorm trace elements urine L-2 (Freeze-dried human urine) |
||
|---|---|---|---|---|---|---|---|---|
| Certified value, μg L–1 | Measured valued, μg L–1 | Spike recovery, % | ||||||
| CH3Hg+ | y = 1426317x + 2441 | 1.0000 | 0.01–1 | 2.95 | 1 | 39.8 ± 8.0 | N.D.e | 107f |
| Hg2+ | y =3304219x - 12384 | 0.9998 | 0.01–1 | 1.39 | 3 | 41.4 ± 0.4 | 106f | |
a Correlation coefficient. b Method detection limit; sample volume = 50 μL; n = 7. c Relative standard deviation; standard concentration: 0.2 μg L–1 (n = 15). d Mean ± standard deviation (n = 3). e Not detected. f Spiked concentration = 0.1 μg L−1.
Table 4.
Analysis of urine and water samples.
| Sample | CH3Hg+ | Hg2+ | |||
|---|---|---|---|---|---|
| Measured valuea, μg L–1 | Spike recovery, % | Measured value, μg L–1 | Spike recovery, % | ||
| Urine 1 | N.D.b (N.D.)c | 99d | 0.112 ± 0.004 (1.12 ± 0.04) | 95d | |
| Urine 2 | N.D. (N.D.) | 108e | 0.057 ± 0.002 (0.57 ± 0.02) | 113e | |
| Urine 3 | N.D. (N.D.) | 94d | N.D. (N.D.) | 102d | |
| Drinking water | N.D. (N.D.) | 92f | N.D. (N.D.) | 96f | |
| Effluent water 1 | N.D. (N.D.) | 106f | N.D. (N.D.) | 97f | |
| Effluent water 2 | N.D. (N.D.) | 114g | 0.036 ± 0.002 (0.072 ± 0.004) | 116g | |
a Mean ±standard deviation (n = 3). b Not detected. c Values in parentheses are the concentration of species in original samples. d Spiked concentration = 0.1 μg L−1. e Spiked concentration = 0.05 μg L−1. f Spiked concentration = 0.02 μg L−1. g Spiked concentration = 0.04 μg L−1.
Disclaimer/Publisher’s Note: The statements, opinions and data contained in all publications are solely those of the individual author(s) and contributor(s) and not of MDPI and/or the editor(s). MDPI and/or the editor(s) disclaim responsibility for any injury to people or property resulting from any ideas, methods, instructions or products referred to in the content. |
© 2024 by the authors. Licensee MDPI, Basel, Switzerland. This article is an open access article distributed under the terms and conditions of the Creative Commons Attribution (CC BY) license (https://creativecommons.org/licenses/by/4.0/).
Copyright: This open access article is published under a Creative Commons CC BY 4.0 license, which permit the free download, distribution, and reuse, provided that the author and preprint are cited in any reuse.


