
Submitted:
10 July 2024
Posted:
10 July 2024
You are already at the latest version
Abstract
Investigation of functional magnetic resonance imaging (fMRI) data with machine learning (ML) techniques, including also deep learning (DL) methods, have been widely used to study Autism Spectrum Disorder (ASD). This disorder is characterized by symptoms that affect the individual’s behavioral aspects and social relationships. Early diagnosis is crucial for intervention, but the complexity of ASD poses challenges for treatment development. This study compares traditional ML techniques with deep learning (DL) methods in the analysis of functional connectivity measures obtained from the time series of multicentric ABIDE dataset. Specifically, Support Vector Machines (SVM) classifiers, with both linear and Radial Basis Function (RBF) kernels, as well as eXtreme Gradient Boosting (XGBoost) classifiers, are compared against the TabNet classifier, which is a DL architecture customized for tabular data analysis and a Multi Layer Perceptron (MLP). The findings suggest that DL classifiers may not be optimal for the type of data analyzed, as their performance trails behind that of standard classifiers. SVMs achieve performances, in terms of AUC, around 75%, compared to the best TabNet and MLP results, which are 65% and 71%, respectively. Additionally, this work investigates the brain regions that contribute most to the classification task, which are found to be those primarily responsible for sensory and spatial perception, as well as attention modulation, known to be altered in ASD.
Keywords:
ABIDE
; Multi-site Data
; Deep Learning
; Machine Learning
; Autism Spectrum Disorder
1. Introduction
Autism spectrum disorder (ASD) is a neurodevelopmental disorder characterized by repetitive and stereotyped behaviours as well as deficit in social communication and interaction [1]. ASD affects approximately 1 child out of 59, with strong male prevalence, one in every 37 males and 1 in every 51 females [2]. Currently the diagnosis is based on behavioral criteria that require a team of specialists which can be often time consuming and sometimes does not lead to a conclusive response due to factors such as comorbidity [3,4]. Given the heterogeneous nature of this disorder, it is still studied across different fields and the diagnosis criteria is constantly updated [5,6]. Early diagnosis and intervention is crucial to improve the quality of life and develop effective intervention strategies [7]. Thus far, many studies focus on the analysis of brain images acquired with functional magnetic resonance imaging (fMRI). This is a non-invasive imaging technique that can be used to measure the brain activity through the hemodynamic response associated with the neural activity of a specific brain area (Region of Interest - ROI). Brain activity can be revealed through the Blood Oxygenation Level Dependent (BOLD) signal, whose intensity depends on the oxygenation level of the brain areas involved in neural activity. In particular, resting-state functional magnetic resonance imaging (rs-fMRI) has been regarded as a valuable tool in the ASD studies. This imaging technique involves acquiring functional magnetic resonance images while the patient is not performing specific tasks, i.e. while he/she is at rest. This acquisition technique is often used in the study of brain functional connectivity, which refers to the study of the correlation between the temporal signals of two anatomically distinct brain areas. By assuming that functional connectivity is a phenomenon involving interactions that occur on time scales shorter than acquisition times, it is possible to evaluate the correlation between the temporal signals of two anatomically distinct brain areas, considering the entire observation time interval, instant by instant. This process, repeated for all brain areas, allows to quantify the functional connection between brain areas, from which researchers can identify neurological distinctions between typically developing (TD) individuals from ASD ones leading to more accurate interventions. Given the abundance of data in neuroimaging, machine learning (ML) and deep learning (DL) techniques have been employed to advance ASD prediction and detection with good accuracy [8,9]. Usually neuroscientists apply traditional machine learning techniques for classification, such as support vector machine [10] and random forest [11,12], DL models like convolutional neural networks [13] and deep neural networks[14]. Deep neural networks have achieved significant success different fields, including image and text processing [15,16]. In practical applications, tabular data is the most common data type, particularly in medicine. Recent studies have shown that deep learning-based methods can have a crucial role in diagnosing of ASD [17,18]. Over the last decade, traditional ML methods have remained dominant when dealing with tabular data and frequently achieved better performance than DL approaches. Usually, ML models are simpler compared to DL ones, which facilitates their understanding and interpretation. While DL complexity, lack of transparency and interpretability [19], limiting their applicability in clinical contexts, leading to the necessity of identify the features that contribute the most to the classification results, emphasizing which are the features involved in identifying ASD subjects.
In this work, we investigated different ML and DL methods to show the differences in classification performances and most important features involved in the classification.
2. Materials and Methods
2.1. Data Selection
For this work, we used the data obtained with rs-fMRI of the ABIDE archive [20]. The entire ABIDE dataset has been published in two versions: ABIDE I and ABIDE II. Not all sites belonging to ABIDE II are different from those of ABIDE I, but even if some clinical centers are the same, the pipeline and acquisition parameters may have been modified between the two publications. For this reason, they will be considered as different acquisition sites. Furthermore, even within a single collection, such as ABIDE II, there are sites that have released two different data samples. For this reason, some of these samples are labeled with a subscription number (e.g. 1 or 2). Subjects belonging to the ABIDE II collection will have the prefix ”ABIDE II” before the site name. When this prefix is missing, it is understood that the collection belongs to ABIDE I.
The data selected for this work have been preprocessed with the Configurable Pipeline for the Analysis of Connectomes (CPAC) pipeline [21]. CPAC applies filters for noise from respiration, heart rate, movements of the subjects’ heads, and other smoothing techniques. This pipeline is among the most used, and previous studies have found that, when compared to images preprocessed with other pipelines, those preprocessed with CPAC led to better ASD/TD classification [22]. CPAC also provides the time series of brain areas of interest for patients.
We selected 1001 male subjects aged between 5 and 40 years, with their eyes open during acquisition. The subjects come from 23 different sites. Male subjects were chosen because the sample is larger than the female one and because males have a probability about four times higher of being affected by the disorder [23]. Moreover, the female dataset was insufficiently populated to allow statistically significant studies. The choice of the condition with eyes open was made to avoid including cases with potentially sleeping subjects during the examination. The dataset is equally distributed between ASD and TD, it consists of 506 TD subjects and 495 ASD. Figure 1 shows the distribution of ASD/TD for each site.
2.2. Features Generation
In neuroimaging, Pearson correlation analysis determines the potential correlation between the instantaneous variation in activation state of different brain regions and how these areas are involved in carrying out a specific function. The values, or coefficients, of Pearson correlation are defined as follows:
In the studied case, x and y represent the time series of two brain regions and n is their dimension (number of time points), the coefficient r represents signals that are fully correlated or anti-correlated [24]. Pearson coefficients were normalized using the Fisher transformation (2) to make them statistically more significant [25].
In equation (2), n represents the number of time points of the time series and r indicates the Pearson coefficient calculated with equation (1). Pearson coefficients will be used as features for classification. The number of features depends on the atlas used. In fact, for N regions, we will have features. This is because calculating the Pearson correlation between the time series of each of the regions of an atlas generates a square and symmetric connectivity matrix (see equation (1), which is invariant under the interchange of time series indices), thus, the upper triangle of the matrix contains the only elements of interest. In this work we used the Harvard-Oxford anatomical atlas [26], composed of 110 regions, which result in features.
For this study, out of the initial 110 ROIs, 7 were excluded due to having null time series in a substantial number of patients. This led to a total of 103 ROIs for each patient. The correlation was then computed for each pair of brain areas, resulting in independent combinations of connectivity features for each subject.
2.3. Harmonization Procedure
Given that large datasets can be obtained by collecting images from different centers, this brings a heterogeneity of data due to differences in scanners and/or acquisition protocols that requires a harmonization technique to minimize these differences. In this work we used the Neuroharmonize tool proposed by Pomponio et al. [27,28], which is derived from Fortin et al.’s ComBat [29,30]. Neuroharmonize aims to eliminate the site effect while preserving the dependence of the features on biologically significant covariates, like age and sex.
According to Serra et. al [31], in order to avoid a bias due to data leakage, the harmonization parameters were estimated using only the subjects belonging to the control group of the training set. Once the set of covariates is defined, the harmonization model is computed. In this work we used age and site as covariates. Subsequently, the model is used to harmonize both the train and test sets. In a cross-validation scheme, the procedure is repeated for each fold separately.
2.4. Classification Strategy
For this work, traditional classifiers, Support Vector Machine with a Linear kernel (L-SVM), Support Vector Machine with a Gaussian kernel (SVM-RBF) and eXtreme Gradient Boosting (XGBoost) were chosen, alongside deep classifiers, Attentive Interpretable Tabular Learning (TabNet) and Multi Layer Perceptron (MLP). The SVM classifiers are the most commonly used classifiers in these classification problems. SVMs have demonstrated superior performance compared to other classifiers, particularly in scenarios with a small number of samples and a large number of features [32]. XGBoost, was chosen because tree ensemble models are recommended when dealing with tabular data classification problems [33] and offers better generalization capability and is less susceptible to overfitting. TabNet is a deep learning model mostly used when dealing with tabular data, it employs sequential attention to select the most relevant features for reasoning at each decision step enhancing interpretability and optimizes learning efficiency by focusing the learning capacity on the most significant features [34]. MLP consists of fully connected layers where every node of each adjacent layer is connected, is a classifier easy to implement, fast and has shown performances that outperform other classifiers [35]. The L-SVM and SVM-RBF classifiers were implemented using the sklearn.svm.SVC module from the Python library scikit-learn,svmpy,svm2. For XGBoost, we used the XGBoostClassifier from the xgboost package in Python [38]. The TabNet model was implemented with the TabNetClassifier from the PyTorch library pytorch_tabnet.tab_model [39] and the MLP was implemented using the MLPClassifier from sklearn.neural_network package [40].
Once the features for each subject are obtained, these characteristics, along with the labels (+1 for ASD subjects and -1 for TD subjects), are used for classification. We applied a feature scaling method, the Scikit-learn RobustScaler and a hyperparameters tuning for XGBoost and TabNet classifiers. The classification results are obtained using the Repeated Stratified k-fold cross-validation method, setting the number of folds to 5 and the number of repetitions to 10. The classification performance was evaluated using the area under the ROC curve (AUC) [41,42]. The AUC was calculated for each fold and repetition and the final result is calculated as the mean of the AUC at which we associated the standard deviation as error.
With such a high number of features compared to the number of samples, the analysis, in addition to being more complex, is highly prone to overfitting. For this reason the performances of the classifiers were observed both without Principal Component Analysis (PCA) and with PCA, varying the number of principal components (PCs) from 30 to 300 PCs (30, 50, 100, 200, 300).
2.5. Features Importance
Understanding the most important features that contribute to the classification of ASD and TD individuals is crucial for advancing diagnostic and therapeutic strategies. In order to determine which pairs of regions were discriminating for distinguishing TD from ASD, the permutation importance [43] technique was used for each analyzed classifier because it can be applied uniformly to all of the models tested.
Permutation importance is generally useful for understanding data and interpreting models: by calculating the score for each feature, one can determine which features most influenced the utilized model. Permutation importance is considered as one of the global Explainable Artificial Intelligence (XAI) methods. It provides insights into the overall behavior of a model and offers a comprehensive view of feature contributions across the entire dataset. Using a global XAI approach, the interpretability and reliability of the model are increased. The basic idea of permutation importance is to observe how much a particular score decreases when a feature is not available. The score thus represents the importance of each feature. A higher score indicates that the feature in question has a greater effect on the utilized model. In principle, one could remove features, retrain the classifier, and check the score. However, this approach can be computationally complex because it would require retraining the classifier for each feature. Additionally, this method demonstrates which features might be important in the dataset rather than which features are important for the classifier. To avoid retraining the classifier, a feature is replaced with noise derived from the same distribution as the original feature values during each permutation. The simplest way to derive this noise is by shuffling the values of one feature using the values of another. In this study, permutation importance was implemented using the method described above. The purpose of the analysis was to determine whether the key features for the classification vary depending on the model used. We used the feature permutation importance implemented in the ELI5 python library [44]. This library offers a function that takes into account a trained model, a validation dataset, a scoring metric and it returns the importance score for each feature. The importance score reflects the decrease in model performance: the greater the drop in performance when a feature is shuffled, the more significant that feature will be considered. We employed the AUC as a scoring metric and computed the permutation importance for each fold of the 5-fold cross-validation and repetition. The final results were obtained as the average importance score across the folds and repetitions. We carried out the feature permutation importance analysis for all classification models.
3. Results and Discussion
3.1. Classification Performances
In Figure 2 are illustrated the classification performances in discriminating ASD subjects from TD ones. The results are reported for each classifier analyzed (TabNet, MLP, XGBoost, L-SVM, and SVM-RBF) and with different numbers of PCs. The best classification results are obtained for the SVM-RBF classifier with an AUC of 0.75±0.03 (100 PCs), followed by L-SVM with an AUC of 0.74±0.02 (50 and 100 PCs). As for the DL models the classification results fall behind, 0.71±0.02 (200 PCs and no PCA) for MLP and 0.65±0.02 (no PCA) for TabNet. These results are in accordance with the current literature, where performance typically hovers around 70% in multi-site approaches [45,46,47]. The higher classification performance of standard ML models indicates that the use of deep learning algorithms does not always provide an advantage for this type of data.
3.2. Feature Importance
Identifying the key features that differentiate ASD from TD subjects is essential for understanding ASD. Given that these features measure the correlation between the temporal signals of ROIs, they provide valuable insight into which aspects most significantly impact the distinction between ASD and TD subjects. In order to compare which regions were most significant in discriminating ASD/TD, we selected the top 50 features with the highest scores for each classifier. Subsequently, we checked for common features among all the top-50 features. From this analysis we didn’t find any common feature for all the classifiers but only some features that were in common between two or three classifiers. This difference in the most important features for different classifiers is certainly connected to the high number of features (5253) and the intrinsic multivariate nature of the problem. Hence, a large set of features appears to be relevant in the classification, while no small subset can be defined relevant in the classification. To provide an example, the most important features present a feature importance that is in the range of 0.1%-1% of AUC, depending on the classification method.
However, despite the lack of global common features, we looked for brain regions occurrences in the 50 most relevant correlations by counting the number of times these regions were present in all classifiers. This allowed us to observe which regions had the most significant effect on ASD/TD classification based on their connectivity to other regions. The results are shown in Table 2. Consistent regions can be identified in all classifiers. These regions are those whose correlation with other regions was most significant in discriminating between ASD and TD. We also examined the belonging of these regions in the functional networks of Mesulam [48] catalog. In this way it was possible to highlight how the most significant areas for distinguishing between ASD and TD belong to the heteromodal, unimodal, primary and paralimbic network. The importance of these networks has also been found in literature [49,50,51]. These highlighted areas are crucial for sensory perception, processing visual and auditory signals, spatial perception, and attention modulation. They are fundamental for understanding social signals that require the integration of complex sensory information such as facial expression, tone of voice and gesture [52]. Therefore, they are important in understanding the mechanisms underlying autism spectrum disorder [53]. Heteromodal networks, involving various cortical areas, are crucial for integrating complex sensory information and processing multisensory knowledge. In contrast, unimodal networks are specialized in a specific sensory modality. Neuroimaging studies have shown alterations in these areas in autism spectrum disorder, suggesting dysfunction in sensory integration and processing of complex information in this disorder [54].
4. Conclusions
In this work we investigated the effectiveness of both traditional ML methods and DL approaches in classifying individuals with ASD against TD controls. Our findings revealed that ML methods achieved state-of-the-art classification performance, outperforming the DL models, TabNet and MLP. These results suggest that DL classifiers may not always provide optimal outcomes for this specific data domain. Moreover, our analysis emphasizes the need to pay attention when interpreting DL models performance, given that optimizing DL models presents greater challenges compared to traditional ML techniques. Additionally, the features that have the most significant impact in the classification task vary across different classifiers. Such diversity could be also related to overfitting. This highlights the challenges posed by the dataset’s complexity and the abundance of features in achieving robust model generalization and accurately identifying significant features. Therefore, when employing a classification task to identify brain regions or features which are the most involved in the discrimination of a neurological or neurodevelopmental disease, it is necessary to consider the validity of these findings.
Author Contributions
F.M. implemented, analyzed and interpreted the classification procedures and the feature importance and wrote the manuscript with input from all authors. P.O. contributed to the design and implementation of the research, to the analysis of the results and to the writing of the manuscript. A.R. was involved in planning and supervised the work. B.G. was involved in planning and supervised the work. All authors read and approved the final manuscript.
Funding
This research received no external funding.
Institutional Review Board Statement
Not applicable.
Informed Consent Statement
We used a public database, ABIDE. The ABIDE initiative declared: “This database was created through the aggregation of datasets independently collected across more than 24 international brain imaging laboratories and are being made available to investigators throughout the world, consistent with open science principles, such as those at the core of the International Neuroimaging Data-sharing Initiative. In accordance with HIPAA guidelines and 1000 Functional Connectomes Project / INDI protocols, all datasets have been anonymized, with no protected health information included.”
Data Availability Statement
The data used for this work can be found in the ABIDE site for download. We provided all the additional and necessary informations to interpret, replicate and build upon the findings reported in the manuscript.
Acknowledgments
Not applicable.
Conflicts of Interest
The authors declare no conflicts of interest.
Abbreviations
The following abbreviations are used in this manuscript:
| ABIDE | Autism Brain Imaging Data Exchange |
| ASD | Three letter acronym |
| AUC | Area Under the Curve |
| BOLD | Blood Oxygenation Level Dependent |
| CPAC | Configurable Pipeline for the Analysis of Connectomes |
| CV | Cross Validation |
| DL | Deep Learning |
| fMRI | Functional Magnetic Resonance Imaging |
| HO | Harvard Oxford |
| L-SVM | Support Vector Machine with Linear Kernel |
| ML | Machine Learning |
| MLP | Multi Layer Perceptron |
| PCA | Principal Component Analysis |
| PCs | Principal Components |
| RBF-SVM | Support Vector Machine with Gaussian Radial Basis Function |
| ROC | Receiver Operating Characteristic |
| ROI | Region of Interest |
| rs-fMRI | resting-state Functional Magnetic Resonance Imaging |
| SVM | Support Vector Machine |
| TabNet | Attentive Interpretable Tabular Learning |
| TD | Typically Developing |
| XAI | Explainable Artificial Intelligence |
| XGBoost | eXtreme Gradient Boosting |
References
- Isabelle, R.; Roberto F., T. Autism: Definition, Neurobiology, Screening, Diagnosis. Pediatric Clinics of North America 2008, 55, 1129–1146. [Google Scholar] [CrossRef]
- Baio, J.; Wiggins, L.; Christensen, D.; Meanner, M.; Daniels, J.; Warren, Z.; Kurzius-Spencer, M.; Zahorodny, W.; Robinson, C.; Rosenberg, T.; et al. Prevalence of Autism Spectrum Disorder Among Children Aged 8 Years- Autism and Developmental Disabilities Monitoring Network, 11 Sites, United States, 2014. MMWR Surveill Summ 2018, 67, 1–23. [Google Scholar] [CrossRef] [PubMed]
- Yarger, H.; Lee, L.C.; Kaufmann, C.; Zimmerman, A. Co-occurring Conditions and Change in Diagnosis in Autism Spectrum Disorders. Pediatrics 2012, 129, e305–16. [Google Scholar] [CrossRef]
- Falkmer, T.; Andeerson, K.; Falkmer, M.; Horlin, C. Diagnostic procedures in autism spectrum disorders: a systematic literature review. Eur Child Adolesc Psychiatry 2013, 22, 329–40. [Google Scholar] [CrossRef]
- Susan, E.L.; David S, M.; Robert T, S. Autism. Lancet 2009, 374, 1627–1638. [Google Scholar] [CrossRef]
- Gallagher, S.; Varela, F.J. Redrawing the Map and Resetting the Time: Phenomenology and the Cognitive Sciences. Canadian Journal of Philosophy 2003, 33, 93–132. [Google Scholar] [CrossRef]
- Barbara, R.; Ugis, S.; Gunter, S.; Antonio M, P. Biomarkers in autism spectrum disorder: the old and the new. Psychopharmacology 2014, 231, 1201–1216. [Google Scholar] [CrossRef]
- Büyükoflaz, F.N.; Öztürk, A. Early autism diagnosis of children with machine learning algorithms. 2018 26th Signal Processing and Communications Applications Conference (SIU), 2018; pp. 1–4. [Google Scholar] [CrossRef]
- Yousefian, A.; Shayegh, F.; Maleki, Z. Detection of autism spectrum disorder using graph representation learning algorithms and deep neural network, based on fMRI signals. Frontiers in Systems Neuroscience 2023, 16. [Google Scholar] [CrossRef]
- Koutsouleris, N.; Borgwardt, S.; Meisenzahl, E.M.; Bottlender, R.; Möller, H.J.; Riecher-Rössler, A. Disease Prediction in the At-Risk Mental State for Psychosis Using Neuroanatomical Biomarkers: Results From the FePsy Study. Schizophrenia Bulletin 2011, 38, 1234–1246, [https://academic.oup.com/schizophreniabulletin/article-pdf/38/6/1234/16975211/sbr145.pdf]. [Google Scholar] [CrossRef]
- Ball, T.; Stein, M.; Ramsawh, H.; et al. . Single-Subject Anxiety Treatment Outcome Prediction using Functional Neuroimaging. Neuropsychopharmacol 2014. [Google Scholar] [CrossRef]
- Chen, T.; Chen, Y.; Yuan, M.; Gerstein, M.; Li, T.; Liang, H.; Froehlich, T.; Lu, L. The Development of a Practical Artificial Intelligence Tool for Diagnosing and Evaluating Autism Spectrum Disorder: Multicenter Study. JMIR Med Inform 2020. [Google Scholar] [CrossRef] [PubMed]
- Gao, J.; Chen, M.; Li, Y.; Gao, Y.; Li, Y.; Cai, S.; Wang, J. Multisite Autism Spectrum Disorder Classification Using Convolutional Neural Network Classifier and Individual Morphological Brain Networks. Frontiers in Neuroscience 2021, 14. [Google Scholar] [CrossRef] [PubMed]
- Yang, X.; Islam, M.S.; Khaled, A.M.A. Functional connectivity magnetic resonance imaging classification of autism spectrum disorder using the multisite ABIDE dataset. 2019 IEEE EMBS International Conference on Biomedical and Health Informatics (BHI), 2019; pp. 1–4. [Google Scholar] [CrossRef]
- Jacob, D.; Ming-Wei, C.; Kenton, L.; Kristina, T. BERT: Pre-training of Deep Bidirectional Transformers for Language Understanding, 2019, [1810.04805].
- Kaiming, H.; Xiangyu, Z.; Shaoqing, R.; Jian, S. Deep Residual Learning for Image Recognition, 2015, [1512.03385].
- Marjane, K.; Afshin, S.; Delaram, S.; Navid, G.; Mahboobeh, J.; Parisa, M.; Ali, K.; Roohallah, A.; Assef, Z.; Yinan, K.; et al. Deep learning for neuroimaging-based diagnosis and rehabilitation of Autism Spectrum Disorder: A review. Computers in Biology and Medicine 2021, 139, 104949. [Google Scholar] [CrossRef]
- Yang, X.; Sarraf, S.; Zhang, N. Deep Learning-based framework for Autism functional MRI Image Classification. Journal of the Arkansas Academy of Science 2018. [Google Scholar] [CrossRef]
- Shwartz-Ziv, R.; Tishby, N. Opening the Black Box of Deep Neural Networks via Information, 2017, [1703.00810].
- http://preprocessed-connectomes-project.org/abide/index.html.
- Configurable Pipeline for the Analysis of Connectomes. Accessed 10 March 2024.
- Yang, X.; Schrader, P.T.; Zhang, N. A Deep Neural Network Study of the ABIDE Repository on Autism Spectrum Classification. International Journal of Advanced Computer Science and Applications 2020, 11. [Google Scholar] [CrossRef]
- Rachel, L.; Laura, H.; William, P.L.M. What Is the Male-to-Female Ratio in Autism Spectum Disorder? A Systematic Review and Meta-Analysis. Journal of the American Academy of Child and Adolescent Psychiatry 2017, 56, 466–474. [Google Scholar] [CrossRef]
- Ross, S.M. Introduzione alla statistica; Maggioli Editore, 2014.
- Chen, H.; Nomi, J.; Uddin, L.; Duan, X.; H. , C. Intrinsic functional connectivity variance and state-specific under-connectivity in autism. Hum Brain Mapp 2017, 38, 5740–55. [Google Scholar] [CrossRef] [PubMed]
- Atlases. Accessed 30 April 2024.
- NeuroHarmonize. Accessed 4 March 2024.
- Pomponio, R.; Erus, G.; Habes, M.; Doshi, J.; Srinivasan, D.; Mamourian, E.; Bashyam, V.; Nasrallah, I.M.; Satterthwaite, T.D.; Fan, Y.; et al. Harmonization of large MRI datasets for the analysis of brain imaging patterns throughout the lifespan. NeuroImage 2020, 208, 116450. [Google Scholar] [CrossRef] [PubMed]
- Johnson, W.E.; Li, C.; Rabinovic, A. Adjusting batch effects in microarray expression data using empirical Bayes methods. Biostatistics 2006, 8, 118–127. [Google Scholar] [CrossRef] [PubMed]
- Fortin, J.P.; Cullen, N.; Sheline, Y.I.; Taylor, W.D.; Aselcioglu, I.; Cook, P.A.; Adams, P.; Cooper, C.; Fava, M.; McGrath, P.J.; et al. Harmonization of cortical thickness measurements across scanners and sites. NeuroImage 2018, 167, 104–120. [Google Scholar] [CrossRef] [PubMed]
- Serra, G.; Mainas, F.; Golosio, B.; Retico, A.; Oliva, P. Effect of data harmonization of multicentric dataset in ASD/TD classification. Brain Inform. 2023. [Google Scholar] [CrossRef]
- Kassraian-Fard, P.; Matthis, C.; Balsters, J.H.; Maathuis, M.H.; Wenderoth, N. Promises, Pitfalls, and Basic Guidelines for Applying Machine Learning Classifiers to Psychiatric Imaging Data, with Autism as an Example. Frontiers in Psychiatry 2016, 7. [Google Scholar] [CrossRef] [PubMed]
- Shwartz-Ziv, R.; Armon, A. Tabular Data: Deep Learning is Not All You Need. arXiv 2021. [Google Scholar] [CrossRef]
- Arik, S.O.; Pfister, T. TabNet: Attentive Interpretable Tabular Learning, 2020, [1908.07442].
- Hossain, M.; Kabir, M.; Anwar, A.; et al. . Detecting autism spectrum disorder using machine learning techniques. Health Inf Sci Syst 2021. [Google Scholar] [CrossRef] [PubMed]
- sklearn svm. Accessed 14 March 2024.
- Pedregosa, F.; Varoquaux, G.; Gramfort, A.; Michel, V.; Thirion, B.; Grisel, O.; Blondel, M.; Prettenhofer, P.; Weiss, R.; Dubourg, V.; et al. Scikit-learn: Machine Learning in Python. Journal of Machine Learning Research 2011, 12, 2825–2830. [Google Scholar]
- xgboost. Accessed 14 March 2024.
- tabnet. Accessed 14 March 2024.
- MLPClassifier. Accessed 14 March 2024.
- Hanley, J.; Mcneil, B. The Meaning and Use of the Area Under a Receiver Operating Characteristic (ROC) Curve. Radiology 1982, 143, 29–36. [Google Scholar] [CrossRef] [PubMed]
- Metz, C.E. Receiver Operating Characteristic Analysis: A Tool for the Quantitative Evaluation of Observer Performance and Imaging Systems. Journal of the American College of Radiology 2006, 3, 413–422, Special Issue: Image Perception. [Google Scholar] [CrossRef] [PubMed]
- ELI5’s documentation: Permutation Importance. Accessed 15 April 2024, https://doi.org/https://eli5.readthedocs.io/en/latest/blackbox/permutation_importance.html.
- ELI5’s documentation. Accessed 15 April 2024, https://doi.org/https://eli5.readthedocs.io/en/latest/index.html.
- X. Yang, M.S.I.; Khaled, A.M.A. Functional connectivity magnetic resonance imaging classification of autism spectrum disorder using the multisite ABIDE dataset. IEEE EMBS International Conference on Biomedical and Health Informatics (BHI) 2019. [Google Scholar] [CrossRef]
- Plitt, M.; Barnes, K.A.; Martin, A. Functional connectivity classification of autism identifies highly predictive brain features but falls short of biomarker standards. NeuroImage: Clinical 2015, 7, 359–366. [Google Scholar] [CrossRef] [PubMed]
- Nielsen, J.; Zielinski, B.; Fletcher, P.; Alexander, A.; Lange, N.; Bigler, E.; Lainhart, J.; Anderson, J. Multisite functional connectivity MRI classification of autism: ABIDE results. Frontiers in Human Neuroscience 2013, 7. [Google Scholar] [CrossRef]
- M. M., M. Form sensation to cognition. Brain 1998, 121, 1013–1052. [Google Scholar] [CrossRef]
- Martínez, K.; Martínez-García, M.; Marcos-Vidal, L.; Janssen, J.; Castellanos, F.X.; Pretus, C.; Óscar Villarroya. ; Pina-Camacho, L.; Díaz-Caneja, C.M.; Parellada, M.; et al. Sensory-to-Cognitive Systems Integration Is Associated With Clinical Severity in Autism Spectrum Disorder. Journal of the American Academy of Child and Adolescent Psychiatry 2020, 59, 422–433. [Google Scholar] [CrossRef] [PubMed]
- Martineau, J.; Roux, S.; Garreau, B.; Adrien, J.; Lelord, G. Unimodal and crossmodal reactivity in autism: presence of auditory evoked responses and effect of the repetition of auditory stimuli. Biol Psychiatry. 1992. [Google Scholar] [CrossRef] [PubMed]
- d’Albis, M.A.; Guevara, P.; Guevara, M.; Laidi, C.; Boisgontier, J.; Sarrazin, S.; Duclap, D.; Delorme, R.; Bolognani, F.; Czech, C.; et al. Local structural connectivity is associated with social cognition in autism spectrum disorder. Brain 2018, 141, 3472–3481. [Google Scholar] [CrossRef]
- Maximo, J.O.; Kana, R.K. Aberrant “deep connectivity” in autism: A cortico–subcortical functional connectivity magnetic resonance imaging study. Autism Research 2019, 12, 384–400. [Google Scholar] [CrossRef]
- Neuroanatomia dell’autismo. Accessed 15th April 2024.
- Gotts, S.J.; Simmons, W.K.; Milbury, L.A.; Wallace, G.L.; Cox, R.W.; Martin, A. Fractionation of social brain circuits in autism spectrum disorders. Brain 2012, 135, 2711–2725. [Google Scholar] [CrossRef]
Figure 1.
Dataset composition. Sites without a prefix belong to the ABIDE I collection.
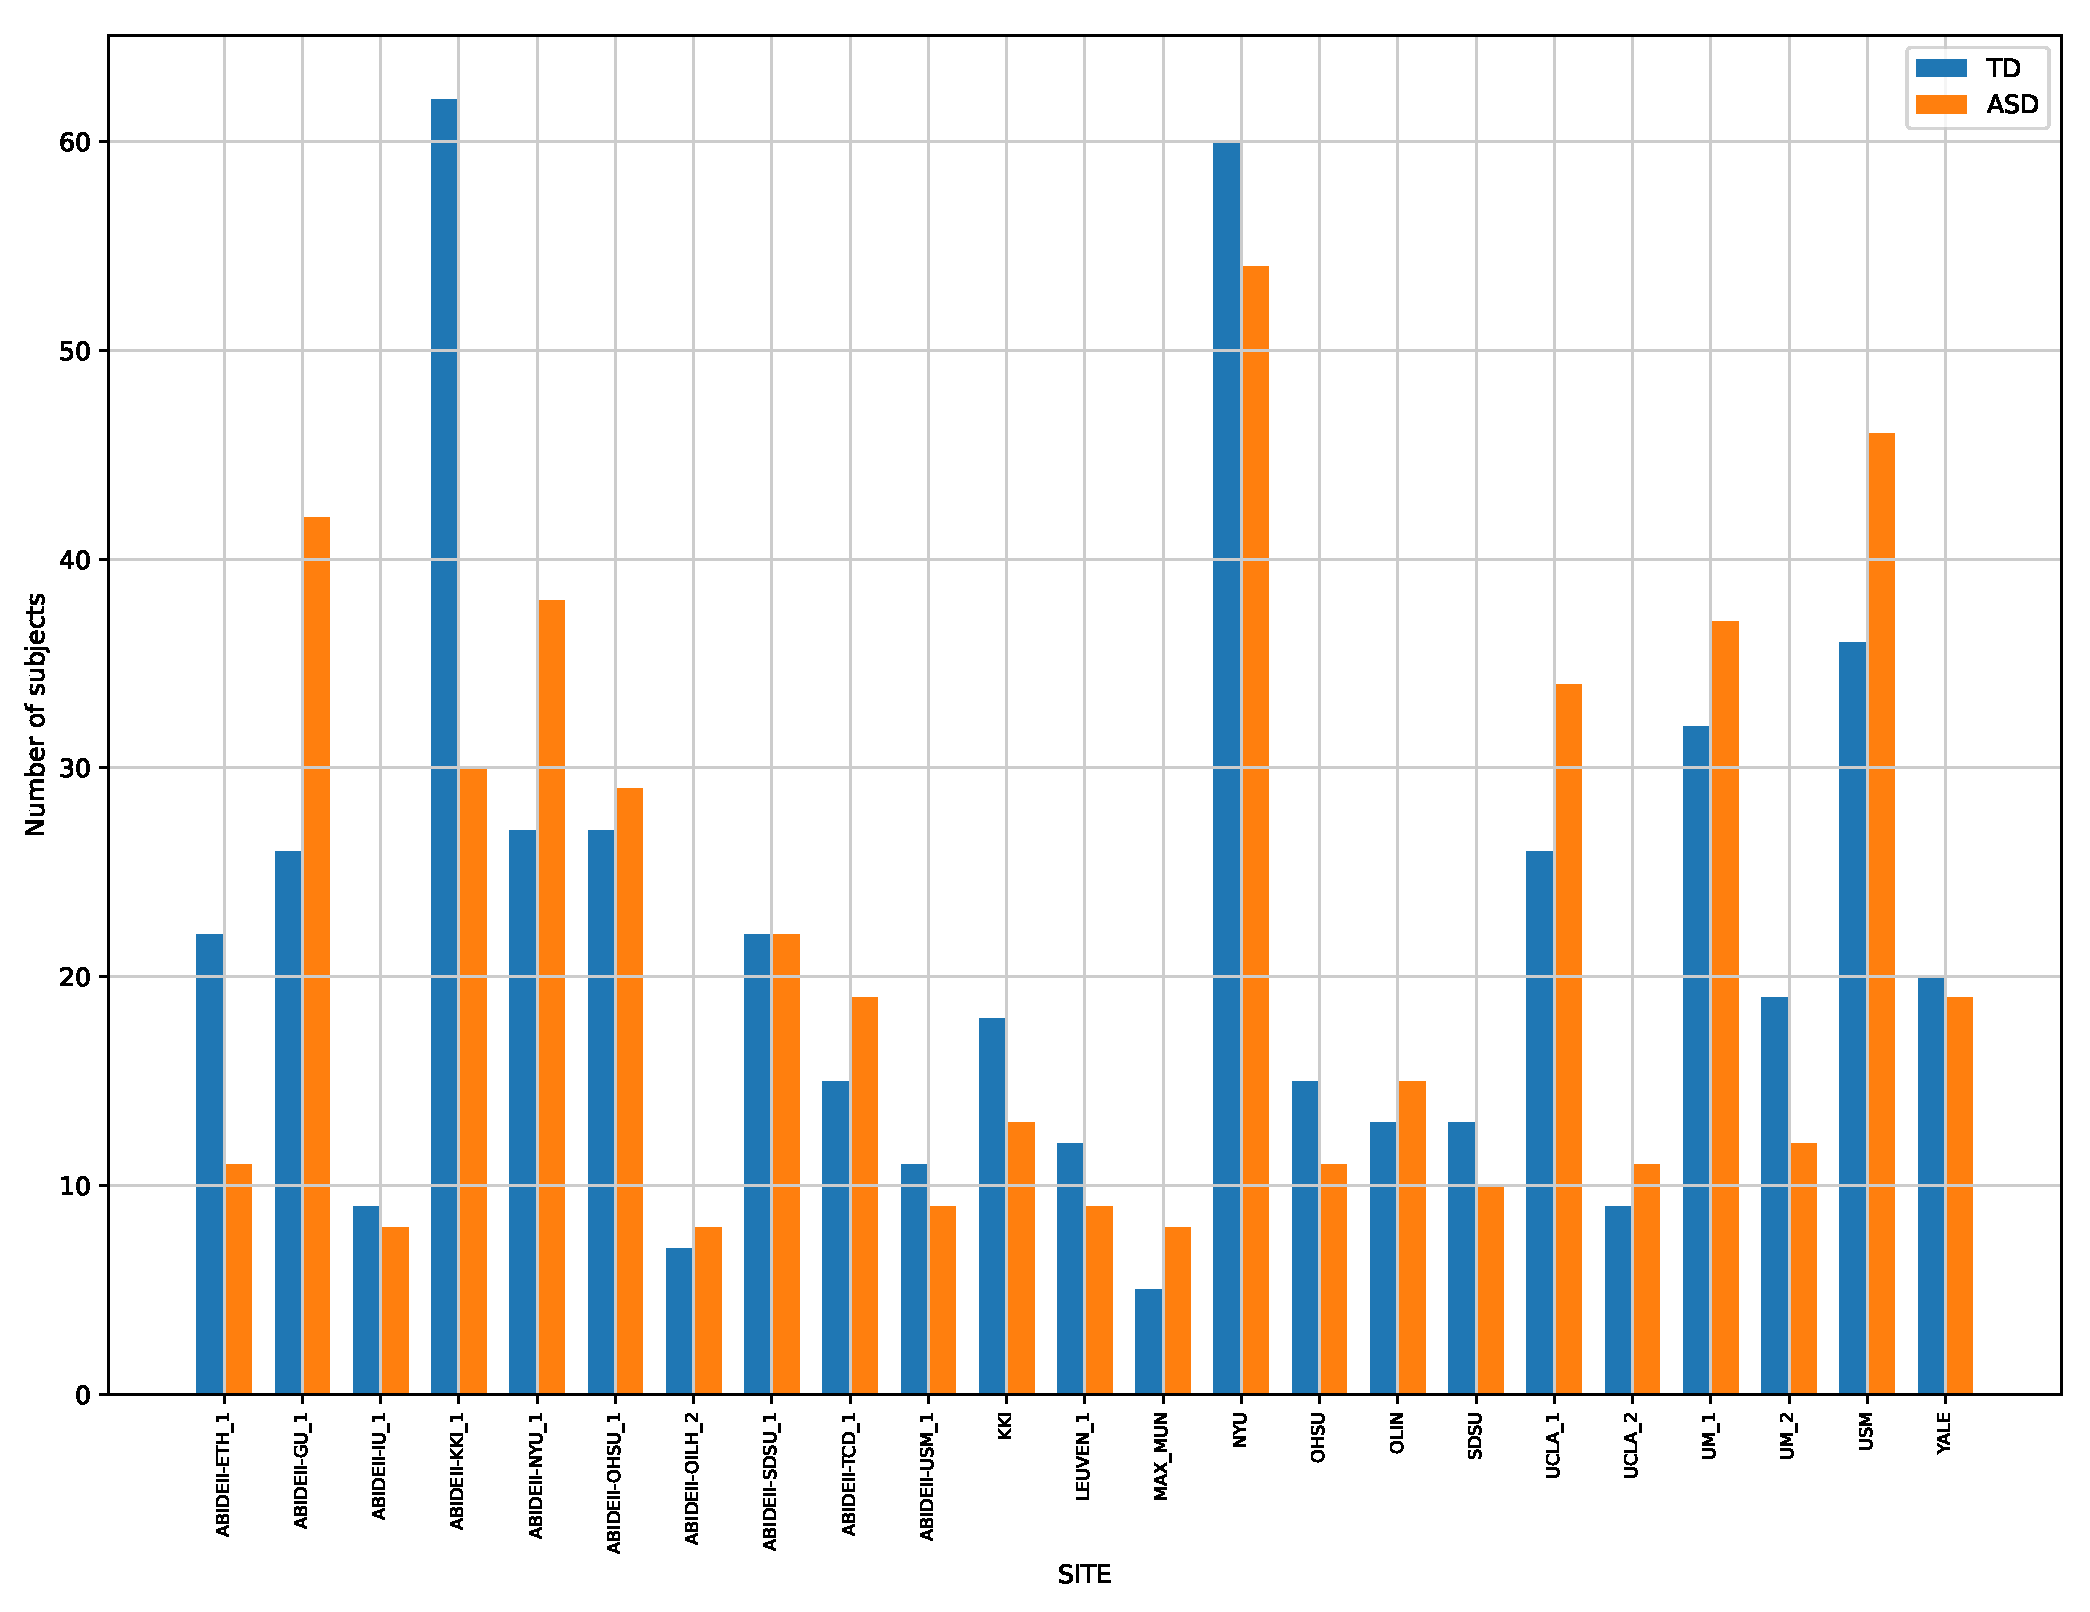
Figure 2.
The ASD and TD classification results are reported, for each classifier considered and for different values of PCs.
Figure 2.
The ASD and TD classification results are reported, for each classifier considered and for different values of PCs.
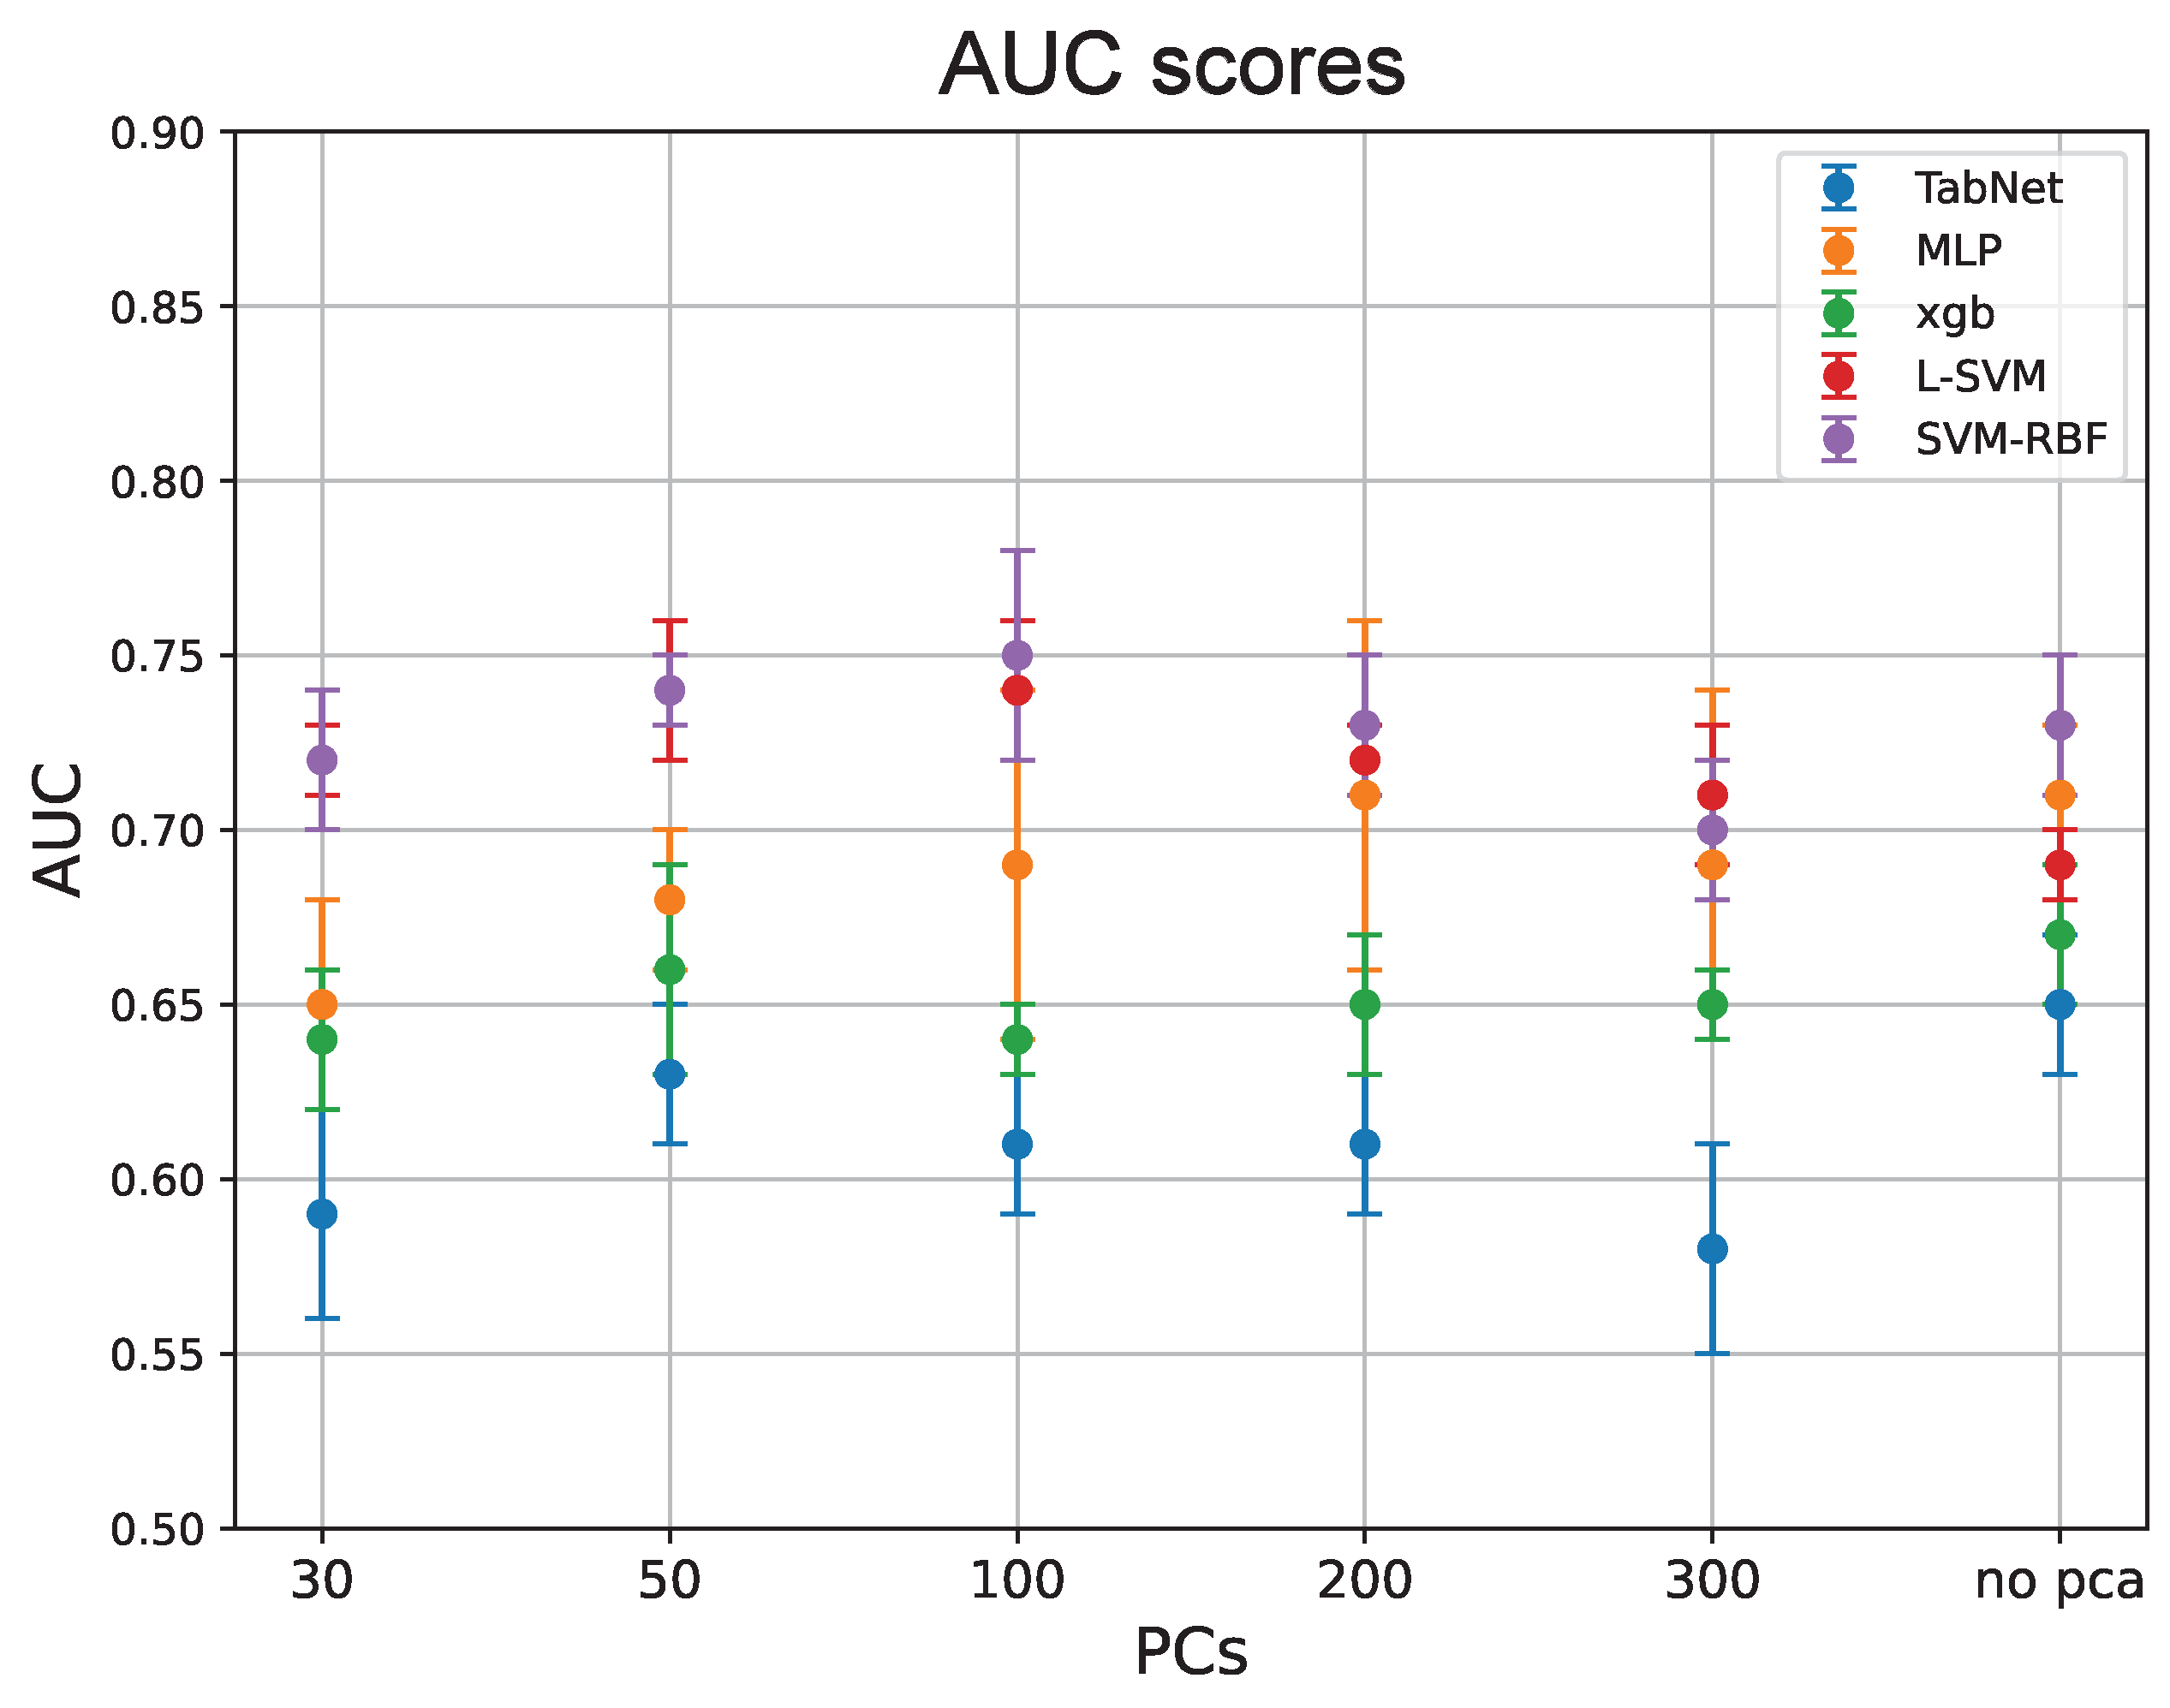

Table 1.
Best classification performances for each classifier.
| Classifier | AUC | # of PCs |
|---|---|---|
| MLP | 0.71±0.02 | no PCA |
| 0.71±0.05 | 200 PCs | |
| TabNet | 0.65±0.02 | no PCA |
| XGBoost | 0.67±0.02 | no PCA |
| L-SVM | 0.74±0.02 | 50 PCs |
| 0.74±0.05 | 100 PCs | |
| SVM-RBF | 0.75±0.03 | 100 PCs |
Table 2.
ROIs whose connectivity with other regions had the most significant effect on ASD/TD classification. The Occurrences column includes the number of times a ROI appears in the five classifiers, while the numbers in the ROI column represent the identifiers of the ROIs in the HO atlas. The Anatomical Part column lists the corresponding anatomical parts of the brain (according to HO parcellation), while the Mesulam column identifies the associated functional networks.
| Occurrences | ROI | Anatomical Part | Mesulam |
|---|---|---|---|
| 18 | 3102 | L-Precuneous Cortex | Heteromodal |
| 15 | 1002 | L-Superior Temporal Gyrus; posterior division | Unimodal |
| 15 | 501 | R-Inferior Frontal Gyrus; pars triangularis | Heteromodal |
| 14 | 1302 | L-Middle Temporal Gyrus; temporo-occipital | Heteromodal |
| 11 | 1101 | R-Middle Temporal Gyrus; anterior division | Heteromodal |
| 10 | 1301 | R-Middle Temporal Gyrus; temporo-occipital | Heteromodal |
| 8 | 4301 | R- Parietal Operculum Cortex | Unimodal |
| 8 | 3301 | R-Frontal Orbital Cortex | Paralimbic |
| 8 | 2702 | L-Subcallosal Cortex | Paralimbic |
| 8 | 1102 | L-Middle Temporal Gyrus; anterior division | Heteromodal |
| 7 | 3401 | R-Parahippocampal Gyrus; anterior division | Paralimbic |
| 7 | 2801 | R-Paracingulate Gyrus | Heteromodal |
| 7 | 2302 | L-Lateral Occipital Cortex; inferior division | Paralimbic |
| 7 | 1702 | L-Postcentral Gyrus | Primary |
| 6 | 2201 | R-Lateral Occipital Cortex; superior division | Unimodal |
| 6 | 401 | R-Middle Frontal Gyrus | Heteromodal |
| 5 | 4402 | L-Planum Polare | Unimodal |
Disclaimer/Publisher’s Note: The statements, opinions and data contained in all publications are solely those of the individual author(s) and contributor(s) and not of MDPI and/or the editor(s). MDPI and/or the editor(s) disclaim responsibility for any injury to people or property resulting from any ideas, methods, instructions or products referred to in the content. |
© 2024 by the authors. Licensee MDPI, Basel, Switzerland. This article is an open access article distributed under the terms and conditions of the Creative Commons Attribution (CC BY) license (https://creativecommons.org/licenses/by/4.0/).
Copyright: This open access article is published under a Creative Commons CC BY 4.0 license, which permit the free download, distribution, and reuse, provided that the author and preprint are cited in any reuse.


