

Submitted:
09 July 2024
Posted:
10 July 2024
You are already at the latest version
Abstract
This study investigates the environmental parameters contributing to the Urban Heat Island (UHI) effect in historically built environments, focusing on Matera's Street Canyon. The primary objective is to enhance understanding of heritage centers' ecological sustainability and management frameworks. The study involves two main phases: the initial research and development phase, including a comprehensive literature review and methodology development, followed by the empirical data gathering and analysis phase, utilizing advanced techniques such as 3D laser scanning, satellite imagery, and meteorological data integration. Key findings reveal significant correlations between urban morphology, material properties, and UHI intensity, suggesting stra-tegic urban planning interventions to mitigate UHI effects. This research provides actionable in-sights for urban planners and policymakers, emphasizing the importance of balancing heritage preservation with modern sustainability needs.
Keywords:
Urban Heat Islands (UHI)
; Matera
; Environmental Mitigation
; Historical Urban Planning
; Integrated Data Analysis
1. Introduction
Urban Heat Islands (UHI) are a significant environmental concern characterized by higher temperatures in urban areas than in rural areas. This phenomenon results from various factors, including the extensive use of impervious surfaces, high building density, and anthropogenic heat emissions. UHIs contribute to increased energy consumption, elevated air pollutants and greenhouse gas emissions, and impaired human health and comfort [1].
In historical urban environments such as Matera, a UNESCO World Heritage Site, the challenges associated with UHIs are compounded by the need to preserve architectural heritage while addressing modern urban sustainability issues [2]. Matera, with its distinctive urban morphology, narrow streets, densely built structures of calcarenite, and hypogean (underground) architecture, presents a unique case for studying UHI. The city's ancient urban fabric, with a complex system of underground dwellings and water cisterns, creates unique microclimatic conditions [3].
The primary objective of this study is to identify the environmental parameters that contribute to the UHI effect in historically built environments, focusing on Matera's Street Canyon. This research aims to enhance understanding of ecological sustainability and management frameworks in heritage centers by examining socio-territorial dynamics and their implications for environmental trade-offs. Focusing on ecological sustainability ensures that urban planning strategies are environmentally sound and resource-efficient, while socio-territorial dynamics guarantee that these strategies respect and benefit local communities, preserving their cultural heritage.
The research is structured into two main phases. The first phase thoroughly reviews existing literature, developing data collection and analysis methodologies, and initial experimentation. The second phase focuses on advanced data collection techniques, including 3D laser scanning, satellite imagery analysis, and integration of meteorological data, to provide a comprehensive view of the UHI phenomenon in Matera. This structure ensures a robust and comprehensive analysis, leading to actionable recommendations for urban planners and policymakers.
1.1. Objectives
The objectives of this study focus on identifying and analyzing the environmental parameters that contribute to the phenomenon of Urban Heat Islands (UHI) in historically built environments, with a particular focus on the city of Matera [4]. To address this challenge, the following specific objectives have been defined:
- Identification of Temporal Patterns: Temporal clustering analysis is used to identify periods with similar temperature and humidity characteristics. This objective seeks to understand the seasonal and diurnal variations of the UHI in Matera [5].
- Scenario Simulation: Employ the Random Forest regression model to simulate different scenarios, such as changes in vegetation (NDVI) or building materials (solar absorption coefficients), and predict their impact on the UHI. This analysis will assess the effectiveness of different mitigation strategies [6].
- Regulatory Impact Analysis: Evaluate how regulatory changes, such as building codes and green roof mandates, could influence environmental indices and urban temperatures. This will be done by simulating scenarios in which these regulations are applied, adjusting relevant variables such as NDVI and solar absorption coefficients [7].
- Identification of Dominant Factors: Determine the dominant factors influencing UHI intensity, including NDBI, NDSI, and interaction terms, to identify those elements that have the greatest impact on UHI prediction. This objective will help prioritize mitigation strategies based on the most influential factors [8].
These objectives are designed to comprehensively understand the mechanisms contributing to UHI in historical contexts and develop practical and effective mitigation strategies consistent with preserving Matera's cultural and architectural heritage.
2. Background
Urban Heat Islands (UHI) are a significant environmental concern in cities worldwide, characterized by higher temperatures in urban areas compared to their rural surroundings. This phenomenon results from various factors, including the extensive use of impervious surfaces, high building density, and anthropogenic heat emissions. The UHI effect is particularly pronounced in historical cities where the unique architectural and urban planning challenges intersect with modern environmental issues.
2.1. Historical Cities and UHI
Beijing, China Beijing's dense urban fabric and historical architecture intensify UHI challenges. Rapid urbanization and replacing green spaces with impervious surfaces contribute to elevated temperatures. Historical buildings often lack modern cooling systems, exacerbating heat retention. Urban planning in Beijing now focuses on integrating green roofs, increasing urban vegetation, and using reflective building materials to mitigate UHI effects [9].
Rome, Italy Rome experiences significant UHI effects, particularly in its ancient city center. The narrow streets, high-density buildings, and modern traffic and pollution increase temperatures. Enhancing urban greenery, increasing tree cover, and creating green corridors significantly reduce the UHI effect in Rome. Additionally, using lighter-colored building materials helps reflect more sunlight, lowering ambient temperatures [1].
Cairo, Egypt Cairo’s historical areas face severe UHI effects due to old, thermally massive buildings and a lack of vegetation. Increasing green spaces, implementing green roofs, and improving urban planning to enhance natural ventilation are suggested measures to mitigate UHI in Cairo. These strategies are crucial in a city where high temperatures can severely impact public health and energy consumption [1].
Istanbul, Turkey: Istanbul's historical peninsula is significantly affected by UHI. The dense network of streets and historic buildings, along with limited green spaces, leads to higher temperatures. Urban planning includes increasing parks and green roofs and preserving existing green spaces. Additionally, restoring historical buildings with materials that have better thermal properties can help reduce heat absorption [10].
2.2. Example Studies
- Beijing: Remote sensing data combined with GIS analysis to map and assess the spatial distribution of UHI and its relation to urban expansion and green space distribution [9].
- Rome: Use temperature sensors and urban morphology analysis to study the cooling effects of green corridors and reflective surfaces in reducing UHI in historical city centers [11].
- Cairo: Implement green roofs and increased vegetation, evaluated through remote sensing and ground-based temperature measurements, to mitigate the high UHI effects in densely built historical areas [1].
- Istanbul: Analysis of city layout and building design using 3D laser scanning and GIS to understand how different urban forms influence UHI, combined with strategies for increasing urban greenery [10].
These methodologies collectively contribute to a comprehensive understanding of UHI in historical cities and help develop effective strategies to mitigate its impacts while preserving cultural heritage.
2.3. Relevance to Matera
Matera, a UNESCO World Heritage Site, presents challenges similar to those other historical cities face. Its distinctive urban morphology, narrow streets, densely built structures of calcarenite, and hypogean (underground) architecture create unique microclimatic conditions. Studying UHI in Matera not only helps in understanding the specific environmental dynamics of this city but also contributes to the broader knowledge of how to manage UHI in other historical contexts [12].
By comparing Matera's situation with cities like Beijing, Rome, Cairo, and Istanbul, we can draw valuable lessons and apply proven strategies to mitigate UHI effects while preserving the unique cultural and architectural heritage. This background underscores the importance of tailored urban planning strategies that respect historical preservation while addressing modern sustainability challenges.
3. Materials and Methods
The research on Urban Heat Islands (UHI) in Matera is structured into two main phases, each designed to address specific objectives outlined in the introduction. The study aims to identify environmental parameters contributing to UHI and provide actionable insights for urban planners and policymakers.
3.1. Initial Research and Development Phase
3.1.1. Literature Review, [11]
Objective: To establish a theoretical foundation and identify gaps in research related to UHI in historical contexts. A thorough review of existing literature was conducted to understand the critical issues and opportunities within the scope of UHI in historical environments. This includes:
- 1)
- Analysis of studies on indoor comfort and urban infrastructure in the Sassi di Matera
- 2)
- Examination of the thermal properties of calcarenite and its impact on UHI
- 3)
- Review of methodologies used in previous UHI studies to inform the design of our research framework.
3.2. Empirical Data Gathering and Analysis Phase
The study's second phase focused on advanced data collection and analysis, building on the foundations established in the initial phase.
3.2.1. Topographic Surveys, [13]
Objective: To capture detailed models of Matera's urban canyons and analyze their impact on UHI intensity.
- Conducting topographic surveys using 3D laser scanning technology.
- Post-processing data to create detailed 3D models for analysis
3.2.2. Satellite Imagery Analysis, [14]
Objective: To analyze the spatial distribution of UHI and its correlation with urban features.
- Collecting satellite data from Sentinel, Landsat, and MODIS.
- Using indices like NDVI, NDBI, and NDSI to assess vegetation coverage and built-up areas.
3.2.3. Meteorological Data Integration, [15]
Objective: To understand local climatic conditions and their impact on UHI.
- Using sensors to collect real-time external and internal humidity and temperature data.
- Analyzing long-term meteorological data for trends and correlations with UHI.
3.2.4. Calcarenite analysis results: Solar absorption index, [16]
Objective: To assess the thermal properties of calcarenite and its role in UHI.
- Collaborating with the Laboratory of the Escuela Politécnica del Litoral (ESPOL) to analyze solar absorption coefficients.
3.2.5. Integration of Data and Modeling [17]
We used a random forest regression model to analyze the data and predict the effects of Urban Heat Islands (UHI) in Matera. This model allowed us to integrate multiple environmental and urban variables, identifying the dominant factors influencing external temperature.
Objective: To develop a comprehensive model to analyze and predict UHI effects.
Conceptual Breakdown of Random Forest Regression
- Multiple Decision Trees: The model consists of T decision trees. Each tree t makes a prediction ŷ for a given input x.
- Averaging Predictions: The final prediction ŷ is the average of the predictions from all T trees.
- Mathematical Representation: For a Random Forest model with T trees, the prediction for an input x can be represented as:
Where:
- ŷ is the final predicted value.
- T is the total number of trees in the Random Forest.
- ŷt(x) is the prediction of the t-th tree for the input x.
For data integration, a Random Forest Regression Model is proposed that integrates heterogeneous data: dynamic heterogeneous (external meteorology; internal temperature/humidity/pressure) and static heterogeneous (Calcarenite building material characteristics). The proposed analysis seeks to understand whether the solar absorption coefficient of Calcarenite and the environmental indices (NDBI/NDSI/NDVI) extracted by photogrammetric analysis condition the outdoor/indoor temperature in the city of Matera. Main characteristics will be extracted, a partial analysis will be carried out, and the behavior of the dataset variables about the feature variable will be visualized:
The Random Forest Regression model has been trained, and we have extracted the feature importances and visualized the partial dependence plots. (See Table S2). The following perspectives emerge from the analysis:
- a.
- Indoor Temperature Analysis: Feature Importances
- External Temperature: 63.8%
- External Humidity: 35.9%
- External Pressure: 0.24%
Figure 1.
Feature Importances For Indoor Temperature.
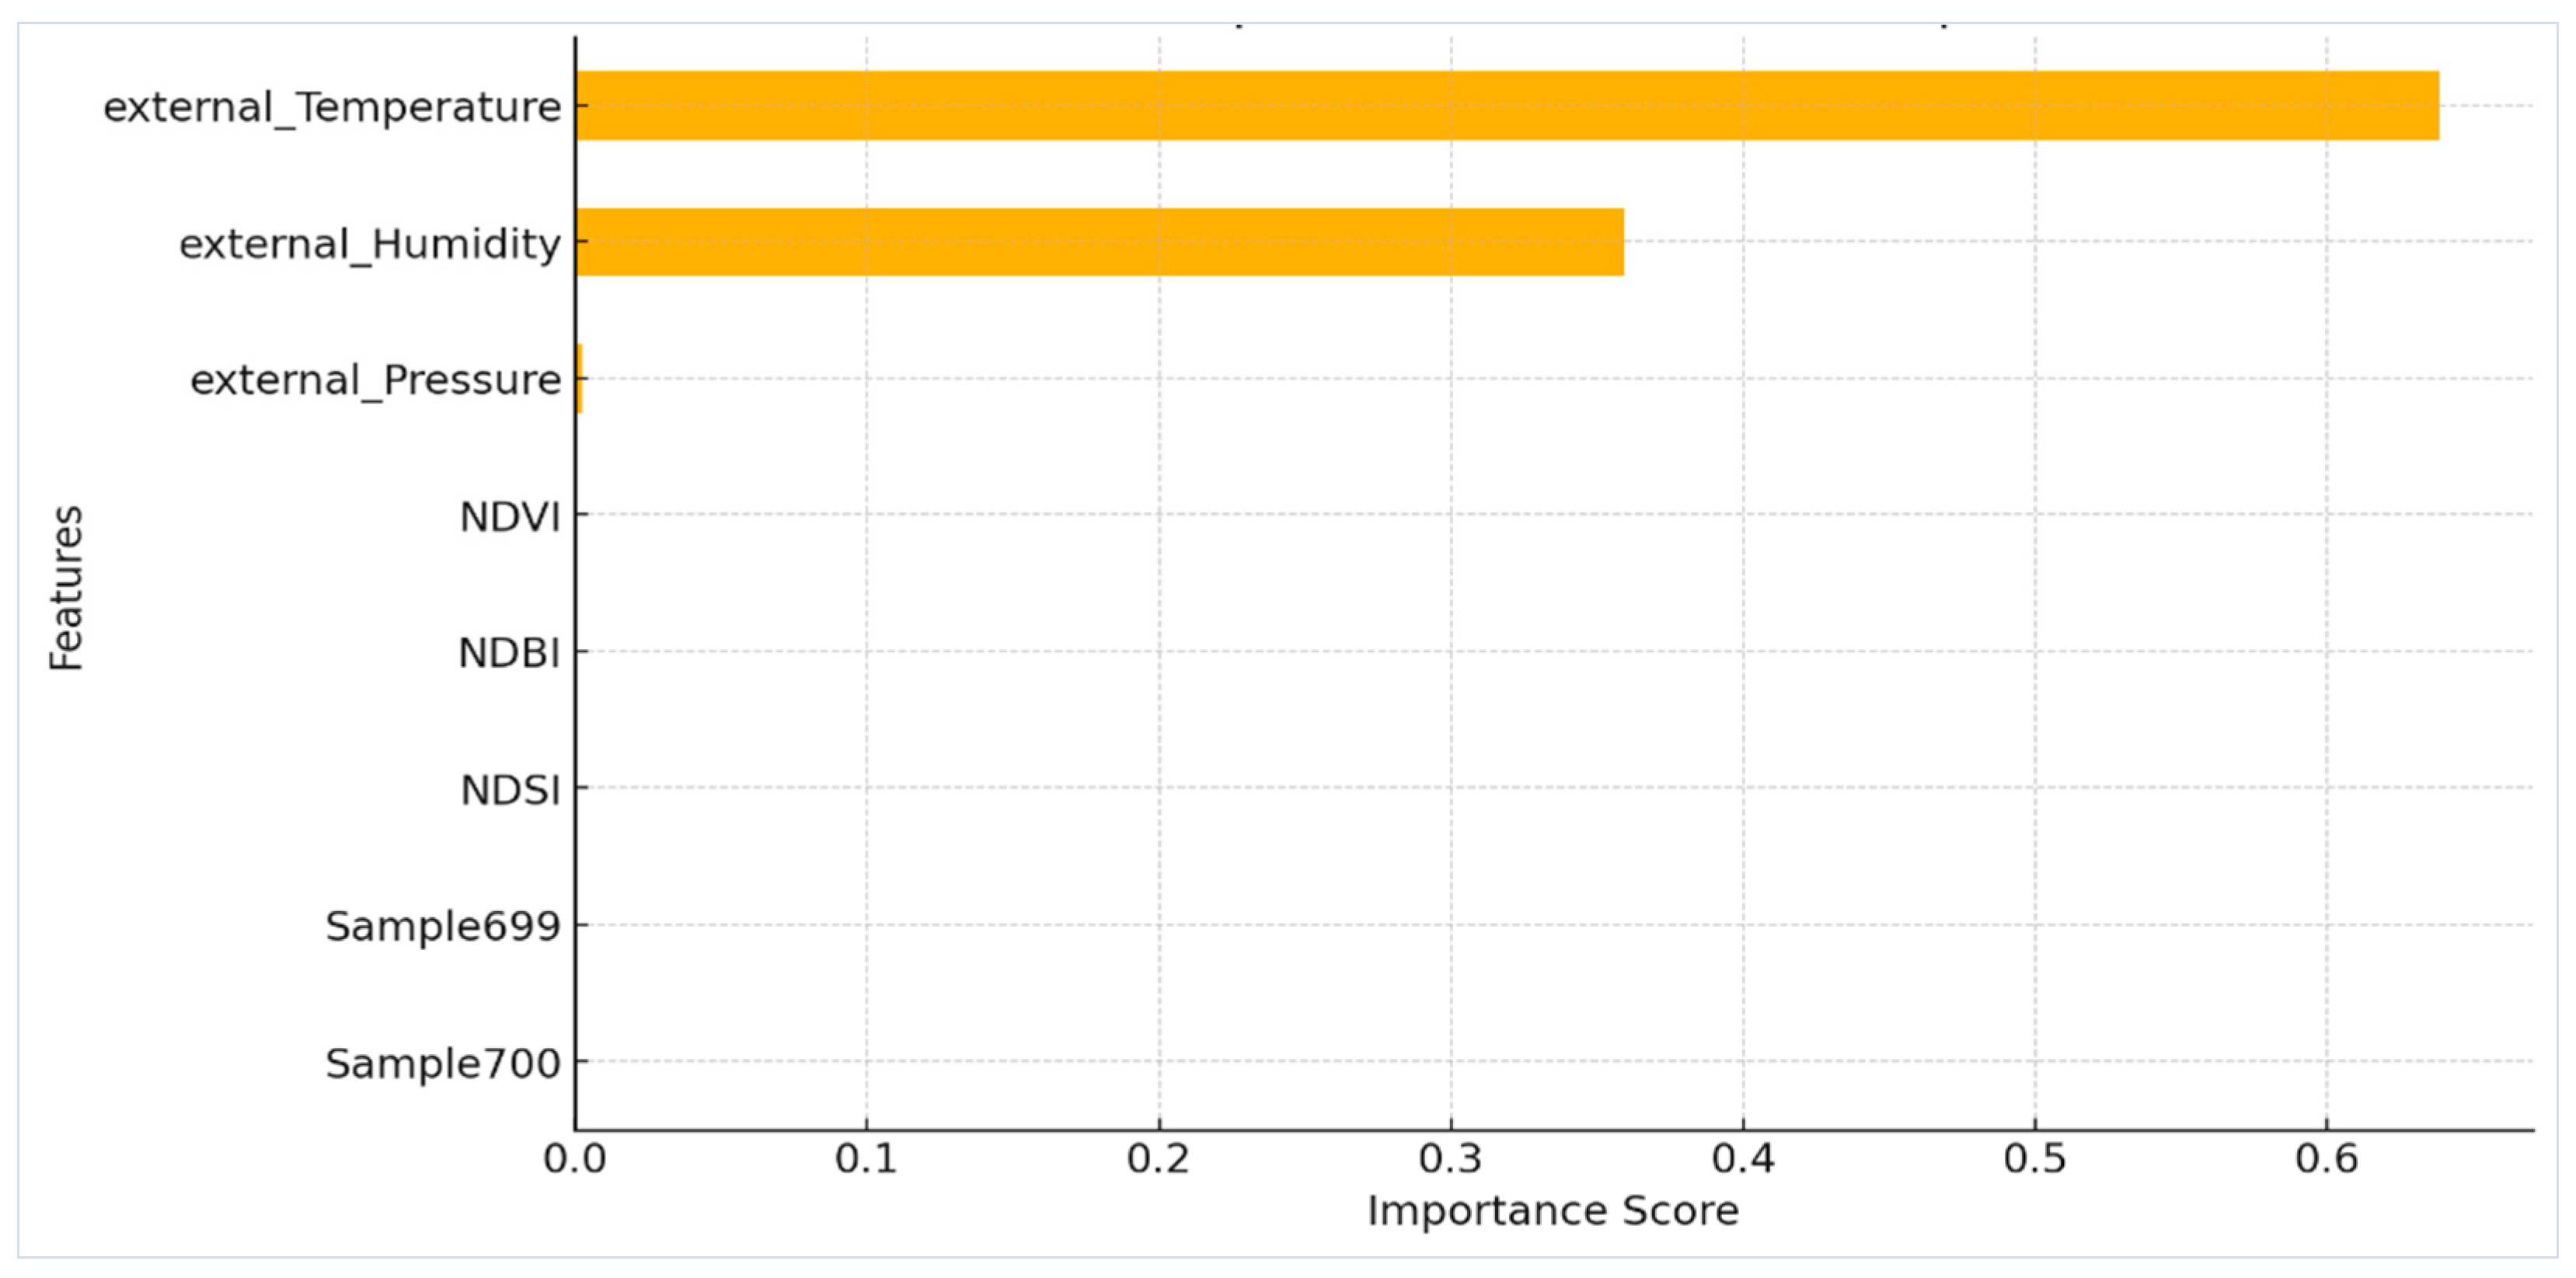
- The environmental indices (NDBI, NDSI, NDVI) and solar absorption coefficients (Sample699, Sample700) had negligible importance in predicting indoor temperature.
- b.
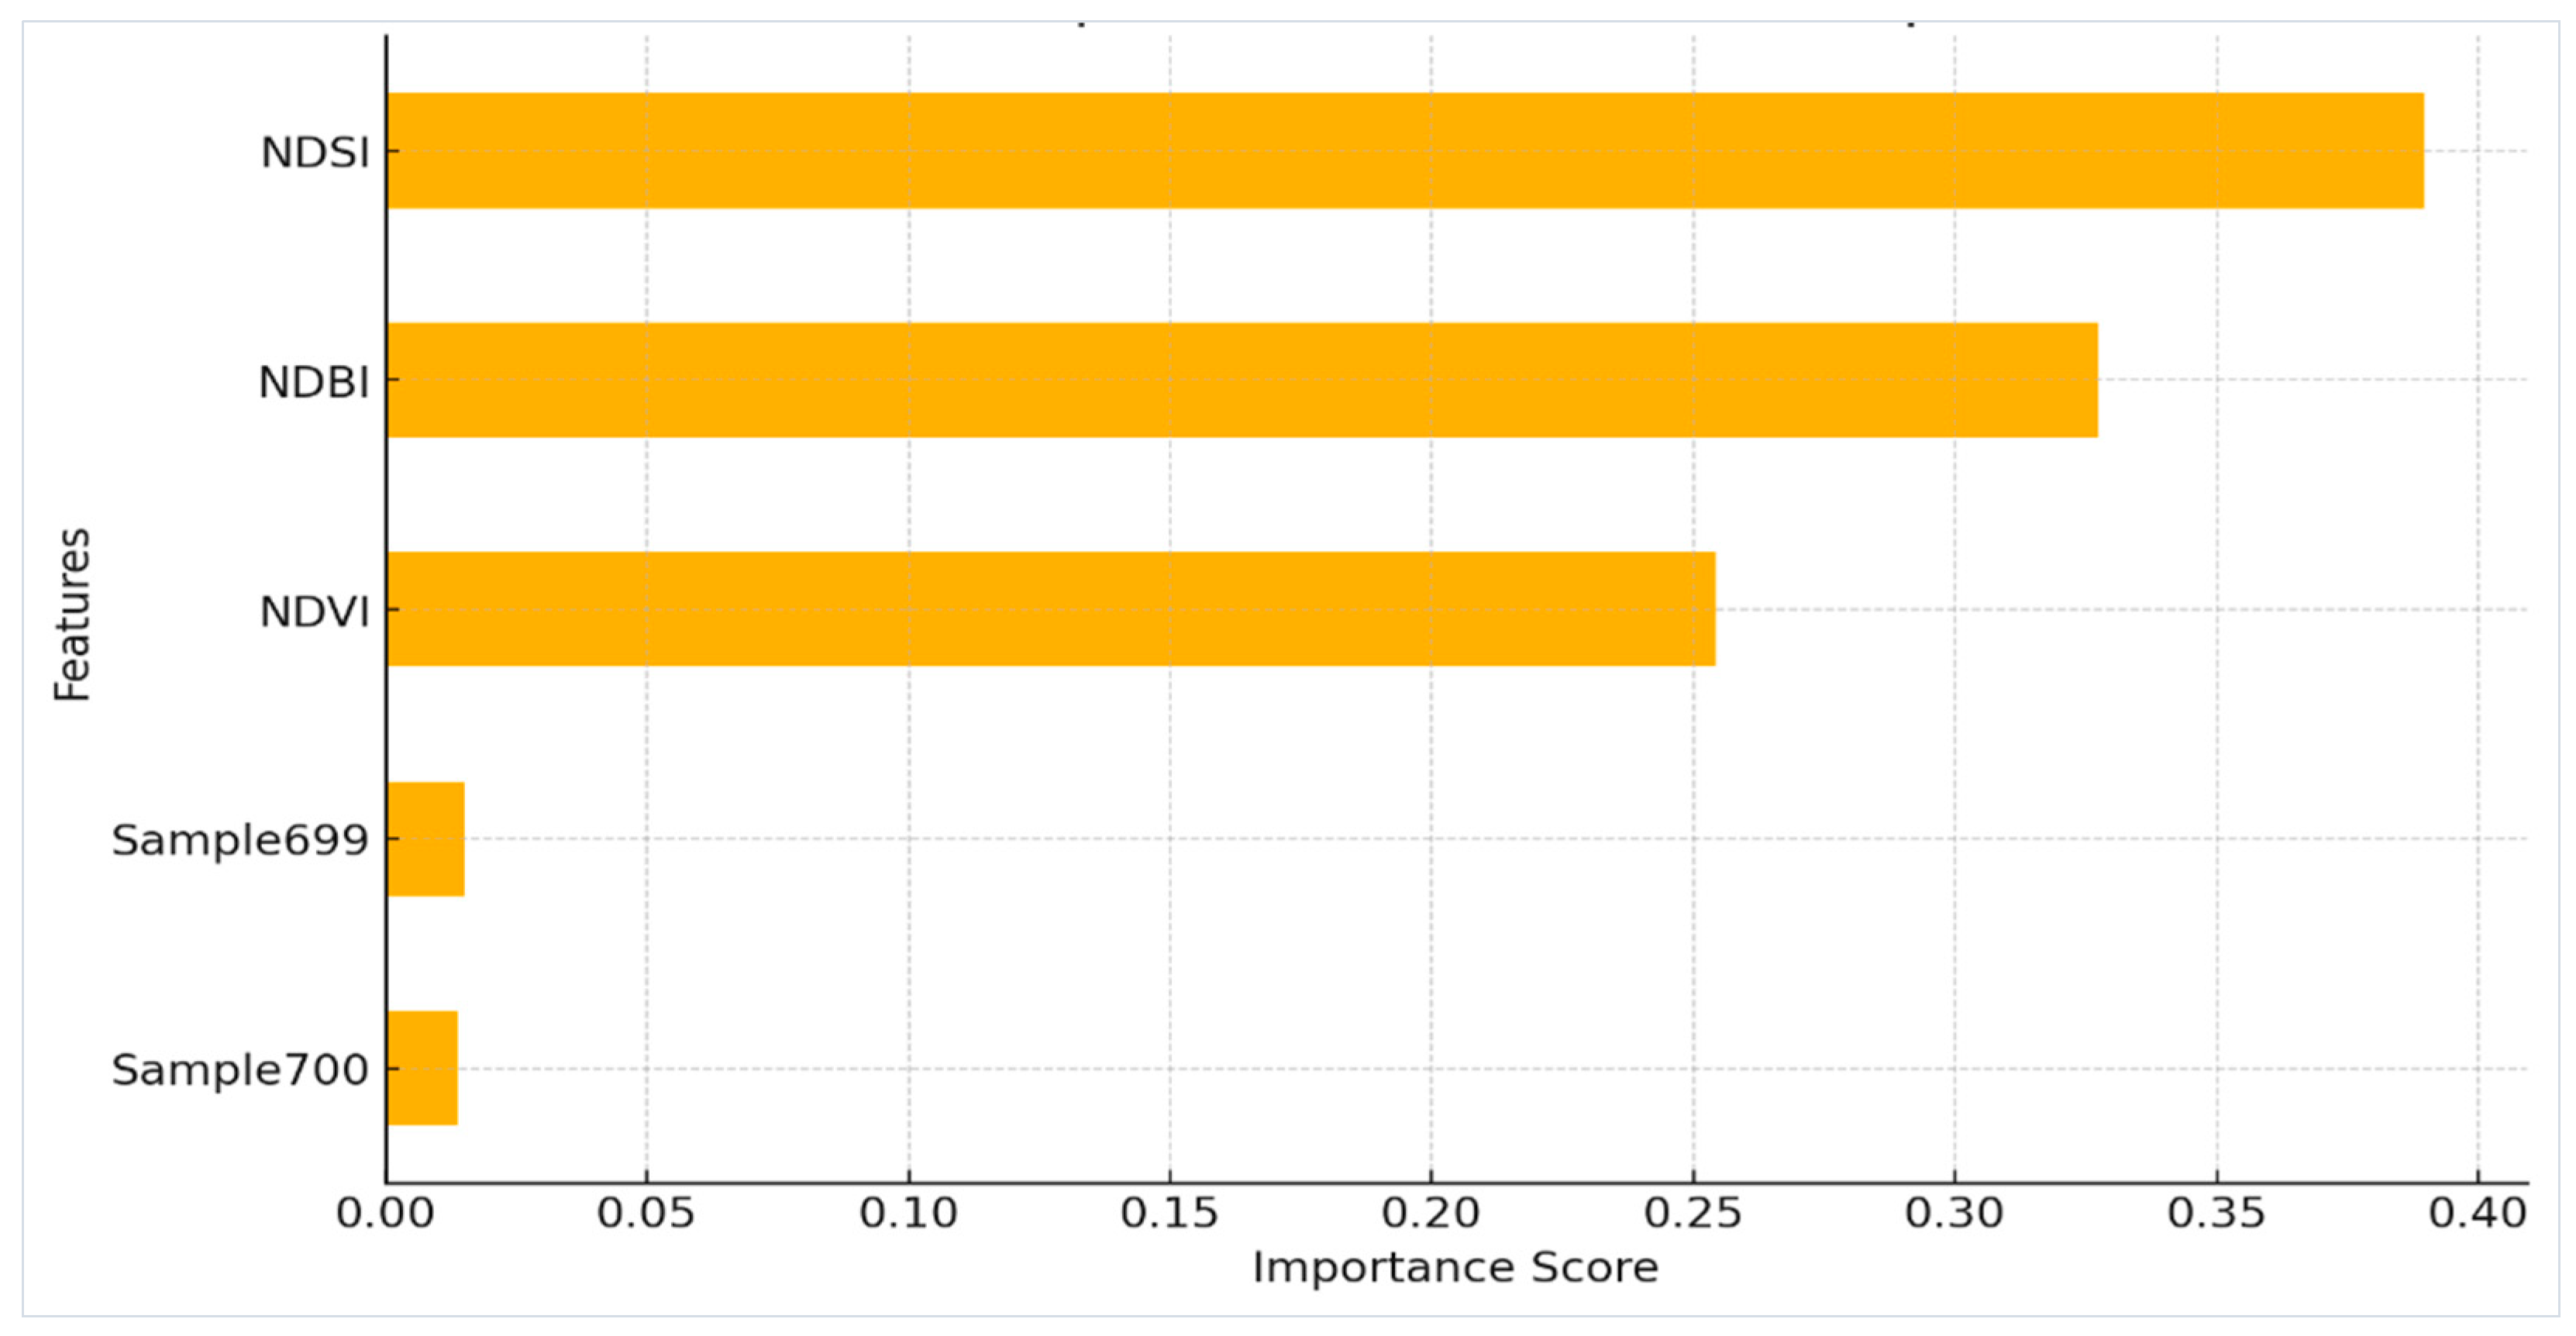
- External Temperature Analysis: Feature Importances (see Figure 2).
- NDSI: 38.9%
- NDBI: 32.7%
- NDVI: 25.4%
- Sample699: 1.5%
- Sample700: 1.4%
Figure 2.
Feature Importances For Indoor Temperature.
- c.
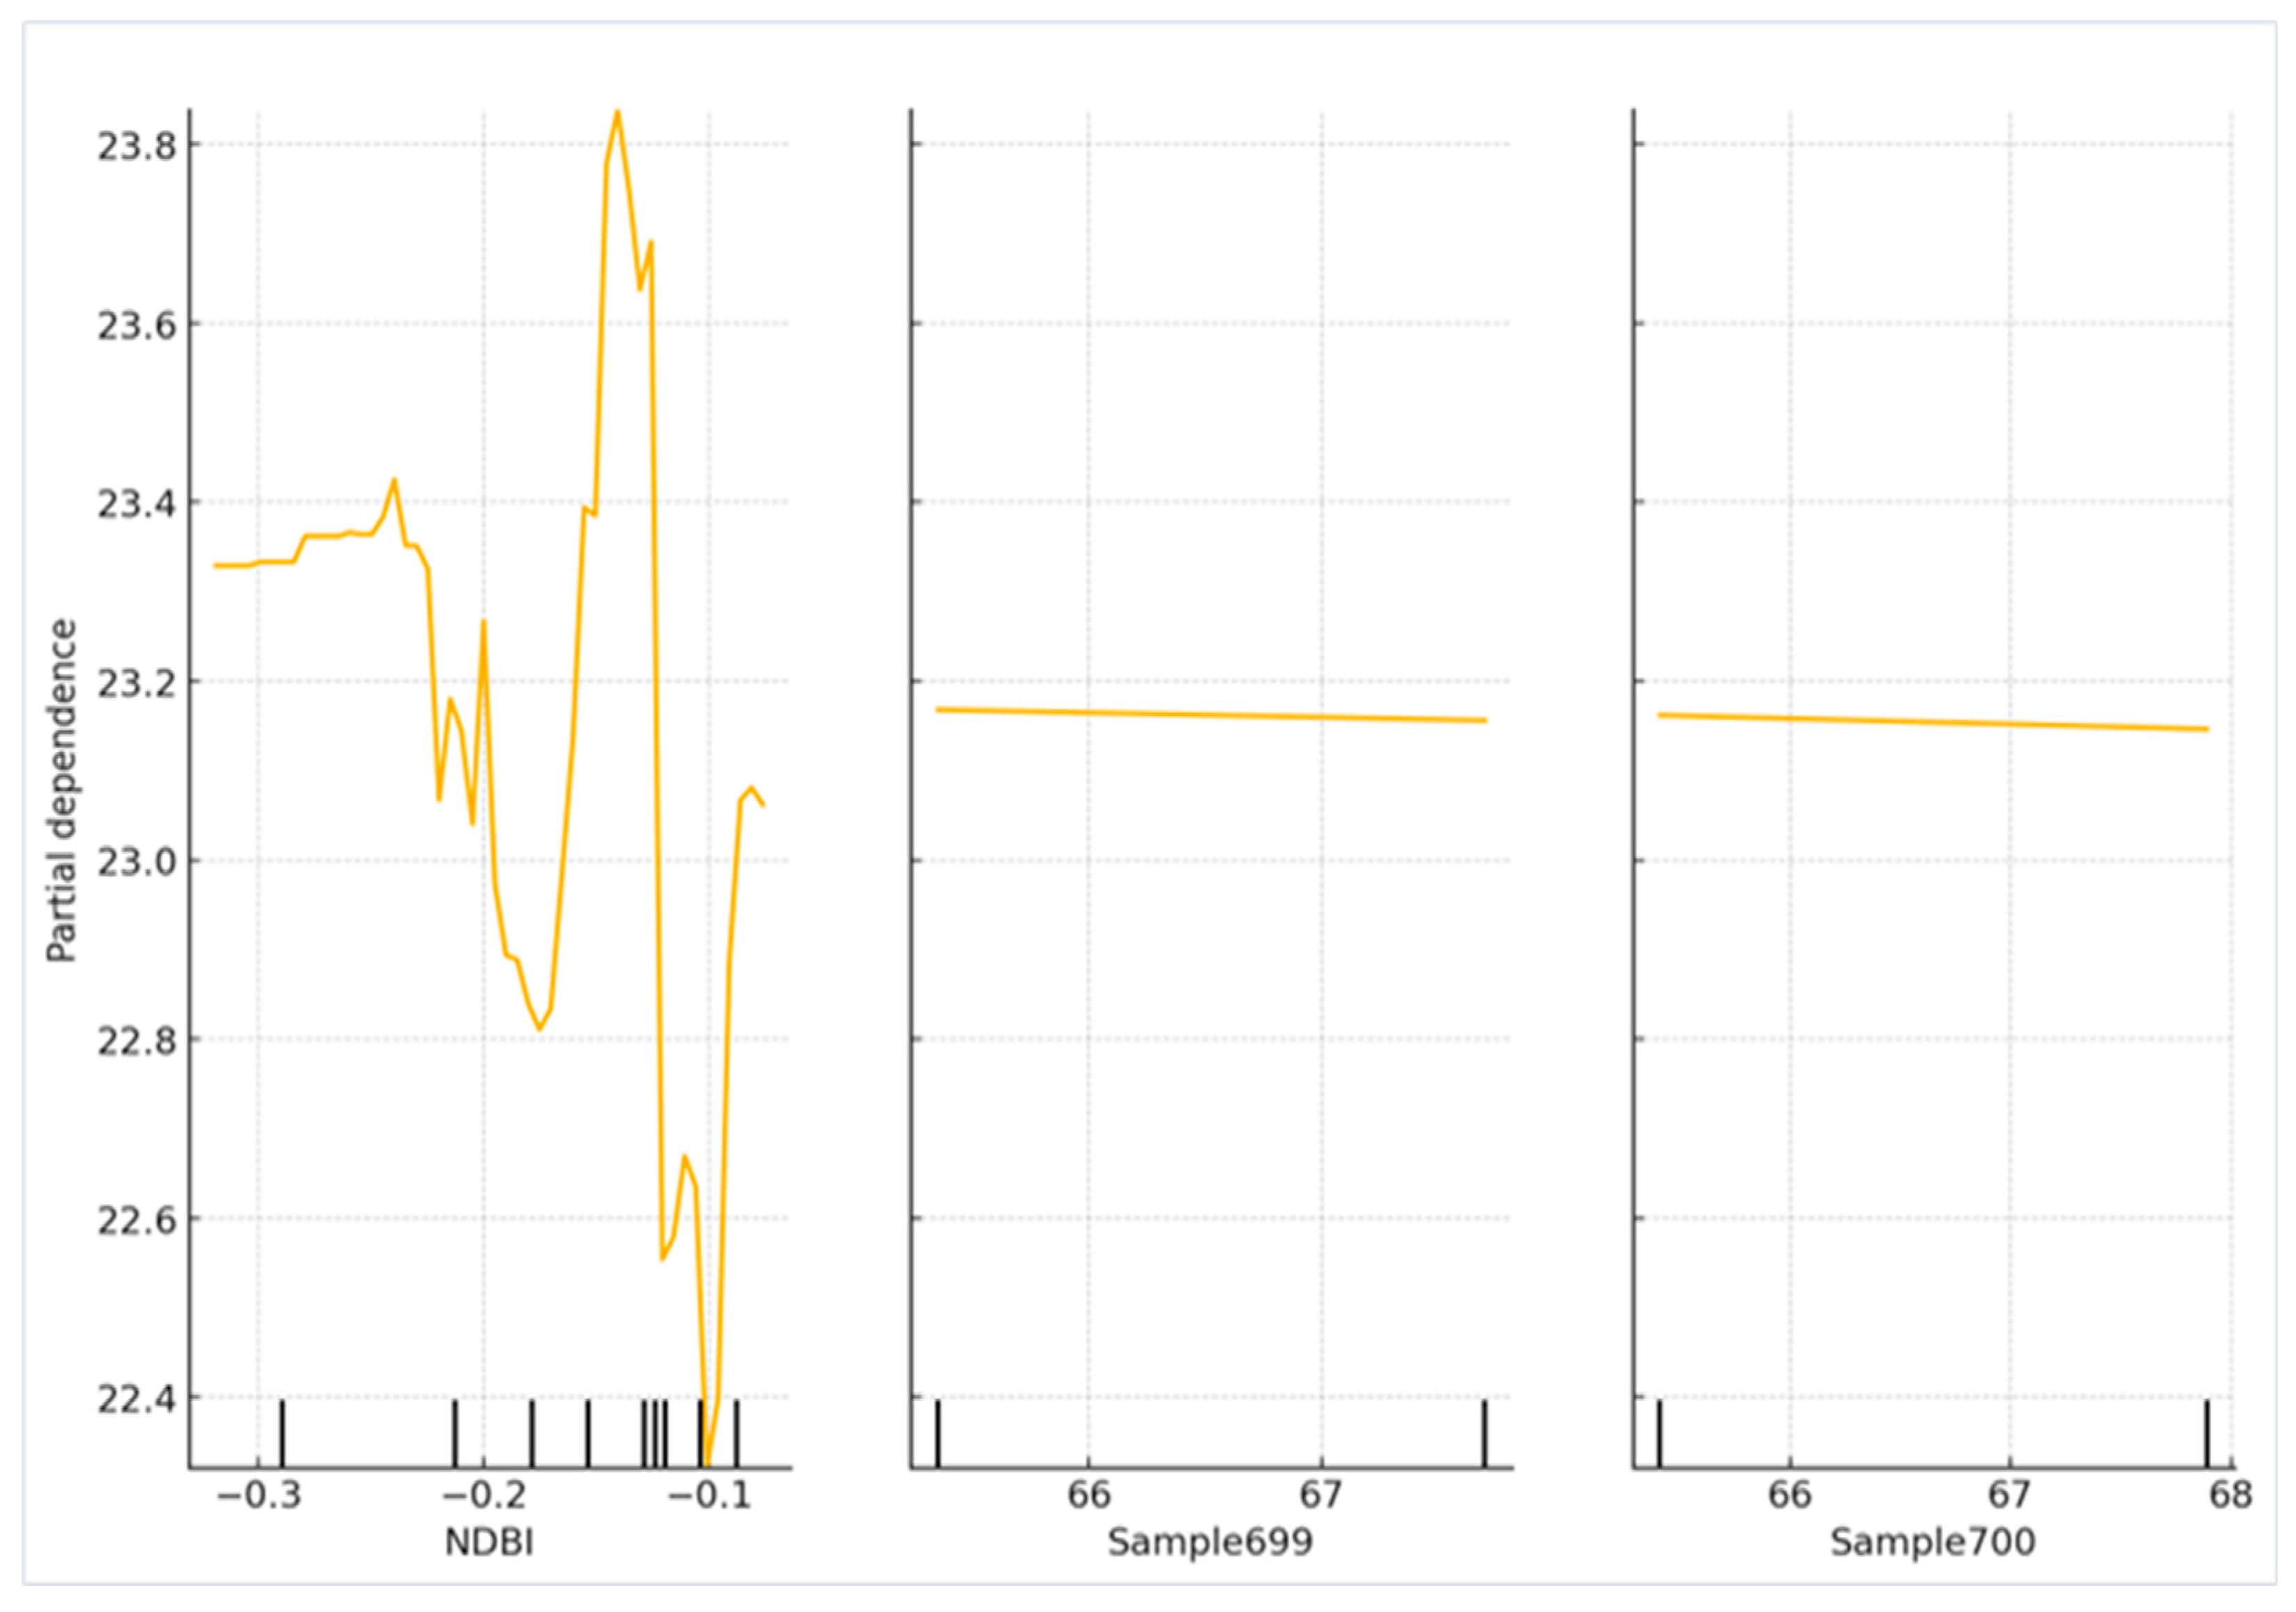
- Partial Dependence Plots:
- The partial dependence plots for the most important features in the external temperature analysis confirm that NDSI, NDBI, and NDVI significantly impact external temperature.
Figure 3.
Matplotlib Chart Partial dependence for external temperature.
These findings underscore the importance of considering external environmental conditions such as temperature and humidity in urban planning. While the solar absorption coefficients influence external temperature, their impact is relatively minor compared to the environmental indices. This insight can guide policymakers and urban planners in effectively formulating strategies to manage urban temperatures [18].
Based on the Random Forest Regressions Model, we will perform different analyses to understand the other variables' external and internal temperature behavior in the integrated database we built.
4. Results
4.1. Literature Review
4.1.1. Analysis of Studies on Indoor Comfort and Urban Infrastructure in the Sassi di Matera
Previous research has extensively examined Matera's hypogean structures' unique climatic and architectural characteristics, focusing on their influence on thermal comfort and UHI effects. With its network of cave dwellings and stone structures, the Sassi di Matera provides natural insulation that stabilizes indoor temperatures, reducing daily thermal oscillations typical of external environments. Studies have demonstrated that the high thermal mass of these structures, particularly the calcarenite stone, plays a crucial role in maintaining comfortable indoor climates. This balance between architectural design and natural materials helps mitigate the urban heat island effect by promoting passive cooling and reducing the need for artificial climate control [4,12].
4.1.2. Examination of the Thermal Properties of Calcarenite and Its Impact on UHI
The thermal properties of calcarenite, a common building material in Matera, significantly impact UHI dynamics. Calcarenite’s ability to absorb and slowly release heat stabilizes indoor temperatures but can exacerbate UHI effects by retaining heat in urban environments. Measurements and simulations have shown that this material's high thermal inertia allows it to act as a natural thermal regulator, providing cool indoor conditions during summer and retaining warmth during winter. However, the properties that benefit indoor climates can contribute to increased ambient temperatures in densely built urban areas, highlighting the need for balanced urban planning strategies incorporating vegetation and reflective materials to mitigate these effects [16,19,20]. Important Insights and Characteristics
- Natural Insulation of Hypogean Structures: The unique hypogean architecture of the Sassi di Matera provides natural insulation, stabilizing indoor temperatures without heavy reliance on artificial cooling.
- High Thermal Mass of Calcarenite: Calcarenite, Matera's primary building material, absorbs and releases heat slowly, stabilizing indoor temperatures but potentially worsening the Urban Heat Island (UHI) effect in dense areas.
- Impact on UHI Dynamics: The thermal properties of calcarenite and Matera's architecture affect UHI dynamics, maintaining indoor comfort but raising ambient temperatures, requiring balanced urban planning.
- Passive Cooling and Reduced Energy Demand: Matera's use of natural materials and traditional architecture supports passive cooling, reducing the need for artificial climate control and promoting sustainable building practices.
- Necessity for Integrated Urban Planning: Mitigating UHI effects requires urban planning incorporating vegetation and reflective materials to counteract calcarenite's heat retention and improve the urban microclimate.
4.1.3. Review of Methodologies Used in Previous UHI Studies to Inform the Design of Our Research Framework
Previous studies have employed various methodologies to effectively analyze Urban Heat Islands (UHI) in historical urban contexts. Remote sensing has been a pivotal tool, enabling researchers to collect extensive data on surface temperatures and environmental indices over large areas and periods. This method is often combined with Geographic Information System (GIS) analysis to map and assess the spatial distribution of UHI and its correlation with urban features such as green spaces, building materials, and land use patterns. Ground-based measurements complement remote sensing by providing detailed local data on temperature, humidity, and other relevant variables. These measurements are essential for validating remote sensing data and for conducting fine-scale analyses of microclimates within urban canyons and other specific sites. For instance, [21] highlights the integration of GIS with ground-based measurements to assess urban metabolism and its environmental impacts, which can be adapted for UHI studies. Numerical modeling and simulation are also crucial components of UHI research, enabling the prediction of future scenarios and evaluating potential mitigation strategies. Tools such as the Weather Research and Forecasting (WRF) model and the Comprehensive Air Quality Model with extensions (CAMx) have been used to simulate urban climate dynamics and assess the impact of various urban planning interventions.
The following theoretical descriptors were used to analyze the identified scientific literature: parameters, urban environments, and methodologies/methods. Initially, 61 papers were reviewed, from which 20 studies analyzing the UHI phenomenon in Street Canyons were selected.
Scatter Plot of Urban Settings, Methodologies, and Parameters (See Table: S1).
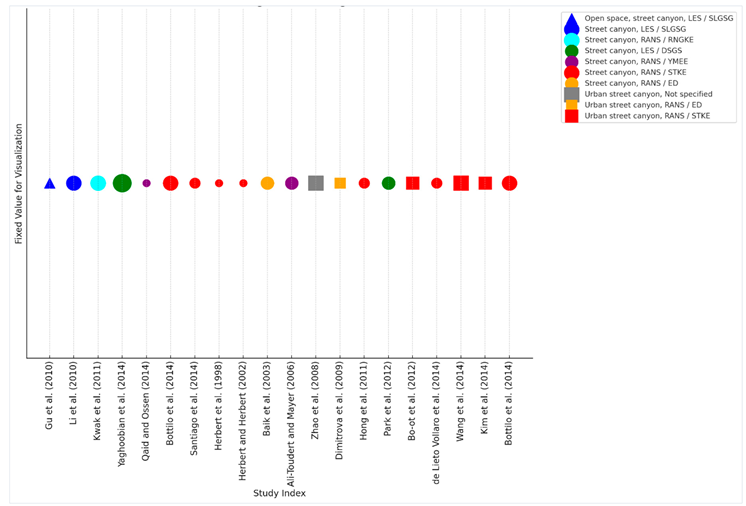
The scatter plot of urban settings, methodologies, and parameters provides a comprehensive overview of the relationships among these key aspects in Urban Heat Island (UHI) studies. The plot uses different marker shapes to represent various urban settings, such as street canyons, urban street canyons, and open space street canyons. Additionally, it employs distinct colors to indicate the methodologies and models utilized, including RANS/STKE, LES/SLGSG, LES/DSGS, and others. The size of each marker corresponds to the number of parameters considered in each study, highlighting the complexity of the analyses. This visualization reveals that "Street canyon" is the most common urban setting studied, with the RANS/STKE model being predominantly used, often incorporating multiple parameters. Other models, such as LES/SLGSG and RANS/ED, are visible but less frequently applied. This scatter plot effectively demonstrates the diversity of methodologies and the varying degrees of complexity in UHI research, providing valuable insights into the prevailing trends and focal points within the field.
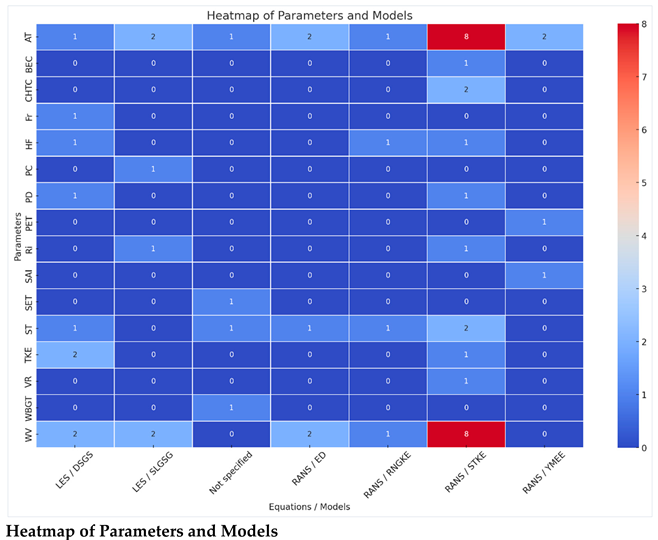
The heatmap visualizes the frequency and relationships between specific parameters (e.g., air temperature, wind velocity, surface temperature) and models used in Urban Heat Island (UHI) studies. Darker shades indicate higher frequencies, showing that the RANS/STKE model frequently uses parameters like air temperature, wind velocity, and surface temperature. This visualization highlights the predominant role of certain parameters across different modeling approaches, emphasizing trends and methodological preferences in UHI research.
The scatter plot and heatmap visualizations enhance our understanding of Urban Heat Island (UHI) effects in Matera, particularly within the Sassi di Matera. These tools highlight key parameters like air temperature and wind velocity, aiding our random forest regression model selection. The scatter plot reveals diverse urban settings, while the heatmap emphasizes important UHI parameters. This supports an integrated analysis using random forest regression to capture calcarenite's thermal dynamics, guiding passive cooling, reduced energy demand, and balanced urban planning with vegetation and reflective materials to mitigate UHI. The following sequence diagram outlines the methodology for implementing a random forest regression model to analyze the effects of urban heat islands (UHI) on Matera. The process begins with data collection and preparation, followed by feature selection and model training. This model allows you to identify the parameters contributing to the UHI effect. The final steps involve evaluating the model's performance and using it for predictions and analysis to gain insights into UHI phenomena. (See Methodology for Analyzing Urban Heat Island (UHI) Effects Using Random Forest Regression).
We have developed a revolutionary Random Forest Regression model in our pioneering efforts to comprehend and alleviate Matera's Urban Heat Island (UHI) effect. This model, which is the first of its kind in the field, integrates a wide range of dynamic and static data, including environmental indices such as NDBI (Normalized Difference Built-up Index), NDSI (Normalized Difference Snow Index), and NDVI (Normalized Difference Vegetation Index), along with solar absorption coefficients and meteorological variables (see Table S6).
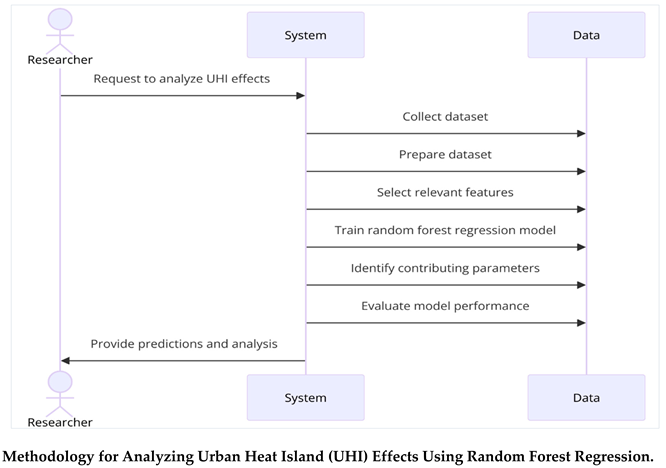
Our model uncovers the complex interactions and key factors influencing urban temperatures by harnessing advanced machine-learning techniques. This analysis provides practical insights and predictive capabilities that form the basis of effective urban planning strategies, with the ultimate aim of mitigating UHI effects and enhancing the livability of Matera. The following presentation outlines the methodology of this innovative analytical approach, its significant findings, and strategic recommendations.
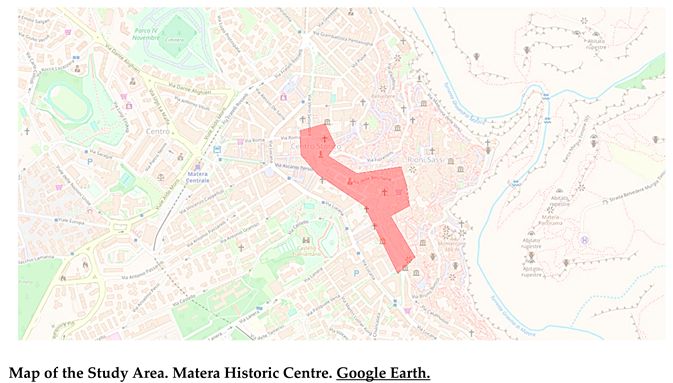
4.2. Temporal Clustering, [22]
Objective: To identify periods with similar temperature and humidity characteristics.
Inputs: Meteorological Data Integration:
- Temperature Data: According to Figure 4, the temperature behavior during the study period shows that high temperatures fluctuate without a clear trend, low temperatures are relatively stable with minor fluctuations, and average temperatures generally remain low to mid-20s °C with slight variations year to year.
- Humidity Data: Figure 5 indicates that high relative humidity consistently reaches or approaches 100% annually, low humidity displays notable fluctuations, and average humidity typically stays between 40-70%.
- Pressure Data: As shown in Figure 6, high pressure varies between 1015 to 1024 mbar, low pressure fluctuates more significantly, ranging from 998 to 1012 mbar, and average pressure remains around 1007 to 1016 mbar with some variations.
Internal Environmental Data:
The monitored home's Via Castelvecchio No. 6 data reveals internal microclimatic conditions influenced by layout and ventilation. Higher humidity is noted in the bathroom and entrance hall, while the bedroom benefits from thermal contributions from the rear wall.

Table 1.
Temperature, Relative Humidity, and Internal Pressure Data Summary (See Table S3).
Table 1.
Temperature, Relative Humidity, and Internal Pressure Data Summary (See Table S3).
| Year | Predicted Med Indoor Temperature (°C) | Predicted Med Indoor Relative Humidity (%) | Predicted Med Indoor Pressure (mbar) |
|---|---|---|---|
| 2021 | 22.34 | 56.28 | 1015.2 |
| 2020 | 19.48 | 66.17 | 1007.2 |
| 2019 | 22.17 | 59.25 | 1015.2 |
| 2018 | 22.17 | 57.65 | 1010.5 |
| 2017 | 23 | 47.44 | 1015.5 |
| 2016 | 21.37 | 67.13 | 1007.5 |
Source: Using sensors like ThermoPro and Sainlogic weather stations.
Outputs: Temporal clustering identified periods with similar temperature and humidity characteristics, revealing seasonal trends and periods of high UHI intensity.
Table 2.
Meteorological Data.
| external_Temperature | external_Humidity | cluster |
|---|---|---|
| 20 | 0.7 | 0 |
| 23.5 | 0.575 | 1 |
| 22 | 0.68 | 2 |
| 26 | 0.42 | 3 |
Source: Weather in giugno 2016 in Matera, Italy (timeanddate.com).
The temporal clustering analysis has identified four distinct clusters based on external temperature and humidity patterns. Here's a summary of the cluster characteristics:
Cluster Characteristics
- Cluster 0: Represents periods with a certain temperature and humidity range.
- Cluster 1: Represents periods with a different temperature and humidity range.
- Cluster 2: Represents periods with another distinct temperature and humidity range.
Cluster 3: Represents periods with another distinct temperature and humidity range.
Figure 8.
Temperature and Humidity Clusters.
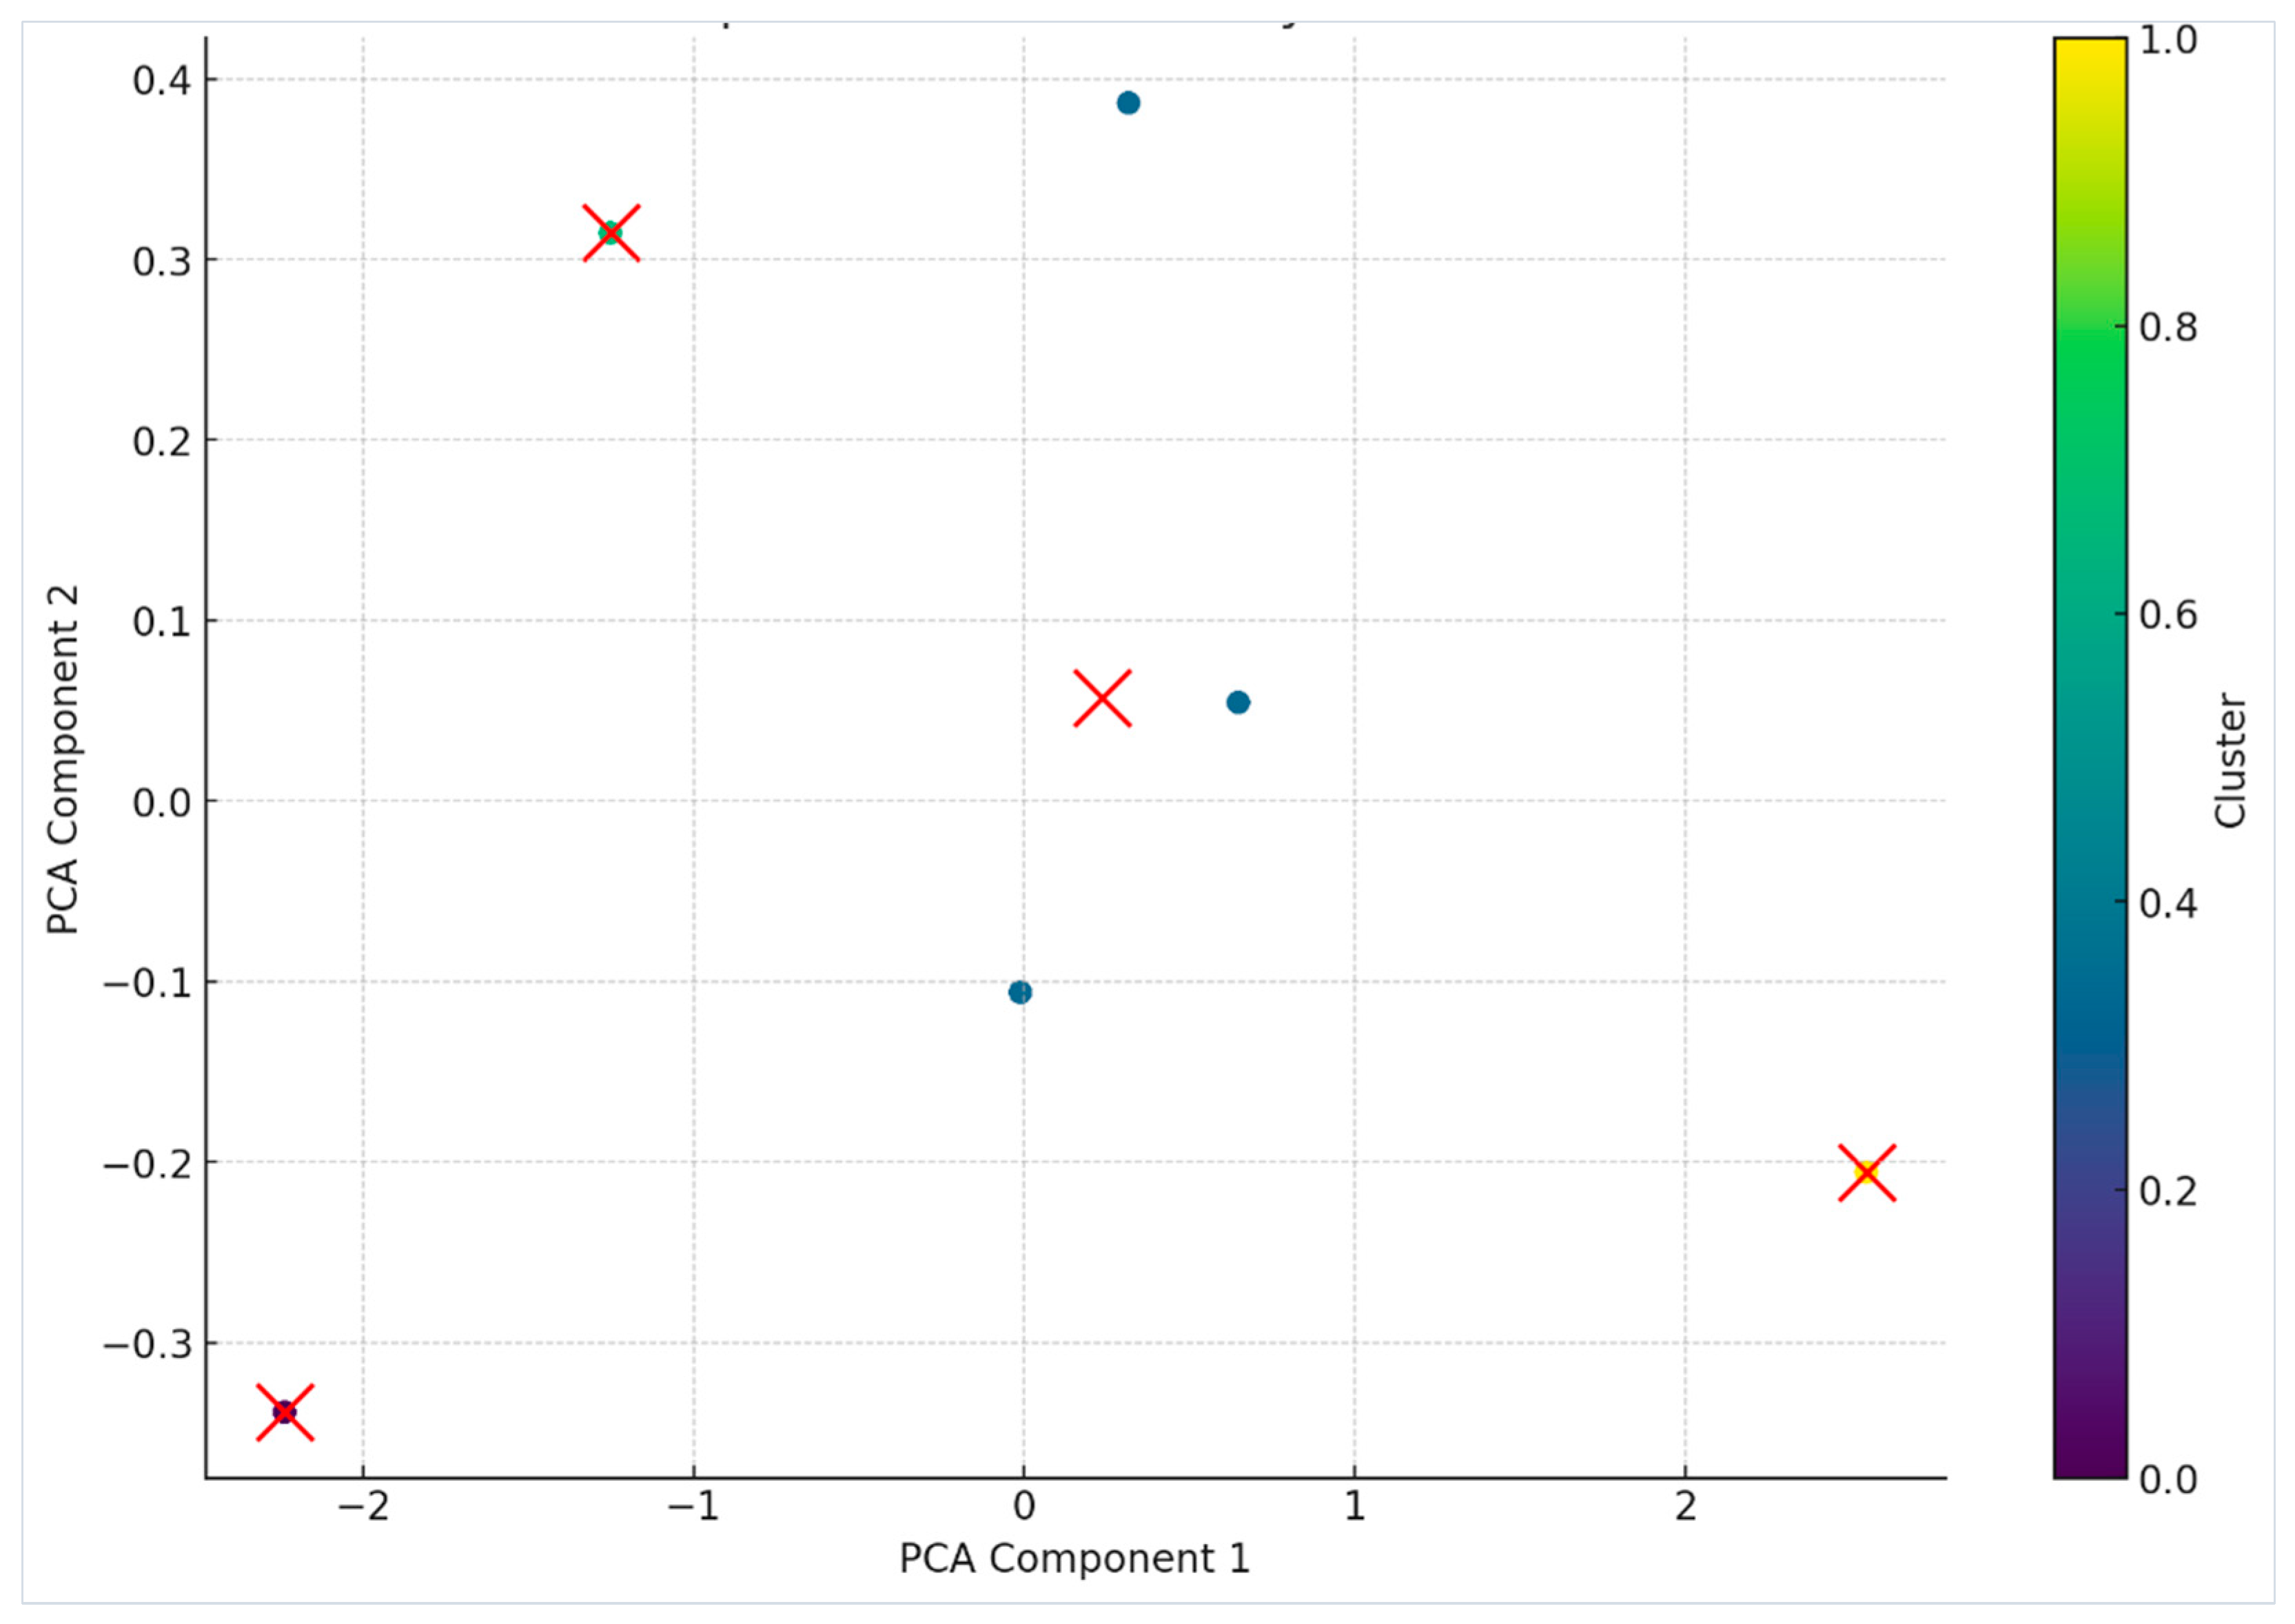
Each cluster captures unique temporal patterns in temperature and humidity, which can help identify periods with similar characteristics.
The scatter plot shows the clusters in a reduced dimension space (PCA components), with the centers of the clusters marked in red. This visualization helps to understand how the periods are grouped according to their temperature and humidity characteristics.
Results: The analysis highlighted specific seasonal patterns where UHI intensity peaked, particularly during summer. This temporal identification is critical for understanding the dynamic behavior of UHI over time and can guide the development of targeted mitigation strategies during periods of high intensity [23].
4.3. Scenario Simulation, [24,25]
Objective: To predict the impact of changes in vegetation (NDVI) and building materials (solar absorption coefficients) on UHI.
Inputs:
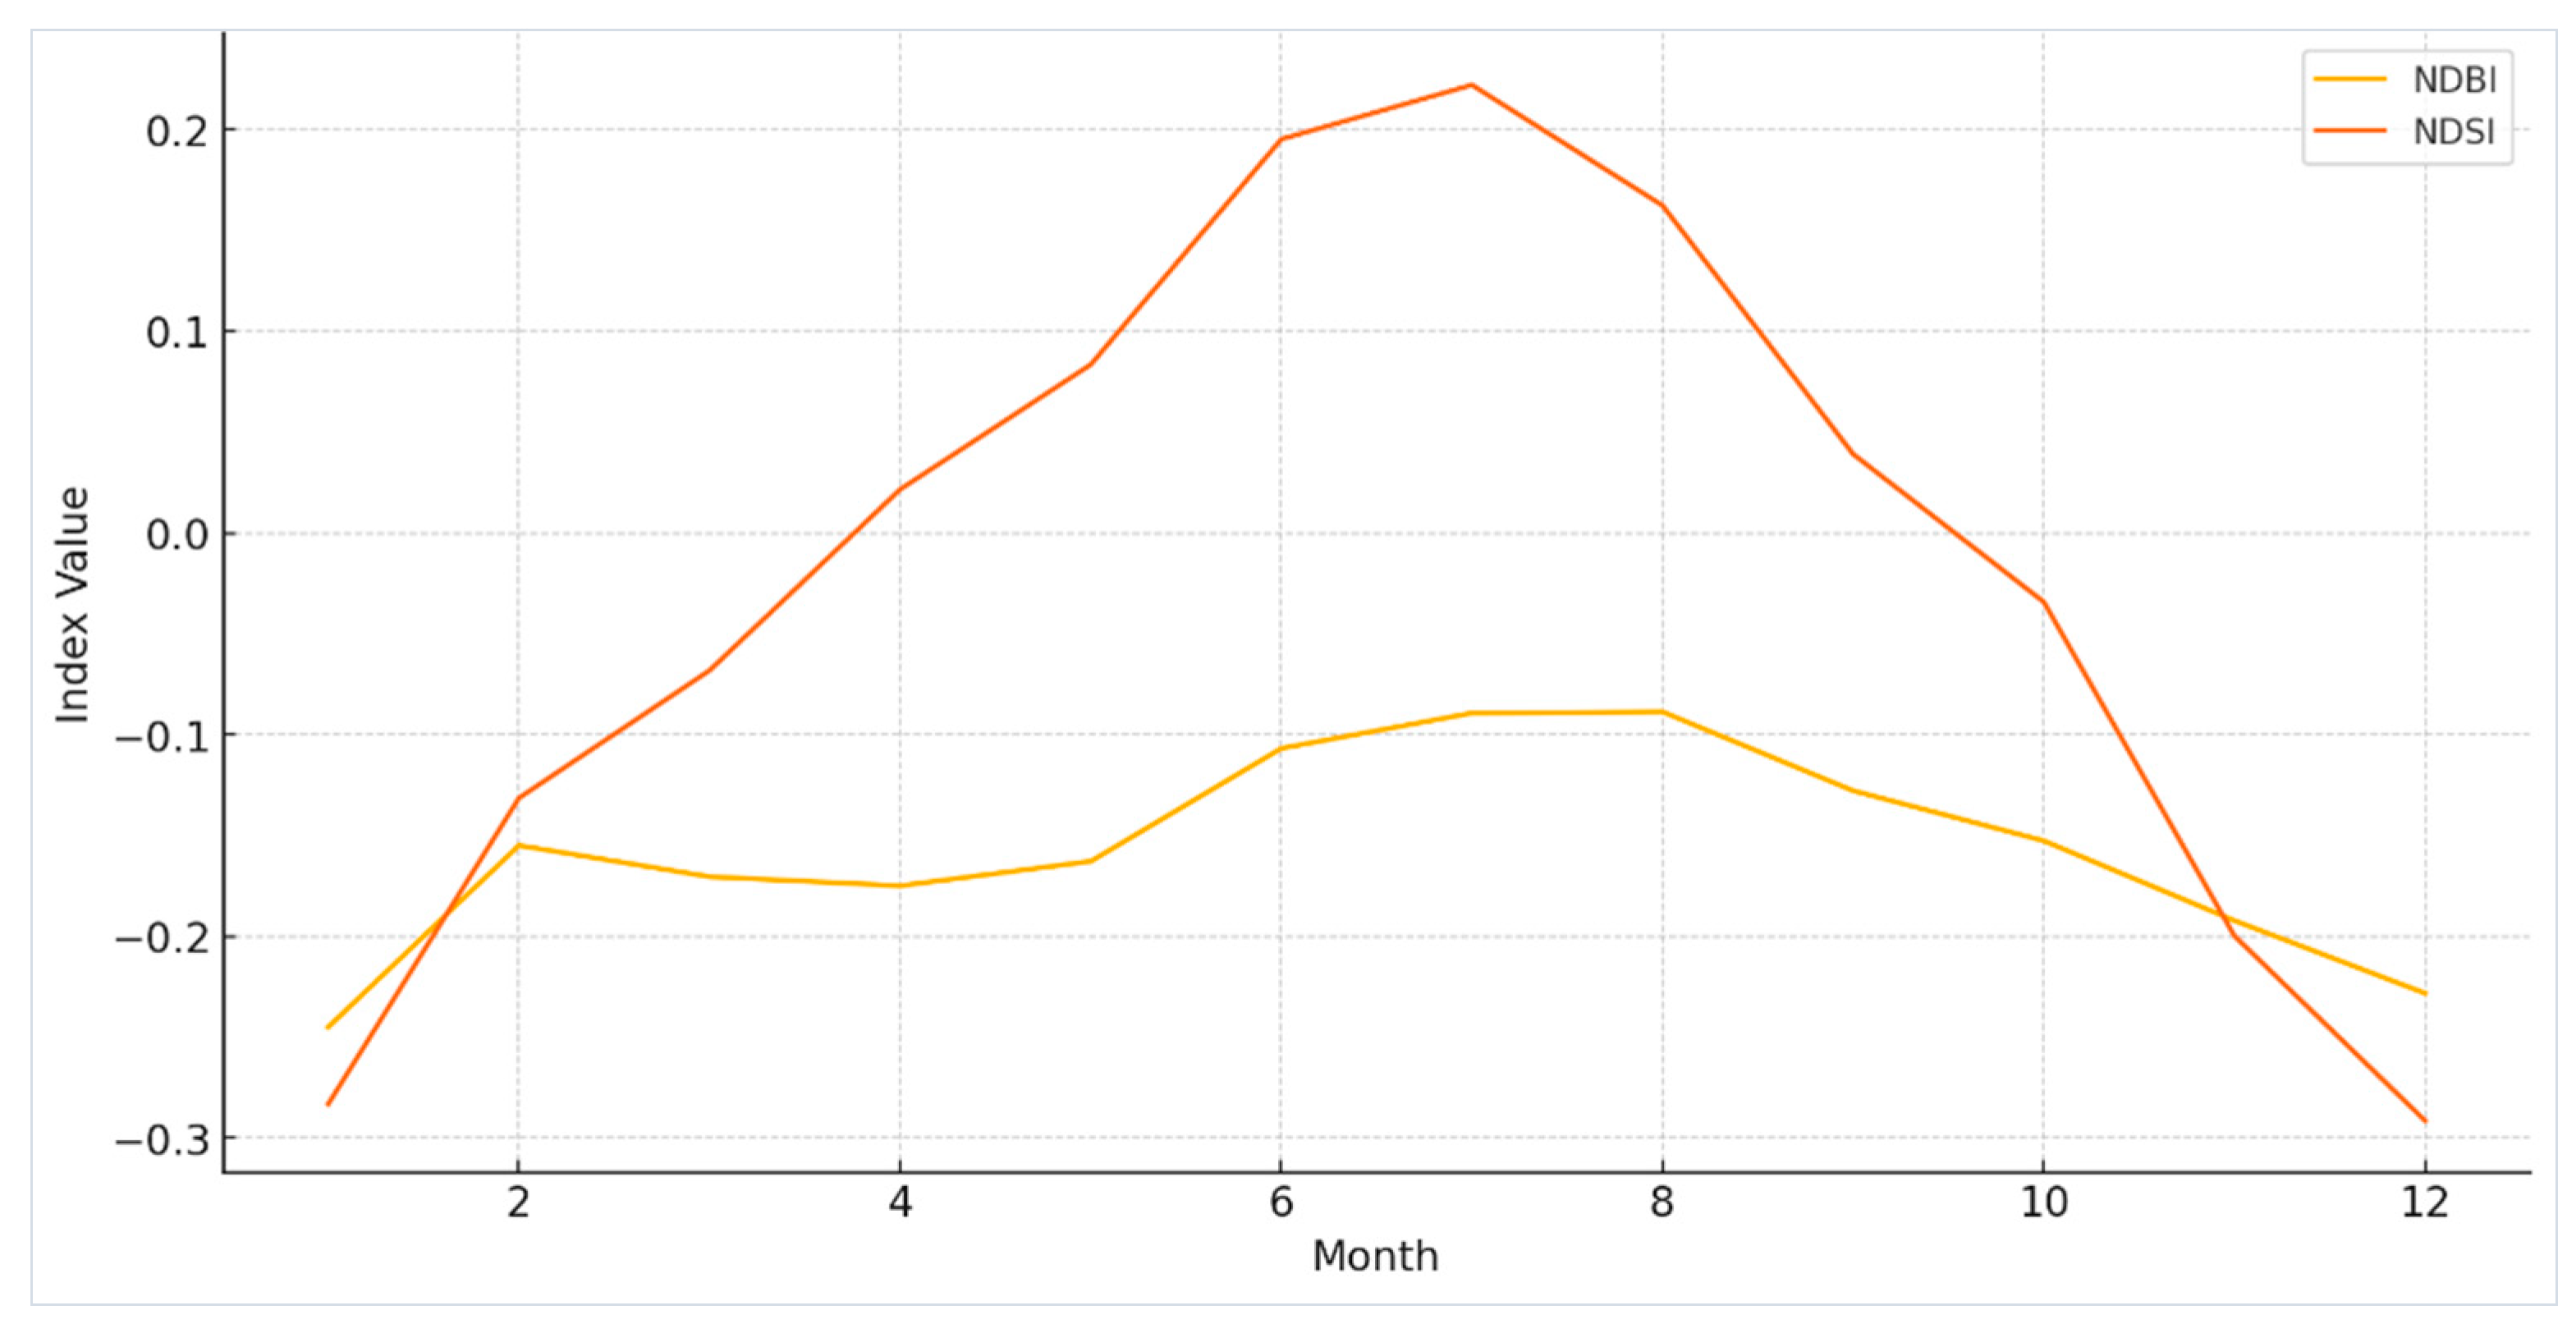
- Satellite Imagery Analysis: The time series examined spans approximately seven years, from January 2016 to May 2023. The analysis focused on annual and monthly variations of environmental indices such as NDBI, NDSI, and NDVI.
Annual Trends (Figure 9):
- NDBI has shown a slight decrease in recent years, indicating a potential slowdown in construction or a shift towards more sustainable building practices.
- NDSI displays variations, with an overall increasing trend suggesting decreased snow cover, exacerbating urban warming effects.
- NDVI has a slight upward trend, indicating increased urban vegetation, which is beneficial for reducing UHI effects.
Monthly Variations (Figure 10):
- Peaks in NDBI during certain months correspond to construction activity, particularly in warmer months.
- NDSI variations reflect the annual snow cycle, with less snow in winter indicating reduced natural cooling.
- NDVI is highest in spring and summer, aligning with seasonal vegetative growth, which helps reduce urban temperatures.
Figure 9.
Annual Trend of Indices.
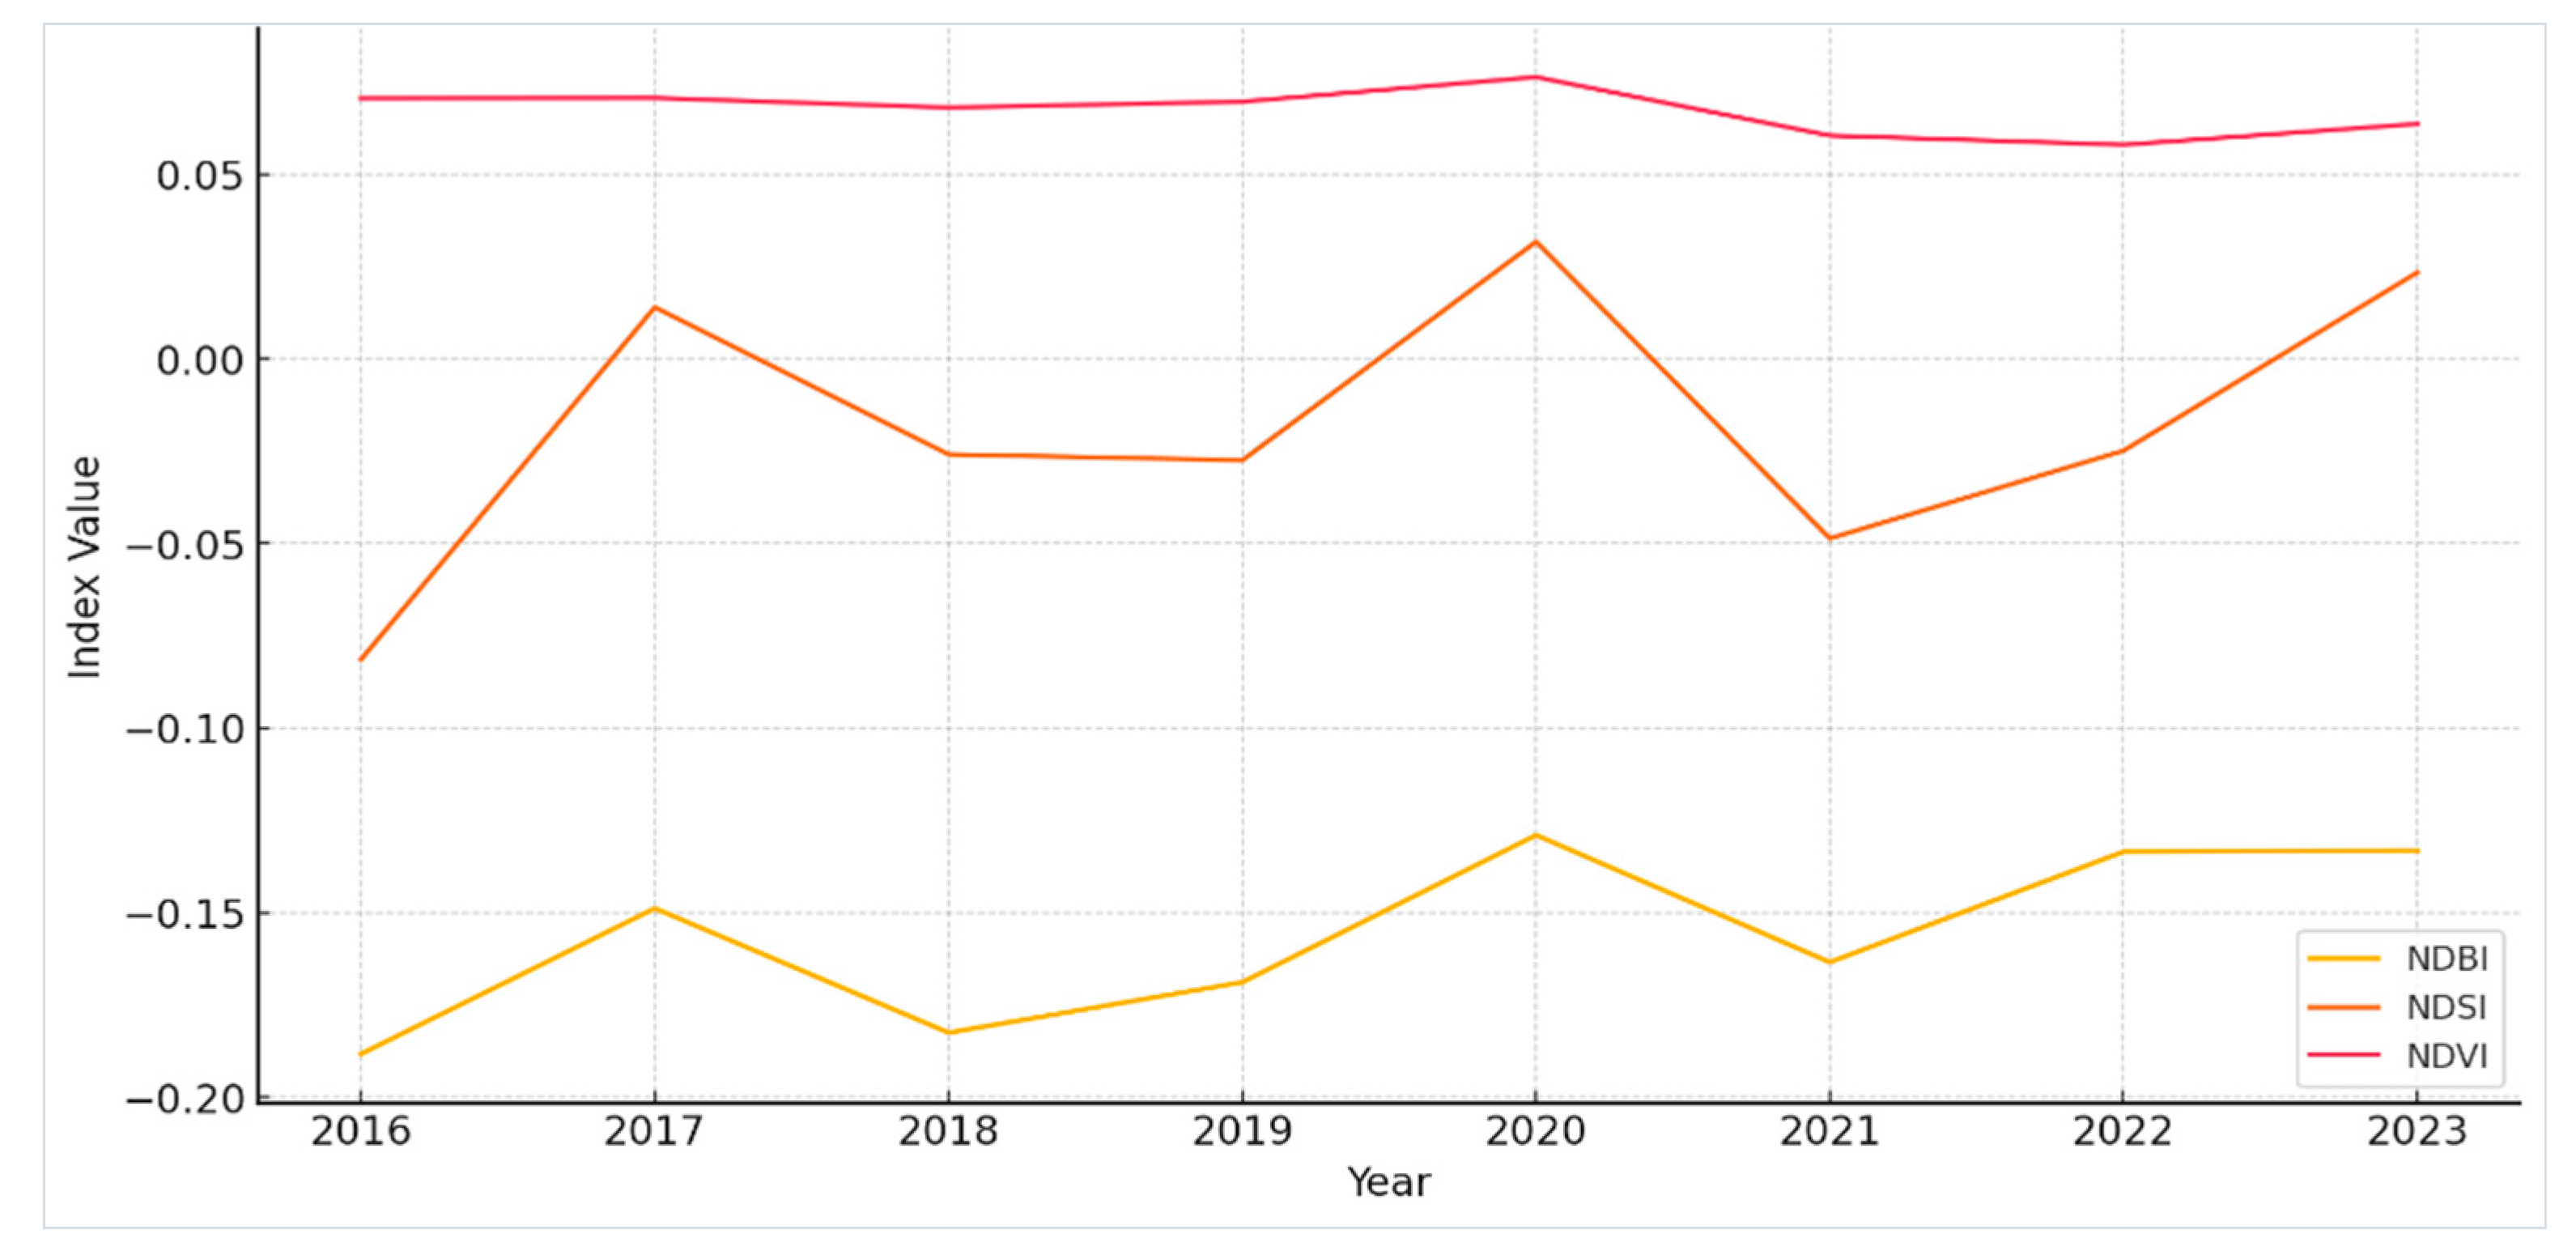
Figure 10.
Monthly Trend of Indices.
Thermal Properties of Calcarenite, [16]:
- Calcarenite's high thermal mass, analyzed for solar absorption properties, increases heat retention, exacerbating UHI effects in narrow urban canyons.
- Laboratory results showed significant solar absorption coefficients, illustrating the material's impact on local microclimates.
Table 3.
Solar Absorption Coefficient of Calcarenite.
| Sample699: | Sample700: |
|---|---|
| ASTM E 891: 67.70 | ASTM E 891: 67.89 |
| ASTM E 892: 65.35 | ASTM E 892: 65.41 |
| ASTM G (173). (Direct Circumsolar): 66.07 | ASTM G 173 (Direct Circumsolar): 66.22 |
| ASTM G (173). (Hemispherical Tilt @ 37 degrees): 64.90 | ASTM G 173 (Hemispherical Tilt @ 37 degrees): 64.99 |
Source: Laboratory Results, ESPOL Ecuador.
Topographic Survey Analysis [24]:
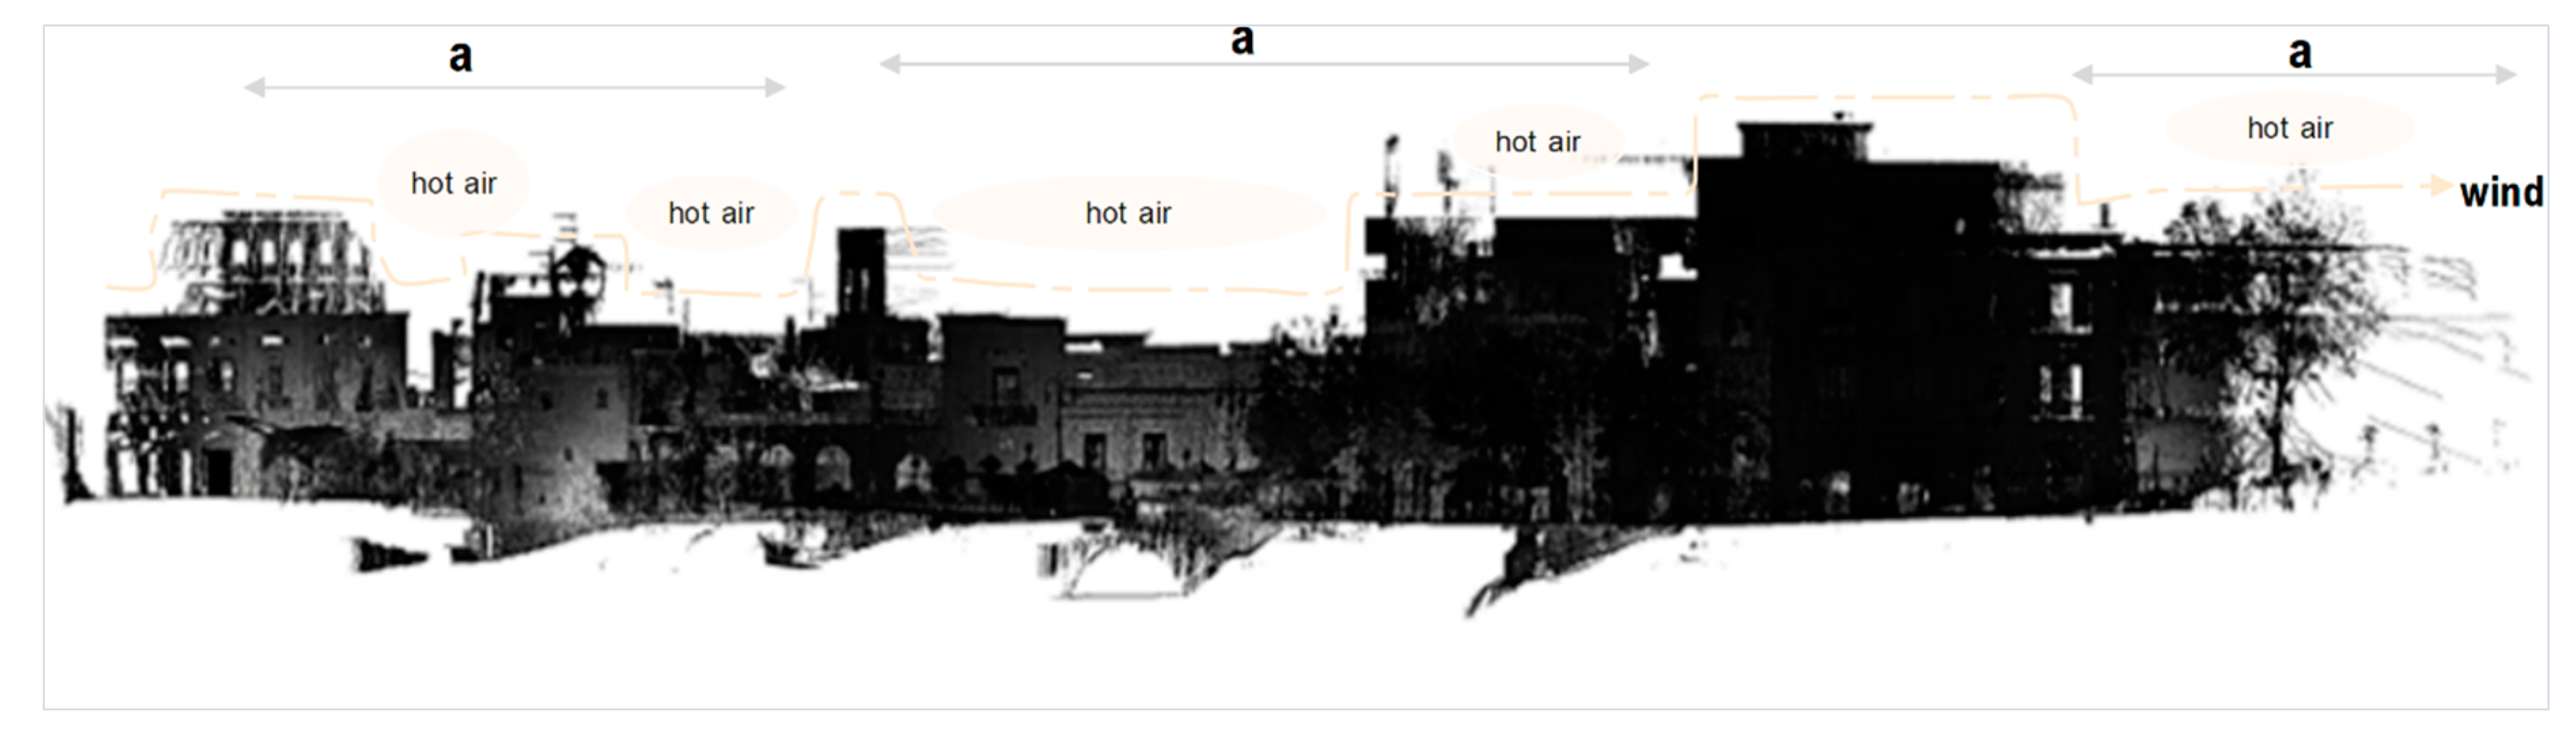
- Detailed 3D models of Via delle Beccherie were created using advanced 3D laser scanning technology. The analysis revealed significant correlations between the canyon's aspect ratios (height-to-width ratio) and UHI intensity.
- Narrower streets with high aspect ratios showed higher UHI intensity due to limited ventilation and higher thermal mass absorption.
Figure 11.
3D Urban Model, Street Canyon Matera. Own elaboration.
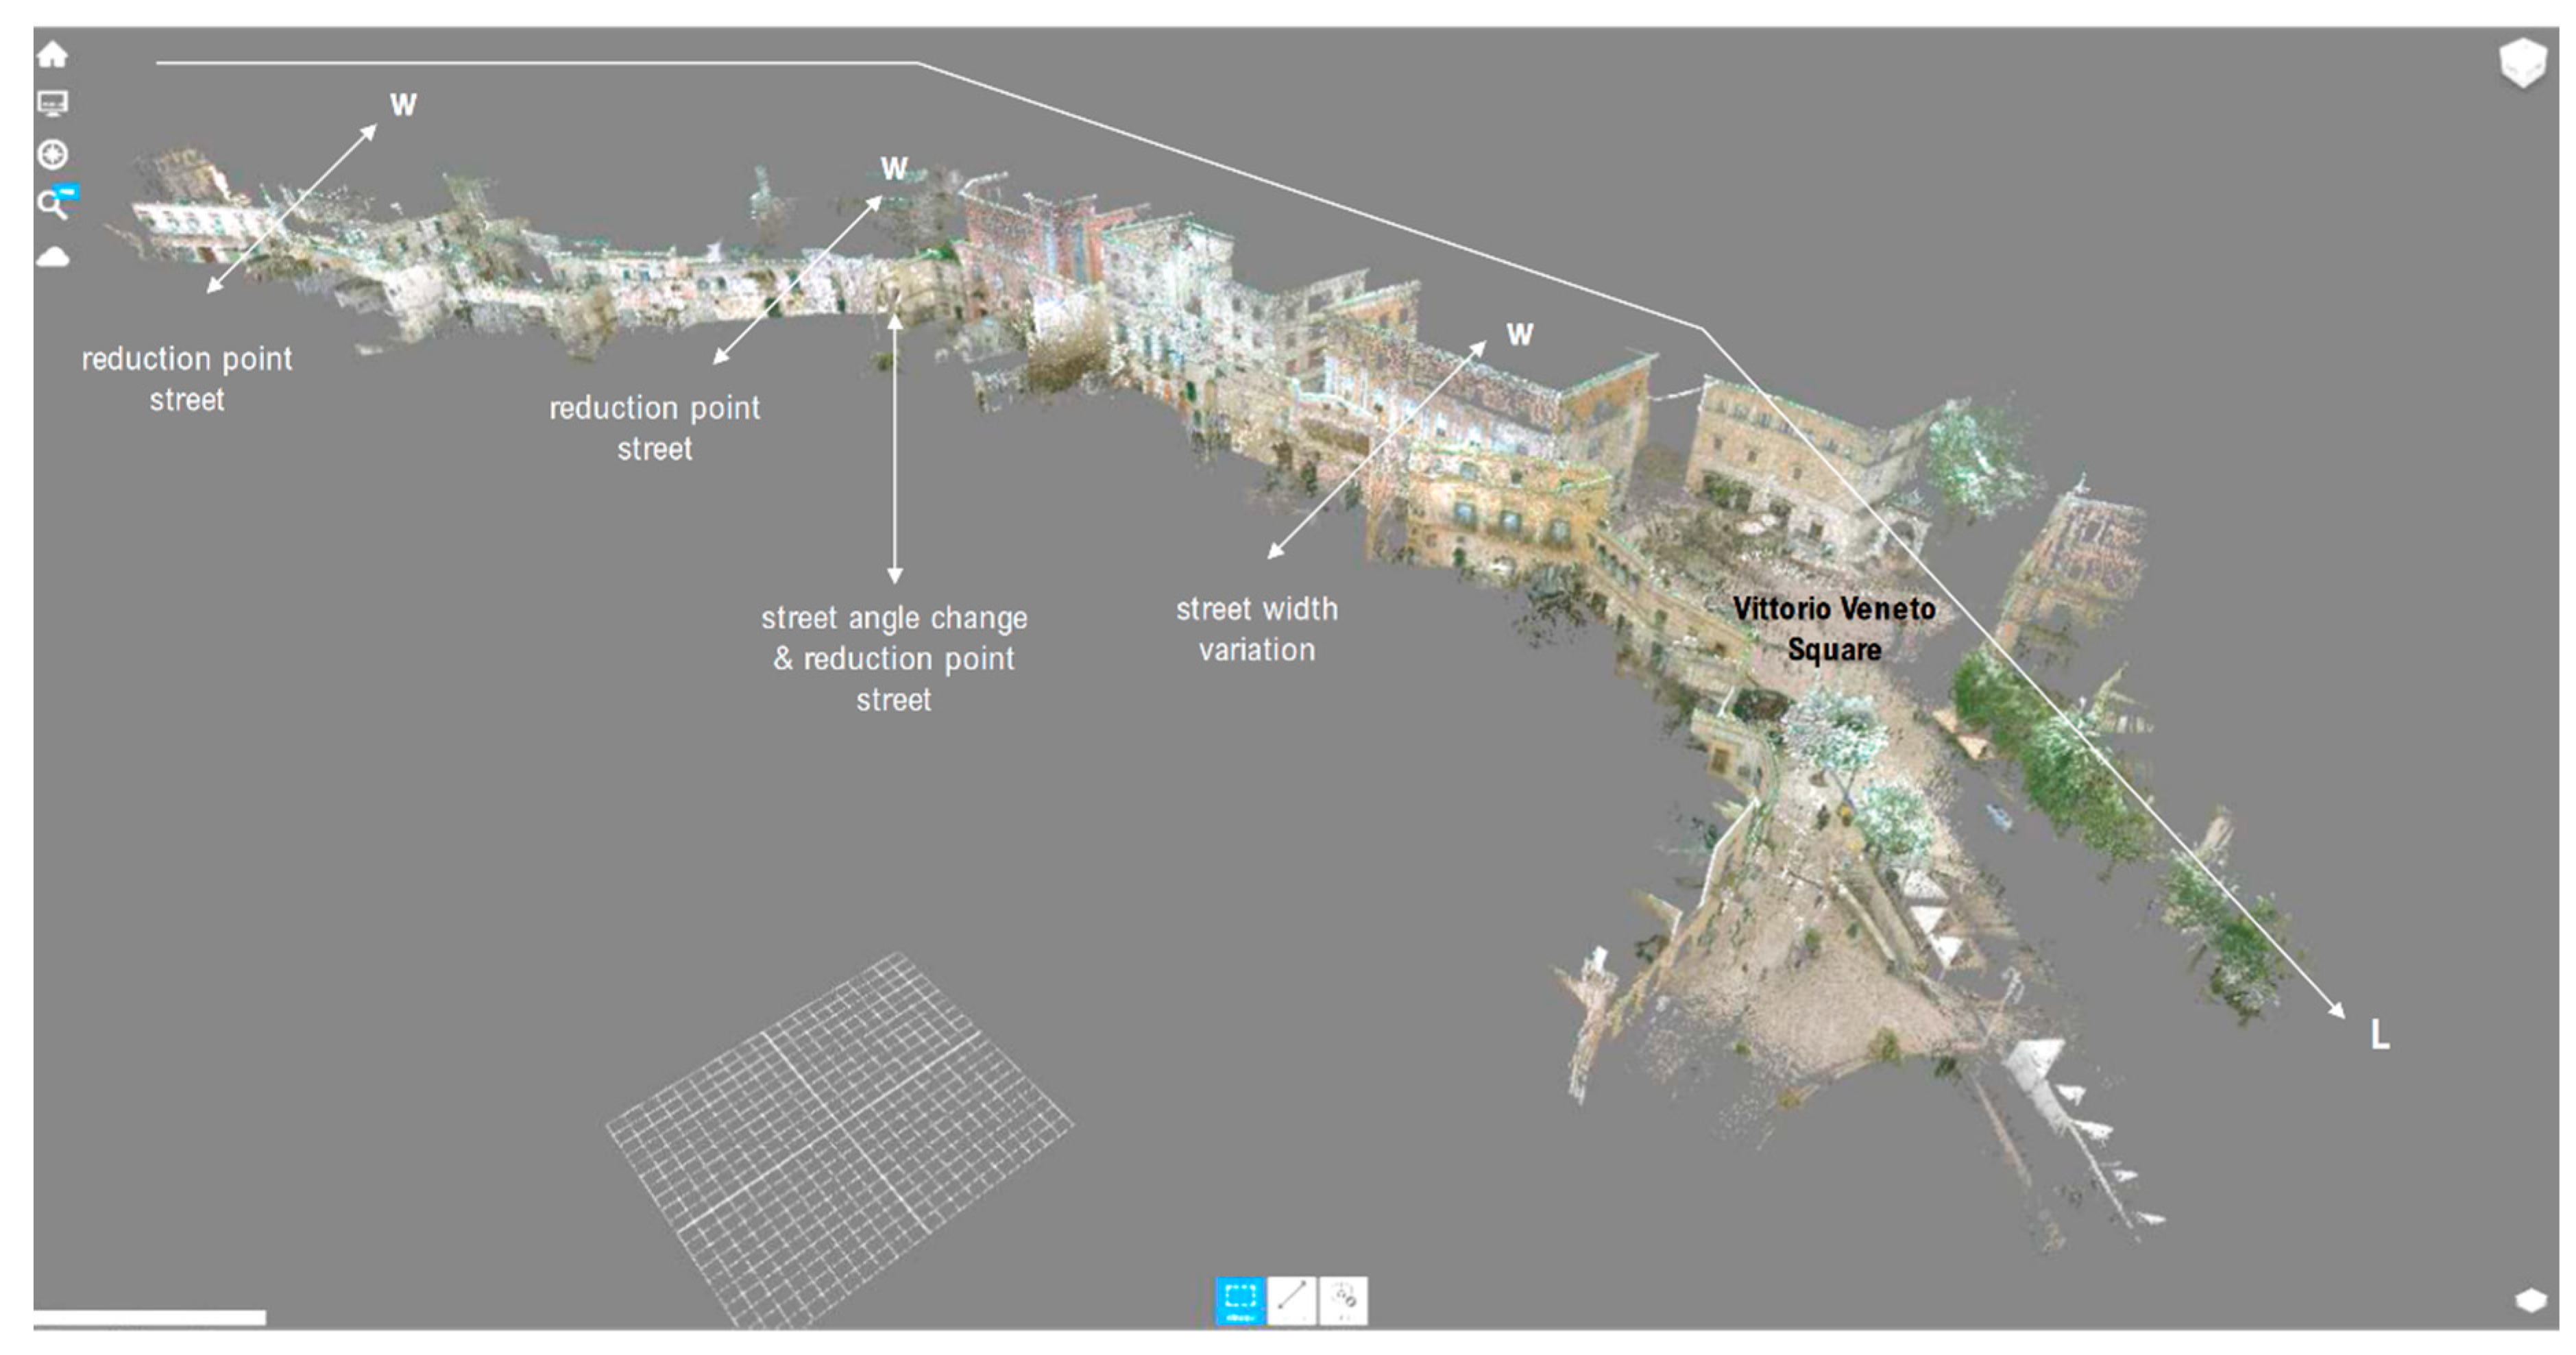
Figure 12.
Ventilation and sunlight pattern on “Via delle Beccherie” profile. Own elaboration.
Outputs:
- Simulated scenarios showed the effects of increasing NDVI through green roofs and urban parks and using reflective building materials, (see Table S4).
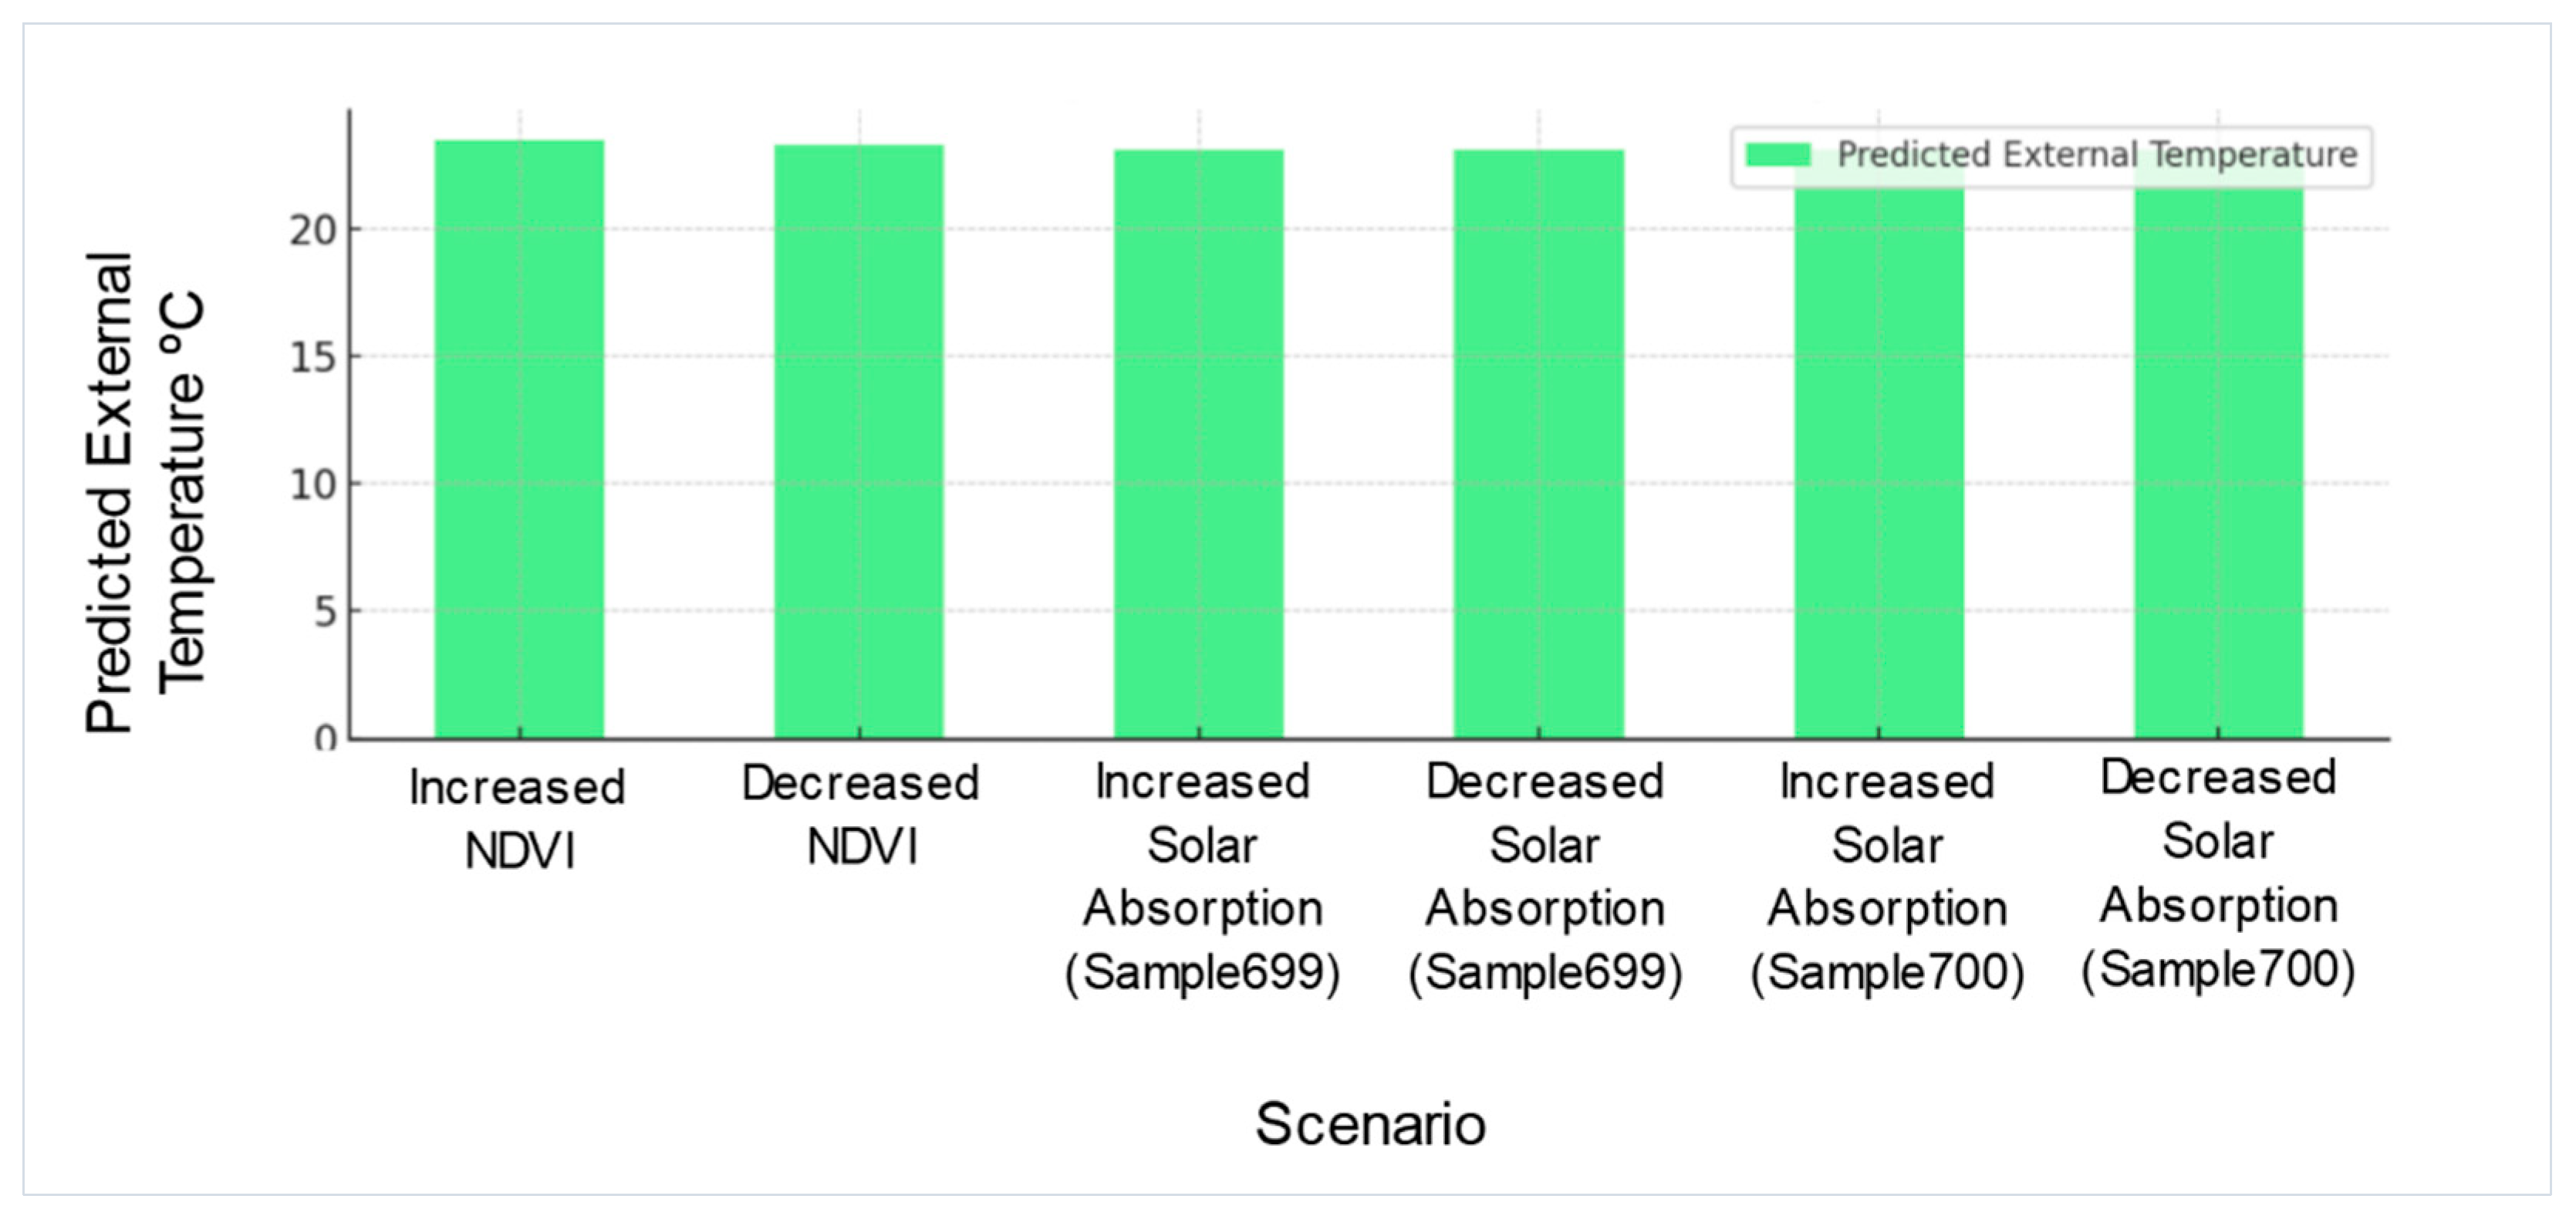
The scenario analysis results show the predicted impact on external temperature under different scenarios involving changes in vegetation (NDVI) and solar absorption coefficients (Sample699 and Sample700):
- Increased NDVI: Predicted external temperature increases to 23.51°C.
- Decreased NDVI: Predicted external temperature decreases to 23.30°C.
- Increased Solar Absorption (Sample699): Predicted external temperature decreases to 23.12°C.
- Decreased Solar Absorption (Sample699): Predicted external temperature remains around 23.13°C.
- Increased Solar Absorption (Sample700): Predicted external temperature decreases to 23.11°C.
- Decreased Solar Absorption (Sample700): Predicted external temperature remains around 23.13°C.
Figure 13.
Scenario Analysis: Predicted External Temperature.
Interpretation
- Vegetation (NDVI): Increasing NDVI (more vegetation) slightly increases the external temperature, while decreasing NDVI (less vegetation) reduces it. This might be counterintuitive and indicate specific local effects in the dataset or how NDVI interacts with other variables.
- Solar Absorption (Sample699 and Sample700): Changes in solar absorption coefficients have a relatively small impact on external temperature, with increased absorption leading to a slight decrease in temperature.
Results: The simulations predicted a significant reduction in UHI intensity with increased vegetation cover (higher NDVI values) and materials with higher solar reflectance. This underscores the effectiveness of green infrastructure and sustainable building materials in mitigating UHI effects. These results can inform urban planning decisions, such as the importance of vegetation and material choices in managing urban heat island effects [18].
4.4. Regulatory Impact Analysis, [26,27]
Objective: To analyze how regulatory changes, such as building codes and green roof mandates, could influence environmental indices and temperatures.
Inputs:
- Data Adjustments to Simulate Regulatory Changes, including increased NDVI for green roofs and altered solar absorption coefficients for new building materials.
- 3D Survey Data helps visualize the impact of regulatory changes on the urban landscape and how modifications can be integrated without compromising Matera's historical integrity.
Outputs: Analysis of various regulatory scenarios and their impact on UHI.
In the simulation, the NDVI coefficient was increased by 0.2 from its mean value to simulate the impact of implementing green roofs, (see Table S5).
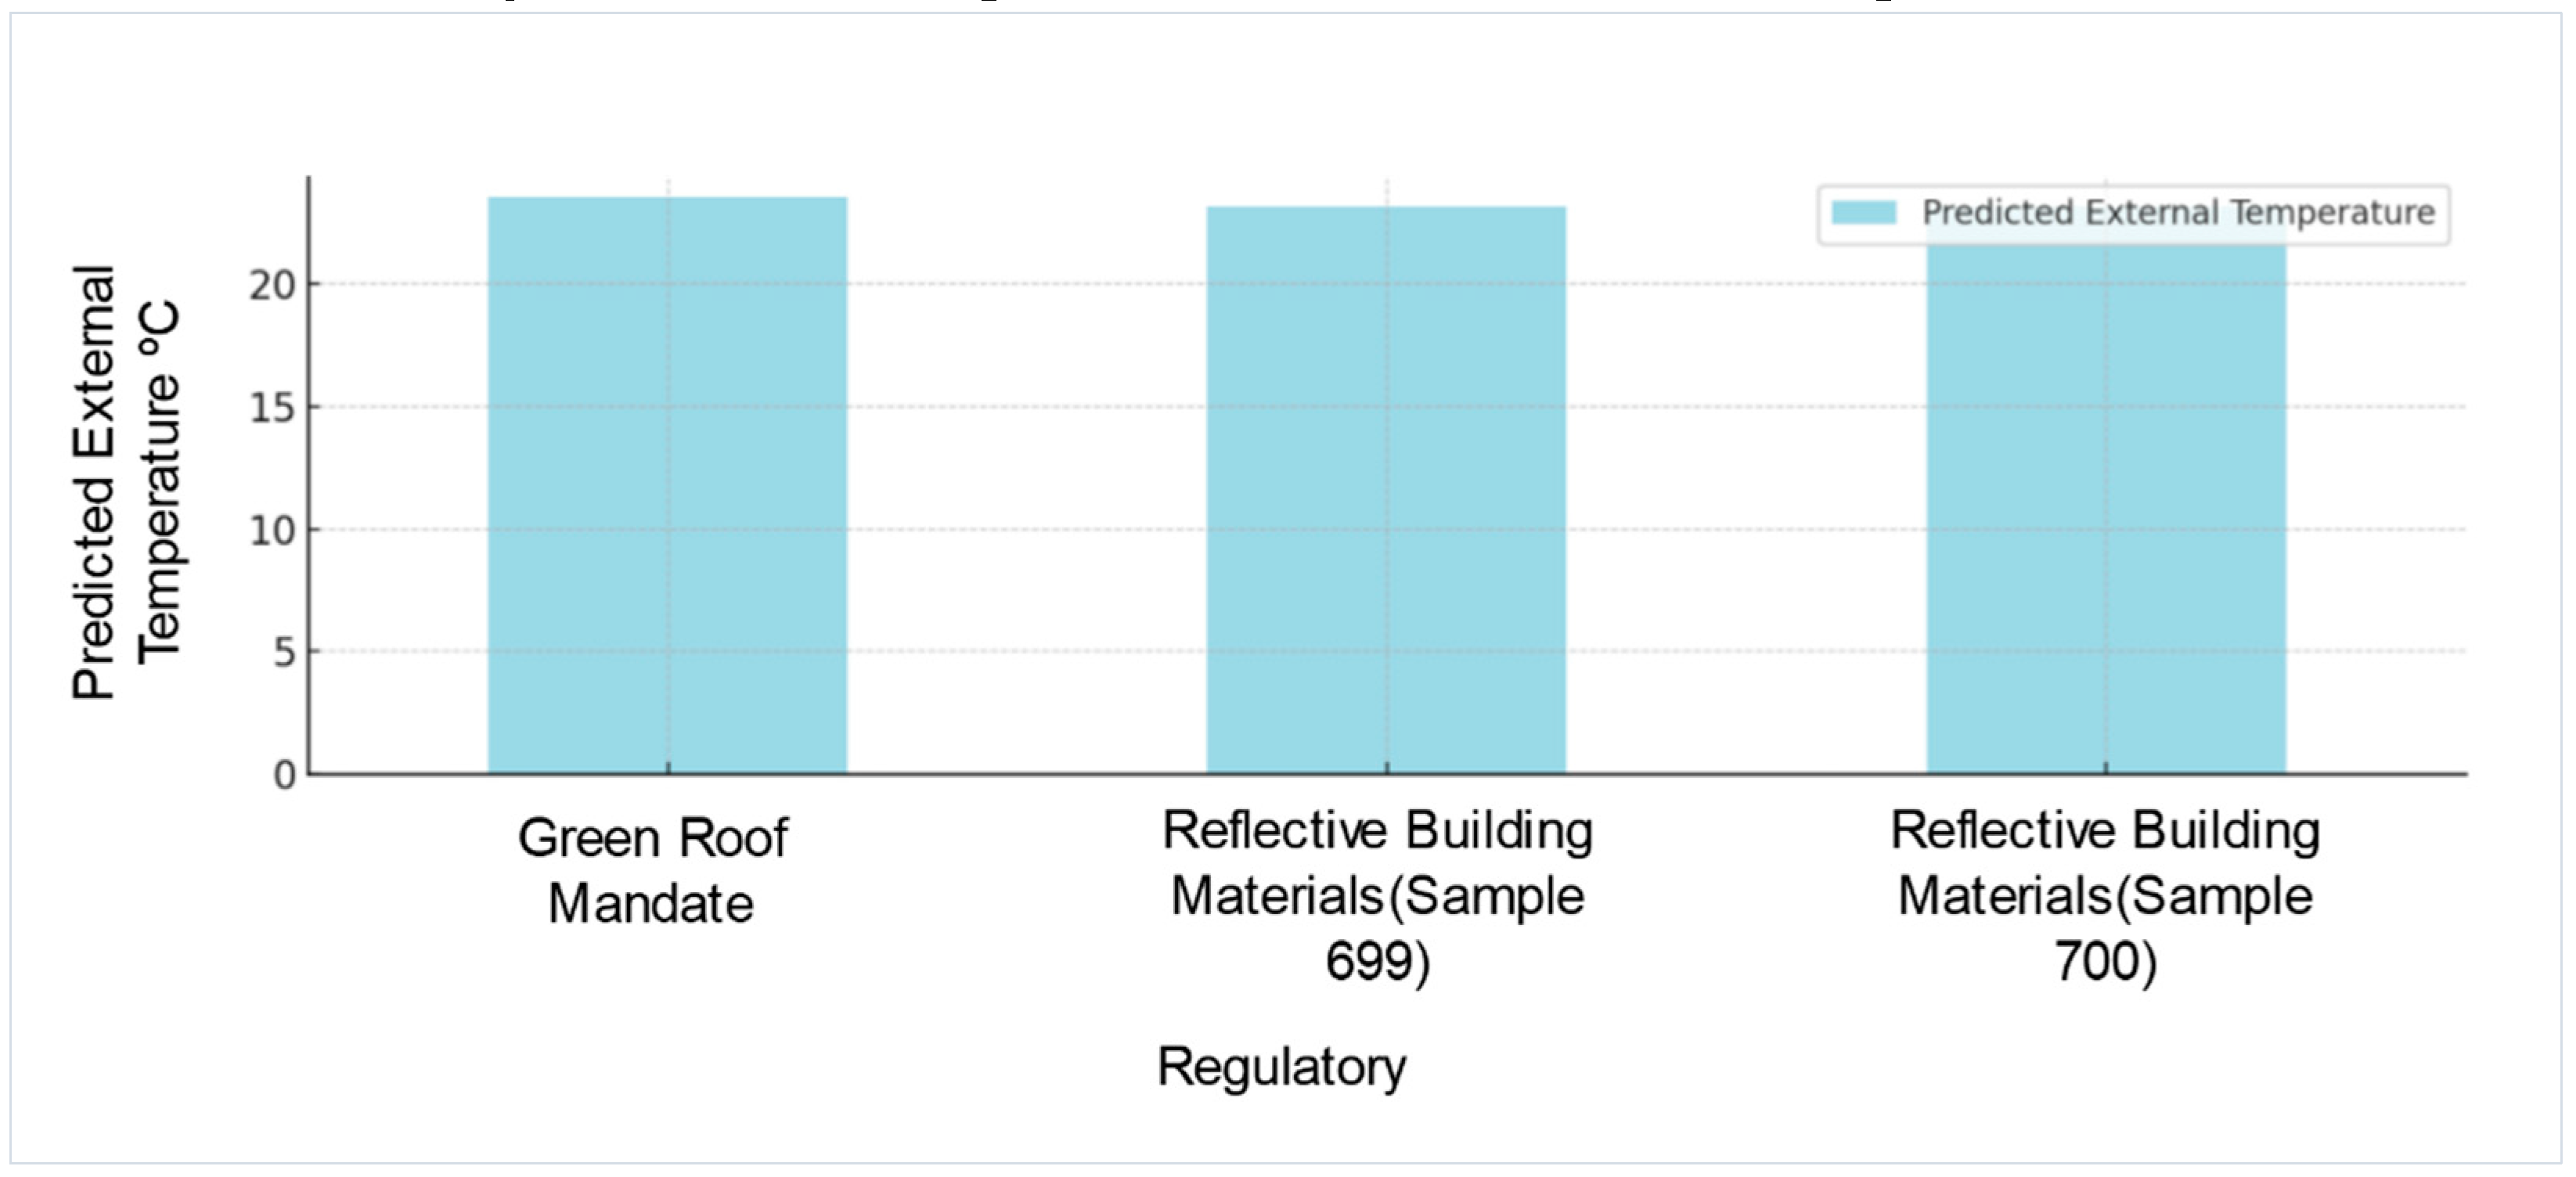
The analysis shows the predicted impact on external temperature under different regulatory scenarios:
- Green Roof Mandate: The predicted external temperature is 23.51°C.
- Reflective Building Materials (Sample699): Predicted external temperature is 23.13°C.
- Reflective Building Materials (Sample700): Predicted external temperature is 23.13°C.
Figure 14.
Regulatory Impact Analysis: Predictes External Temperature.
Interpretation
- Green Roof Mandate: Implementing green roofs, simulated by increasing NDVI, slightly increases the predicted external temperature. This result suggests that while green roofs add vegetation, their impact on temperature reduction may be more complex and influenced by factors like humidity and building density.
- Reflective Building Materials: Using more reflective building materials, simulated by decreasing solar absorption coefficients, results in a slight decrease in the predicted external temperature. This indicates that such materials can help reduce the urban heat island effect by reflecting more solar radiation.
Insights
- Complex Interactions: The slight increase in temperature with increased NDVI highlights the complex interactions between vegetation and urban heat. Factors like increased humidity and evapotranspiration might play a role.
- Effective Mitigation: Reflective building materials reduce external temperatures and mitigate the urban heat island effect.
4.5. Dominant Factors Analysis, [30]
Objective: To determine the dominant factors influencing UHI intensity, including NDBI, NDSI, and interaction terms.
Inputs: Integration of dynamic and static data through the Random Forest Regression model, incorporating NDVI, NDBI, NDSI, and meteorological variables.
Outputs: Identification of key predictors and their relative importance in influencing UHI intensity. The feature importance analysis from the Random Forest model reveals the following:
- NDSI: 38.97%
- NDBI: 32.74%
- NDVI: 25.43%
- Sample699: 1.50%
- Sample700: 1.37%
Partial Dependence Plots: The partial dependence plots for critical features and their interactions with NDVI show:
Figure 15.
Partial Dependence Plots for Keys Features and Interaction with MDVI.
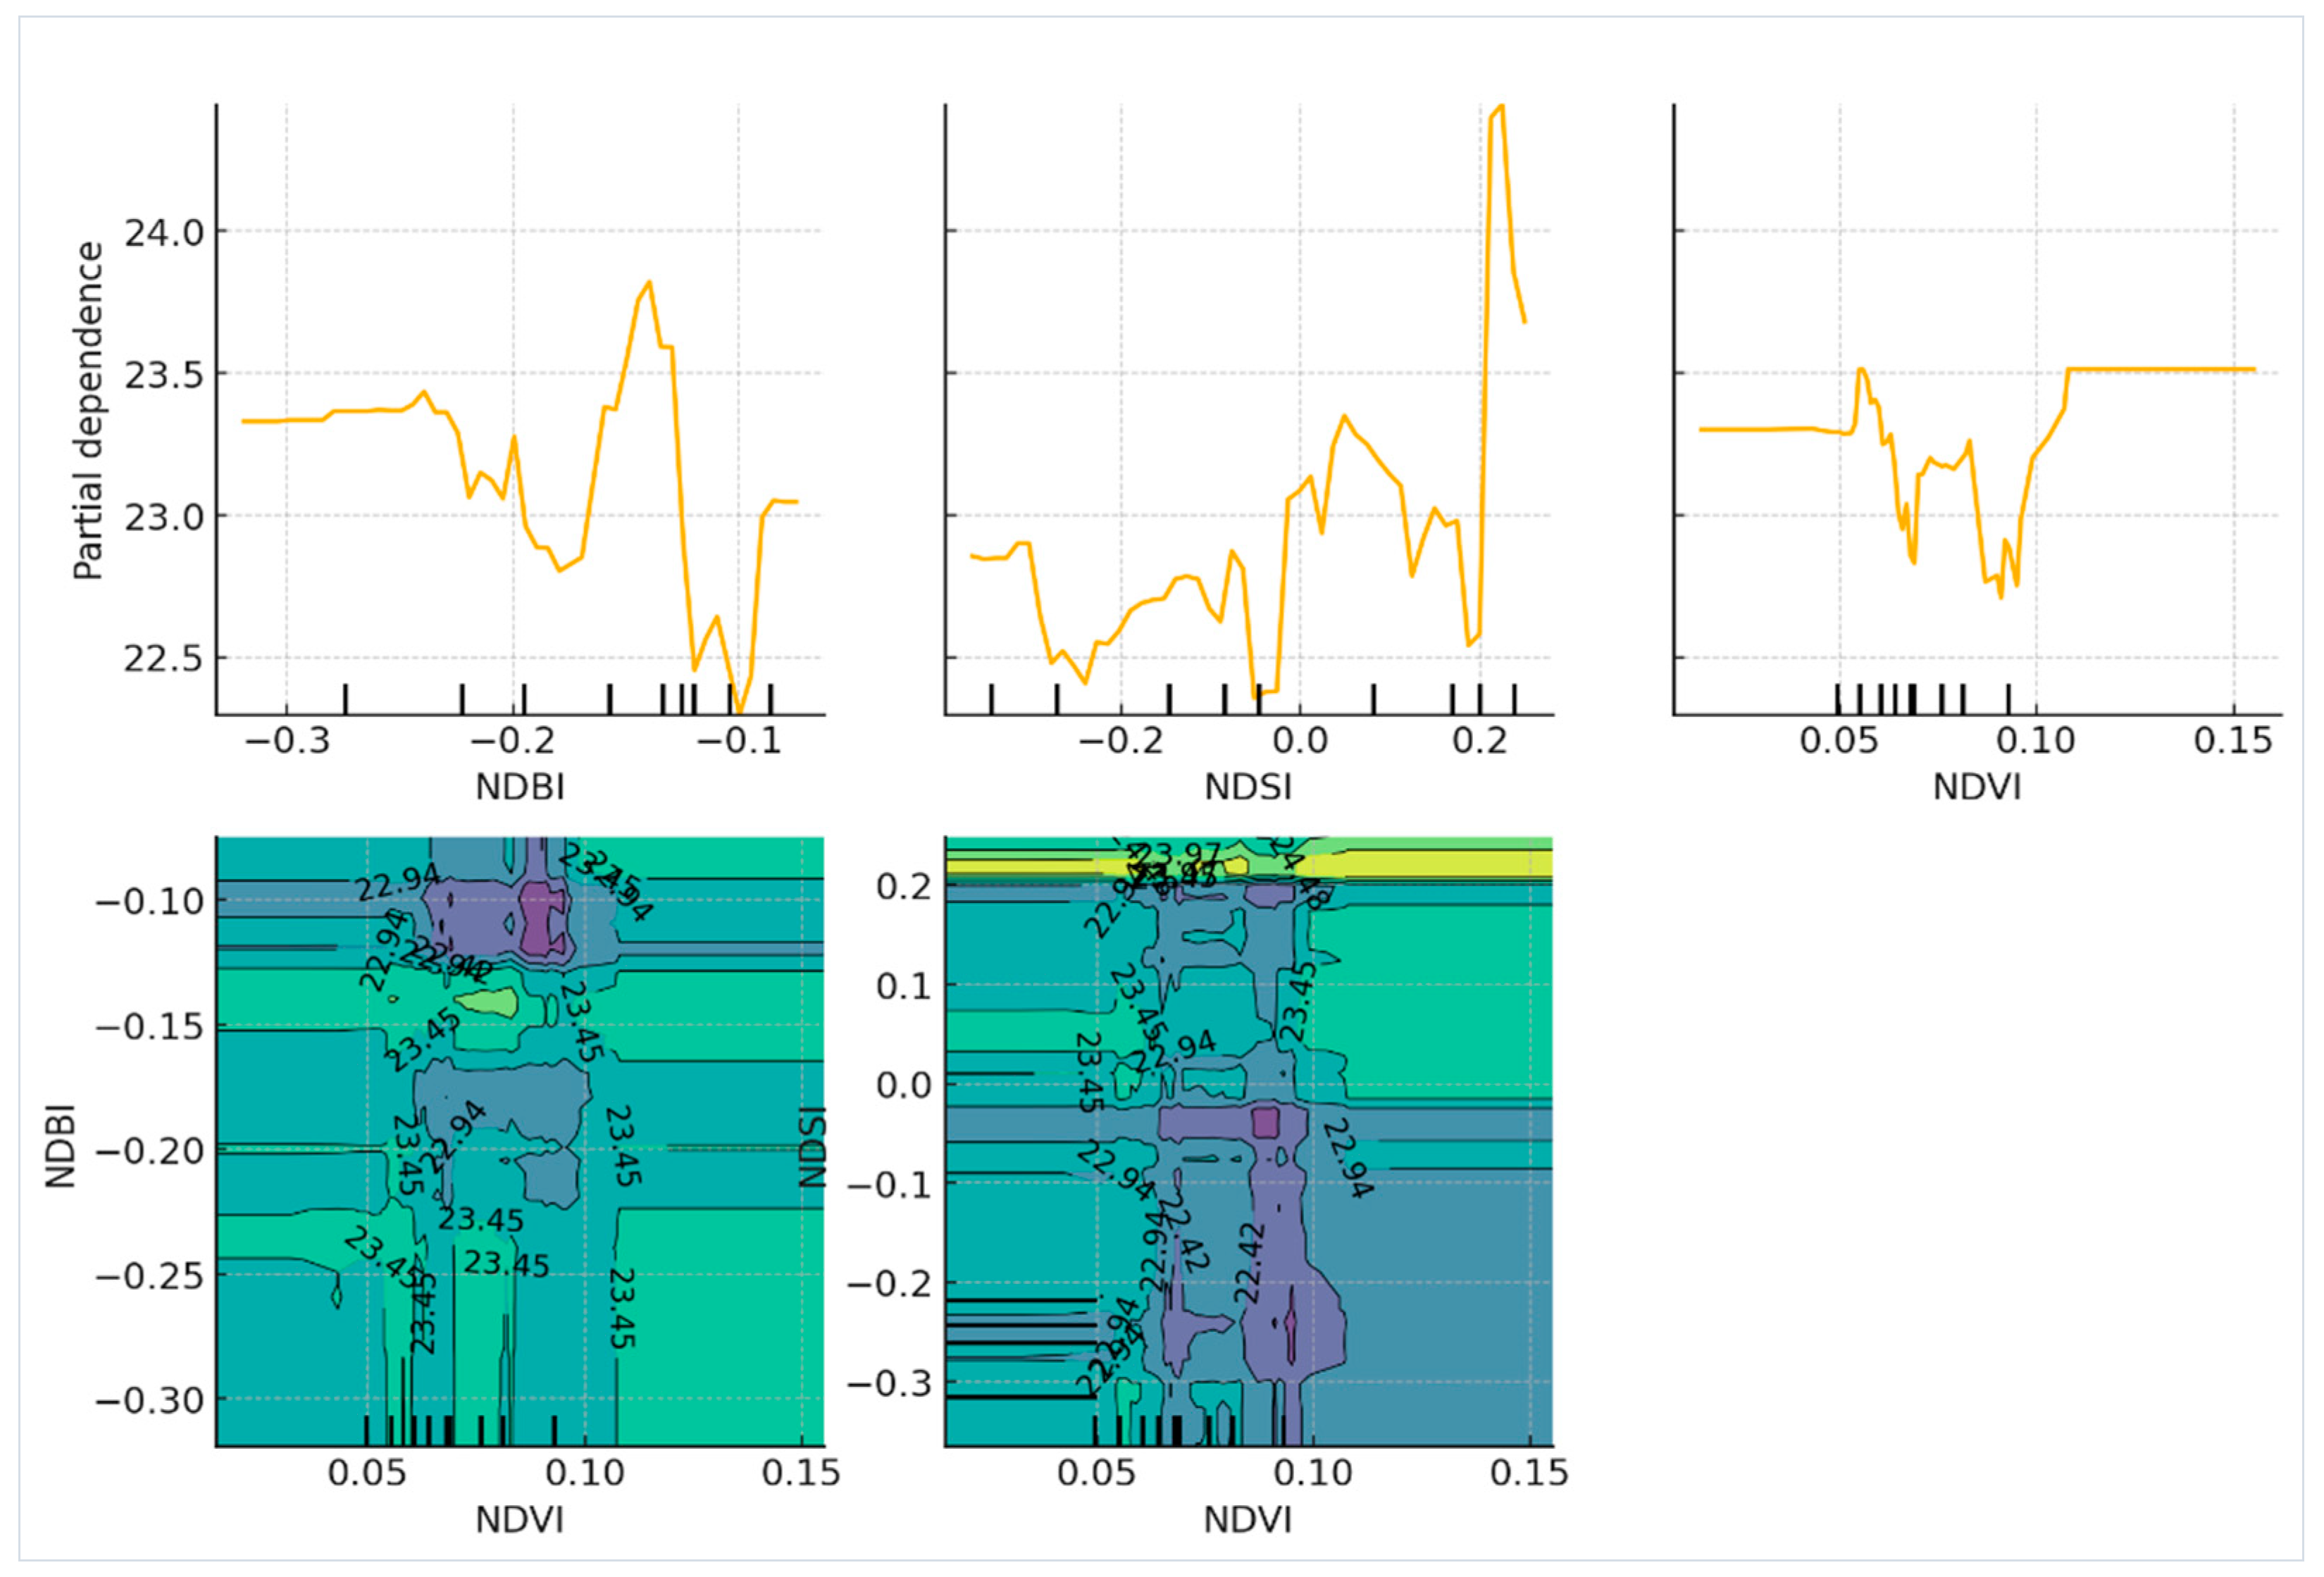
- NDSI: A strong influence on external temperature, with higher NDSI values leading to higher temperatures.
- NDBI: Also strongly influences, with higher NDBI values leading to higher temperatures.
- NDVI: Has a noticeable but lesser influence than NDSI and NDBI.
Interactions:
- NDVI and NDBI: The interaction plot suggests that the level of NDBI influences the impact of NDVI on temperature.
- NDVI and NDSI: Similarly, the interaction with NDSI shows complex patterns, indicating that NDSI levels moderate the effect of NDVI.
Interpretation
- Dominant Factors: NDSI and NDBI are the dominant factors influencing the prediction of external temperature. Their higher importance scores and the partial dependence plots confirm that they have a significant impact.
- Interaction Effects: The interactions between NDVI and the dominant factors (NDBI and NDSI) indicate that NDVI's effect on temperature is not straightforward. Instead, it is influenced by the levels of NDBI and NDSI.
Insights
- Complex Dynamics: The relationship between NDVI and external temperature is moderated by other indices like NDBI and NDSI. This explains why changes in NDVI alone might not lead to significant changes in temperature.
- Regulatory Implications: Effective urban planning should consider these interactions. For example, increasing vegetation might need to be coupled with managing built-up areas (NDBI) and snow/ice cover (NDSI) to achieve desired temperature reductions.
Results: The model revealed that NDBI and NDSI were significant predictors of UHI intensity, often overshadowing the impact of NDVI changes. Interaction terms between various indices highlighted complex relationships influencing temperature variations [31]. These findings help prioritize mitigation strategies by focusing on the most impactful factors.
Understanding the assumptions of the Random Forest Regression Model is crucial for interpreting its predictions and insights. The model assumes the dataset is accurate, complete, and representative of Matera's conditions; any missing or incorrect data can bias predictions. It relies on the selected features adequately capturing the factors affecting urban temperatures and assumes consistent relationships between these features and temperature over time. The independence of observations is assumed, and spatial autocorrelation violations can affect performance. The model presumes uniform feature impact across the dataset, with unmodeled local variations or non-linear interactions potentially leading to incorrect predictions. It assumes static solar absorption coefficients representative of Matera's materials and consistent methods for calculating environmental indices. Homogeneity of climatic conditions during data collection is presumed, with extreme weather events potentially skewing predictions. The effectiveness of mitigation strategies like green roofs and reflective materials may vary based on implementation. Continuous validation and updates with new data are essential to maintain accuracy and relevance.
5. Discussion
5.1. Temporal Clustering and Seasonal Patterns
The temporal clustering analysis identified distinct periods with similar temperature and humidity characteristics, revealing significant seasonal trends. These findings are consistent with previous studies that highlight the seasonal variability of UHI effects, particularly the intensification during summer months due to higher temperatures and reduced humidity. For instance, research by [32] demonstrated that UHI effects are more pronounced during warmer seasons, corroborating our findings in Matera. This seasonal insight is critical for developing targeted mitigation strategies that address the periods of highest UHI intensity.
5.2. Impact of Vegetation and Building Materials
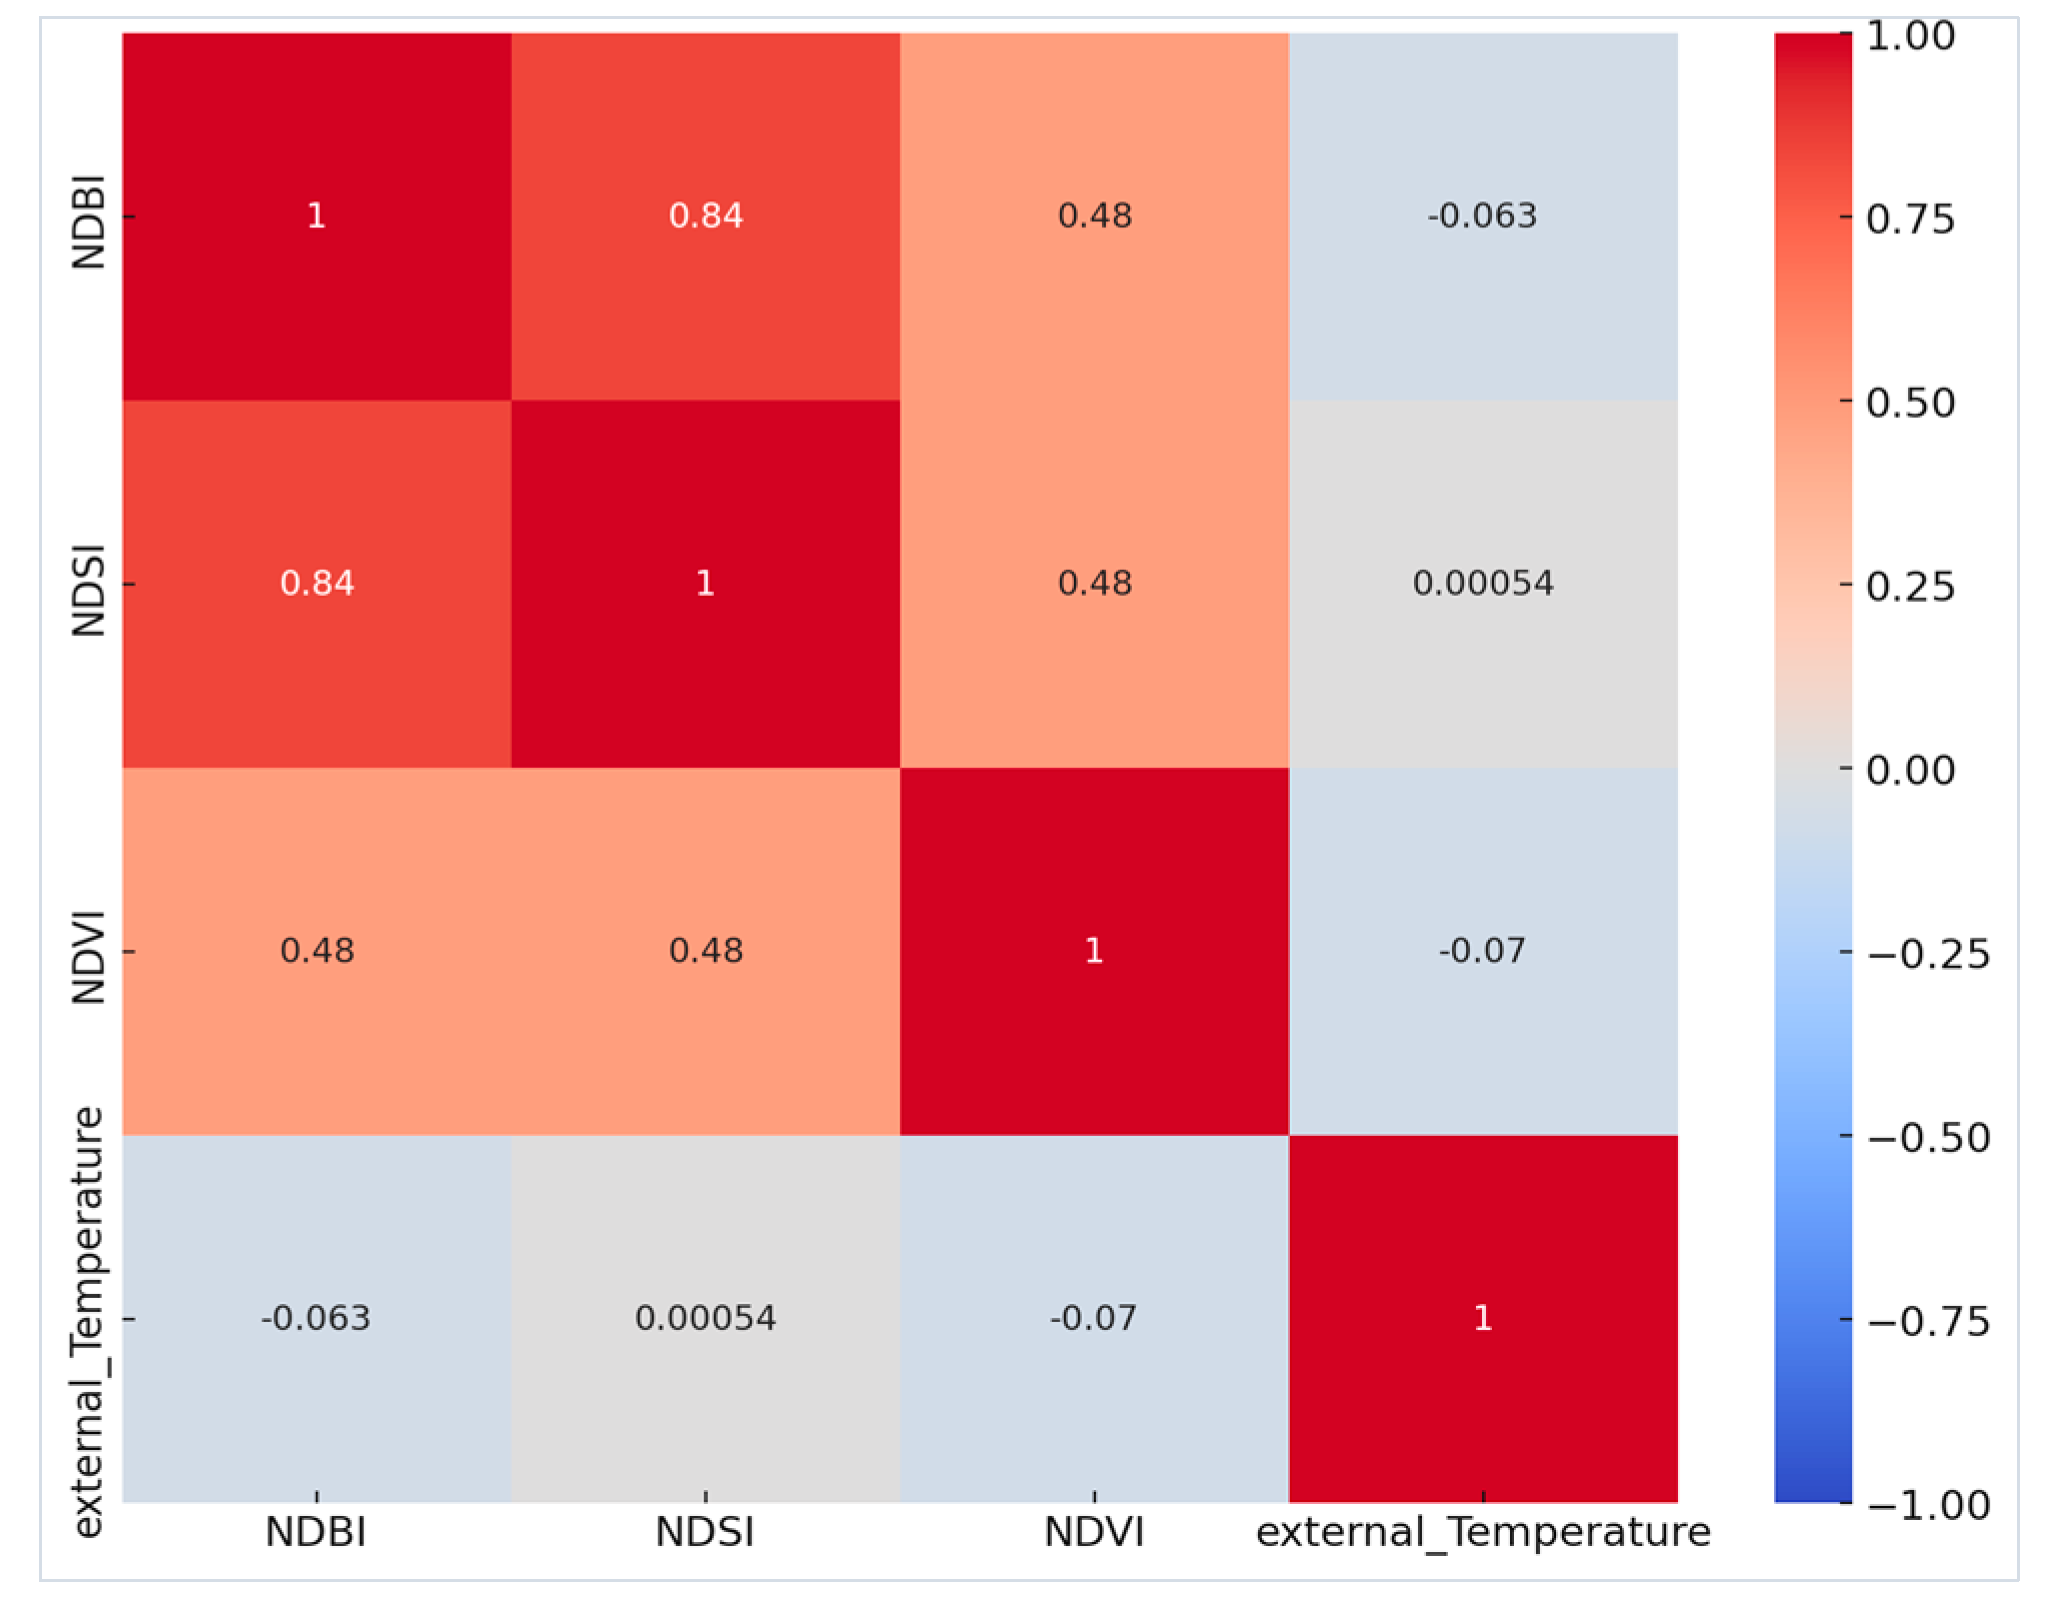
In Analysis 2, the model presented a counter-intuitive aspect: increasing the Normalized Difference Vegetation Index (NDVI) slightly, increasing the outdoor temperature while decreasing NDVI, which reduced it. This contradicts the commonly held expectation that more vegetation generally cools the environment. Further investigation through partial dependence plots (PDP) for NDVI and its interactions with NDBI and NDSI illustrated that the impact of NDVI on temperature depends on the level of NDBI and NDSI (see Figure 16). The correlation matrix (see Figure 17) revealed a positive correlation between NDVI and external temperature, suggesting hidden interactions that were not initially considered. These findings indicate that increasing NDVI, simulating the addition of green roofs, slightly increased the predicted external temperature due to local effects or complex interactions captured by the Random Forest model. This complexity could explain the seemingly counter-intuitive results observed in the analysis.
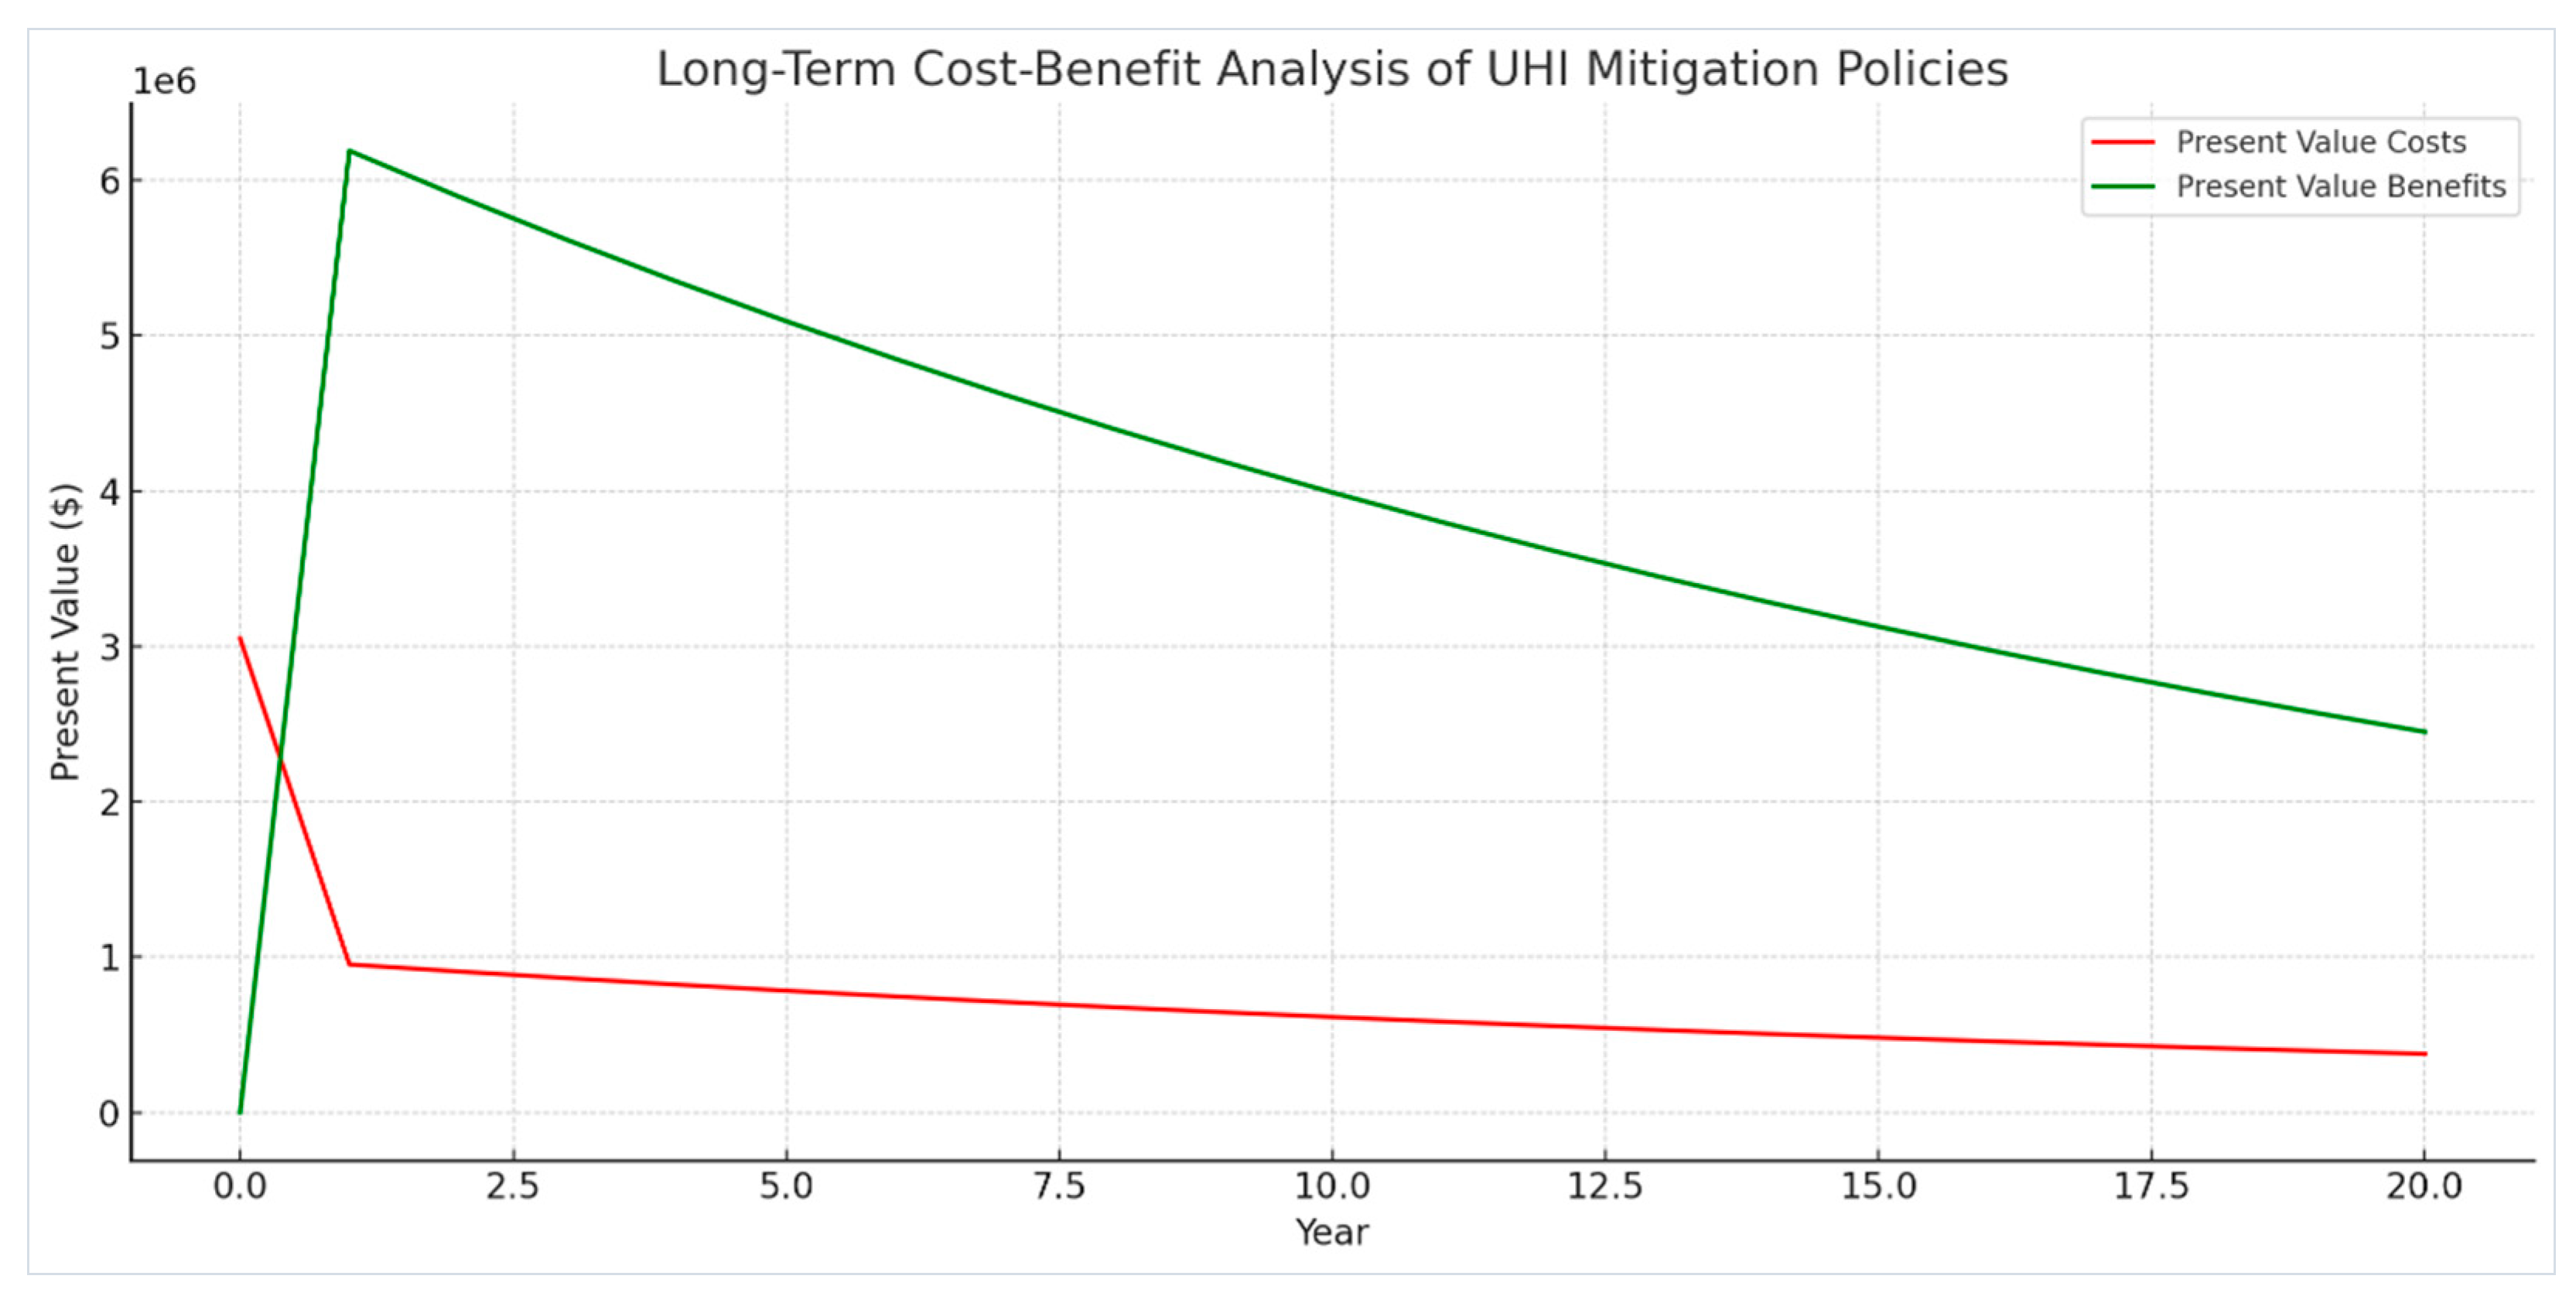
Examining the economic feasibility of UHI mitigation policies involves cost-benefit analysis, implementation costs, and long-term savings. This includes estimating costs for green roofs, reflective materials, and benefits like energy savings, health improvements, and comfort [33]. The analysis uses net present value (NPV) over 20 years with a 5% discount rate, projecting annual costs and benefits. Assumptions include annual green roof maintenance costs of $5 per square meter, 20% energy savings for green roofs, 15% for reflective materials, $50 per person per year in health benefits, and $100 per person per year in improved comfort.
Results show the NPV of costs at $15,512,210.34 and the NPV of benefits at $81,004,367.23, yielding a net benefit of $65,492,156.88. This indicates that benefits significantly outweigh costs over 20 years, making the investment economically feasible and sustainable [34]. Annual benefits from energy savings, health improvements, and increased comfort provide substantial returns, justifying initial high costs. The findings support the economic feasibility of UHI mitigation policies, urging city planners and policymakers to consider such investments [35]. This analysis highlights the importance of evaluating long-term benefits and using discounting methods to assess true economic impact.
The scenario simulation analysis showed that increasing vegetation (higher NDVI values) and using reflective building materials significantly reduce UHI intensity. This aligns with the findings of [36,37], who emphasized the role of urban greenery and high-albedo materials in mitigating UHI effects. Our study contributes to the existing literature by providing specific data for Matera, demonstrating that green infrastructure and sustainable building materials are adequate in historic urban environments. The slight upward trend in NDVI observed in our study period suggests a positive shift towards more vegetation, which has proven benefits for urban cooling.
Figure 18.
Long-Term Cost-Benefit Analysis of UHI Mitigation Policies.
5.3. Regulatory Impact and Urban Planning
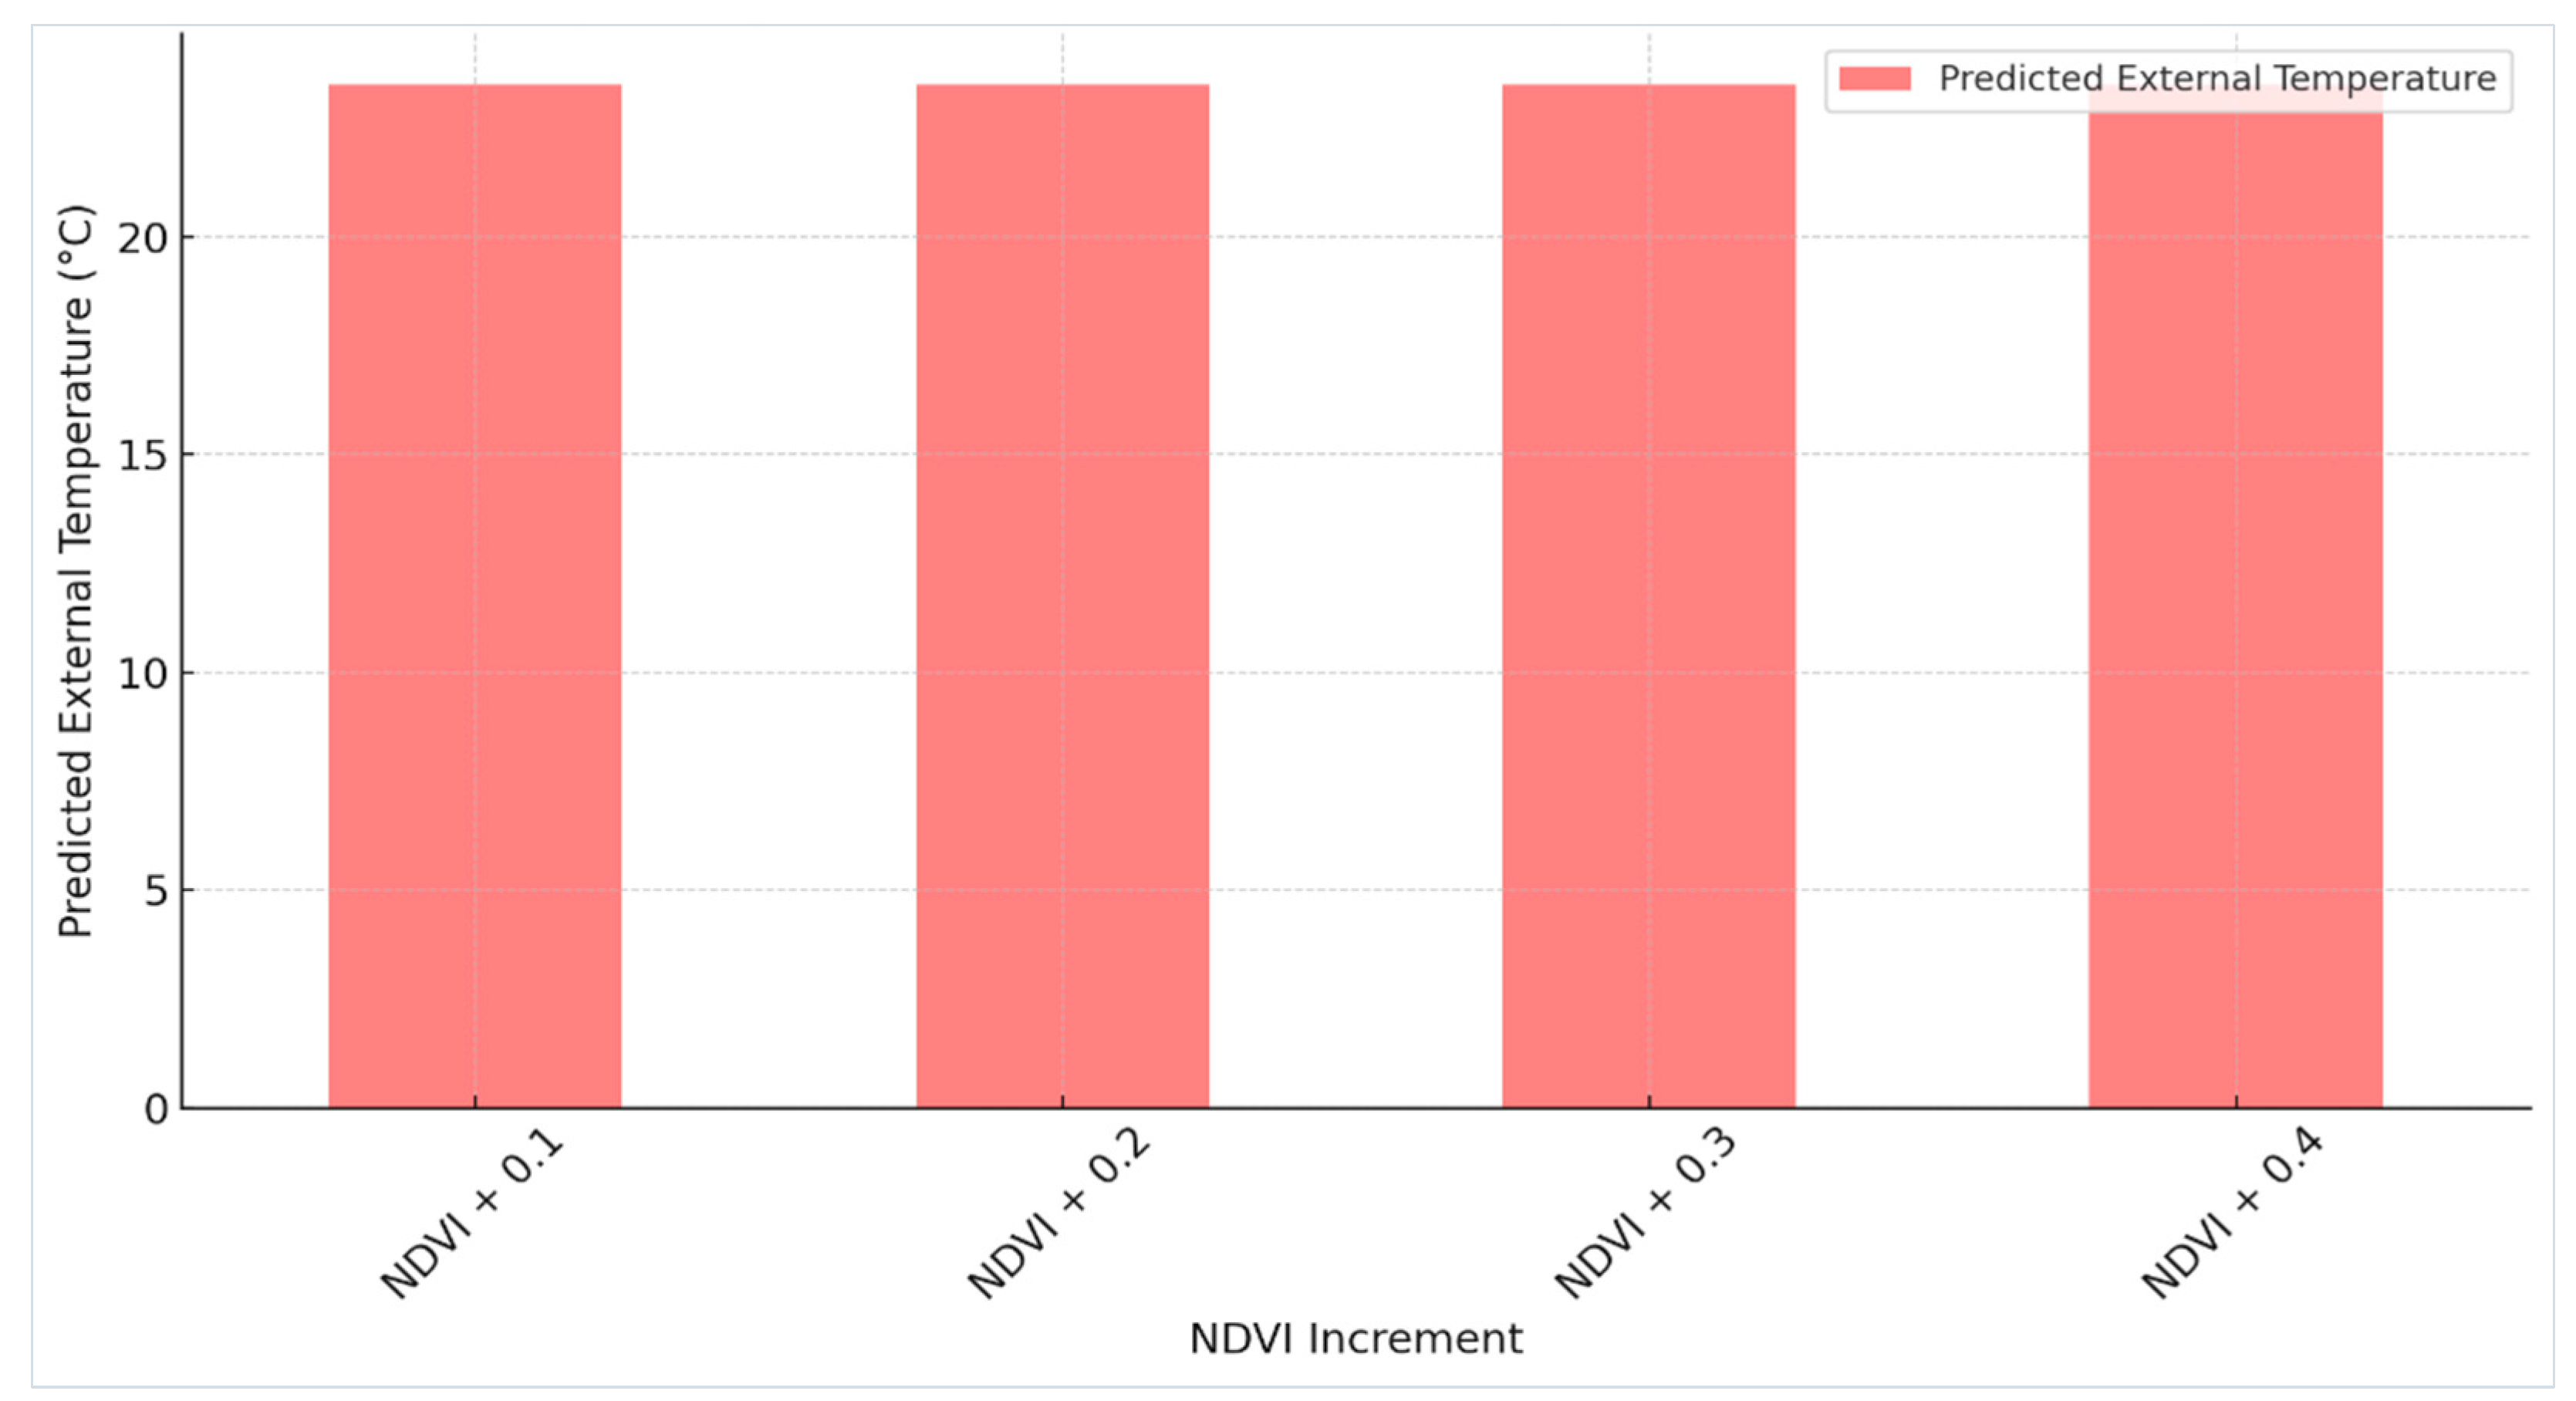
The regulatory impact analysis highlights the potential of building codes and green roof mandates to improve environmental indices and reduce urban temperatures (see Figure 19). The sensitivity analysis revealed that increasing NDVI within the tested range did not significantly affect the predicted external temperature, remaining constant at 23.51°C regardless of the NDVI increment. This suggests that the model might not be sensitive to NDVI changes within this range or that other factors dominate the prediction. Possible explanations include model limitations in capturing NDVI sensitivity, the dominance of other factors like NDBI and NDSI, or unique characteristics of the dataset.
Figure 18.
Sensitivity Analysis Predicted External Temperature With Increasing MDVI.
These findings align with previous studies advocating for regulatory measures, such as those of [38], who emphasized the role of urban design in mitigating UHI effects. Integrating 3D survey data in our analysis underscores the importance of considering urban morphology in regulatory frameworks. As identified through our topographic survey, high aspect ratios in urban canyons correlate with higher UHI intensity, reinforcing the need for urban planning that promotes adequate ventilation and reflective materials.
The regulatory impact analysis highlights the potential of building codes and green roof mandates to improve environmental indices and reduce urban temperatures. This supports the conclusions of previous studies that advocate for policy measures to enhance urban resilience to heat. Integrating 3D survey data in our analysis underscores the importance of considering urban morphology in regulatory frameworks. As identified through our topographic survey, high aspect ratios in urban canyons correlate with higher UHI intensity, reinforcing the need for urban planning that promotes adequate ventilation and reflective materials [39], as suggested.
5.4. Dominant Factors Influencing UHI
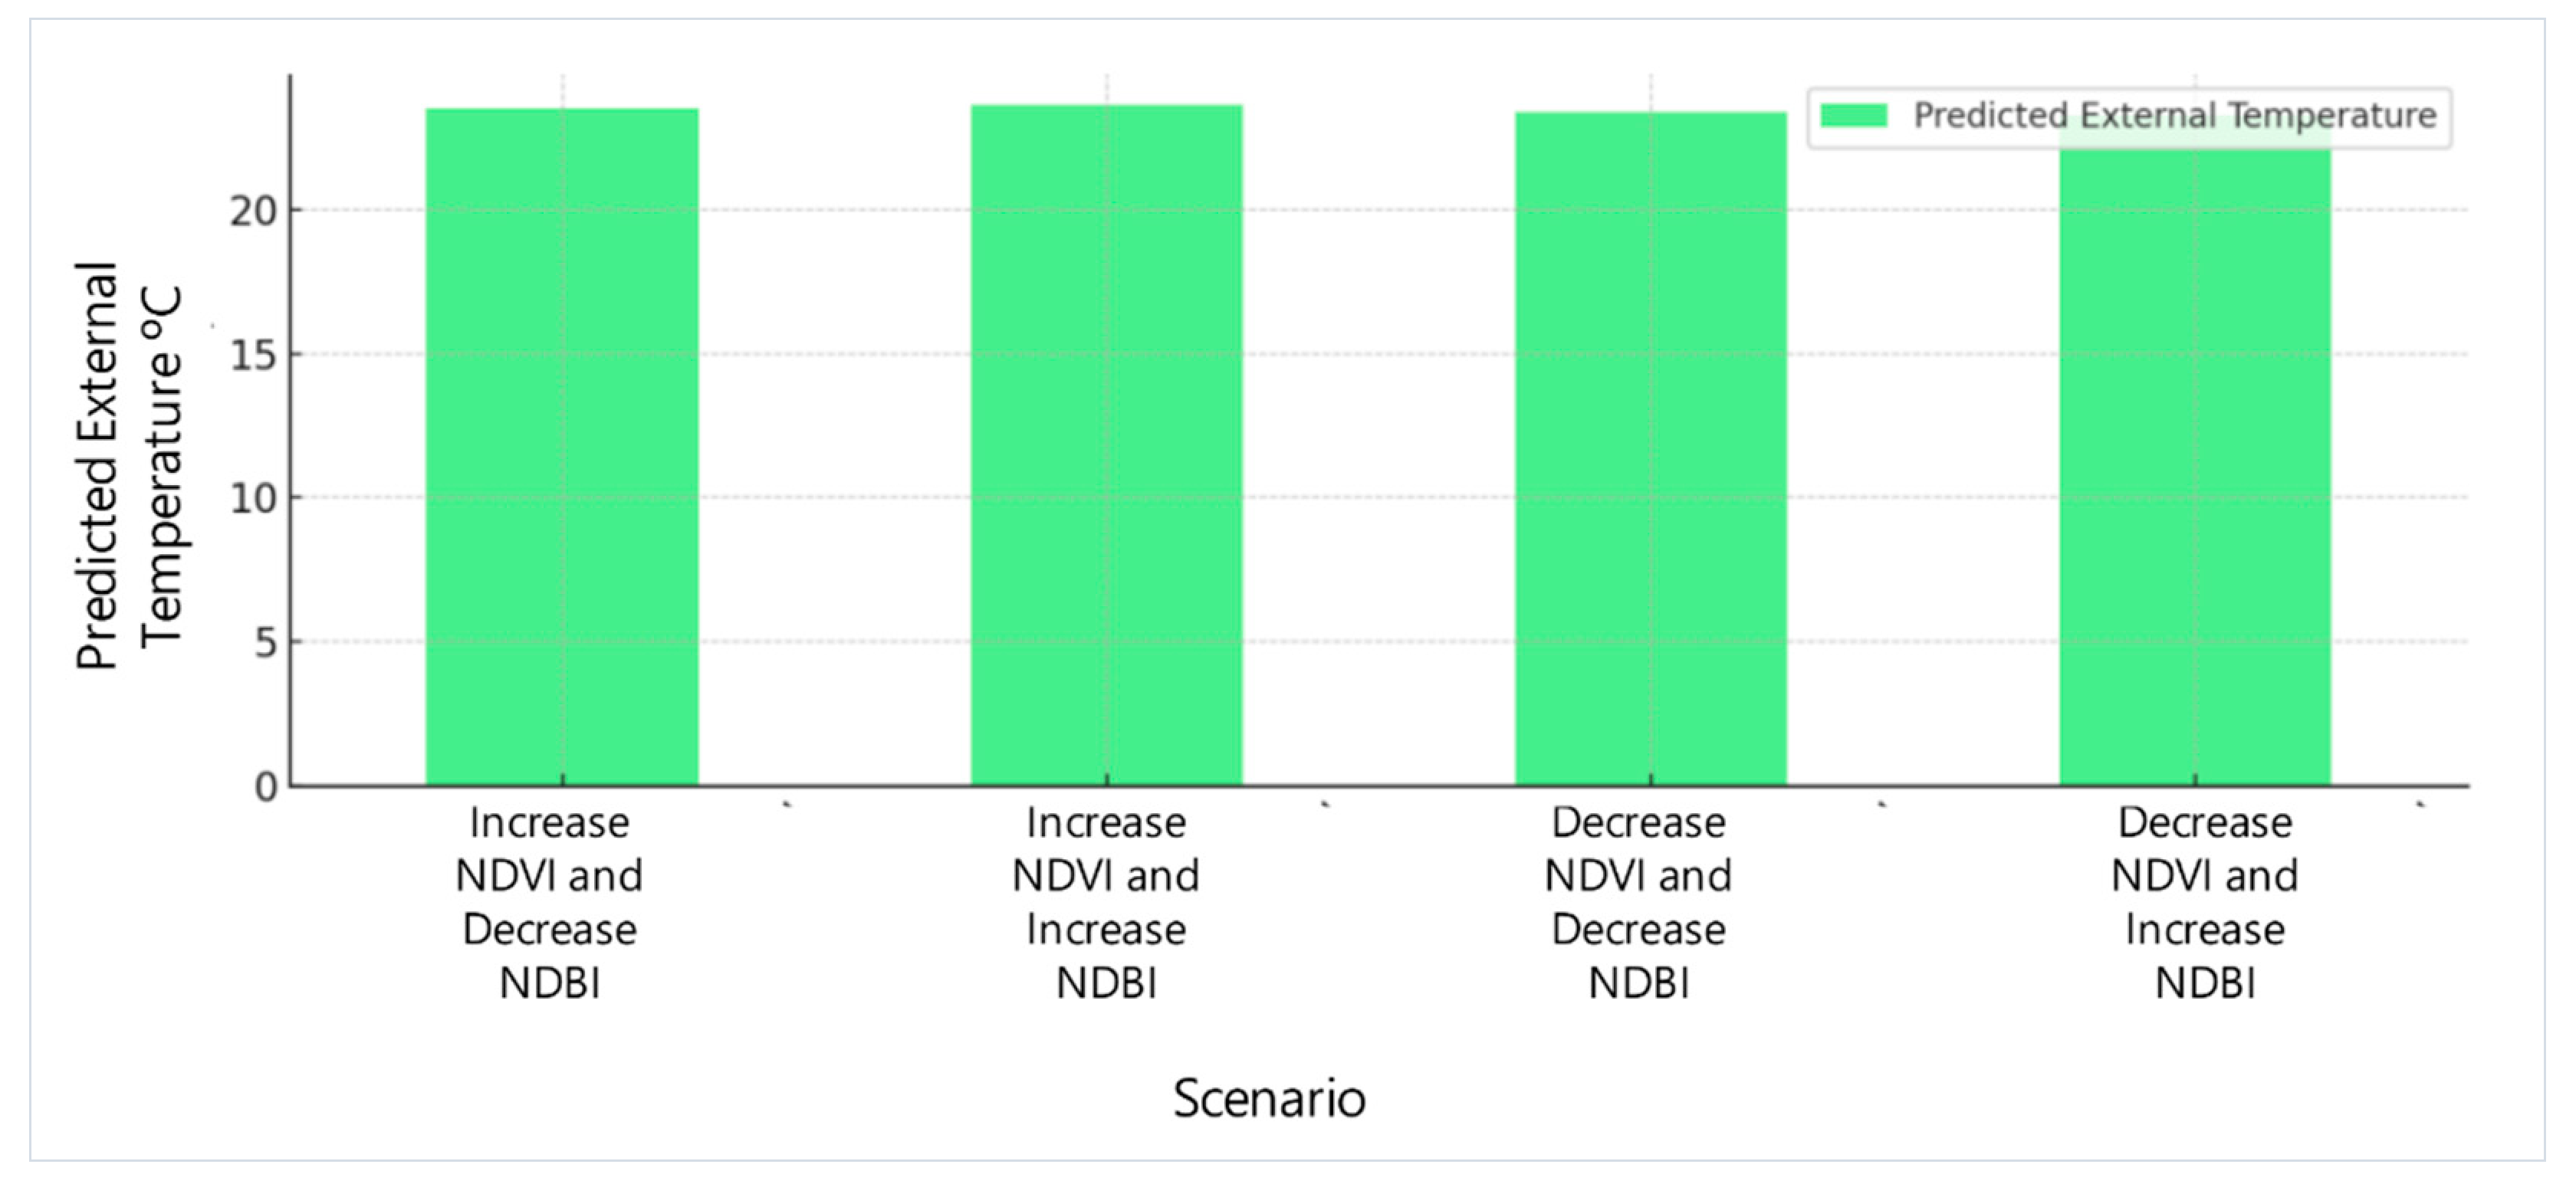
Analysis 4 identifies NDSI and NDBI as the dominant factors influencing outdoor temperature predictions. Feature importance analysis shows that NDSI (38.97%) and NDBI (32.74%) significantly impact external temperature, while NDVI (25.43%) has a lesser effect. Partial dependence plots indicate that higher NDSI and NDBI values increase temperatures, with NDVI's effect moderated by these indices. Combined scenario analysis shows:
- Increasing NDVI and decreasing NDBI: Temperature = 23.55°C
- Increasing both NDVI and NDBI: Temperature = 23.65°C
- Decreasing both NDVI and NDBI: Temperature = 23.42°C
- Decreasing NDVI and increasing NDBI: Temperature = 23.26°C
These results highlight that NDBI changes impact temperature more than NDVI changes. The interactions suggest that merely increasing vegetation is insufficient; effective UHI mitigation requires reducing built-up areas while increasing vegetation to achieve cooling effects.
Figure 18.
Combined Scenario Analysis: Predicted External Temperature.
The study comprehensively explains the effects of urban heat island (UHI) on Matera. Temporal clustering highlights the need to address seasonal variations, especially during peak summer. The analysis of vegetation and building materials reveals that simply increasing green areas is insufficient without managing built-up areas and reducing the solar absorption coefficient of materials. Calcarenite, a common building material in Matera, has a high solar absorption coefficient, complicating UHI mitigation. Regulatory impact analysis shows that UHI mitigation policies are economically feasible, with long-term benefits outweighing costs. Dominant factors analysis identifies NDSI and NDBI as critical drivers of UHI intensity, indicating the necessity of balancing NDVI and NDBI and reducing solar absorption. Historical satellite imagery shows that decreasing NDSI contributes to the imbalance of other environmental parameters, exacerbating UHI effects. Therefore, integrated strategies that reduce solar absorption, manage built-up areas, and increase vegetation are essential.
The economic analysis supports the implementation of green roofs and reflective materials, demonstrating long-term savings and health benefits. These findings suggest that effective UHI mitigation requires a holistic approach that balances historic preservation with modern sustainability needs. This study provides valuable insights for urban planners and policymakers, enhancing urban resilience to climate change and ensuring sustainable development in historic urban environments.
6. Conclusions and Recommendations
Advanced models such as random forest regression provide a detailed understanding of the factors contributing to UHI, facilitating the development of effective mitigation strategies. The study revealed several key findings on the effects of Urban Heat Islands (UHI) on Matera. The temporal clustering analysis highlighted the importance of addressing seasonal variations, especially during the summer when the UHI effect intensifies. The results showed that increasing green areas alone cannot mitigate UHI in Matera due to the complex interaction between NDVI, NDBI, and NDSI and calcarenite's high solar absorption coefficient. NDSI and NDBI were identified as the most influential factors in predicting external temperature, suggesting that management of built-up areas and reduction of solar absorption are essential. In addition, the economic analysis showed that UHI mitigation policies, such as the implementation of green roofs and reflective materials, are economically viable in the long term, with benefits significantly outweighing the costs. The decrease in NDSI, according to historical satellite imagery, contributes to the imbalance of other environmental parameters, exacerbating the effects of UHI.
Based on these findings, it is recommended that integrated strategies be implemented, which include reducing solar absorption of building materials, managing built-up areas, and increasing vegetation. Developing urban planning policies that promote adequate ventilation and reflective materials is crucial, balancing historic preservation with modern sustainability needs. In addition, it is essential to continue research through integrated data analysis to deepen the relationships and correlations of variables contributing to the UHI phenomenon using advanced methods such as random forest regression modeling. Maintaining continuous monitoring and updating models with new data will ensure the accuracy and relevance of mitigation strategies. Finally, it is recommended to involve the community in the planning and implementation of mitigation policies to ensure that the proposed solutions are practical and beneficial to residents.
7. Patents
The results of this preliminary research correspond to a research grant for the PhD internship in Cities and Landscapes: Architecture, Archeology, Cultural Heritage, History and Resources at DiCEM - Department of European and Mediterranean Culture: Architecture, Environment, and Culture. The research was conducted at DiCEM | CTM - House of Emerging Technology in Matera, Italy, under the project Adaptive Microcity: Digital Twin Experimentation = AFM & Ai+D, at the University of Basilicata.
Supplementary Materials
The following supporting information can be downloaded at the website of this paper posted on Preprints.org, Table S1: Literature Review; Table S2: Analyzed Environmental Indices; Table S3: Meteorological Data Summary; Table S4: Scenario Analysis Results_1; Table S5. Regulatory Impact Analysis Results; Table S6: Feature Importances for External Temperature; Table S7: Integrated Dataset
Author Contributions
Conceptualization, Perlaza J. and Guida A.; methodology, Perlaza J.; software, Fattore C. and Perlaza J.; validation, Perlaza J., Guida A. and Fattore C.; formal analysis, Perlaza J., Guida A.; research, Perlaza J.; data curation, Perlaza J. and Fattore C.; writing-preparing the original draft, Perlaza J.; writing-revising and editing, Perlaza J.; visualization, Perlaza J.; supervision, Guida A.; project administration, Guida A.; securing funding, Guida A.
Funding
The research activity is funded by the CTEMT agreement stipulated between the University of Basilicata, the National Research Council, the Polytechnic University of Bari, and the Municipality of Matera. This activity aims to support the development of the "Data Lake" platform using the technical approach of AFM (material flow analysis). CUP I14E200000020001
Institutional Review Board Statement
Not applicable
Informed Consent Statement
Not applicable
Data Availability Statement
Not applicable
Acknowledgments
Not applicable
Conflicts of Interest
The authors declare no conflicts of interest. The funders had no role in the study's design, data collection, analysis, interpretation, manuscript writing, or decision to publish the results.
References
- H. K. Jabbar, M. N. Hamoodi, and A. N. Al-Hameedawi, “Urban heat islands: A review of contributing factors, effects, and data,” in IOP Conference Series: Earth and Environmental Science, Institute of Physics, 2023. [CrossRef]
- U. de Barcelona, M. del Carmen Moreno García, and J. Antonio Serra Pardo, “Biblio3W REVISTA BIBLIOGRÁFICA DE GEOGRAFÍA Y CIENCIAS SOCIALES El estudio de la isla de calor urbana en el ámbito mediterráneo: Una revisión bibliográfica,” Depósito Leg. B, vol. 21, pp. 742–98.
- Conte, La citta’ scavata. 2014.
- T. Cardinale, D. Colapietro, N. Cardinale, and F. Fatiguso, “Evaluation of the efficacy of traditional recovery interventions in historical buildings. A new selection methodology,” in Energy Procedia, Elsevier Ltd, 2013, pp. 515–524. [CrossRef]
- R. B. Xiao et al., “A review of the eco-environmental consequences of urban heat islands,” Acta Ecologica Sinica, vol. 25, no. 8. 2005.
- E. Bozonnet, M. Musy, I. Calmet, and F. Rodriguez, “Modeling methods to assess urban fluxes and heat island mitigation measures from street to city scale,” Int. J. Low-Carbon Technol., vol. 10, no. 1, pp. 62–77, Mar. 2015. [CrossRef]
- Y. Li, Y. Sun, J. Li, and C. Gao, “Socioeconomic drivers of urban heat island effect: Empirical evidence from major Chinese cities,” Sustain. Cities Soc., vol. 63, Dec. 2020. [CrossRef]
- Y. Zhang, Y. W. Zhao, Z. F. Yang, B. Chen, and G. Q. Chen, “Measurement and evaluation of the metabolic capacity of an urban ecosystem,” Commun. Nonlinear Sci. Numer. Simul., vol. 14, no. 4, 2009. [CrossRef]
- M. Huang, S. Zhong, X. Mei, and J. He, “Spatiotemporal Patterns in the Urban Heat Island Effect of Several Contemporary and Historical Chinese ‘Stove Cities,’” Sustain. , vol. 16, no. 7, pp. 1–16, 2024. [CrossRef]
- S. Tong, J. Prior, G. McGregor, X. Shi, and P. Kinney, “Urban heat: An increasing threat to global health,” BMJ, vol. 375, pp. 1–5, 2021. [CrossRef]
- P. E. Phelan et al., “Urban Heat Island: Mechanisms, Implications, and Possible Remedies,” Annu. Rev. Environ. Resour., vol. 40, pp. 285–307, 2015. [CrossRef]
- N. Cardinale, G. Rospi, P. Stefanizzi, and V. Augenti, “INTERNATIONAL JOURNAL OF ENERGY AND ENVIRONMENT Thermal properties of the vernacular buildings envelopes: The case of the ‘Sassi di Matera’ and ‘Trulli di Alberobello,’” J. homepage www.IJEE.IEEFoundation.org ISSN, vol. 2, no. 4, pp. 2076–2909, 2011, [Online]. Available: www.IJEE.IEEFoundation.org.
- K. Deilami, M. Kamruzzaman, and Y. Liu, “Urban heat island effect: A systematic review of spatio-temporal factors, data, methods, and mitigation measures,” International Journal of Applied Earth Observation and Geoinformation, vol. 67. Elsevier B.V., pp. 30–42, May 01, 2018. [CrossRef]
- D. Jato-Espino, “Spatiotemporal statistical analysis of the Urban Heat Island effect in a Mediterranean region,” Sustain. Cities Soc., vol. 46, p. 101427, 2019. [CrossRef]
- J. He, “Potentials of meteorological characteristics and synoptic conditions to mitigate urban heat island effects,” Urban Clim., vol. 24, no. November 2017, pp. 26–33, 2018. [CrossRef]
- E. Bonomo, A. Minervino Amodio, G. Prosser, M. Sileo, and G. Rizzo, “Evaluation of soft limestone degradation in the Sassi UNESCO site (Matera, Southern Italy): Loss of material measurement and classification,” J. Cult. Herit., vol. 42, pp. 191–201, Mar. 2020. [CrossRef]
- M. Y. Joshi, D. G. Aliaga, and J. Teller, “Predicting Urban Heat Island Mitigation with Random Forest Regression in Belgian Cities BT - Intelligence for Future Cities,” R. Goodspeed, R. Sengupta, M. Kyttä, and C. Pettit, Eds., Cham: Springer Nature Switzerland, 2023, pp. 305–323.
- L. Gartland, Heat islands : Understanding and mitigating heat in urban areas. Earthscan, 2011.
- V. Selicati, N. Cardinale, and M. Dassisti, “Evaluation of the sustainability of energy retrofit interventions on the historical heritage: A case study in Matera, Italy,” Int. J. Heat Technol., vol. 38, no. 1, pp. 17–27, Mar. 2020. [CrossRef]
- Chartered Institution of Building Services Engineers (CIBSE), The limits of thermal comfort: Avoiding overheating in European buildings. CIBSE Technical Memorandum 52 (TM52:2013). Great Britain, 2013.
- González, A. Donnelly, M. Jones, N. Chrysoulakis, and M. Lopes, “A decision-support system for sustainable urban metabolism in Europe,” Environ. Impact Assess. Rev., vol. 38, pp. 109–119, Jan. 2013. [CrossRef]
- L. G. Vaca, E. C. Vallejo-coral, J. Martíninez-gomez, and M. Orozco, “Análisis de Confort Térmico de Voto Medio Pronosticado Aplicando Simulaciones Energéticas con Materiales de Cambio de Fase para Climas Muy Cálidos-Húmedos en Vivienda Social en Ecuador,” p. 31, 2021.
- Martilli, E. S. Krayenhoff, and N. Nazarian, “Is the Urban Heat Island intensity relevant for heat mitigation studies?” Urban Clim., vol. 31, Mar. 2020. [CrossRef]
- E. E. Menacho C. and S. N. Teruya R., “Análisis de la relación de la isla de calor urbano con factores demográficos, espaciales y ambientales de Lima metropolitana usando sensores remotos,” An. Científicos, vol. 80, no. 1, p. 60, Jun. 2019. [CrossRef]
- Zhou, S. Bonafoni, L. Zhang, and R. Wang, “Remote sensing of the urban heat island effect in a highly populated urban agglomeration area in East China,” Sci. Total Environ., vol. 628–629, pp. 415–429, Jul. 2018. [CrossRef]
- J. Cayambe, J. Riofrio, and J. Dávila, “Analysis of socio-economic determinants and their impact on home ownership in Machala, Ecuador.”.
- S. Zhao et al., “Rates and patterns of urban expansion in China’s 32 major cities over the past three decades,” Landsc. Ecol., vol. 30, no. 8, 2015. [CrossRef]
- M. F. Arriaga and K. E. Martínez-torres, “WILL CITIES The future of sustainable buildings and urbanism in the,” no. March 2023, 2022.
- Tamaskani Esfehankalateh, J. Ngarambe, and G. Y. Yun, “Influence of tree canopy coverage and leaf area density on urban heat island mitigation,” Sustain., vol. 13, no. 13, 2021. [CrossRef]
- S. Li, Y. Zhang, Z. Yang, H. Liu, and J. Zhang, “Ecological relationship analysis of the urban metabolic system of Beijing, China,” Environ. Pollut., vol. 170, 2012. [CrossRef]
- Matzarakis, L. Martinelli, and C. Ketterer, Relevance of thermal indices for assessing the urban heat Island. 2016. [CrossRef]
- M. RIZWAN, L. Y. C. DENNIS, and C. LIU, “A review on the generation, determination, and mitigation of Urban Heat Island,” J. Environ. Sci., vol. 20, no. 1, pp. 120–128, 2008. [CrossRef]
- M. Santamouris, “Chapter 1 - Urban climate change: Reasons, magnitude, impact, and mitigation,” R. Paolini and M. B. T.-U. C. C. and H. I. Santamouris, Eds., Elsevier, 2023, pp. 1–27. [CrossRef]
- K. R. Murphy, “Performance evaluation will not die, but it should.,” Hum. Resour. Manag. J., vol. 30, no. 1, pp. 13–31, 2020. [CrossRef]
- T. Cuerdo-Vilches et al., “Impact of urban heat islands on morbidity and mortality in heat waves: Observational time series analysis of Spain’s five cities,” Sci. Total Environ., vol. 890, p. 164412, 2023. [CrossRef]
- M. Santamouris, “Cooling the cities – A review of reflective and green roof mitigation technologies to fight heat island and improve comfort in urban environments,” Sol. Energy, vol. 103, pp. 682–703, 2014. [CrossRef]
- H. Akbari and L. S. Rose, “Urban Surfaces and Heat Island Mitigation Potentials,” J. Human-Environment Syst., vol. 11, no. 2, pp. 85–101, 2008. [CrossRef]
- Çalşkan, “Design thinking in urbanism: Learning from the designers,” Urban Des. Int., vol. 17, no. 4, pp. 272–296, 2012. [CrossRef]
- Moughtin, Urban Design: Street and Square.
Figure 4.
Temperature Trends (2016-2023).
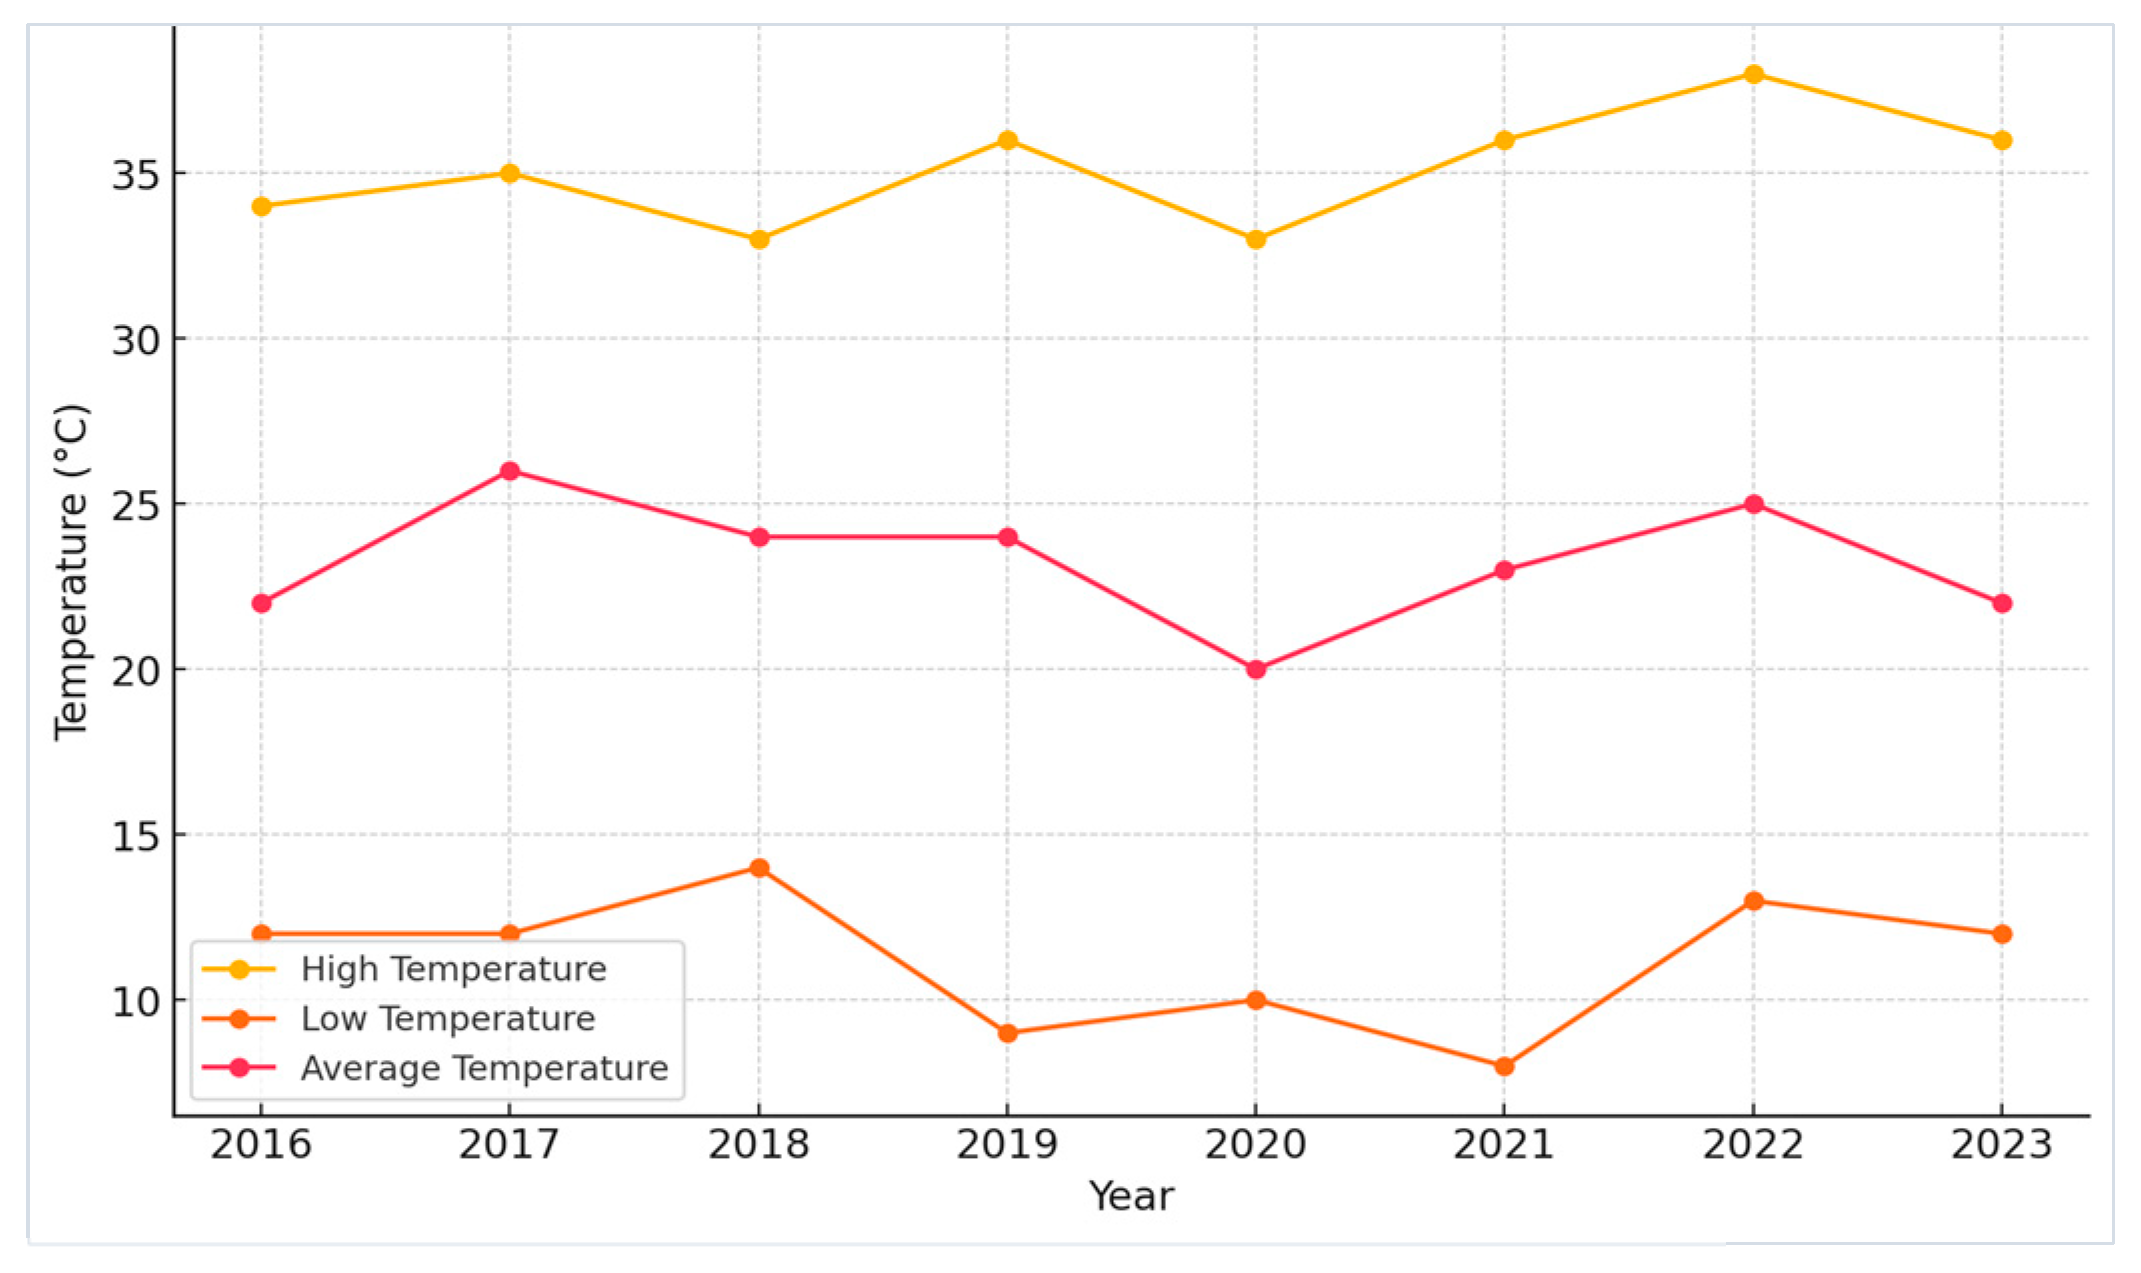
Figure 5.
Humidity Trends (2016-2023).
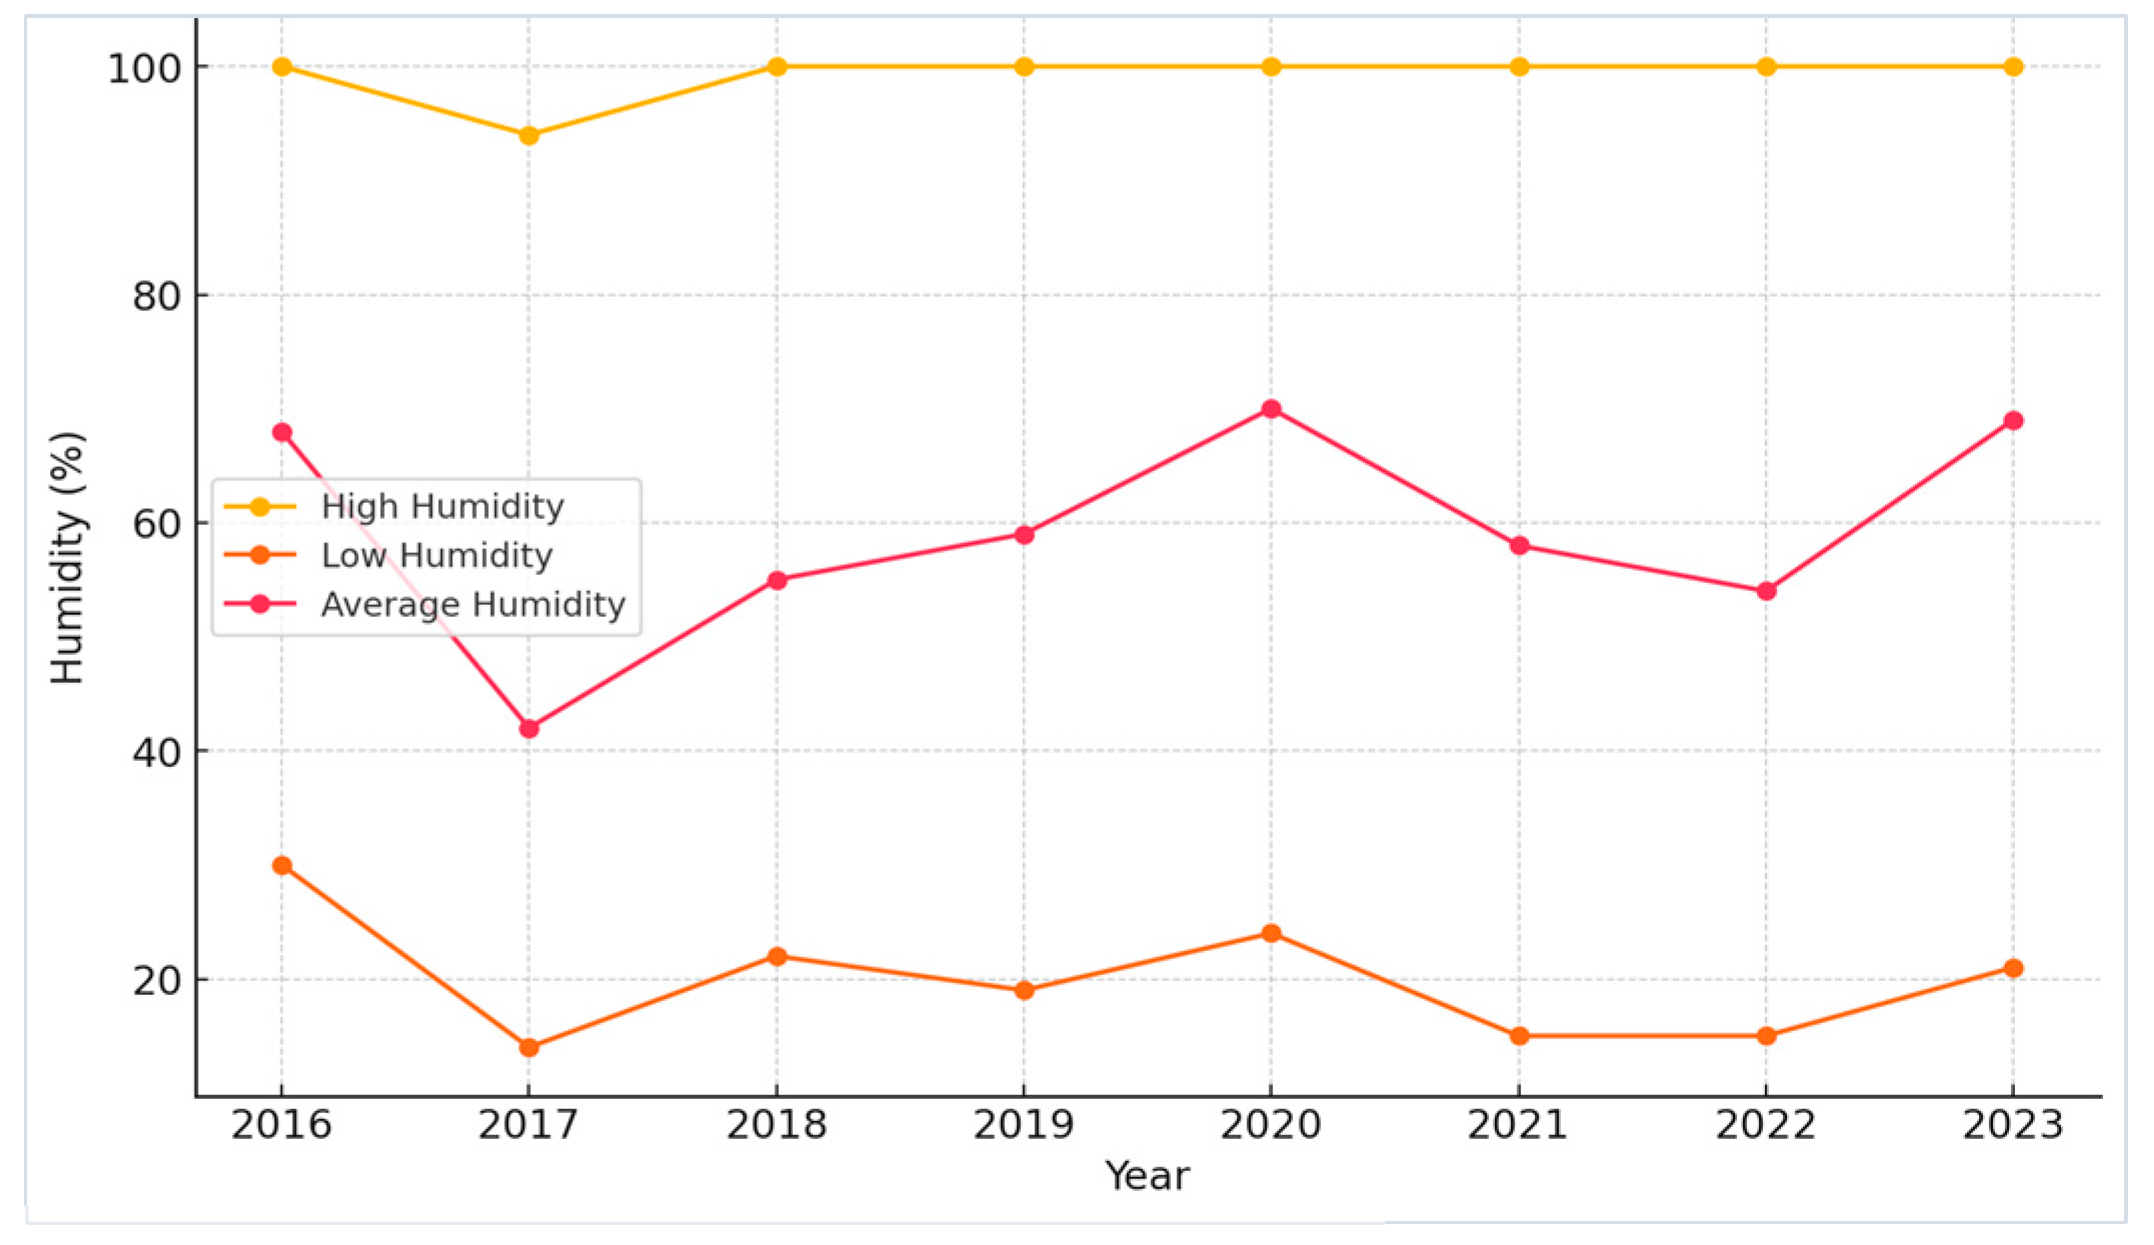
Figure 6.
Pressure Trends (2016-2023).
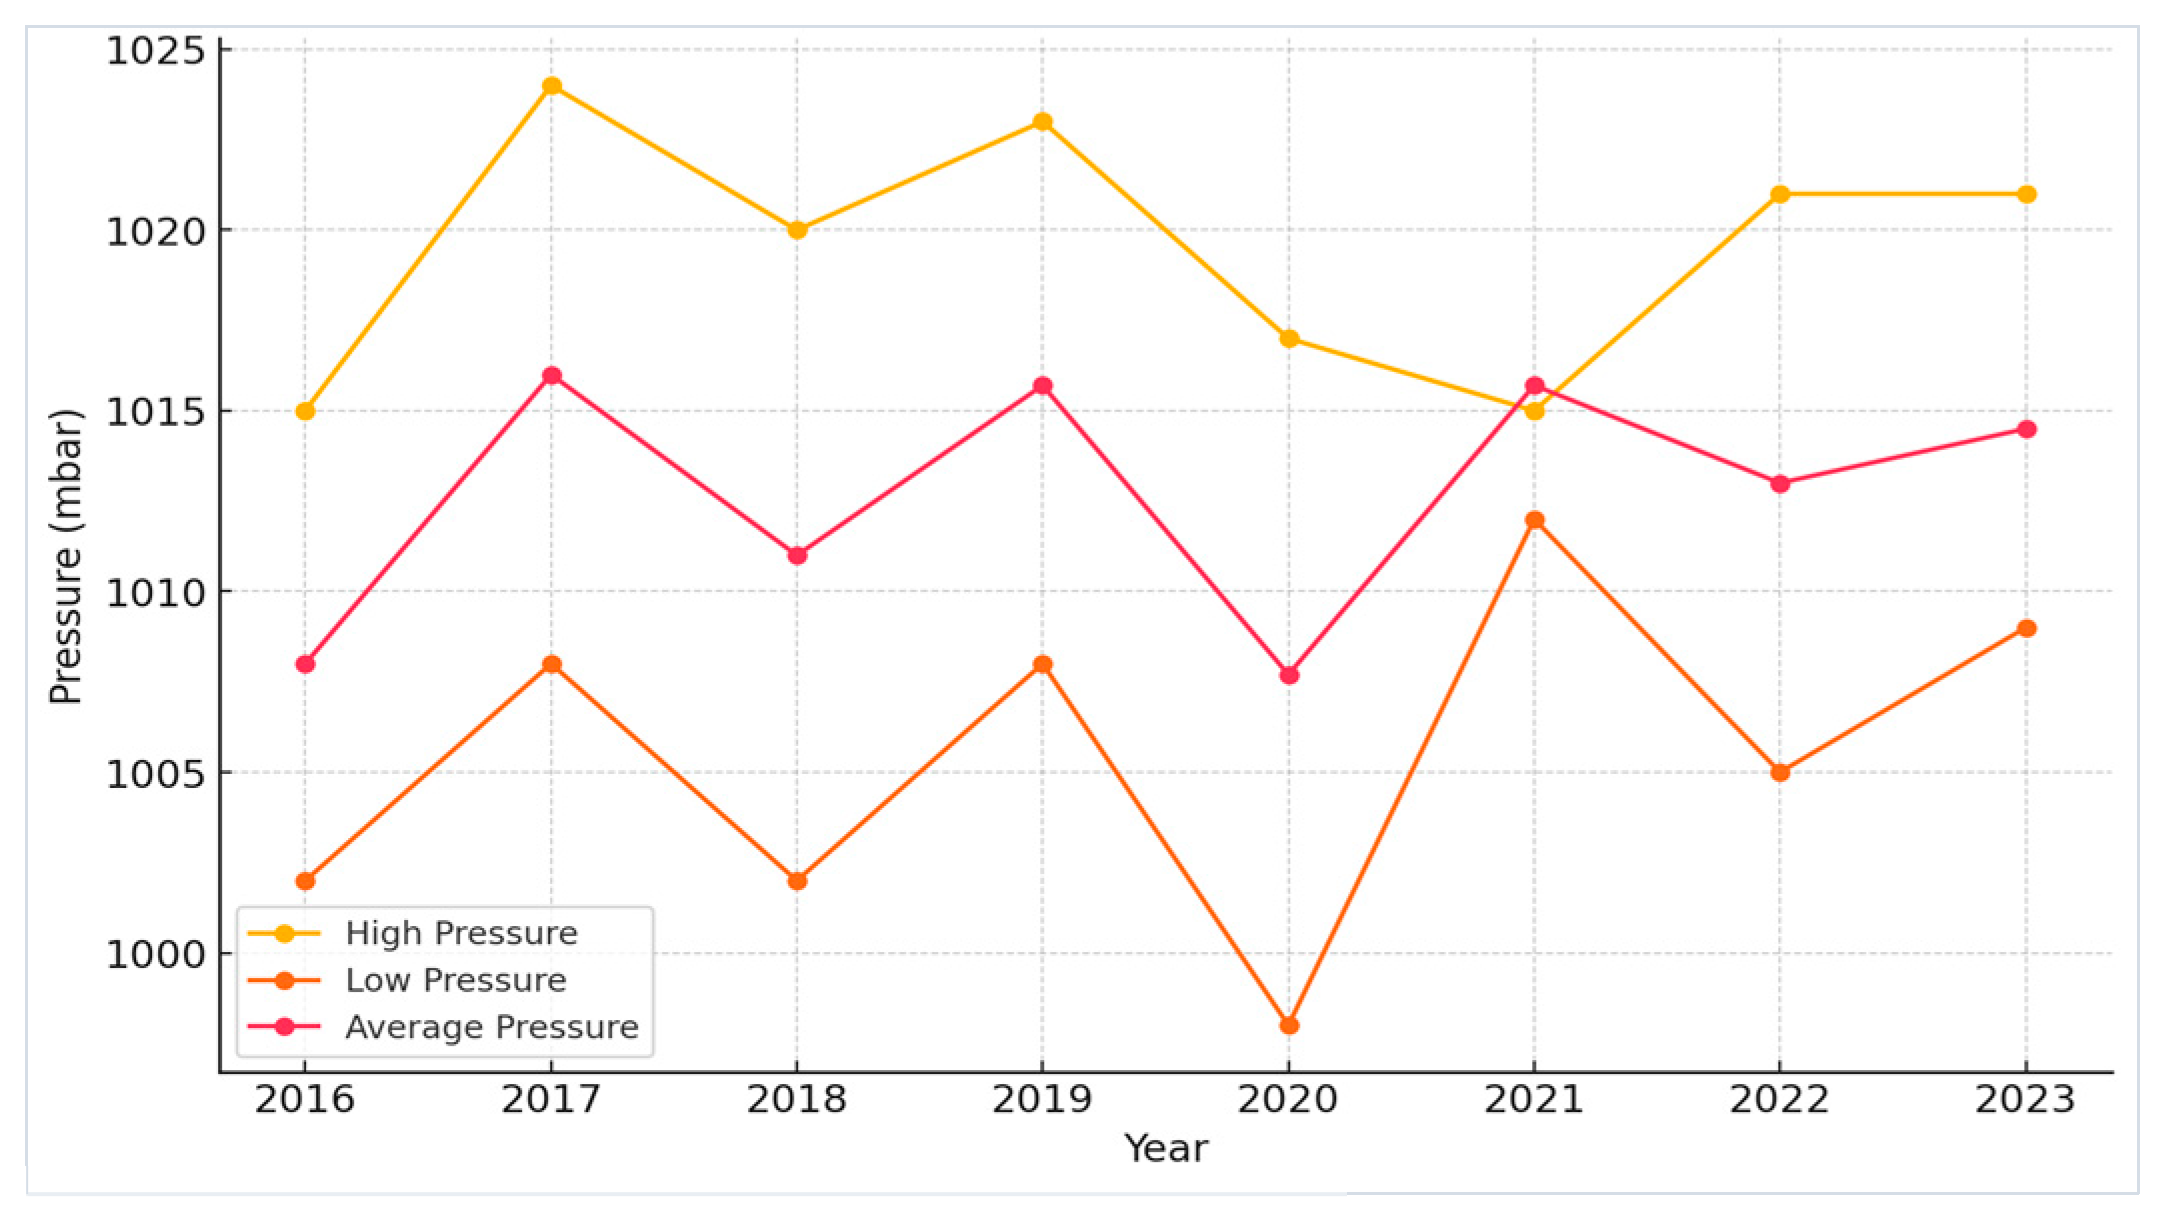
Figure 7.
Graphical diagram of the internal thermal behavior of the monitored dwelling.
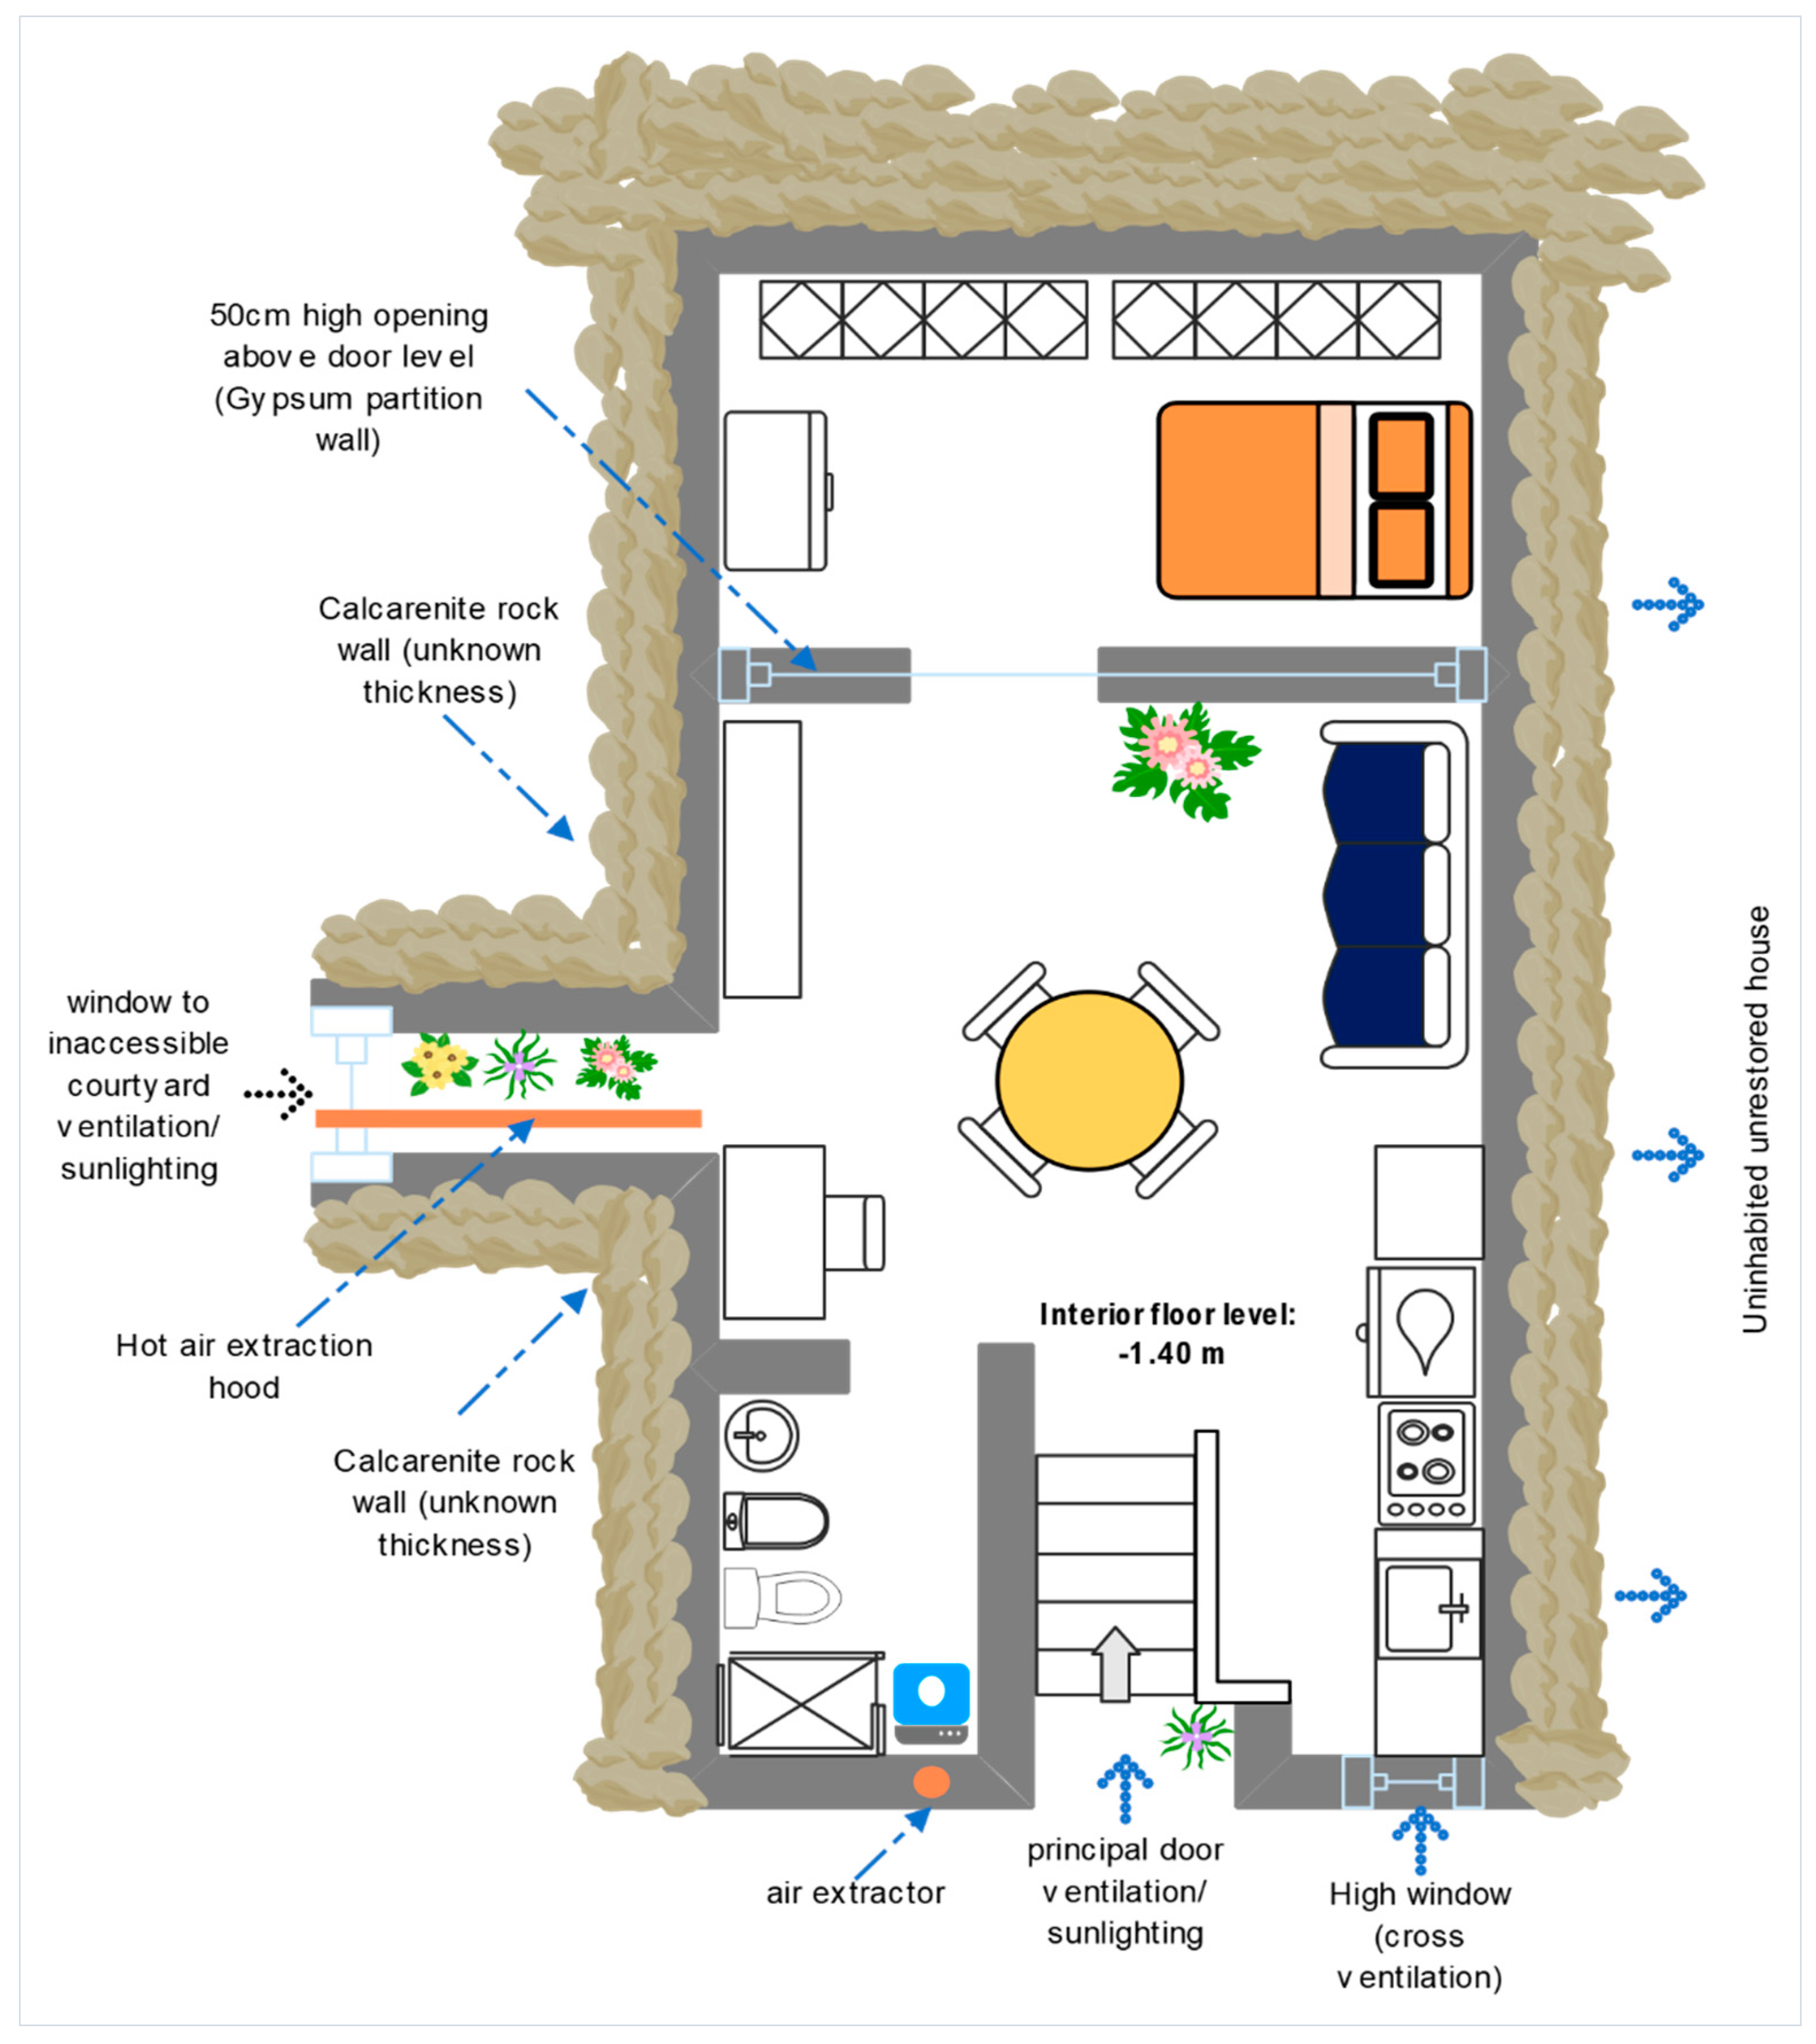
Figure 16.
Partial Dependence Plots.
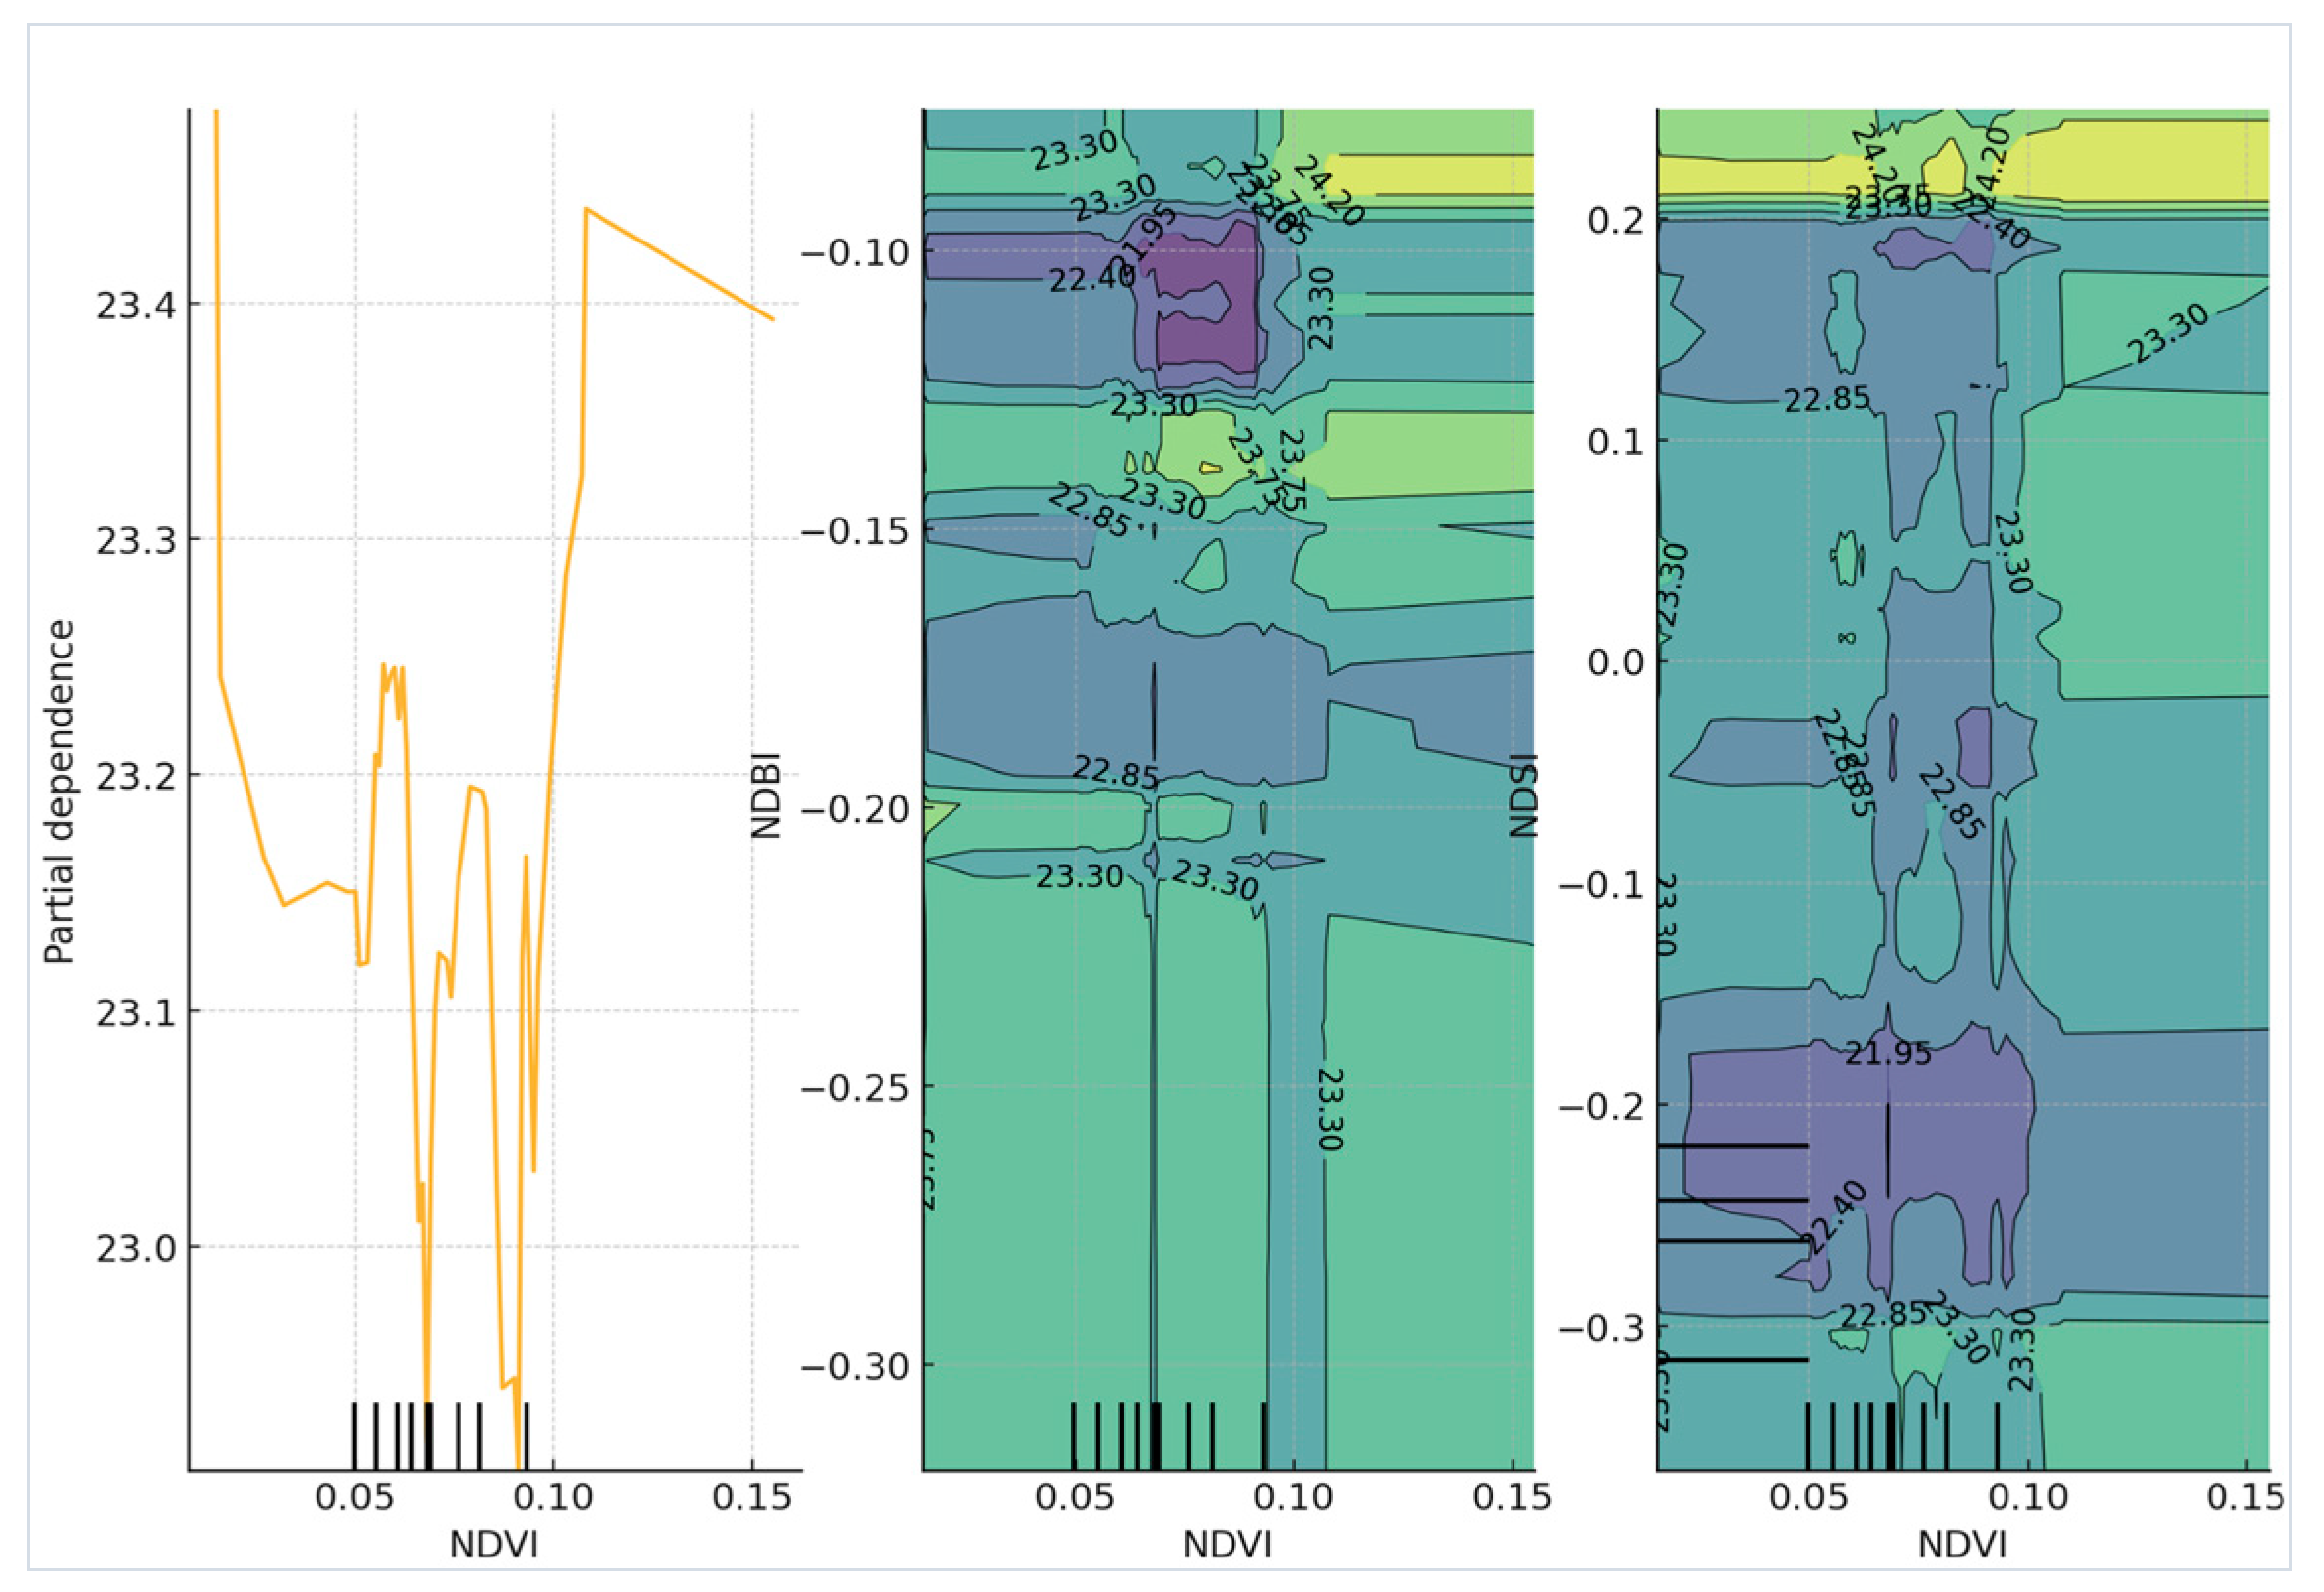
Figure 17.
Correlation Matrix.
Disclaimer/Publisher’s Note: The statements, opinions and data contained in all publications are solely those of the individual author(s) and contributor(s) and not of MDPI and/or the editor(s). MDPI and/or the editor(s) disclaim responsibility for any injury to people or property resulting from any ideas, methods, instructions or products referred to in the content. |
© 2024 by the authors. Licensee MDPI, Basel, Switzerland. This article is an open access article distributed under the terms and conditions of the Creative Commons Attribution (CC BY) license (http://creativecommons.org/licenses/by/4.0/).
Copyright: This open access article is published under a Creative Commons CC BY 4.0 license, which permit the free download, distribution, and reuse, provided that the author and preprint are cited in any reuse.


