Submitted:
02 July 2024
Posted:
04 July 2024
Read the latest preprint version here
Abstract
The production and consumption of plastic bottled water have several negative environmental impacts worldwide. The EU countries have adopted strategies and programs to reduce single-use plastics (e.g. PET bottles). A critical aspect of designing effective policies is understanding consumer behaviour. To identify barriers and motivations for consuming tap and bottled water, we conducted a questionnaire survey among 3,411 respondents in the Czech Republic in 2022. The methods used include estimation using the Generalized Ordered Logit. The results reveal that young people appear to be moderate consumers of bottled water and heavy consumers of tap water. Bottled water consumption was more likely to be lower among people with higher education, while tap water consumption was lower among people with lower incomes. The factors that appear to have the most significant influence on bottled and tap water consumption are taste perception, health concerns and habit. Health concerns about tap water and the unpleasant taste of tap water influence higher consumption of bottled water and vice versa. People with a strong habit of drinking tap water are less likely to consume bottled water. The constructs from the Theory of Planned Behavior were statistically significant. The results can guide decision-makers by promoting the availability of tap water in public places in conjunction with a campaign targeting taste perception and health and promoting the habit of drinking tap water.
Keywords:
Tap water
; Bottled water
; Consumer behaviour
; Theory of Planned Behaviour
; Questionnaire survey
1. Introduction
The production and consumption of plastic bottled water has a number of negative environmental impacts. The environmental impact of drinking bottled water is estimated to be 1400 times higher in terms of species loss and 3500 times higher for resource use than tap water (comparing a scenario where the entire population consumed tap water versus a scenario where the entire population drank bottled water, [1]). Production is energy intensive [2]) and improper disposal leads to plastic waste pollution [3].
To address environmental problems, the EU countries have been adopting a number of strategies and programs. One of the most important ones is the EU Green Deal strategy together with the 17 Sustainable Development Goals [4] and then in particular the revised EU Drinking Water Directive (in force since January 2021 and with the need to be transposed into Member States' national law and its provisions met by January 2023), which is the EU's main drinking water law. One of its main features, in addition to reinforcing water quality standards, is the obligation to promote tap water to consumers, including in public areas and restaurants [5]. In the Czech Republic, there is an action plan „Circular Czechia 2040“with the aim of a successful transition to a circular economy [6]. Among the many objectives of this plan is also the reduction of single-use plastics (e.g. PET bottles). To reduce the negative environmental impacts of bottled water production and consumption, effective measures should be designed and adopted.
One important aspect of designing effective policies is understanding consumer behavior. A number of international studies have therefore analyzed consumer behavior in terms of consumption of tap and bottled water. Important factors that explain tap and bottled water consumption are organoleptic properties [7,8,9,10,11,12], health reasons [13,14,15], convenience [16,17,18,19,20], environmental aspects [21], socio-demographic characteristics [22,23] and constructs from the theory of planned behavior [24] which are also a very important feature to explain bottled and tap water use [25,26].
The organoleptic properties of water can be considered as taste, smell, appearance or color and represent one of the key characteristics for perception and preference in consumer water choice [9,10,19]. The most important of these is probably taste. Representative research for the Flemish population in Belgium finds the taste of bottled water to be essential over the taste of tap water [23]. According to the findings of the US respondents, higher ratings of tap water quality in terms of taste, smell, and appearance were associated with an individual's decision to drink tap water, particularly when comparing a group that drinks only tap water with a group that drinks only bottled water [8]. In the case of the German sample, consumers of bottled water rated bottled water as significantly preferable in terms of taste, smell and color, while consumers of tap water demonstrated the opposite by rating it as significantly less preferable across all factors compared to tap water [7]. Delpha et al. [10] then build on results from Canadian respondents to add that perceptions of overall tap water quality emerged as a key determinant of consumption choice: as satisfaction with overall quality declined, the proportion of bottled water consumption increased. People who were dissatisfied with the taste and smell of tap water were more likely to prefer or drink only bottled water.
Health reasons are linked to safety and concerns about the potential health risks of drinking water, with a number of studies showing that tap water tends to be considered riskier and less safe [10,13,14,15,17,20,23]. For example, Aslani et al. [13] reported that up to 74% of research participants in Iran believed that tap water can often be contaminated (especially with toxic chemicals, microbial agents, or nitrate compounds) and thus cannot be a reliable source in terms of quality. Viscusi et al. [19], using a representative survey in the USA, then mention that these facts are reasons for respondents to consume more bottled water.
Convenience is a very important factor, especially the ease and accessibility of using the product. In the case of bottled water, it has been shown to be preferable to tap water in terms of consumption [16,17,18,19]. Based on a study conducted among students in the USA, Bethurem et al. [16] show that convenience, in the sense of the lack of water refill stations near student dorm rooms, was one of the key reasons for choosing bottled water. Jones et al. [17] also find convenience to be a major reason for using bottled water, using examples from focus groups in Canada. A large number of participants in this research bought bottled water simply because the bottle was portable, convenient, and generally well-received in the workplace and schools. Many of these study participants also said they only buy bottled water when they are out and about.
Environmental aspects represent attitudes expressing concern for the environment and pro-environmental behavior. In a study with Polish respondents, Borusiak et al. [21] showed that environmental concern, defined as a belief in the importance of environmental issues to human beings, leads to a reduction in bottled water consumption.
Sociodemographic characteristics are another factor that tends to be looked at in explaining water consumption, with studies most often discussing the influence of gender, age, and education, but also other characteristics. Geerts et al. [23] report a more frequent consumption of bottled water among men and older people, while in southern Italy, tap water consumption was positively associated with the age group 16 years and below among respondents [22]. People with lower levels of education have higher consumption of bottled water [9,23]. Canadian respondents with higher education then reported more frequent consumption of tap water [10], while female university students in Singapore drank bottled water slightly more often compared to tap water [18]. Ethnicity is reflected in the US, where Blacks and Hispanics are more likely to drink bottled water due to their relatively greater exposure to hazardous water and greater beliefs about potential risk [19].
The theory of planned behavior (TPB) is based on the central assumption of conscious intention to act as a key determinant of actual behavior. This intention is then further influenced by attitudes, perceived behavioral control, and subjective norms [24]. Studies have yielded mixed results due to the social context in different countries. While Mir Mohamad Tabar et al. [26] found social norms (family and friends who think the respondent should consume bottled water rather than tap water) to be key in explaining the consumption of bottled water among respondents in Iran, Saefi et al. [25] use the example of Indonesian students to show the importance of all factors within the TPB in encouraging tap water consumption among students.
Most studies have been conducted on samples that were not representative of the general population [7,8,9,10,12,13,15,16,18,21,22,25,26] except for a few that have been conducted in countries such as the USA [14,19], Poland and Ukraine [11] or in the Flemish population within Belgium [23].
To our knowledge, no similar study exists in the context of the Czech Republic and the following analysis aims to fill this gap. The novelty also lies in the incorporation of constructs from the theory of planned behavior [24] and its extension with habit into research on predictors of water consumption.
2. Materials and Methods
2.1. Data
In order to identify barriers and motivations for tap and bottled water consumption, we conducted a questionnaire survey in the Czech Republic in 2022. In particular, a Likert scale was used to identify attitudes, norms, perceived barriers and habits. The questionnaire also included questions that elicited additional data and information that shed light on respondents' attitudes and preferences, including those related to their socioeconomic status, consumption behaviour or values.
The recruitment of respondents for the survey was carried out by a contractor from an actively managed panel for the Czech Republic, i.e. a panel in which the identity of respondents was verified during recruitment and, where applicable, during the respondent's participation in the panel (e.g. survey questions that check one of the indicators listed in the registration questionnaire, telephone checks or checks on the uniqueness of the bank account number provided), and in which each respondent was controlled to take a maximum of 2 surveys per week, up to a maximum of 36 surveys per year.
Participation in the survey posed a risk to respondents comparable to normal internet surfing. The questionnaire survey did not ask controversial questions or questions that would be traumatic for the respondents to answer. The questionnaires were anonymous. The panel operator assigned a random identification number to the respondent at the beginning of the questionnaire, and only this random identification number is available to the researchers analyzing the survey data. The compliance of the questionnaire survey with the ethical principles of social science research was confirmed by the Research Ethics Committee of the Environment Centre at Charles University before they began.
The sample of respondents was selected by quota sampling with unbound quotas for region (14 regions), size of place of residence (3 categories), age (3 categories), gender (2 categories), and education (3 categories). The resulting sample is representative based on socio-demographic characteristics for the adult population (population aged 18 to 69 years); see Table 1.
In the data cleaning process, incomplete records, records with logical inconsistencies, and „speeders“, i.e. questionnaires completed in less time than other questionnaires (217 questionnaires in total), were discarded. „Speeders“ were defined as questionnaires below 48% of the median completion time. The pilot survey was conducted approximately one week before the main collection, with approximately 200 valid observations. The final total number of valid questionnaires in the dataset is 3411.
2.1. Measures
In the following section, we describe all the questions and response scales used in our models. We follow the composition of the survey questions, from frequency and reasons for water consumption to attitudes and norms and finally to sociodemographic questions.
Bottled and tap water consumption was recorded as frequency of consumption. Respondents answered the questions "How often do you personally drink tap water (water from the public tap)?" and "How often do you drink bottled water (sparkling or still, flavoured or unflavored, mineral, drinking, spring, or baby water)? " and had a total of 6 choices indicating the extent of their consumption ("Several times a day," "Once a day," "Several times a week," "Several times a month," "Less frequently," and "Never").
Taste was measured by having respondents indicate the option "Bad taste" for the question "For what reasons do you not drink tap water, or do you drink it infrequently?" or "What are your reasons for drinking bottled water?" they answered that the reason was "Taste". Health concern was measured using identical questions to taste, i.e. when respondents reported having health concerns about tap water (response options "Health concern" or "The water in our house is defective") or perceiving bottled water to be beneficial to their health (response options "It is healthier than tap" or "Safety").
The habit of drinking tap water was constructed based on the question "How often do the following situations happen to you?" which takes into account respondents' answers to only the following two statements: "If tap water is available, I prefer it to bottled water without thinking." and "I drink tap water automatically." The frequency of situations was measured on a 7-point Likert scale, where 1 represented "Rarely" and 7 represented "Very often." The result variable was created by adding two items (statements) and dividing them by the appropriate number (in this case two). The internal consistency of the scale was measured using Cronbach's alpha and has a value of 0.80, which is a result above 0.70 and indicates good scale consistency [27]. The calculated value indicates the average of the scores on the items included in the scale.
Environmental concern was measured by incorporating several statements related to this construct. Participants are asked to what extent they agree with three statements about environmental attitudes presented to them (...prevent pollution, ...live in harmony with nature, ...protect the environment). Responses to these are measured by a Likert scale containing six ratings ranging from one ('Not at all like me') to six ('Very much like me'). The variable was constructed as in the previous case (Cronbach's α=0.88).
Attitudes were constructed using the following six response-situations to the question "How good or bad do you think these situations are?" and the statement "If I drink mostly tap water for the next 3 months...": ...I will save money on bottled water, ...I will save time shopping and taking plastic bottles to the dumpster, ...I will have a mineral deficiency, ...I will get much less microplastics into my body, ...I will get harmful substances from chlorinating water, ...I will drink fresh water. Measurements were also made using a Likert scale format, with a rating of 1 being "Very Bad" and a rating of 7 being "Very Good" (or as 1 "Strongly Disagree" to 7 "Strongly Agree"). Not all situations presented to respondents were in the same direction, so reverse coding was needed in some cases. Again, the variable is constructed in the same way as habit and environmental concern (Cronbach's α=0.74).
The measurement of subjective norms was created as a combination of the questions "To what extent do you care about what the following people think you should do?" and "Do the following people think you should drink mostly tap water over the next 3 months?" with answers "My parents", "My spouse", "My children", "Good friends". In both cases the measurement is done using a Likert scale. For respondents' attachment to individuals, ratings are from one ("I don't care at all") to seven ("I care a lot"). For normative views, ratings are from one ("Definitely not") to seven ("Definitely yes"). The scale was again constructed by summing the items and dividing them by the appropriate number, and internal consistency was acceptable (Cronbach's α=0.78).
The perceived behavioural control was constructed as a combination of the question "How often do the following situations happen to you?" and the statement "Drinking mostly tap water over the next 3 months would make it easier for me to...". A Likert scale with 7 possible ratings was also used in this case. To measure the control beliefs, respondents were asked about the frequency with which certain situations related to the difficulty of drinking tap water occurred (In restaurants or cafes, it is not possible to order tap water; At petrol stations, it is not possible to turn on or buy tap water, In public places, it is not possible to turn on tap water). As a result, a rating of one corresponds to "Rarely" and a rating of seven to "Very often". The strength of beliefs was measured by asking respondents to answer how much they agreed on the strength of certain situations regarding drinking tap water (...if it could be ordered at more restaurants and cafes, ...if it could be bought at petrol stations in its own bottle and the price was lower than bottled water, ...if there were more drinks in public places). A rating of one corresponds to "Strongly disagree" and a rating of seven corresponds to "Strongly agree". Perceived behavioral control was constructed in an identical manner to previous scales (Cronbach's alpha α=0.75).
Quota and socio-demographic issues were also included. Of the quota questions, gender, age and education were used in the models. In our sample, 49% of participants were female and 51% were male. There was also an option to select "Other" as the preferred gender. Only 0.12% of the respondents gave this answer, and as a result this group is grouped together with the female gender due to its low variability. Respondents were asked to indicate their age in years, with a minimum of 18 years and a maximum of 69 years. The median age of the participants was 45 years. Survey participants were also asked for their highest level of education, choosing from a list of 11 possible levels. To compare groups, age was divided into younger people (18 to 34 years old), middle-aged (35 to 50 years old) and older people (51 years old and above); education was then divided into primary and lower secondary (maximum of vocational secondary without a high school diploma), secondary (those who had not reached higher education than grammar school) and tertiary (education level higher than grammar school), see Table 1.
The income question was defined as the respondent's total net monthly household income from all sources after deducting taxes and levies. It was possible to choose from 12 items, ranging from "Less than 13,000 CZK" to "More than 70,000 CZK", or research participants could choose the options "Don't know" and "Don't want to answer". Three income categories were created by averaging and dividing by the respective number of household members: respondents with an income per household member less than or equal to 12 250 CZK (low income), with an income greater than 12 250 CZK and less than or equal to 21 000 CZK (medium) and with an income greater than 21 000 CZK (high). The fourth category was chosen because of the lack of income information. The economic status of the respondents was measured using 10 items that respondents were given a choice to select. In our sample, the most represented were full-time employed (50%) and retired (15%). Three categories were created: working (full-time, part-time and self-employed), unemployed (unemployed, retired, studying or disabled) and at home (maternity leave, full-time caring). The question on marital status gave a choice of 7 categories and a "Don't want to answer" option. The highest representation was for those in the Married (43%) and Single (never married/registered civil partnership) status at 21%. Again, 3 categories were constructed for modelling. The first represents people who are not single (married, in a partnership or living together without being married), the second is single (single and never been in a formal relationship), and the third category is lost partner (people who are widowed, divorced or separated from their partner). Research participants were also asked to mention the number of household members, including themselves. Most of them (34%) lived in a two-person household. Those who indicated a household size of 2 or more were also asked about the number of children under the age of 18 and retired persons in their household. The most common number was 1 child (20%) or 1 retiree (25%) in the respondent's household.
3. Results
3.1. Frequency and Reasons for Drinking Tap and Bottled Water
In the initial part of the questionnaire, we were interested in the frequency, volume and reasons for drinking water (tap, bottled and other beverages). The answers provided by the respondents showed that 75% of them drink tap water several times a day, 6% once a day, 7% several times a week, 2% several times a month, 7% less often than several times a month and 3% said they never drink tap water (see Figure 1). Regarding the reasons why people do not drink tap water or drink it infrequently, the main reason given is that it tastes bad (31%), see Figure 2.
Bottled water (sparkling or still, flavoured or unflavored, mineral, drinking, spring or baby water) was consumed several times a day by 21% of the participants, once a day by 7%, several times a week by 19%, several times a month by 21%, less frequently by 27% and never by only 4% (see Figure 3). The main reasons given by respondents for drinking bottled water were the unavailability of tap water (23%), its taste (18%) and its effervescence or mineral content (15%) (see Figure 4).
While 42% of the respondents drank 7 to 13 litres of tap water in the past 7 days (i.e. on average 1 to less than 2 litres per day), and 29% drank 14 litres or more (i.e. on average 2 litres or more per day), the consumption of bottled water in the same period was zero for more than half of the people (of those who drink tap or bottled water at least several times a week). The most frequent category of bottled water consumed by people who drink it at least a few times a week was 24% mineral and medicinal unflavored water and 20% mineral and medicinal flavoured water, in quantities of 1 to 2 litres per week. From 5 litres or drunker over 7 days onwards, the differences between the different types of bottled water are negligible, and together, they remain around 3 %.
Bottled lemonades, juices, fruit and vegetable juices, nectars, energy drinks and iced teas were drunk several times a day by 7% of people, once a day by 6%, several times a week by 18%, several times a month by 26% and even less frequently by 35%. A total of 8% of the participants never drink these types of beverages. Respondents reported drinking juice, nectar and juice most often (54% in the week, 47% in the 30 days) and least often energy drinks and iced teas (27% in the week, 17% in the 30 days), in quantities of 1 to 2 liters, both in the past week (those who consumed drinks at least several times a week) and 30 days (others who reported consuming drinks at least several times a month).
3.2. Barriers, Attitudes, Norms and Habit in Relation to Drinking Tap Water
In the next part of the questionnaire survey, we looked at perceived barriers, attitudes, norms and habits that explain drinking water consumption. Respondents were asked to rate statements that related to the idea that they would predominantly (90%) drink tap water over the next 3 months, either in general or outside the home (if their household was not connected to a public water supply).
Habit
The survey shows that drinking tap water is a habitual behavior for between 31% and 41% of respondents. Specifically, 41% of respondents drink tap water very often automatically and 31% said that when tap water is available, they very often prefer it to bottled water without thinking.
Subjective Norms
In terms of norms, the proportion of respondents who perceive social pressure to drink tap water slightly outweighs those who perceive that they should not drink it. At the same time, however, approximately one third of respondents perceive no social pressure in this regard. Specifically, 39% of respondents expressed the view that most people who are important to them think that they should drink mostly tap water in the next 3 months. This compares to 8% of respondents who said that most people think they should not drink it. Similarly, 37% of respondents think people who are important to them drink mostly tap water (compared to 13% who think people who are important to them do not drink tap water). However, perceptions of the norm differ significantly for drinking tap water outside the home, where the norm of drinking mostly tap water is perceived more weakly and there is a higher proportion of neutral responses.
Attitudes
Over half of respondents believe that if they drank mostly tap water over the next 3 months they would save money on bottled water (54% strongly agreed). Furthermore, they would save time buying and taking plastic bottles to the bin (strongly agreed by 47%) and reduce environmental pollution (strongly agreed by 38%). In all the mentioned cases, those who would drink tap water away from home also expressed their opinion in the same or very similar percentage (see Figure 5). People reported that they would miss the taste of sugary lemonade or sparkling water (31% strongly disagreed) and would not like the taste of water (32% strongly disagreed) as the least disadvantages of the idea of drinking tap water in the next 3 months. Even for these statements, there were no significant differences between those who would consume tap water outside the home.
Perceived Barriers
Almost two thirds generally agreed with the statement that it was up to them to drink mostly tap water and over half were confident that they could drink mostly tap water if they wanted to over the next 3 months. Of respondents not connected to a public water supply, just over half (53%) strongly agreed that it was up to them to drink mostly tap water outside the home and 40% thought it was possible if they wanted to.
More drinking fountains in public places would make it easier for 44% of respondents to drink tap water. If tap water could be ordered in more restaurants and cafes, this would make it easier for 40% of respondents to drink tap water. Almost the same proportion of respondents would find it easier to drink tap water if it could be bought at petrol stations in its own bottle and its price was lower than bottled water.
Household Connection to Public Water Supply
As expected, household connection to the public water supply is not a barrier to drinking tap water for most people. In the questionnaire, 93% of respondents indicated that their household is connected to a public water supply, which is broadly in line with the data from 2020, when 10.13 million inhabitants in the Czech Republic, i.e. 94.6% of the total population, were supplied from water supply systems (Report on the state of water management in the Czech Republic in 2020, 2021). When asked whether these respondents had any purification devices (filters) for tap water at home, 16% of them answered in the affirmative and the remaining 84% in the negative.
3.3. Factors Explaining Bottled and Tap Water Drinking
In this chapter, we identify segments of the population that drink bottled or tap water more or less often. An ordinal logit model (restricted model) was primarily considered for data analysis because the dependent variable, which is frequency of consumption of bottled/tap water, is ordinal. We merged the underrepresented categories of the variable frequency of bottled drinks (see Figure 3), so that the explained variable has 4 categories: 1) Never or seldom (31%), 2) Several times a month (21%), 3) Several times a week or once a day (27%), 4) Several times a day (21% of research participants). The categories of frequency of drinking tap water (see Figure 1) were combined in the same way, i.e.: 1) Never or seldom (10%), 2) Several times a month (2%), 3) Several times a week or once a day (13%), 4) Several times a day (75% of research participants). Several variables did not meet the assumptions of the model, therefore a generalized ordinal logit model (partial restriction) was used. Since many researchers still choose the multinomial logit model (unconstrained model) if the assumption of parallelism of the curves is violated, this model was used for robustness checking. The constructs of the theory of planned behavior and habit, which enter the model as independent variables, were checked for internal consistency with the help of factor analysis, Cronbach's alpha and McDonald's omega. Based on the above models, several relationships between the independent variables and frequencies of bottled and tap water consumption were revealed, and those that emerged as statistically most significant are further elaborated below (Results from GOL estimation can be seen in Table 2 and Table 5, with marginal results in Table 3 and Table 6. Results from the MNL estimation are shown in Table 4 and Table 7).
Within the framework of socio-demographic characteristics, it can be stated that women, compared to men, drink both bottled and tap water more often, several times a day. It was found that people with lower education (primary, vocational and high school without high school diploma) more often drink bottled water at least several times a week, and tap water rather never and seldom. On the contrary, people with higher education (higher vocational and higher education) drink bottled water consistently less often, and for tap water, there is no statistical difference compared to the reference group (secondary education with a high school diploma). While younger people aged 18-34 drink bottled water in moderation, i.e. at least several times a month but no more than once a day, they have a consistently high tap water consumption compared to the middle-aged group. Respondents aged 51 and over have a lower chance of drinking tap water several times a month or less than the middle age group. No significant differences were found in the case of bottled water. In terms of income, while consumption of bottled water by low-income per household member is not statistically significant, tap water is statistically significantly lower among low-income per household members in all categories compared to the middle-income group. People with a higher income drink more bottled water several times a day, but their tap water consumption was not statistically significant compared to the reference group. Those who did not state their income then have a lower chance of drinking tap water several times a month at most. There are differences between the employed and the unemployed in bottled water and partly tap water consumption. According to the results, those who work continuously drink more bottled water than their counterparts. Comparing those who are at home (e.g. on maternity leave) with the unemployed, such results do not occur, and those who are at home drink tap water rather than never and seldom. Marital status was analysed by comparing people in a relationship and those who had lost a partner with single people as a reference group. While no statistically different consumption was shown for bottled water, in the case of tap water, people who have lost a partner have significantly higher consumption several times a month compared to singles.
The number of retired household members was statistically significant, which means a higher chance of drinking bottled water several times a day or, conversely, a lower chance of never or seldom drinking tap water. For the variable number of children present in the household, statistical significance was not demonstrated in the modelling in connection with the consumption of bottled/tap water (see Figure 6 and Figure 7).
Environmental concern is a significant predictor for higher consumption of tap water several times a week or once a day, but this is not the case with bottled water. Three predictors appear to be relatively significant both in terms of statistical significance and strength of influence. These include taste perception, health concern and habit. The perception of the pleasant taste of bottled water or the unpleasant taste of tap water is associated with a significant increase in the consumption of bottled water. Average marginal effects show that variable taste is associated with 22% less likelihood of never or seldom drinking bottled water, nearly 5% more likely to drink it several times a month, and 7% more likely to drink it at least several times a week or once a day and 10% more likely to consume several times a day.
A high consumption of bottled water is also associated with a negative perception of the healthiness of tap water and a positive perception of the healthiness of bottled water. The average marginal effects show a 17% lower probability of drinking bottled water at most several times a month and an 18% higher probability of drinking at least several times a week. Strong tap water drinking habits were found to be a significant predictor of lower bottled water consumption. Increasing the habit of drinking tap water by one unit is 5% and 2% more likely to consume bottled water never or seldom and several times a month. In contrast, a unit increase in habit corresponds to being 2% and 6% less likely to drink bottled water at least several times a week, once a day, and several times a day, respectively (see Figure 8).
A negative perception of the taste of tap water or a positive perception of the taste of bottled water increases the probability of never drinking tap water or drinking it rarely by 5% and, conversely, decreases it by 7% in the case of consumption several times a day. Having health concerns about tap water or perceiving bottled water as beneficial to one's health is then associated with a total 11% higher probability of drinking tap water at most once a day and, on the other hand, with an 11% lower probability of drinking it several times a day. The habit of drinking tap water is the main predictor of higher tap water consumption. An increase in the habit of drinking tap water by one unit corresponds to a total of 7% less probability of consuming tap water in the categories of never or seldom to several times a week or once a day, and conversely, a 7% higher probability that respondents will drink it several times a day (see Figure 9).
People with positive attitudes towards tap water consumption are more likely to drink bottled water less frequently. Average marginal effects show that a unit increase in water consumption attitudes makes people almost 0.5% more likely to consume bottled water no more than several times a month or, conversely, 0.5% less likely to drink it at least several times a week. Respondents who perceive that it is the norm for their significant others (family and friends) to drink tap water are less likely to drink bottled water more often. If subjective norms increase by one unit, then there is a 0.3% higher probability of drinking bottled water in the frequencies of never to once a day or a 0.3% lower probability that respondents drink bottled water several times a day. People who perceive it is difficult to get water from the tap in restaurants, cafes, gas stations, and public places drink bottled water more often. This perceived behavioural control and its increase by one unit represents a 0.2% lower (never or seldom and several times a month) or 0.2% higher (several times a week or once a day and several times a day) probability of consuming bottled water (see Figure 10).
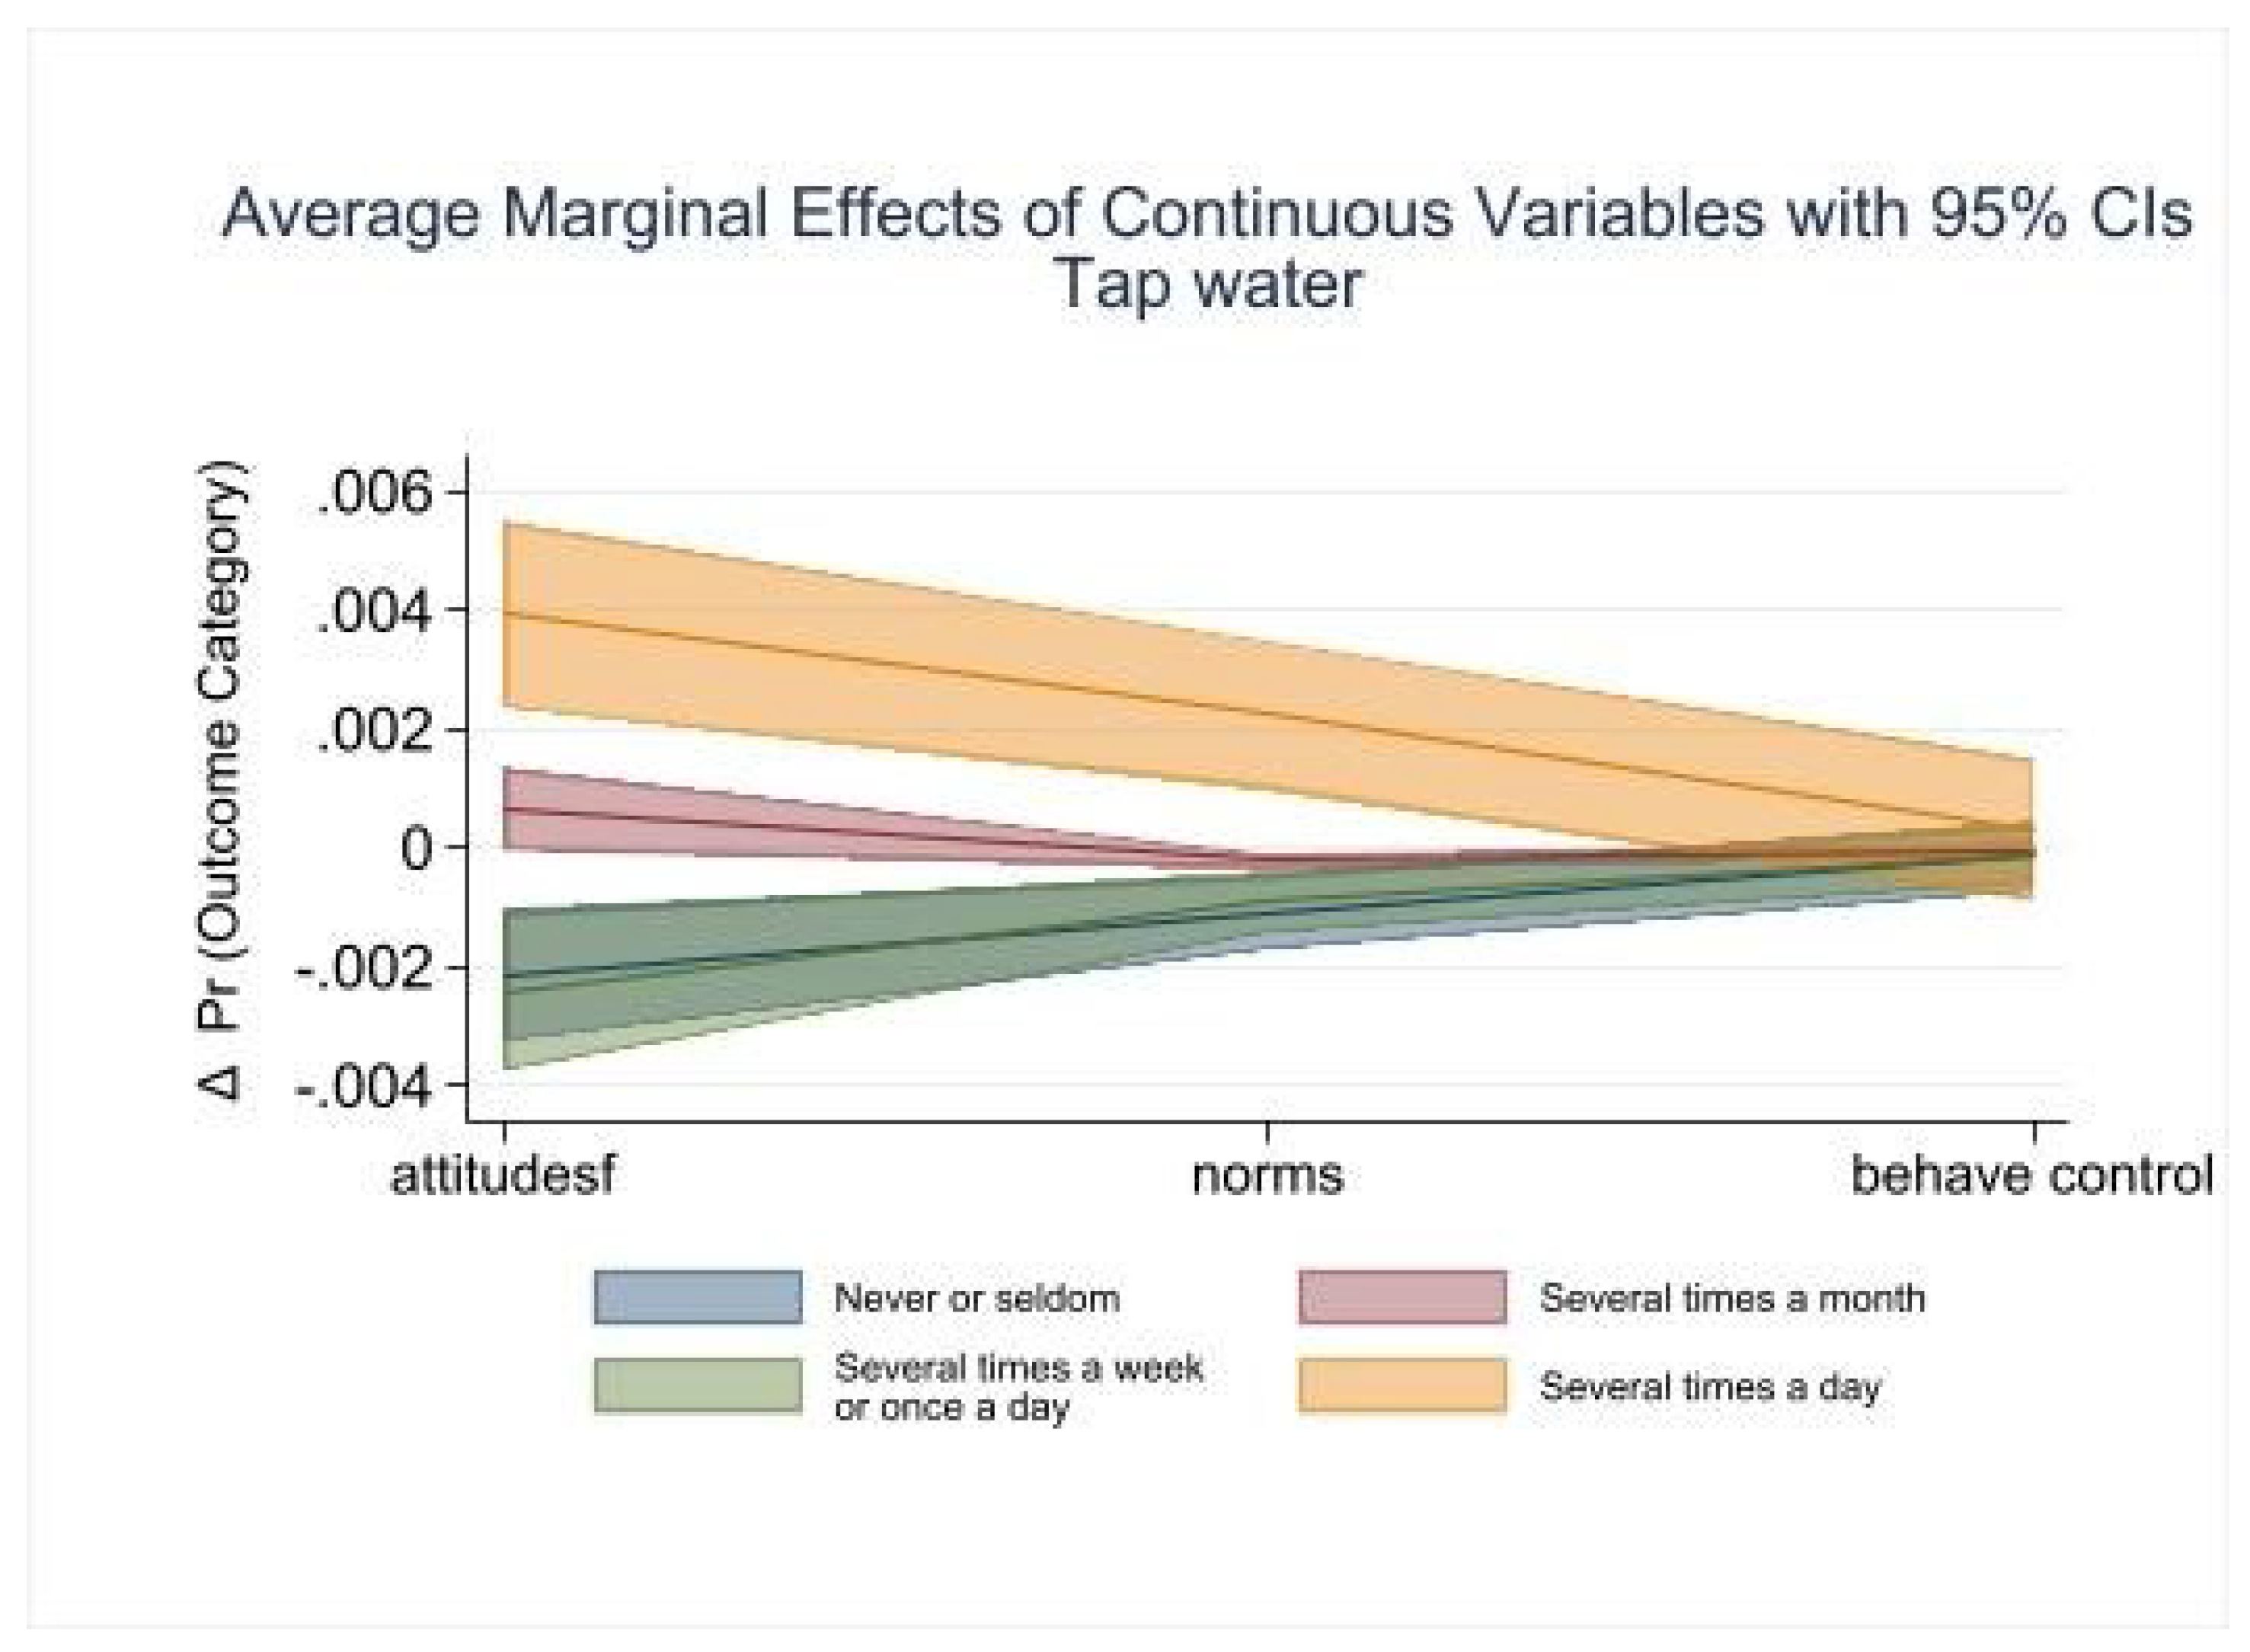
The average marginal effects show that with a unit increase in attitudes towards water consumption, people are 0.2% less likely to drink tap water never or seldom and several times a week or once a day. On the contrary, they are 0.4% more likely to consume it several times daily. For subjective norms, a one-unit increase is associated with respondents being 0.2% less likely to drink tap water no more than once per day and 0.2% more likely to do so more than once daily. Perceived behavioural control in the case of tap water was not statistically significant as a predictor (see Figure 11).
4. Discussion and Conclusions
Our study shows that in terms of frequency of drinking, tap water is preferred over bottled water among the general population (75% of respondents drink tap water several times a day, but only 21% of participants drink bottled water this often). Foreign literature provides similar results, i.e. generally more common consumption of tap water. For example, while Delpla et al. [10] mention almost two-thirds of respondents (65%) expressing a strong preference for drinking tap water every day/every week, Geerts et al. [23] describe that 56% of research participants reported drinking tap water always or more than half of the time instead of bottled water.
The most common reason for people not drinking tap water, or drinking it infrequently, was its bad taste (31%). Other important factors were water being too soft or hard (15%) and the household not being connected to a public water supply (14%), while the least common reasons were odor or color (7%) and the water being defective in respondents' houses (2%). The main reasons for drinking bottled water among respondents are the unavailability of tap water (23%), taste (18%) and sparkling or mineral content (identically 15%), while the least frequent reasons are safety (5%) and the claim that it is healthier than tap water (3%). These findings therefore suggest that taste is particularly important for our respondents' preferences, while reasons related to safety and health concerns are less important. Together with Geerts et al. [23] and Delpla et al. [10], it can be concluded that the taste characteristics of bottled water are often preferred over the taste of tap water. Even Viscusi et al. [19] in their research report that bottled water has a better taste compared to tap water for more than 40% of people, but also that for almost a third of all respondents bottled water is safer and then a slightly lower percentage believe that drinking bottled water is more convenient than tap water, which on the other hand was not as significant in our data. Jones et al. [17] then describe that the unpleasant sensory properties (odor and color) of tap water even emerged as one of the topics that was mentioned prominently by research participants. Finally, the importance of the aforementioned water characteristics is confirmed by Qian [18], who found in a sample of university students that the more they felt that tap water was safe, hygienic, convenient and widely available, as well as tasty, the less often they would drink bottled water on campus.
Our model shows that socio-demographic characteristics indicate higher consumption of bottled water among women, those with lower education, higher income, those in employment and the number of retired household members. Tap water also shows higher consumption among women (statistically less significant than bottled water) and respondents with environmental concerns, and moderate consumption among those who have lost a partner or are single. While the results suggest lower consumption of bottled water among those with higher education, for tap water, on the other hand, lower rates of consumption were found among those with lower income, aged 51 years and over, with unstated income, and those who are at home. In terms of age, young people appear to be moderate consumers of bottled water (absent or very frequent consumption) and big consumers of tap water. These findings are broadly consistent with those of a number of other studies [9,10,18,19,22,23], but some differences can be pointed out. While Geerts et al. [23] report more frequent consumption of bottled water among men and the elderly, our findings instead point to higher consumption among women, and do not support a statistically different consumption among those aged 51 years and older from that of middle-aged respondents. Delpla et al. [10], for example, mention more frequent consumption of tap water among people with higher education, but in our case the results were not statistically significant.
Environmental concern is a significant predictor for higher consumption of tap water several times a week or once a day. Although no significant relationship with this variable was found for bottled water, it can, to some extent, be assumed, based on the result for tap water with Borusiak et al. [21], that environmental concern is positively related to attitudes towards reducing bottled water consumption.
Constructs from the theory of planned behaviour [24] were found to be influential as well. In the case of perceived behavioral control, people who perceive that it is difficult to get tap water in restaurants, cafes, gas stations, and public places are more likely to drink bottled water. In terms of attitudes towards tap water consumption, people with positive attitudes towards tap water consumption are more likely to drink tap water, while those with positive attitudes towards tap water consuming are less likely to drink bottled water. These attitudes are largely influenced by responses to the construct question, where more than half of respondents believe that if they drank mostly tap water over the next 3 months they would save money on bottled water (strongly agreed by 54% of respondents), and would also save time shopping for and taking plastic bottles to the bin (strongly agreed by 47%). Thus, in this regard, we concur with the findings that price and convenience are also important for consumer choice of tap or bottled water [16,17,18,19,20]. The association between social norms and behavioral influence was reflected in less frequent drinking of bottled water (and conversely, more frequent consumption of tap water) among people who perceived that it was the norm for their significant others (family and friends) to drink tap water. Our findings differ from other studies and thus make it important to consider the broader social context in interpretation. For example, Geerts et al. [23] show in their research in Belgium that despite environmental and financial considerations, bottled water consumption is still widespread among people, and the existing social norms that promote it play an important role. Similarly, Qian [18] cites family habits as a factor that influenced behaviors leading to a preference for bottled water in the case of her research among university students. Finally, Mir Mohamad Tabar et al. [26] identify social norms as one of the strongest predictors for bottled water consumption among respondents in Iran.
Taste perception, health concerns, and the habit of drinking tap water are significant predictors of drinking bottled and tap water, both in terms of statistical significance and strength of influence, the first two even being the most influential. Health concerns about tap water and unpleasant taste of tap water influence higher/lower consumption of bottled/tap water. For example, unfavorable perceptions of the healthiness of tap water and positive perceptions of the healthiness of bottled water imply a 17% lower likelihood of consuming bottled water at most a few times a month and an 18% higher likelihood of drinking it at least a few times a week. Similarly, perceptions of the pleasant taste of bottled water or the unpleasant taste of tap water are associated with a 22% lower likelihood of never or seldom drinking bottled water and, conversely, a 10% higher likelihood of drinking it several times a day. Our results confirm the importance of the organoleptic properties of water for its consumers [7,8,9,10,11,12], here specifically the taste of bottled water, which Geerts et al. [23] report is often preferred over the taste of tap water. It also suggests that water safety may be an issue for many people. These findings are consistent with a number of international studies showing that people consider tap water less healthy and less safe compared to bottled water [10,13,14,15,17,20,23]. As such, drinking tap water may be perceived as risky for some consumers, which according to Viscusi et al. [19] is a reason to consume more bottled water. In terms of habit, those who drink bottled water less frequently and those who have a strong habit of drinking tap water more frequently drink tap water. The significance of this predictor for water consumption confirmed the appropriateness of extending the constructs from the theory of planned behavior [24] to include habit in this paper.
To conclude the factors that appear to have the greatest influence on bottled and tap water consumption are perceived taste of both tap and bottled water, health concerns and habit. A campaign that focuses on spreading the perception that tap water tastes good and that addresses perceived health concerns about this water source could lead to a reduction in bottled water consumption. At the same time, it would be appropriate to introduce measures in water treatment that would further improve the taste of tap water. As the habit of drinking tap water plays a significant role in explaining the frequency of drinking bottled water, a campaign could also be targeted to encourage habit formation.
Drinking tap water outside the home appears to be more challenging and is less often perceived as the norm. More drinking fountains in public places would make drinking tap water easier for 44% of respondents. In addition, people perceive that drinking tap water would be easier if tap water could be ordered from more restaurants and cafes, or if it could be bought from gas stations in its own bottle and its price was lower than bottled water.
International studies show that measures combining the installation of drinking fountains with the distribution of water bottles and information and education activities are particularly effective in promoting tap water. Our study shows that although 39% of Czechs do not have a bottle, only 21% of them would find a free bottle easier to drink tap water. For the Czech Republic, we would therefore rather suggest measures that combine the installation of water fountains in public places, promoting the availability of tap water in restaurants and petrol stations, combined with a campaign focusing on taste perception, health and promoting the habit of drinking tap water.
Author Contributions
Conceptualization, I.Z. and M.Š.; methodology, I.Z. and M.Š.; software, I.Z.; validation, I.Z.; formal analysis, I.Z. and M.Š.; investigation, I.Z. and M.Š.; resources, M.Š.; data curation, I.Z., J.O and M.Š..; writing—original draft preparation, I.Z.; writing—review and editing, I.Z. and M.Š.; visualization, I.Z. and J.O.; supervision, I.Z.; project administration, M.Š.; funding acquisition, M.Š. All authors have read and agreed to the published version of the manuscript.
Funding
This article has been prepared with the support of the Technology Agency of the Czech Republic under the ETA Programme, project TL03000252 „Tap Water or Bottled Water: Barriers and Motivations to Consume Drinking Water".
Data Availability Statement
The dataset presented in this article is not readily available due to time limitations given the fact they were obtained from an original survey.
Acknowledgments
We thank Martin Kryl for programming the survey and Klára Hanusová whose work was greatly valuable during the presurvey and data cleaning. All errors are our own.
Conflicts of Interest
The authors declare no conflicts of interest.
References
- Villanueva, C.M.; Garfí, M.; Milà, C.; Olmos, S.; Ferrer, I.; Tonne, C. Health and Environmental Impacts of Drinking Water Choices in Barcelona, Spain: A Modelling Study. Sci. Total Environ. 2021, 795, 148884. [Google Scholar] [CrossRef] [PubMed]
- Gleick, P.H.; Cooley, H.S. Energy Implications of Bottled Water. Environ. Res. Lett. 2009, 4, 014009. [Google Scholar] [CrossRef]
- Free, C.M.; Jensen, O.P.; Mason, S.A.; Eriksen, M.; Williamson, N.J.; Boldgiv, B. High-Levels of Microplastic Pollution in a Large, Remote, Mountain Lake. Mar. Pollut. Bull. 2014, 85, 156–163. [Google Scholar] [CrossRef]
- The EU and the United Nations - Common Goals for a Sustainable Future. Available online: https://environment.ec.europa.eu/topics/water/drinking-water_en (accessed on 25 September 2023).
- Drinking Water. Available online: https://environment.ec.europa.eu/topics/water/drinking-water_en (accessed on 21 September 2023).
- Circular Czechia - Ministry of the Environment of the Czech Republic. Available online: https://www.mzp.cz/cz/circularni_cesko (accessed on 3 January 2023).
- Debbeler, L.J.; Gamp, M.; Blumenschein, M.; Keim, D.; Renner, B. Polarized but Illusory Beliefs about Tap and Bottled Water: A Product- and Consumer-Oriented Survey and Blind Tasting Experiment. Sci. Total Environ. 2018, 643, 1400–1410. [Google Scholar] [CrossRef]
- Grupper, M.A.; Schreiber, M.E.; Sorice, M.G. How Perceptions of Trust, Risk, Tap Water Quality, and Salience Characterize Drinking Water Choices. Hydrology 2021, 8, 49. [Google Scholar] [CrossRef]
- Levêque, J.G.; Burns, R.C. Predicting Water Filter and Bottled Water Use in Appalachia: A Community-Scale Case Study. J. Water Health 2017, 15, 451–461. [Google Scholar] [CrossRef]
- Delpla, I.; Legay, C.; Proulx, F.; Rodriguez, M.J. Perception of Tap Water Quality: Assessment of the Factors Modifying the Links between Satisfaction and Water Consumption Behavior. Sci. Total Environ. 2020, 722, 137786. [Google Scholar] [CrossRef] [PubMed]
- Ober, J.; Karwot, J.; Rusakov, S. Tap Water Quality and Habits of Its Use: A Comparative Analysis in Poland and Ukraine. Energies 2022, 15, 981. [Google Scholar] [CrossRef]
- Romano, G.; Masserini, L. Factors Affecting Customers’ Satisfaction with Tap Water Quality: Does Privatisation Matter in Italy? J. Clean. Prod. 2020, 258, 120593. [Google Scholar] [CrossRef]
- Aslani, H.; Pashmtab, P.; Shaghaghi, A.; Mohammadpoorasl, A.; Taghipour, H.; Zarei, M. Tendencies towards Bottled Drinking Water Consumption: Challenges Ahead of Polyethylene Terephthalate (PET) Waste Management. Health Promot. Perspect. 2021, 11, 60–68. [Google Scholar] [CrossRef]
- Bass, D.A.; McFadden, B.R.; Costanigro, M.; Messer, K.D. Implicit and Explicit Biases for Recycled Water and Tap Water. Water Resour. Res. 2022, 58, e2021WR030712. [Google Scholar] [CrossRef]
- March, H.; Garcia, X.; Domene, E.; Sauri, D. Tap Water, Bottled Water or In-Home Water Treatment Systems: Insights on Household Perceptions and Choices. Water 2020, 12, 1310. [Google Scholar] [CrossRef]
- Bethurem, M.; Choate, B.; Bramwell, S. Stop Piling on: Assessing Efforts to Reduce Single-Use Water Bottles at Allegheny College. Sustainability 2021, 13, 8864. [Google Scholar] [CrossRef]
- Jones, A.Q.; Dewey, C.E.; Doré, K.; Majowicz, S.E.; McEwen, S.A.; Waltner-Toews, D.; Henson, S.J.; Mathews, E. A Qualitative Exploration of the Public Perception of Municipal Drinking Water. Water Policy 2007, 9, 425–438. [Google Scholar] [CrossRef]
- Qian, N. Bottled Water or Tap Water? A Comparative Study of Drinking Water Choices on University Campuses. Water 2018, 10, 59. [Google Scholar] [CrossRef]
- Viscusi, W.K.; Huber, J.; Bell, J. The Private Rationality of Bottled Water Drinking. Contemp. Econ. Policy 2015, 33, 450–467. [Google Scholar] [CrossRef]
- Cohen, A.; Ray, I. The Global Risks of Increasing Reliance on Bottled Water. Nat. Sustain. 2018, 1, 327–329. [Google Scholar] [CrossRef]
- Borusiak, B.; Szymkowiak, A.; Pierański, B.; Szalonka, K. The Impact of Environmental Concern on Intention to Reduce Consumption of Single-Use Bottled Water. Energies 2021, 14, 1985. [Google Scholar] [CrossRef]
- Gambino, I.; Bagordo, F.; Coluccia, B.; Grassi, T.; Filippis, G.D.; Piscitelli, P.; Galante, B.; Leo, F.D. PET-Bottled Water Consumption in View of a Circular Economy: The Case Study of Salento (South Italy). Sustainability 2020, 12, 7988. [Google Scholar] [CrossRef]
- Geerts, R.; Vandermoere, F.; Van Winckel, T.; Halet, D.; Joos, P.; Van Den Steen, K.; Van Meenen, E.; Blust, R.; Borregán-Ochando, E.; Vlaeminck, S.E. Bottle or Tap? Toward an Integrated Approach to Water Type Consumption. Water Res. 2020, 173, 115578. [Google Scholar] [CrossRef]
- Ajzen, I. The Theory of Planned Behavior. Organ. Behav. Hum. Decis. Process. 1991, 50, 179–211. [Google Scholar] [CrossRef]
- Saefi, M.; Fauzi, A.; Kristiana, E.; Adi, W.C.; Islami, N.N.; Ikhsan, M.A.; Ramadhani, M.; Ningrum, D.E.A.F.; Setiawan, M.E.; Muchson, M. Theory of Planned Behavior to Analyze Students’ Intentions in Consuming Tap Water. Eurasia J. Math. Sci. Technol. Educ. 2023, 19, em2236. [Google Scholar] [CrossRef] [PubMed]
- Mir Mohamad Tabar, S.A.; Brewis, A.; Sohrabi, M. Status, Social Norms, or Safety? Understanding Intended and Reported Bottled Water Use in Urban Mashhad, Iran. J. Water Health 2023, 21, 81–93. [Google Scholar] [CrossRef] [PubMed]
- Vaske, J.J. Survey Research and Analysis: Applications in Parks, Recreation and Human Dimensions; Venture Pub: State College, Pa, 2008; ISBN 978-1-892132-79-6. [Google Scholar]
- Report on the State of Water Management in the Czech Republic in 2020; Ministry of Agriculture and Ministry of the Environment of the Czech Republic: Prague, 2021; ISBN 978-80-7434-626-2.

Table 1.
Characteristics of the national sample (final) and target population.
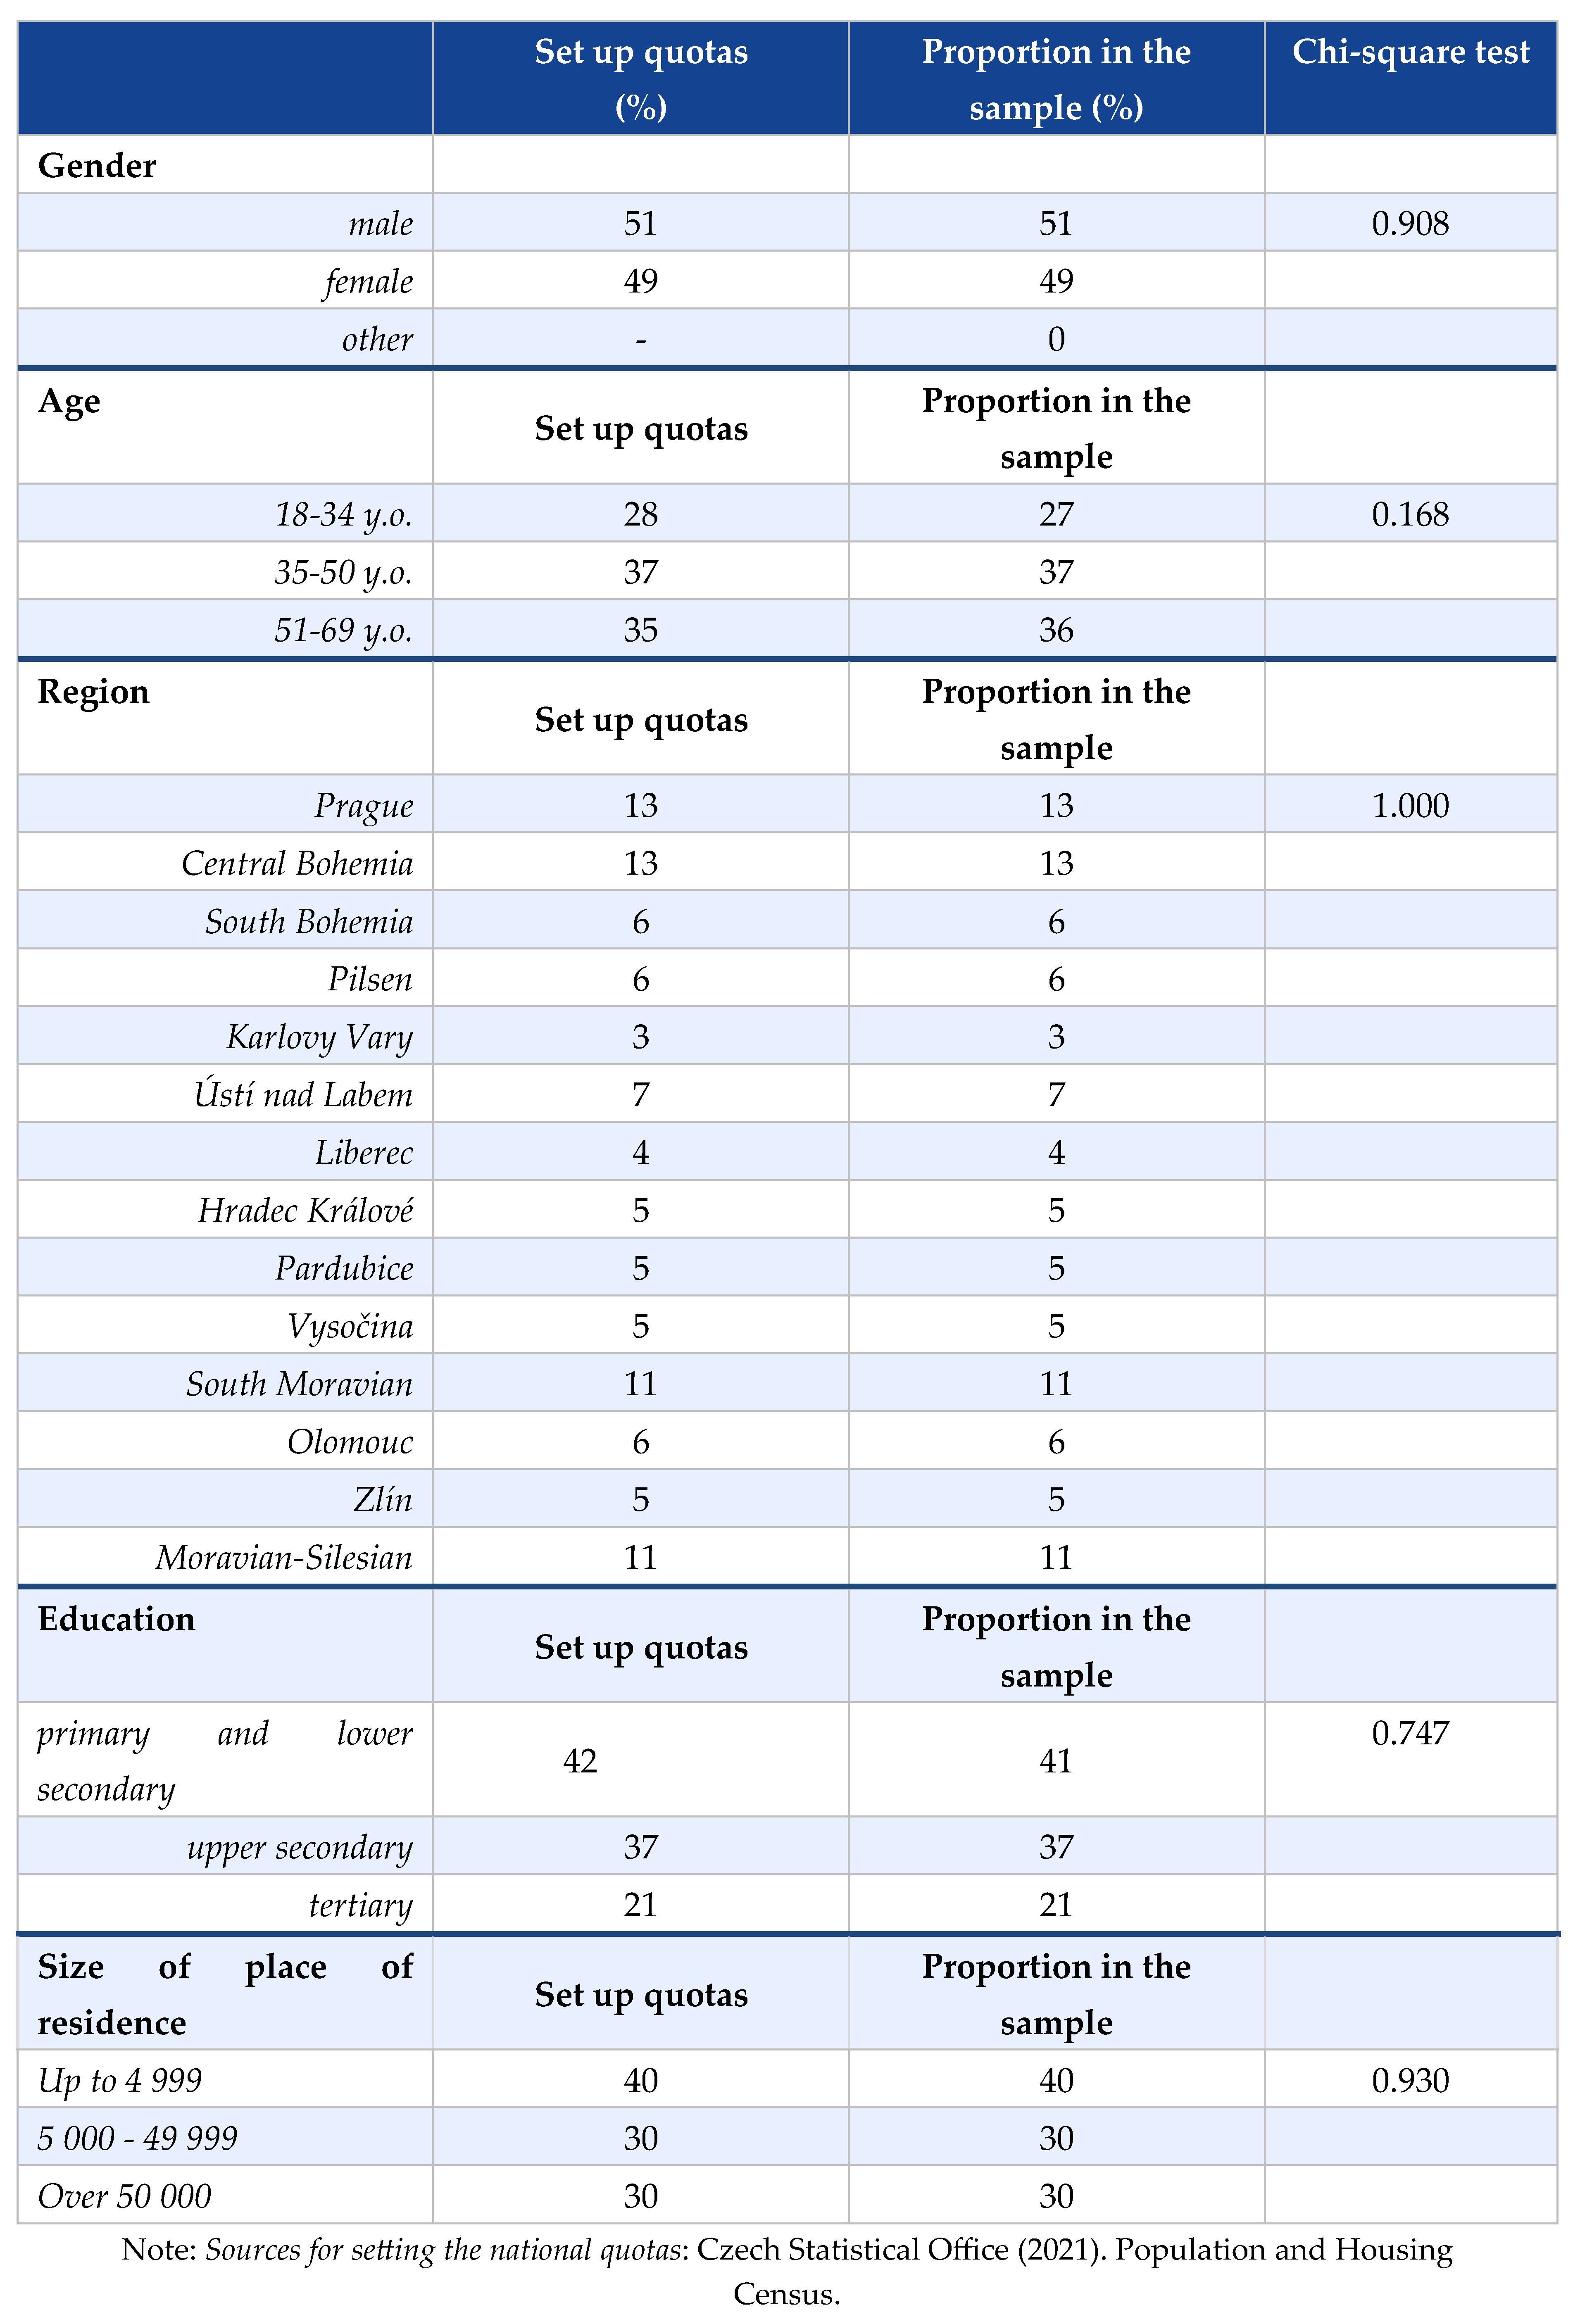 |
Table 2.
Generalized ordinal logit model explaining the frequency of drinking bottled water (1 = never or seldom; 2 = several times a month; 3 = several times a week or once a day; 4 = several times a day).
Table 2.
Generalized ordinal logit model explaining the frequency of drinking bottled water (1 = never or seldom; 2 = several times a month; 3 = several times a week or once a day; 4 = several times a day).
 |
Table 3.
Marginal effects from the generalized ordinal logit model for the frequency of drinking bottled water.
Table 3.
Marginal effects from the generalized ordinal logit model for the frequency of drinking bottled water.
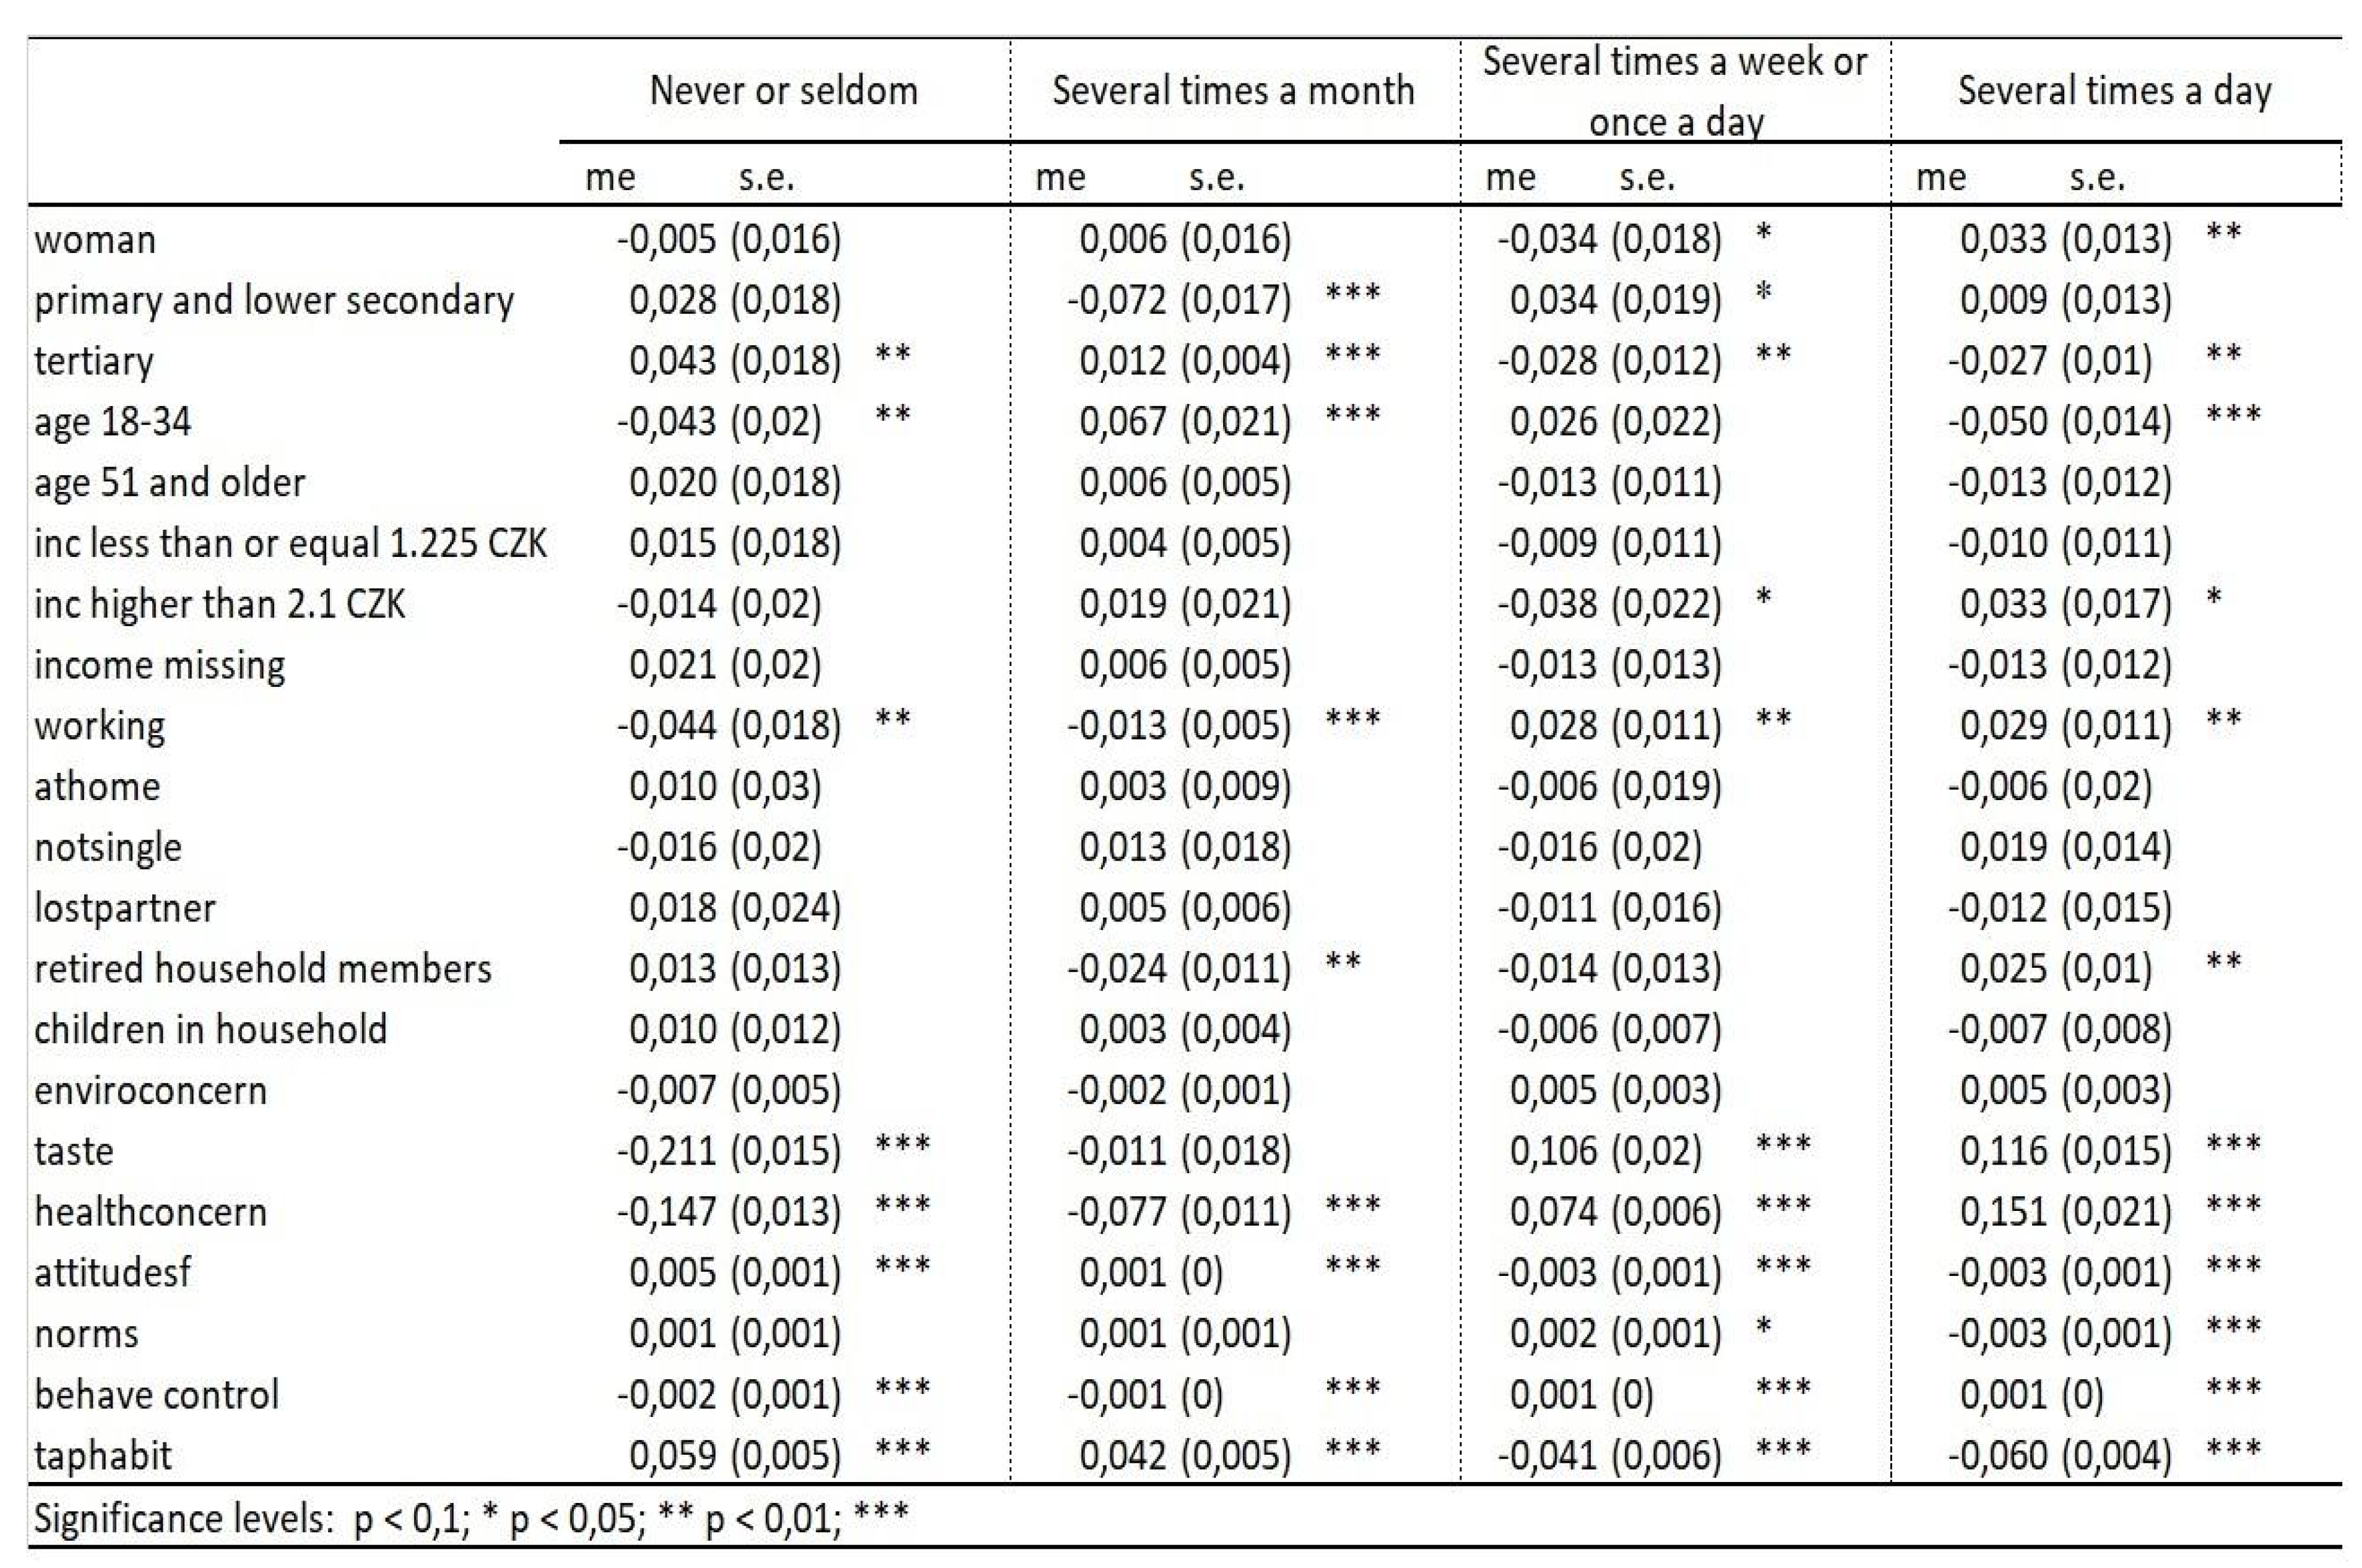 |
Table 4.
Multinomial logit results for the frequency of drinking bottled water, reference category = several times a day.
Table 4.
Multinomial logit results for the frequency of drinking bottled water, reference category = several times a day.
 |
Table 5.
Generalized ordinal logit model explaining the frequency of drinking tap water (1 = never or seldom; 2 = several times a month; 3 = several times a week or once a day; 4 = several times a day).
Table 5.
Generalized ordinal logit model explaining the frequency of drinking tap water (1 = never or seldom; 2 = several times a month; 3 = several times a week or once a day; 4 = several times a day).
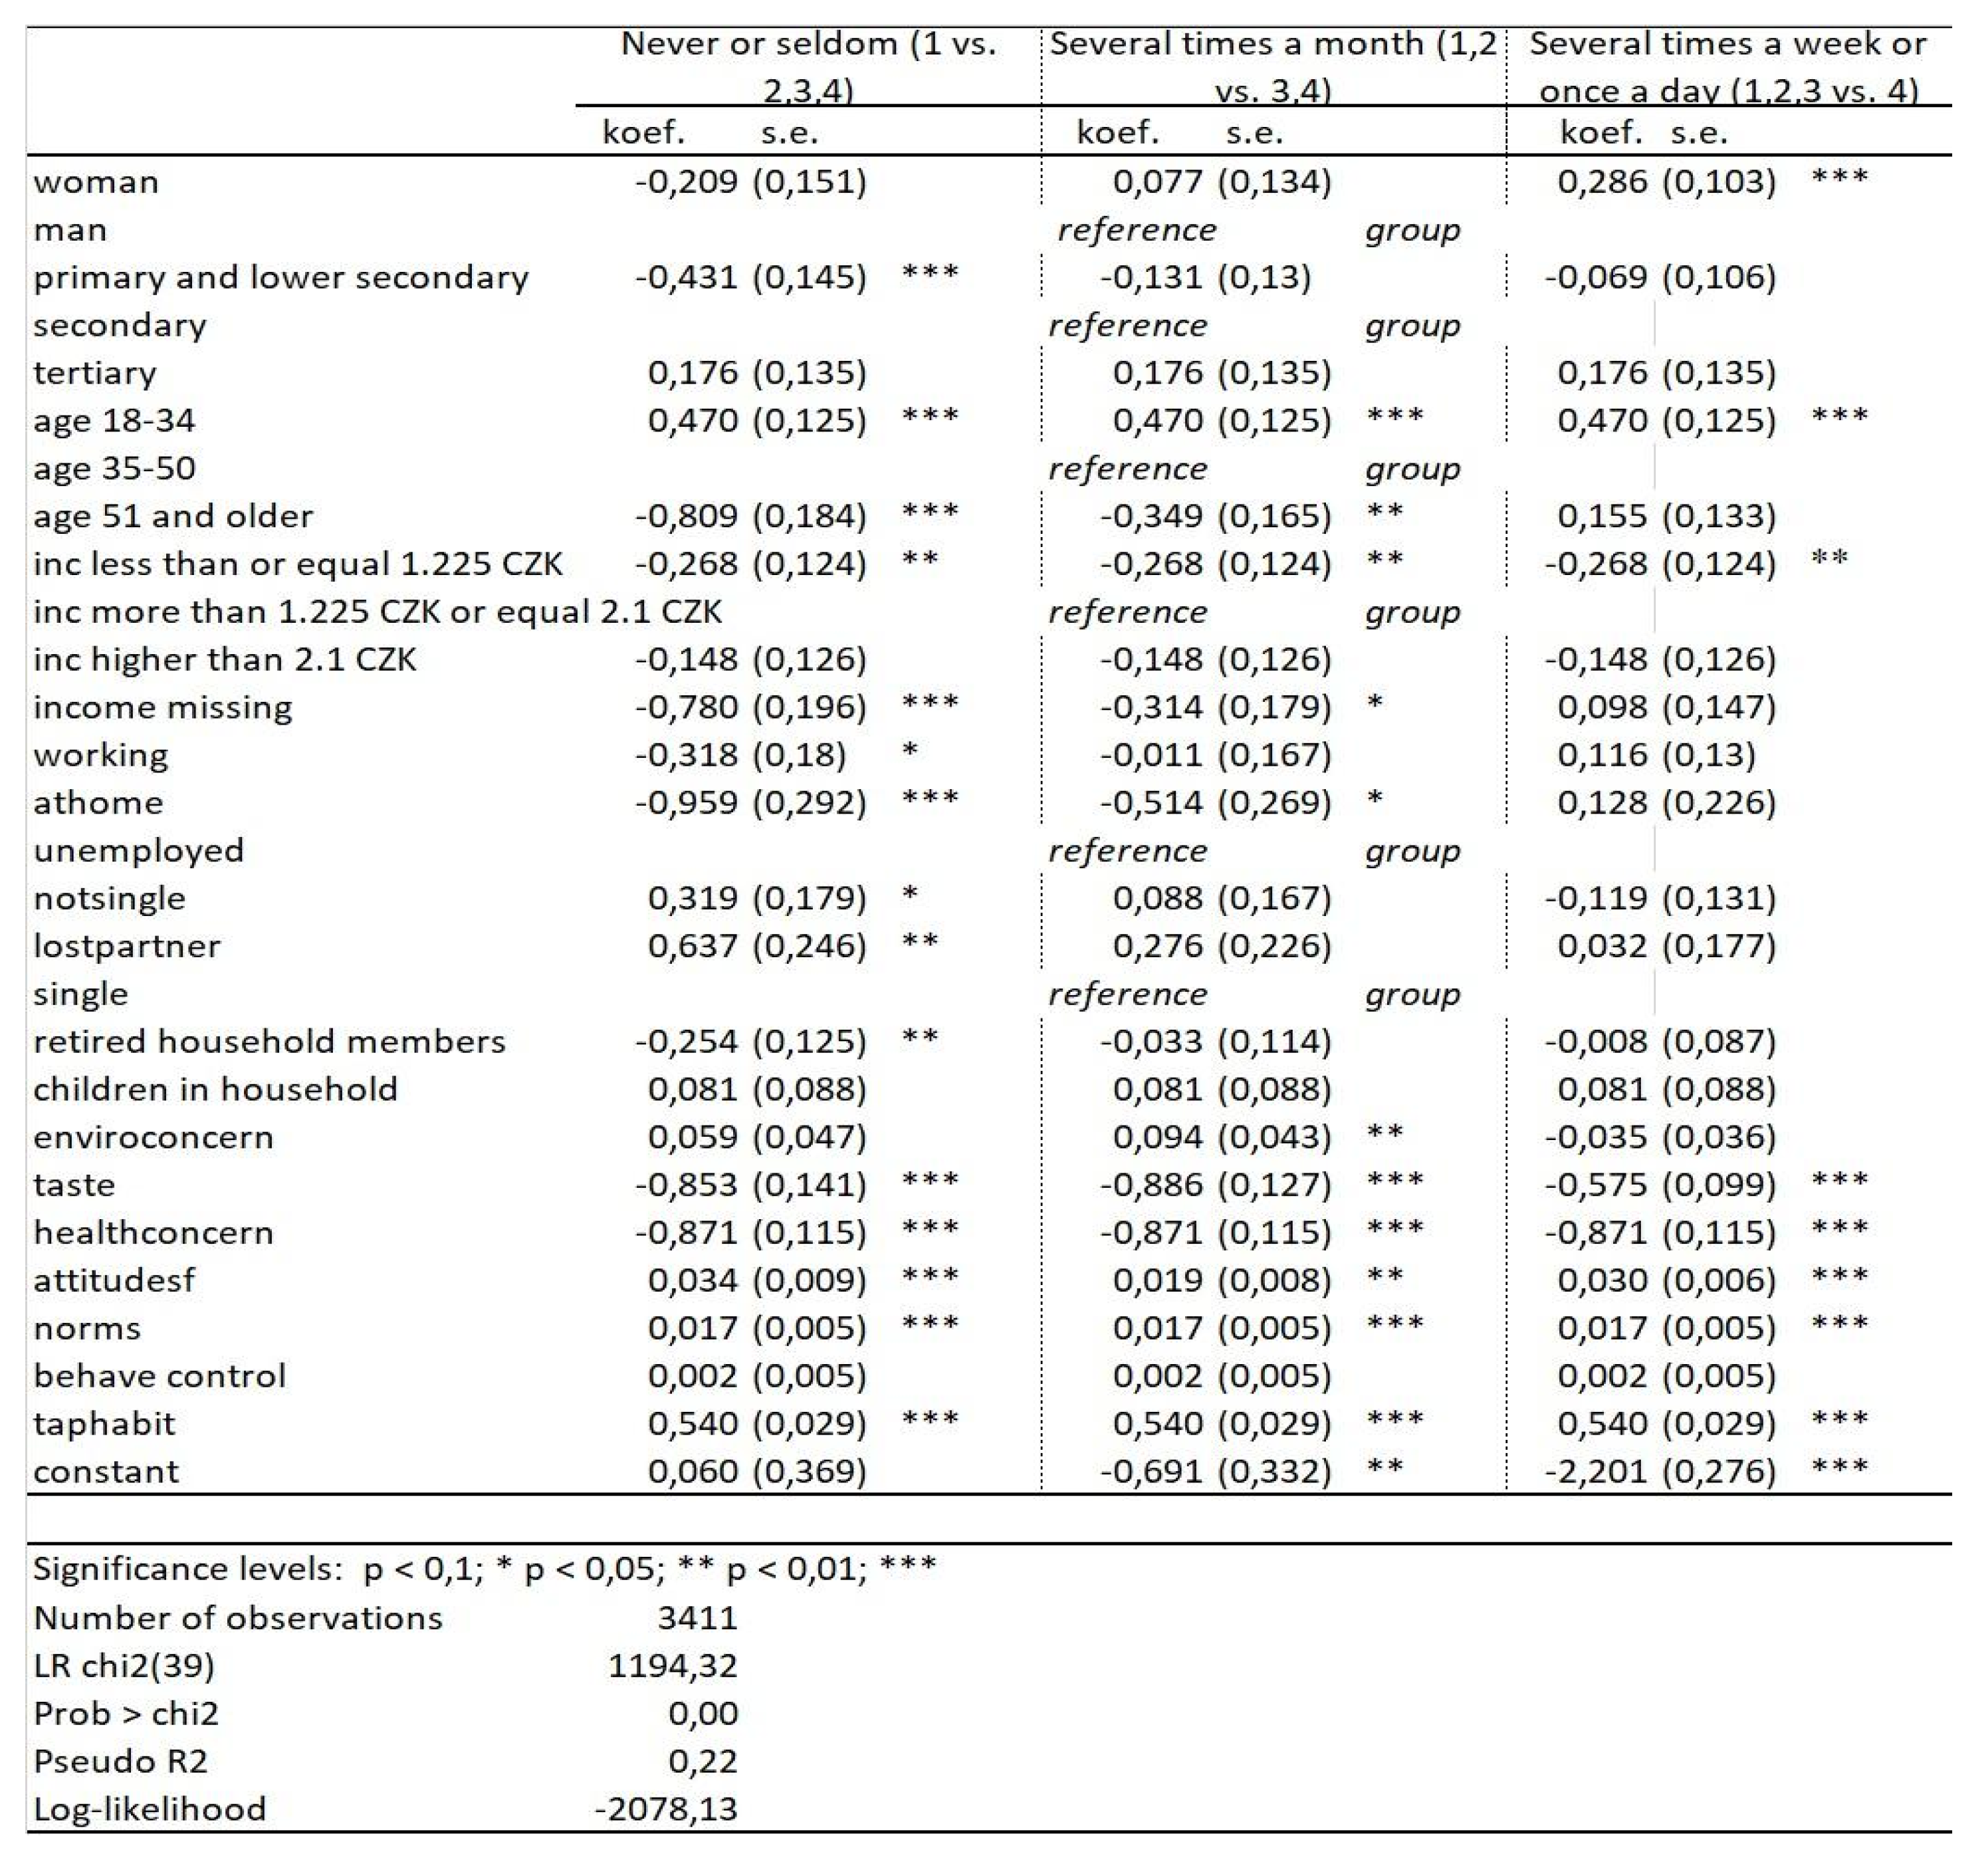 |
Table 6.
Marginal effects from the generalized ordinal logit model for the frequency of drinking tap water.
Table 6.
Marginal effects from the generalized ordinal logit model for the frequency of drinking tap water.
 |
Table 7.
Multinomial logit results for the frequency of drinking tap water, reference category = several times a day.
Table 7.
Multinomial logit results for the frequency of drinking tap water, reference category = several times a day.
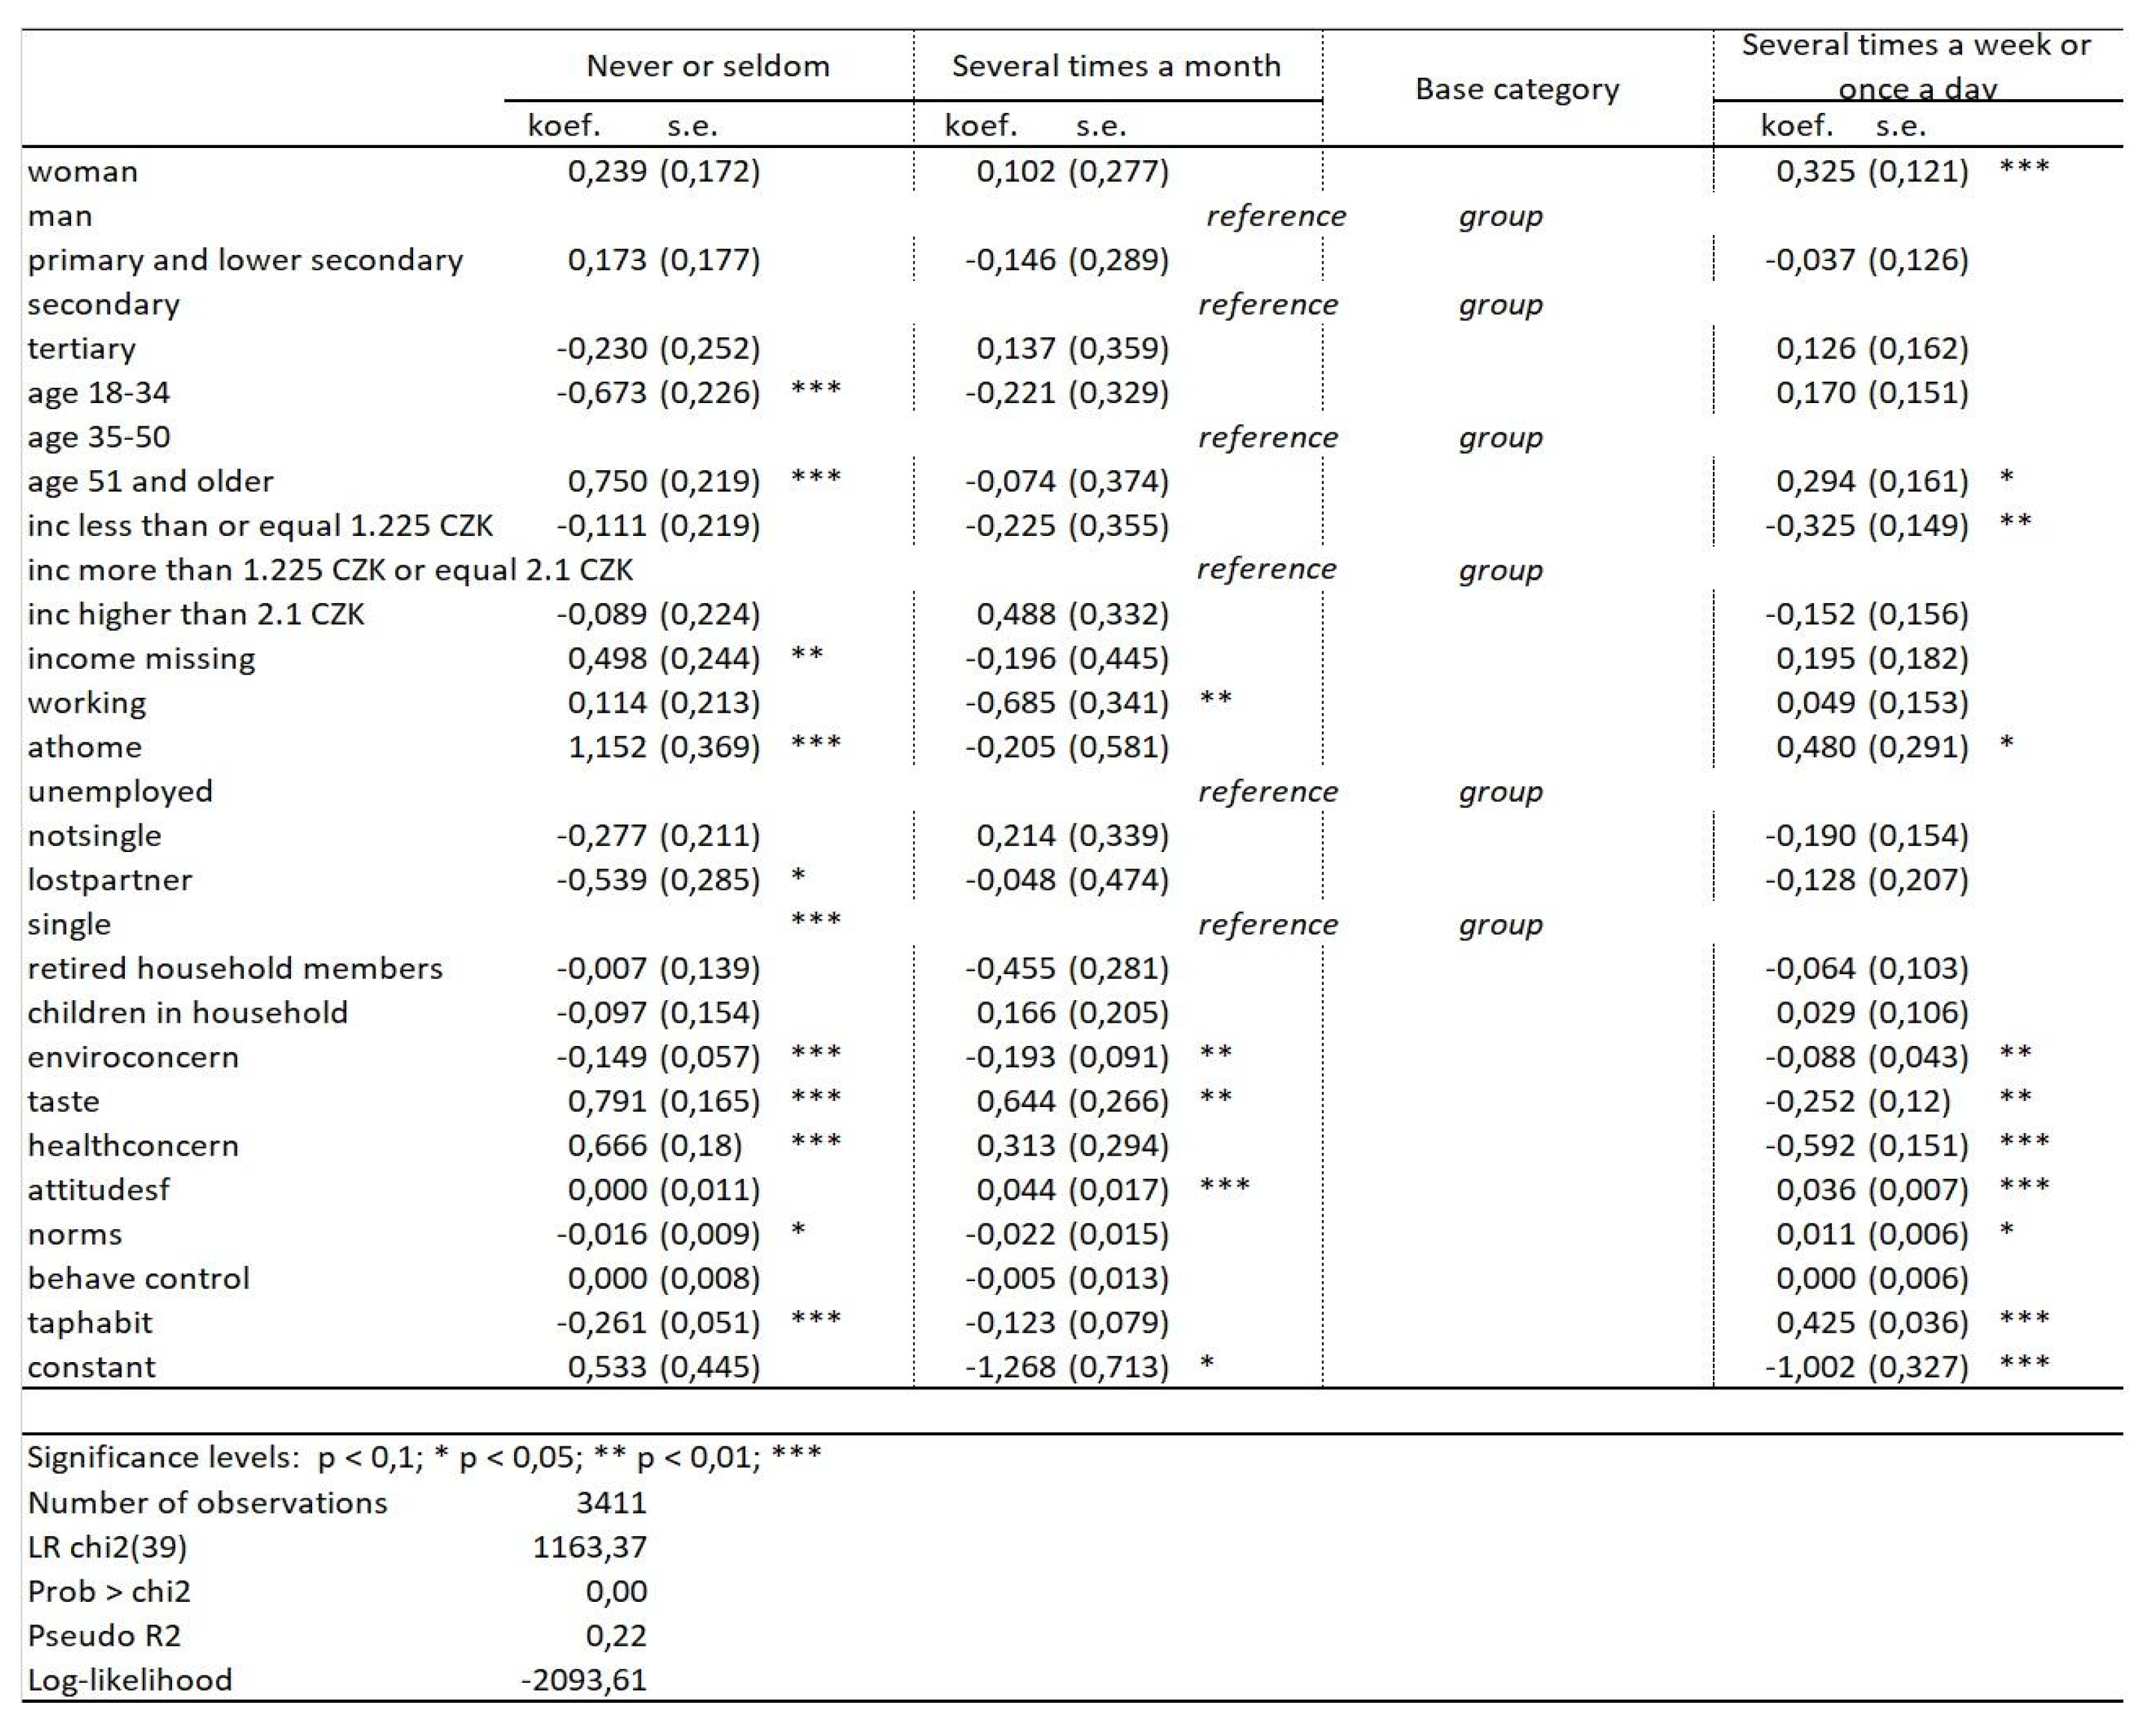 |
Figure 1.
Percentages of frequency of drinking tap water (water from the public tap) among respondents (N = 3411).
Figure 1.
Percentages of frequency of drinking tap water (water from the public tap) among respondents (N = 3411).
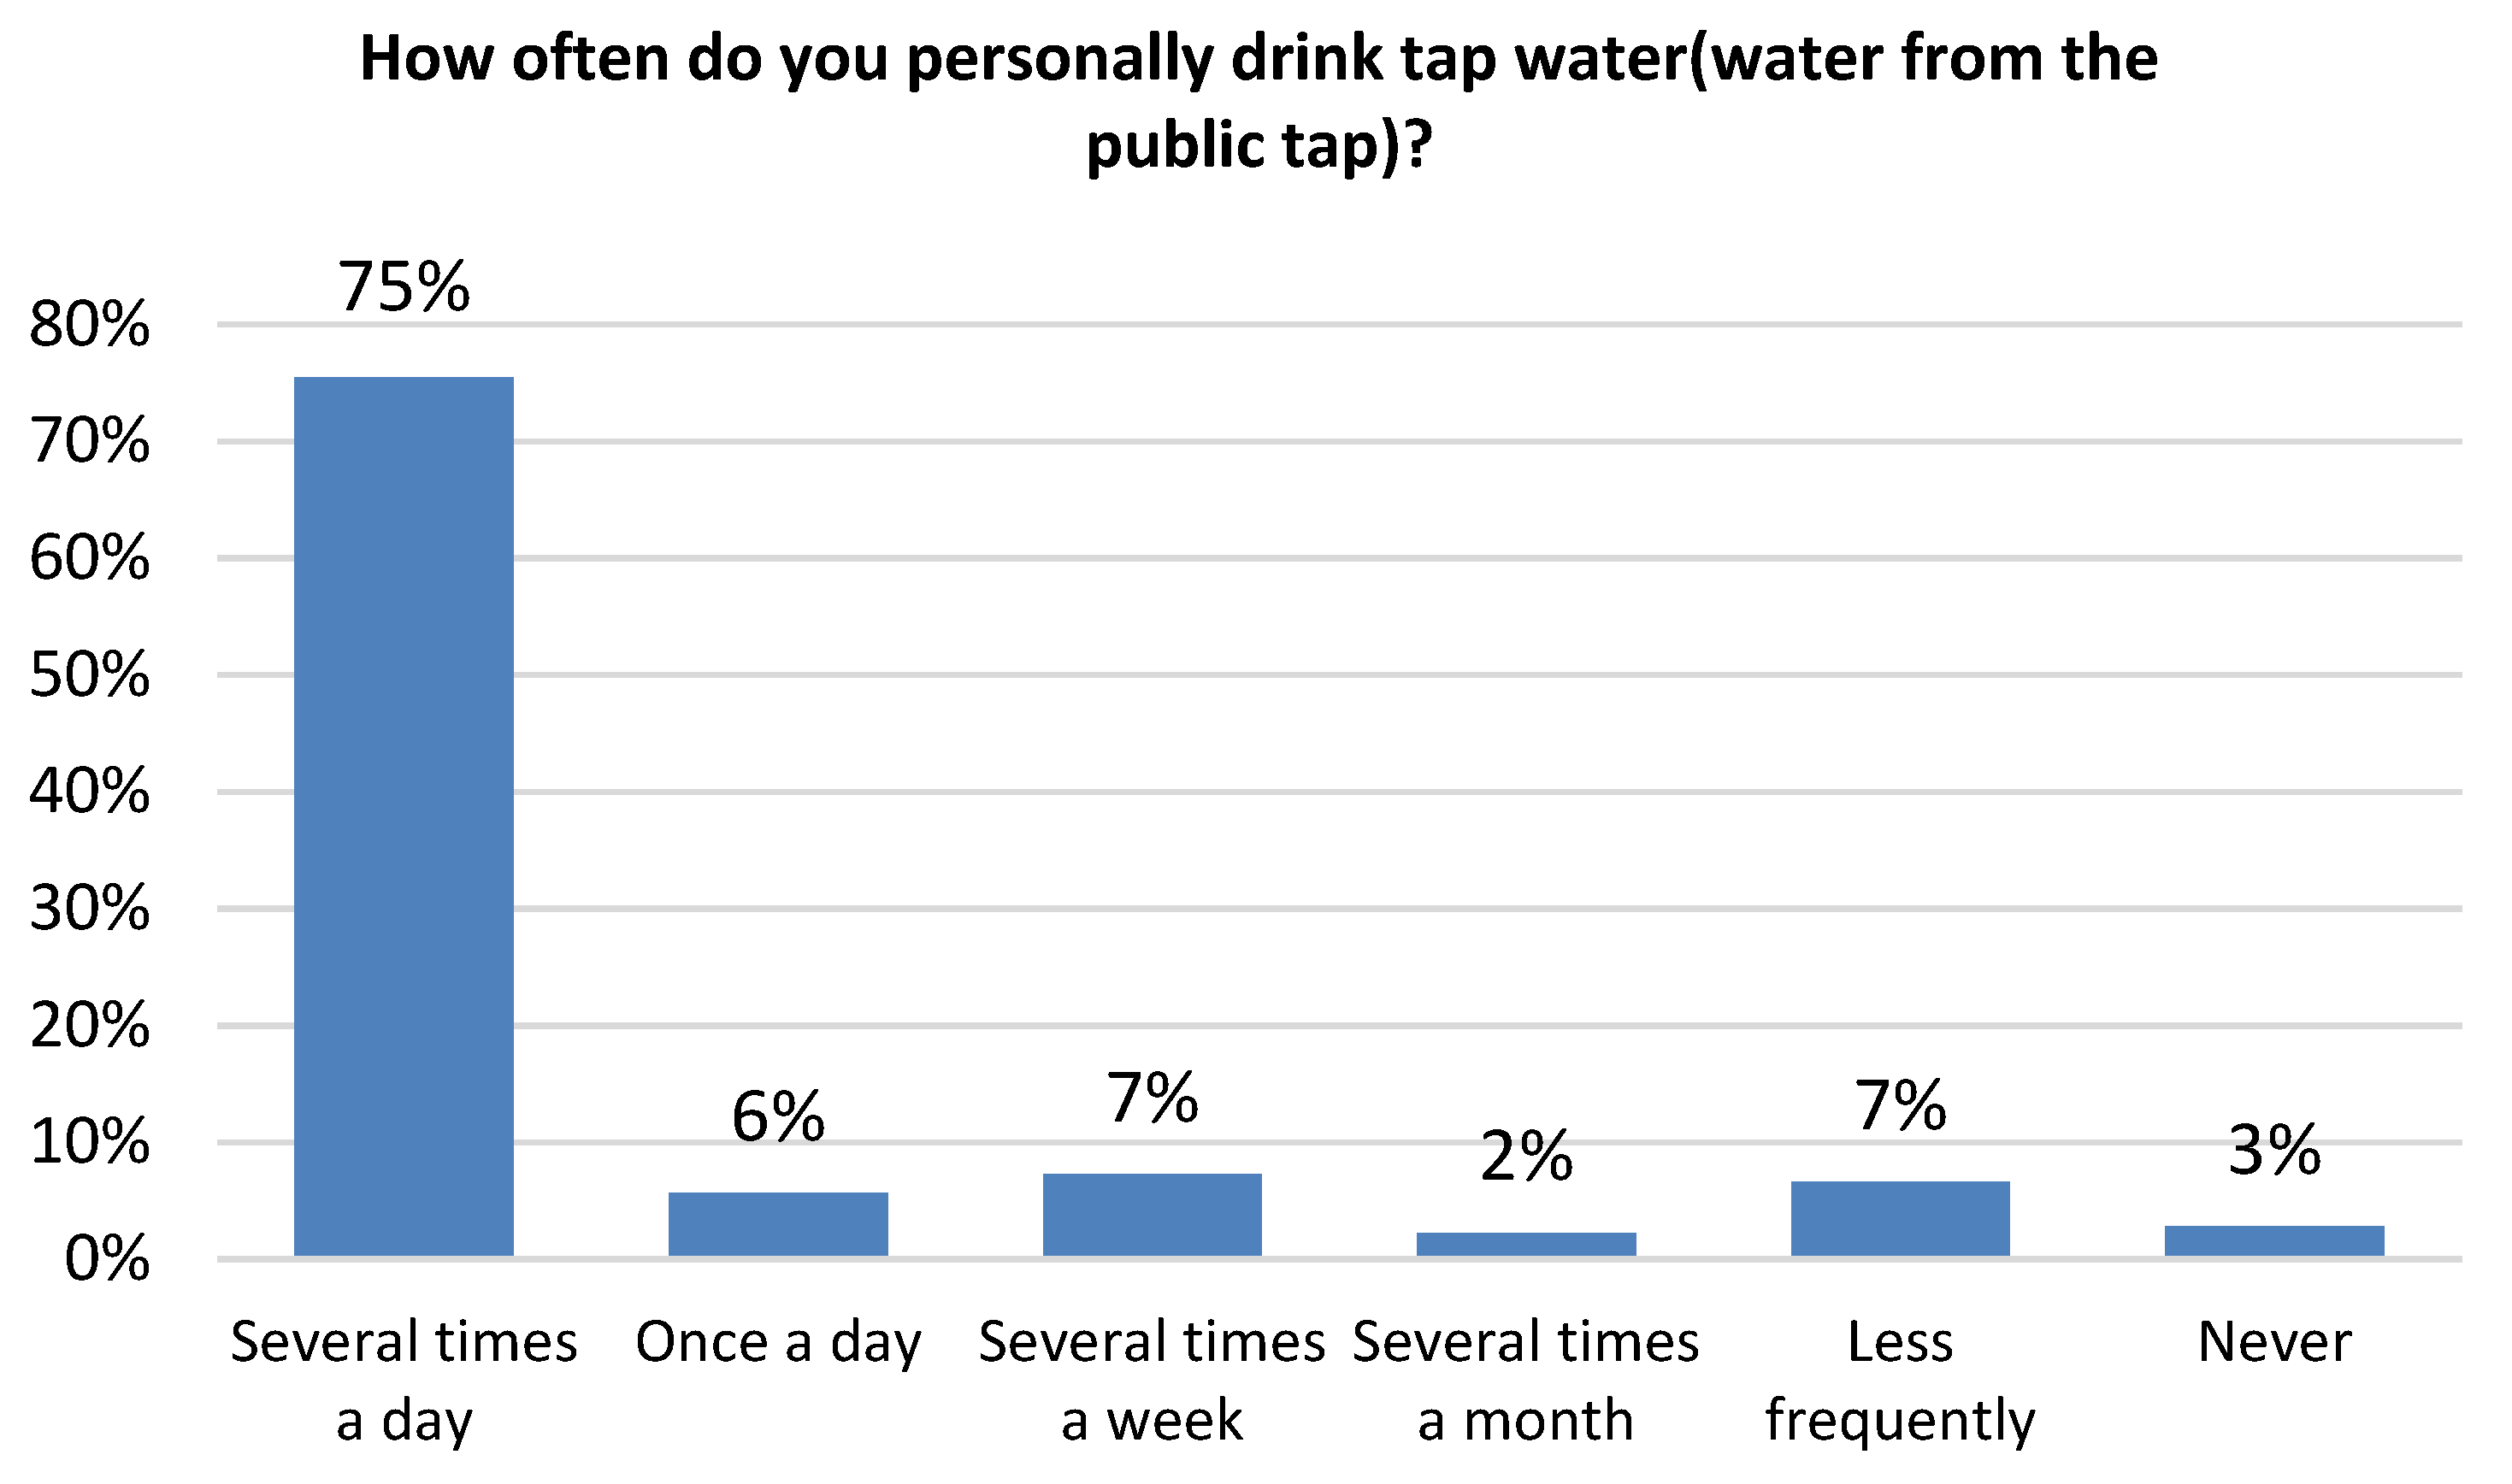
Figure 2.
Percentage of reasons given for not drinking tap water or drinking it infrequently (Number of responses = 402).
Figure 2.
Percentage of reasons given for not drinking tap water or drinking it infrequently (Number of responses = 402).
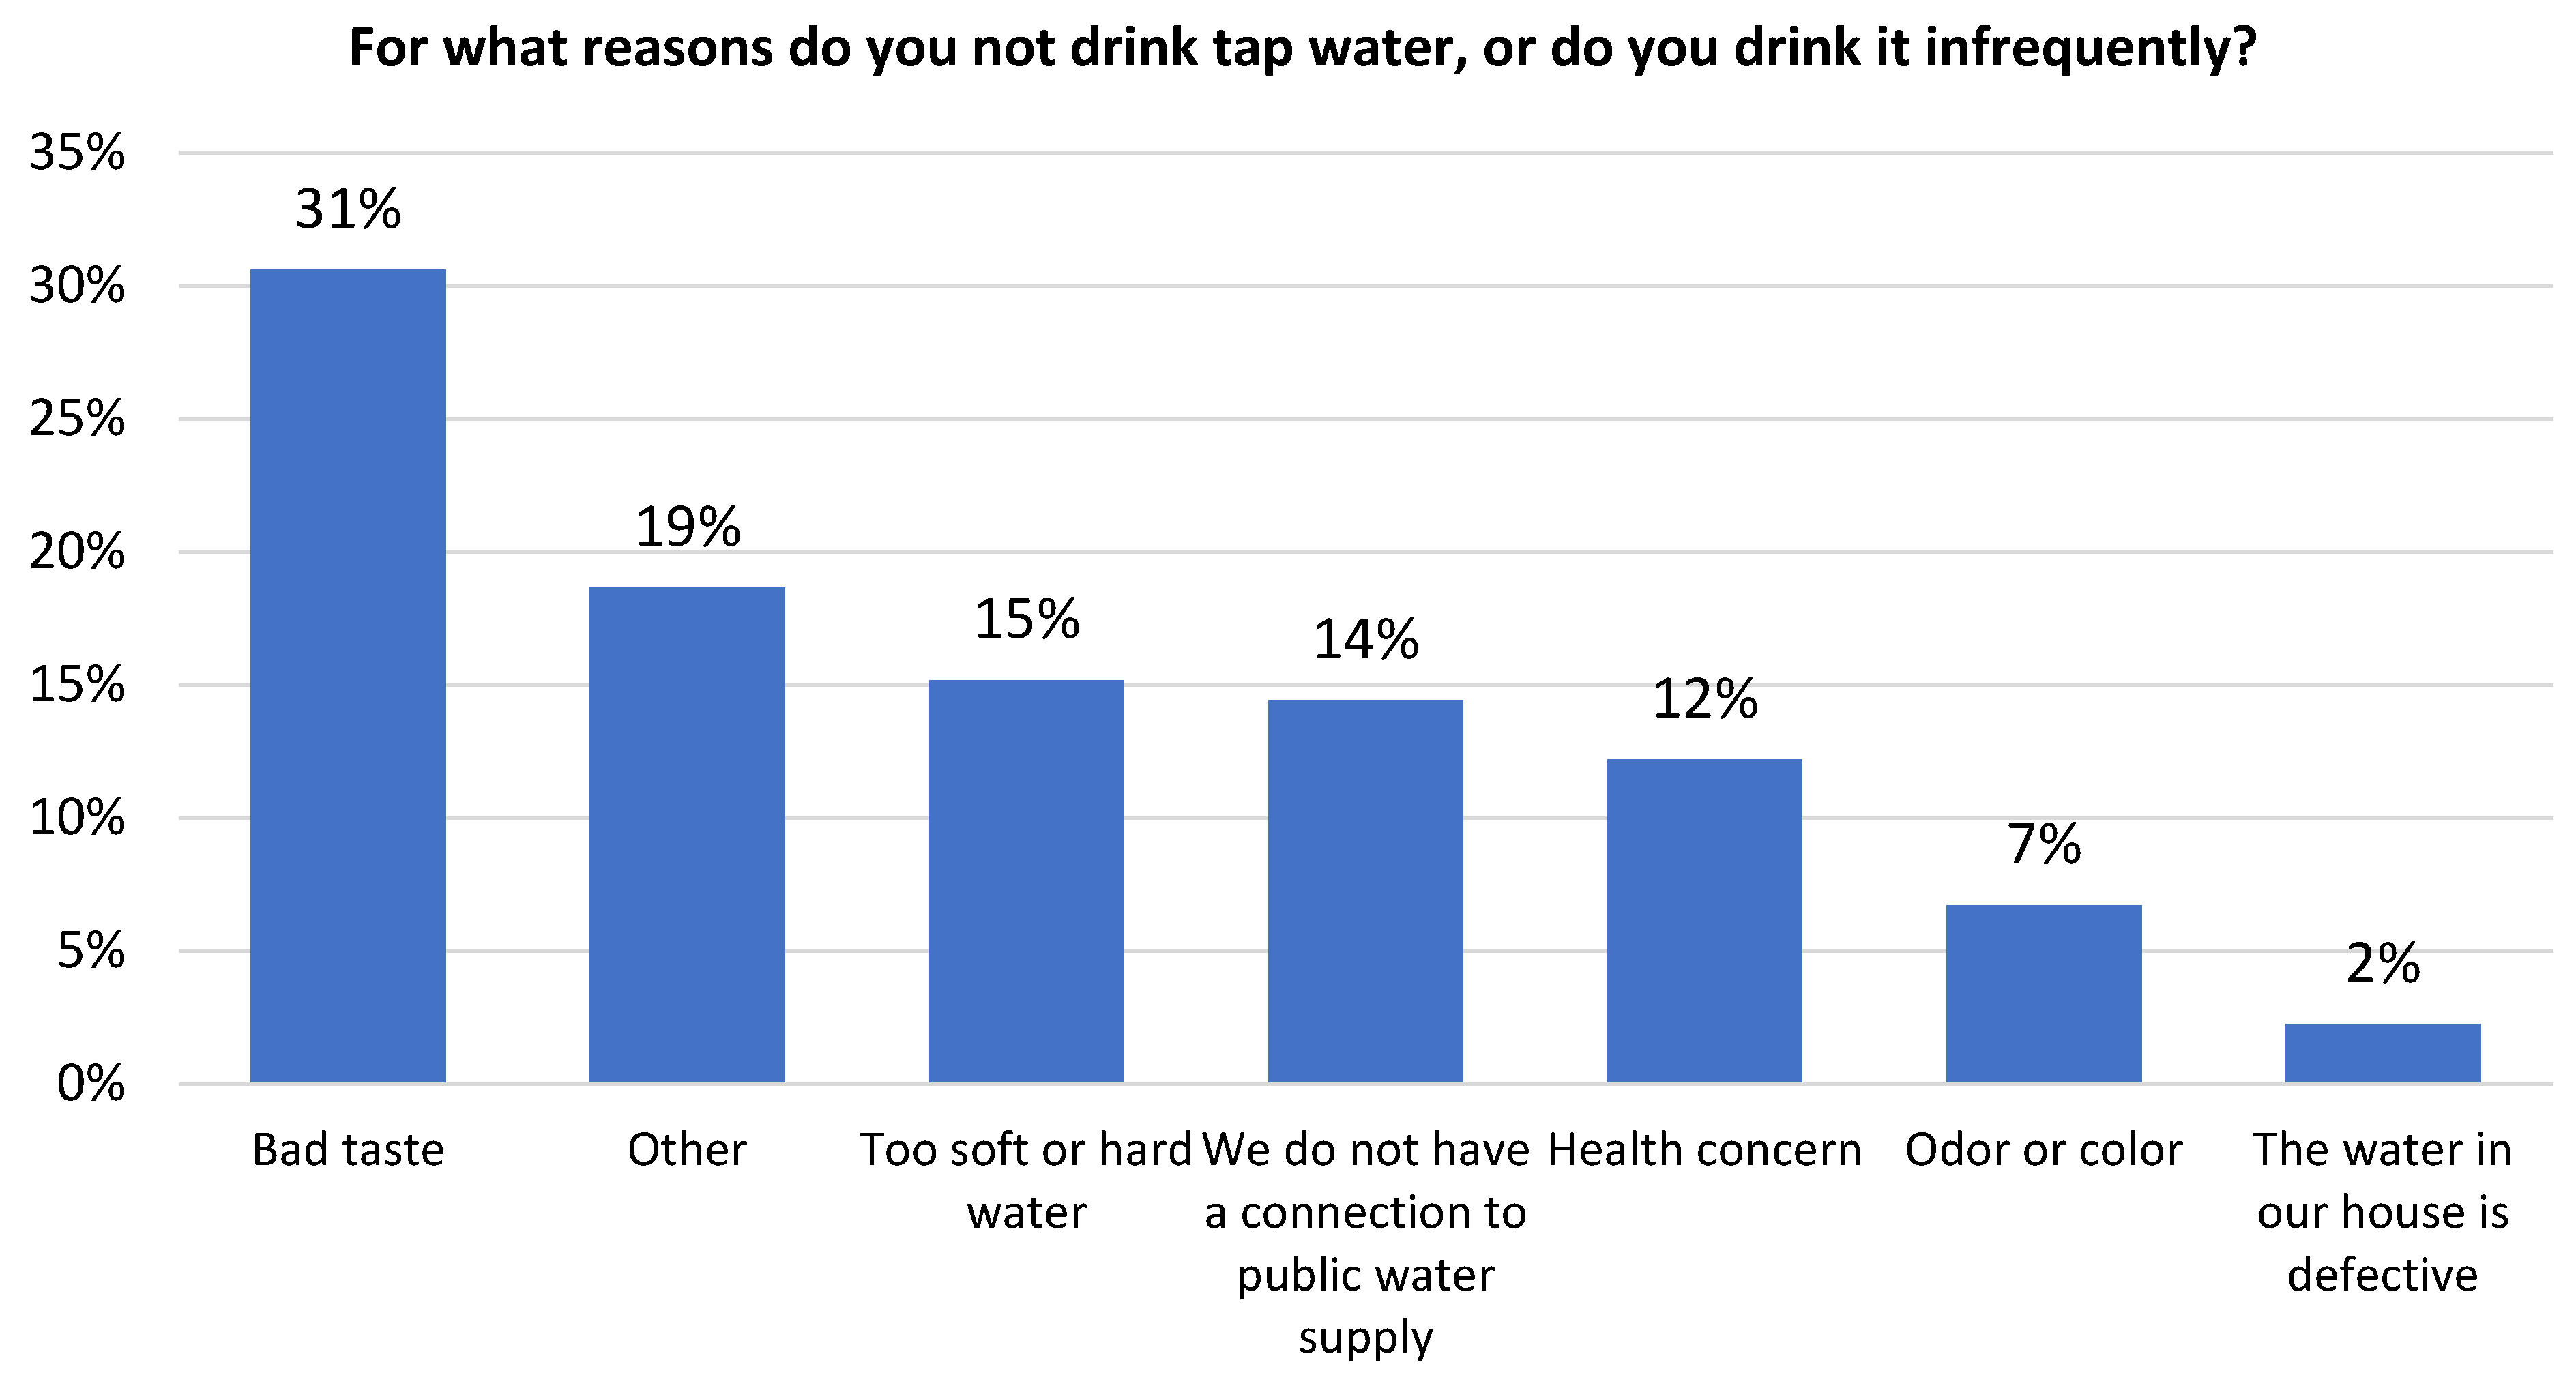
Figure 3.
Percentages of frequency of drinking bottled water among respondents (N = 3411).
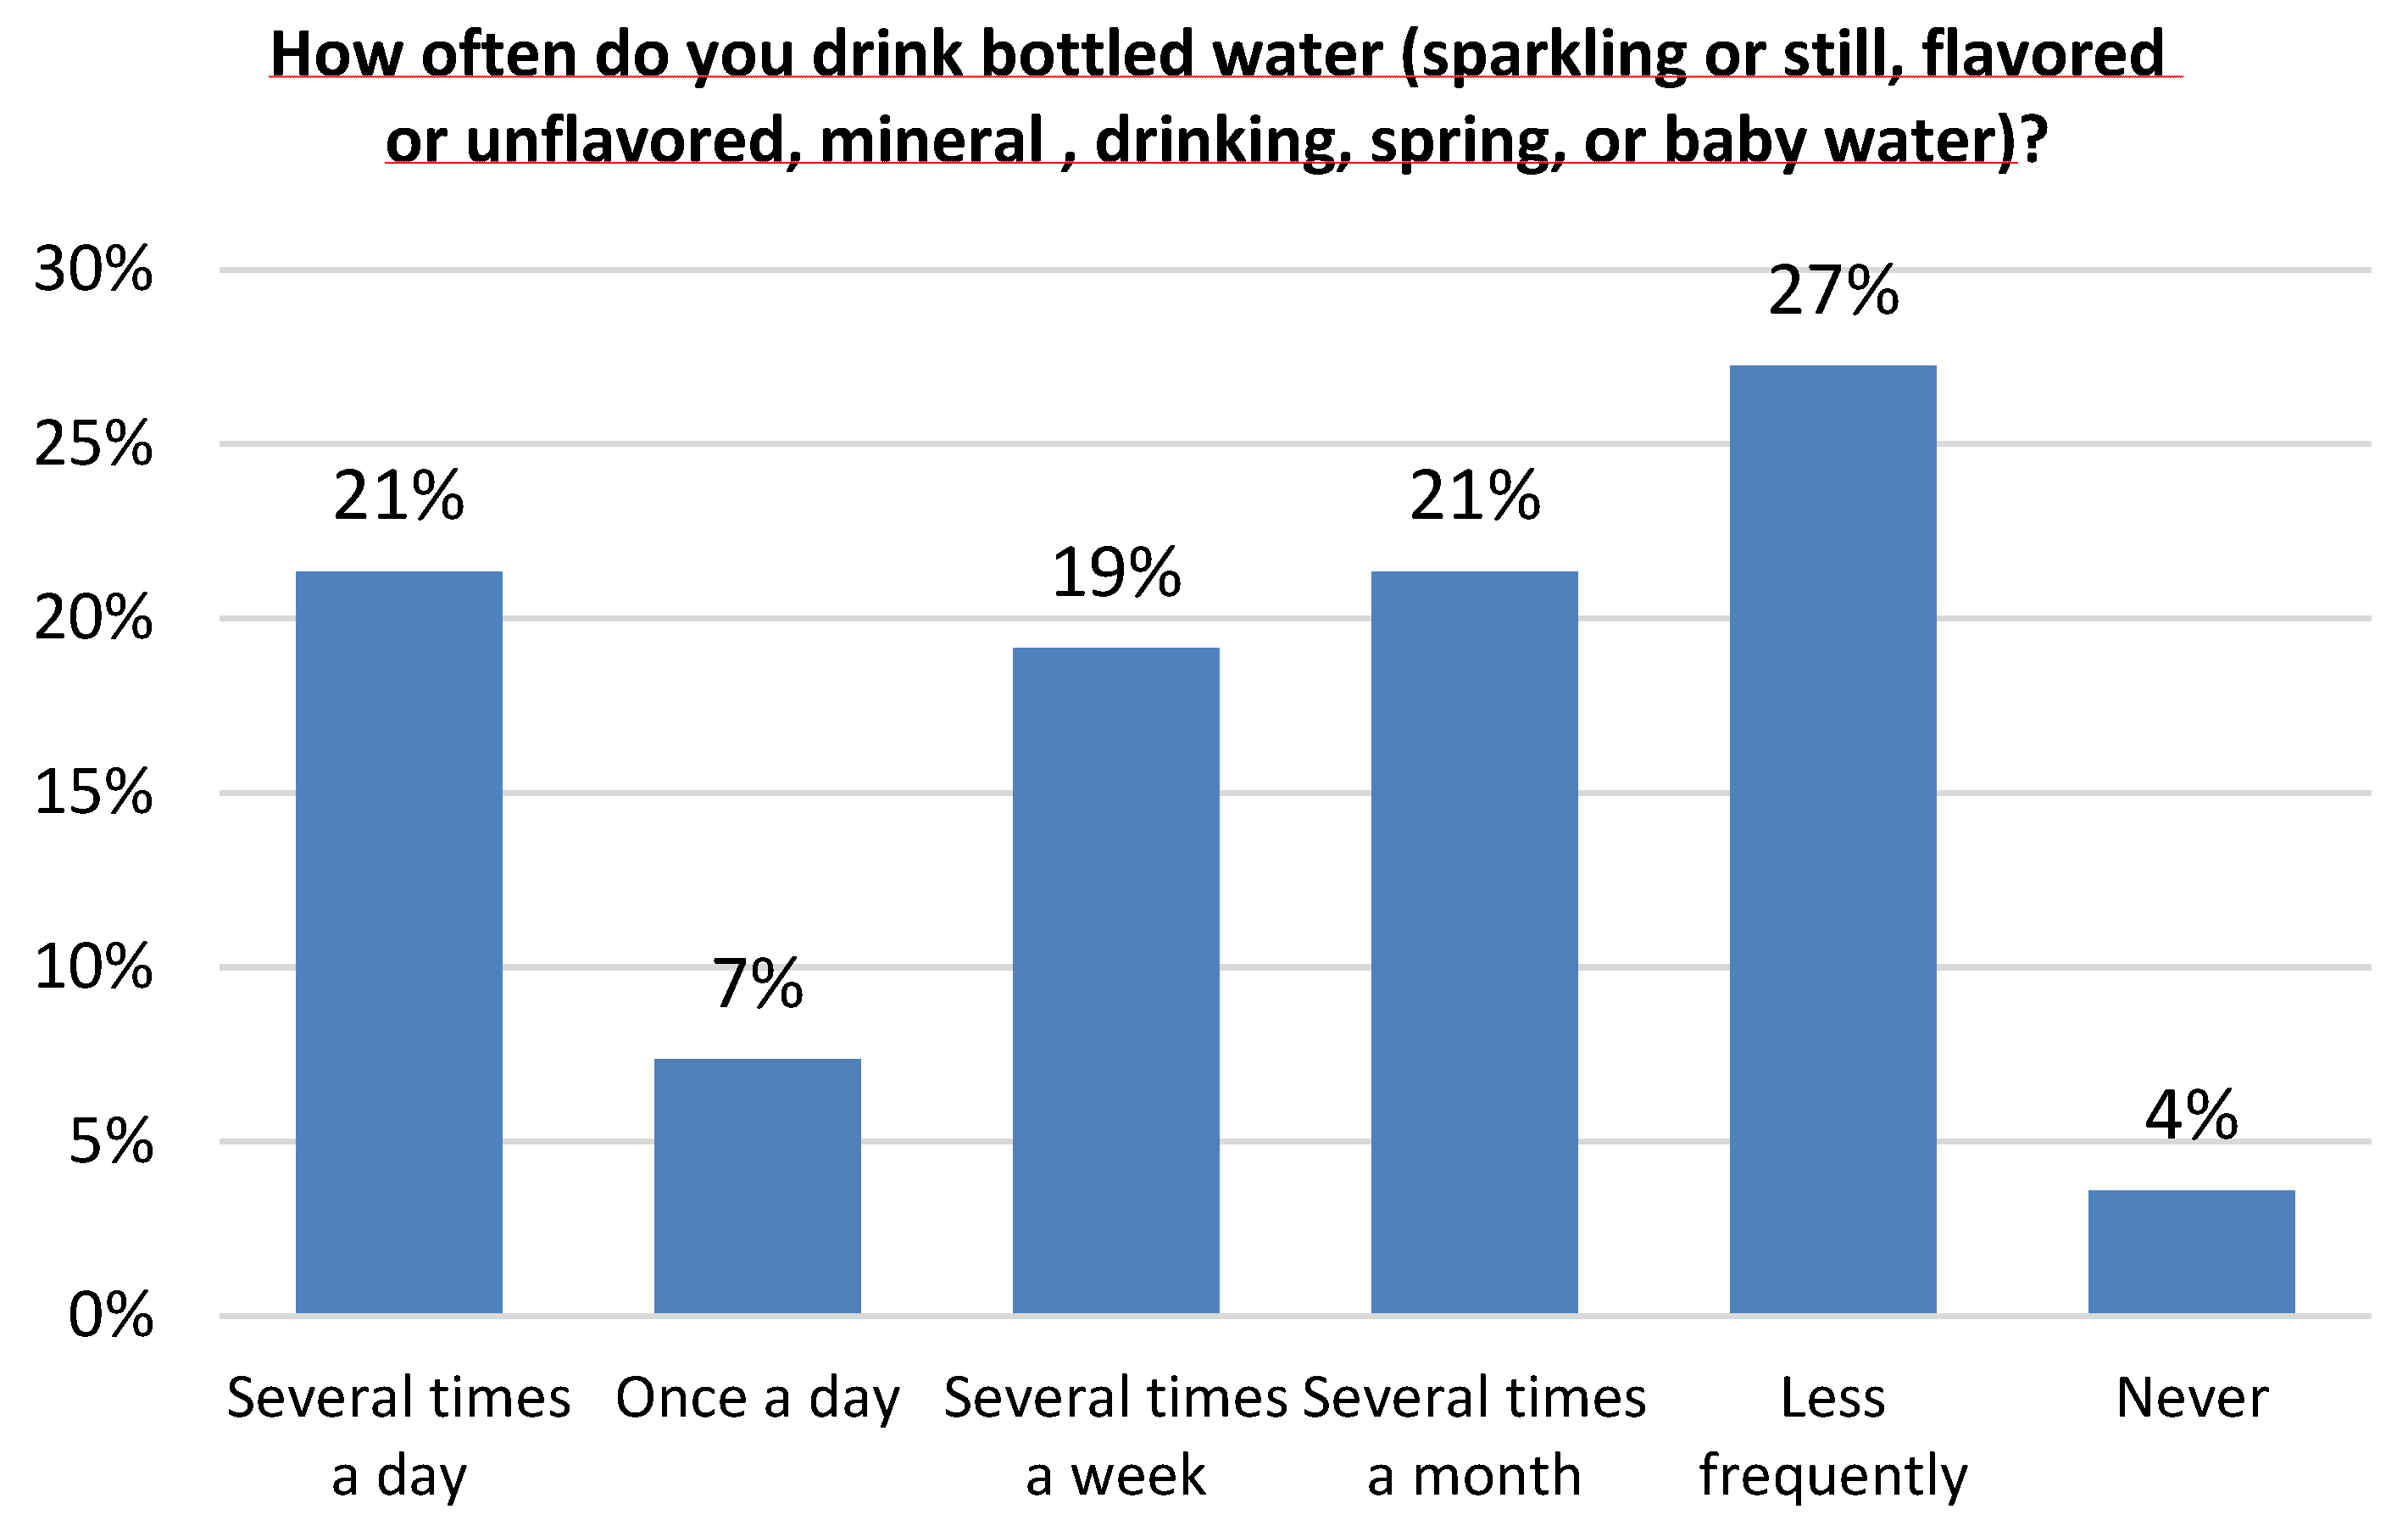
Figure 4.
Percentage of reasons given for drinking bottled water (Number of responses = 5854).

Figure 5.
Level of agreement or disagreement with statements about the consequences of drinking mostly tap water during the next 3 months, in percent (N = 3411).
Figure 5.
Level of agreement or disagreement with statements about the consequences of drinking mostly tap water during the next 3 months, in percent (N = 3411).
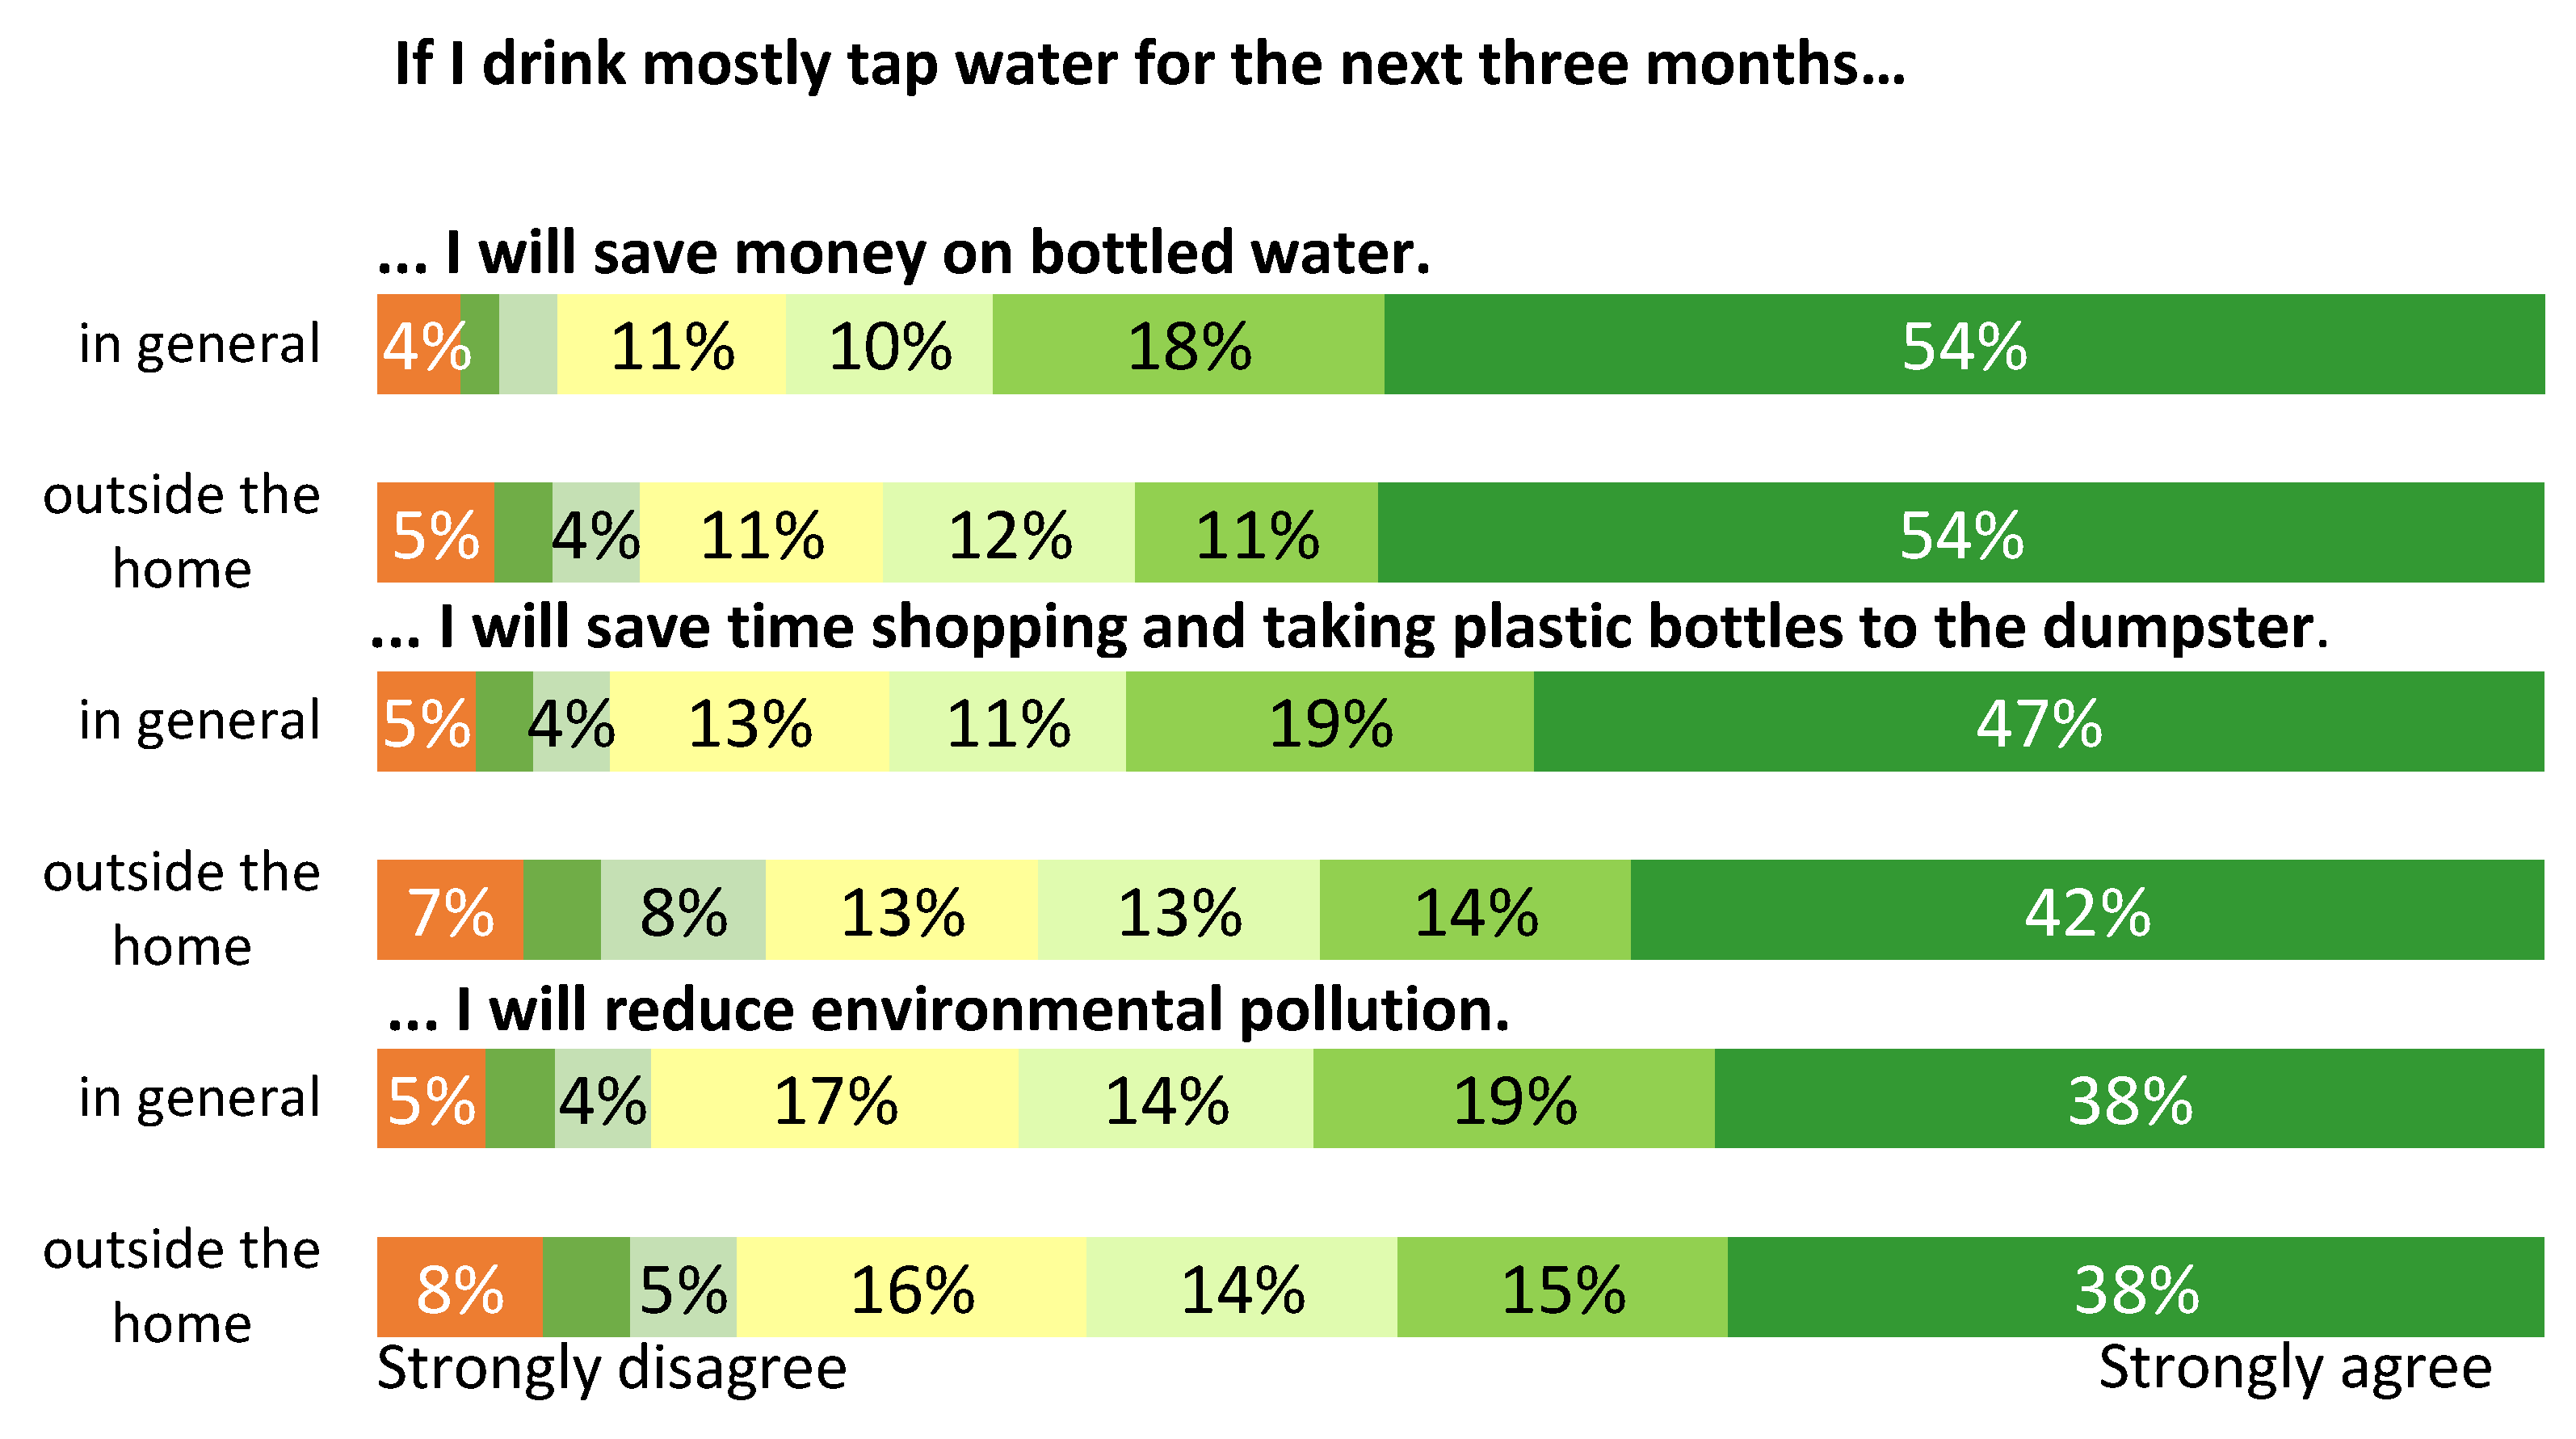
Figure 6.
Odds ratio of individual predictors for frequency of bottled water consumption (N = 3411).
Figure 6.
Odds ratio of individual predictors for frequency of bottled water consumption (N = 3411).
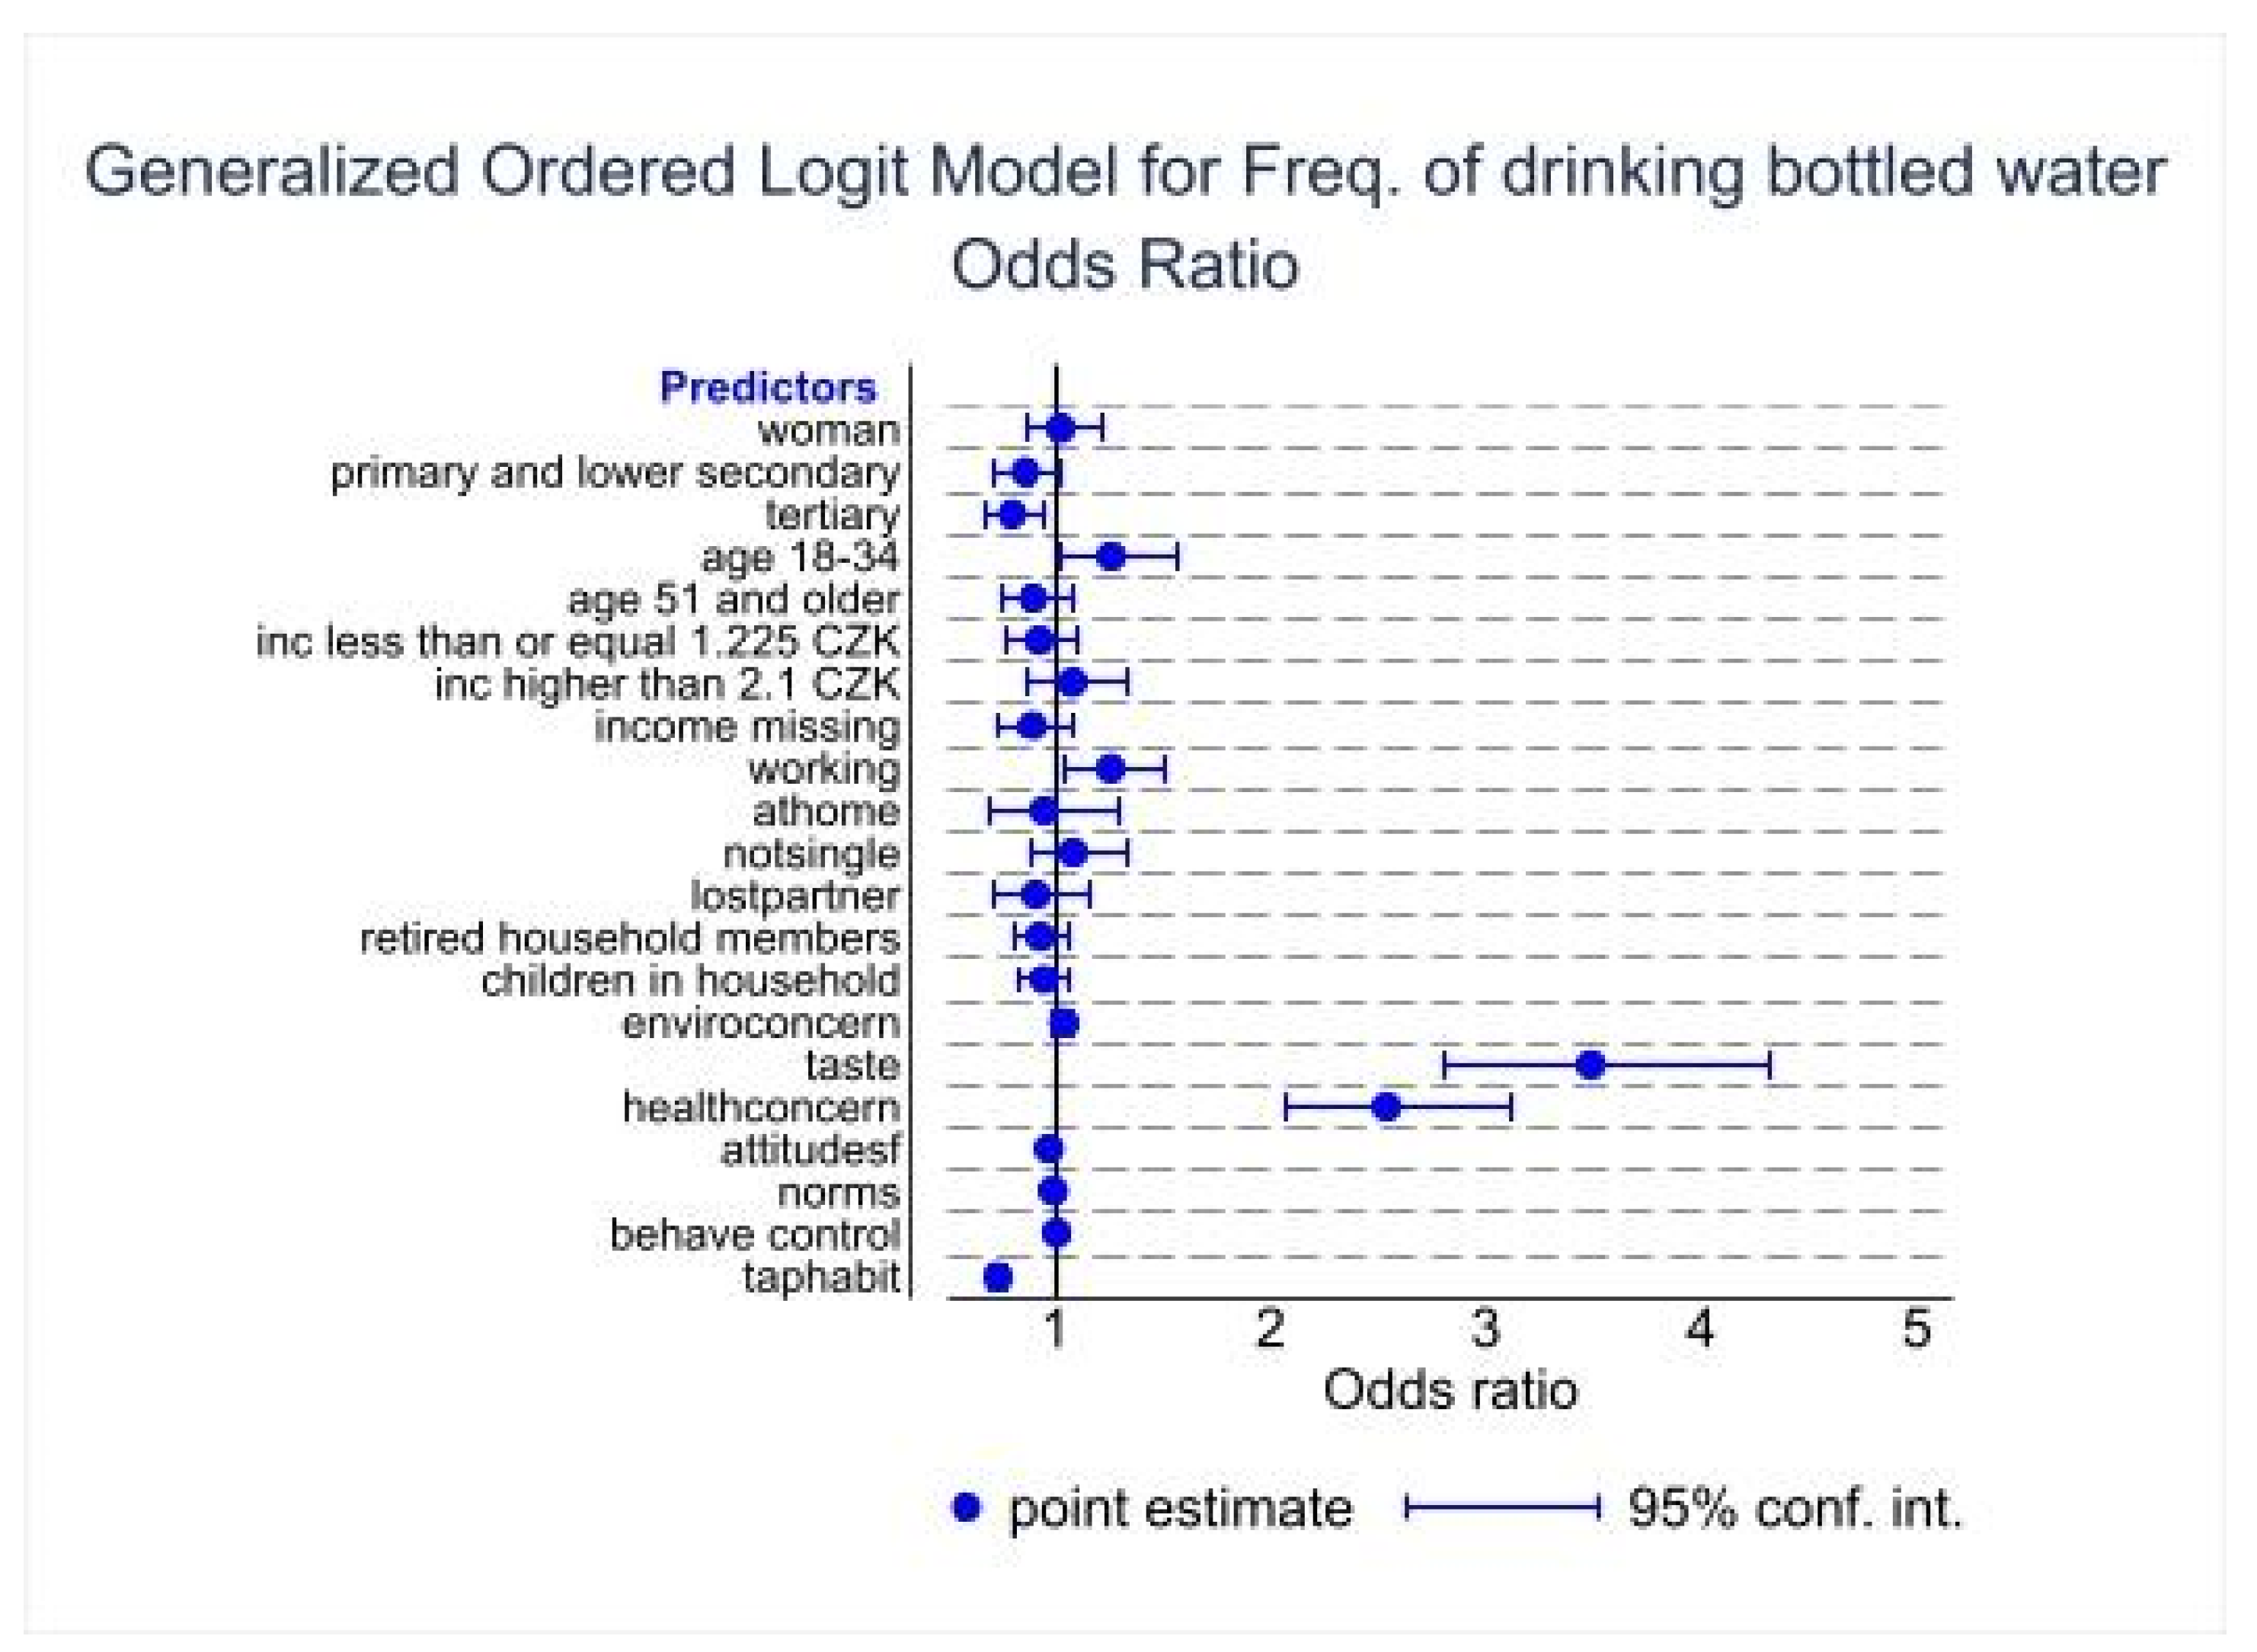
Figure 7.
Odds ratio of individual predictors for frequency of tap water consumption (N = 3411).
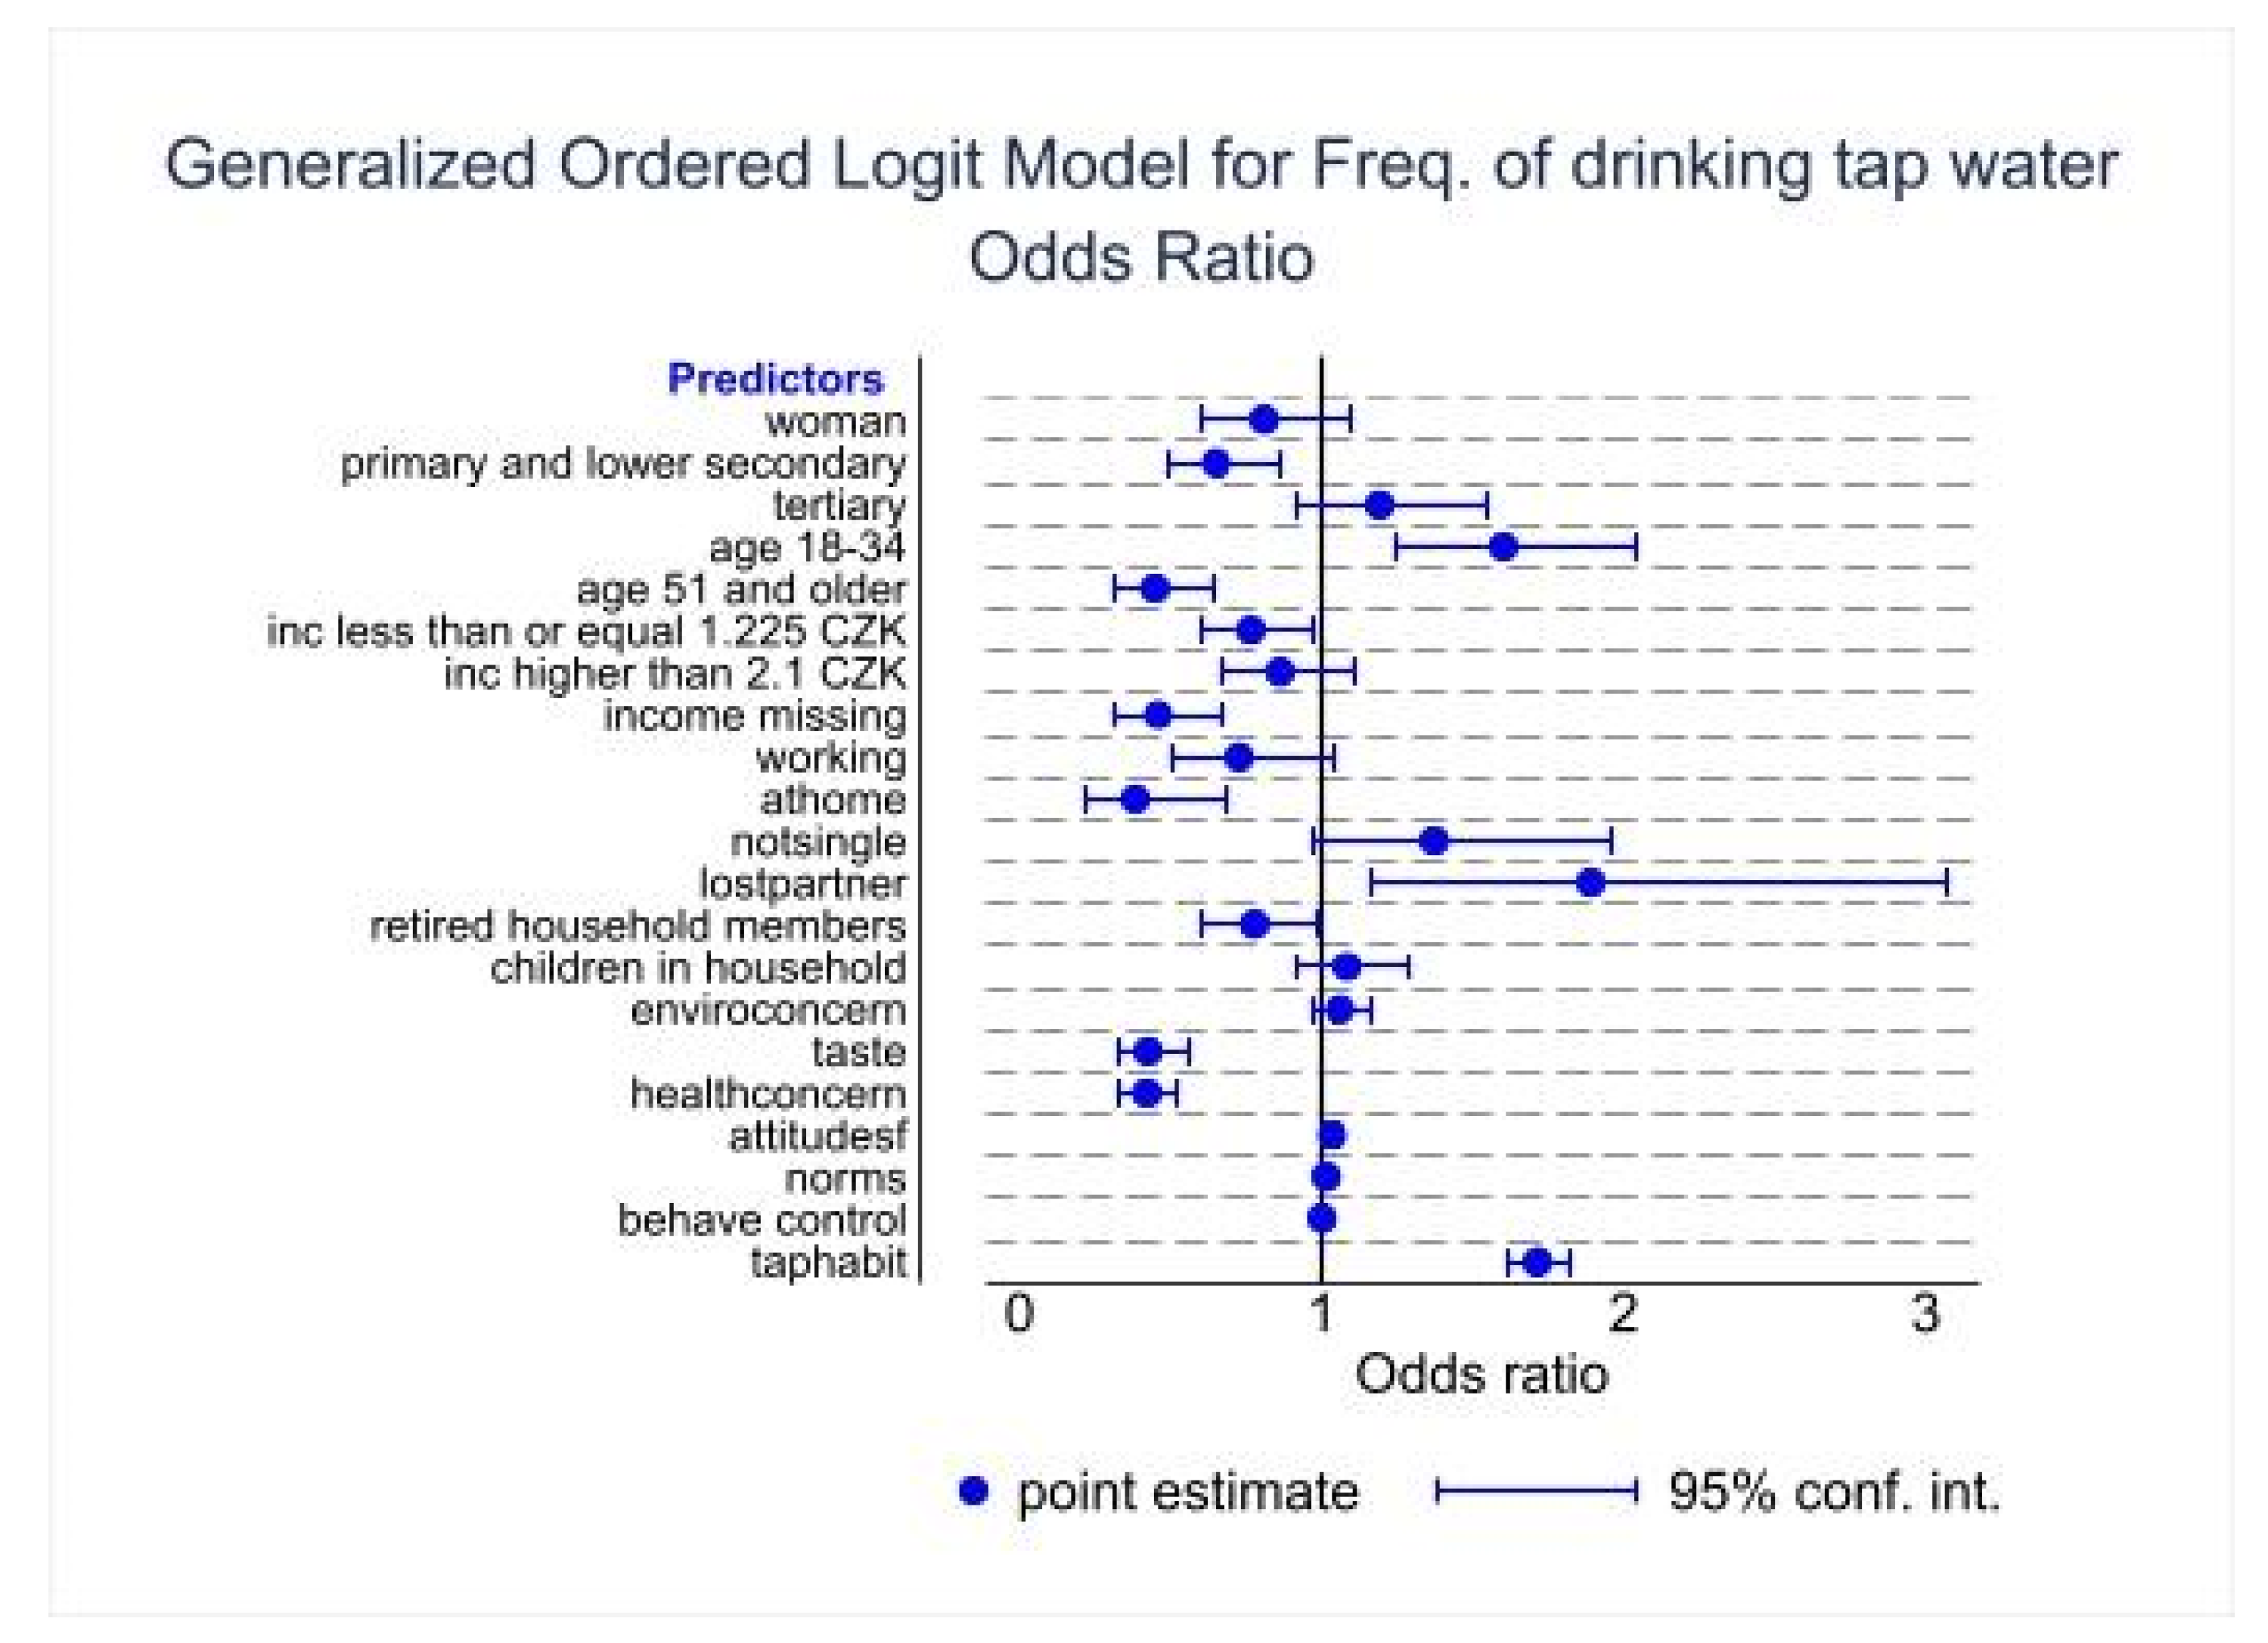
Figure 8.
Average marginal effects of key independent variables on bottled water consumption at the 95% confidence level, △Pr denotes a change in the probability (N = 3411).
Figure 8.
Average marginal effects of key independent variables on bottled water consumption at the 95% confidence level, △Pr denotes a change in the probability (N = 3411).
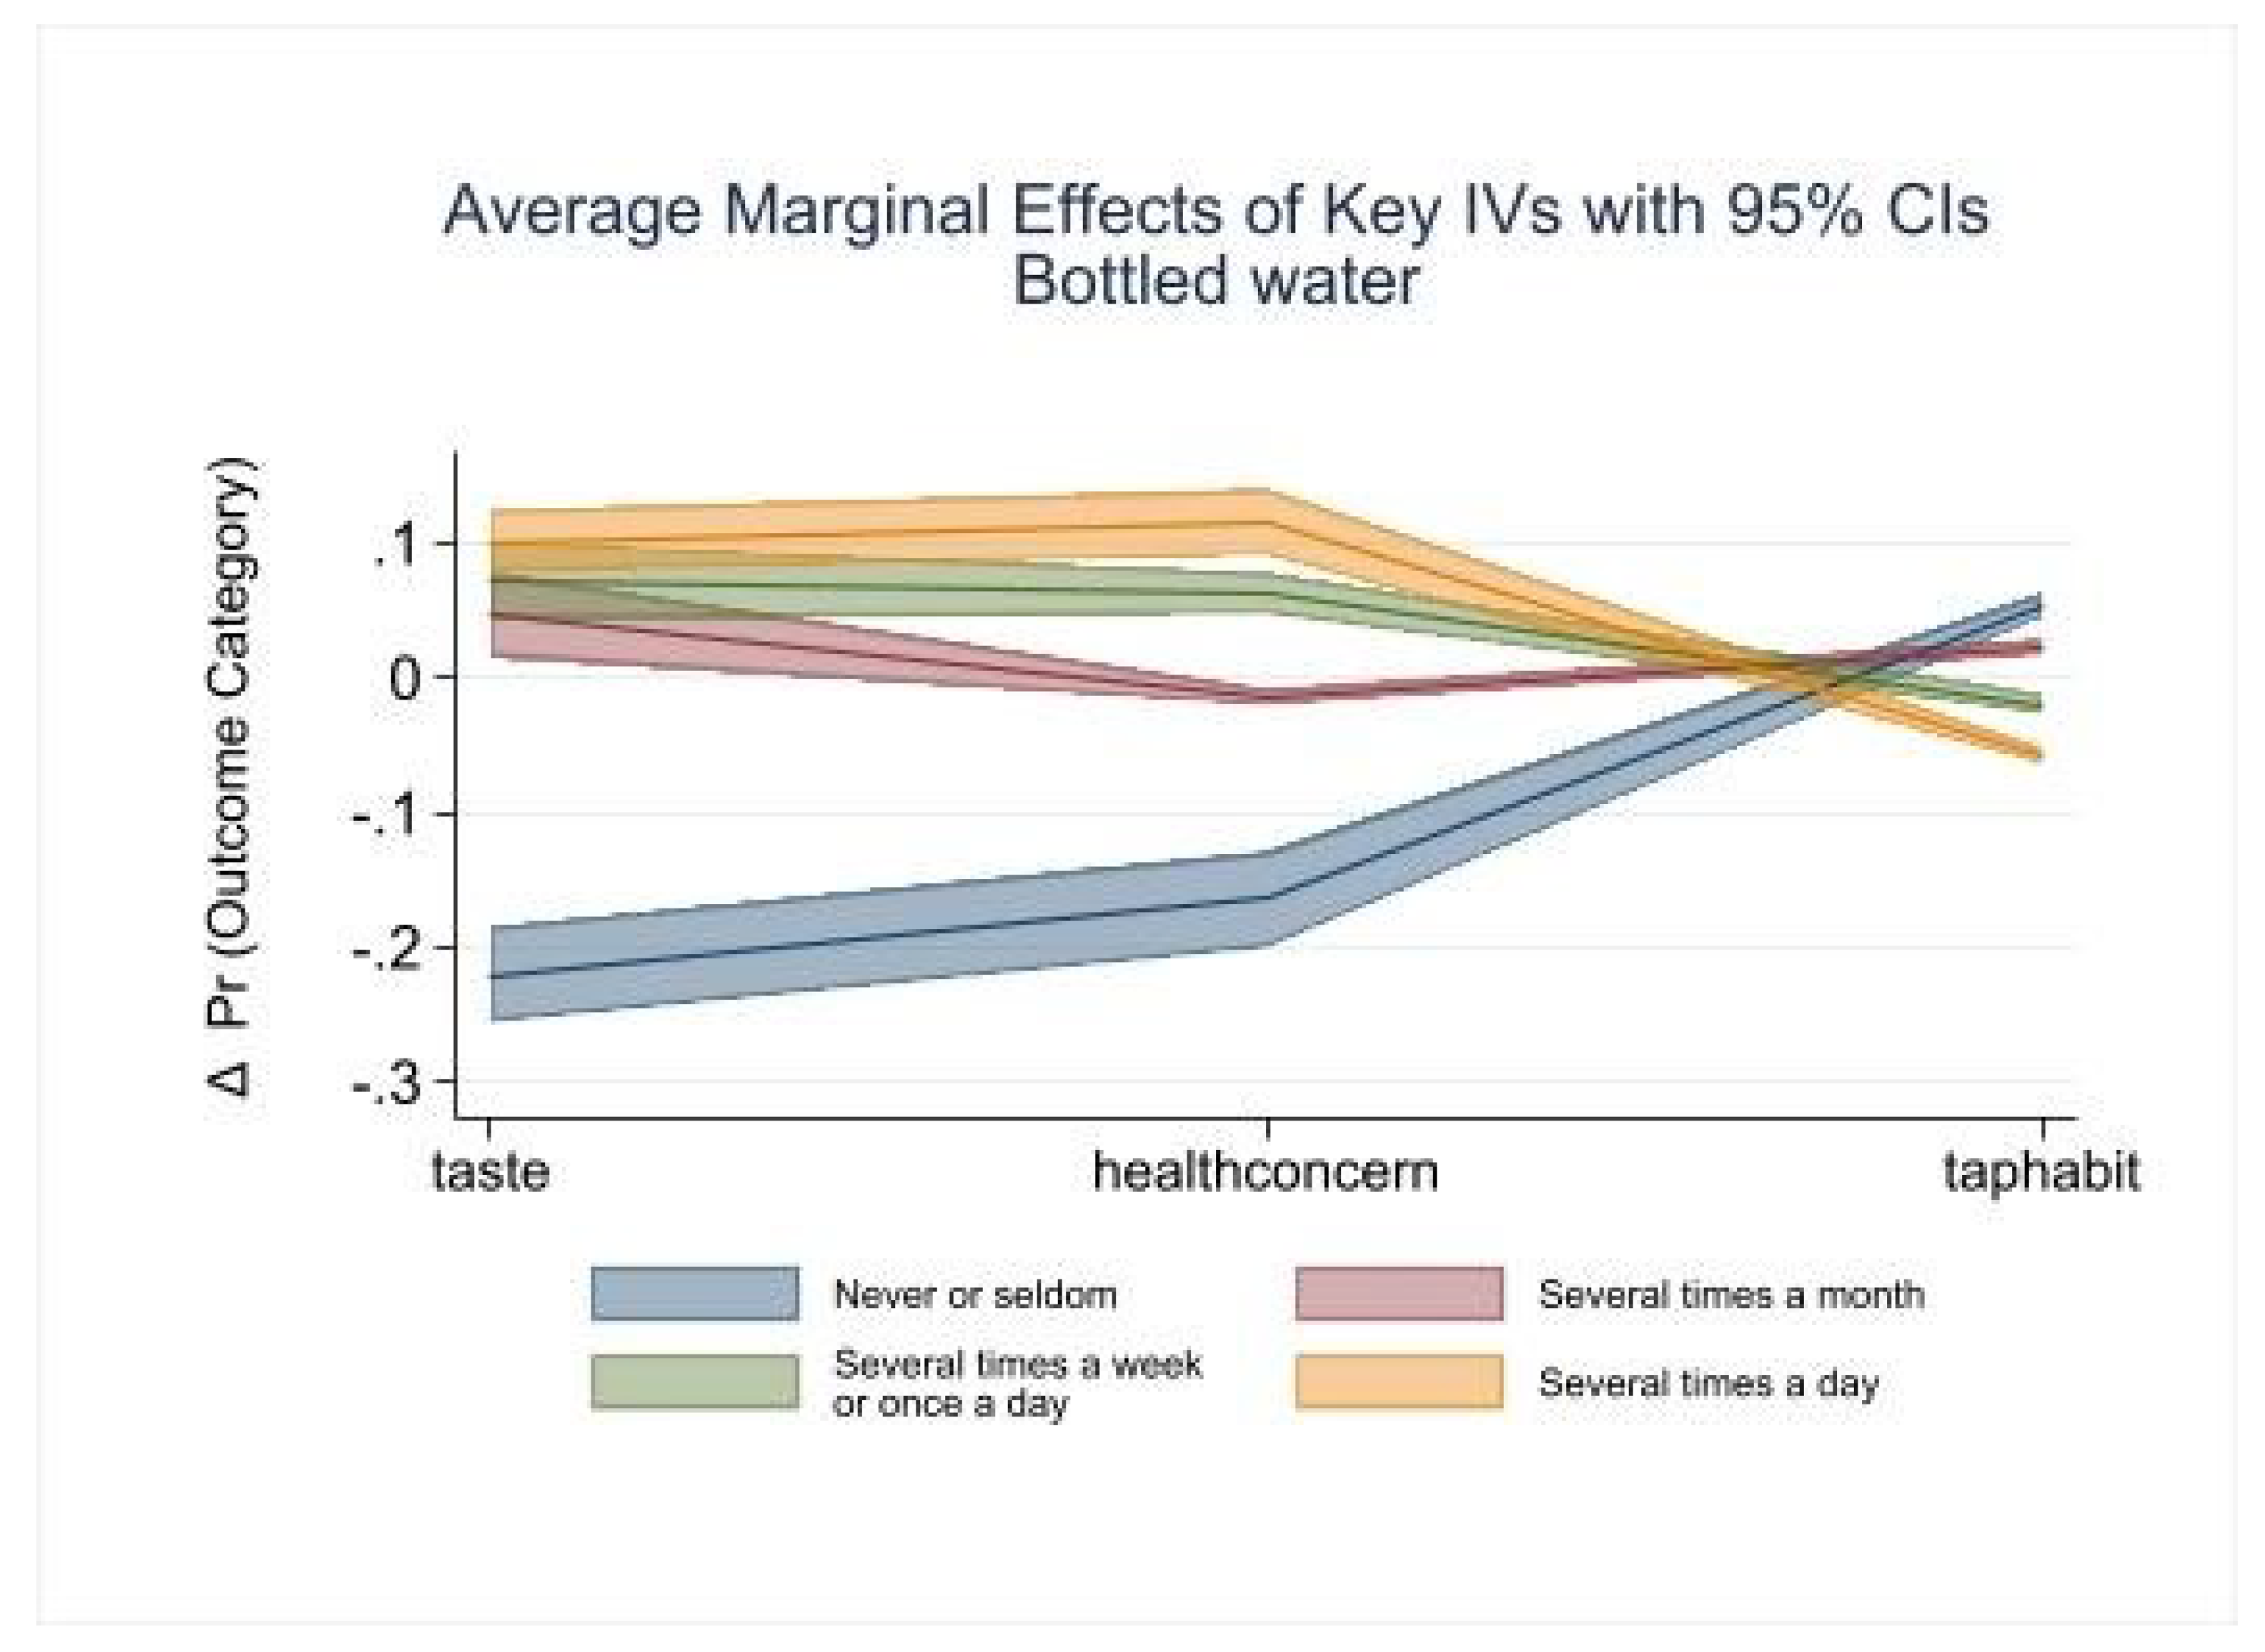
Figure 9.
Average marginal effects of key independent variables on tap water consumption at the 95% confidence level, △Pr denotes a change in the probability (N = 3411).
Figure 9.
Average marginal effects of key independent variables on tap water consumption at the 95% confidence level, △Pr denotes a change in the probability (N = 3411).
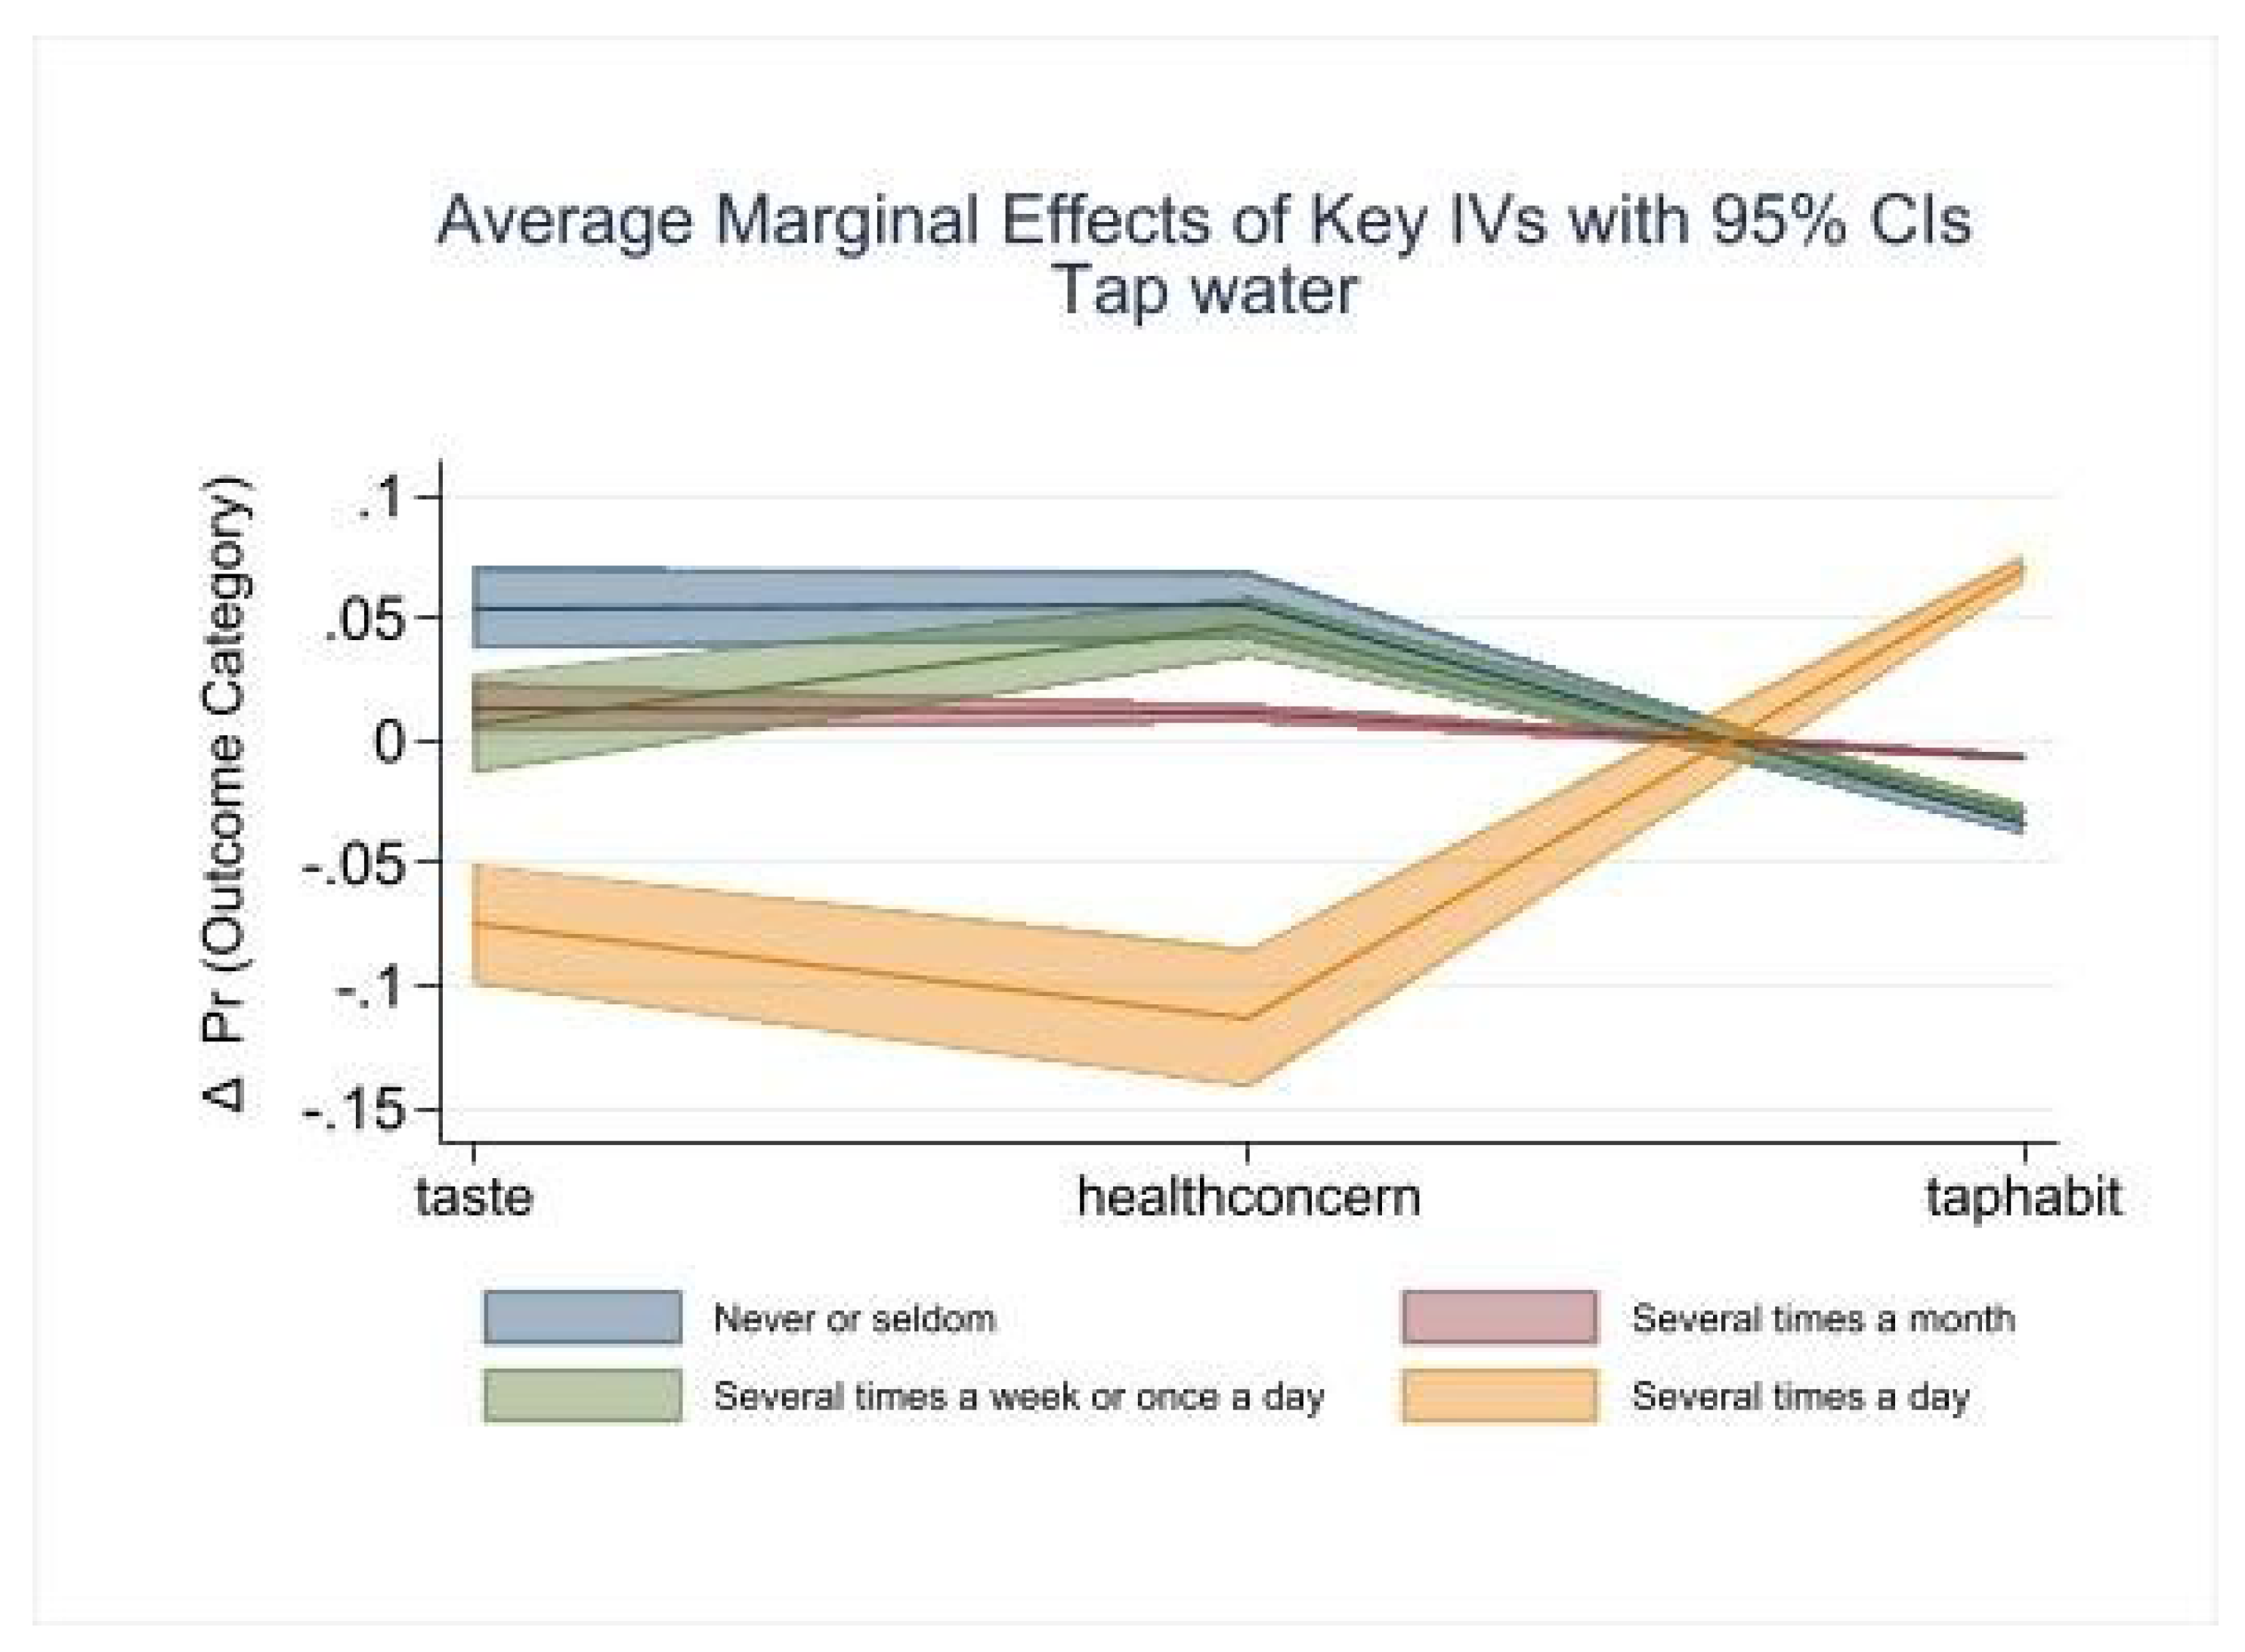
Figure 10.
Average marginal effects of continuous variables on bottled water consumption at the 95% confidence level, △Pr denotes a change in the probability (N = 3411).
Figure 10.
Average marginal effects of continuous variables on bottled water consumption at the 95% confidence level, △Pr denotes a change in the probability (N = 3411).
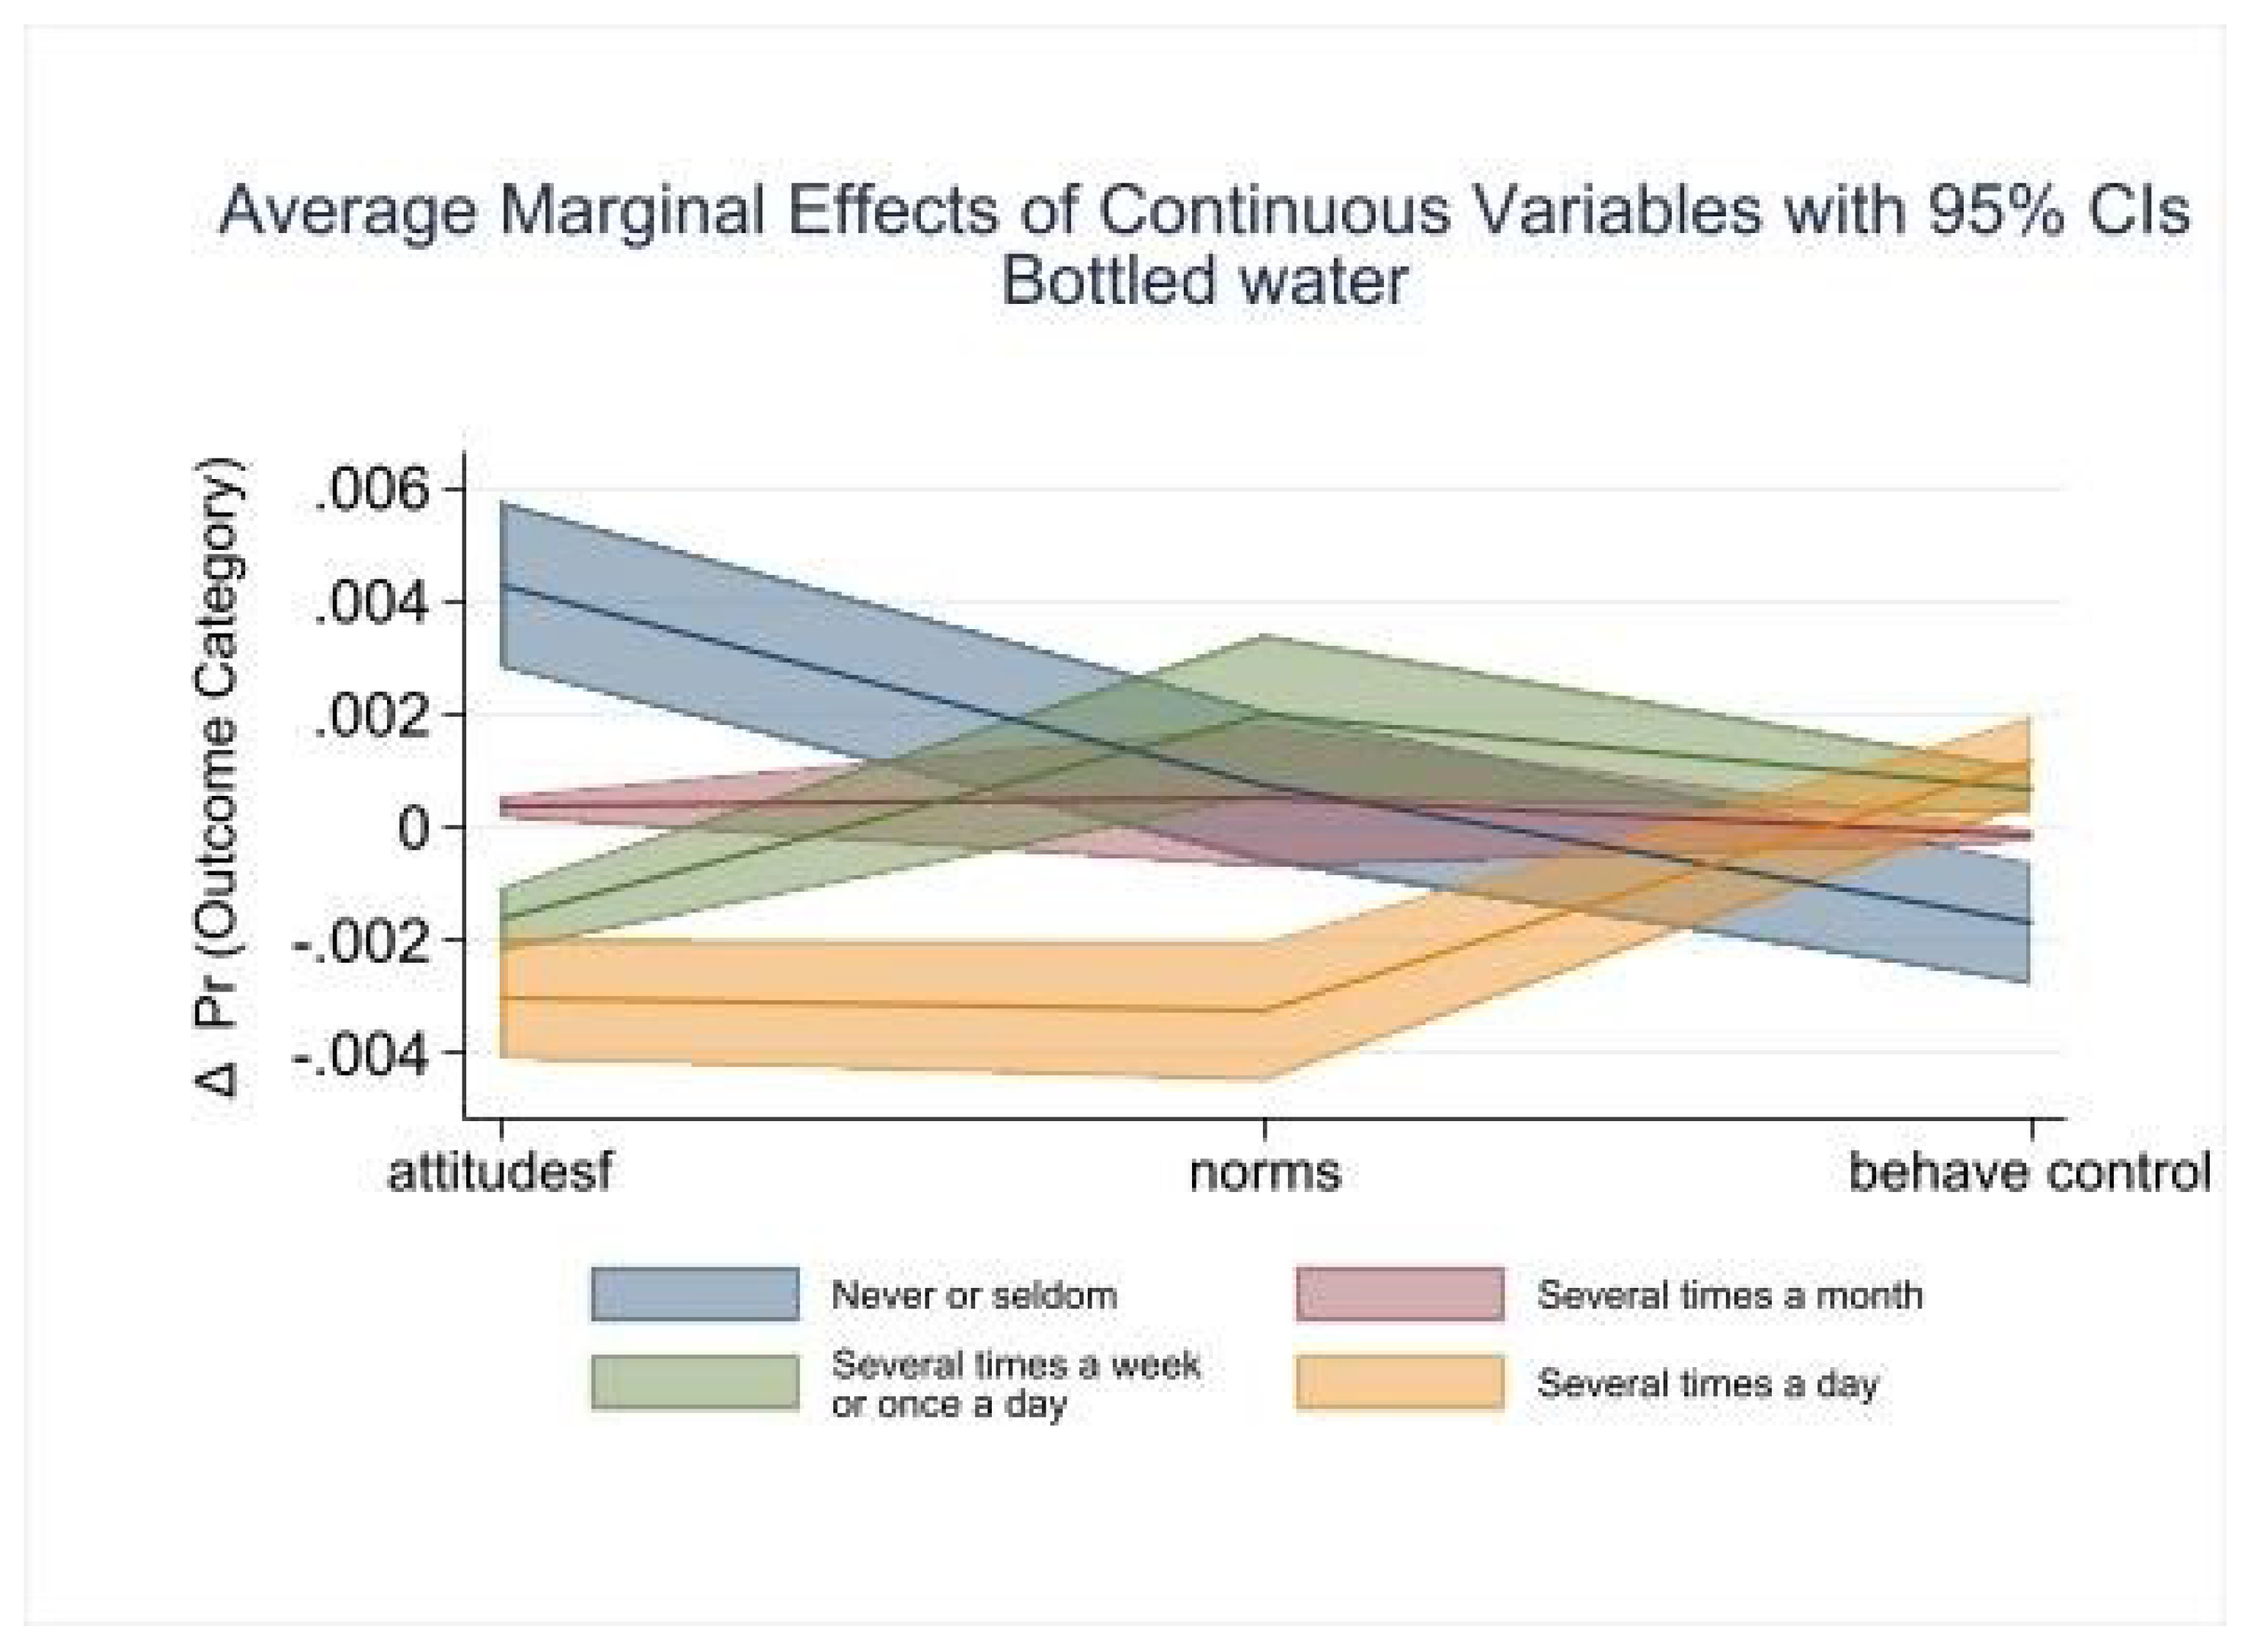
Figure 11.
Average marginal effects of continuous variables on tap water consumption at the 95% confidence level, △Pr denotes a change in the probability (N = 3411).
Figure 11.
Average marginal effects of continuous variables on tap water consumption at the 95% confidence level, △Pr denotes a change in the probability (N = 3411).
Disclaimer/Publisher’s Note: The statements, opinions and data contained in all publications are solely those of the individual author(s) and contributor(s) and not of MDPI and/or the editor(s). MDPI and/or the editor(s) disclaim responsibility for any injury to people or property resulting from any ideas, methods, instructions or products referred to in the content. |
© 2024 by the authors. Licensee MDPI, Basel, Switzerland. This article is an open access article distributed under the terms and conditions of the Creative Commons Attribution (CC BY) license (http://creativecommons.org/licenses/by/4.0/).
Copyright: This open access article is published under a Creative Commons CC BY 4.0 license, which permit the free download, distribution, and reuse, provided that the author and preprint are cited in any reuse.


