
Submitted:
02 July 2024
Posted:
03 July 2024
You are already at the latest version
Abstract
The architectural configuration of the space plays a crucial role in the acoustics of Neonatal Intensive Care Units (NICUs). The design of the environment, the materials used in construction, and the organisation of noise sources within the room significantly influence the noise levels present in these critical areas. For this research, noise levels found in two hospitals, with different architectural configurations and sizes but similar construction materials, have been analyzed. Data were recorded at 1-second intervals over a period of more than 24 hours. The data collected in these hospitals confirm the magnitude of the noise problem in NICUs, highlighting the urgent need to address it effectively to ensure an appropriate and safe environment for the recovery of neonates. Good architectural planning can help mitigate noise, while poor configuration can exacerbate acoustic problems, negatively affecting both patients and healthcare staff. It is crucial to involve architects, acoustic engineers, and healthcare staff in the design and renovation of NICUs to create spaces that not only meet medical needs but also consider the auditory well-being of neonates.
Keywords:
Neonatal Intensive Care Units
; architectural design
; acoustics
; sources of noise.
1. Introduction
The environment of a Neonatal Intensive Care Unit (NICU) is crucial for the recovery of newborn patients. However, noise is a widespread problem that might be slowing down their healing process. While excessive noise is harmful to everyone, it is especially damaging to sick patients in the NICU. This is particularly true for premature babies, whose developing nervous and auditory systems make them very sensitive to loud sounds [1].
Historically, newborns were assumed to be desensitized to their environment and lacked the ability to interact with it in a meaningful way [2]. However, recent research has shown that infants actively respond to their environment, using their sensory experiences as a platform for learning [3]. For example, they respond to touch, can differentiate and show preference for certain stimuli, and are able to protect themselves from the environment by moving away from painful stimuli [4]. This knowledge has led to focusing attention on the management of sensory stimuli within the NICU, as these can have a crucial impact on neonatal development.
Neonates who are premature or have serious medical conditions can stay weeks or even months in the NICU, where noise is always present. Prolonged exposure to high levels of noise can interfere with auditory and emotional development, as well as increase the risk of sleep disorders and stress [5,6,7,8]. Sleep deprivation has a great impact on various physiological parameters, such as bradycardia, apnea, increased hypoxic periods or increased intracranial pressure, which can negatively influence the recovery of patients under care [9,10]. Deep sleep plays an essential role in the maturation of brain functions in newborns, and its interruption can cause alterations in thermoregulation, production and release of certain hormones, in addition to compromising the newborn's immunity [5]. These effects can have significant consequences on long-term development, including cognitive ability and academic performance [11].
In addition to the direct impact on neonates, it is crucial to understand how various noise sources in the NICU affect the overall environment and dynamics of neonatal care.
The noise level in the NICU is a determining factor in staff communication, family interactions, and child development. According to the American Academy of Pediatrics (AAP), exposure to noise levels above 45 dBA can cause cochlear damage and even disrupt the normal growth and development of the neonate [12,13]. Although the human ear may get used to high levels, no longer perceiving them as high, noise may continue generating damage [14].
For this reason, the AAP recommends that neonatal care areas should incorporate sound absorption materials or other measures to ensure that the combination of continuous background noise and transient sounds does not exceed a Leq,1h of 45 dBA, an L10 of 50 dBA and an Lmax of 65 dBA [15].
The noise produced in this type of neonatal ward is mainly composed of alarms from medical equipment, staff conversations and displacements, and medical equipment [16,17]. Apart from this type of sounds, the spectral content in NICUs is dominated by low frequencies [18,19]. However, the specific effects of these low frequencies on newborns remain largely unknown. A recent study indicated that if exposure to low frequencies negatively affects mice, which have a higher threshold for low frequencies than humans (375 Hz for mice versus 20 Hz for humans) [20], humans could also suffer. negative impacts [21]. The study found that mice exposed to 70 dB of low-frequency noise for 4 weeks experienced a permanent imbalance and reduction in calbindin-positive hair cells in the saccule and utricle [21].
In addition to the impact on patient care, constant noise in the NICU also affects the health and well-being of nursing staff. Studies have shown that prolonged exposure to noise can cause hearing fatigue, increase blood pressure and contribute to the development of cardiovascular diseases and psychological disorders such as anxiety and depression, difficulty communicating, work stress, decreased concentration and increased risk from making mistakes, which in turn can negatively affect the quality of care they provide [22]. In the highly specialized environment of the NICU, where each care decision is decisive for the well-being of newborns, this situation creates a negative cycle in which both newborns and nursing staff are affected by the same problem.
The choice between placing a baby in an incubator or a warming crib depends on a careful assessment of their individual medical needs. According to the guidelines of the AAP, incubators are essential for the care of premature neonates as they create an optimal environment for their healthy growth and development, precisely regulating temperature, humidity, and oxygen [23]. On the other hand, thermal cribs, although they offer radiant heat, are more suitable for stable babies since they do not need the same intensive supervision as premature babies [24].
After birth, neonates lose the protective barrier against high-frequency noise, as well as the predictable acoustic environment of the womb. This situation affects premature neonates more profoundly, as their auditory development is still incomplete. The absence of this protection can disrupt the development of their auditory systems and audio-cortical circuits, in addition to altering the natural entrainment of sounds characteristic of the intrauterine environment [25].
Incubators, like the womb, could protect maturing auditory systems from harmful noise levels. Such protection could alleviate concerns about overstimulation in the NICU, as long as the baby remains inside a closed incubator. The walls of these incubators have demonstrated the ability to reduce sounds coming from the neonatal room by up to 10 dBA [5,13]. However, current incubators produce a background noise level inside that exceeds 56 dBA, considerably exceeding the recommendations established by the AAP [26,27]. This level of background noise is generated by the incubator's internal motor, responsible for regulating the temperature and humidity inside. This situation raises additional concern about exposing neonates to potentially harmful noise levels even when inside an incubator.
This 10 dBA attenuation implies that when the noise level in the NICU exceeds the levels emitted by the internal motor of the incubator, the attenuation provided by the walls of the incubator reduces the dose of noise that the neonate receives inside. For the noise level to increase inside the incubator, the ambient noise in the NICU must be at least 3 dBA higher than the motor noise plus motor attenuation [13].
In relation to the existing noise levels inside the incubators, the Acoustic Engineering laboratory of the University of Cádiz has developed a prototype of an incubator with a system to improve the acoustic comfort of the NICA+ neonate. This prototype, presented in the form of patent “OEPM P202330766”, includes a neonatal incubator equipped with a system designed to improve the acoustic comfort of the newborn with sound levels lower than international recommendations [28].
The acoustic environment to which the newborn is exposed is different if it is housed in an incubator or a warming crib. In contrast to neonates found in incubators, it is relevant to highlight that those housed in thermal cribs do not have the same level of noise attenuation. This means that they are more exposed to sounds produced in the neonatal room.
Considering these facts, we can affirm that the incubator or thermal crib, together with the NICU, constitute an interconnected system in which the ambient noise of the room directly affects the neonates housed in the incubators. This relationship highlights the importance of appropriately managing the noise level in the neonatal environment to protect the health and development of newborns, as well as ensure an environment conducive to their recovery.
This does not mean that neonatal rooms should be totally silent, since it should not be forgotten that exposure to sound is necessary for the neonate and provides constant sensory stimulation [29,30]. This early exposure to different sounds in the neonatal environment plays a critical role in language acquisition and the development of language skills [31].
In relation to NICU design, several studies have compared noise levels in units designed with individual rooms for each family versus traditional open units [32,33]. These studies have found that single incubator rooms had significantly lower noise levels compared to open units due to less interference from sounds from other incubators and medical equipment, which not only reduces noise but also improves the perception of care by parents and the well-being of staff. That is, open plan units tend to have higher noise levels due to greater exposure to noise generated by staff and equipment, while small modules help mitigate the acoustic impact [33].
Taking this premise into account, no studies have been found that compare noise levels in two open neonatal rooms with different architectural design and volume. Most studies focus on comparing open-design NICUs with those using single rooms, highlighting the advantages of the latter in terms of noise reduction and better environmental control. However, research specifically comparing open rooms with different architectural configurations and volumes appears to be limited or nonexistent. This lack of studies highlights the need to further investigate how variations in the design and size of open rooms can influence noise levels and ultimately the health and development of neonates.
Regarding the Spanish regulations applicable to these spaces, it is important to consider Law 37/2007 [34], Royal Decree 1367/2007 [35] , and the Technical Building Code CTE DB-HR [36], which establish provisions related to acoustic zoning, quality objectives and acoustic emissions. According to said regulations, noise levels inside hospital bedrooms must be less than 40 dBA in the day and evening period, and 30 dBA in the night period. These limits refer to the values of the immission index resulting from the set of acoustic emitters that affect the interior of the enclosure.
The objective of the present study is to compare the noise levels generated in two neonatal intensive care unit rooms of different volumes and geometries, to evaluate whether there are notable differences between the two rooms. The comparison will be made by evaluating both global noise levels, weighted and unweighted, and levels in third-octave bands. To obtain data, continuous measurements were carried out in both rooms with the incubators running, during day and night periods, paying special attention to feeding times and shift changes.
2. Methodology
To carry out this study, data was collected and analyzed in the Neonatal Intensive Care Units of two leading hospitals in Spain. These centers are the Puerta del Mar University Hospital (HUPM), located in the city of Cádiz, and the Juan Ramón Jiménez University Hospital (HJRJ), located in Huelva. Both institutions are recognized for their commitment to excellence in neonatal care and have advanced medical technologies for the intensive care of newborns. The data obtained covers several key variables, such as ambient noise levels, the layout of medical equipment and the general conditions of the rooms, allowing a comprehensive evaluation of the factors that influence the acoustic environment of the NICU. This comprehensive approach provides a solid foundation for identifying areas of improvement and developing effective strategies to optimize neonatal care.
This research has received approval from the Provincial Research Ethics Committee of Cádiz, under registration number 82.22 and PEIBA code 1253-N-22. It is important to highlight that this study is not classified as a biomedical research project according to the terms established by Spanish Law 14/2007, of July 3, on Biomedical Research [37]. Ethical approval ensures that the research complies with the necessary ethical regulations and guidelines, guaranteeing the protection of participants and the integrity of the data collection process.
2.1. Material and Methods
In order to characterize the NICUs and evaluate the noise level to which neonates could potentially be exposed, a sound level meter was installed in each of the rooms. This device was strategically located between two incubators, at a distance of 1.5 meters from the nearest wall and 1 meter from the ceiling.
To carry out these measurements, the HBK 2270 sound level meter was used, which meets the type 1 instrumentation requirements according to the regulations established by the International Electrotechnical Commission, specifically the EN-IEC 61672:2013 standard. In order to guarantee the precision and accuracy of the sound level meters, the HBK 4231 sound calibrator was used to verify their correct operation.
Measurements were carried out with a sampling interval of 1 second for periods of time exceeding 24 hours. Random days were selected to carry out the measurements, thus ensuring the representativeness of the data obtained. It should be noted that measurements were made on at least two different days to ensure a thorough evaluation of the noise level in the NICUs.
The main parameters collected included continuous equivalent, A- and C-weighted, and broadband unweighted sound pressure levels (LAeq, LCeq, and LZeq). The rest of the parameters are the maximum and minimum levels weighted by response (LAFmax and LAFmin, respectively), the levels weighted by impulse (LAIeq), and the percentiles LA10, LA50 and LA90 (the meaning of the acoustic terms used in this study are shown in Appendix A).
Subsequently, the data obtained were downloaded from the sound level meter and analyzed using the HBK 4231 software (Evaluator), which facilitated a thorough analysis of the collected noise logs.
Noise levels are analyzed from various perspectives. Initially, the equivalent continuous level (Leq) is considered throughout the 24 hours of the day, distinguishing between the levels reached during the daytime period (from 8:00 a.m. to 10:00 p.m.) and the nighttime period (from 10:00 p.m. to 8:00 a.m.). In addition, special attention is paid to key moments in the routine of health personnel, such as shift changes and neonatal feeding schedules, since these moments usually coincide with significant increases in the noise level due to increased activity and noise. increased verbal and operational interactions.
Throughout the day, in both healthcare units, there are three shifts changes for the healthcare staff: at 8:00 a.m., another at 3:00 p.m., and the last one at 10:00 p.m. These changes are critical moments lasting approximately 30 minutes each. Fifteen minutes before the shift change, the relief staff begins to arrive, while the outgoing staff remains in the room until about 15 minutes after the changeover time, ensuring proper care transitions.
Regarding the feeding of the babies, it takes place every three hours, starting at midnight (00:00 a.m.). The process lasts approximately 15 minutes, from the moment the feeding pump is activated until the alarm sounds, indicating that the feeding has been completed.
2.2. Features of he NICUs
The neonatal rooms analyzed in this study exhibit remarkably similar characteristics that significantly influence their acoustic properties. In both cases, the vertical walls are constructed with brick walls rendered with a layer of gypsum paste, with an approximate thickness of 1.5 cm. Similarly, the ceilings are made of plaster plates of the same thickness, suspended from the structure, leaving an air gap without acoustic insulation where the installations are located. The flooring is made of terrazzo, making all these surfaces highly reflective in acoustic terms.
Additionally, both rooms feature various glass surfaces, which further amplifies the reflection of sounds in the surrounding environment. The deliberate absence of materials with acoustic absorption capacity is based on the imperative need to maintain strict standards in terms of safety and hygiene, which prevents the use of porous or irregular surfaces for this purpose.
This structural configuration, characterized by a notable sound reverberation, contributes significantly to the increase in noise levels present in these facilities, giving rise to a challenging acoustic environment for the neonates housed in them.
2.2.1. Puerta del Mar University Hospital (HUPM)
The main room of the NICU of this hospital center has a rectangular distribution, as shown in Figure 1, which covers an area of 156 m2, with a height of 2.66 m, resulting in a total volume of 415 m3. Additionally, this main area is connected to other rooms essential for its operation, such as the entrance hall, medicine and other materials stores, and staff changing rooms. Likewise, independent rooms are included specifically for the isolation of neonates in critical condition or with contagious infections. Considering the inclusion of all these annex spaces, the total surface area of the NICU reaches approximately 230 m2.
Up to 10 neonates housed in incubators can be cared for in the main NICU room, with additional capacity for 3 or 4 more neonates in the adjoining private rooms. Each of these care units is equipped with the necessary monitoring and conditioning devices, as well as the corresponding electromedical equipment, adapted to the individual needs of each neonate, depending on their specific health status.
This research focuses exclusively on the noise levels of the NICU main room, identified in Figure 1 with the number 2.
2.2.2. Juan Ramón Jiménez University Hospital (HJRJ)
The configuration of the NICU in this hospital center has an L-shaped configuration, as illustrated in Figure 2. Its main room covers an area of 65 m2, with an approximate height of 2.7 m, resulting in a total volume of 175 m3. In addition to this main room, the NICU has two related spaces: a warehouse and an independent room intended for the presence of the mother with the baby, in specific cases. Considering all these additional spaces, the total surface area of the NICU is nearly 78 m².
This research focuses exclusively on the noise levels of the NICU main room, identified in Figure 2 with the number 2. This room, with the capacity to care for 8 neonates housed in incubators, is equipped with the necessary monitoring devices, conditioning and electromedical equipment, adapted to the individual needs of each neonate according to their health status.
The graphic documentation of this care unit has been provided by Moisés Fumero Rodríguez and was published as part of his Final Master's Thesis in Acoustic Engineering in 2010 [38].
2.3. Data analysis
A descriptive analysis of the data was carried out to evaluate the noise levels in both NICUs, in different periods and events over 24 hours.
For this study, the following hypotheses were formulated:
- HY1. There are no differences between the sound pressure levels measured during the day period (8:00 a.m.-10:00 p.m., excluding feeding periods and shift changes) in the NICU of the HJRJ and the HUPM.
- HY2. There are no differences between the sound pressure levels measured during the night period (10:00 p.m.-8:00 a.m.), excluding feeding periods and shift changes) in the NICUs of the HJRJ and the HUPM.
- HY3. There are no differences between the sound pressure levels of the daytime feeding periods (10:00 p.m.-8:00 a.m.) in the NICUs of the HJRJ and the HUPM.
- HY4. There are no differences between the sound pressure levels of the nocturnal feeding periods (8:00 a.m. to 10:00 p.m.) in the NICUs of the HJRJ and the HUPM.
- HY5. There are no differences between the sound pressure levels of the shift changes of healthcare personnel (8:00 a.m. to 10:00 p.m.) in the NICUs of the HJRJ and the HUPM.
After carrying out an initial analysis of the data, we proceeded to verify whether there are significant differences in the noise levels in the NICUs of Huelva and Cádiz. To do this, we first evaluate which are the most appropriate statistical tests for the analysis, depending on the nature of the data. Given the sample size, the normal distribution of the data was evaluated using the Shaphiro-Wilk test. Levene's test for homogeneity of variances was calculated to determine whether the distribution of the data between both samples were similar. The variables analyzed were LAeq (dBA), LAIeq (dBA), LAFmáx (dBA), LAFmín (dBA), LCeq (dBC), LA10 (dBA), LA50 (dBA), LA90 (dBA), and the non-weighted frequency range between 40 Hz and 20 kHz (LZeq, in dBA).
According to the results of the previous analyses, it was decided to perform a parametric test, the Mann Whitney U test, which allows determining whether there are significant differences between two independent samples. The main objective was to compare the acoustic behavior of the NICU rooms in Huelva and Cádiz, and verify if we can rigorously speak of differences between them, in order to answer the research questions. The value of 0.05 was used as a threshold to determine the statistical significance of the results of the tests, and, therefore, to decide whether to accept or reject the null hypothesis.
It will be evaluated whether the aforementioned variables present significant differences in the day (8:00 a.m.-10:00 p.m.) and night (10:00 p.m.-8:00 a.m.) periods -- excluding feeding and shift change times -- the night and day feeding periods, and the changes shift, which always occur during the day.
Effect size typically indicates the significance of differences between two groups, with a larger effect size meaning a more substantial difference [39]. It is a valuable metric for assessing the effectiveness of results [40]. In this study, the effect size was determined using Rosenthal's formula for parametric tests [41], by dividing the absolute standardized test statistic z by the square root of the sample size. The interpretation of the results was done using Bartz criterion [42] applied to the r absolute values: 0.00 < r < 0.20, “Very low”, 0.20 ≤ r < 0.40, “Low”, 0.40 ≤ r < 0.60, “Moderate”, 0.60 ≤ r < 0.80, “Strong”, 0.80 ≤ r < 1, “Strong”.
3. Results
To make a detailed comparison with the noise levels recommended by various international entities, such as the AAP, the results will first focus on the equivalent continuous sound level (LAeq) measured over the 24-hour day. These data provide a comprehensive view of noise exposure throughout the day and allow for an integral assessment of the acoustic conditions in the NICUs.
Subsequently, a clear distinction will be made between daytime and nighttime noise levels. This differentiation is essential, as activities and staff presence vary significantly between day and night, affecting noise levels differently. Additionally, attention will be paid to the noise levels during feeding times and staff shift changes. By comparing these levels, a more precise understanding can be obtained of how noise levels vary at different times of the day and how these variations can influence the well-being of the neonates.
Next, the L10 levels will be analyzed, representing the noise level that is exceeded for 10% of the measurement period. This metric is particularly useful for identifying frequent noise peaks that can be disturbing, even if they are not sustained. The analysis of L10 helps to understand the prevalence of high noise levels and their potential impact on the NICU environment.
Finally, the maximum noise level (Lmax) recorded during the measurement period will be examined. The Lmax indicates the highest level of noise exposure and is a critical metric for determining extreme noise peaks that can occur in the clinical environment. The evaluation of Lmax is essential for identifying isolated extreme noise events that could have a significant impact on the health of the neonates.
As a result of the acoustic measurements conducted in the NICUs of HUPM and HJRJ, significant differences in sound pressure levels between the two facilities were observed. On the first day of measurement at HUPM, a continuous equivalent sound level (LAeq) of 60 dBA was recorded over the 24-hour period. On the second day, this value increased considerably to 63.8 dBA. In contrast, at HJRJ, the LAeq for the first day was 60.1 dBA, and for the second day, it was 60.9 dBA. This indicates greater variability in noise levels at HUPM compared to HJRJ.
Several factors may explain this pronounced difference between the two days at HUPM. One possible explanation is the need to incorporate new equipment for the intensive care of some neonates. Often, these devices and machines have motors, which can significantly increase ambient noise levels in the room. Additionally, a substantial increase in communication among healthcare staff to coordinate and manage this new equipment can contribute to elevated noise levels. The need to ensure that instructions and information are clearly understood may lead staff to speak louder, especially in an already noisy environment. This becomes even more critical during emergencies or when specialized and constant attention is required, thereby increasing the volume of conversation and the overall noise level in the unit.
Another contributing factor to these elevated noise levels is the physical structure of the room. Units with vertical walls and ceilings lacking acoustic absorption tend to reflect more sound, thereby increasing the ambient noise level.
Analyzing the nighttime period, from 10:00 p.m. to 8:00 a.m., a slight decrease in noise levels was observed in both neonatal units. At HUPM, the LAeq values were 58.7 dBA and 62.3 dBA on the two measurement days, respectively. At HJRJ, the levels were 58.2 dBA and 58.1 dBA.
This trend of noise reduction during the nighttime period is notable and suggests a decrease in noisy activities and less interaction between healthcare staff and medical equipment at night. However, it is important to highlight the exception observed on the second day of measurement at HUPM, where noise levels increased to 62.3 dBA, contrasting with the general trend of reduction observed.
This nocturnal decrease is crucial for the rest and recovery of neonates, although the values still exceed the levels recommended by international guidelines for intensive care environments. Regarding the feeding periods of neonates, the average noise levels at HUPM on the first day were 60.5 dBA and 64.1 dBA, ranging from 64.3 dBA at 3:00 p.m. due to overlapping with shift changes, to 53.2 dBA at 6:00 a.m. On the second day, levels were 66.2 dBA at 9:00 p.m. and 60 dBA at 6:00 a.m. At HJRJ, values on the first day ranged from 65.7 dBA at 3:00 p.m. to 55.6 dBA at 3:00 a.m., while on the second day they were 66.6 dBA at 3:00 p.m. and 59.4 dBA at 9:00 p.m.
Regarding shift changes of healthcare personnel, noise levels increase significantly. At HUPM, LAeq values during these periods reached 63.8 dBA and 65.9 dBA, whereas at HJRJ they were 64.3 dBA and 63.9 dBA. Specifically, during the 8:00 a.m. shift change, noise levels at HUPM were 62.3 dBA and 65.6 dBA, compared to 64.8 dBA and 66.1 dBA during the 10:00 p.m. shift change, while the 3:00 p.m. shift change presented an intermediate value of 63.9 dBA. At HJRJ, LAeq values during the 8:00 a.m. shift changes were 64.7 dBA and 64.6 dBA, at 3:00 p.m. they were 65.1 dBA on both days, and at 10:00 p.m. they were 62.7 dBA and 60.7 dBA.
The aforementioned data, along with Figure 3 depicting sound pressure levels (SPL) throughout the day in both neonatal intensive care units over the two days of measurement, corroborate a clear trend in noise levels. There is a progressive increase from morning until approximately 3:00 a.m., followed by a decrease towards the afternoon. This pattern suggests diurnal fluctuations in noise levels, possibly influenced by activities and operational changes within the facilities during peak hours and nighttime operations.
As observed in Figure 3, the noise levels recorded in these two units exceed the recommendations established by various international entities such as the American Academy of Pediatrics, the World Health Organization, or the Spanish Pediatric Association.
Regarding the LA10 levels recorded during the measurements, values of 63.6 dBA and 66.6 dBA were obtained at HUPM on the first and second day, respectively. Conversely, at HJRJ, values of 63.8 dBA and 64.7 dBA were recorded on the same days.
Finally, the maximum level (LAmax) recorded at HUPM was 87.3 dBA and 90.3 dBA on the first and second day, respectively, while at HJRJ, values of 89.2 dBA and 88.4 dBA were recorded on the same days.
3.1. Data Analysis
The results of the Saphiro Wilk test show a normal distribution for all the variables analyzed. However, Levene's test shows that there is no equality of variances between all pairs of variables. Therefore, we opted to use a non-parametric test. As the groups of variables are independent, the Mann Whitney U test was applied.
Hypothesis HY1 was formulated to assess whether there were differences in the sound pressure levels measured during the day period in the NICUS of HUPM and HJRJ.
Table 1 shows the results of the Mann Whitney U test during the day period among the NICUs studied, for the values of the variables LAeq (dBA), LAIeq (dBA), LAFmax (dBA), LAFmin (dBA), LCeq (dBC), LA10 (dBA), LA50 (dBA), LA90 (dBA), and the non-weighted range frequency LZ (dB) between 40 Hz and 20 kHz. There are significant differences between LAeq and LAIeq, LAFmin, LCeq, LA10, LA50, LA90, and the unweighted ranges between from 40Hz until 100 Hz, between 250 Hz and 2 kHz, and at 4 kHz. The mean ranks show that all A-weighted sound pressure levels, as well as the frequency ranges between 250 Hz and 2 kHz, and at 4 kHz are greater in the Cádiz NICU than in Huelva. In the C-weighted values, as well as in the low frequencies, it is the Huelva NICU that generates the most noise. This is explained by how the weightings are carried out. C-weighting barely corrects low-frequency values, so it is normal that if differences in sound pressure levels occur at low frequencies, this difference is also reflected in the LCeq. In this type of room, the engines of the healthcare equipment are usually the elements that generate more noise at low frequencies. Since most of the engine noise comes from the incubators, this indicates that the incubators in Huelva are noisier than those in Cádiz. Furthermore, the size effect is very strong, so this significant difference between rooms is not due to chance.
A-weighting, however, attempts to fit a hypothetical auditory human response, not heavily penalizing low frequencies, neither high or very high frequencies, in which human noise is less sensitive. In the NICUs, the perceived frequencies are usually associated with noises produced by telephones, monitoring system alarms, healthcare staff (both operational noises and conversations), or by visitors. In this case, it is just the opposite, it is the NICU in Cádiz that is noisier than that in Huelva. While for the sound pressure levels exceeded 10% (LA10), or 50% (LA50) of the time the size of the effect is low or moderate, for background noise, which is usually measured with the L90 [43,44], the effect size is very strong, which indicates that the differences in background noise cannot between both NICUS, cannot be due to chance. Alarms from medical equipment were especially important owing to their persistence in time, and redundancy. They also imply that the healthcare staff carries out activities after hearing the alarms of the monitoring equipment. According to several studies [16,45], the alarms' noise has a stronger impact on NICU perceived noise levels due to their high-frequency components. Since A-weighting is related to how humans perceive sounds, and alarm noises sound quite frequently, they may correspond primarily to the percentile LA50, or even to LA90. Since the NICU of HUPM has more incubators (10) than that of HJRJ (8), and consequently, more monitoring systems, it was expected that the sound pressure levels were also higher. The volume also influences the reverberation time of the rooms, that is, the persistence of sound in the room. Without the materials of the room being similar, the higher volume of the NICU of the HUPM can be contributing to these differences between rooms.
Hypothesis HY2 deals with assessing whether there were differences in the sound pressure levels measured during the night period in the NICUs of HUPM and HJRJ.
Table 2 shows the results of the Mann Whitney U test during the day period among the NICUs studied. For the sake of simplicity, only the variables that show statistical significant differences between both NICUs were shown. There are significant differences between LAeq, LAFmin, LCeq, LA50, LA90, and the unweighted ranges between from 40Hz to 315 Hz, and between 800 Hz and 1600 kHz. Just like the earlier hypothesis, the mean ranks show that all A-weighted values are higher in the HUPM than in HJRJ. In C-weighted values, as well as in low frequencies up to 125Hz, it is the HJRJ NICU that generates the higher sound pressure levels. Given that during the night the overall noise levels should be lower than during the day for the rest of the newborns, we assume that conversations will be in a low voice. Recuero [46] placed the spectral ranges of the human voice between approximately 100 Hz and 4000 Hz. Edgan [47], however, situated them approximately between 160 Hz and 5000 Hz. Therefore, the more spread range of existing difference at lower frequencies can be because during the day, voices of the NICU of Cadiz may be masking some low frequencies of healthcare sanitary equipment, to make both NICUs not so different at 125 Hz (but still different at lower frequencies and at C-weighted noise levels). However, during day and night periods, there are statistically significant differences above 250 Hz between both NICUs, being the one of Cadiz noisier. The reasons why there may be a difference between rooms above 250 Hz, as well as in the A-weighted variables, are equally attributed to the same noise sources than during the day period: phones, voices and operational noise from the staff, and alarms from monitoring healthcare systems.
Hypothesis HY3 was formulated to assess whether there were differences in the sound pressure levels measured during the day feeding period in the NICUs of HUPM and HJRJ.
Table 3 shows the results of the Mann Whitney U test for the feeding periods during the day between Cádiz and Huelva. Here the background noise and the LAFmin weighting (dBA) appear as the A-weighted levels with the greatest differences, with the Cádiz NICU again being the one with the highest levels.
Similar to the hypothesis HY1, in the daytime feeding period, there are statistical significant differences in the global C weighting and in the low frequency range; again, the HJRJ NICU is the noisiest. During feeding periods, the infusion pumps are turned on. These pumps either do not affect the low frequencies, or they do increase the differences generated by the engine noise of the incubators in such a way that the levels continue being higher in the NICU of the HJRJ. Sound pressure levels of the alarms of different incubator brandts were measured. In the study by Hernández-Molina et al. [16]. In this study, the highest sound pressure level was in the octave band of 1000 Hz, which includes the one-third octave band of 800 Hz; therefore, the statistically significant difference found in our study at 800 Hz may be due to the noise levels produced by alarms in both NICUs, as monitoring system equipment emits intermittent sounds after the feeding pump stops. These sounds seem to be louder in the HUPM NICU.
Hypothesis HY4 was formulated to assess whether there were differences in the sound pressure levels measured during the night feeding period in the NICUs of HUPM and HJRJ.
Table 4 shows the results of the Mann Whitney U test for the overnight feeding periods. Here the background noise and the LAFmin weighting (dBA) appear again as the weighted levels with the greatest differences, with the Cádiz NICU again being the one with the highest levels.
On the other hand, in the comparison of night feeding periods, the same trend occurs in terms of overall C weighting and unweighted low frequencies as in the comparison of night periods. The range of frequencies in which there are statistically significant differences increases up to 125 Hertz compared to the day period, possibly because there is no longer possible masking of the voice in these frequencies.
Hypothesis HY5 was formulated to understand whether there were differences in the sound pressure levels measured during the staff shift changes in the NICUs of HUPM and HJRJ.
Table 5 shows the results of the Mann Whitney U test for the periods of staff shift changes during the day. The same trends appear as in other daily periods evaluated with respect to LCeq and low frequencies up to 100 Hz, accentuating the idea that they are due to differences in the noise levels produced by the incubator engine.
4. Discussion
Neonatal Intensive Care Units are environments that require strict control of sound and acoustic conditions due to the sensitivity of neonates. Within this context, reverberation time (RT) significantly influences how sound behaves within the room, affecting speech clarity and the perception of ambient sounds [48]. A moderate RT is desirable to maintain a suitable acoustic environment for medical care and the development of premature or sick infants.
Due to the sensitivity of these types of rooms, reverberation time (RT) has not been measured in any of the NICUs under study [49,50,51]. RT is a crucial parameter in assessing noise levels within any environment, significantly influenced by the volume of the space, as well as other factors such as geometry and construction materials [48].
Considering Sabine's general formulation of reverberation time, where volume plays a predominant role [52], and assuming both neonatal environments employ similar construction materials, it is anticipated that the NICU at HUPM will exhibit a longer reverberation time compared to the other healthcare unit. This is because this NICU, with its larger volume, provides more space for sound propagation and reflection, thus impacting the persistence and level of reverberation in the acoustic environment [48].
It is noteworthy that the NICU at HJRJ is distinguished by its L-shaped configuration, a feature introducing angles and corners that can impact sound dispersion and absorption differently compared to a more regular room design. This complex arrangement may influence internal acoustic behavior, potentially affecting the measured reverberation time in this specific environment.
Whereas,
V represents the volume of the analyzed room, in m³.
A denotes the equivalent acoustic absorption area, in m².
Performing an approximate calculation of the reverberation time in both rooms, considering their volumes, the absorption coefficients of the materials, and the surfaces they occupy, a reverberation time (TR) of 2.65 seconds has been obtained in HUPM, while in HJRJ it is 2.50 seconds. These reverberation times are estimated, although based on experience and existing literature, it can be said that the reverberation time in these spaces is quite high [53]. Despite the significant difference in volume, the TR values are very similar, indicating comparatively equivalent acoustic behavior in terms of reflection and absorption. Furniture has not been taken into account as it is sparse and has a low absorption level, and there are also no curtains that could help absorb sound.
Currently, there is no specific regulation limiting the reverberation time in these types of spaces. The CTE DB-HR only limits the RT for classrooms, conference rooms, dining areas, and restaurants, which should be 0.7 seconds for classrooms and conference rooms larger than 350 m³ when empty, and 0.9 seconds for restaurants and dining areas when empty [36].
The reverberation time (TR) in the room where the incubator is located can have a considerable impact, especially due to the limited acoustic isolation of the incubator dome [49,50,51]. This emphasizes the need to implement effective acoustic conditioning measures to minimize any adverse effects on neonates. An environment with controlled TR can significantly contribute to improving auditory conditions within the neonatal unit, thereby promoting the development and well-being of premature or ill infants.
Unlike light, which does not penetrate the maternal uterus, noise plays a crucial role in fetal development. Contrasting the data obtained with levels reported in other research, it can be concluded that the levels recorded in the NICUs are consistent with multiple previous studies, significantly exceeding the levels recommended by international organizations such as the APA and WHO for sensitive environments like neonatal units [43,54,55,56].
Based on the results obtained in both rooms, it is evident that the typical sound environment in these spaces is considerably noisy. However, the occasional introduction of new equipment necessary for the survival of neonates can increase noise levels by more than 3 dBA, as observed on the second day of measurements in the HUPM NICU. It should be noted that a 3 dBA increase in sound pressure levels represents a noticeable increase in sound intensity. In practical terms, this increase is perceived as approximately doubling the sound intensity compared to a reference level.
In critical contexts such as NICUs, where a controlled acoustic environment is required, a 3 dBA increase could have negative impacts on the rest and development of premature or sick neonates, exacerbating the effects of noise on their health and well-being [53].
The noise levels observed in NICUs are often equated to being near moderate traffic or even to the noise generated by a running vacuum cleaner. Specific studies on NICU patients have identified noise as the primary cause of sleep disruptions, highlighting the critical importance of addressing this issue to improve the neonatal care environment [5].
In the statistical analysis conducted, the main differences observed focus on LA90, which primarily reflects the background noise in the rooms, LAeq, LCeq, as well as the unweighted ranges LZ between 40Hz and 125Hz. Discrepancies in LA90 and LAeq variables may be explained by the occasional introduction of equipment that is not commonly used but is vital at specific times for the care of neonates in these environments.
On the other hand, as mentioned earlier, C-weighting only corrects low-frequency values, so any differences in sound pressure levels at these low frequencies are also expected to be reflected in LCeq. It is important to note that most of the noise comes from the incubators, suggesting that the incubators in HJRJ are noisier compared to those in HUPM.
Based on studies suggesting that individual or shared rooms housing two incubators tend to have lower noise levels compared to open ward setups, one might initially assume that the NICU at HJRJ, with its L-shaped layout theoretically reducing reverberation time compared to unobstructed rectangular rooms, would have lower noise levels. However, this is not observed in practice, as noise levels are very similar compared to those at HUPM.
This similarity could be attributed to the fact that, relative to the total volume, the NICU at HJRJ, with a surface area of 65 m², accommodates a higher number of incubators (8), while HUPM, with 156 m² of surface area, has 10 incubators. This higher concentration of incubators in a smaller space at HJRJ could be contributing to comparable or even higher noise levels, despite the theoretically advantageous L-shaped layout that might favor lower reverberation.
This phenomenon highlights the complexity in managing noise in environments like NICUs, where factors such as spatial distribution and equipment quantity can significantly influence perceived noise levels and the overall acoustic environment.
Several studies have explored various strategies to address noise issues in NICUs. One approach has been the retraining of healthcare staff working in these units, as a significant portion of the noise in these environments originates from this source [16]. Initially, this has shown a reduction in noise levels. However, over time, staff tend to readjust to previous noise levels, resulting in a return to the usual routine of elevated noise levels [5].
On the other hand, the architectural configuration of the space plays a crucial role in noise management. Careful space design, appropriate material selection, and organization of sound stimuli are fundamental aspects in controlling the acoustic environment in NICUs. Certain research efforts have focused on improving the materials used in NICU rooms, yielding promising results in reducing ambient noise. Despite these advancements, current noise levels still do not meet the recommendations established by the AAP [53].
5. Conclusions
The appropriate design of the acoustic environment in neonatal care units is essential to mitigate the adverse effects of noise on the development and well-being of premature infants. It has been demonstrated that in noisy environments, these infants are more likely to experience physical instability, poorer sleep quality, slower growth, and potential long-term health issues. Therefore, creating spaces that minimize noise through the use of sound-absorbing materials on ceilings and walls, and implementing strategies such as private rooms, are crucial.
In addition to architectural design, the actions of healthcare staff play a fundamental role in noise reduction. Simple interventions such as establishing calm periods, controlling alarm volume, and educating staff about the detrimental effects of noise can significantly improve the environment of NICUs. Awareness of the impact of noise and the adoption of practices that promote a quieter environment are necessary measures to optimize the neurological and physical development of neonates.
It is also crucial to review and properly adjust alarm parameters to reduce the frequency of false alarms, which can unnecessarily disturb infants and contribute to overall noise levels. This comprehensive approach, combining favorable architectural design and conscientious care practices, can provide a conducive environment for premature neonates to thrive during their stay in the NICU, thereby maximizing their chances of optimal health and development in the long term.
Reflecting on the regulations applied in neonatal care units [34,35,36], adhering to these limits presents a significant challenge when addressing operational noise generated within the rooms themselves. This internal noise often severely constrains the ability to meet specific recommendations issued by organizations such as the AAP.
This issue underscores the complexity of maintaining a quiet and conducive environment for the development of premature neonates. While external parameters may comply with regulations, internal noise stemming from medical equipment, staff conversations, and other activities within the NICU can exceed recommended limits, negatively impacting the most vulnerable patients.
Therefore, it is crucial to consider additional strategies to mitigate internal noise, ranging from technical adjustments in medical devices to behavioral protocols for staff. These measures can significantly contribute to creating a quieter and safer environment for neonates, thereby optimizing their developmental and well-being conditions during their stay in the NICU.
Author Contributions
The conceptualization of the article was undertaken by Rodríguez-Montaño, V.M., who also handled the methodology. Data analysis and writing were carried out by Rodríguez-Montaño, V.M. and Puyana Romero, V., under the supervision of Hernández-Molina, R. and Beira Jiménez, J.L. Data recording was conducted by Rodríguez-Montaño, V.M., Hernández-Molina, R. and Beira Jiménez, J.L. All authors have read and agreed to the published version of the manuscript.
Funding
This research received no external funding.
Data Availability Statement
The original contributions presented in the study are included in the article. Further inquiries can be directed to the corresponding authors.
Acknowledgments
The authors wish to express their gratitude to the Puerta del Mar University Hospital (Cádiz, Spain) and the Juan Ramón Jiménez University Hospital (Huelva, Spain) for their collaboration in allowing the necessary measurements to be carried out for this article.
Conflicts of Interest
The authors declare no conflicts of interest.
Appendix A
Acoustic acronyms used in the study:
- LAeq: A-weighted equivalent continuous sound level.
- LCeq: C-weighted equivalent continuous sound level, LCeq.
- LAIeq; A-weighted Impulsive equivalent continuous sound level.
- LZeq: Linear equivalent continuous sound level.
- LAFmin: Minimum A-weighted equivalent continuous sound level, measured in an integration period of 0.125 ms (fast).
- LAFmin: Maximum A-weighted equivalent continuous sound level, measured in an integration period of 0.125 ms (fast).
- LA10: A-weighted sound pressure level exceeded for 10% of the time.
- LA50: A-weighted sound pressure level exceeded for 50% of the time.
- LA90: A-weighted sound pressure level exceeded for 90% of the time.
References
- Graven, S.N.; Browne, J.V. Auditory Development in the Fetus and Infant. Newborn Infant Nurs. Rev., 2008, 8 (4), pp. 187-193. [CrossRef]
- Duffy, N.; Hickey, L.; Treyvaud, K.; Delany, C. The lived experiences of critically ill infants hospitalised in neonatal intensive care: A scoping review. Early Human Development, 2020, 151. [CrossRef]
- Philpott-Robinson, K.; Lane, S. J.; Korostenski, L.; Lane, A. E. The impact of the Neonatal Intensive Care Unit on sensory and developmental outcomes in infants born preterm: A scoping review. British Journal of Occupational Therapy, 2017, 80 (8), pp. 459-469. [CrossRef]
- Sehgal, A.; Stack, J. Developmentally Supportive Care and NIDCAP. Indian J. Pediatr., 2006, 73 (11), pp. 1007-1010. [CrossRef]
- Beira Jiménez, J.L. Afección acústica de pacientes en incubadoras. Caso de estudio: Neonatos prematuros en el Hospital Universitario Puerta del Mar de Cádiz. PhD Thesis. Universidad de Cádiz, 2021.
- Gabor, J.; Cooper, A; Hanly, P. Sleep disruption in the intensive care unit. Curr. Opin. Crit. Care, 2001, 7 (1), pp. 21-27. [CrossRef]
- Reinke, L. et al. The importance of the intensive care unit environment in sleep—A study with healthy participants. J. Sleep Res., 2020, 29 (2). [CrossRef]
- Aaron, J.N.; Carlisle, C.C.; Carskadon, M.A.; Meyer, J.; Hill, N.S.; Millman R. P. Environmental noise as a cause of sleep disruption in an intermediate respiratory care unit. Sleep, 1996, 19 (9), pp. 707-710. [CrossRef]
- Rodríguez-Montaño, V. Análisis del acondicionamiento acústico del habitáculo de una incubadora neonatal: Propuestas de mejora. Master’s Thesis. Universidad de Cádiz, 2018.
- Muñoz Illescas, M.L.; Sevilla Salgado, S.; Pérez Lafuente, E. Tecnología y mínima manipulación en prematuros. Enfermería Integr., 2017, 116, pp. 41-45.
- Guerra Rodríguez, A.E. Alteraciones del sueño en los pacientes pediátricos hospitalizado. PhD Thesis. Universidad Autónoma de Nuevo León, 2023.
- Rodríguez-Montaño, V.; Beira-Jiménez, J.L.; Fernández-Zacarías, F.; Cueto-Ancela, J.L.; Puyana-Romero, V.; Hernández-Molina, R. The frequency spectrum of the acoustic environment in a Neonatal Intensive Care Unit. J. King Saud Univ. - Sci., 2023, 35 (4). [CrossRef]
- American Academy of Pediatrics. Noise: A hazard for the fetus and newborn. Pediatrics, 1997, 100 (4), pp. 724-727. [CrossRef]
- Sánchez Gómez, S. Effects of acoustic pollution on health. Rev. Salud Ambient., 2007, 7 (2), pp. 175-180. http://ojs.diffundit.com/index.php/rsa/article/view/261.
- White, R.D. Recommended standards for newborn ICU design. J Perinatol, 2007, 27, pp. S4-S19. [CrossRef]
- Hernández-Molina, R. et al. Characterizing the acoustic environment in a Neonatal Intensive Care Unit. Appl. Acoust., 2020, 165, 107301. [CrossRef]
- Hernández-Molina, R. et al. Análisis del ambiente sonoro en una unidad de cuidados intensivos de neonatología. In TecniAcustica 2018; Cádiz, 2018.
- Santos, J.; Carvalhais, C.; Xavier, A.; Silva, M. Assessment and characterization of sound pressure levels in portuguese Neonatal Intensive Care Units. Archives of Environmental & Occupational Health, 2017, 73 (2), pp. 121-127. [CrossRef]
- Gray, L.; Philbin, M. K. Measuring Sound in Hospital Nurseries. Journal of Perinatology, 2001, 20, pp. S100-S104. [CrossRef]
- Jones, G. P.; Lukashkina, V. A.; Russell, I. J.; Lukashkin, A. N. The vestibular system mediates sensation of low-frequency sounds in mice. J. Assoc. Res. Otolaryngol., 2010, 11, pp. 725–732. [CrossRef]
- Ohgami, N. et al. Risk assessment of neonatal exposure to low frequency noise based on balance in mice. Front. Behav. Neurosci., 2017, 11 . [CrossRef]
- Almadhoob, A.; Ohlsson, A. Sound reduction management in the neonatal intensive care unit for preterm or very low birth weight infants (Review). Cochrane Database Syst. Rev., 2020 (1), CD010333. [CrossRef]
- American Academy of Pediatrics. Guidelines for Perinatal Care, 8th ed., 2017.
- Quiroga, A. et al. Guía de práctica clínica de termorregulación en el recién nacido. Soc. Iberoam. Neonatol., 2010.
- Lahav, A.; Skoe, E. An acoustic gap between the NICU and womb: A potential risk for compromised neuroplasticity of the auditory system in preterm infants. Front. Neurosci., 2014, 8. [CrossRef]
- Fernández Zacarías, F.; Beira Jiménez, J.L.; Bustillo Velázquez-Gaztelu, P.J.; Hernández Molina, R.; Lubián López, S. Noise level in neonatal incubators: A comparative study of three models. Int J Pediatr. Otorhinolaryngol, 2018, 107, pp. 150-154. [CrossRef]
- Rodríguez-Montaño, V.; Beira-Jiménez, J.L.; Puyana-Romero, V.; Cueto-Ancela, J.L.; Hernández-Molina, R.; Fernández-Zacarías, F. Acoustic conditioning of the neonatal incubator compartment: Improvement proposal. Front. Pediatr., 2022, 10. [CrossRef]
- Hernández-Molina, R. et al. Silent Neonatal Incubators, Prototype NICA+. Res. Sq., 2024. [CrossRef]
- Webb, A.R.; Heller, H.T.; Benson, C.B.; Lahav, A. Mother’s voice and heartbeat sounds elicit auditory plasticity in the human brain before full gestation. Proc. Natl. Acad. Sci. U. S. A., 2015, 112 (10), pp. 3152-3157. [CrossRef]
- Caskey, M.; Stephens, B.; Tucker, R; Vohr, B. Importance of Parent Talk on the Development of Preterm Infant Vocalizations. Pediatrics, 2011, 128 (5), pp. 910-916. [CrossRef]
- Balsan, M.J. et al. A pilot study to assess the safety, efficacy and ease of use of a novel hearing protection device for hospitalized neonates. Early Hum. Dev., 2021, 156, 105365. [CrossRef]
- Pineda, R.; Stransky, K.; Rogers, C. et al. The single-patient room in the NICU: Maternal and family effects. J Perinatol, 2012, 32, pp. 545–551. [CrossRef]
- Smith ,S.W.; Ortmann, A.J.; Clark, W.W. Noise in the neontal intensive care unit: A new approach to examining acoustic events. Noise Health, 2018, 20 (95), pp. 121-130. [CrossRef]
- Ley 37/2003, de 17 de noviembre, del Ruido. Boletín Of. del Estado, 2003.
- Real Decreto 1367/2007, de 19 de octubre, por el que se desarrolla la Ley 37/2003, de 17 de noviembre, del Ruido, en lo referente a zonificación acústica, objetivos de calidad y emisiones acústicas. Boletín Of. del Estado, 2007.
- Código Técnico de la Edificación (CTE) Documento Básico de Protección frente al Ruido (DB-HR). Ministerio de Transportes, Movilidad y Agenda Urbana, 2019.
- Ley 14/2007, de 3 de julio, de Investigación biomédica. Boletín Of. del Estado, 2007.
- Fumero Rodríguez, M. Estudio de afección acústica a neonatos en la UCI Pediátrica del Hospital General Juan Ramón Jiménez de Huelva. Master’s Thesis. Universidad de Cádiz, 2010.
- Sullivan, G.; Feinn, R. Using Effect Size—Or Why the P Value Is Not Enough. J. Grad. Med. Educ., 2012, 4 (3), pp. 279–282. [CrossRef]
- Coe, R. It’s the effect size, stupid: What effect size is and why it is important. In Conference of the British Educational Research Association; Exeter (England), 2002.
- Rosenthal, R. Parametric measures of effect size. In The handbook of research synthesis; Russell Sage Foundation: New York, NY, US, 1994; pp 231–244.
- Bartz, A. E. Basic Statistical Concepts, 4th ed.; Upper addle River NJ: Merrill, Ed.; 1999.
- Fortes-Garrido, J. C.; Velez-Pereira, A. M.; Gázquez, M.; Hidalgo-Hidalgo, M.; Bolívar, J. P. The characterization of noise levels in a Neonatal Intensive Care Unit and the implications for noise management. J. Environ. Heal. Sci. Eng., 2014, 12 (104), pp. 1–8. [CrossRef]
- Bergmans, D. H. T.; Veerbeek, H. W.; Jabben, J.; Schreurs, E. A Method to Calculate Ambient Aircraft Background Noise. 8th Eur. Conf. Noise Control 2009, EURONOISE 2009 - Proc. Inst. Acoust. 2009, 31 (PART 3), 26–28.
- Lichtig, I.; Maki, K. Estudo de níveis de ruídos ambientais e de ruídos gerados em incubadoras em uma unidade de terapia intensiva neonata. Pediatria, 1992, 14 (1), pp. 30–34.
- Recuero, M. Contaminación Acústica.; Madrid, Spain, 2002.
- Egan, M. D. Architectural Acoustics; McGraw-Hill: New York, 1998.
- Carrión, A. Diseño acústico de espacios arquitectónicos. Barcelona: Edicions UPC, 1998.
- Puyana-Romero, V. et al. Reverberation time measurements of a neonatal incubator. Appl. Acoust., 2020, 167, 107374. [CrossRef]
- Puyana-Romero, V.; Núñez-Solano, D.; Fernández-Zacarías, F.; Jara-Muñoz, E.; Hernández-Molina, R. The importance of reverberation for the design of neonatal incubators. Front. Pediatr., 2021, 9 (584736), pp. 4–11. [CrossRef]
- Puyana-Romero, V.; Núñez-Solano, D.; Hernández-Molina, R.; Jara-Muñoz, E. Influence of the NICU on the acoustic isolation of a neonatal incubator. Front. Pediatr., 2020, 8. [CrossRef]
- Sabine, W. C. Collected papers on acoustics. Cambridge: Harvard University Press, 1922.
- Negreira, J. Reducción de niveles de ruido en unidades de neonates. Integración, 2020, 96.
- Da Silva, L.; Soares, L.; Rocha, R.; Edson, J. Measurement of acoustic noise levels in a neonatal intensive care unit. Reme, 2015, 19 (2). [CrossRef]
- Kuhn, P. et al. Moderate acoustic chances can disrupt the sleep of very preterm infants in their incubators. Acta Paediatrica, 2013, 102 (10), pp. 949-954. [CrossRef]
- Goshi, G. et al. Analysis of noise level in neonatal intensive care unit and post natal ward of a tertiary care hospital in an urban city. Int J Contemp Pediatr., 2016, 3 (4), pp. 1358-1361. [CrossRef]
Figure 1.
Floor plan of the NICU of the Puerta del Mar University Hospital (Cádiz, Spain).
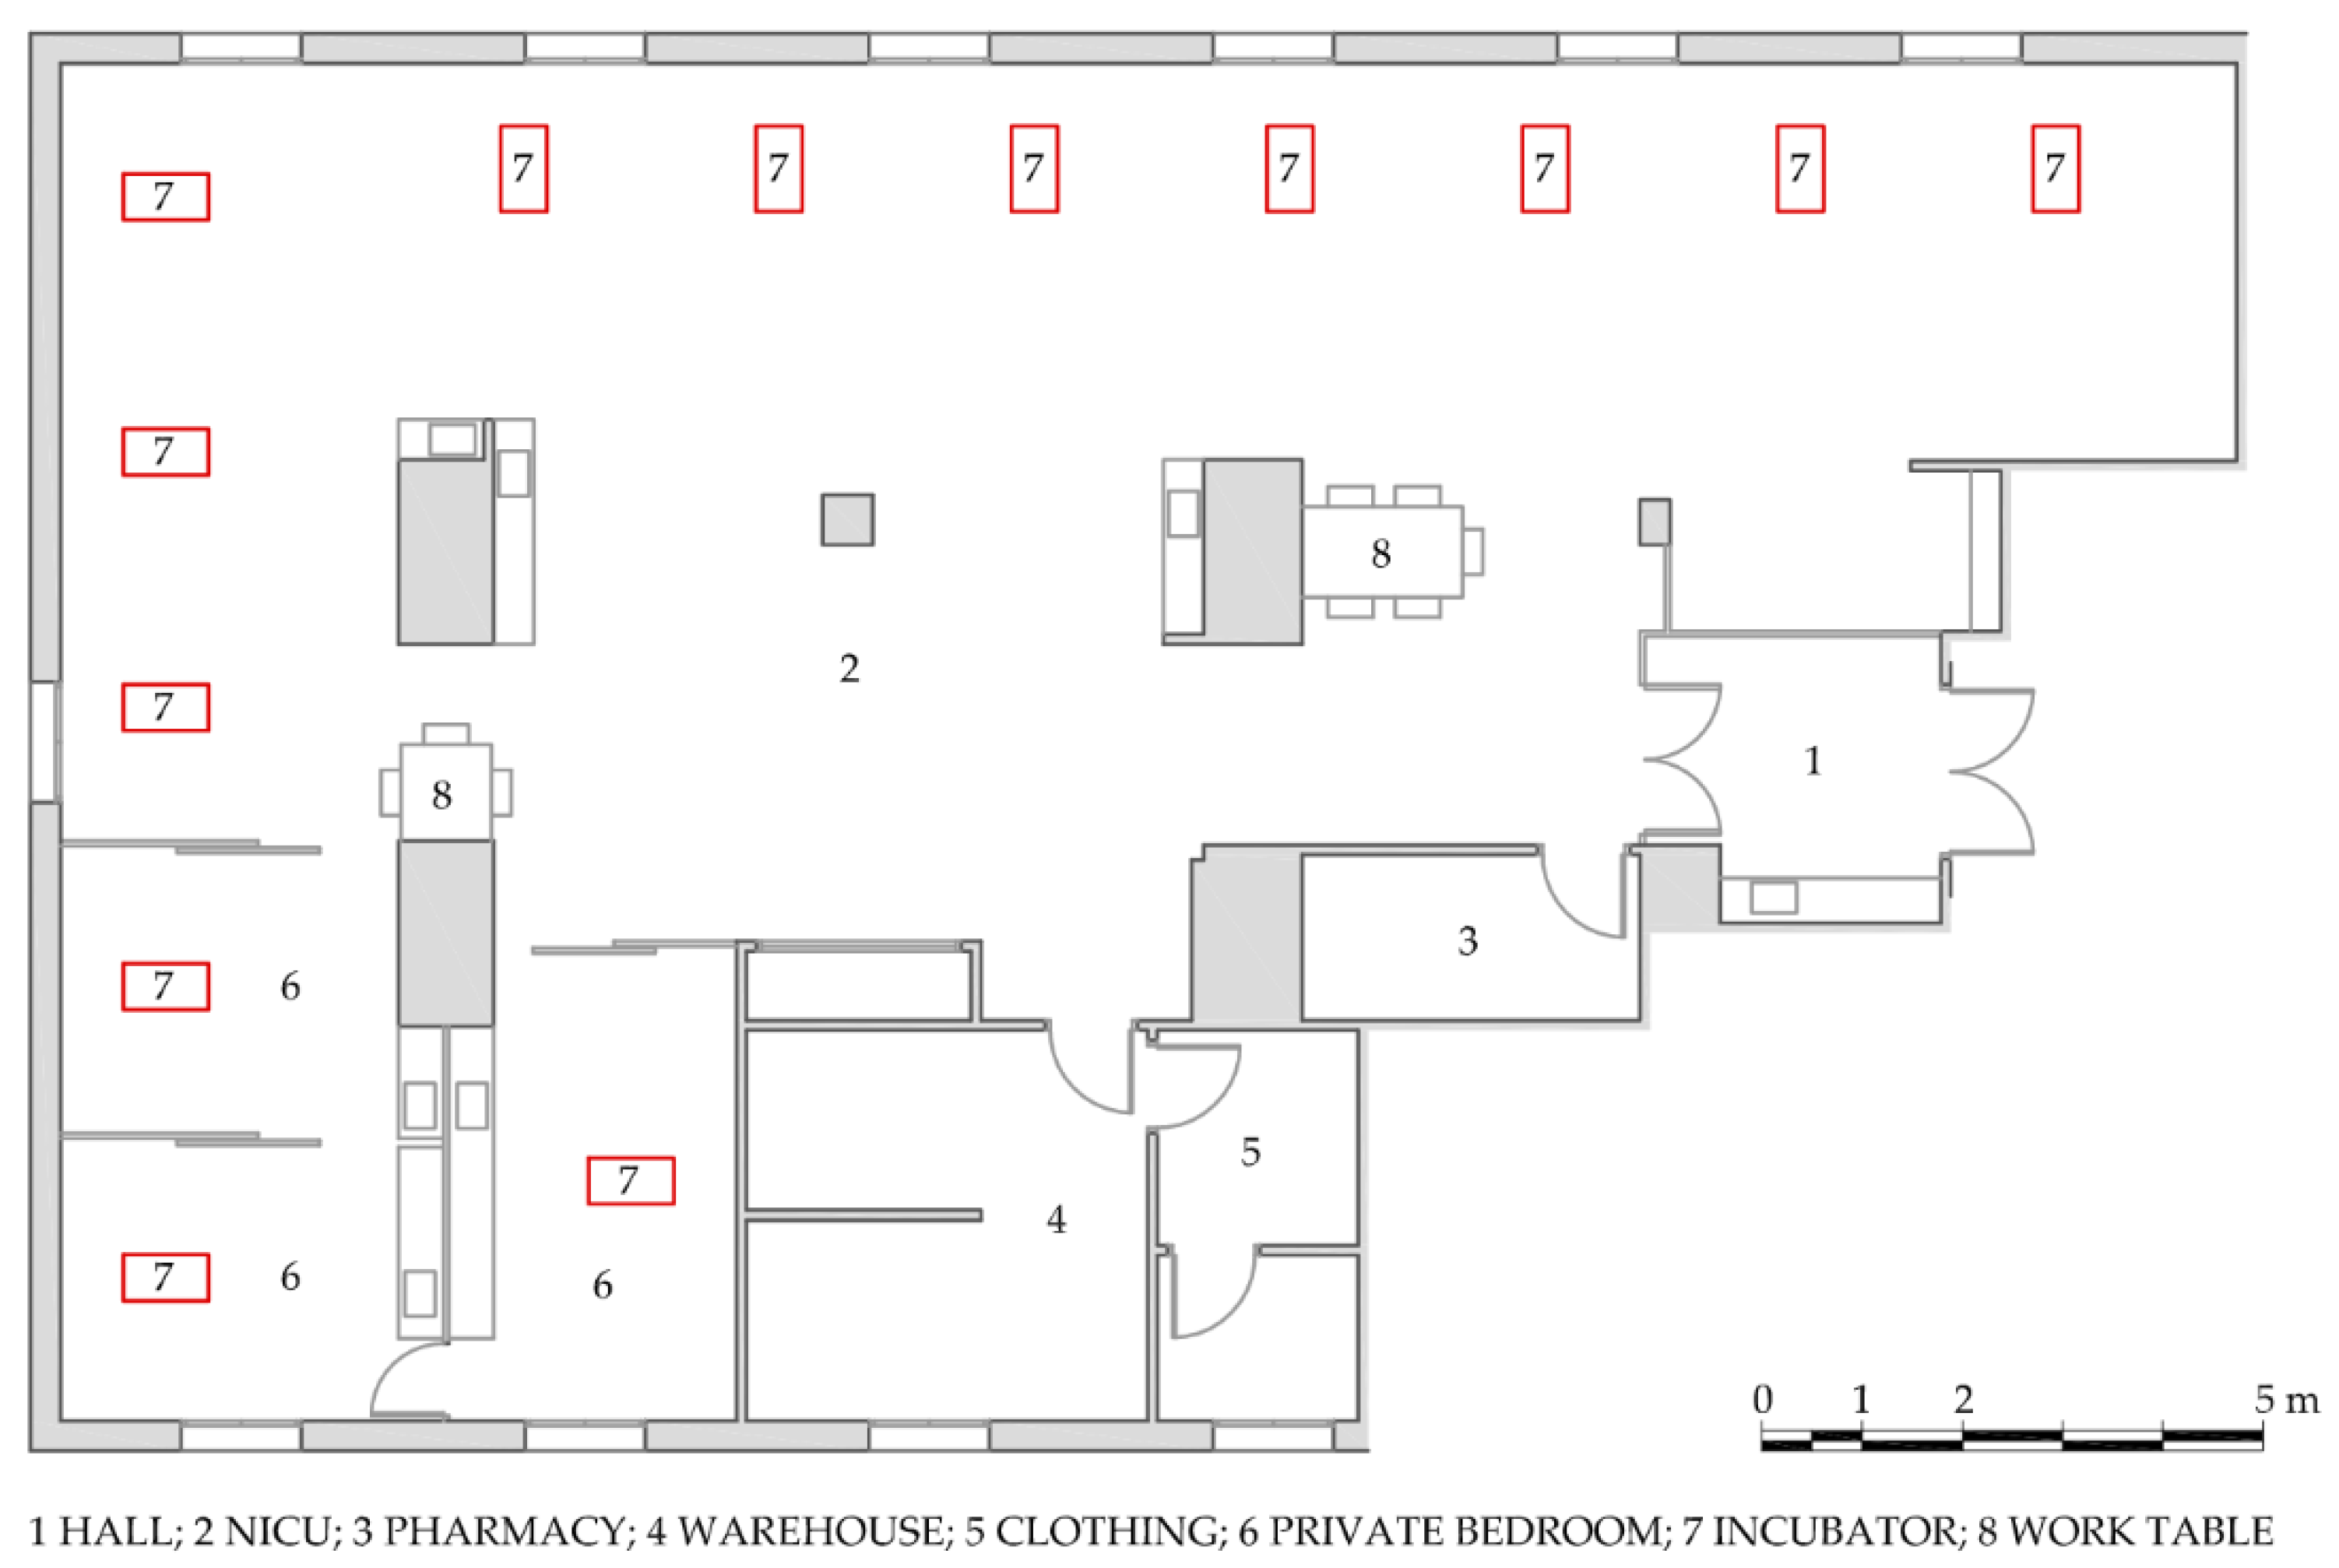
Figure 2.
Floor plan of the NICU of the Juan Ramón Jiménez University Hospital (Huelva, Spain).
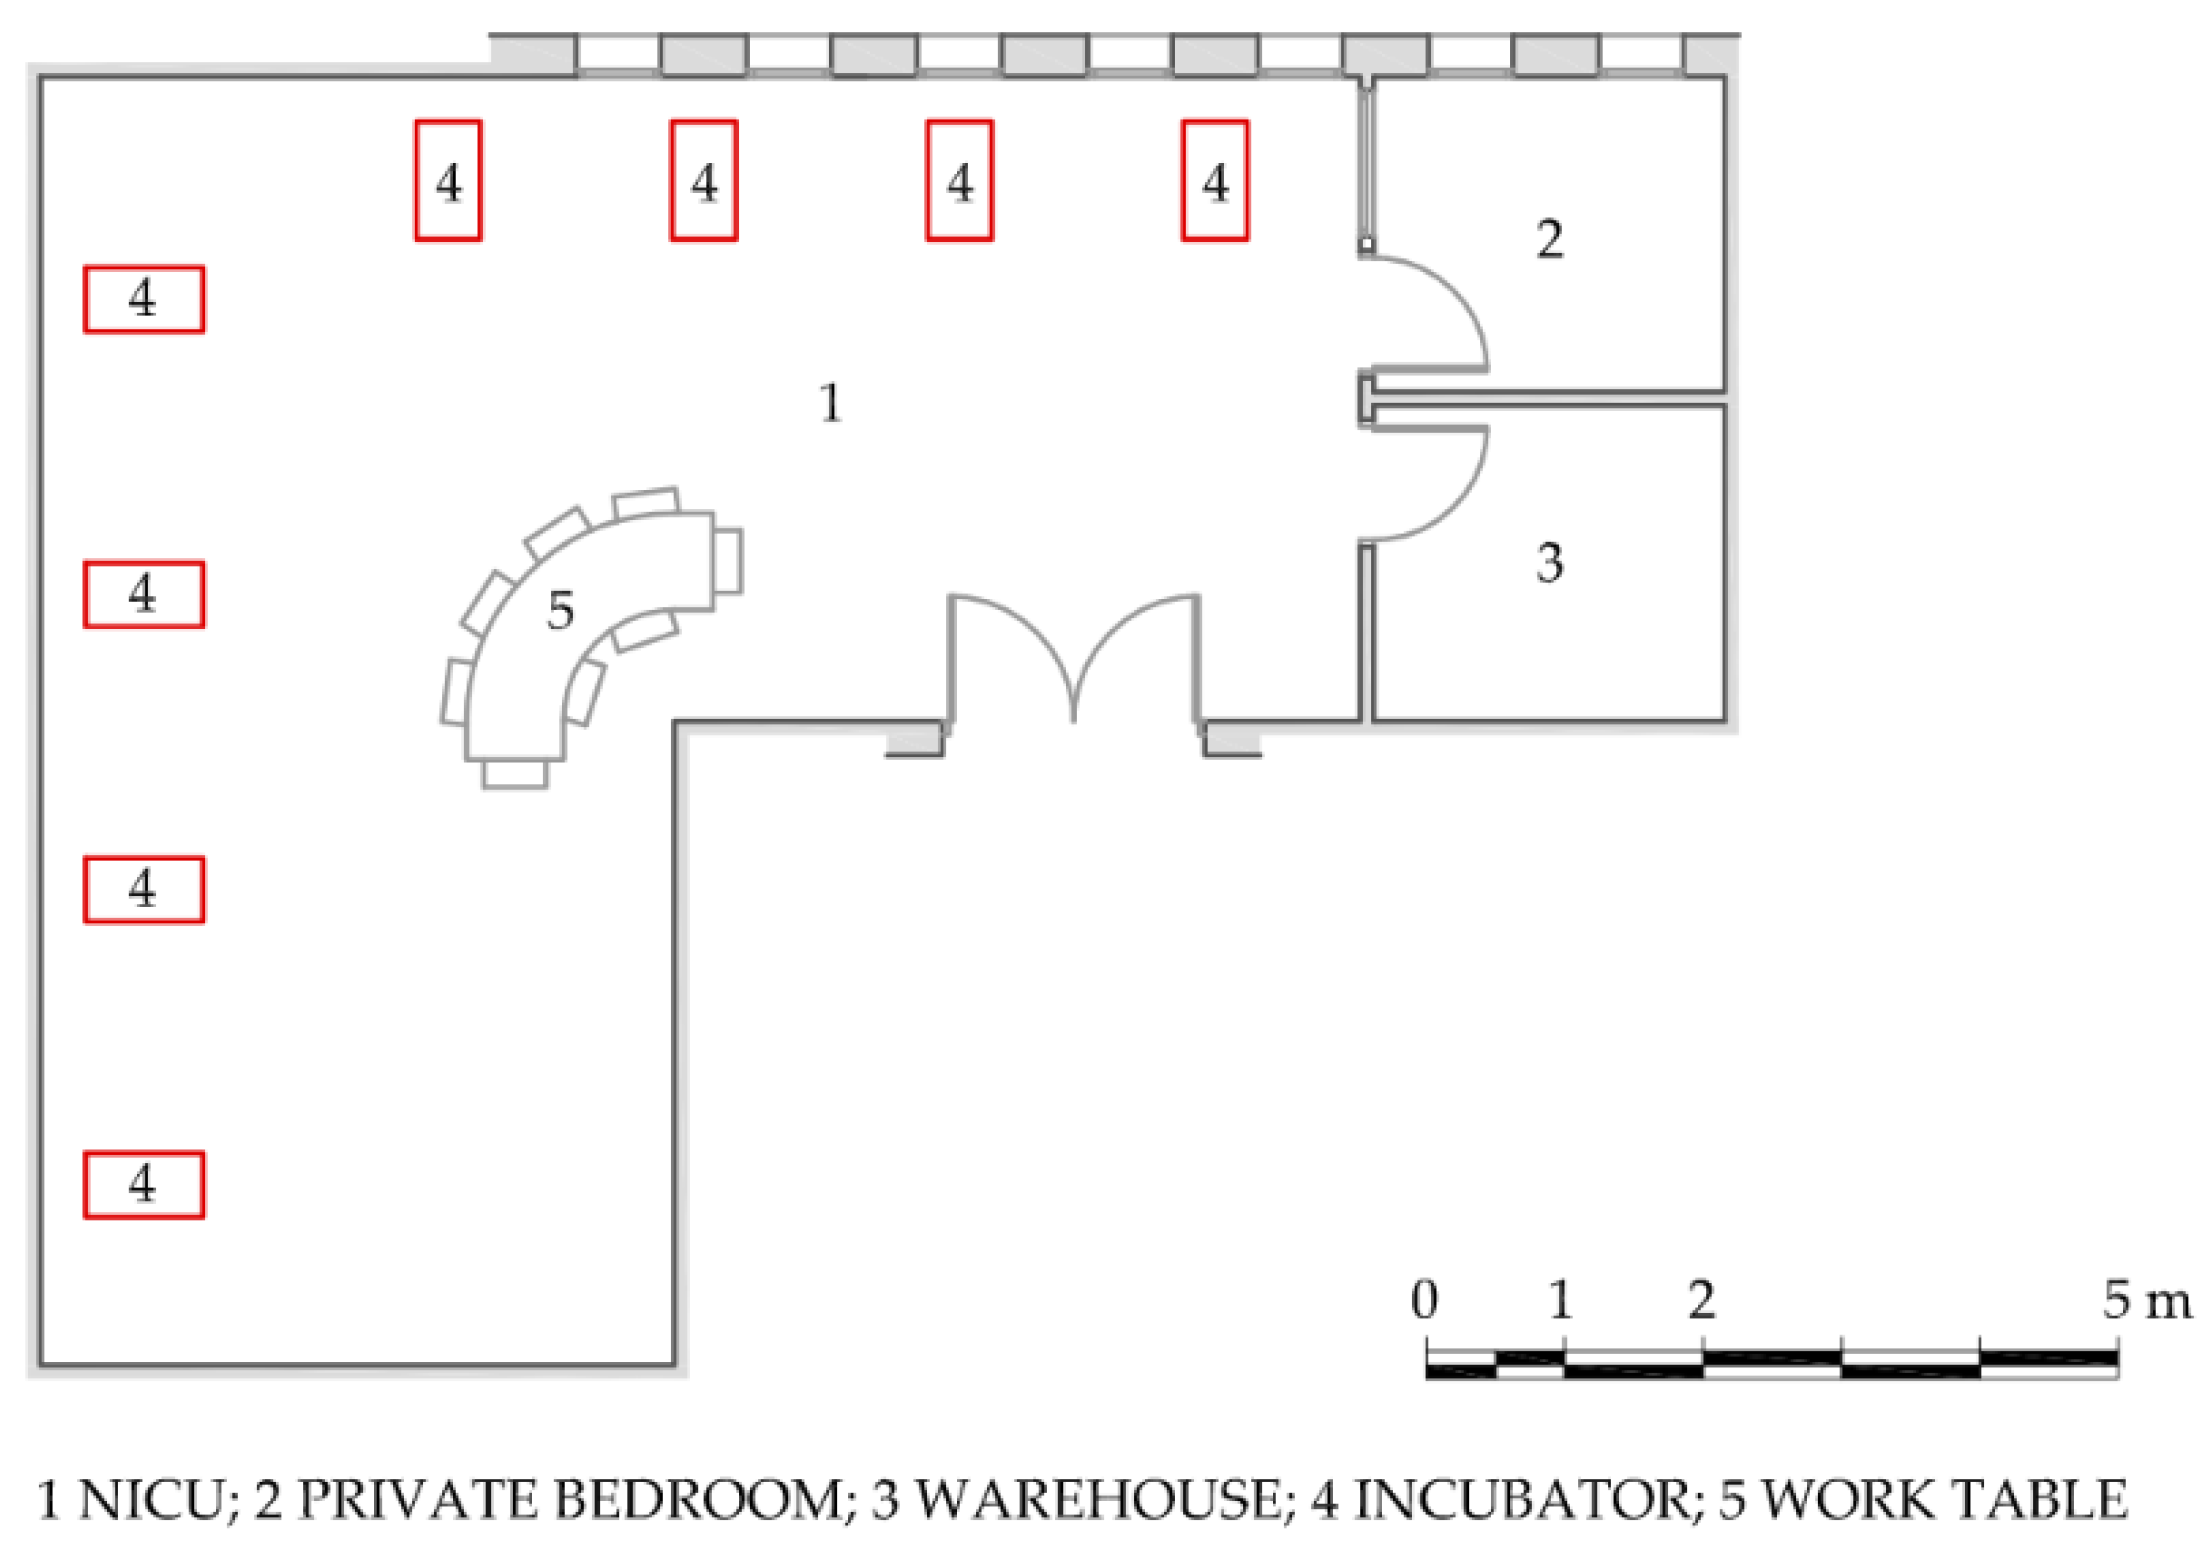
Figure 3.
Comparison of A-weighted Noise levels measured at the HUPM and the HJRJ throughout 24 hours.
Figure 3.
Comparison of A-weighted Noise levels measured at the HUPM and the HJRJ throughout 24 hours.
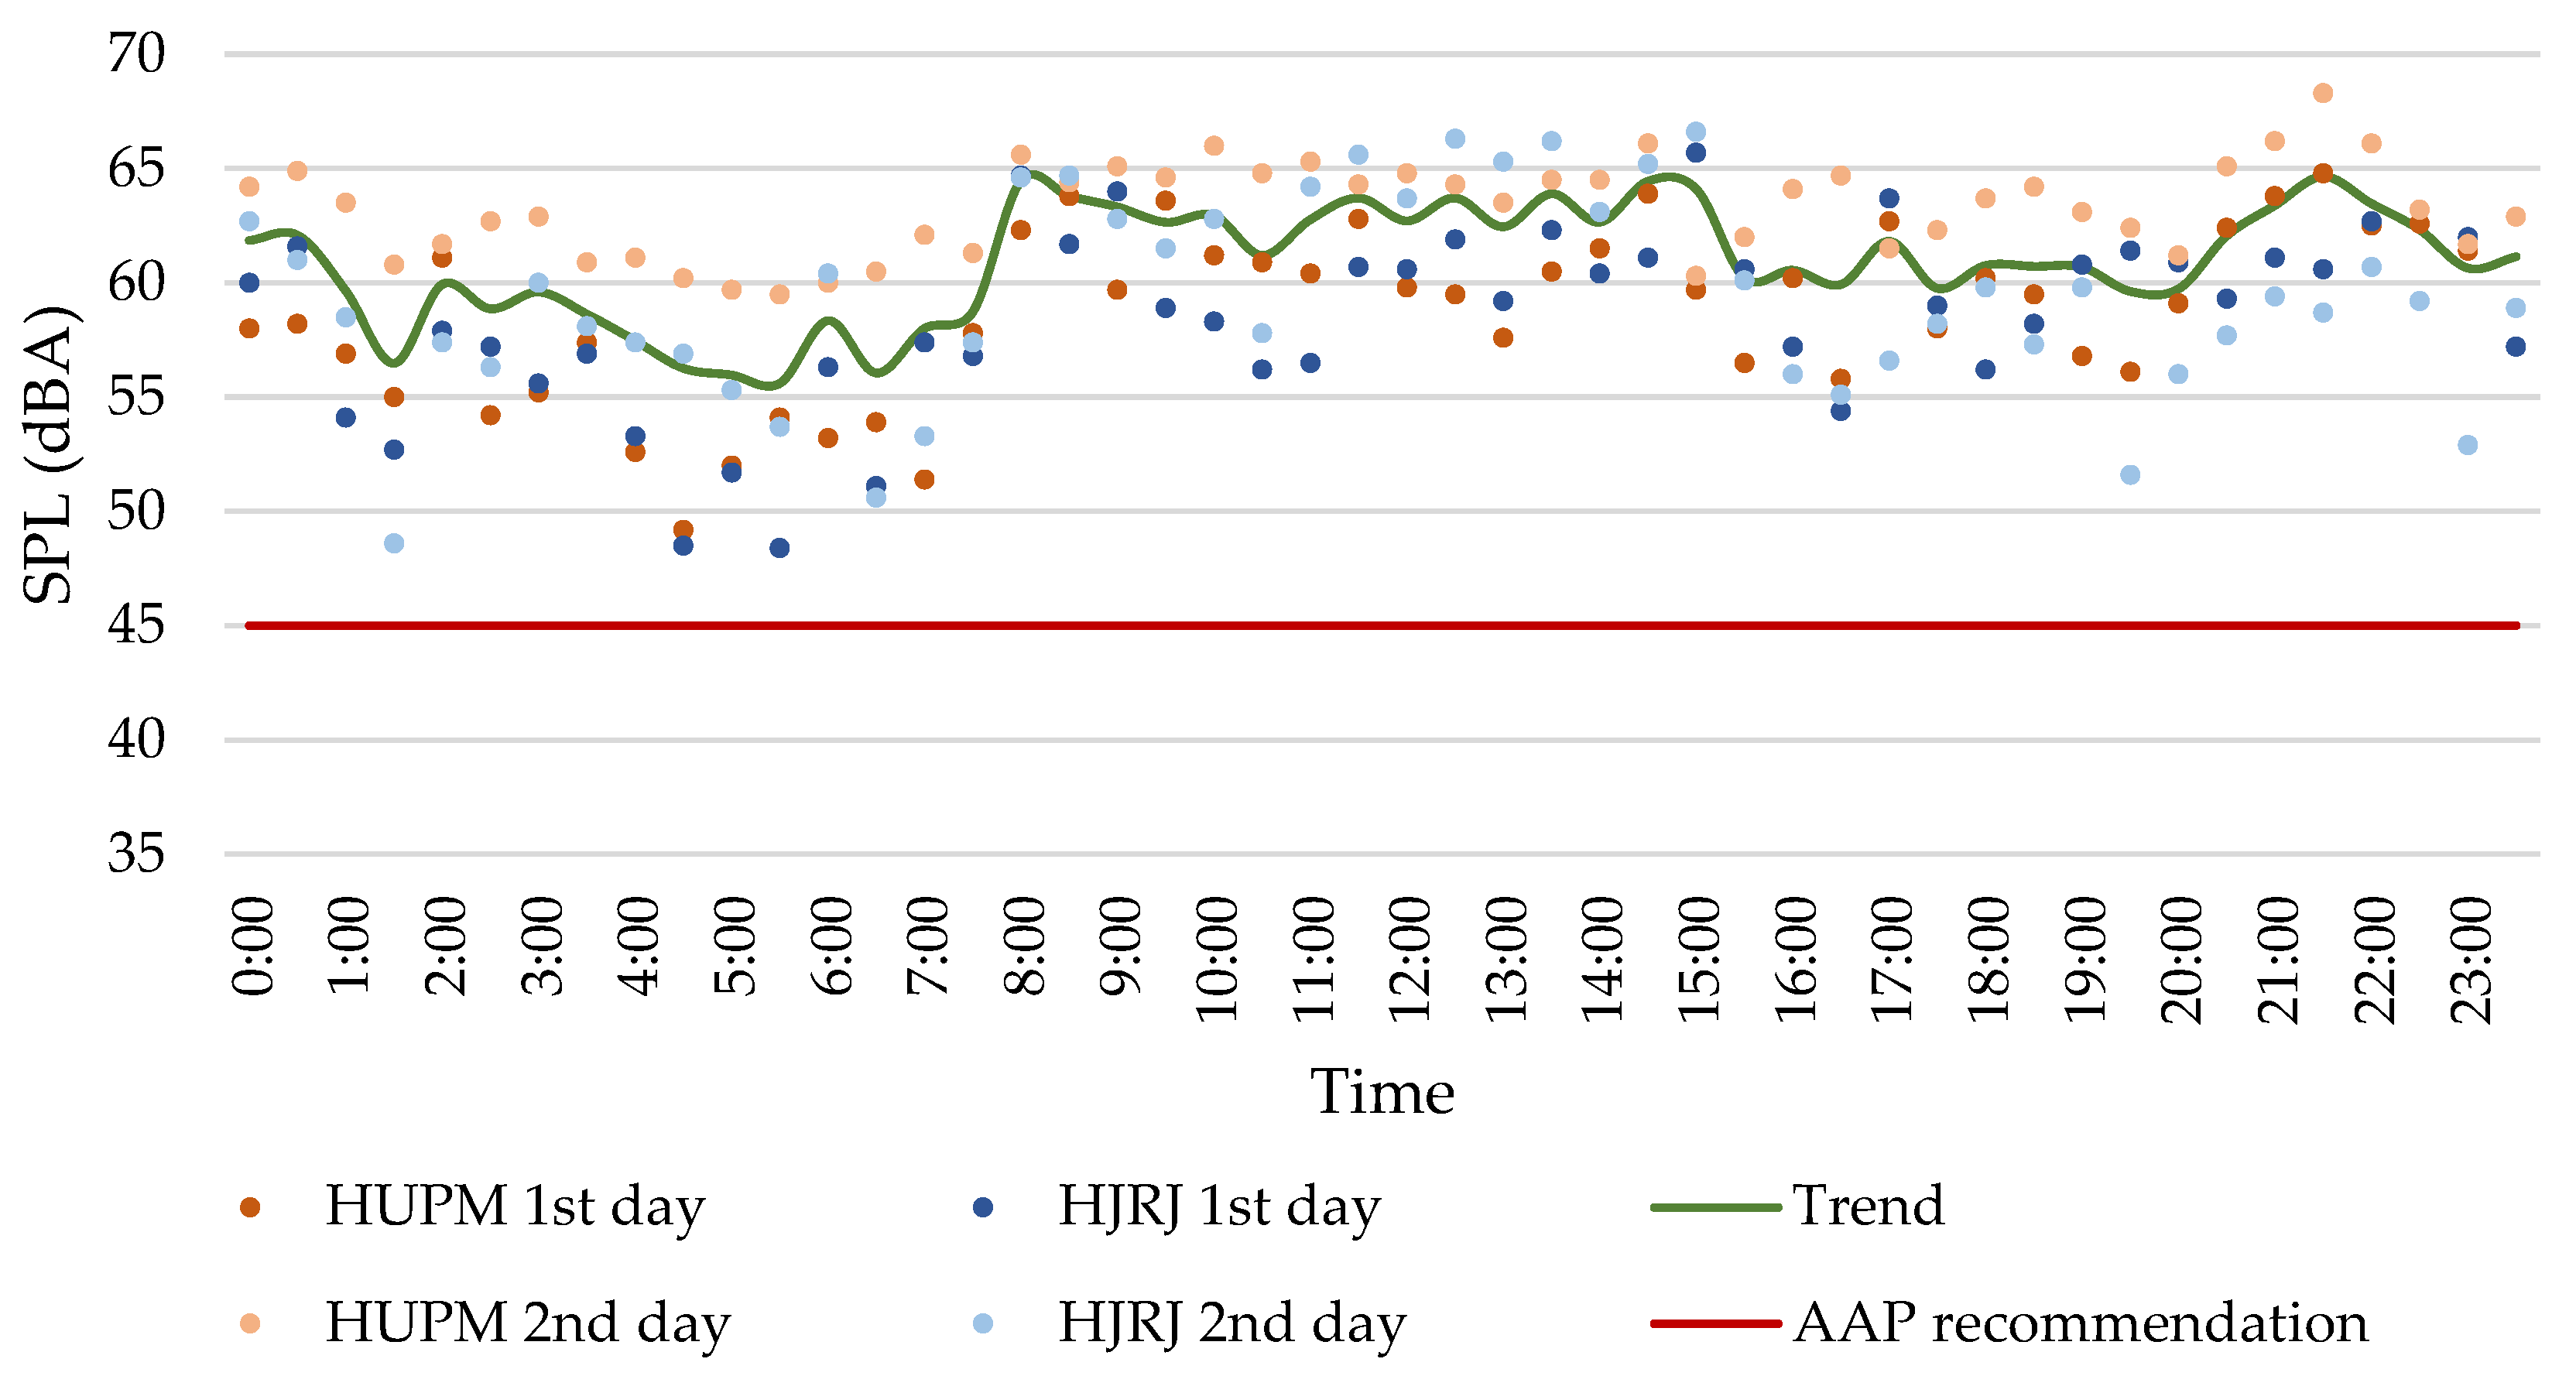

Table 1.
Mann Whitney U test (p-value, z-score and mean ranks), and effect size results to evaluate the differences during the day period between the NICUs from the Juan Ramón Jiménez University Hospital (HJRJ) and the Puerta del Mar University Hospital (HUPM) from Huelva and Cádiz respectively.
Table 1.
Mann Whitney U test (p-value, z-score and mean ranks), and effect size results to evaluate the differences during the day period between the NICUs from the Juan Ramón Jiménez University Hospital (HJRJ) and the Puerta del Mar University Hospital (HUPM) from Huelva and Cádiz respectively.
| Day period (without feeding and staff shift changes), Huelva and Cádiz | ||||||
|---|---|---|---|---|---|---|
| Metrics | Mean Rank | Z | p-value | r, absolute value | Effect size | |
| HJRJ | HUPM | |||||
| LAeq [dBA] | 43,16 | 65,24 | -3,69 | 0,00 | 0,36 | Low |
| LAIeq [dBA] | 46,38 | 60,84 | -2,41 | 0,02 | 0,24 | Low |
| LAFmáx [dBA] | 55,80 | 48,00 | -1,30 | 0,19 | 0,13 | |
| LAFmín [dBA] | 30,50 | 82,50 | -8,69 | 0,00 | 0,85 | Very Strong |
| LCeq [dBC] | 72,23 | 23,37 | -8,11 | 0,00 | 0,80 | Very Strong |
| LA10 [dBA] | 44,75 | 63,07 | -3,06 | 0,00 | 0,30 | Low |
| LA50 [dBA] | 37,45 | 73,02 | -5,94 | 0,00 | 0,58 | Moderate |
| LA90 [dBA] | 32,49 | 79,78 | -7,90 | 0,00 | 0,77 | Very Strong |
| LZeq 40Hz [dB] | 74,50 | 22,50 | -8,69 | 0,00 | 0,85 | Very Strong |
| LZeq 50Hz [dB] | 74,50 | 22,50 | -8,71 | 0,00 | 0,85 | Very Strong |
| LZeq 63Hz [dB] | 74,50 | 22,50 | -8,69 | 0,00 | 0,85 | Very Strong |
| LZeq 80Hz [dB] | 73,88 | 23,35 | -8,44 | 0,00 | 0,83 | Very Strong |
| LZeq 100Hz [dB] | 72,79 | 24,83 | -8,01 | 0,00 | 0,79 | Very Strong |
| LZeq 125Hz [dB] | 55,46 | 48,47 | -1,17 | 0,24 | 0,11 | |
| LZeq 160Hz [dB] | 48,80 | 57,55 | -1,46 | 0,14 | 0,14 | |
| LZeq 200Hz [dB] | 49,71 | 56,31 | -1,10 | 0,27 | 0,11 | |
| LZeq 250Hz [dB] | 41,79 | 67,10 | -4,23 | 0,00 | 0,41 | Moderate |
| LZeq 315Hz [dB] | 40,02 | 69,52 | -4,93 | 0,00 | 0,48 | Moderate |
| LZeq 400Hz [dB] | 45,29 | 62,33 | -2,85 | 0,00 | 0,28 | Low |
| LZeq 500Hz [dB] | 46,60 | 60,55 | -2,33 | 0,02 | 0,23 | Low |
| LZeq 630Hz [dB] | 45,25 | 62,39 | -2,86 | 0,00 | 0,28 | Low |
| LZeq 800Hz [dB] | 39,48 | 70,25 | -5,14 | 0,00 | 0,50 | Moderate |
| LZeq 1kHz [dB] | 43,16 | 65,24 | -3,69 | 0,00 | 0,36 | Low |
| LZeq 1,25kHz [dB] | 39,62 | 70,07 | -5,09 | 0,00 | 0,50 | Moderate |
| LZeq 1,6kHz [dB] | 41,49 | 67,51 | -4,35 | 0,00 | 0,43 | Moderate |
| LZeq 2kHz [dB] | 47,16 | 59,78 | -2,11 | 0,03 | 0,21 | Low |
| LZeq 2,5kHz [dB] | 48,44 | 58,03 | -1,60 | 0,11 | 0,16 | |
| LZeq 3,15kHz [dB] | 51,93 | 53,27 | -0,22 | 0,82 | 0,02 | |
| LZeq 4kHz [dB] | 45,59 | 61,92 | -2,73 | 0,01 | 0,27 | Low |
| LZeq 5kHz [dB] | 51,13 | 54,36 | -0,54 | 0,59 | 0,05 | |
| LZeq 6,3kHz [dB] | 52,42 | 52,61 | -0,03 | 0,97 | 0,00 | |
| LZeq 8kHz [dB] | 51,75 | 53,52 | -0,30 | 0,77 | 0,03 | |
| LZeq 10kHz [dB] | 51,33 | 54,10 | -0,46 | 0,64 | 0,05 | |
| LZeq 12,5kHz [dB] | 51,14 | 54,35 | -0,54 | 0,59 | 0,05 | |
| LZeq 16kHz [dB] | 50,21 | 55,63 | -0,90 | 0,37 | 0,09 | |
| LZeq 20kHz [dB] | 48,19 | 58,38 | -1,70 | 0,09 | 0,17 | |
Table 2.
Mann Whitney U test (p-value, z-score and mean ranks), and effect size results to evaluate the differences during the night period between the NICUs from the Juan Ramón Jiménez University Hospital (HJRJ) and the Puerta del Mar University Hospital (HUPM) from Huelva and Cádiz respectively.
Table 2.
Mann Whitney U test (p-value, z-score and mean ranks), and effect size results to evaluate the differences during the night period between the NICUs from the Juan Ramón Jiménez University Hospital (HJRJ) and the Puerta del Mar University Hospital (HUPM) from Huelva and Cádiz respectively.
| Night period (without feeding and staff shift changes), Huelva and Cádiz | ||||||
|---|---|---|---|---|---|---|
| Metrics | Mean Rank | Z | p-value | r, absolute value | Effect size | |
| HJRJ | HUPM | |||||
| LAeq [dBA] | 33,92 | 50,38 | -3,10 | 0,00 | 0,35 | Low |
| LAFmín [dBA] | 24,50 | 64,50 | -7,55 | 0,00 | 0,84 | Very Strong |
| LCeq [dBC] | 56,50 | 16,50 | -7,56 | 0,00 | 0,84 | Very Strong |
| LA50 [dBA] | 32,34 | 52,73 | -3,85 | 0,00 | 0,43 | Moderate |
| LA90 [dBA] | 25,25 | 63,38 | -7,19 | 0,00 | 0,80 | Very Strong |
| LZeq 40Hz [dB] | 56,50 | 16,50 | -7,56 | 0,00 | 0,84 | Very Strong |
| LZeq 50Hz [dB] | 56,50 | 16,50 | -7,58 | 0,00 | 0,85 | Very Strong |
| LZeq 63Hz [dB] | 55,19 | 18,47 | -7,56 | 0,00 | 0,84 | Very Strong |
| LZeq 80Hz [dB] | 52,36 | 22,70 | -6,93 | 0,00 | 0,77 | Strong |
| LZeq 100Hz [dB] | 46,22 | 31,92 | -5,59 | 0,00 | 0,63 | Very Strong |
| LZeq 125Hz [dB] | 46,22 | 31,92 | -2,70 | 0,01 | 0,30 | Low |
| LZeq 250Hz [dB] | 34,81 | 49,03 | -2,68 | 0,01 | 0,30 | Low |
| LZeq 315Hz [dB] | 35,74 | 47,64 | -2,24 | 0,02 | 0,25 | Low |
| LZeq 800Hz [dB] | 29,30 | 57,30 | -5,28 | 0,00 | 0,59 | Moderate |
| LZeq 1kHz [dB] | 36,21 | 46,94 | -2,02 | 0,04 | 0,23 | Low |
| LZeq 1,25kHz [dB] | 31,74 | 53,64 | -4,13 | 0,00 | 0,46 | Moderate |
| LZeq 1,6kHz [dB] | 33,20 | 51,45 | -3,44 | 0,00 | 0,38 | Low |
Table 3.
Mann Whitney U test (p-value, z-score and mean ranks), and effect size results to evaluate the differences during the feeding day period between the NICUs from the Juan Ramón Jiménez University Hospital (HJRJ) and the Puerta del Mar University Hospital (HUPM) from Huelva and Cádiz respectively.
| Feeding, day period, Huelva and Cádiz | ||||||
|---|---|---|---|---|---|---|
| Metric | Mean Rank | Z | p-value | r, absolute value | Effect size | |
| HJRJ | HUPM | |||||
| LAFmín [dBA] | 6,50 | 16,00 | -3,56 | 0,00 | 0,82 | Very Strong |
| LCeq [dBC] | 14,33 | 4,75 | -3,18 | 0,00 | 0,73 | Strong |
| LA90 [dBA] | 7,08 | 15,00 | -2,96 | 0,00 | 0,68 | Very Strong |
| LZeq 40Hz [dB] | 13,50 | 4,00 | -3,56 | 0,00 | 0,82 | Very Strong |
| LZeq 50Hz [dB] | 13,50 | 4,00 | -3,57 | 0,00 | 0,82 | Very Strong |
| LZeq 63Hz [dB] | 13,50 | 4,00 | -3,57 | 0,00 | 0,82 | Very Strong |
| LZeq 80Hz [dB] | 13,17 | 4,57 | -3,21 | 0,00 | 0,74 | Strong |
| LZeq 100Hz [dB] | 13,50 | 4,00 | -3,55 | 0,00 | 0,82 | Very Strong |
| LZeq 800Hz [dB] | 7,96 | 13,50 | -2,07 | 0,04 | 0,48 | Moderate |
Table 4.
Mann Whitney U test (p-value, z-score and mean ranks), and effect size results to evaluate the differences during the feeding nigh period between the NICUs from the Juan Ramón Jiménez University Hospital (HJRJ) and the Puerta del Mar University Hospital (HUPM) from Huelva and Cádiz respectively.
| Feeding, night period, Huelva and Cádiz | ||||||
|---|---|---|---|---|---|---|
| Metric | Mean Rank | Z | p-value | r, absolute value | Effect size | |
| HJRJ | HUPM | |||||
| LAFmín [dBA] | 5,00 | 12,50 | -3,18 | 0,00 | 0,82 | Very Strong |
| LCeq [dBC] | 11,00 | 3,50 | -3,18 | 0,00 | 0,82 | Very Strong |
| LA90 [dBA] | 5,89 | 11,17 | -2,25 | 0,02 | 0,58 | Moderate |
| LZeq 40Hz [dB] | 11,00 | 3,50 | -3,19 | 0,00 | 0,82 | Very Strong |
| LZeq 50Hz [dB] | 11,00 | 3,50 | -3,21 | 0,00 | 0,83 | Very Strong |
| LZeq 63Hz [dB] | 11,00 | 3,50 | -3,20 | 0,00 | 0,83 | Very Strong |
| LZeq 80Hz [dB] | 11,00 | 3,50 | -3,19 | 0,00 | 0,82 | Very Strong |
| LZeq 100Hz [dB] | 11,00 | 3,50 | -3,19 | 0,00 | 0,82 | Very Strong |
| LZeq 125Hz [dB] | 10,83 | 3,75 | -3,02 | 0,00 | 0,78 | Strong |
Table 5.
Mann Whitney U test (p-value, z-score and mean ranks), and effect size results to evaluate the differences during the staff shift changes between the NICUs from the Juan Ramón Jiménez University Hospital (HJRJ) and the Puerta del Mar University Hospital (HUPM) from Huelva and Cádiz respectively.
| Staff shift changes, day period, Huelva and Cádiz | ||||||
|---|---|---|---|---|---|---|
| Metric | Mean Rank | Z | p-value | r, absolute value | Effect size | |
| HJRJ | HUPM | |||||
| LAFmín [dB] | 5,00 | 12,00 | -3,01 | 0,00 | 0,80 | Very Strong |
| LCeq [dB] | 10,00 | 3,00 | -3,50 | 0,00 | 0,93 | Very Strong |
| LA90 [dB] | 5,67 | 10,80 | -2,20 | 0,03 | 0,59 | Moderate |
| LZeq 40Hz [dB] | 10,00 | 3,00 | -3,01 | 0,00 | 0,80 | Very Strong |
| LZeq 50Hz [dB] | 10,00 | 3,00 | -3,01 | 0,00 | 0,80 | Very Strong |
| LZeq 63Hz [dB] | 10,00 | 3,00 | -3,02 | 0,00 | 0,81 | Very Strong |
| LZeq 80Hz [dB] | 10,00 | 3,00 | -3,00 | 0,00 | 0,80 | Very Strong |
| LZeq 100Hz [dB] | 9,56 | 3,80 | -2,47 | 0,01 | 0,66 | Strong |
Disclaimer/Publisher’s Note: The statements, opinions and data contained in all publications are solely those of the individual author(s) and contributor(s) and not of MDPI and/or the editor(s). MDPI and/or the editor(s) disclaim responsibility for any injury to people or property resulting from any ideas, methods, instructions or products referred to in the content. |
© 2024 by the authors. Licensee MDPI, Basel, Switzerland. This article is an open access article distributed under the terms and conditions of the Creative Commons Attribution (CC BY) license (http://creativecommons.org/licenses/by/4.0/).
Copyright: This open access article is published under a Creative Commons CC BY 4.0 license, which permit the free download, distribution, and reuse, provided that the author and preprint are cited in any reuse.


