
Submitted:
26 June 2024
Posted:
27 June 2024
You are already at the latest version
Abstract
This paper presents the concept of applying incremental capacity analysis (ICA) on the OCV curve in the SoC space. The OCV curve can be obtained from any sequence of discharge or charge current or power pulse with a necessary rest period to allow the cell to reach a pseudo-OCV after each pulse. With a higher resolution (>100 pulses) in the full SoC window, an OCV vs SoC curve can be obtained with sufficient accuracy to perform an ICA on the obtained OCV curve. ICA as a diagnostic technique has commonly been applied on Li-ion cells with a constant charge and discharge at slow currents. However, a slow controlled constant current charge or discharge is normally not feasible and cannot be easily applied to a battery in an application. Here we revisit pulse-based ICA to supplement the conventional constant-current-based technique. Conventional ICA performed on ageing data with constant current is directly compared to ICA performed on a selection of higher resolution OCV curves. The main advantage of OCV-ICA is that it can be applied to most cells and systems without significant interruption of normal cell operation. OCV-ICA provides valuable insights into ageing mechanisms as well as detailed information on changes in internal resistance.
Keywords:
Li-ion battery
; diagnostics
; ICA
; dQ/dV
; OCV
; battery system
; aging
; SoH
; SoS
1. Introduction
The Li-ion battery (LIB) has become the most popular rechargeable battery technology since its commercial introduction in 1990s. It was originally used as a battery in consumer electronics and was later introduced as the energy battery of electric vehicles (EVs) when e.g., the Nissan Leaf and Mitsubishi i-MiEV were introduced in 2010 and 2009. Later, the LIB has entered the market in both electric energy storage (ESS) applications and large electric and hybrid-electric ships. The LIB is still the most used rechargeable battery technology due to its superior energy density and efficiency compared to most other rechargeable battery technologies.
However, LIBs are more prone to fires than other battery technologies. This is due to their inherent higher energy density as well as the flammability of especially anode materials, separator, and electrolyte solvents. In addition, ageing and degradation can contribute considerably to decrease the safety of a LIB [1]. A LIB can age in several ways. The effects of different ageing mechanisms are commonly classified into different ageing modes, such as e.g., loss of lithium inventory (LLI), loss of active material (LAM), and impedance increase due to reaction kinetics degradation.
One degradation mechanism leading to LLI that will significantly impact the battery’s safety is lithium plating. During lithium plating, metallic lithium forms on the anode surface [2]. This happens specifically when charging at too high currents and lower temperatures (< 10°C). Recent reports have shown that this can already happen at moderate temperature (15-25°C) and currents [3]. The metallic Lithium can in the worst case create a short-circuit in the battery cell and cause a fire and or explosion. More commonly, the metallic lithium will not short the battery, but will remain within the anode contributing to accelerated degradation as well as being a potential future safety hazard. Especially when a battery has aged, the path of ageing can affect the safety properties of the battery considerably and cause dramatic differences in the severity of a possible safety incident. While battery safety tests are routinely performed on new cells, the understanding and experimental assessment of the state of safety (SoS) of aged cells in general and cells aged under different conditions is still scarce [4]. Consequently, the SoS is commonly assumed to be directly related to the battery’s state of health (SoH), and its monitoring is done to avoid further use of LIBs that may have aged in a detrimental fashion and can have an increased fire safety risk.
Several techniques for battery SoH monitoring exist. These encompass e.g., a simple measurement of remaining capacity, DC resistance monitoring, or more elaborate methodologies such as electrochemical impedance spectroscopy (EIS) [5], intermittent current interrupt (ICI) [6], high power pulse characterization (HPPC), incremental capacity analysis (dQ/dV, ICA) [7], differential voltage analysis (dV/dQ, DVA) [8] or entropy spectroscopy [9]. While some of these methods only yield very basic information on the battery’s SoH, others might give insight into how the battery has aged and through which mechanisms this has happened. From an applied perspective the ICA and DVA methodologies may be the most versatile diagnostic method as they only require a constant low current of the Li-ion cell. Detailed analysis of the obtained ICA and DVA can then reveal correlations between capacity loss and degradation, and thus allow for a more detailed assessment of the battery’s SoH and potentially also the battery’s SoS [8]. However, obtaining the full constant-current (dis-)charge of the battery required for ICA can be challenging and is not feasible to obtain during actual battery operation.
The open-circuit voltage (OCV) curve is frequently used as a reference in battery modelling and SoC estimations in battery manage systems (BMS) [10]. The OCV is the stable thermodynamic state of a battery at any state-of-charge (SoC) representing the change in reversible Gibbs free energy of the anode and cathode reactions. The OCV is measured when there is no current in the battery and the battery voltage has stabilized to a “constant value”. However, the OCV relaxation is an asymptotic process and will only approach, but not actually reach the “true” OCV value. This means that there is no constant OCV, but typically a pseudo-OCV is assumed to have been reached after e.g., 1 or 2 hours of relaxation. Consequently, the measurement of an OCV curve can be very time consuming and not feasible on a regular basis. E.g., for an OCV curve with a SoC resolution of 1% and a relaxation time of one hour at each step, this would give a total of 204 hours for a full OCV curve for both charge and discharge with C/2 current steps in-between, summing up to more than 8 days for one full detailed OCV measurement. Quite commonly, the cell voltage of a slow discharge (<C/20) is used as a pseudo-OCV curve [7], still requiring >40 hours of measurement time for a new cell. Several methods have been investigated to obtain a pseudo-OCV curve at reduced measurement times, as well as applying advanced methods for OCV reconstruction [11,12] to speed up the process even further.
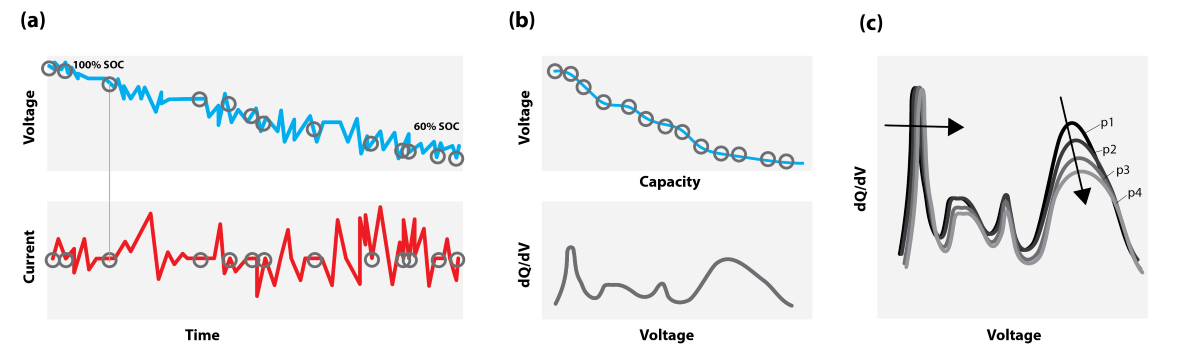
As opposed to constant-current (CC) measurements across the full SoC window, (pseudo-) OCV values can be considerably easier to obtain during actual battery operation within an application. In fact, the OCV curve can be obtained from any sequence of discharge or charge current or power pulse with a necessary rest period to allow the cell to reach a pseudo-OCV after each pulse. This will allow for the establishment of a pseudo-OCV curve without significant operational interruption. This OCV curve can be further used as input to an ICA, not requiring slow CC conditions but based on operational data as illustrated in Figure 1 obtaining an OCV-ICA instead.
The reconstruction of a battery’s OCV curve is currently being used extensively for SoC estimation in battery systems. However, its use and potential analogy to common CC diagnostics has not been well explored. Petzl et al. [10] compared the OCV curve estimation with slow CC and its application for calculating both ICA and DVA. However, the information was not used to assess battery ageing and ageing mechanisms. A research paper by Goldammer [5] studies the link between EIS and DVA on OCV curves for a small set of aged cells. Further literature studies have found a first paper on operando quantitative diagnostics [13], but, to the best of our knowledge, no other research explores the application of OCV-ICA within the diagnostic assessment of battery ageing and its applicability to assess safety critical ageing conditions.
In this paper we present the ICA methodology applied to an ageing dataset with ICA data collected at slow constant currents (CC-ICA) and further investigate how it may be applied to detailed OCV curves (OCV-ICA). This will allow for the ICA methodology to be applied to most cells and systems without significant interruption of normal cell operation and consequently provide not only SoH estimation, but also valuable insights into ageing mechanisms, detailed information on changes in internal resistance and state of safety.
To illustrate the feasibility of the proposed approach, we present excerpts of a large-scale lifetime study on a large commercial 64 Ah NMC532/graphite pouch cell. Cell ageing at different temperatures was followed by conventional CC-ICA. In addition, we compare several approaches for OCV-estimation, varying both SoC resolution and relaxation times, aiming to reduce the measurement time below the 40 hours required for a full C/20 cycle, while still resolving the main electrode features. Subsequently we present a direct comparison of the obtained OCV-ICA and CC-ICA.
2. Materials and Methods
2.1. Data Collection
Cell type and setup. The cell used in this study was a large commercial 64 Ah pouch cell, with an NMC532/graphite chemistry. A total of over 140 cells has been tested within a large-scale aging and safety study, out of those, data from 18 cells was used specifically in this paper. The cells were tested under controlled environments in temperature chambers within voltage limits of 3 V and 4.2 V, according to the manufacturers’ specifications. All cells were mounted in a mechanical fixture with 10 mm Aluminum plates around the cell, and a 1 Nm torque on the six 10 mm bolts. In addition, a 5 mm Aluminum plate with a narrow groove was placed on top of the cell to accommodate for the placement of a Pt-100 temperature sensor at the center of the pouch cell surface. The measurement setup is shown in Figure 2.
Cell cycling. All cycling was performed with battery testers from PEC, either SBT-0550 or ACT-0550 testers. The cells were kept in dedicated temperature-controlled chambers for the five selected test temperatures.
Cell characterization. All cells were initially characterized at 25±1°C employing a characterization protocol including 0.75C, 0.25C and 0.05C constant current cycles. All charge steps were finished with a CV step at 4.2 V to 0.05C. The characterization protocol included a high-power-pulse like test (HPPC) to unveil details of cell resistance and OCV in steps of 5% SoC from 100% SoC to 0% SoC.
Ageing study. The presented dataset is part of a large-scale ageing study including cells aged at 5, 15, 25, 35 and 45°C cycling from 0 to 100% SoC at 0.75C current. A minimum of 5 minutes OCV between charge and discharge was required. If the cell temperature was (still) more than 1°C above the wanted cycling temperature, the cell was allowed to cool until the 1°C limit was reached before the next charge or discharge was started. The initial cell characterization at 25°C was repeated in regular intervals (after either (i) a defined number of cycles, (ii) a total maximum test time was reached or (iii) if the remaining capacity for the cycling protocol had dropped with 5% during the cycling) until the cell reached its end-of-life at 80% SoH.
OCV measurements. The detailed OCV curve was measured occasionally in significantly higher SoC resolution than in the standard HPPC test protocol: A current pulse of 0.5C was used to discharge or charge the cell in SoC steps of 1% or less. The OCV values were established by taking the value at t = 15 min after the end of the current pulse. To reduce the influence of noise in the data, this OCV value was verified by direct comparison to a fitted exponential regression curve against the voltage relaxation data.
2.2. Data Handling
CC-ICA. Conventional CC-ICA was performed on C/20 data collected during the regular characterization cycles. The method for calculating the dQ/dV from charge and discharge curves was described in detail in our earlier work [14]: “As the original voltage versus capacity curves contain measurement noise, it is necessary to apply a filtering algorithm to obtain the IC data. Since the number of data points per capacity step might be uneven, the measured voltages are averaged in capacity steps of 0.05% of the full capacity span. After averaging the dataset, a local second order polynomial regression was fitted to the voltage as a function of capacity with a moving capacity window. The size of the moving capacity window is limited by either a voltage window (20 mV) or capacity window (5%) whichever being the limiting variable.”.
OCV-ICA. OCV-ICA was established from the detailed OCV measurements described above, following the same smoothing methodology as used for CC-ICA.
3. Results
3.1. Cycle Life
The cycling study included a total of 18 cells which were aged at five different temperatures. The results are summarized in Figure 3. We observe that cycling at temperatures above 25°C reduces cycle life. Cycling at 25°C allows for a cycle life of 3000 equivalent full cycles at 80% SoH, while the cycle life is reduced to 2100 EFC at 35°C and even further down to 1450 EFC at 45°C respectively. Even though cycle conditions at 5°C exhibit a higher initial drop in capacity, cycling at 5°C and 15°C result in comparable cycle life of 3000 EFC as compared to 25°C.
Depending on the cycling conditions, the mechanisms leading to the observed loss in capacities can be quite different but cannot be inferred from a simple lifetime plot. A detailed ICA can allow for the extraction of more details on the underlying ageing mechanisms.
3.2. Qualitative Aging Diagnostics via ICA
Figure 4 shows the evolution of the IC curves throughout the life of a cell cycled at room temperature (25°C). As the cell ages we observe qualitative changes in the IC for both discharge (negative dQ/dV values) and charge (positive dQ/dV values). In the IC at 100% SoH, on charging, we observe two larger peaks at 3.49 V and 3.645V, while a local minimum (valley) is observed at 3.765 V as well as some smaller peaks around 3.6V. The origin of these peaks stems from the phase transitions of the graphite during lithiation as well as changes within the NMC material during de-lithiation as elaborated by Spitthoff [14]. The positions of these change during the ageing progression, significantly depending on the dominating ageing modes.
To illustrate the influence of temperature on the degradation pathways, Figure 5 and Figure 6 show the corresponding IC curves at 5 and 45°C. It can clearly be seen that even at similar SoH, the features of the IC curves evolved in different ways, pointing towards different types of degradation mechanisms. For a more thorough interpretation of those curves, including a more detailed and quantitative analysis, we refer to our previous work [14].
3.3. Measurement of OCV Curves
Two basic approaches are commonly employed to approximate the “true” OCV curve: slow constant-current charge and discharge, as well as pulsing protocols with varying relaxation times and SoC steps. To evaluate the different approaches with respect to their applicability for ICA, several different measurements where performed. Figure 7 shows the direct comparison of a representative selection of measured OCV curves, including charge and discharge curves for C/20 and C/100 as well as an OCV curve obtained by employing 0.5C current pulses in 0.5% SoC steps and 15 minutes OCV relaxation times.
The observed hysteresis between charge and discharge gets smaller with decreasing C-rates and thus closer to the actual equilibrium voltage. The voltage hysteresis for the current pulse protocol is even smaller than for the slow constant current cycles, indicating an even better approximation to the “true” OCV.
3.4. Influence of Pulsing-Parameters on OCV-ICA
To better resolve the features in the pseudo-OCV curves and evaluate similarities and differences between slow CC and pulsing approaches, the corresponding dQ/dV curves will be analyzed. As a first step, we take a closer look at the influence of pulsing parameters on the resulting pseudo-OCV curve as well as their effects on the resulting dQ/dV curves. It should be noted that OCV curves based on constant current can never be assigned as an “actual” OCV curve since the cell is not at an OCV equilibrium, but has a small polarization shift proportional to the actual current. This polarization will give a voltage shift of the IC proportional to the applied current and the shift accumulates over the SoC and will hence not be constant throughout the obtained IC curves.
OCV-ICA data were obtained from pseudo-OCV curves using a variety of different pulsing protocols. The influence of selected influential pulsing parameters (relaxation times and SoC resolution) on the resulting dQ/dV curves was investigated.
Relaxation times. The relaxation time after a current pulse determines how close one gets to the true OCV. Figure 8 shows the influence of selected relaxation times on the resulting dQ/dV curves. Even short relaxation times of 5 minutes show peak shifts smaller than observed for CC-ICA despite comparably high current pulses of 0.5C. The OCV-ICA seemed to stabilize for relaxation times larger than 15 minutes, with very similar IC curves for both 15- and 30-minutes of relaxation time. Thus 15 minutes seems to be a good experimental compromise with respect to a maximum necessary relaxation time for this cell. Some noise in the IC signals is observed especially at the first peaks around 3.47 V. This can most likely be attributed to the applied smoothing algorithm that are not (yet) fully optimized for the significantly smaller number of datapoints across the SoC window used for obtaining the OCV-ICA compared to the CC-ICA curves (see below).
SoC resolution. The SoC resolution of the pulsing protocols significantly affects the quality of the obtained OCV-ICA data. A SoC resolution of 2% (50 steps) is enough to resolve the main ICA features, while a SoC resolution of 0.5% (200 steps) will properly resolve even smaller features (Figure 9). SoC-dependent resolution adjustments around areas of interest can further reduce the necessary number of steps. Note that the smoothing algorithm settings can affect the actual outcome of the ICA and will have to be further optimized specifically with respect to OCV-ICA.
Based on the discussions above, in the following we will use the OCV dataset with 15 min relaxation time and a SoC-resolution of 1%.
3.5. Direct Comparison of CC-ICA and OCV-ICA
To evaluate the diagnostic capability of OCV-ICA versus conventional CC-ICA, a direct comparison was performed for cells aged to 80% SoH at both 5 and 45°C. The results are shown in Figure 10. The dQ/dV from both approaches show very similar patterns for both, new and aged cells. All main features are preserved for OCV-ICA. The shifts in voltage between CC-ICA and OCV-ICA are caused by the small polarization at low constant currents. This shift may increase through ageing and an increase in internal resistance, however, for this specific cell the increase in internal resistance upon ageing is low [14]. This provides a proof of concept for using OCV-ICA as a diagnostic tool similar to CC-ICA.
4. Discussion
This work introduces the concept of OCV-ICA as a potential diagnostic tool and presents a proof of concept for the feasibility and applicability of OCV-ICA as an alternative to CC-ICA. Using an excerpt of a large-scale cycle-life study, we investigated and directly compared the diagnostic capability of OCV-ICA vs CC-ICA, as well as the influence of selected parameters onto the results. The results presented in Figure 10 clearly illustrate that OCV-ICA reproduces the main features and trends for cells aged under different conditions. The main noticeable difference is the voltage shift due to the polarization during CC for CC-ICA.
One of the main advantages of OCV-ICA is the potential for a significant reduction in measurement time. While the “true” OCV at any SoC is assumed to be reached only after a long relaxation time of several hours, resulting in very time-consuming experiments (see Table 1), the presented results (Figure 8) illustrate that for OCV-ICA it is not the absolute “true” OCV-curve that matters, but that there is a minimum required relaxation time, resulting in a “good enough” OCV-ICA curve. This opens for a range of possibilities in further optimizing relaxation times with respect to minimizing the total measurement time, including, e.g., the investigation of SoC-dependent relaxation times as well as the extrapolation of initial relaxations to a standard relaxation time of e.g., 60 minutes. The presented examples on relaxation times and their influence on the resulting IC curves (Figure 8) illustrate that even relaxation times as short as 15 minutes per SoC step give comparable IC curve as the longer 30 min relaxation. Even the shorter 5 minutes relaxation time gives a consistently lower voltage shift than the conventional CC-ICA curves.
Similarly, measurement time can be reduced by reducing the number of measurement points across the SoC window. The influence of SoC resolution on the quality of the obtained OCV-ICA curves is illustrated in Figure 9. While a sufficiently high SoC resolution is required across highly predictive features intended to be used for subsequent diagnostic analysis, a reduction of SoC resolution seems feasible across SoC-ranges showing lower variation in the dQ/dV.
Total test times for selected parameters for both, OCV-ICA and CC-ICA are summarized in Table 1. We observe that e.g., 5 minutes relaxation with 1% SoC steps can be measured in less than 24 hours, while the conventional 0.05C CC-ICA tests will take at least 40 hours (exhibiting a larger voltage shift).
In addition to the preliminary experiments presented here, there is a large literature base on establishing methods for high-precision SoC estimation based on reconstruction of OCV [12]. These OCV curves are applied to BMSs for improved SoC estimation. By learning from these methods, OCV-ICA curves may be measured even faster.
Within standard cell testing using high-accuracy equipment in the laboratory, CC-ICA may still be superior due to the high sampling rate and consequently very high data resolution across the entire SoC range. However, the aspect of longer measurement times for performing a full high-quality CC-ICA of more than 40 hours at a low 0.05C current, and the possibility to significantly reduce this time, make OCV-ICA a viable addition to diagnostic data collection also in laboratory environments.
However, the main benefits of OCV-ICA can be exploited outside of high-precision laboratory environments where a constant current is challenging to obtain. Any current pulse being either constant current or power, and the following OCV relaxation, can yield an OCV measurement point that can then be accumulated into an OCV curve usable for OCV-ICA. Provided the voltage resolution within a system’s BMS is sufficiently high, individual OCV-ICA curves can then be achieved for any local cell parallel within the module or pack. This opens for exploiting the natural breaks within a battery system’s operational profile. By collecting these randomized “natural” OCV points across a necessary time period (i.e., one week), a “complete” OCV curve with the required resolution for subsequent OCV-ICA can be obtained (Figure 1). This can enable the possibility to perform online diagnostics on every cell parallel in a battery system without operational interruption.
Author Contributions
Conceptualization, Julia Wind and Preben Vie; Experiments & formal analysis, Preben Vie; Visualization, Julia Wind; Writing—original draft, review & editing, Julia Wind and Preben Vie. All authors have read and agreed to the published version of the manuscript.
Funding
The authors acknowledge the Research Council of Norway and partner companies of the projects BattMarine (Grant No. 281005), MoreIsLess (Grant No. 324077) and 2ND LIFE (Grant No. 320760) for financial support.
Data Availability Statement
The original data presented in the study are included in the article’s supplementary material, further inquiries can be directed to the corresponding author/s. This includes:
- .csv of differently obtained OCV curves
- .csv of selected dQ/dV curves
- .csv of lifetime data
Conflicts of Interest
The authors declare no conflicts of interest. The funders had no role in the design of the study; in the collection, analyses, or interpretation of data; in the writing of the manuscript; or in the decision to publish the results.
References
- Lian, T.; Vie, P.J.S.; Gilljam, M.; Forseth, S. (Invited) Changes in Thermal Stability of Cyclic Aged Commercial Lithium-Ion Cells. ECS Transactions 2019, 89, 73–81. [Google Scholar] [CrossRef]
- Ratnakumar, B.V.; Smart, M.C. Lithium Plating Behavior in Lithium-ion Cells. In Rechargeable Lithium-Ion Batteries, Winter, M., Doughty, D.H., Zaghib, K., Abraham, K.M., Ogumi, Z., Dudney, N.J., Eds. Electrochemical Soc Inc: Pennington, 2010; Vol. 25, pp. 241–252.
- Smith, A.J.; Fang, Y.; Mikheenkova, A.; Ekstrom, H.; Svens, P.; Ahmed, I.; Lacey, M.J.; Lindbergh, G.; Furo, I.; Lindstrom, R.W. Localized lithium plating under mild cycling conditions in high-energy lithium-ion batteries. Journal of Power Sources 2023, 573, 15. [Google Scholar] [CrossRef]
- Cabrera-Castillo, E.; Niedermeier, F.; Jossen, A. Calculation of the state of safety (SOS) for lithium ion batteries. Journal of Power Sources 2016, 324, 509–520. [Google Scholar] [CrossRef]
- Goldammer, E.; Kowal, J. Investigation of degradation mechanisms in lithium-ion batteries by incremental open-circuit-voltage characterization and impedance spectra. In Proceedings of 17th IEEE Vehicle Power and Propulsion Conference (VPPC), Electr Network, Nov 18-Dec 16.
- Yin, L.T.; Geng, Z.Y.; Chien, Y.C.; Thiringer, T.; Lacey, M.J.; Andersson, A.M.; Brandell, D. Implementing intermittent current interruption into Li-ion cell modelling for improved battery diagnostics. Electrochimica Acta 2022, 427, 12. [Google Scholar] [CrossRef]
- Dubarry, M.; Svoboda, V.; Hwu, R.; Liaw, B.Y. Incremental capacity analysis and close-to-equilibrium OCV measurements to quantify capacity fade in commercial rechargeable lithium batteries. Electrochem. Solid State Lett. 2006, 9, A454–A457. [Google Scholar] [CrossRef]
- Olson, J.Z.; López, C.M.; Dickinson, E.J.F. Differential Analysis of Galvanostatic Cycle Data from Li-Ion Batteries: Interpretative Insights and Graphical Heuristics. Chem. Mat. 2023, 35, 1487–1513. [Google Scholar] [CrossRef]
- Takano, K.; Saito, Y.; Kanari, K.; Nozaki, K.; Kato, K.; Negishi, A.; Kato, T. Entropy change in lithium ion cells on charge and discharge. Journal of Applied Electrochemistry 2002, 32, 251–258. [Google Scholar] [CrossRef]
- Petzl, M.; Danzer, M.A. Advancements in OCV Measurement and Analysis for Lithium-Ion Batteries. IEEE Trans. Energy Convers. 2013, 28, 675–681. [Google Scholar] [CrossRef]
- Blanc, J.; Schaeffer, E.; Auger, F.; Diab, Y.; Cousseau, J.F. A new time-adjustable model-based method for fast open-circuit voltage estimation of Lithium-ion cells. Journal of Power Sources 2023, 586, 12. [Google Scholar] [CrossRef]
- Zhou, M.Y.; Zhang, J.B.; Ko, C.J.; Chen, K.C. Precise prediction of open circuit voltage of lithium ion batteries in a short time period. Journal of Power Sources 2023, 553, 11. [Google Scholar] [CrossRef]
- Prosser, R.; Offer, G.; Patel, Y. Lithium-Ion Diagnostics: The First Quantitative In-Operando Technique for Diagnosing Lithium Ion Battery Degradation Modes under Load with Realistic Thermal Boundary Conditions. Journal of the Electrochemical Society 2021, 168, 14. [Google Scholar] [CrossRef]
- Spitthoff, L.; Vie, P.J.S.; Wahl, M.S.; Wind, J.; Burheim, O.S. Incremental Capacity Analysis (dQ/dV) as a Tool for Analysing the Effect of Ambient Temperature And Mechanical Clamping on Degradation. Journal of Electroanalytical Chemistry 2023. [Google Scholar] [CrossRef]
Figure 1.
Illustration of the concept of OCV-ICA applied to operational data. OCV data is extracted from (a) and the OCV is reconstructed from relaxation data, while ICA is further calculated from the OCV curve (b). Changes in OCV-ICA due to ageing are compared in (c).
Figure 1.
Illustration of the concept of OCV-ICA applied to operational data. OCV data is extracted from (a) and the OCV is reconstructed from relaxation data, while ICA is further calculated from the OCV curve (b). Changes in OCV-ICA due to ageing are compared in (c).
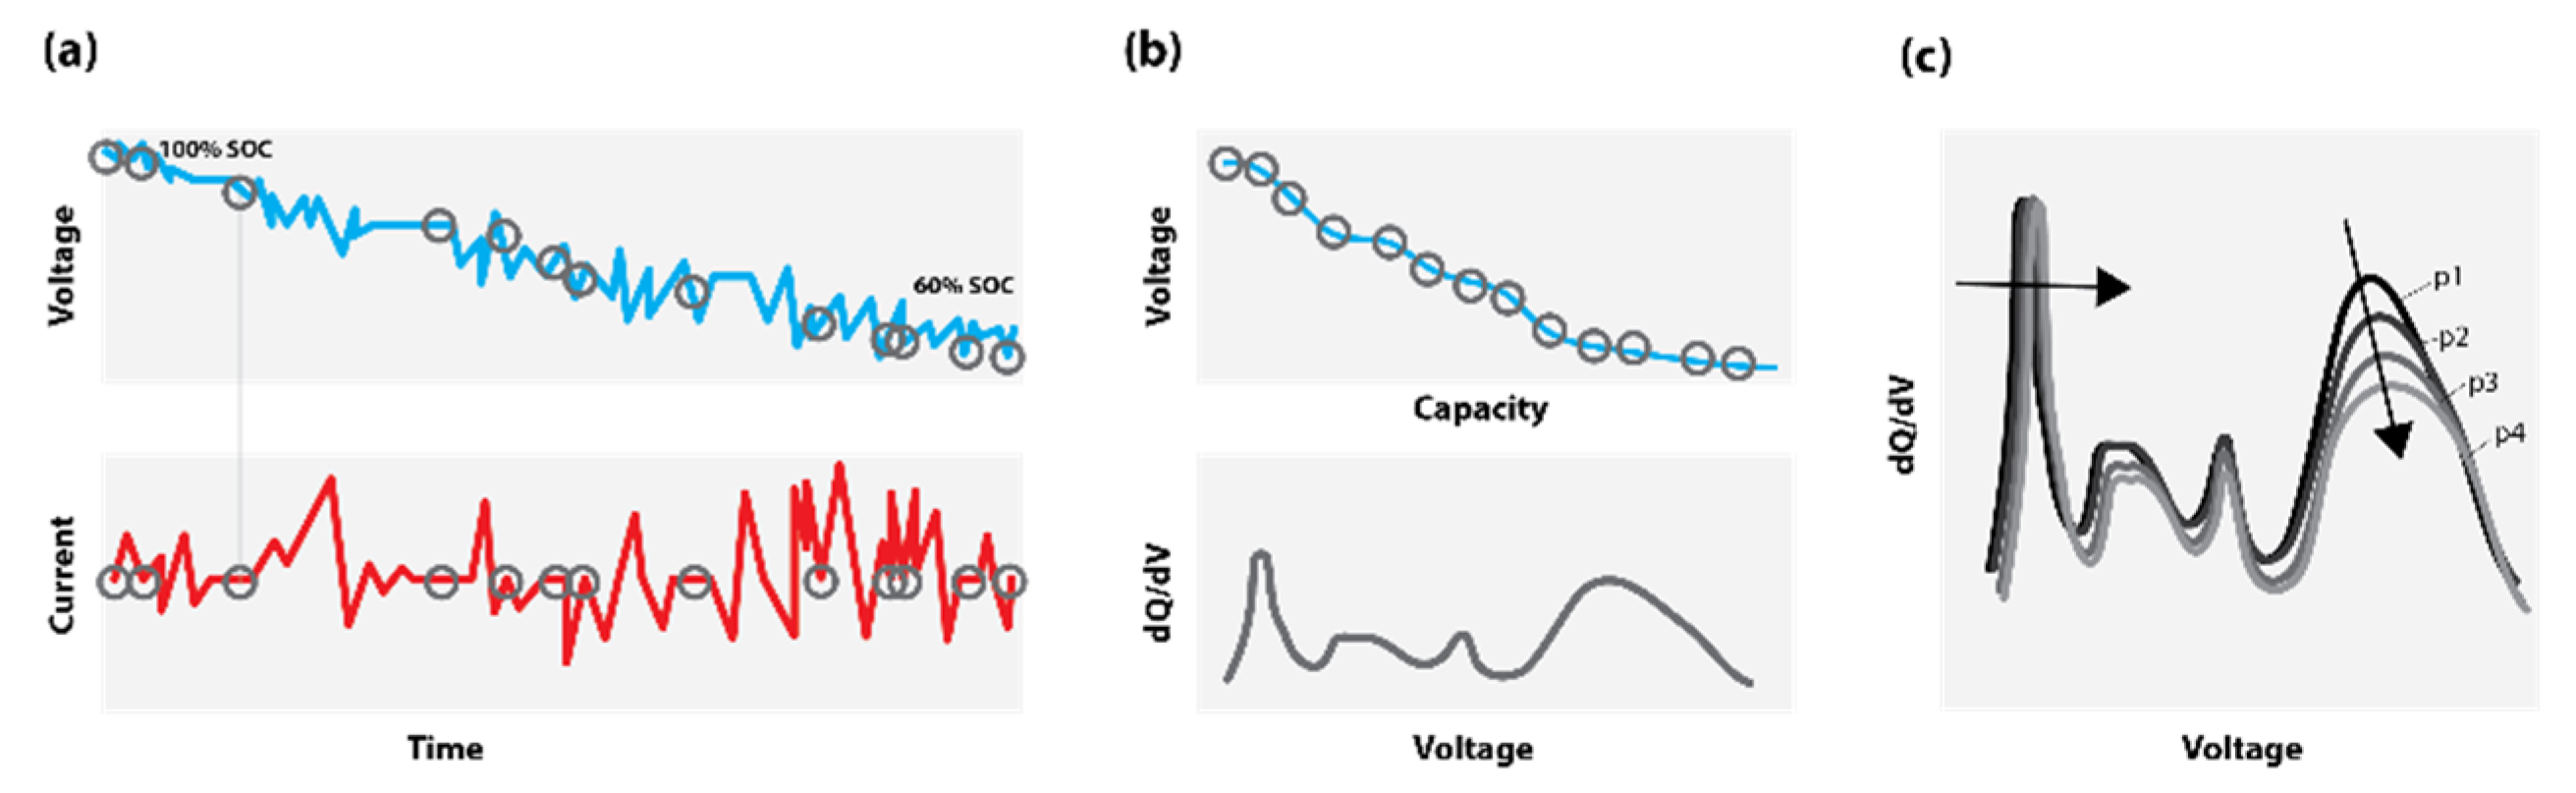
Figure 2.
Measurement setup: pouch cell mounted in the mechanical fixture including clamps for current on the cell tab as well as voltage sense.
Figure 2.
Measurement setup: pouch cell mounted in the mechanical fixture including clamps for current on the cell tab as well as voltage sense.
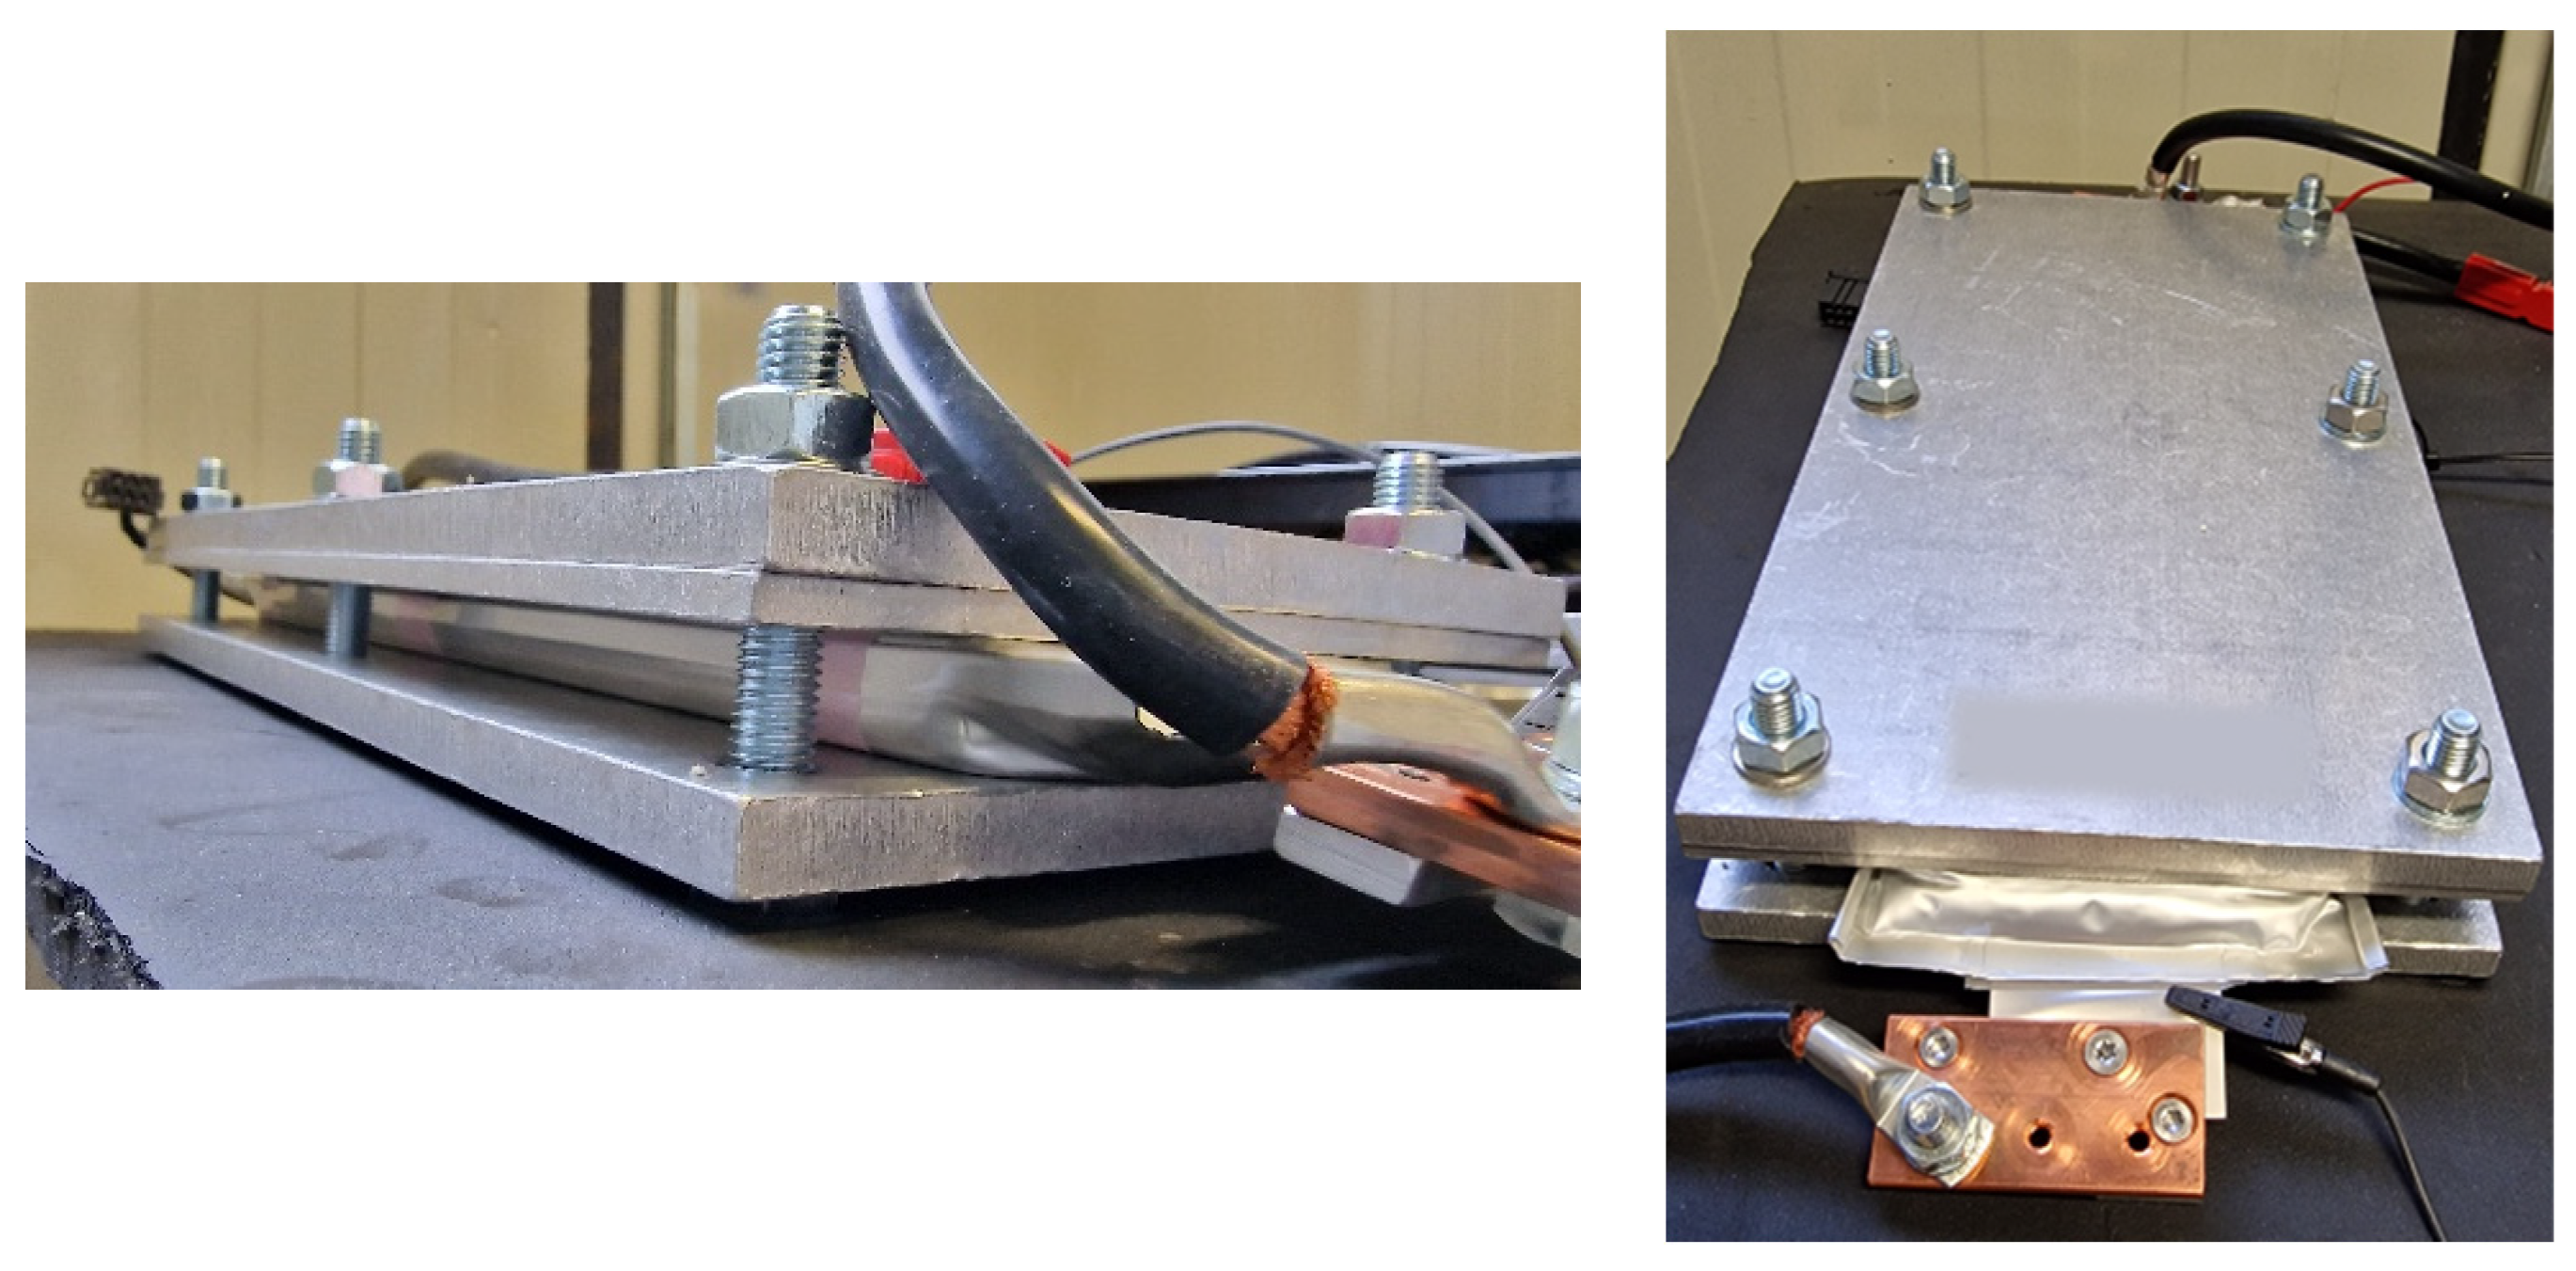
Figure 3.
Cycle life for cells cycled at 0.75C in the full SoC window at different temperatures.
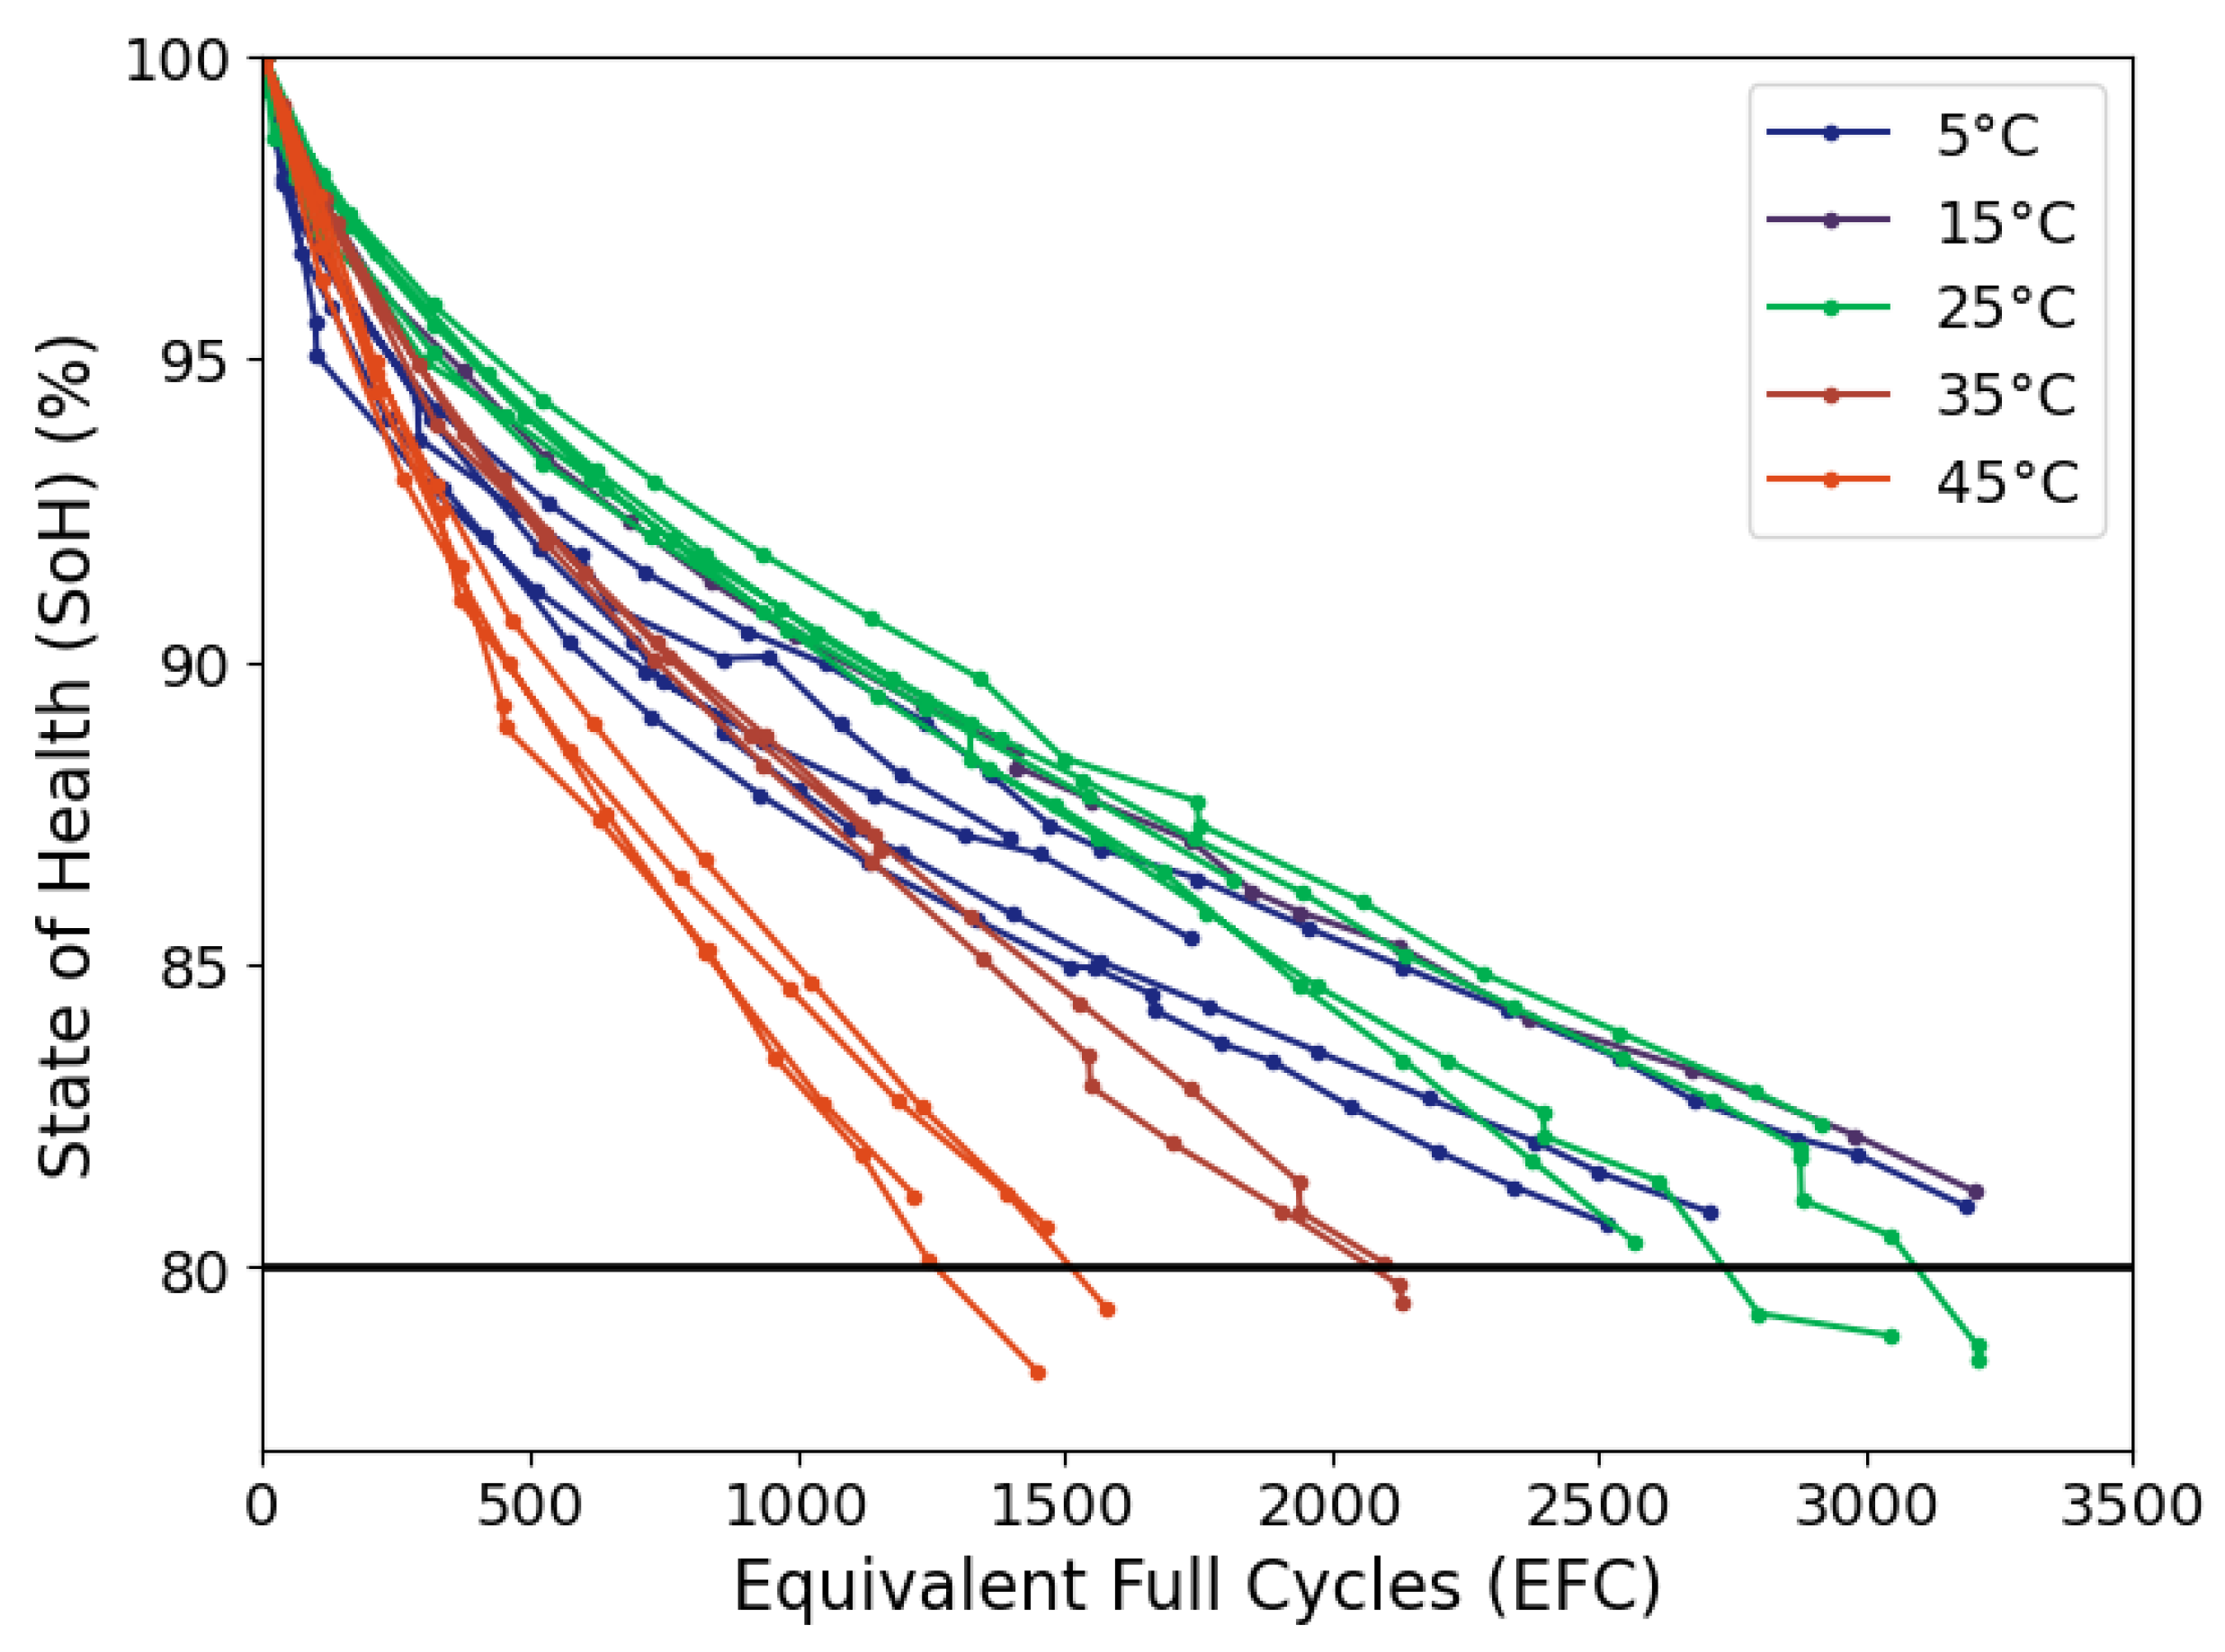
Figure 4.
Evolution of the dQ/dV for a cell cycled at 25°C from 100% to 80% SoH.

Figure 5.
Changes to the dQ/dV for cells aged at 5°C from 100% to 80% SoH.
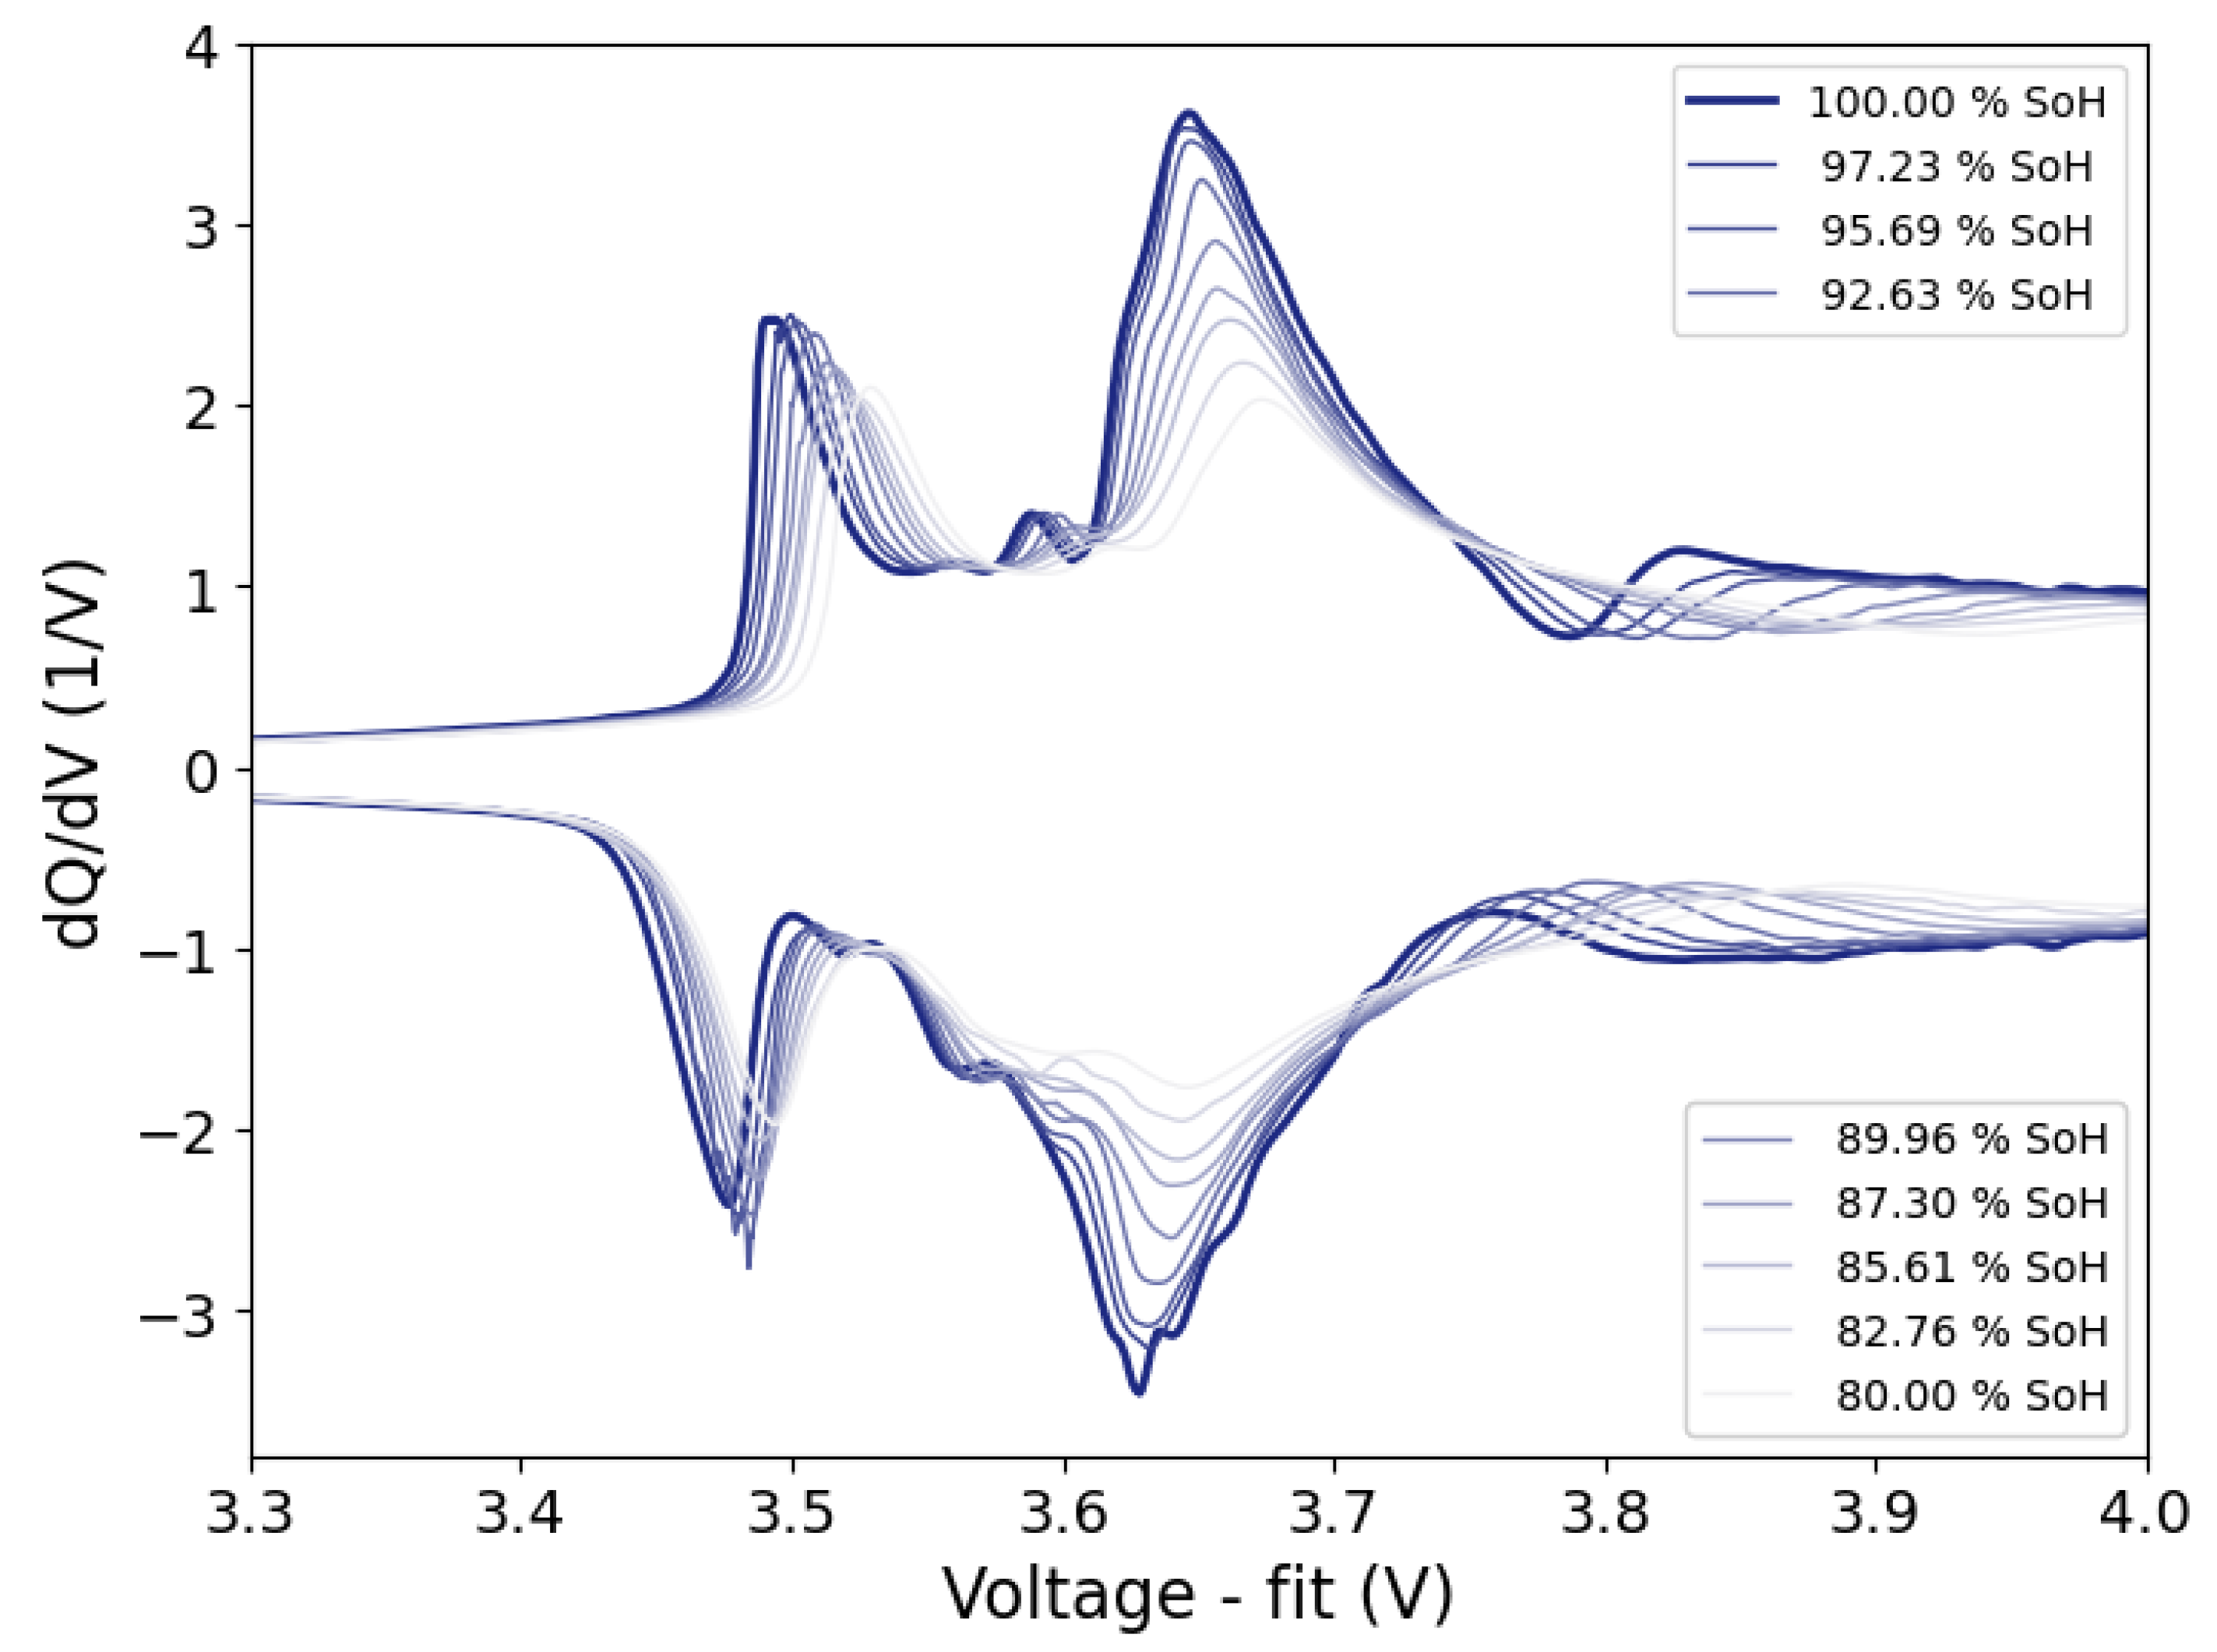
Figure 6.
Changes to the dQ/dV for cells aged at 45°C from 100% to 80% SoH.
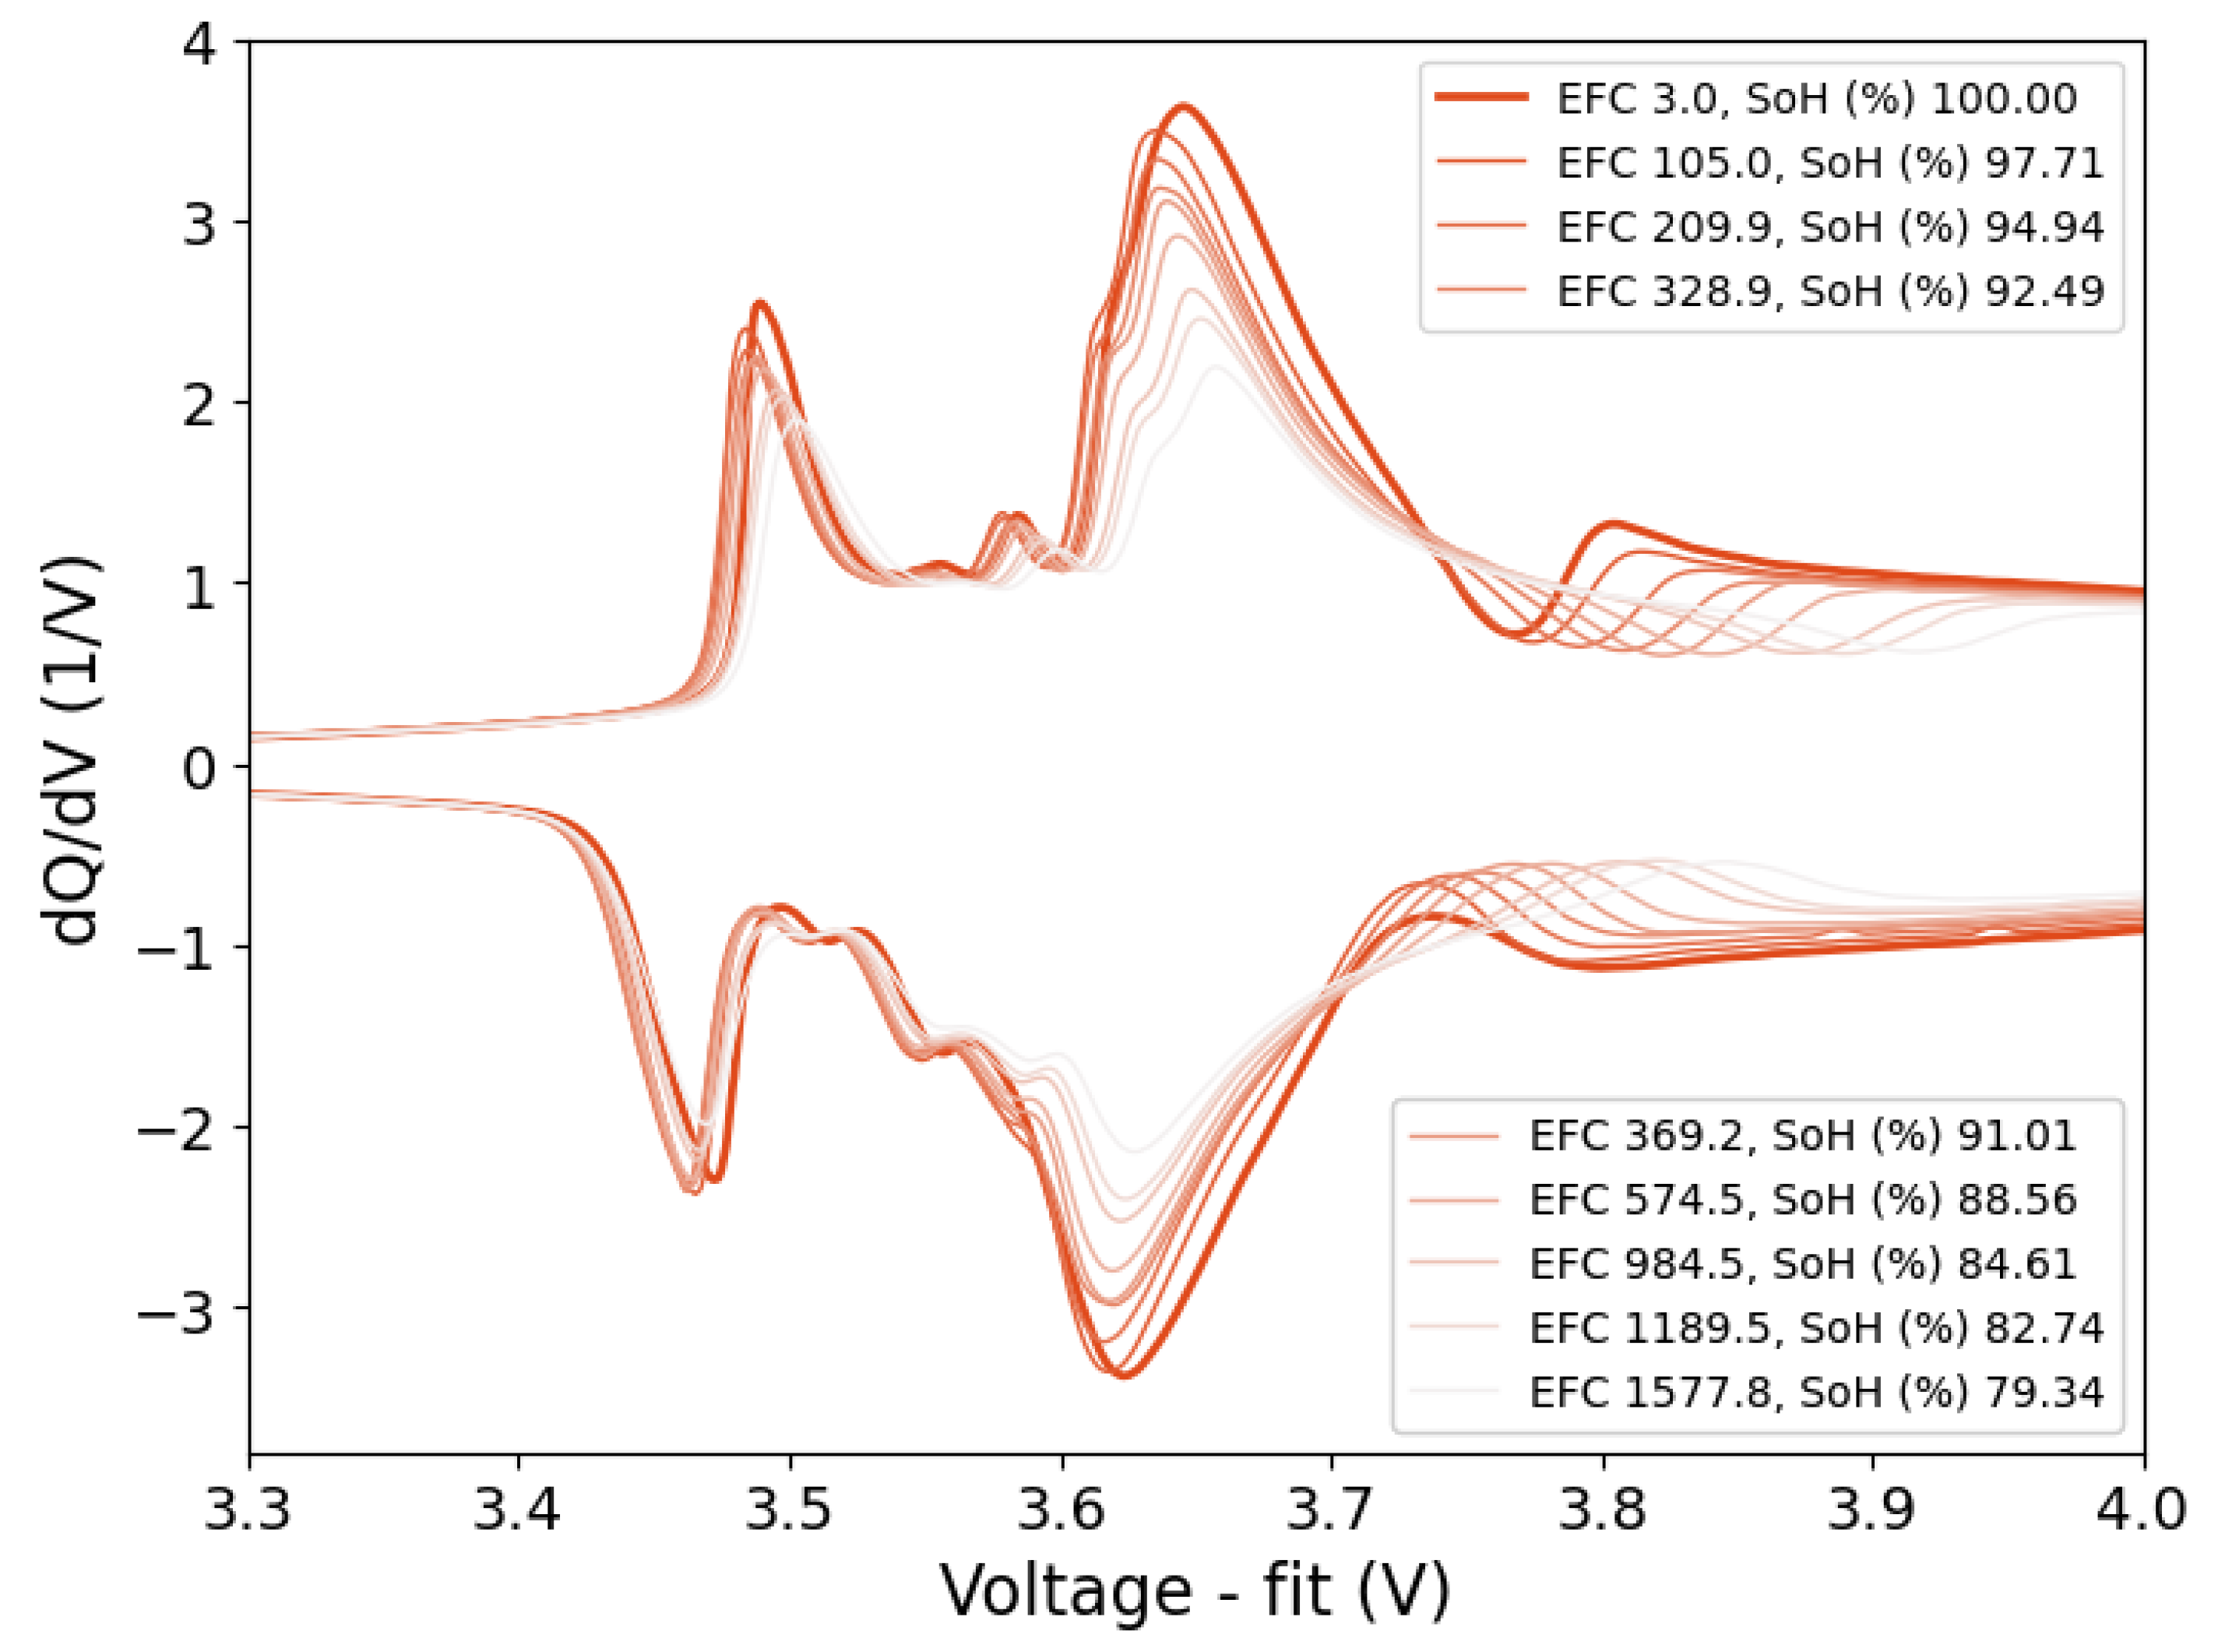
Figure 7.
Direct comparison of C/20, C/100, and current pulse OCV curves.
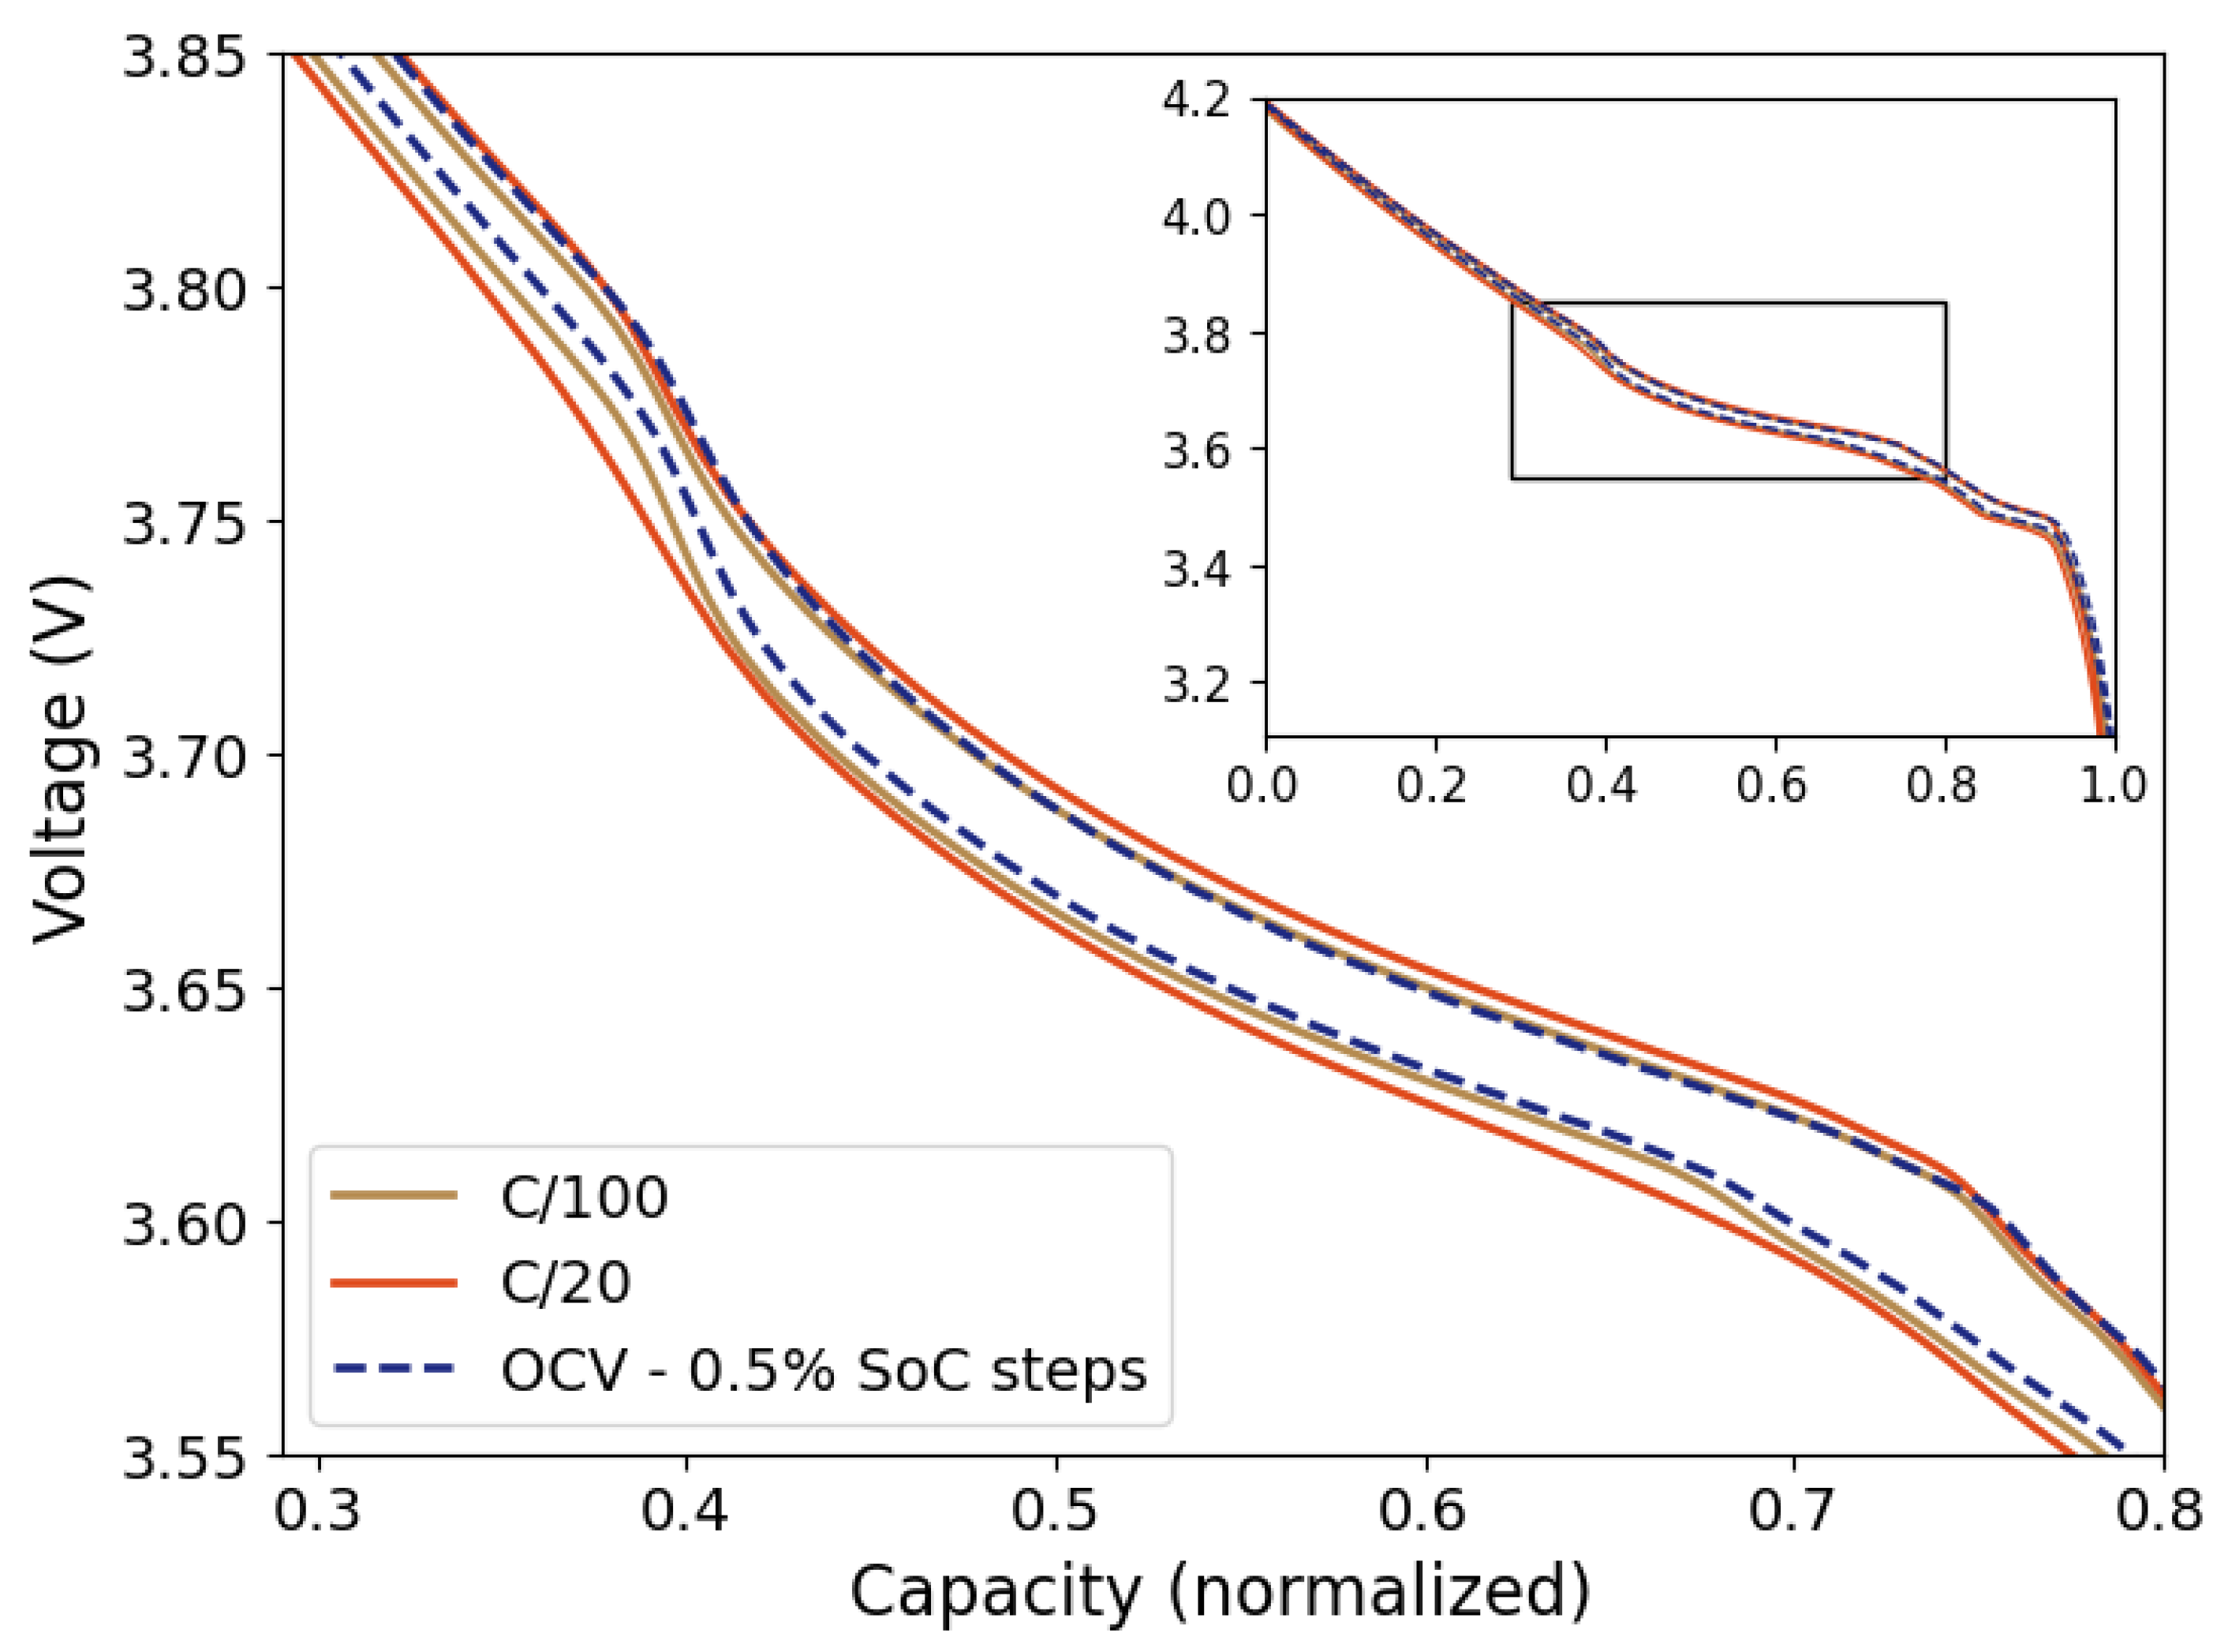
Figure 8.
Influence of relaxation times on the resulting OCV-dQ/dV. Left: zoom into the selected region marked on the right.
Figure 8.
Influence of relaxation times on the resulting OCV-dQ/dV. Left: zoom into the selected region marked on the right.
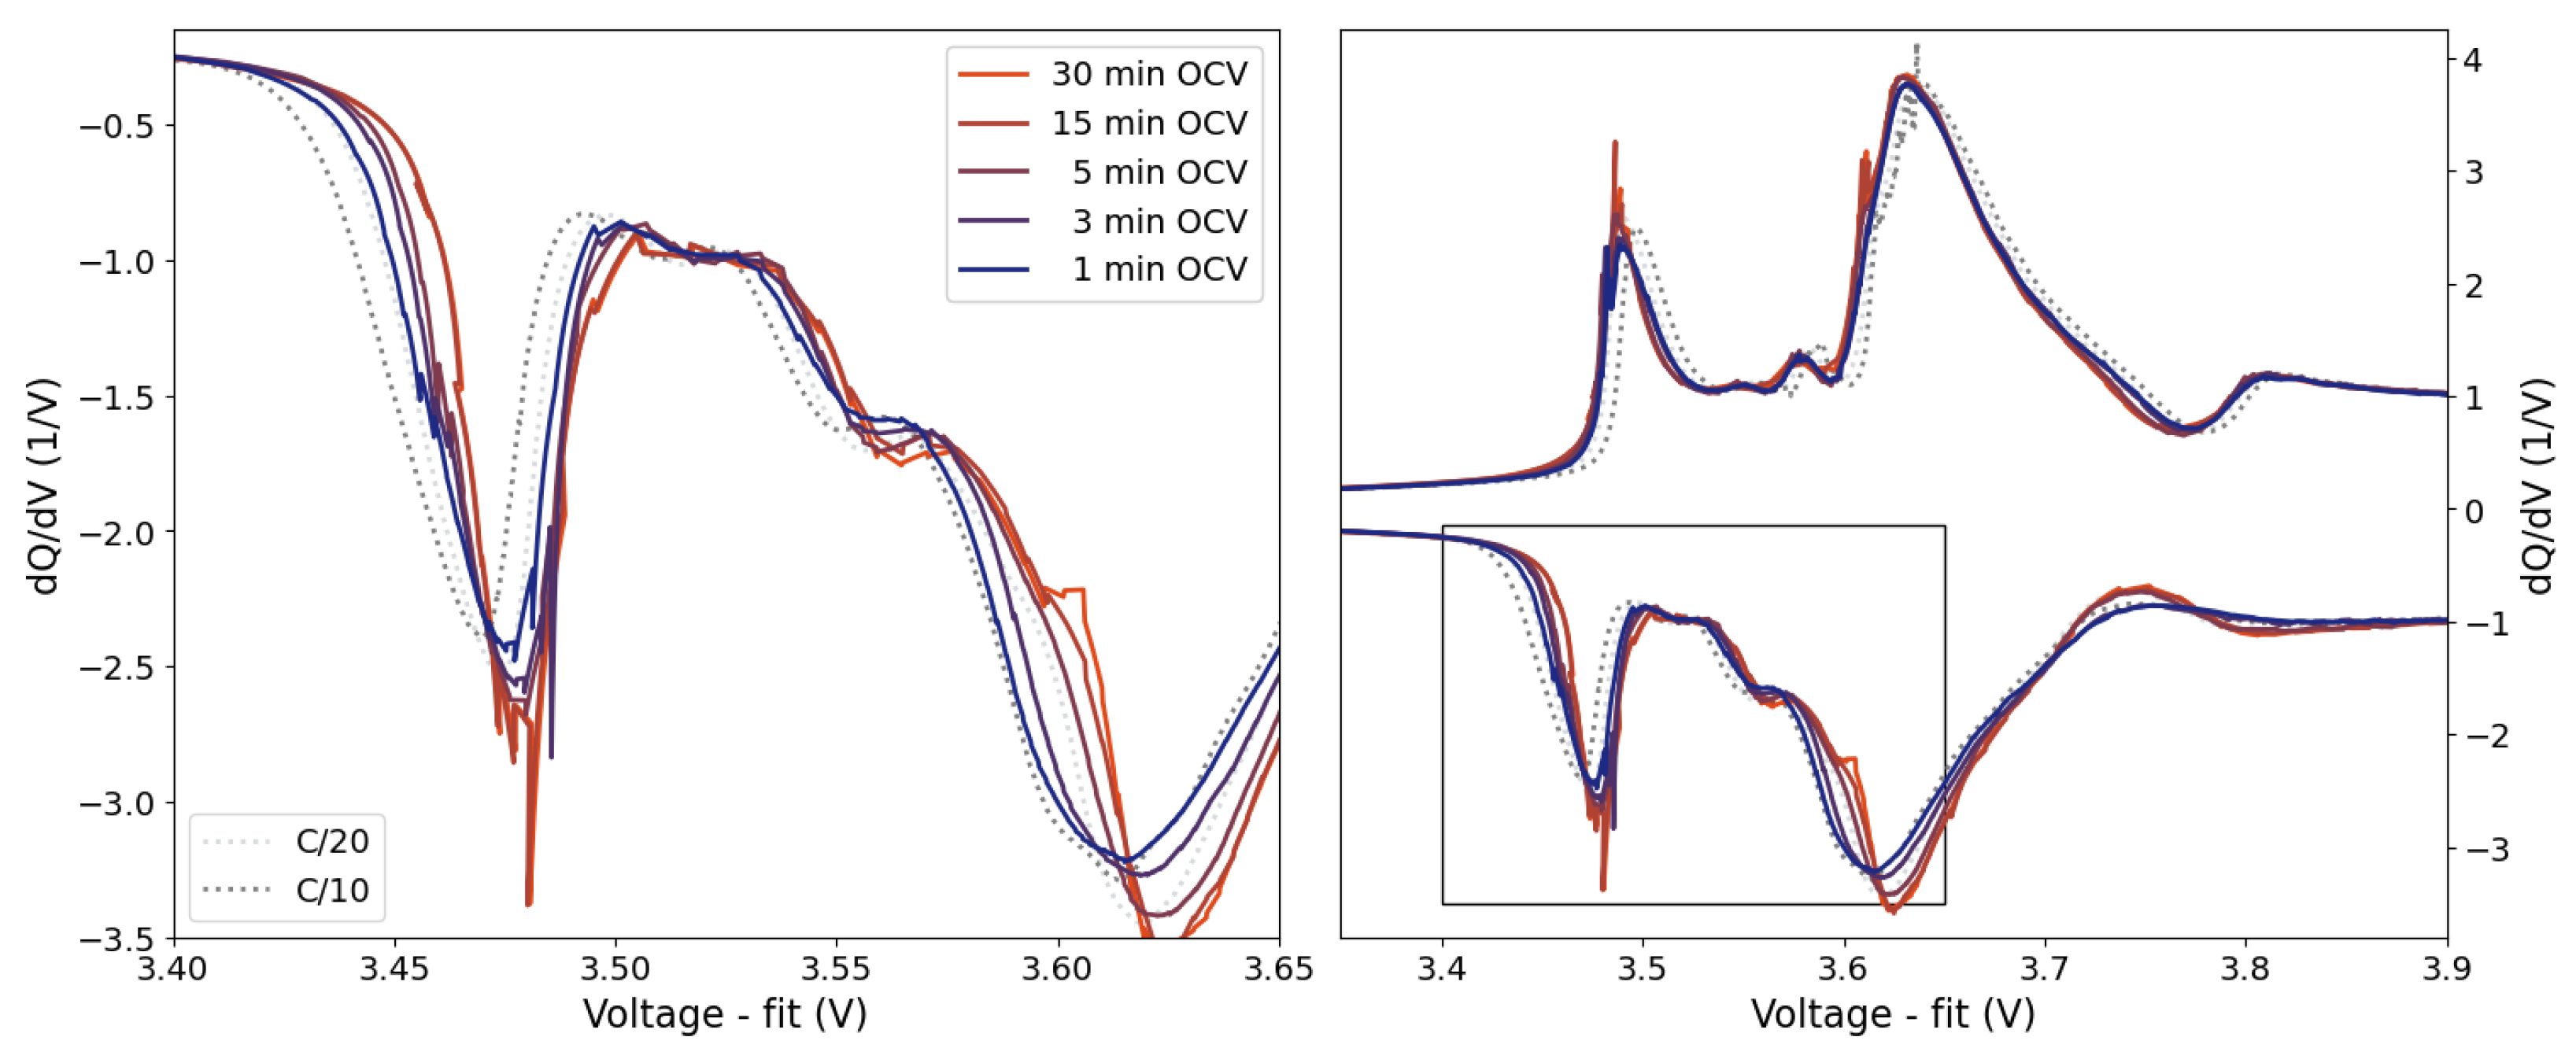
Figure 9.
Influence of SoC resolution on the resulting OCV-dQ/dV curves.
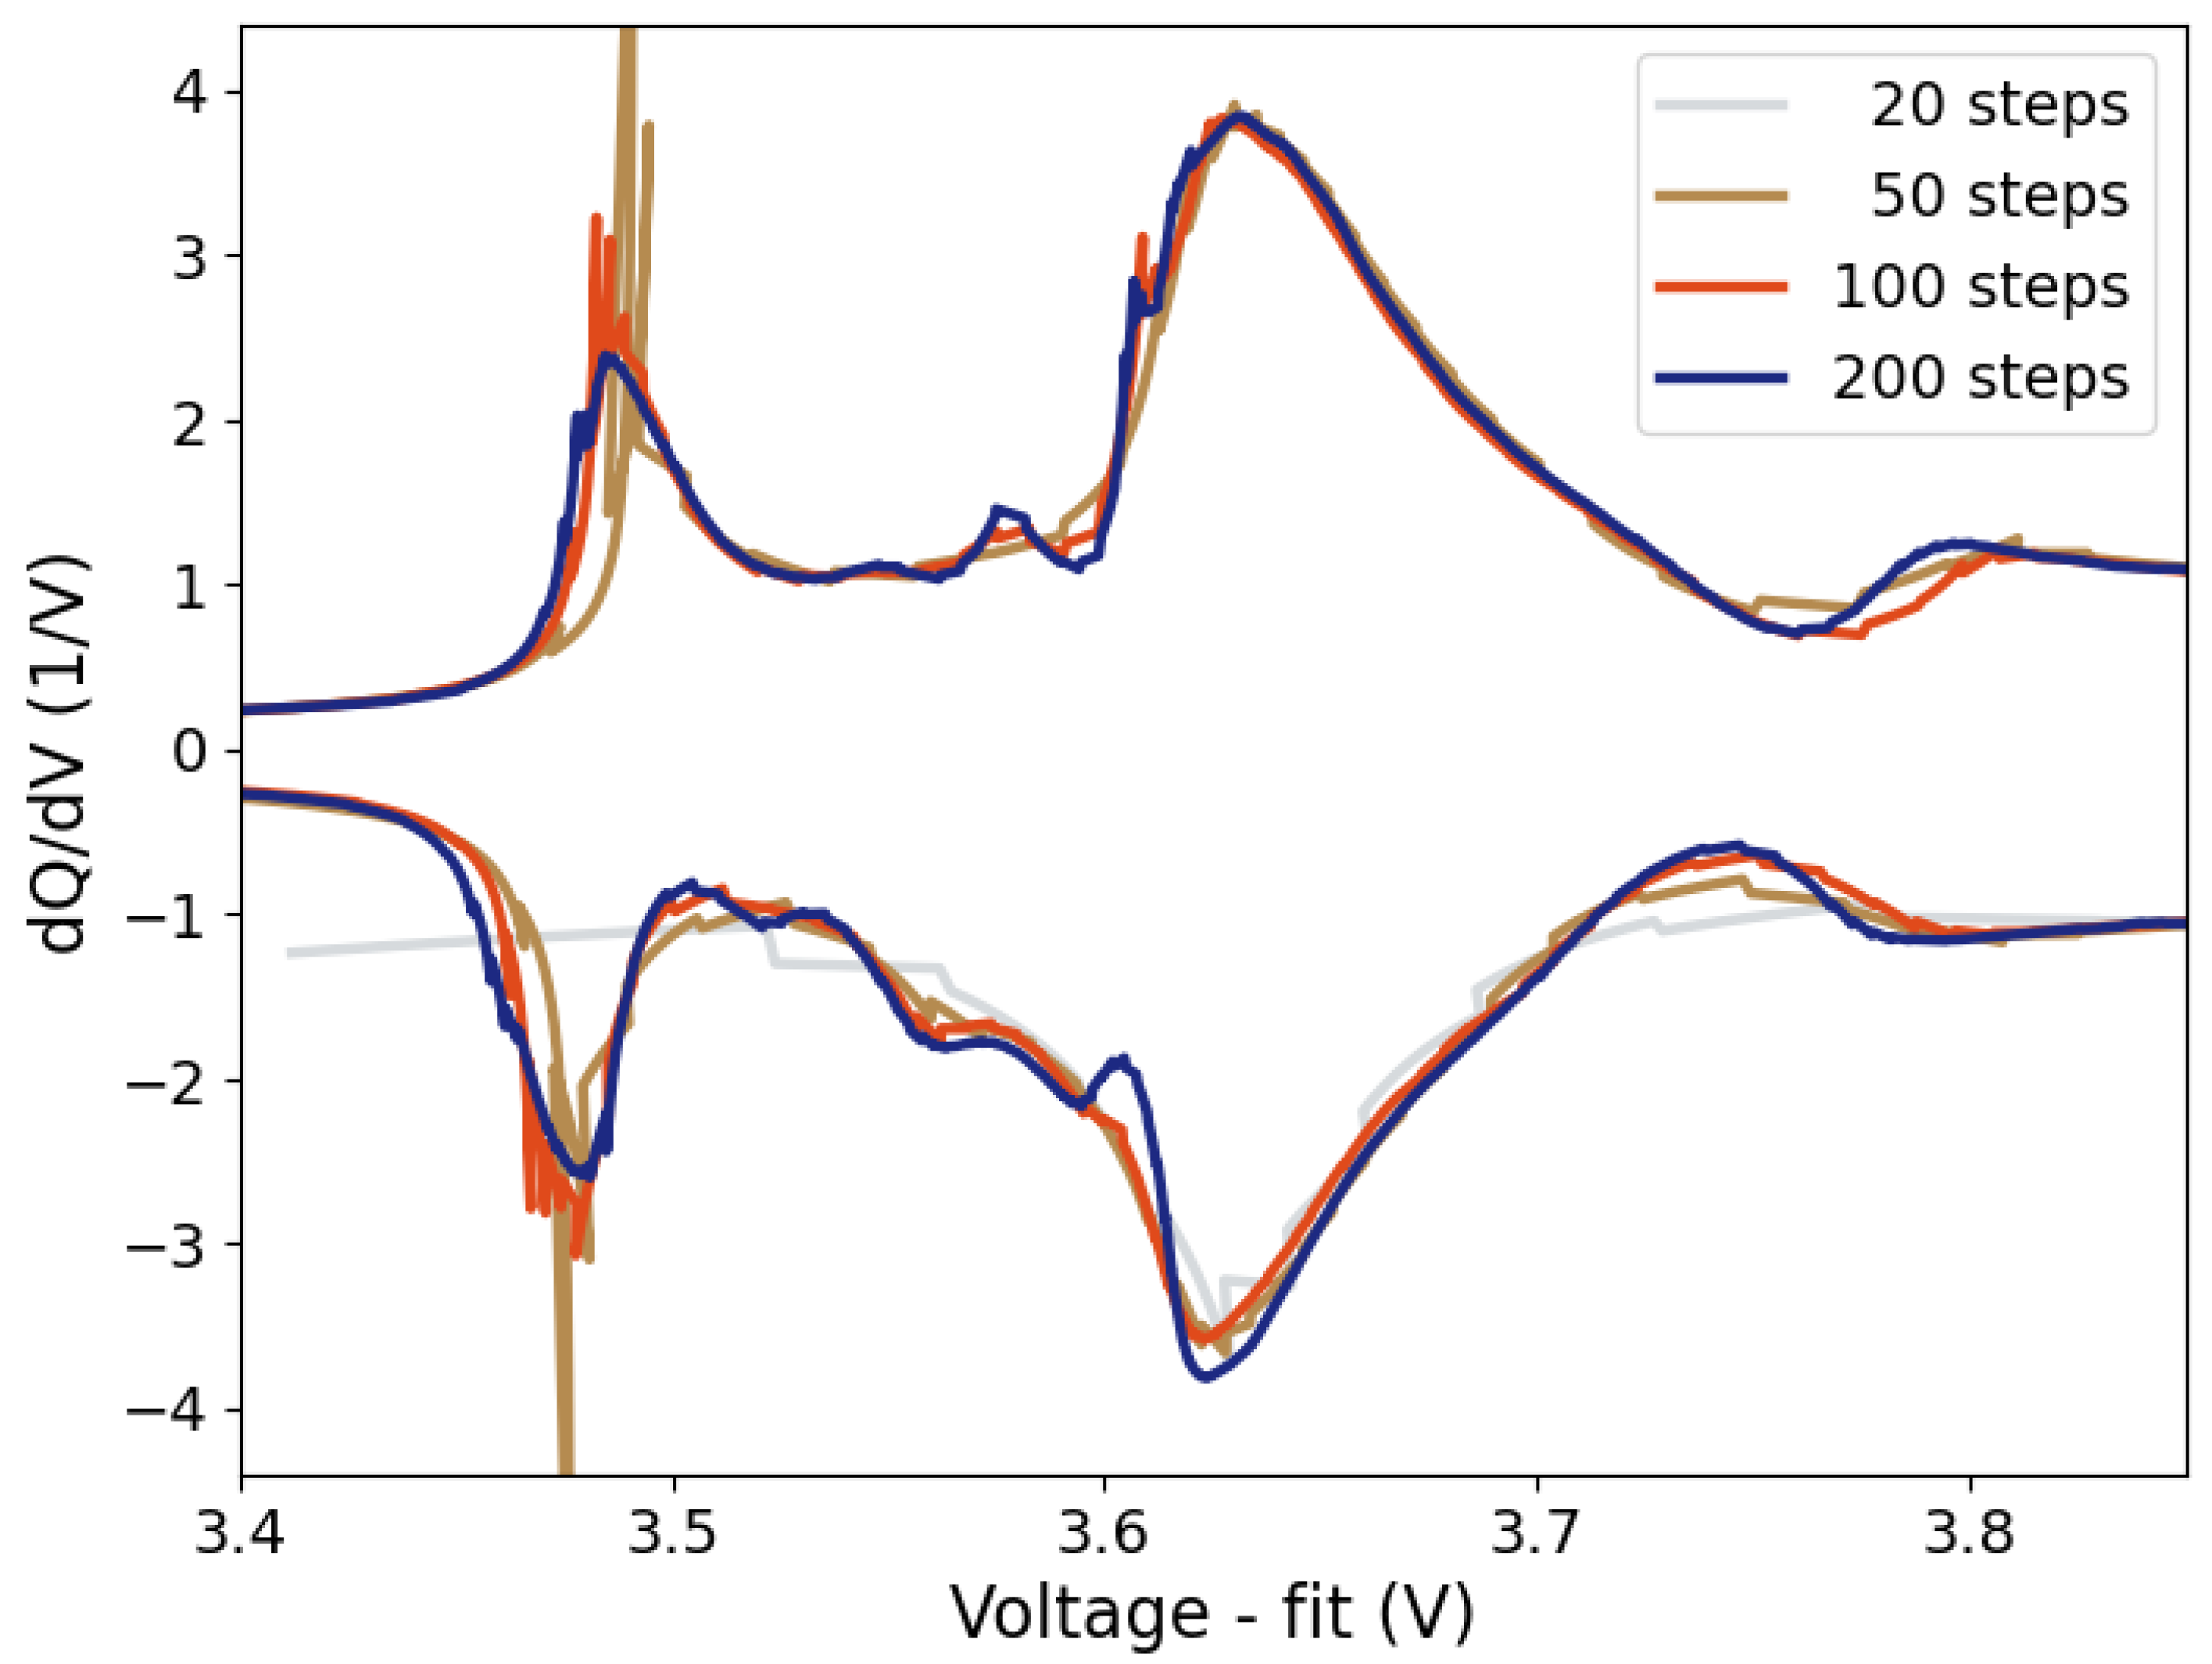
Figure 10.
Direct comparison of CC-ICA and OCV-ICA at 100% SoH (grey) and 80% SoH for cells aged at 5°C (blue) and 45°C (red).
Figure 10.
Direct comparison of CC-ICA and OCV-ICA at 100% SoH (grey) and 80% SoH for cells aged at 5°C (blue) and 45°C (red).
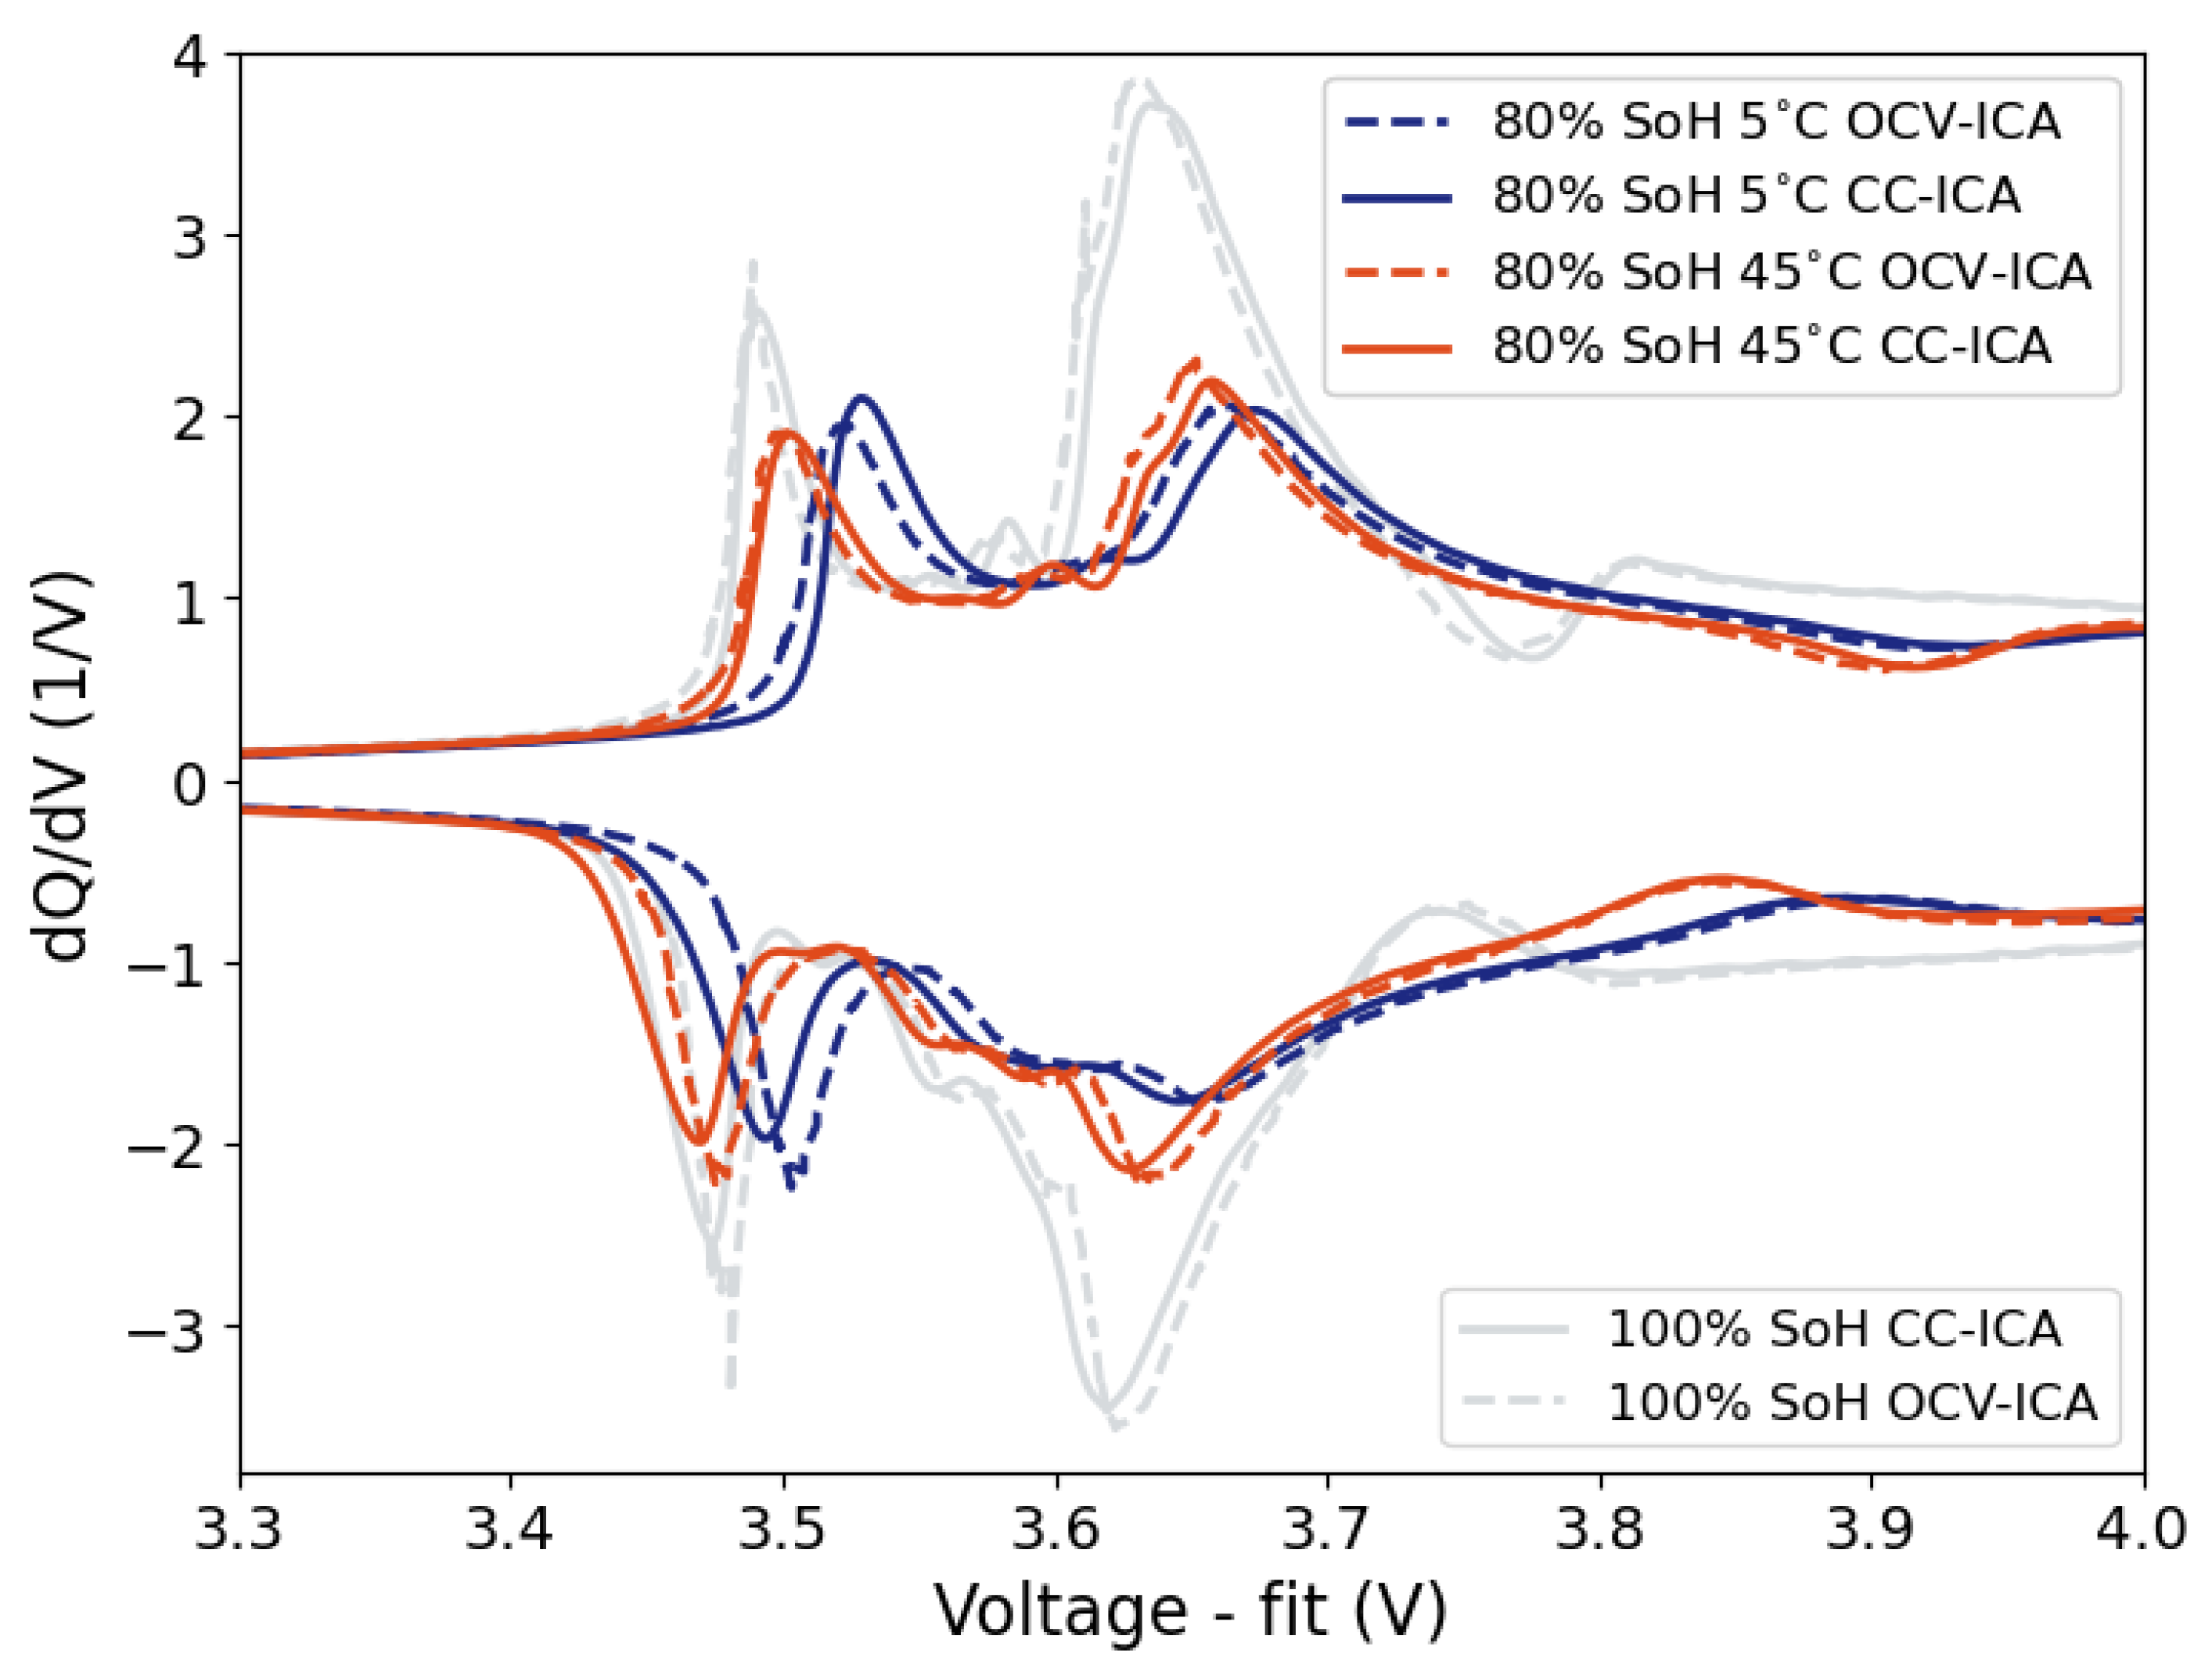

Table 1.
Comparison of estimated test time for an OCV-ICA test with 0.5C pulse current with different OCV relaxation times and SoC resolution for both charge and discharge compared to CC-ICA tests with 0.05 and 0.01C.
Table 1.
Comparison of estimated test time for an OCV-ICA test with 0.5C pulse current with different OCV relaxation times and SoC resolution for both charge and discharge compared to CC-ICA tests with 0.05 and 0.01C.
| Test type | SoC resolution (%) | OCV time (min) | Total test time (days) |
|---|---|---|---|
| OCV | 1 | 1 | 0.3 |
| OCV | 1 | 3 | 0.6 |
| OCV | 1 | 5 | 0.9 |
| OCV | 1 | 15 | 2.3 |
| OCV | 1 | 30 | 4.3 |
| OCV | 0.5 | 1 | 0.4 |
| OCV | 0.5 | 5 | 1.6 |
| OCV | 0.5 | 15 | 4.3 |
| OCV | 0.5 | 30 | 8.5 |
| OCV | 0.5 | 60 | 16.8 |
| CC-0.05C | 1.7 | ||
| CC-0.01C | 8.3 |
Disclaimer/Publisher’s Note: The statements, opinions and data contained in all publications are solely those of the individual author(s) and contributor(s) and not of MDPI and/or the editor(s). MDPI and/or the editor(s) disclaim responsibility for any injury to people or property resulting from any ideas, methods, instructions or products referred to in the content. |
© 2024 by the authors. Licensee MDPI, Basel, Switzerland. This article is an open access article distributed under the terms and conditions of the Creative Commons Attribution (CC BY) license (http://creativecommons.org/licenses/by/4.0/).
Copyright: This open access article is published under a Creative Commons CC BY 4.0 license, which permit the free download, distribution, and reuse, provided that the author and preprint are cited in any reuse.


