Submitted:
26 June 2024
Posted:
27 June 2024
You are already at the latest version
Abstract
This research evaluates the technical and financial feasibility of using Inhibitor A for brine treatment in geothermal energy production, comparing it with traditional brine acidification. Conducted at a geothermal site in Central Java, Indonesia, the study uses Decision Tree Analysis and risk Expected Monetary Value (EMV) to assess both methods. Inhibitor A demonstrates a 70% reduction in scaling compared to untreated brine, with laboratory tests indicating a 10 ppm dosage as optimal for minimizing silica scaling. Despite higher initial costs, Decision Tree Analysis shows that Inhibitor A has a lower overall risk profile than acidification. EMV analysis confirms its cost-efficiency when considering potential risks and benefits. This research advocates for the adoption of Inhibitor A, highlighting its long-term benefits and sustainability over traditional methods. The findings emphasize the importance of innovative solutions in enhancing geothermal energy systems’ efficiency and sustainability. By integrating technical performance with financial analysis, this study provides a comprehensive evaluation to inform decision-making in the geothermal sector, promoting more effective and sustainable brine treatment practices.
Keywords:
silica
; antiscalant
; phosphinocarboxylic
; geothermal
; brine
1. Introduction
Indonesia is one of the countries with the largest geothermal energy potentials in the world, with an estimated value of 29 GWe. This potential is derived from speculative resources, hypothetical resources, possible reserves, probable reserves, and proven reserves [1]. The geothermal energy resources are distributed across 312 different locations throughout Indonesia. The Indonesian government has set a target for geothermal energy to contribute 9.7% to the energy mix by 2050, a significant increase from the 5.4% contribution in 2023 [2]. By 2050, it is anticipated that 59% of Indonesia’s geothermal potential will be utilized [3].
One notable geothermal site in Indonesia is located on Java Island, which produces water with a high silica content ranging from 900 to 1,300 mg/L. The high silica content is due to the water-dominated nature of the produced fluid, leading to silica deposition inside the pipes, which can disrupt the operation of geothermal power plants [4]. Deposition within the pipes is easier to clean compared to the reinjection wells, due to lower brine temperatures [5].
The production well system consists of several components: the production well system, the production system, and the brine system. The fluid produced by the geothermal reservoir flows into the production well system, where it is separated into two phases: water and steam. The steam is directed to the production system, while the water is directed to the brine system. In the production well and production system, the fluid maintains high pressure and temperature, but in the brine system, the temperature gradually decreases, and the pressure drops to atmospheric levels [6].
Minimizing the possibility of silica deposition in high-temperature fluid systems is essential [7]. As the geothermal fluids cool, the silica saturation index (SSI) increases, leading to deposition, particularly in the Atmospheric Flash Tank (AFT) and associated pipes [8,9,10]. Weres et al. in 1982 investigated the polymerization of silicic acid, delineating two fundamental processes: the initial formation of colloidal particles through homogeneous nucleation and subsequent growth through the deposition of dissolved silica [11]. To address this issue, pH modification especially brine acidification techniques have been implemented to slow down the deposition rate inside the pipes by maintaining monomeric silica in the brine [12,13]. However, this method can cause deposition within reinjection wells, leading to high cleaning costs and additional issues such as corrosion and environmental impacts [14,15,16,17]. However, Hauksson et al. in 2023 discovered that the brine acidification method proved ineffective for arsenic removal [18]. This ineffectiveness is attributed to the low solubility of arsenic sulfide at low pH levels, even though the brine itself contains a high concentration of arsenic sulfide. This finding challenges the assumption that lowering the pH of brine would enhance the solubility and removal of arsenic compounds, highlighting the need for alternative approaches to address arsenic contamination in brine solutions.
Alternative solutions, such as chemical antiscalants, have proven effective in reducing silica deposition [19,20]. For example, Inhibitor A, which consists mainly of phosphinocarboxylic acid copolymer, has shown a 70% reduction in scaling compared to untreated brine [21]. This method has been successfully applied in geothermal sites in the Philippines [22]. For inhibitors to be cost-effective compared to acidification, their dosage must be below 10 ppm [23].
This research aims to investigate the technical and financial aspects of utilizing Inhibitor A for brine treatment, providing a comparative analysis with the traditional acidification method. The evaluation employs Decision Tree Analysis and risk Expected Monetary Value (EMV) as analytical tools to compare the efficacy and cost-effectiveness of both treatment options. The study is conducted through a pilot project at a geothermal site in Central Java, Indonesia, offering practical insights and real-world applicability of the proposed brine treatment methodologies. By integrating these decision-making tools, the research seeks to deliver a comprehensive assessment that can inform future implementations in similar geothermal contexts.
2. Materials and Methods
2.1. Pilot Test Facility
The brine system facility consists of seven main pieces of equipment as shown in Figure 1: (1) Well, (2) Separator Vessel, (3) Level Control Valve, (4) Atmospheric Flash Tank, (5) Open Channel, (6) Brine Pump, and (7) Reinjection Well. There are two types of reinjection wells used in this system: hot reinjection well and cold reinjection well.
2.2. Chemical Injection System
In mitigating silica scaling concerns, Inhibitor A presents a viable alternative where a total dosage of 10 ppm is strategically injected into the system across three distinct points as outlined in Table 1. This distribution scheme ensures effective dispersion and targeted inhibition, optimizing the system’s performance against silica scaling challenges.
To ensure a comprehensive quantitative assessment, two distinct methodologies were employed: the silica-molybdate test and scale coupon analysis. Table 2 delineates the strategic distribution of sampling points for silica-molybdate testing and installation points for scale coupons. This dual approach facilitates a thorough examination of silica scaling dynamics, offering insights into both silica levels and long-term scale deposition tendencies within the system. The remaining silica at each location can be known from the following equation:
where: (SiO2)x ∙ % is the percentage of monomeric silica left in the brine at location x, (SiO2)x ∙ mg/L is the concentration of monomeric silica at location x in mg/L and (SiO2)x ∙ mg/L is the concentration of monomeric silica at separator outlet in mg/L.
Scale coupon analysis was conducted to ascertain the rate of scaling within the pipe over the course of one year. Two scale coupons were strategically inserted into the pipe and suspended using a purpose-built scale coupon holder to ensure optimal exposure to the flow conditions. The coupons, designed to replicate the surface properties of the pipe interior, served as passive monitors of scaling accumulation. By periodically retrieving and analysing these coupons, we were able to quantitatively assess the rate of scaling deposition within the pipe system over the specified duration. Equation (2) gives the formula on how to calculate and convert the scaling rate into one year.
where: SR is scaling rate, ∆WA is the weight gain from first observation until second observation for coupon A in gram, ∆WB is the weight gain from first observation until second observation for coupon B in gram, is the density of silica (2,196 gr/cm3), ∆D days difference between the first observation and second observation and S is the surface area of the coupon (all coupons are identic) in cm2.
2.3. Laboratory Test
Prior to field deployment, laboratory testing was conducted to ascertain the optimal dosage of the inhibitor. Through rigorous experimentation utilizing both the bottle test method and AAS (Atomic Absorption Spectrophotometer) analysis, the most effective dosage was determined. This meticulous approach ensures that the inhibitor is applied at an optimal level, maximizing its efficacy in mitigating silica scaling challenges in the field.
Gallup in 2002 conducted laboratory tests and identified 1.5 ppm as the optimum dosage of monomeric silica treatment within a concentration range of 500 to 1900 mg/L [21]. However, field pilot tests revealed a different scenario, with an optimum dosage of 10 ppm required to treat geothermal water containing 990 mg/L of SiO2. Mejorada et al. in 2000 conducted field trials in the Southern Negros Geothermal Production Field and found that a dosage of 1 ppm effectively treated water containing 800 mg/L of silica [22]. Similarly, Baltazar et al. in 2014 conducted tests in the Bacon-Manito Geothermal Business Unit (BGBU) and Leyte Geothermal Business Unit (LGBU), reporting varying optimum dosages of 10 ppm for the Botong Area and 0.5 ppm for the Malitbog Area, treating monomeric silica concentrations of 1300 mg/L and excess silica concentrations ranging from 50 to 120 mg/L, respectively [24].
In this study, AAS analysis was conducted to assess the raw condition of the brine with samples collected using the SNI-Non-Acid preservation method. Table 3 presents the results of the AAS Test, showing varying silica concentrations (Si Con.) across sample points a, b, and c from Table 2, alongside corresponding readings for RPI (Relative Percent Inhibition) and TSS (Total Suspended Solids). Subsequently, bottle tests were performed to determine the optimal dosage of Inhibitor A for silica control, as depicted in Table 4. This table illustrates silica concentration levels at different inhibitor dosages (7 ppm, 10 ppm, 20 ppm, and 25 ppm) across sample points a, b, and c.
The results of the bottle test revealed that dosages above 20 ppm effectively maintained monomeric silica concentrations in the brine, indicating the inhibitor’s ability to prevent silica deposition. However, considering the need for cost optimization, a starting dosage of 10 ppm was selected as a pragmatic approach. Despite the observation that the optimum dosage exceeds 20 ppm, the decision to initiate at 10 ppm reflects a compromise between effective silica control and minimizing costs. This strategic choice acknowledges the practical realities of industrial operations, where balancing efficacy and economic considerations is paramount.
3. Results
3.1. Silica Molybdate Test
Table 5 shows the results after three months of conducting the test. The silica content is recorded in mg/L (ppm), and dissolved silica is calculated based on location a. The silica molybdate test is performed daily and averaged over a month’s duration.
Brine acidification method results were also recorded by another certified institution. This test was conducted at a different well but with similar brine characteristics. Table 6 shows the results conducted by the institute.
Location ‘a’ serves as the reference point with an initial silicon concentration of 1179 mg/L. At location ‘b’, the silicon concentration reduced to 1021 mg/L, representing 87% of the reference concentration, indicating that 13% of the silicon was removed from the dissolved state due to acidification. Location ‘c’ showed a further reduction in silicon concentration to 892 mg/L, which is 76% of the reference concentration, suggesting a 24% removal of dissolved silicon. This table demonstrates that the acidification process effectively reduces the concentration of dissolved silicon in the brine, with the most significant reduction observed at location ‘c’.
3.2. Scale Coupon Analysis
Table 7 records the scale coupon measurements. Due to technical issues in the field, there are variations in the number of days between weighing the scale coupons at each location. The highest scaling rate, 1.70 mm/year, was observed at the brine pump outlet.
At the Separator Inlet, the weight increased from 17.5028 grams on Day 1 to 18.5157 grams on Day 36, resulting in a scaling rate of 0.99 mm/year. At the AFT Inlet, the weight rose from 17.9631 grams on Day 1 to 19.2043 grams on Day 70, corresponding to a scaling rate of 0.62 mm/year. At the Brine Pump Outlet, the weight increased from 19.0566 grams on Day 1 to 20.5522 grams on Day 31, leading to a higher scaling rate of 1.70 mm/year. This data indicates varying scaling rates at different points in the system, with the Brine Pump Outlet experiencing the highest rate of scale formation.
4. Analysis and Discussion
4.1. Comparison Between Brine Acidification Method and Antiscalant
The comparison between the brine acidification method (Table 5) and the use of Inhibitor A (Table 6) shows distinct differences in effectiveness. When using Inhibitor A, the dissolved silica remains below 60% over three months, whereas the brine acidification method allows dissolved silica levels to reach up to 87%.
Rothbaum et al. in 1979 found that maintaining the pH of brine below 6 facilitates the dissolution of silica, mitigating the rate of scaling [25]. However, when the pH increases, often due to acid evaporation, the rate of scaling escalates significantly, predominantly within the reinjection well.
Another disadvantage of the brine acidification method is the potential for accelerated pipe corrosion beyond design specifications. This necessitates either the reconstruction of the brine facility or the addition of a corrosion inhibitor [26]. The acidification method has an average corrosion rate of 24,85 mm/year, more than twice the 10,94 mm/year corrosion rate observed when using Inhibitor A.
Conversely, Inhibitor A does not markedly sustain dissolved silica levels; instead, it accelerates the polymerization of silica when the brine flows inside the pipe. The primary mechanism involves the inhibitor adhering to amorphous silica, with the carboxylic groups on the inhibitor imparting a net negative charge to the silica particles. This negative charge inhibits the agglomeration and subsequent deposition of amorphous silica onto metal surfaces. Consequently, an increased concentration of silica is observed in the canal and pond, which is easier and less costly to clean compared to inside the pipes [27].
Figure 2 shows high polymerized silica concentration indicated by the white color in both the canal and the pond. Silica scaling still occurs in a 1,5-meter-long pipe after the Atmospheric Flash Tank (AFT), with deposits forming a soft white scale of 0.5 to 1 cm every two weeks. This type of scaling is easily cleaned, as illustrated in Figure 3. In contrast, untreated brine results in a different type of silica scaling, which is dark, hard, and brittle, forming much more rapidly and is significantly more challenging to remove.
Fukuya et al. in 2021 found that the chemical characteristics of the silica scale at one of geothermal site in Japan show that iron content is positively correlated with metal, and rare earth elements (REEs) [28]. These elements likely incorporate into pyrite within the silica scale, crystallizing before the growth of amorphous silica.
4.2. Decision Tree Analysis
To compare the brine acidification method with Inhibitor A, several risk factors were identified. Project Management Institute (PMI) in 2021 introduces Decision Tree Analysis as a diagrammatic and quantitative technique for assessing the implications of a sequence of multiple options amidst uncertainty [30]. Decision trees can leverage information derived from an Expected Monetary Value (EMV) analysis to populate their branches, helping investors choose the best option [31].
Smith in 2021 outlines the construction of a decision tree: (1) Outline anticipated events and expected consequences for the “normal” situation using a process flow chart; (2) Develop and represent several hypothetically feasible alternatives as parallel branches; (3) Subdivide each branch at key milestones based on criteria and weights; (4) Estimate the probabilities of each event occurring along with their relative outcomes and associated monetary values; (5) Compute the alternative paths to determine the expected “payoffs” for each option; (6) Identify the most appropriate alternative through this process.
Key parameters considered for comparing the two methods include the cost of the product, brine line AFT and pond cleaning [27,32], reconstruction of the pipe due to pipe corrosion [33,34], loss of production, and reinjection well cleaning [35].
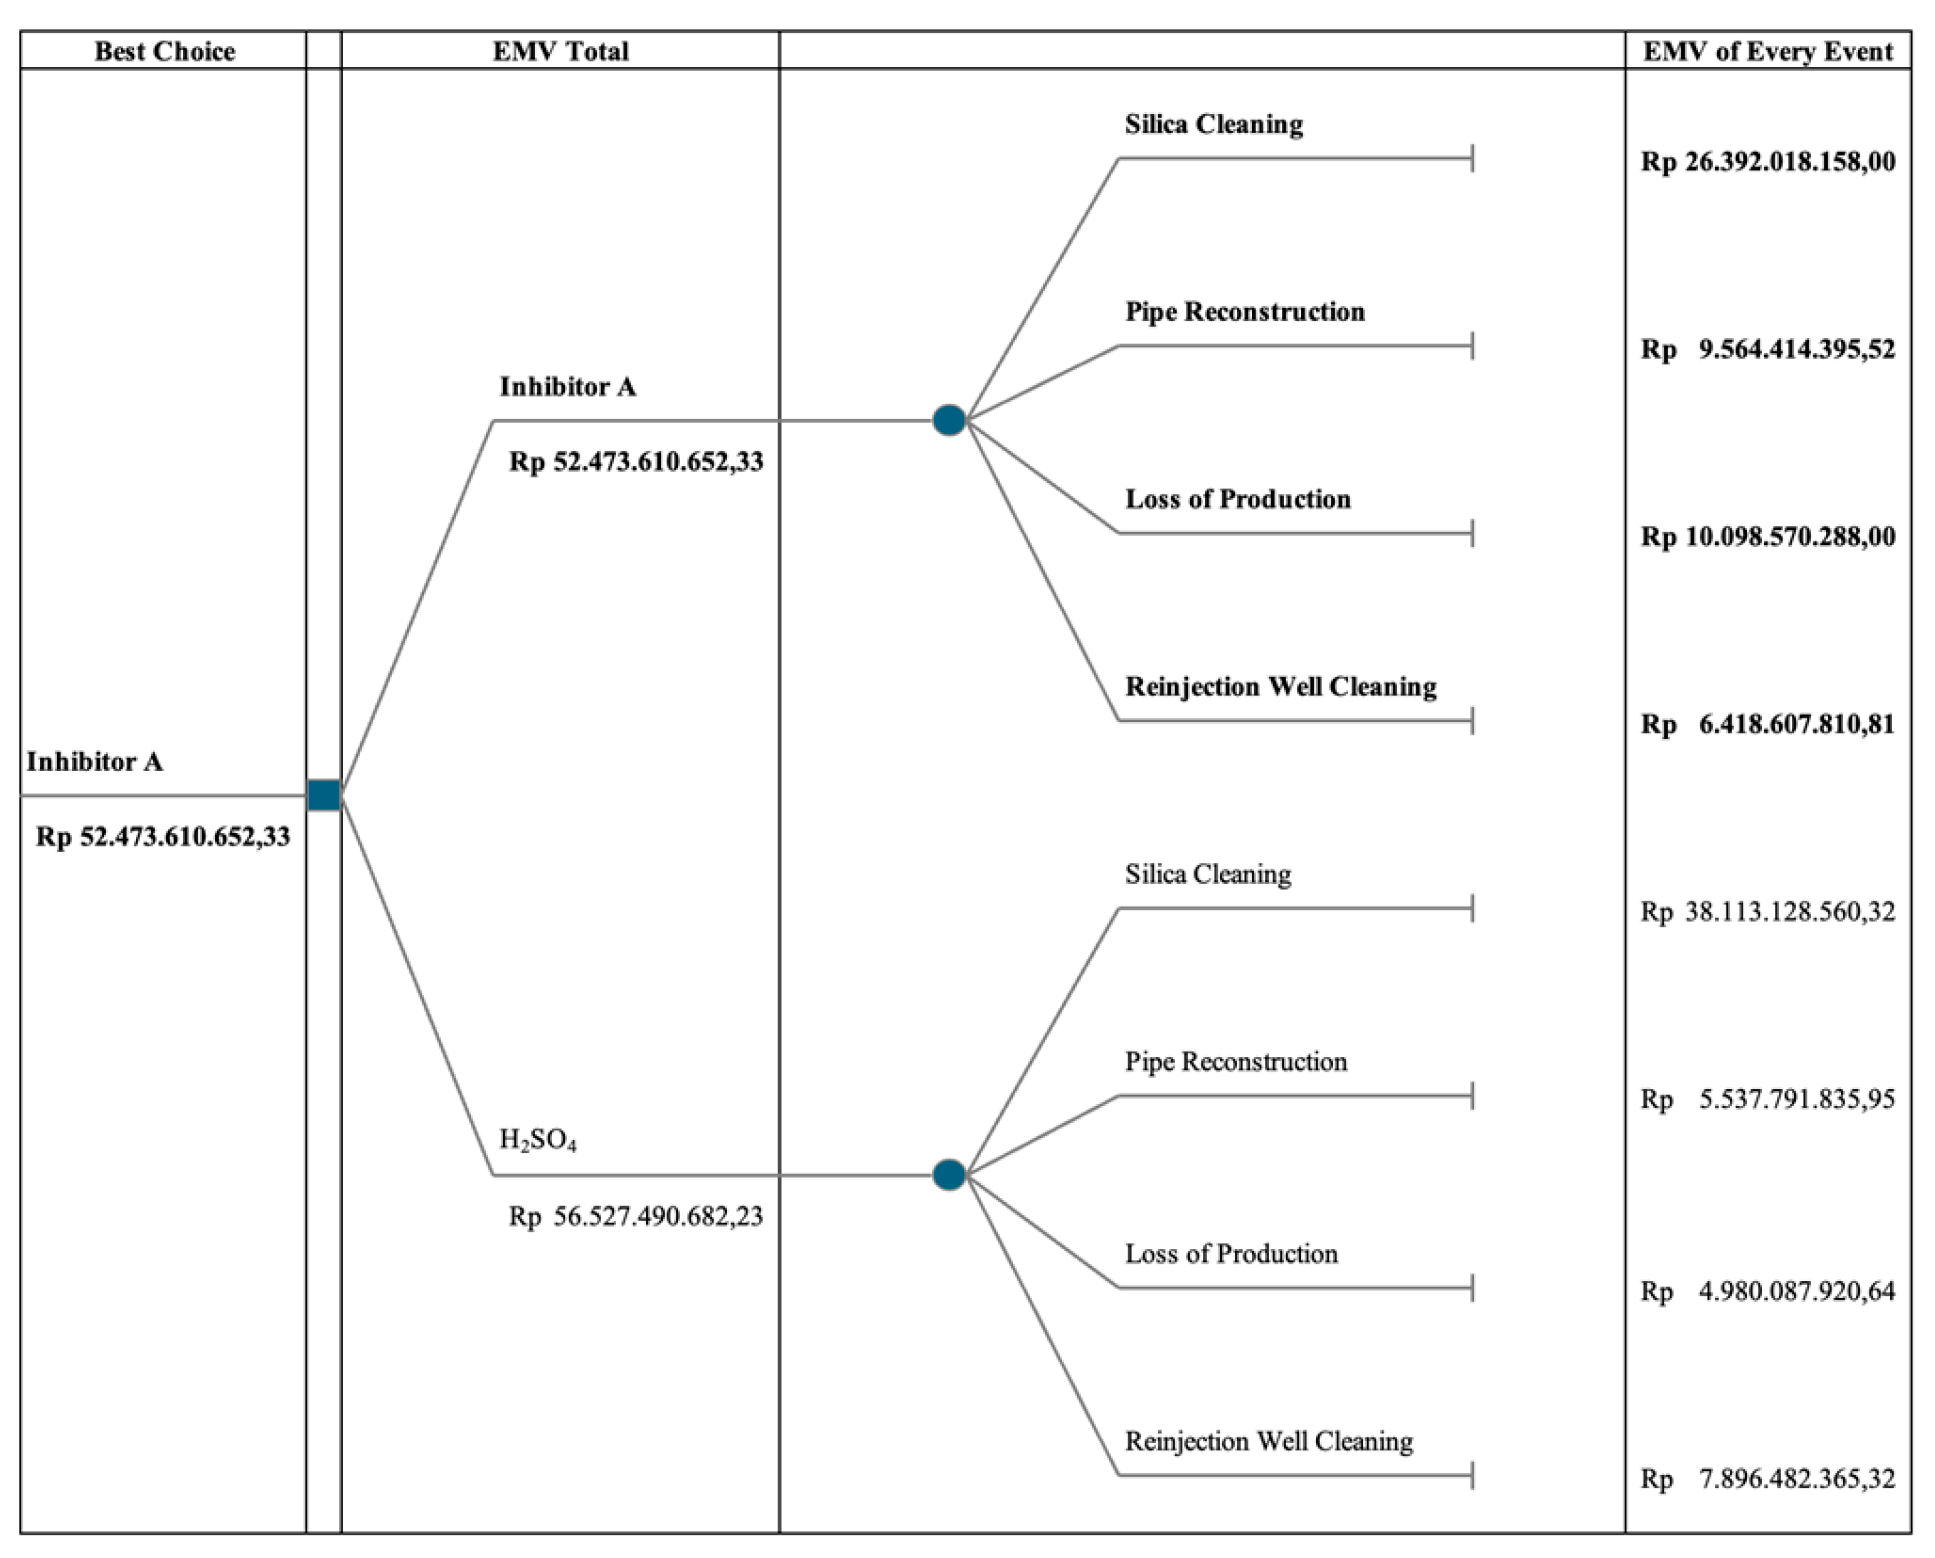
The decision tree model evaluates the comparative risks and EMVs associated with the two methods. Despite Inhibitor A demonstrating lower risks across all consequences, its EMV is found to be Rp 52,473,610,652.33, which is lower than that of the brine acidification method.
Figure 5.
Decision tree analysis, comparing Inhibitor A and acidification method.
5. Conclusions
The comparison between Inhibitor A and the brine acidification method reveals distinct disparities in efficacy. While Inhibitor A may not sustain monomeric silica concentrations as effectively as the acidification method, it prevents silica scaling below 17 mm/year, demonstrating its potential utility. The brine acidification method maintains high monomeric silica concentrations, reaching up to 87%.
The decision tree analysis favors Inhibitor A due to its lower overall risk profile. Despite noted discrepancies in parameter effectiveness, the aggregated assessment of risk factors, as quantified by the EMV Total of Rp 52,473,610,652.33, supports the adoption of Inhibitor A. This finding highlights the nuanced dynamics in decision-making processes, extending beyond individual parameter performance to broader risk management strategies.
The use of Inhibitor A not only prevents silica scale inside the pipe but also has a strong bonding with lithium [36]. Koelbel et al. in 2023 found that the geothermal site in the Upper Rhine Graben has potential in extracting lithium from the brine [37]. Further research in extracting lithium from the geothermal site in Central Java is needed for future commercial opportunities.
Author Contributions
Conceptualization, B.S.; methodology, B.S.; writing—original draft preparation, B.S.; writing—review and editing, S.T.
Funding
“This research received no external funding” or “This research was funded by PT. Cipta Solusi Andalan and PT. Saghata Adika Prominensa.
Data Availability Statement
We encourage all authors of articles published in MDPI journals to share their research data. In this section, please provide details regarding where data supporting reported results can be found, including links to publicly archived datasets analyzed or generated during the study. Where no new data were created, or where data is unavailable due to privacy or ethical restrictions, a statement is still required. Suggested Data Availability Statements are available in section “MDPI Research Data Policies” at https://www.mdpi.com/ethics.
Conflicts of Interest
The authors declare no conflicts of interest. The funders had no role in the design of the study; in the collection, analyses, or interpretation of data; in the writing of the manuscript; or in the decision to publish the results.
References
- Nasruddin; Idrus Alhamid, M.; Daud, Y.; Surachman, A.; Sugiyono, A.; Aditya, H.B.; Mahlia, T.M.I. Potential of Geothermal Energy for Electricity Generation in Indonesia: A Review. Renewable and Sustainable Energy Reviews 2016, 53.
- MEMR RUPTL PT. PLN (PERSERO) 2021-2030; 2021.
- Presidential Decree Presidential Decree No. 22 Year 2017 on National Energy General Plan; 2017.
- Spitzmüller, L.; Goldberg, V.; Held, S.; Grimmer, J.C.; Winter, D.; Genovese, M.; Koschikowski, J.; Kohl, T. Selective Silica Removal in Geothermal Fluids: Implications for Applications for Geothermal Power Plant Operation and Mineral Extraction. Geothermics 2021, 95, 102141. [Google Scholar] [CrossRef]
- Gan, H.; Liu, Z.; Wang, X.; Zhang, Y.; Liao, Y.; Zhao, G.; Zhao, J.; Liu, Z. Effect of Temperature and Acidification on Reinjection of Geothermal Water into Sandstone Geothermal Reservoirs: Laboratory Study. Water (Switzerland) 2022, 14. [Google Scholar] [CrossRef]
- Zhao, H.; Huang, Y.; Deng, S.; Wang, L.; Peng, H.; Shen, X.; Ling, D.; Liu, L.; Liu, Y. Research Progress on Scaling Mechanism and Anti-Scaling Technology of Geothermal Well System. J Dispers Sci Technol 2023, 44. [Google Scholar] [CrossRef]
- Iler, R.K. The Chemistry of Silica: Solubility, Polymerization, Colloid and Surface Properties, and Biochemistry. Lavoisierfr 1979. [Google Scholar] [CrossRef]
- Fournier, O.R. Estimation of Underground Temperatures from the Silica Content of Water from Hot Springs and Wet-Steam Wells. Amer. J. Sci. 1966, 264, 685–697. [Google Scholar] [CrossRef]
- Henley, R.W. PH and Silica Scaling Control in Geothermal Field Development. Geothermics 1983, 12, 307–321. [Google Scholar] [CrossRef]
- Akhmad Sofyan, A.S.; Hari Sumantri Aka, H.S.A.; Suranta, B.Y.; Ratasya, S.M.A. Analysis of Scale Saturation Index (SSI), Scale Formation Rate, and Scale Formation Time Based on Geothermal Production Well Head Pressure at Well “X. ” Indonesian Journal of Energy and Mineral 2021, 1. [Google Scholar] [CrossRef]
- Weres, O.; Yee, A.; Tsao, L. EQUATIONS AND TYPE CURVES FOR PREDICTING THE POLYMERIZATION OF AMORPHOUS SILICA IN GEOTHERMAL BRINES. Society of Petroleum Engineers journal 1982, 22. [Google Scholar] [CrossRef]
- Setiawan, F.A.; Rahayuningsih, E.; Petrus, H.T.B.M.; Nurpratama, M.I.; Perdana, I. Kinetics of Silica Precipitation in Geothermal Brine with Seeds Addition: Minimizing Silica Scaling in a Cold Re-Injection System. Geothermal Energy 2019, 7. [Google Scholar] [CrossRef]
- Juhri, S.; Yonezu, K.; Harijoko, A.; Nurpratama, M.I.; Yokoyama, T. Diverse Scale Deposition in Response to the Change in Chemical Properties of Geothermal Water at the Dieng Geothermal Power Plant, Indonesia. Geothermics 2023, 111. [Google Scholar] [CrossRef]
- Utami, W.S.; Herdianita, N.R.; Atmaja, R.W. The Effect of Temperature and PH on the Formation of Silica Scaling of Dieng Geothermal Field, Central Java, Indonesia; 2014.
- Dwivedi, D.; Lepková, K.; Becker, T. Carbon Steel Corrosion: A Review of Key Surface Properties and Characterization Methods. RSC Adv 2017, 7, 4580–4610. [Google Scholar] [CrossRef]
- Kamila, Z.; Kaya, E.; Zarrouk, S.J. Reinjection in Geothermal Fields: An Updated Worldwide Review 2020. Geothermics 2021, 89. [Google Scholar] [CrossRef]
- Driscoll, C.T.; Lawrence, G.B.; Bulger, A.J.; Butler, T.J.; Cronan, C.S.; Eagar, C.; Lambert, K.F.; Likens, G.E.; Stoddard, J.L.; Weathers, K.C. Acidic Deposition in the Northeastern United States: Sources and Inputs, Ecosystem Effects, and Management Strategies THE EFFECTS OF ACIDIC DEPOSITION IN THE NORTHEASTERN UNITED STATES INCLUDE THE ACIDIFICATION OF SOIL AND WATER, WHICH STRESSES TERRESTRIAL AND AQUATIC BIOTA; 2001; Vol. 51.
- Hauksson, T.; Widianto, H.; Mukti, A.W.; Sigmarsson, Þ. Dieng Geothermal Field: Testing of the Effectiveness of PH Modification for the Mitigation of Silica and Arsenic-Sulfide Scaling in Heat Extraction Process Using a Pilot Plant; 2023.
- Harrar, J.E.; Locke, F.E.; Otto, C.H., Jr.; Lorensen, L.E.; Monaco, S.B.; Frey, W.P. Field Tests of Organic Additives for Scale Control at the Salton Sea Geothermal Field. Society of Petroleum Engineers Journal 1982, 22, 17–27. [Google Scholar] [CrossRef]
- Ikeda, R.; Ueda, A. Experimental Field Investigations of Inhibitors for Controlling Silica Scale in Geothermal Brine at the Sumikawa Geothermal Plant, Akita Prefecture, Japan. Geothermics 2017, 70, 305–313. [Google Scholar] [CrossRef]
- Gallup, D.L. Investigations of Organic Inhibitors for Silica Scale Control in Geothermal Brines. Geothermics 2002, 31. [Google Scholar] [CrossRef]
- Mejorada, A. V; Garcia, S.E.; Jordan, O.T.; Reyes, R.L.; Barroca, G.B.; Pamatian, P.I.; Lim, P.G. A Silica Scale Inhibitor, Geogard SX, Testing at the Southern Negros Geothermal Production Field; 2000; Vol. 24.
- Gallup, D.L.; Barcelon, E. Investigations of Organic Inhibitors for Silica Scale Control from Geothermal Brines-II. Geothermics 2005, 34, 756–771. [Google Scholar] [CrossRef]
- Baltazar, A.D.; See, F.S.; De Guzman, R.C.; Solis, R.P.; Salonga, N.D.; Ogena, M.S.; Patel, S.; Lee, L.; Ooi, A. Geothermal Silica Scale Inhibition and Control Using Phosphino Carboxylic Acid Copolymer in Bacon-Manito Geothermal Business Unit Energy Development Corporation 2 BWA Water Additives; 2014; Vol. 38.
- Rothbaum, H.P.; Anderton, B.H.; Harrison, R.F.; Rohde, A.G.; Slatter, A. Effect of Silica Polymerisation and PH on Geothermal Scaling. Geothermics 1979, 8, 1–20. [Google Scholar] [CrossRef]
- Belas-Dacillo, K.; De Leon, A.C.; Panopio, A.C.R.; Advincula, R.C. Evaluating Protective Coatings and Metal Alloys in Acidic Geothermal Fluids Using Laboratory Techniques. World Geothermal Congress 2015 2015. [Google Scholar]
- Milicich, S.D.; Clark, J.P.; Wong, C.; Askari, M. A Review of the Kawerau Geothermal Field, New Zealand. Geothermics 2016, 59, 252–265. [Google Scholar] [CrossRef]
- Fukuyama, M.; Chen, F. Geochemical Characteristics of Silica Scales Precipitated from the Geothermal Fluid at the Onuma Geothermal Power Plant in Japan. Journal of Mineralogical and Petrological Sciences 2021, 116, 159–169. [Google Scholar] [CrossRef]
- Villaseñor, L.B.; Calibugan, A.A. Silica Scaling in Tiwi-Current Solutions; 2011.
- Project Management Institute “THE STANDARD FOR PROJECT MANAGEMENT AND A GUIDE TO THE PROJECT MANAGEMENT BODY OF KNOWLEDGE”; 2021.
- Maceika, A.; Bugajev, A.; Šostak, O.R.; Vilutienė, T. Decision Tree and AHP Methods Application for Projects Assessment: A Case Study. Sustainability (Switzerland) 2021, 13. [Google Scholar] [CrossRef]
- Pambudi, N.A.; Itoi, R.; Yamashiro, R.; CSS Syah Alam, B.Y.; Tusara, L.; Jalilinasrabady, S.; Khasani, J. The Behavior of Silica in Geothermal Brine from Dieng Geothermal Power Plant, Indonesia. Geothermics 2015, 54, 109–114. [Google Scholar] [CrossRef]
- Sicad, J. Tiwi Geothermal Brine Injection Surface Facility Development as Response to Changing Subsurface Conditions; 2015.
- Remoroza, A.I.; Doroodchi, E.; Moghtaderi, B. Corrosion Inhibition of Acid-Treated Geothermal Brine-Results from Pilot Testing in Southern Negros, Philippines; 2010.
- Rivera Diaz, A.; Kaya, E.; Zarrouk, S.J. Reinjection in Geothermal Fields: A Worldwide Review Update; 2015.
- Thasril, M. LAPORAN JASA KAJIAN OPERASIONAL CHEMICAL ANTISCALANT PAD 10 DAN 33 DIENG UNIT 1 PT GEO DIPA ENERGI (PERSERO); 2024.
- Kölbel, L.; Kölbel, T.; Herrmann, L.; Kaymakci, E.; Ghergut, I.; Poirel, A.; Schneider, J. Lithium Extraction from Geothermal Brines in the Upper Rhine Graben: A Case Study of Potential and Current State of the Art. Hydrometallurgy 2023, 221, 106131. [Google Scholar] [CrossRef]
Figure 1.
Brine system scheme.
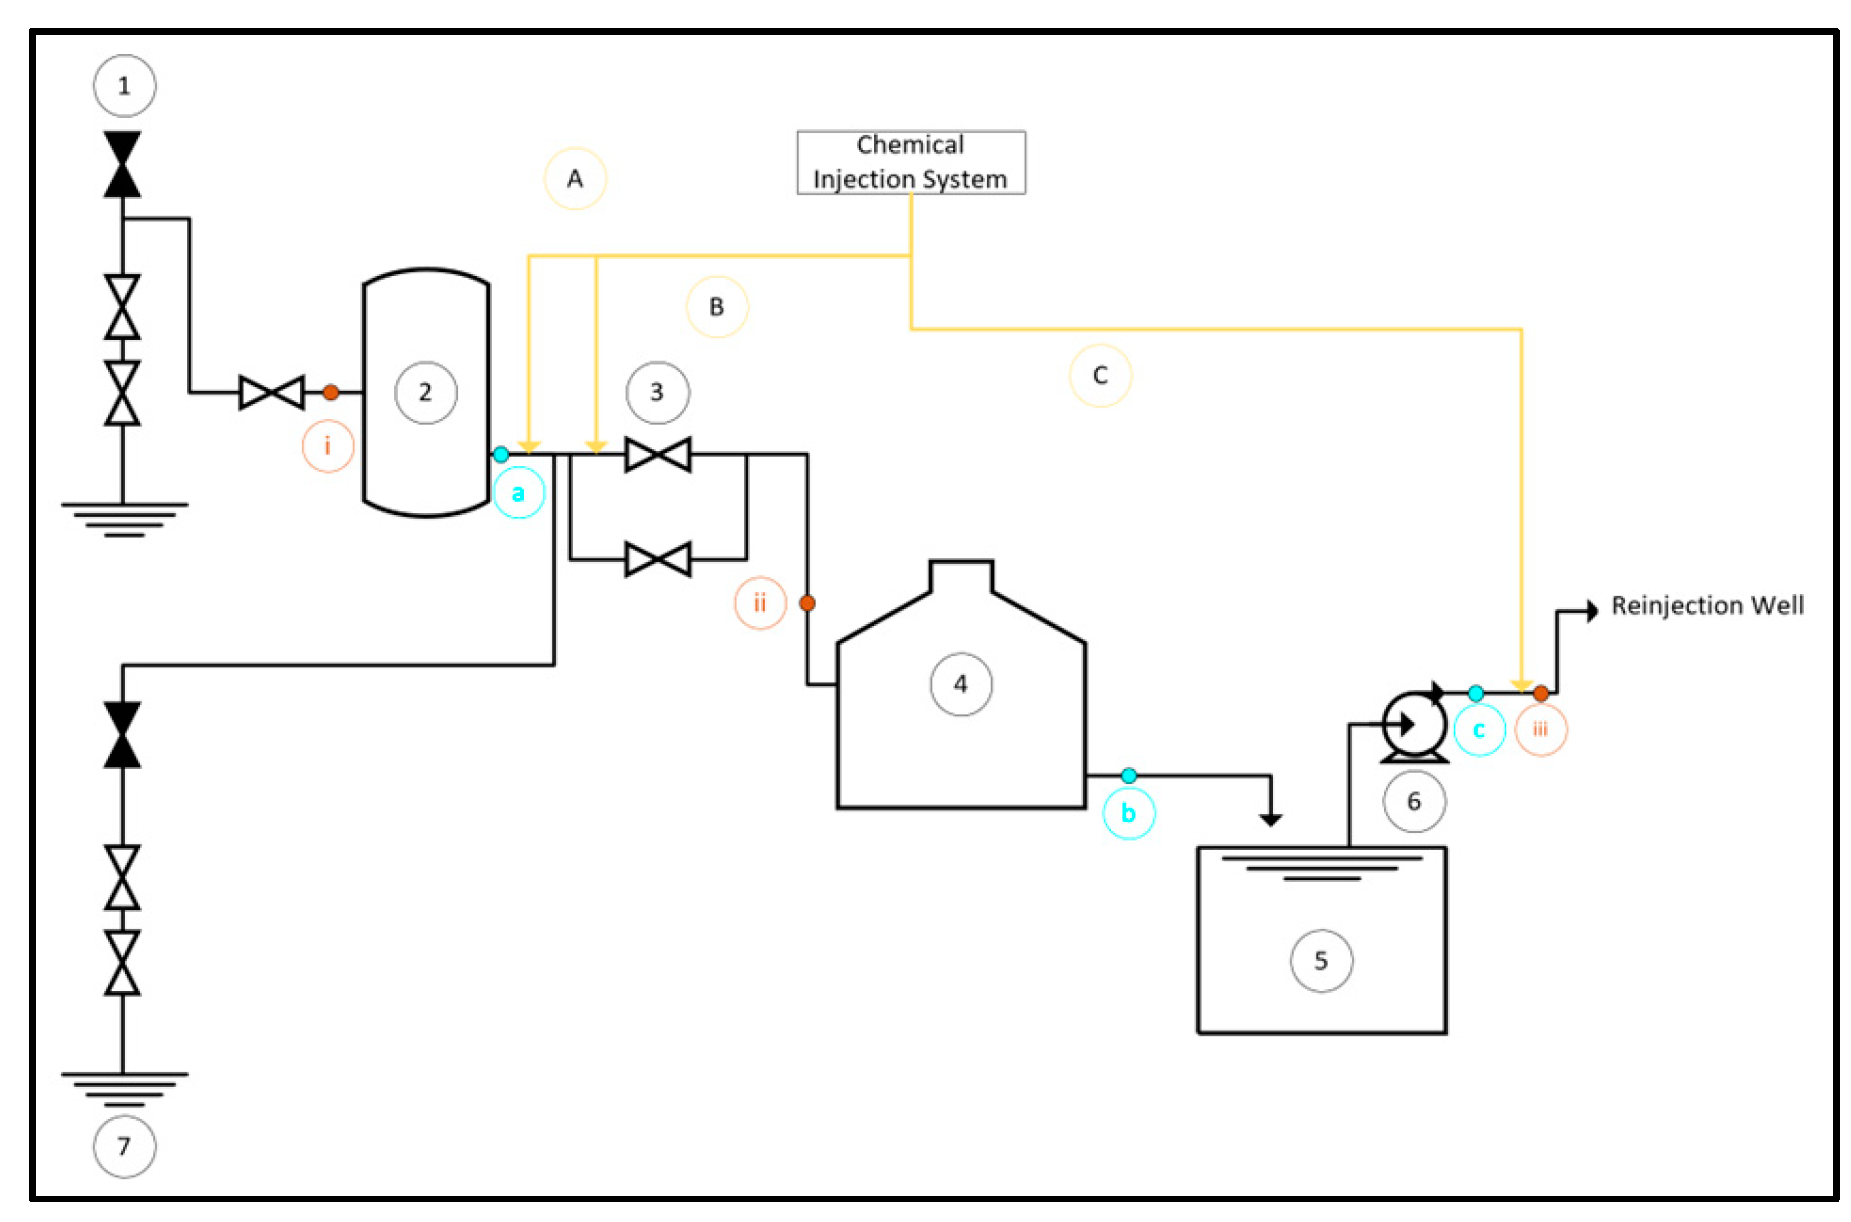
Figure 2.
High polymerized silica concentration, indicated by the white color, in both the canal (a) and the pond (b).
Figure 2.
High polymerized silica concentration, indicated by the white color, in both the canal (a) and the pond (b).
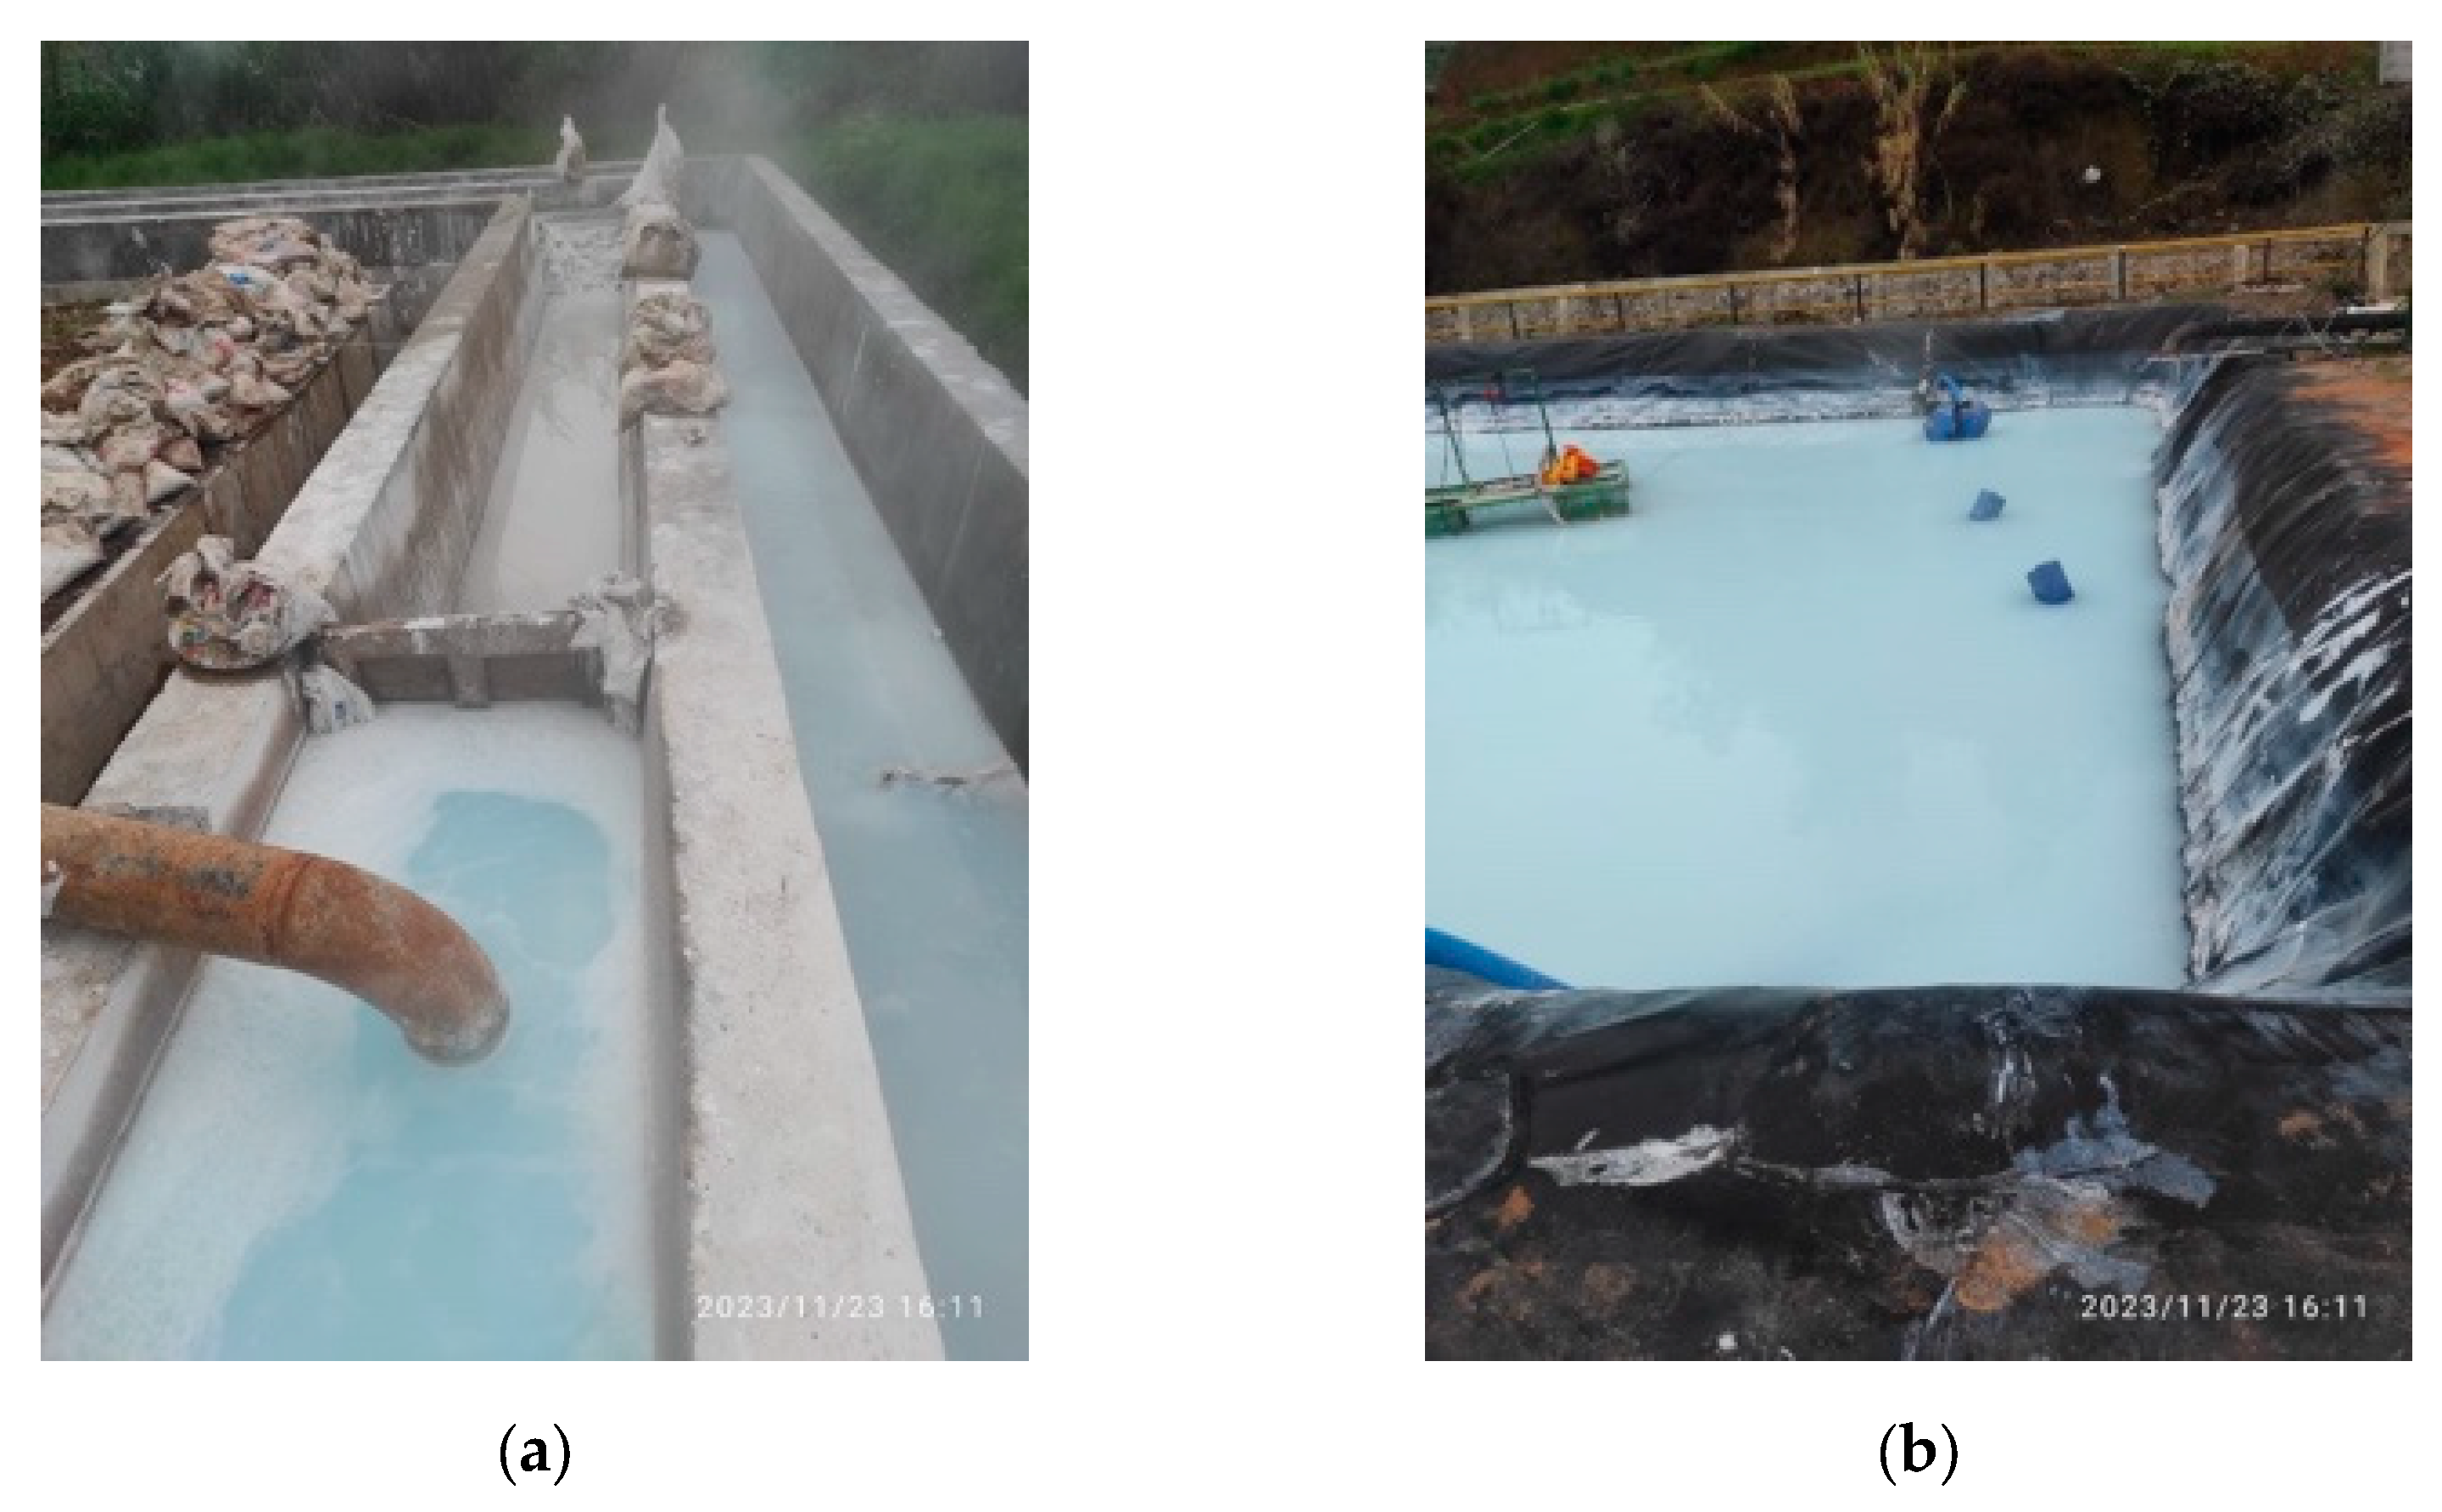
Figure 3.
The appearance of silica scale during the use of Inhibitor A.
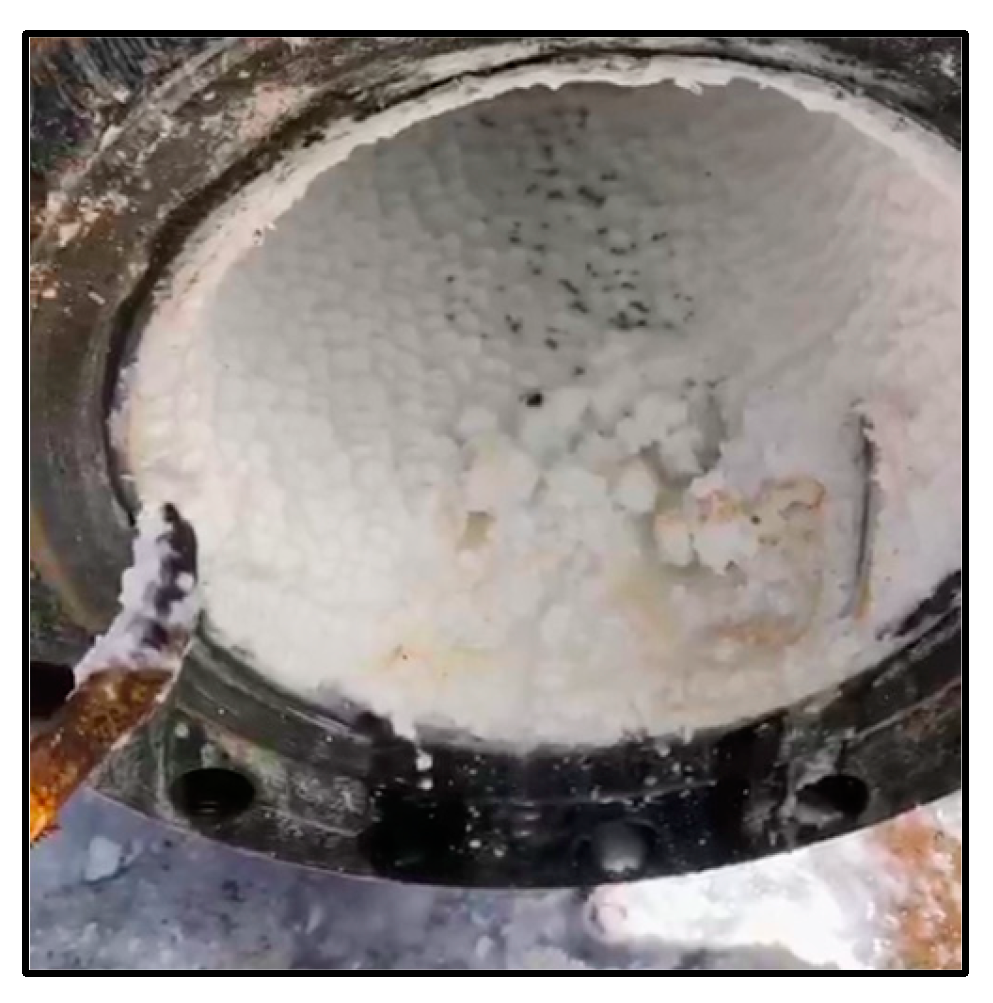
Figure 4.
The presence of silica in untreated brine.
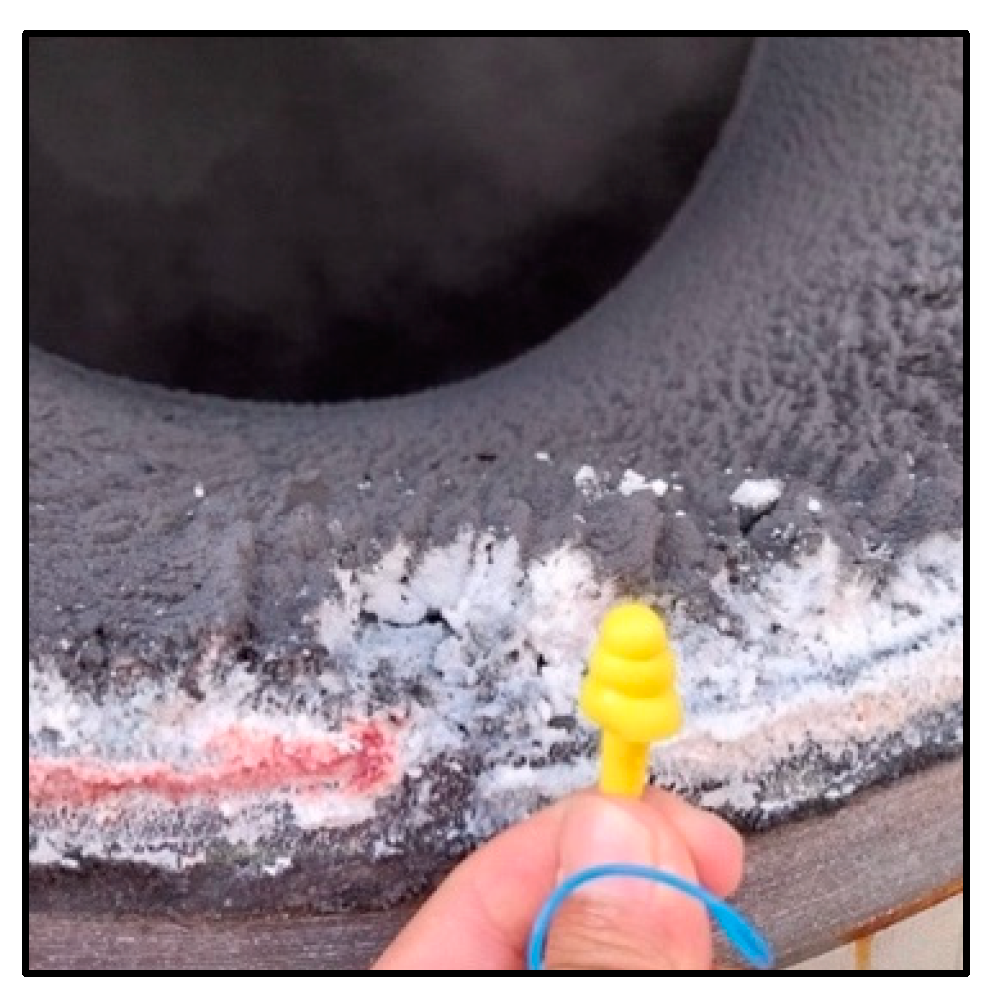

Table 1.
Dosage for every injection point.
| Point | Location | Dosage, ppm |
| A | Separator Outlet | 5 |
| B | Before LCV | 3 |
| C | Brine Pump Outlet | 2 |
Table 2.
Location of silica-molybdate sampling and scale coupon.
| Point | Location |
| Silica-Molybdate | |
| a | Separator Outlet |
| b | AFT Outlet |
| c | Brine Pump Outlet |
| Scale Coupon | |
| i | Separator Inlet |
| ii | AFT Inlet |
| iii | Brine Pump Outlet |
Table 3.
The result of AAS Test.
| Sample Point (x) | Si Con. (mg/L) |
RPI | TSS (mg/L) |
| a | 775 | 20,33 | 36,42 |
| b | 400 | 18,01 | 35,49 |
| c | 277 | 14,57 | 31,77 |
Table 4.
Bottle test result.
| Sample Point (x) | Inhibitor A Dosage (ppm) Silica Concentration (mg/L) |
|||
| 7 | 10 | 20 | 25 | |
| a | 749 | 752 | 768 | 768 |
| b | 532 | 709 | 754 | 754 |
| c | 417 | 528 | 652 | 653 |
Table 5.
Monomeric silica contains within three months of using Inhibitor A.
| Month / Location (x) | Si (mg/L) |
Dissolved Si |
|---|---|---|
| Month 1 | ||
| a | 896,19 | Reference |
| b | 533,57 | 60% |
| c | 254,76 | 28% |
| Month 2 | ||
| a | 926,93 | Reference |
| b | 543,04 | 59% |
| c | 257,39 | 28% |
| Month 3 | ||
| a | 869,33 | Reference |
| b | 511,00 | 59% |
| c | 244,00 | 28% |
Table 6.
Acidification brine method within pH 4.5-5.
| Month / Location | Si (mg/L) |
Dissolved Si |
|---|---|---|
| a | 1179 | Reference |
| b | 1021 | 87% |
| c | 892 | 76% |
Table 7.
The result of scaling rate, projected for a year using equation (2).
| Separator Inlet | ||
| Day 1 | 17,5028 | gram |
| Day 36 | 18,5157 | gram |
| Scaling Rate | 0,99 | mm/year |
| AFT Inlet | ||
| Day 1 | 17,9631 | gram |
| Day 70 | 19,2043 | gram |
| Scaling Rate | 0,62 | mm/year |
| Brine Pump Outlet | ||
| Day 1 | 19,0566 | gram |
| Day 31 | 20,5522 | gram |
| Scaling Rate | 1,70 | mm/year |
Disclaimer/Publisher’s Note: The statements, opinions and data contained in all publications are solely those of the individual author(s) and contributor(s) and not of MDPI and/or the editor(s). MDPI and/or the editor(s) disclaim responsibility for any injury to people or property resulting from any ideas, methods, instructions or products referred to in the content. |
© 2024 by the authors. Licensee MDPI, Basel, Switzerland. This article is an open access article distributed under the terms and conditions of the Creative Commons Attribution (CC BY) license (http://creativecommons.org/licenses/by/4.0/).
Copyright: This open access article is published under a Creative Commons CC BY 4.0 license, which permit the free download, distribution, and reuse, provided that the author and preprint are cited in any reuse.


