
Submitted:
24 June 2024
Posted:
25 June 2024
You are already at the latest version
Abstract
The solar energy can mitigate the power supply shortage in remote regions for portable irrigation systems. The accurate prediction of solar irradiance is crucial for determining the quantity of solar panels and the power capacity of photovoltaic power generation (PVPG) systems for mobile sprinkler machines. In this study, a prediction method is proposed to forecast the solar irradiance of typical irrigation areas. The impact of the meteorological parameters on the solar irradiance is studied, and four different parameter combinations are formed and considered as input to the prediction model. Based on meteorological data provided by ten typical radiation stations uniformly distributed nationwide, an Extreme Gradient Boosting (XGBoost) model optimized using the Whale Optimization Algorithm (WOA) is developed to predict the solar radiation. The prediction accuracy and stability of the proposed method are then evaluated for different input parameters through training and testing. The differences between the prediction performances of models trained based on single-station data and mixed data from multiple stations are also compared. The obtained results show that the proposed model achieves the highest prediction accuracy when the maximum temperature, minimum temperature, sunshine hours ratio, relative humidity, wind speed, and extraterrestrial radiation are used as the input parameters. The prediction effectiveness is also verified based on measured data. The WOA-XGBoost model has higher prediction accuracy than the XGBoost model, with predicted values falling within acceptable ranges. The model developed using mixed data of multiple stations can be applied for forecasting solar irradiance in different regions. This study provides a foundation for the optimization of the configuration of PVPG systems for mobile sprinkler machines.
Keywords:
agricultural irrigation
; mobile sprinkler machine
; solar power generation
; irradiance
; machine learning
; prediction model
1. Introduction
The mobile sprinkler machine is a motor-driven irrigation device which operation relies on grid power. However, in remote areas suffering from electricity shortage or during peak demand periods, ensuring a stable power supply is often challenging, which results in delaying the timely irrigation of crops [1,2]. At present, the photovoltaic (PV) power is mainly adotped to maintain the power supply for mobile sprinkler machines in regions exhibiting electricity shortage [3,4]. Due to the randomness and instability of solar power generation, it is crucial to properly configure the components of the PV power generation (PVPG) system. A decent configuration allows to increase the adaptability of the machine, reduce the setup costs, and improve the efficiency. The solar irradiance is the key factor affecting the configuration of PV systems [5]. Figure 1 shows a scematic diagram of a PV power sypply system for a mobile sprinkler irrigation machine. However, acquiring these data is challenging in remote regions due to the lack of weather stations. Therefore, the accurate prediction of solar irradiance is crucial to optimize the PVPG system configuration of mobile sprinkler machines.
Obtaining the global solar radiation is a prerequisite for predicting solar irradiance. However, the global solar radiation observations are highly restricted due to the high cost of the monitoring equipment. In particular, in developing countries, obtaining global solar radiation data is not as straightforward as acquiring conventional meteorological data such as the sunshine hours and temperature [6,7,8]. In China, out of 752 national meteorological stations, only 122 are equipped to measure the solar radiation, which leads to a sparse and uneven distribution of these monitoring stations [9]. Even the available solar irradiance data often suffer from incomplete time series and frequent gaps [10]. Therefore, the development of a global solar radiation prediction model is crucial to acquire precise solar irradiance data.
The estimation of global solar radiation using empirical formulas is the most widely used approach, providing high simulation accuracy [11,12]. Although it is limited by insufficient sunshine data, the Angstrom-Prescott method based on sunshine hours is widely applied. Jemaa et al. [13] addressed this limitation by adopting three simple sunshine-based models to estimate daily global solar radiation and monthly average radiation. Their results showed that the linear model outperforms the quadratic and cubic models. Khorasanizadeh et al. [14] compared several sunshine-based empirical formula models for solar radiation. Their results demonstrated that the third-degree model is the most optimal one. In complex weather conditions, the empirical formulas cannot deal with the complex non-linear relationship between independent and dependent variables. Consequently, intelligent algorithms, such as Artificial Neural Networks (ANNs), Support Vector Machines (SVMs), and Adaptive Neuro-Fuzzy Inference Systems (ANFISs), have been widely used to estimate the solar radiation [15]. For instance, Chen et al. [16] compared the performances of SVM models and sunshine-based empirical models in predicting solar radiation. Their results showed that the former have higher estimation accuracy than the latter. Ramli et al. [17] studied the accuracy of SVM and ANN models in predicting solar radiation. Their results showed that the former have higher prediction accuracy and computational speed compared with the latter.
Most of the models based on the aforementioned intelligent algorithms are complex, and thus they require significant computational resources during the training phase. In recent years, ensemble methods based on decision trees have been widely studied. These algorithms are straightforward and have high robustness [18]. For instance, Hassan et al. [19] studied the application of decision tree-based ensemble methods in simulating solar radiation, reaching high reliability and accuracy. Fan et al. [20] compared the accuracies of SVM, Extreme Gradient Boosting (XGBoost), and four empirical formula models in estimating solar radiation in subtropical regions of China. Their results showed that SVM and XGBoost outperform the empirical formula models. Benali et al. [21] compared the efficiencies of ANN and RF models in estimating solar radiation. Their results showed that the latter are more effective than the former.
However, in the application of solar irradiance forecasting for PV systems, most of the existing studies rely on the development of prediction models based on meteorological data from a single station. Few general models trained on mixed data from multiple representative stations exist, and those validated based on actual measurements are even fewer [22,23]. In this study, when optimizing the configuration of a mobile irrigation system powered by a PV system based on predicted solar irradiance, the model should exhibit high universality.
Consequently, this paper develops a daily global solar radiation prediction model based on historical meteorological data acquired from ten typical meteorological stations using machine learning models. The solar irradiance can be calculated from mathematical formulas once the global solar radiation is obtained. The prediction of solar irradiance can provide a foundation for the optimization of the configuration of PVPG systems.
The remainder of this paper is organized as follows. The system composition and model construction are presented in Section 2. Section 3 details the analysis of the accuracy and stability of the prediction method. The conducted experimental validation is described in Section 4. A discussion is presented in Section 5. Finally, the conclusion is drawn in Section 6.
2. Materials and Methods
2.1. PV Power Generation System
The physical structure of the mobile sprinkler machine is shown in Figure 2. Its locomotion system mainly comprises four identical drive wheels, a set of PV panels (CS5M32-26, with a peak power of 260 W, peak voltage of 49.71 V, and peak current of 5.25 A, supplied by Golden Electronics Co., Limited, Taizhou, China), a set of storage batteries (6-QA-200, rated capacity of 200 Ah, rated voltage of 12 V, supplied by Wind Sail Co., Ltd., Baoding, China), four DC stepper motors (3404HS60-F, Hamderburg Motors Co., Ltd., Shenzhen, China), four reducers, and a controller. The stepper motors are crucial component of the drive system. Table 1 presents the main technical parameters of the mobile sprinkler machine. The solar PV components of the unit convert the solar radiation energy into electricity, which is then input into the battery for storage. A part of the stored electricity is converted into mechanical energy by the stepper motor to drive the wheels for propulsion and steering, while the other part is converted into pressure energy used by the water pump to lift water from a certain source. All the stepper motors are equipped with drive controllers to regulate the motor speed and allow the irrigation system to move.
To appropriately use the mobile sprinkler machine, it should be ensured that the power demand for locomotion matches the power generated by the PV system. The global solar radiation is the sum of the direct and scattered solar radiation received on a horizontal surface at a specific observation point on the Earth's surface. The required configuration of PV components for the mobile sprinkler machine varies depending on its application area. This is mainly due to the different levels of global solar radiation in different regions, which leads to varying hourly irradiance levels. This results in differences in PVPG, that is, the capacity of the PV system to generate electricity. In remote irrigation areas where monitoring global solar radiation is challenging, forecasting methods should be adopted to obtain global solar radiation.
2.2. Development of the Prediction Model
2.2.1. Data Sources
In this study, data from ten national evenly distributed typical radiation stations between 1960 and 2020 were considered to estimate, validate, and construct a solar radiation dataset. The meteorological data are obtained from the National Meteorological Information Center (NMIC) of China Meteorological Administration (CMA). The station codes, geographical location information, and climatic characteristics of these stations are shown in Table 2, and their geographical distribution is illustrated in Figure 3. Based on the quality control protocol proposed by Liu et al. [24], the meteorological data were processed as follows: if one or more data points are missing from the daily meteorological data, the data of the entire day are excluded; if the global solar radiation exceeds the extraterrestrial total radiation on a given day, all the data of this day are removed.
2.2.2. Selectin of the Input Parameters
The spatial and temporal distributions of global solar radiation are affected by various factors. The latter include astronomical factors, such as the solar altitude angle, Earth-Sun distance, and geographical latitude, that are considered as direct influencing factors, as well as meteorological factors, that are considered as indirect influencing factors. Under the combined influence of these factors, the global total radiation exhibits significant spatial and temporal variations. The accurate calculation of the amount of global total radiation is essential for the analysis and effective utilization of the solar radiation. Therefore, based on a previous study, this paper uses partial or complete sets of six factors (maximum temperature (Tmax), minimum temperature (Tmin), relative humidity (RH), wind speed (u2), sunshine hour ratio (n/N) (i.e., ratio of the sunshine hours to the maximum possible sunshine hours), and extraterrestrial radiation (Ra)) as input parameters to analyze the predictive effects of the global solar radiation for different combinations of input parameters. The Ra is mainly affected by astronomical factors, such as the solar altitude angle, Earth-Sun distance, and geographical latitude. It is calculated as [25,26]:
where dr is the Earth-Sun distance factor, Isc is the solar constant (1367 W·m-2), n is the day of the year, φ, δ, and ωs are respectively the latitude, declination angle, and sunset hour angle (rad).
Note that the unit of Ra is MJ·m-2·d-1.
The sunshine hour ratio is that of the actual sunshine hours to the maximum possible sunshine hours. The maximum possible sunshine hours are computed as [25]:
Four different sets of input parameters to the model were established to accurately estimate the global solar radiation, in order to evaluate the impact of various meteorological factors on the solar radiation. These combinations are presented in Table 3.
2.2.3. Development of
The global solPrediction Modelsar radiation has complex nonlinear relationships with meteorological factors, such as the temperature, humidity, and wind speed. Machine learning models are well-suited for addressing the complex nonlinear relationships between dependent and independent variables. This study adopts the XGBoost machine leaning model to accurately estimate the total surface solar radiation. It also uses the Whale Optimization Algorithm (WOA) to optimize the parameters of the XGBoost model.
(1) The WOA
The WOA simulates whales hunting for prey. It uses random search agents to mimic the hunting behavior and perform global search. This process involves surrounding, attacking, and searching for the optimal prey [27].
1) Surrounding prey
In the WOA algorithm, the assumed best candidate position for prey is either the hunting target or a location near the optimal search agent. The other individuals will constantly adjust their positions relative to the optimal agent in real-time, which can be mathematically expressed as:
where t is the current iteration number, X(t) is the position vector of the current search agent, X*(t) is the position vector of the current best search agent, A and C are coefficient matrices given by:
where r1 and r2 are random vectors of components in the range of 0-1.
Note that m linearly decreases at [0,2].
2) Attacking prey
The bubble-net feeding behavior of humpback whales consists of two mechanisms: contraction and spiral position updating. These two behaviors simultaneously occur, while the whale randomly chooses to either contract in a loop or move along a spiral path, with equal probability for its choices. The position of the whale is updated accordingly in real-time:
where is the distance between the positions of the current search agent and the best one, b is a constant determining the shape of the spiral path, l is a random number in the range of -1-1, and P is the probability.
3) Searching for the optimal prey
In contrast to the development phase, during each iteration, the remaining search agents update their positions in real-time based on the randomly selected search agent, rather than the current best search agent. The iteration process is expressed as:
where Xrand(t) represents the position vector of the randomly chosen search agent.
The WOA algorithm avoids the pitfalls of other population-based optimization algorithms that often get trapped in local optima by balancing and enhancing the development and search abilities, which results in global optimization through a searching process.
(2) The XGBoost model
XGBoost is an advanced machine learning model built on gradient boosting and decision trees. Its key strength lies in leveraging parallel computing on multi-core CPUs, which allows to increase the computational speed compared with the traditional models. Moreover, it employs second-order derivative expansion, which increases the accuracy when optimizing target error functions. When predicting the PV power using XGBoost, the model is essentially a collection of K decision trees. Each decision tree, denoted by fk, operates on the input vector set D = {(xi, yi)}. By combining these K decision trees, the model generates predictions for the PV power of individual samples [28]:
where j = φ(xi) is the leaf node in the k-th tree and ε is the score vector of the leaves.
The errors of all the samples are aggregated to calculate the sum (S) as:
where is the loss function, γ and λ are hyperparameters, Z is the amount of leaf nodes, and Ω(f) is a regular term.
Based on Equation (13), the loss function obtained after the superposition of the k-th decision tree is expressed as:
where Q is a constant.
Equation (15) is then expanded using the Taylor series as:
(3) Implementation of WOA-XGBoost
This study uses three key hyperparameters (max_depth, learning_rate, and L2 reg_lambda) in the WOA optimization forecasting model. The process can be divided into the following steps: 1) Normalizing and splitting the experimental data into training and testing sets; 2) Initializing the WOA by setting search parameters; 3) Defining the parameter ranges for XGBoost and creating an initial whale population; 4) Computing the fitness for each whale position; 5) Ranking the fitness, selecting the best agent, and updating the corresponding positions; 6) Iteratively updating the positions using Equations (6)-(11); 7) Repeating steps 2)-6) using the mean squared error as the fitness function until the termination criteria are met; 8) Applying the optimized parameters to the XGBoost model. Note that after optimization, the maximum decision tree depth, learning rate, and L2 regularization coefficient are 7, 0.033, and 0.05, respectively.
Figure 4 shows the calculation process of the daily global solar radiation estimation model. Based on collected data, such as the solar radiation, temperature, and sunshine hours, 70% of the data are used as training samples and the remaining 30% are used as testing samples. The daily global solar radiation is considered as the dependent variable, while other variables, including the maximum temperature, minimum temperature, sunshine hour ratio, relative humidity, wind speed, and extraterrestrial radiation, are considered as the independent variables. The machine learning models are employed to develop the daily global solar radiation prediction model. Finally, statistical metrics are used to evaluate the estimation accuracy of the machine learning models. Note that all the models are implemented in Python 3.6.
2.2.4. Indicators for the Evaluation of the Prediction Accuracy
The Coefficient of Determination (R2), Root Mean Squared Error (RMSE), Mean Absolute Error (MAE), and Mean Squared Error (MSE) are employed to evaluate the accuracy of the proposed model. These metrics are presented in Equations (19)-(22). Note that high R2 value (close to 1) with small RMSE, MAE, and MSE values denote a high estimation accuracy.
where Ei represents the estimated value, Mi represents the measured value, represents the mean of the estimated values, represents the mean of the measured values, and n is the number of samples.
2.3. Calculation of the Hourly Solar Irradiance
In order to evaluate the hourly solar radiation conditions per unit area, the daily global solar radiation is converted into hourly irradiance. The adopted calculation steps are based on the method of Picazo et al. [29]. The ratio of hourly total radiation to total daily radiation (rt) is expressed as:
where ω represents the hour angle between the sunrise and sunset (rad).
The hourly solar irradiance (IT(t)) is calculated as:
where Rs is the global solar radiation (MJ·m-2·d-1).
Note that IT(t) is measured in W·m-2.
3. Results and Discussion
3.1. Comparison between the Prediction Accuracies Based On Single Station Data
The proposed WOA-XGBoost model is used to predict the daily global solar radiation at ten typical stations. Table 4 shows the obtained results during the training and testing phases for each station. It can be clearly seen that the input parameters affect the prediction accuracy of the model, which is highlighted by the variations in the statistical metrics.
Considering the Harbin station as an example, during the training and testing phases, the highest R2 value as well as the lowest RMSE, MAE, and MSE values, are obtained by the proposed model for the A1 input parameter combination, which denotes the highest accuracy. On the contrary, for the A3 input parameter combination, the model yields the lowest R2 value and the highest RMSE, MAE, and MSE values, which denotes the lowest accuracy. It can be observed that the maximum temperature, minimum temperature, wind speed, sunshine hours ratio, relative humidity, and extraterrestrial radiation affect the global solar radiation. The sunshine hours ratio has the most significant impact on the global solar radiation.
The optimal input parameter combinations and the selection results obtained by the machine learning model for the Altay, Golmud, Beijing, Erenhot, Kunming, Zhengzhou, Wuhan, Guangzhou, and Hotan stations are consistent with those of the Harbin station.
The effectiveness of the WOA-XGBoost model is then compared with that of the XGBoost model without parameter optimization. Figure 5 shows the relationship between the measured values during the testing phase at each station and the predicted values calculated by these two models for the A1 parameter combination, including the maximum temperature, minimum temperature, wind speed, sunshine hours ratio, relative humidity, and extraterrestrial radiation. It can be seen that, at all the stations, the WOA-XGBoost model generates scatter plots of daily global solar radiation closer to the 1:1 line compared with the XGBoost model. This demonstrates that the WOA-XGBoost model exhibits reduced error between the predicted and measured daily global solar radiation.
3.2. Comparison betweeen the Prediction Stabilities Based on Single Station Data
The stability of WOA-XGBoost and XGBoost is evaluated by measuring the percentage increase in RMSE on the testing set compared with the training set ((RMSEtesting - RMSEtraining)/RMSEtesting). The average RMSE values during the training and testing phases are calculated for the same input parameter combinations (A1) at ten stations. The average percentage increase in RMSE for each station is then calculated for the input parameter combinations. The obtained results are shown in Figure 6. It can be observed that the ranges of average percentage increase in RMSE for the WOA-XGBoost and XGBoost models are 2.86-11.16% and 4.29-13.06%, respectively. The WOA-XGBoost model has a smaller average percentage increase in RMSE, which denotes a higher predictive stability compared with the XGBoost model.
3.3. Comparison between the Prediction Results Based on Mixed Data from Multiple Stations
This study also involves the development of daily global solar radiation prediction models using mixed data from ten meteorological stations. 70% of the data are used for model training, and the remaining 30% are used for testing. The prediction accuracies of the WOA-XGBoost and XGBoost models, trained on mixed data from all the stations, are compared. The results obtained during training and testing are shown in Table 5. For the A1 input combination, including the maximum temperature, minimum temperature, relative humidity, wind speed, sunshine hours ratio, and extraterrestrial radiation, the WOA-XGBoost model has higher prediction accuracy than the XGBoost model. Thus, it can be used to forecast daily global solar radiation in various regions nationwide. Although its prediction accuracy may be slightly lower than those of models built solely on data from individual meteorological stations, this model can still be applied to forecast daily global solar radiation in various regions across the country, showcasing its broader range of applications.
4. Experimental Verification for the Prediction Results
4.1. Experimental Methods
The hourly solar irradiance data were collected in the China Institute of Water-Saving Agriculture in the Northwest A&F University in Yangling, Shaanxi (34°18'N, 108°24'E; 521 m a.s.l.). The experimental setup includes monocrystalline PV panels of the CS5M32-260 model, with peak power, voltage, and current of 260 W, 49.71 V, and 5.25 A, respectively (Figure 7). The solar irradiance was monitored using an AV6592 portable PV tester (environmental temperature testing: accuracy ±1°C; testing range -30-100°C; PV panel temperature detection: accuracy ±1°C; irradiance detection: accuracy ±3%; testing range 0-1800 W·m-2; PV power generation testing: testing range 0.1-500 W). Data was collected every ten minutes, transmitted via Bluetooth and serial interface, displayed and stored on a personal computer. Meteorological data was automatically collected (once per hour) and recorded by a weather station located 400 m south of the PV panels, including the temperature, humidity, and wind speed, etc.
4.2. Experimental Results
We utilized data from two typical days (December 15, 2021 and June 28, 2021) in the Yangling region for experimental verification. On December 15, 2021, the meteorological parameters include a maximum temperature of 6°C, a minimum temperature of 0°C, a relative humidity of 62%, a wind speed of 1.5 m·s-1, a sunshine hourly ratio of 0.70, and an extraterrestrial radiation of 23.462 MJ·m-2·d-1. The initially computed daily global solar radiation is 12.565 MJ·m-2·d-1. Afterwards, hourly irradiance calculations are performed from 1 to 24 h. The resulting hourly irradiance calculation is presented in Figure 8a. It can be seen from Figure 8a that the predicted and measured hourly irradiance values are highly consistent. The maximum absolute error between the predicted and measured values is 6 W·m-2, with RMSE, MAE, and MSE of 2.508, 1.458, and 6.292 MJ·m-2·d-1, respectively. This demonstrates that the proposed method has high prediction accuracy.
On June 28, 2021, the meteorological parameters include a maximum temperature of 34°C, a minimum temperature of 21°C, a relative humidity of 58%, a wind speed of 2.5 m·s-1, a sunshine hourly ratio of 0.78, and an extraterrestrial radiation of 44.343 MJ·m-2·d-1. The initially computed daily global solar radiation is 29.512 MJ·m-2·d-1. Afterwards, hourly irradiance calculations are performed from 1 to 24 h. The resulting hourly irradiance calculation is presented in Figure 8b. It can be observed from Figure 8b that the measured and predicted hourly irradiance values are consistent. The maximum absolute error between the predicted and measured values is 19 W·m-2, which falls within an acceptable range. The RMSE, MAE, and MSE are 7.121, 4.792, and 50.708 MJ·m-2·d-1, respectively. This shows that the proposed method has high prediction accuracy.
5. Discussion
This study addresses the prediction of solar irradiance for optimizing the configuration of a portable solar-powered irrigation system in remote areas. The solar irradiance can be calculated once the global solar radiation is obtained. The WOA-XGBoost model is employed to develop a global solar radiation prediction model using meteorological data from ten typical locations nationwide having different input parameter combinations. The obtained results demonstrate that the predictive accuracy of the proposed method is higher than that of the XGBoost model. By taking the factors affecting the ground total radiation into consideration, the influencing parameters are categorized into different combinations for optimal parameter selection. In addition, the WOA algorithm is adopted to solve the problem of excessive hyperparameters in XGBoost. The data from the ten stations are combined for model training and prediction to obtain a universal global solar radiation prediction model. Many studies have been conducted on solar irradiance forecasting. For instance, Lee et al. [30] used ensemble learning models for short-term solar irradiance forecasting. Chakchak and Cetin [31] evaluated daily global solar radiation prediction models for different weather conditions using Nonlinear Autoregressive models with External Input neural networks, feedforward neural networks, and generalized regression neural network models. Mahima et al. [32] proposed a model for daily global solar radiation prediction based on meteorological parameters (e.g., temperature, relative humidity, and wind speed). These studies mainly focus on the prediction algorithms and pay less attention to the mixed handling of meteorological data.
The WOA-XGBoost model outperforms the XGBoost model, since the former can automatically search for the optimal prediction parameters [33], while the latter manually determines them [34]. WOA is highly effective in solving the problem of excessive hyperparameters in XGBoost. The WOA-XGBoost model solves the overfitting problems encountered by the XGBoost model, which allows to increase the data fitting and prediction accuracy.
The daily global solar radiation can only reflect the overall radiation situation throughout the day, while it cannot reflect the hourly radiation within a unit area in a specific region. On the other hand, the hourly solar irradiance denotes the hourly radiation energy reaching the Earth's surface per unit area after the solar radiation undergoes absorption, scattering, reflection, and other effects in the atmosphere. It is a crucial parameter for quantitatively describing the solar radiation. A quantitative conversion relationship exists between the daily global solar radiation and hourly irradiance. However, in practical engineering applications, the hourly irradiance holds broader application value. Therefore, in this paper, the daily global solar radiation was converted into hourly irradiance for evaluation.
However, this study has some limitations, such as the use of data from typical areas for prediction, which results in a limited sample size. In future work, efforts will be made to increase the sample size.
6. Conclusion
This paper addresses the solar irradiance prediction problem for a solar-powered system in a shifting irrigation machine. A daily global solar radiation prediction model was developed using the WOA-XGBoost machine learning model. Performing prediction using this model allowed to obtain gradual irradiance for ten typical meteorological stations nationwide. The prediction accuracy and stability were then analyzed. The model reached the highest precision when its input parameters included the maximum temperature, minimum temperature, sunshine duration ratio, relative humidity, wind speed, and extraterrestrial radiation. The rates of average percentage increase in RMSE for the WOA-XGBoost and XGBoost models were in the ranges of 2.86-11.16% and 4.29-13.06%, respectively. The WOA-XGBoost model had a lower percentage increase in RMSE between the training and testing sets compared with the XGBoost model, which demonstrates its higher stability. Models built on mixed data from multiple stations could be applied to predict solar irradiance in different regions. The experimental validation showed that the proposed method has high accuracy, meeting the requirements of the solar irradiance prediction.
Author Contributions
Conceptualization, D.L. and J.Q.; methodology, D.L.; software, D.L.; validation, D.L.; formal analysis, D.L., J.Q. and D.Z.; investigation, D.Z., Z.Q. and Q.Z.; resources, D.Z. and Z.Q.; data curation, J.Q. and Q.Z.; writing—original draft preparation, D.L.; writing—review and editing, D.L.; visualization, D.L.; supervision, D.Z. and J.Q.; project administration, D.L.; funding acquisition, D.L. and J.Q. All authors have read and agreed to the published version of the manuscript.
Funding
This research was funded by the Natural Science Foundation of the Jiangsu Higher Education Institutions (grant numbers 22KJD510012 and 23KJD510013), the Jiangsu Provincial Natural Science Foundation (grant number BK20210823), the Lvyangjinfeng Talent Project of Yangzhou (grant number YZLYJFJH2021YXBS055), and Yangzhou City Zero-carbon Smart Manufacturing Engineering Technology Research Center.
Institutional Review Board Statement
Not applicable.
Data Availability Statement
Data are contained within the article.
Acknowledgments
The authors express their sincere appreciation to the editor and referees for their valuable time and efforts on our manuscript.
Conflicts of Interest
The authors declare no conflict of interest.
References
- Ahmed, H.F.; Helgason, W. Reliability model for designing solar-powered center-pivot irrigation systems. Trans. ASABE 2015, 58, 947–958. [Google Scholar] [CrossRef]
- Li, D.; Zhu, D.; Ge, M.; Wu, S.; Wang, R.; Wang, B.; Wu, Y.; Yang, Y. Optimal configuration and field experiments for photovoltaic generation system of solar-powered hose-drawn traveler. Trans. ASABE 2019, 62, 1789–1801. [Google Scholar] [CrossRef]
- Campana, P.E.; Leduc, S.; Kim, M.; Olssond, A.; Zhang, J.; Liu, J.; Kraxnerb, F.; McCallum, I.; Li, H.; Yan, J. Suitable and optimal locations for implementing photovoltaic water pumping systems for grassland irrigation in China. Appl. Energ. 2017, 185, 1879–1889. [Google Scholar] [CrossRef]
- Chandel, S.S.; Naik, M.N.; Chandel, R. Review of performance studies of direct coupled photovoltaic water pumping systems and case study. Renew. Sust. Energ. Rev. 2017, 76, 163–175. [Google Scholar] [CrossRef]
- Krishna, R.K.D.V.S.; Premalatha, M.; Naveen, C. Analysis of different combinations of meteorological parameters in predicting the horizontal global solar radiation with ANN approach: A case study. Renew. Sust. Energ. Rev. 2018, 91, 248–258. [Google Scholar] [CrossRef]
- Ramedani, Z.; Omid, M.; Keyhani, A. Modeling solar energy potential in a tehran province using artificial neural networks. Int. J. Green. Energy. 2013, 10, 427–441. [Google Scholar] [CrossRef]
- Şahin, M. Comparison of modelling ANN and ELM to estimate solar radiation over Turkey using NOAA satellite data. Int. J. Remote. Sens. 2013, 34, 7508–7533. [Google Scholar] [CrossRef]
- Quej, V.H.; Almorox, J.; Ibrakhimov, M.; Saito, L. Estimating daily global solar radiation by day of the year in six cities located in the Yucat? N Peninsula, Mexico. J. Clean. Prod. 2017, 141, 75–82. [Google Scholar] [CrossRef]
- Zang, H.; Xu, Q.; Bian, H. Generation of typical solar radiation data for different climates of China. Energy 2012, 38, 236–248. [Google Scholar] [CrossRef]
- Alia, A.; Norb, N.M.; Ibrahimc, T.; Romlied, M.F. Sizing and placement of solar photovoltaic plants by using time-series historical weather data. J. Renew. Sustain. Energy 2018, 10, 023702. [Google Scholar] [CrossRef]
- Kong, X.; Du, X.; Xue, G.; Xu, Z. Multi-step short-term solar radiation prediction based on empirical mode decomposition and gated recurrent unit optimized via an attention mechanism. Energy 2023, 282, 128825. [Google Scholar] [CrossRef]
- Feng, Y.; Cui, N.; Chen, Y.; et al. Development of data-driven models for prediction of daily global horizontal irradiance in Northwest China. J. Clean. Prod. 2019, 223, 136–146. [Google Scholar] [CrossRef]
- Jemaa, A.B.; Rafa, S.; Essounbouli, N.; Hamzaoui, A.; Hnaien, F.; Yalaoui, F. Estimation of global solar radiation using three simple methods. Energy Procedia 2013, 42, 406–415. [Google Scholar] [CrossRef]
- Khorasanizadeh, H.; Mohammadi, K. Introducing the best model for predicting the monthly mean global solar radiation over six major cities of Iran. Energy 2013, 51, 257–266. [Google Scholar] [CrossRef]
- Wu, W.; Liu, H.B. Assessment of monthly solar radiation estimates using support vector machines and air temperatures. Int. J. Climatol. 2012, 32, 274–285. [Google Scholar] [CrossRef]
- Chen, J.; Li, G.; Wu, S. Assessing the potential of support vector machine for estimating daily solar radiation using sunshine duration. Energy Convers. Manage. 2013, 75, 311–318. [Google Scholar] [CrossRef]
- Ramli, M.A.M.; Twaha, S.; Al-Turki, Y.A. Investigating the performance of support vector machine and artificial neural networks in predicting solar radiation on a tilted surface: Saudi Arabia case study. Energy Convers. Manage. 2015, 105, 442–452. [Google Scholar] [CrossRef]
- Olatomiwa, L.; Mekhilef, S.; Shamshirband, S.; Petković, D. Adaptive neuro-fuzzy approach for solar radiation prediction in Nigeria. Renew. Sustain. Energy. Rev. 2015, 51, 1784–1791. [Google Scholar] [CrossRef]
- Hassan, M.A.; Khalil, A.; Kaseb, S.; Kassem, M.A. Exploring the potential of tree-based ensemble methods in solar radiation modeling. Appl. Energy. 2017, 203, 897–916. [Google Scholar] [CrossRef]
- Fan, J.; Wang, X.; Wu, L.; et al. Comparison of Support Vector Machine and Extreme Gradient Boosting for predicting daily global solar radiation using temperature and precipitation in humid subtropical climates: A case study in China. Energy Convers. Manage. 2018, 164, 102–111. [Google Scholar] [CrossRef]
- Benali, L.; Notton, G.; Fouilloy, A.; Voyant, C.; Dizene, R. Solar radiation forecasting using Aartificial Neural Network and Random Forest methods: Application to normal beam, horizontal diffuse and global components. Renew. Energ. 2019, 132, 871–884. [Google Scholar] [CrossRef]
- Khan, M.J.; Yadav, A.K.; Mathew, L. Techno economic feasibility analysis of different combinations of PV-wind-diesel-battery hybrid system for telecommunication applications in different cities of Punjab, India. Renew. Sust. Energy. Rev. 2017, 76, 577–607. [Google Scholar] [CrossRef]
- Malvoni, M.; Giorgi, M.G.D.; Congedo, P.M. Photovoltaic forecast based on hybrid PCA-LSSVM using dimensionality eeducted data. Neurocomputing 2016, 211, 72–83. [Google Scholar] [CrossRef]
- Liu, X.; Mei, X.; Li, Y.; Wang, Q.; Jensen, J.R.; Zhang, Y.; Porter, J.R. Evaluation of temperature- based global solar radiation models in China. Agr. Forest Meteorol. 2009, 149, 1433–1446. [Google Scholar] [CrossRef]
- Wang, Z. Irrigation and drainage engineering; China Agriculture Press: Beijing, 2010; pp. 117–228. (In Chinese) [Google Scholar]
- Duffie, J.A.; Beckman, W.A. Solar engineering of thermal processes; John Wiley and Sons: Madison, 2013; pp. 24–27. [Google Scholar]
- Mirjalili, S.; Lewis, A. The whale optimization algorithm. Adv. Eng. Softw. 2016, 95, 51–67. [Google Scholar] [CrossRef]
- Zhang, L.; Guo, Z.; Tao, Q.; Xiong, Z.; Ye, J. XGBoost-based short-term prediction method for power system inertia and its interpretability. Energy Rep. 2023, 9, 1458–1469. [Google Scholar] [CrossRef]
- Picazo, M.Á.P.; Juárez, J.M.; García-Márquez, D. Consumption Optimization in irrigation networks supplied by a standalone direct pumping photovoltaic system. Sustainability 2018, 110, 2–17. [Google Scholar] [CrossRef]
- Lee, J.; Wang, W.; Harrou, F.; Sun, Y. Reliable solar irradiance prediction using ensemble learning-based models: A comparative study. Energy Convers. Manage. 2020, 208, 112582. [Google Scholar] [CrossRef]
- Chakchak, J.; Cetin, N.S. Investigating the impact of weather parameters selection on the prediction of solar radiation under different genera of cloud cover: A case-study in a subtropical location. Measurement 2021, 176, 109159. [Google Scholar] [CrossRef]
- Mahima; Karakoti, I.; Nandan, H.; Pathak, P.P. An empirical technique to predict monthly mean global solar radiation for PV applications in Indian context. Environ. Prog. Sustain. 2023, 43, e14277. [Google Scholar] [CrossRef]
- Wang, F.; Mi, Z.; Su, S.; Zhao, H. Short-term solar irradiance forecasting model based on Artificial Neural Network using statistical feature parameters. Energies 2012, 5, 1355–1370. [Google Scholar] [CrossRef]
- Eseye, T.A.; Zhang, J.; Zheng, D. Short-term photovoltaic solar power forecasting using a hybrid Wavelet-PSO-SVM model based on SCADA and Meteorological information. Renew. Energ. 2018, 118, 357–367. [Google Scholar] [CrossRef]
Figure 1.
Schematic diagram of a PV power supply system for a mobile sprinkler irrigation machine.
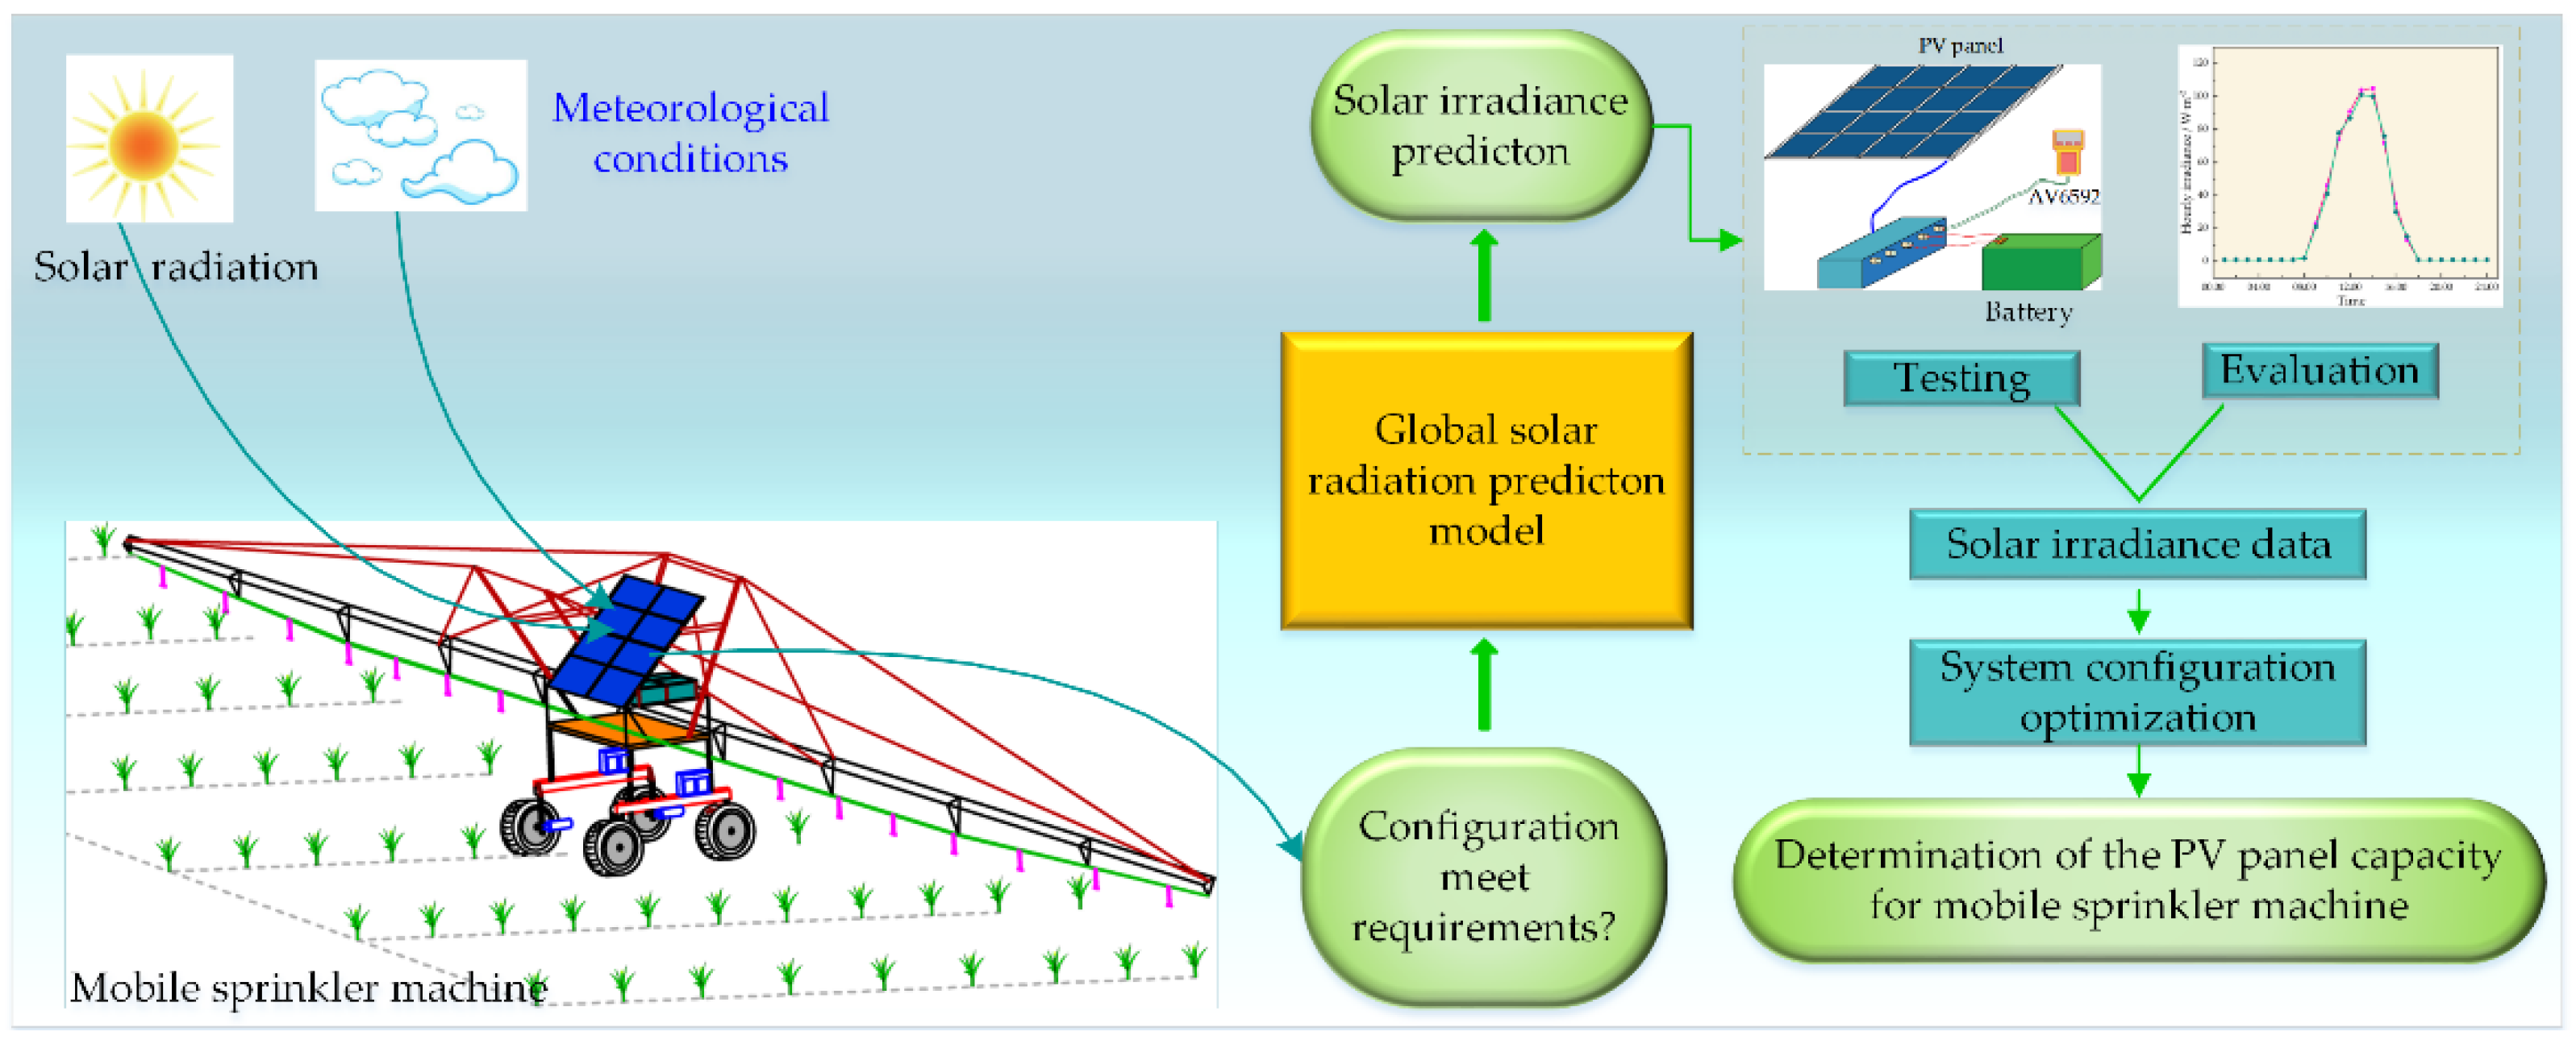
Figure 2.
Physical object and composition of the mobile sprinkler machine, where 1-5 represent the PV panel, battery, controller, stepper motor, and reducer, respectively.
Figure 2.
Physical object and composition of the mobile sprinkler machine, where 1-5 represent the PV panel, battery, controller, stepper motor, and reducer, respectively.
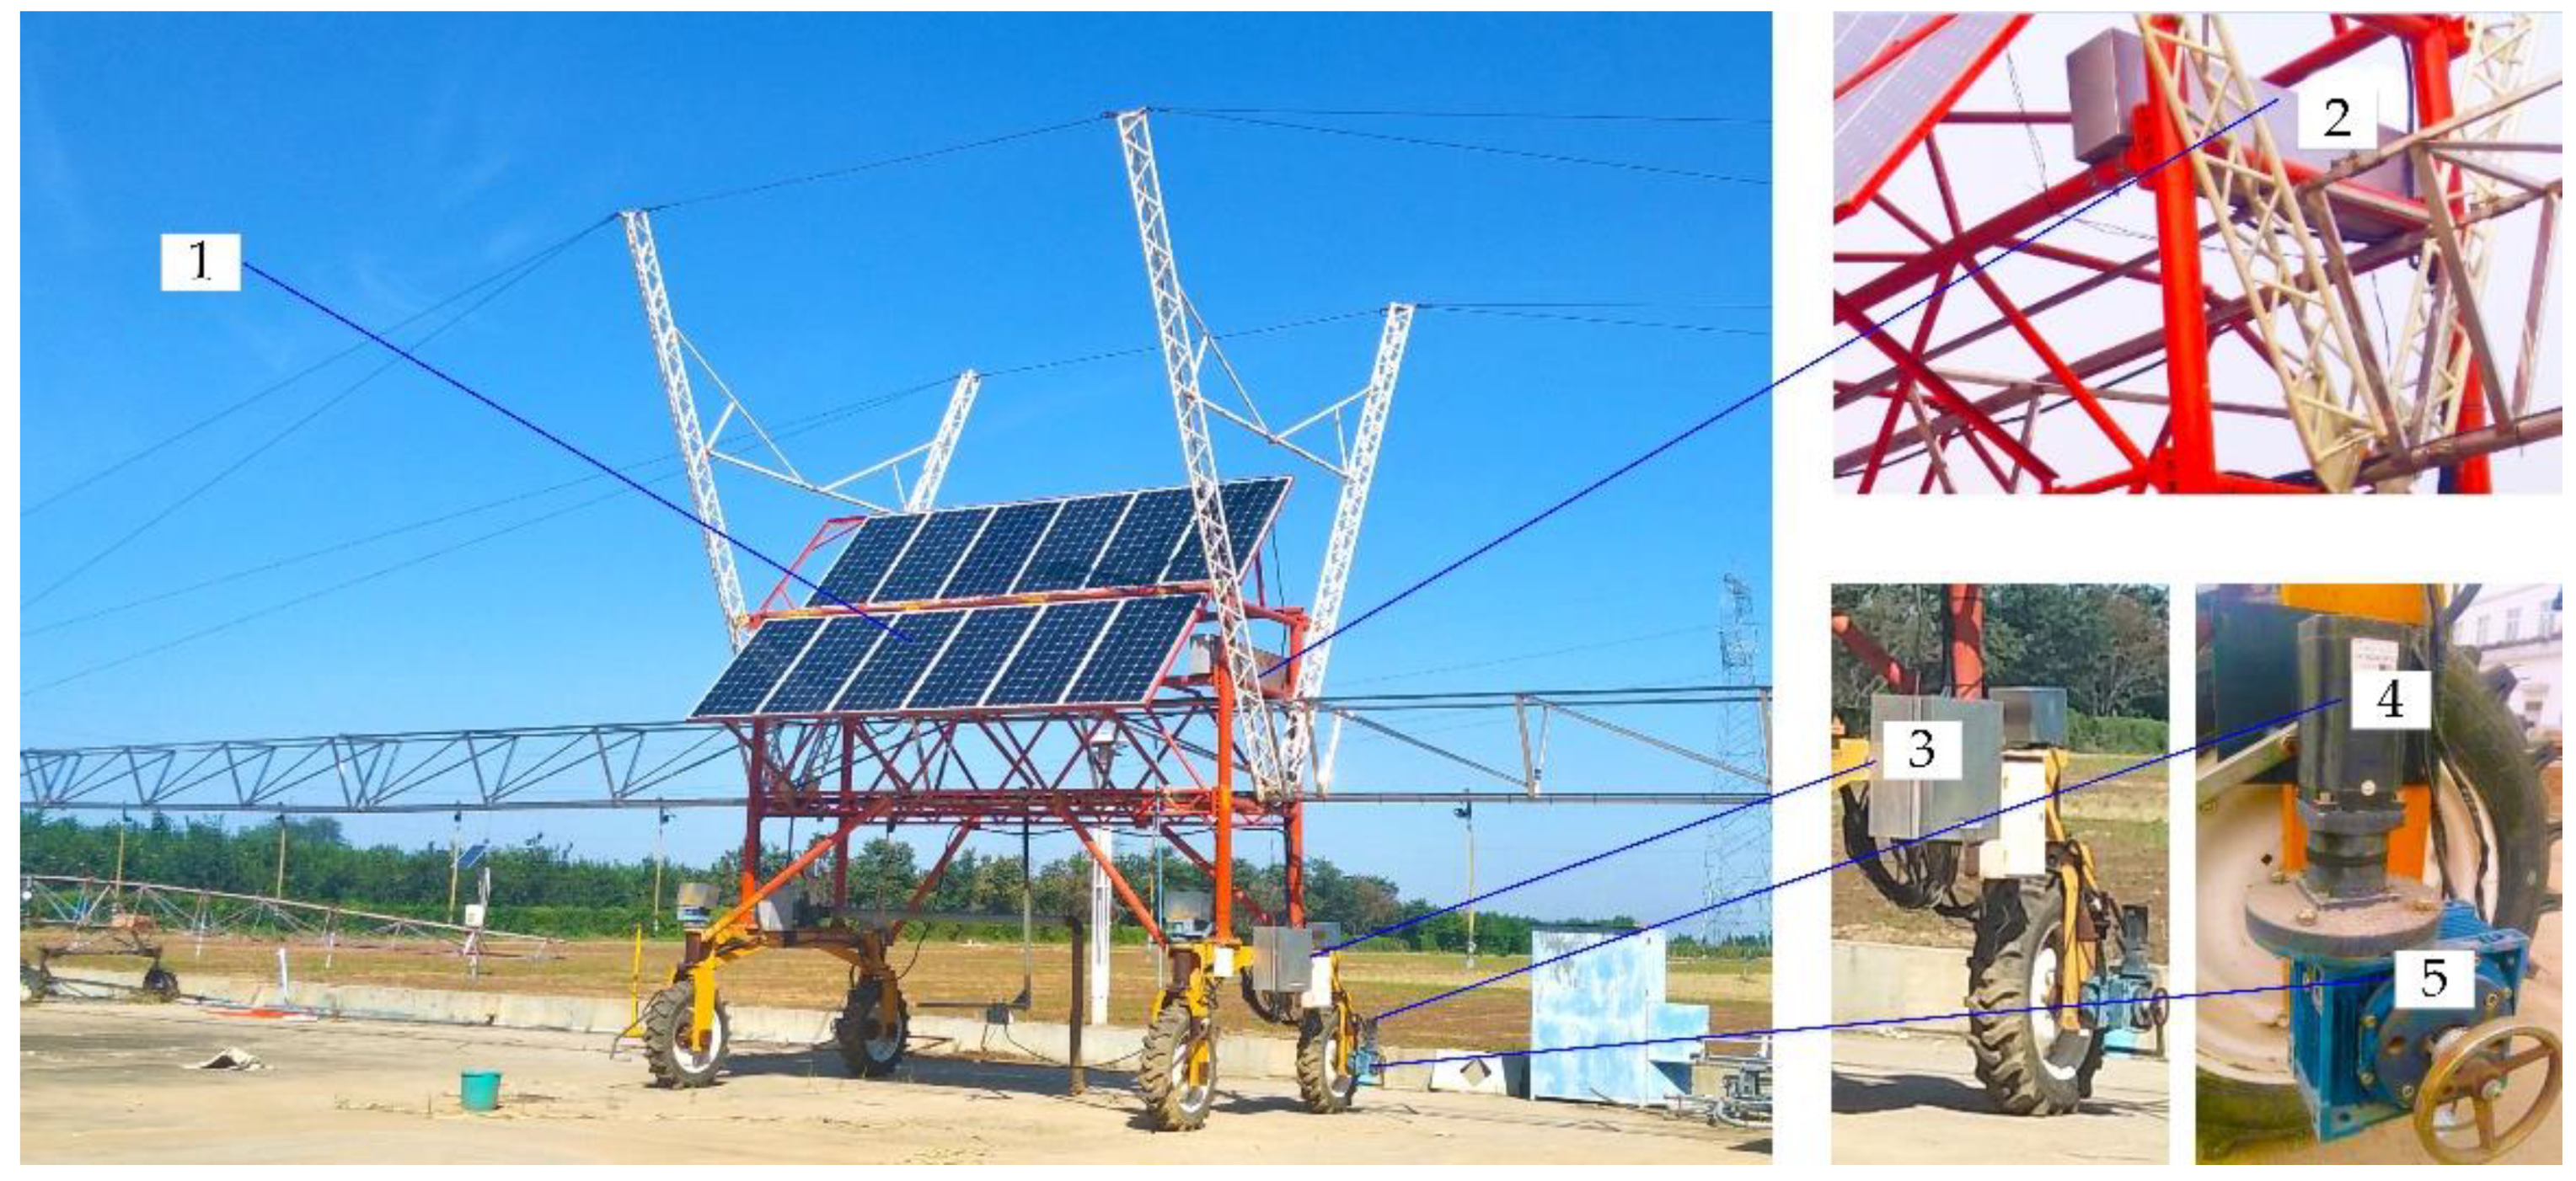
Figure 3.
The geographical locations of the ten weather stations.
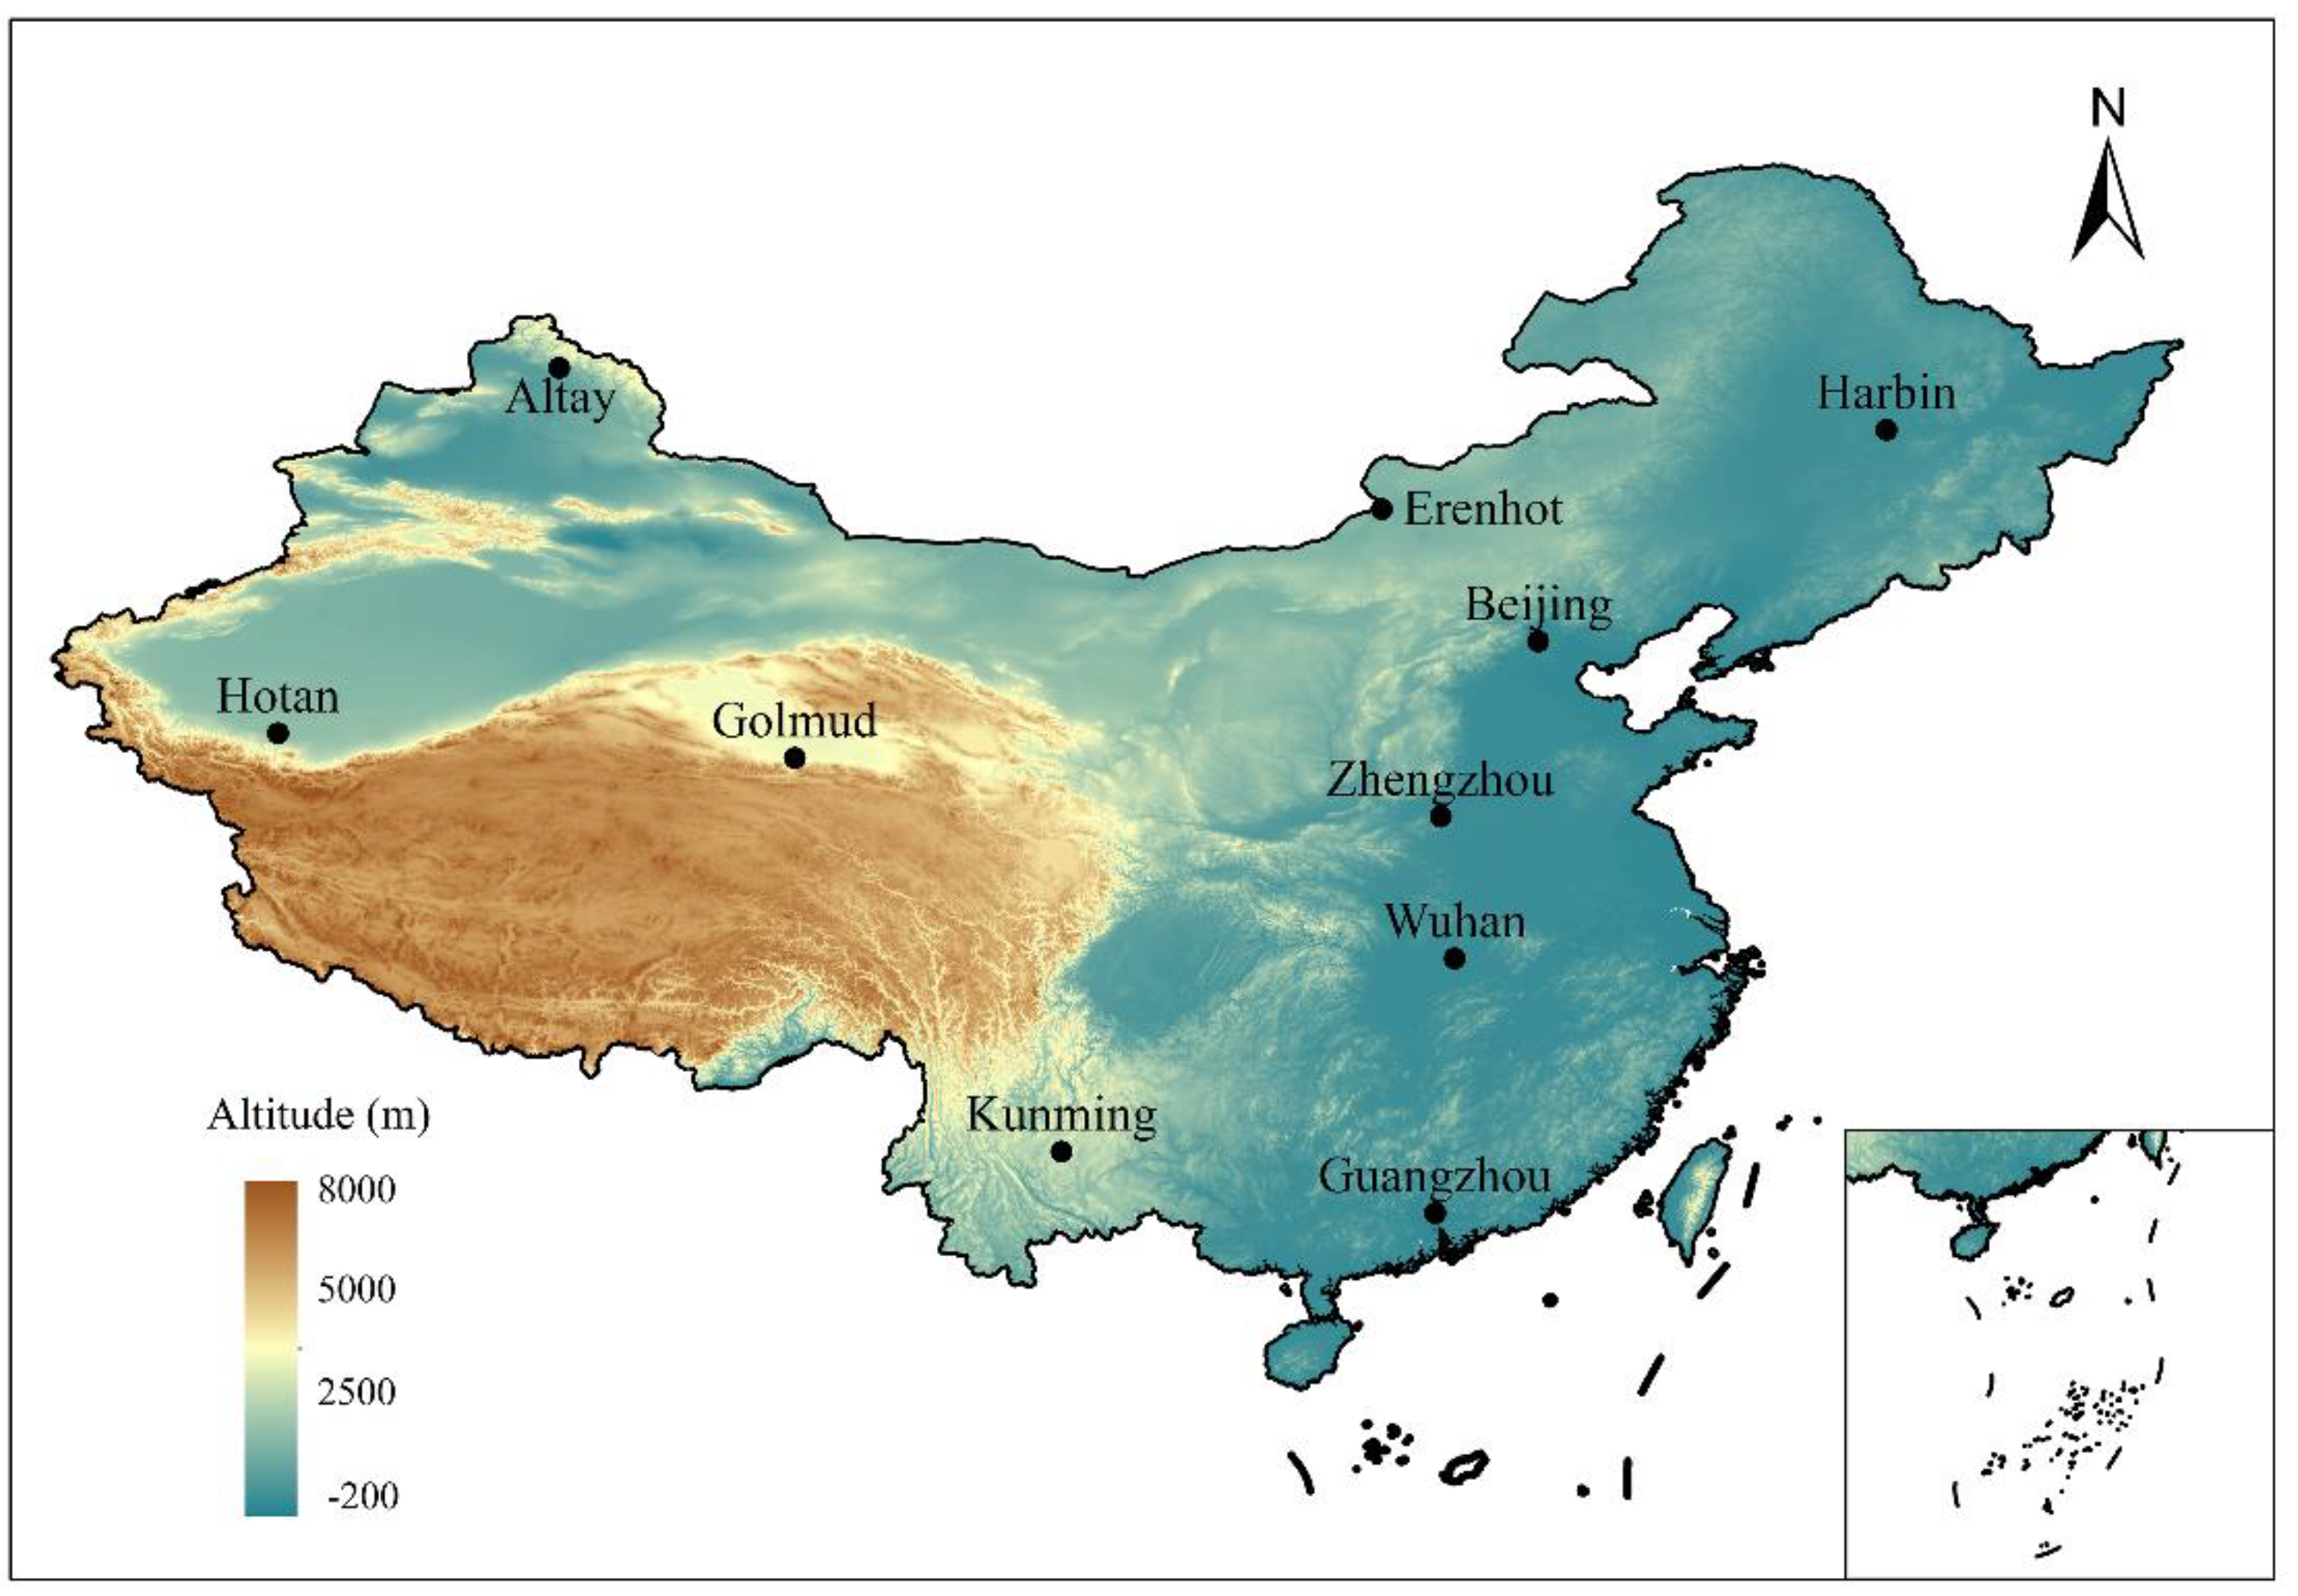
Figure 4.
Flowchart of the proposed methodology.
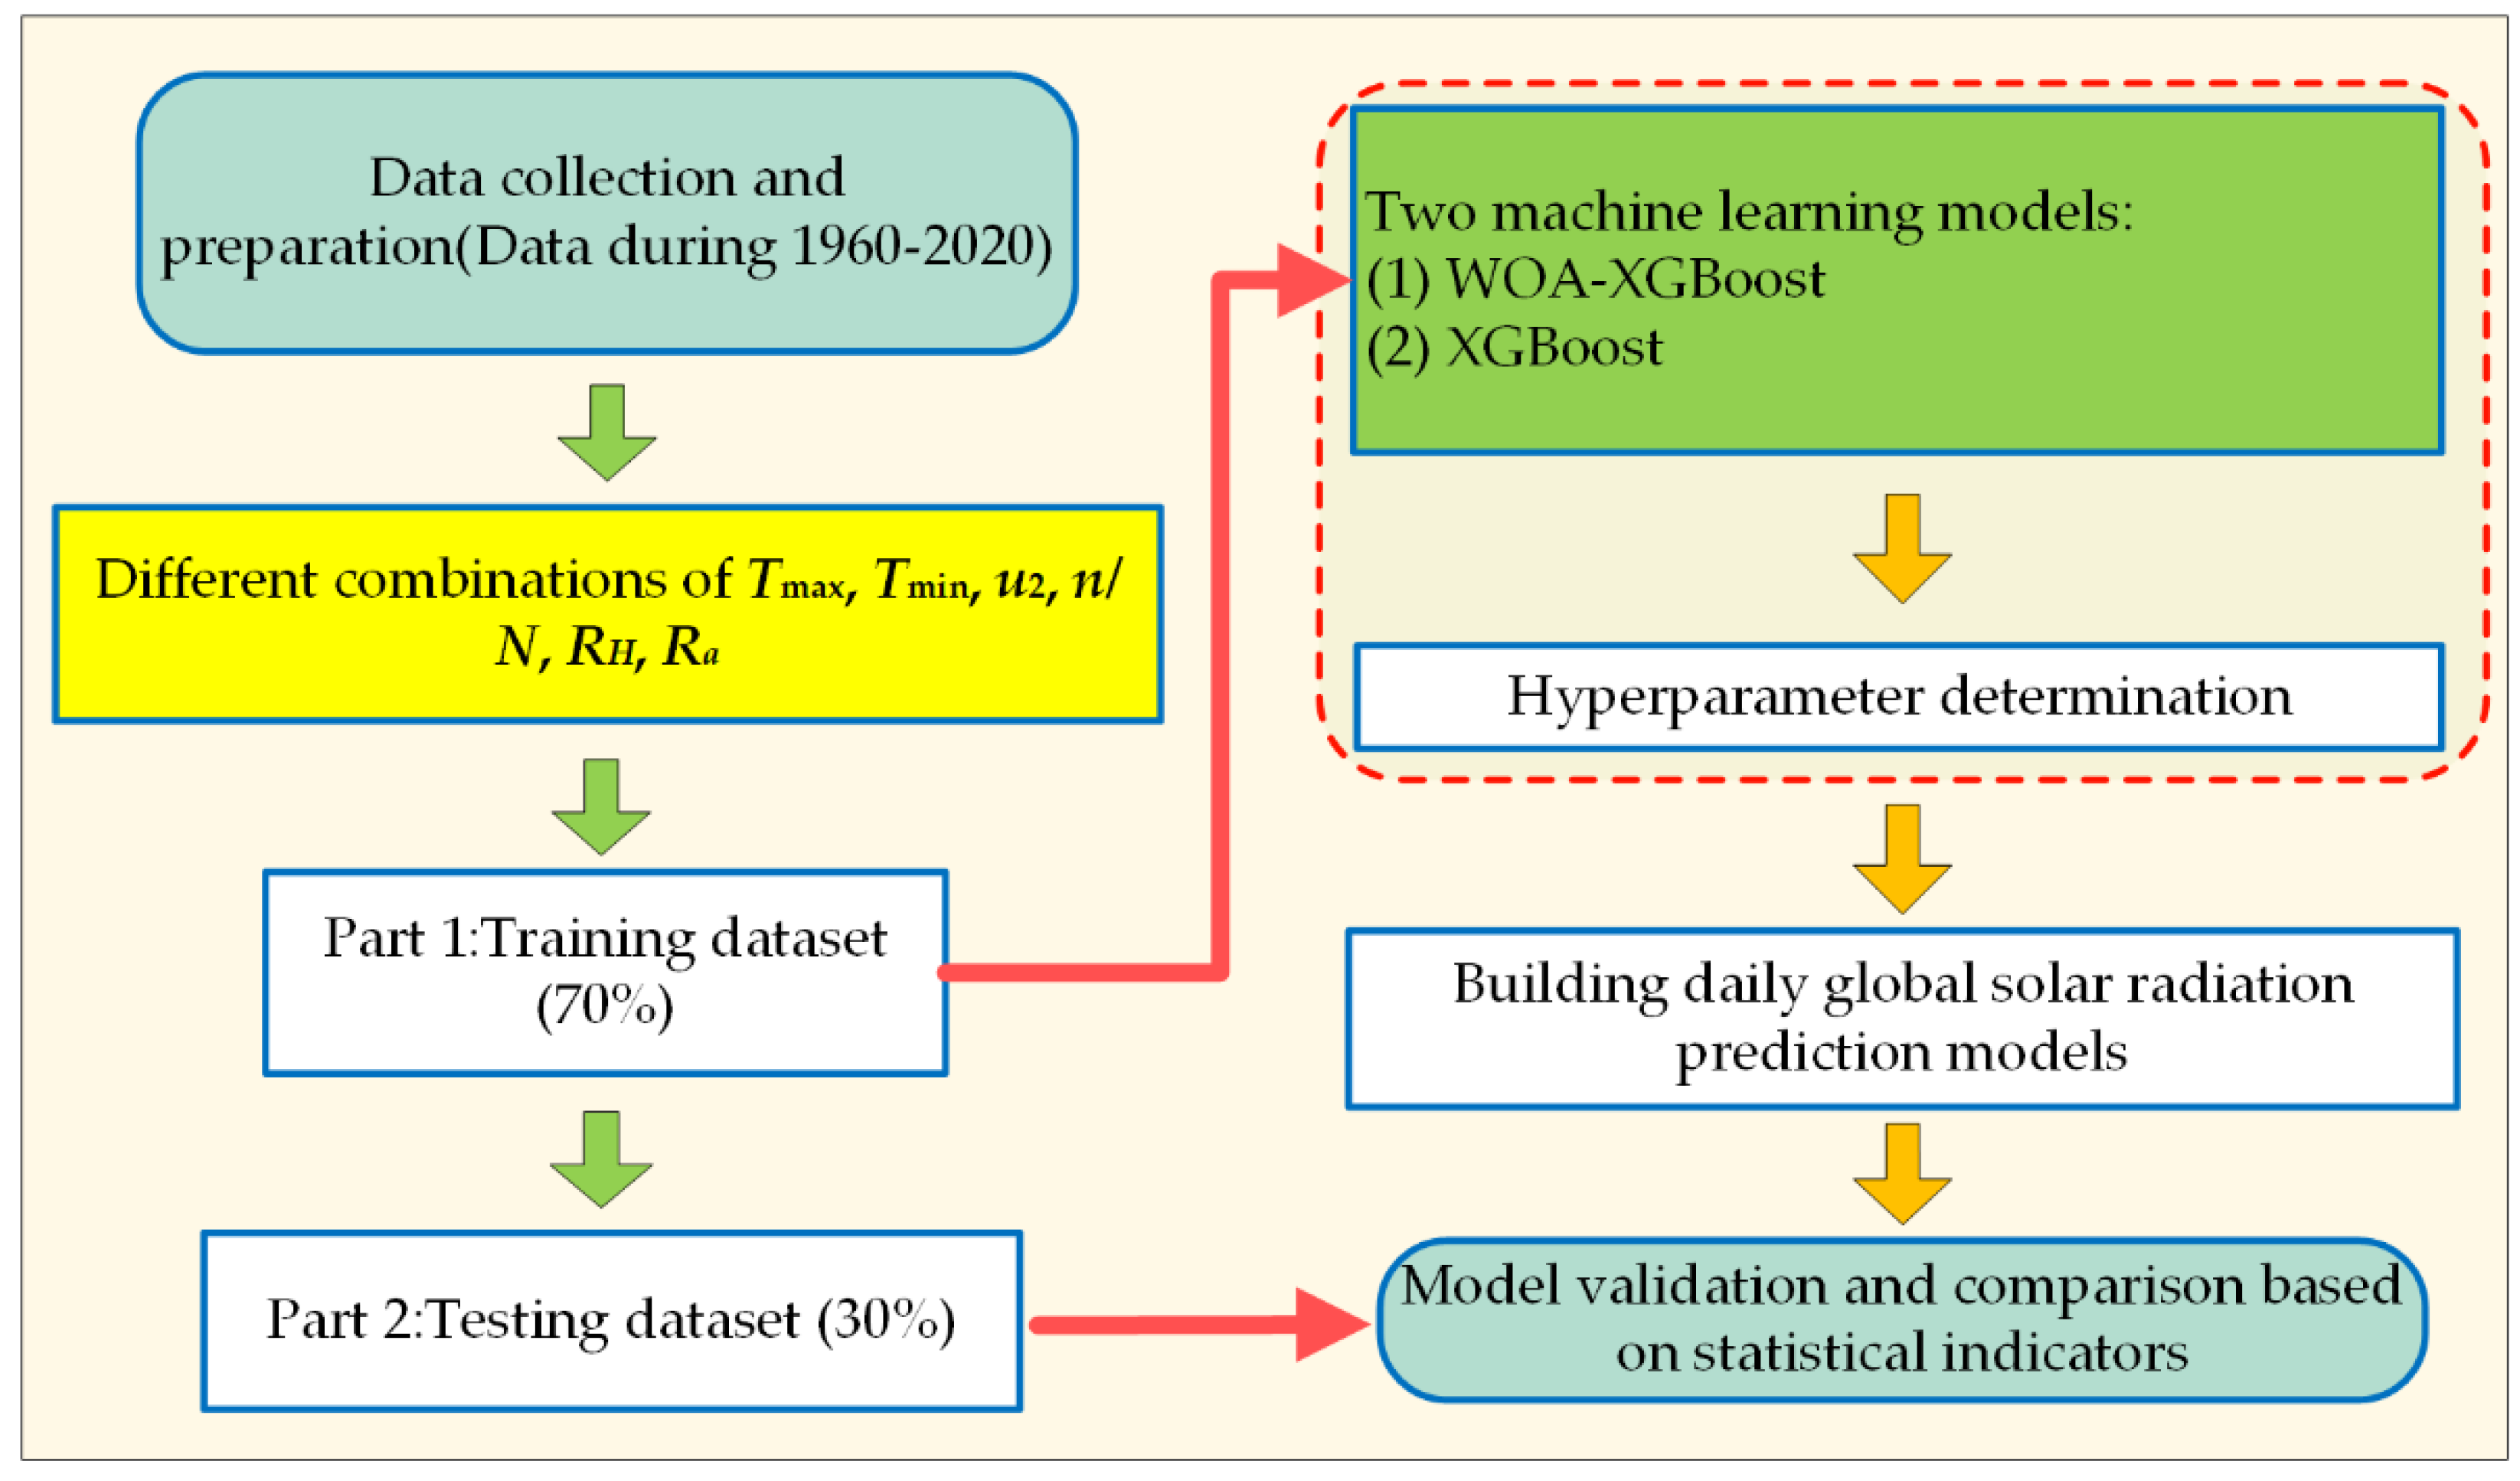
Figure 5.
Scatter plots of the predicted daily global solar radiation versus the corresponding measured values for the testing phase at the (a) Harbin, (b) Altay, (c) Golmud, (d) Beijing, (e) Erenhot, (f) Kunming, (g) Zhengzhou, (h) Wuhan, (i) Guangzhou, and (j) Hotan stations. Note that the straight lines represent the 1:1 line.
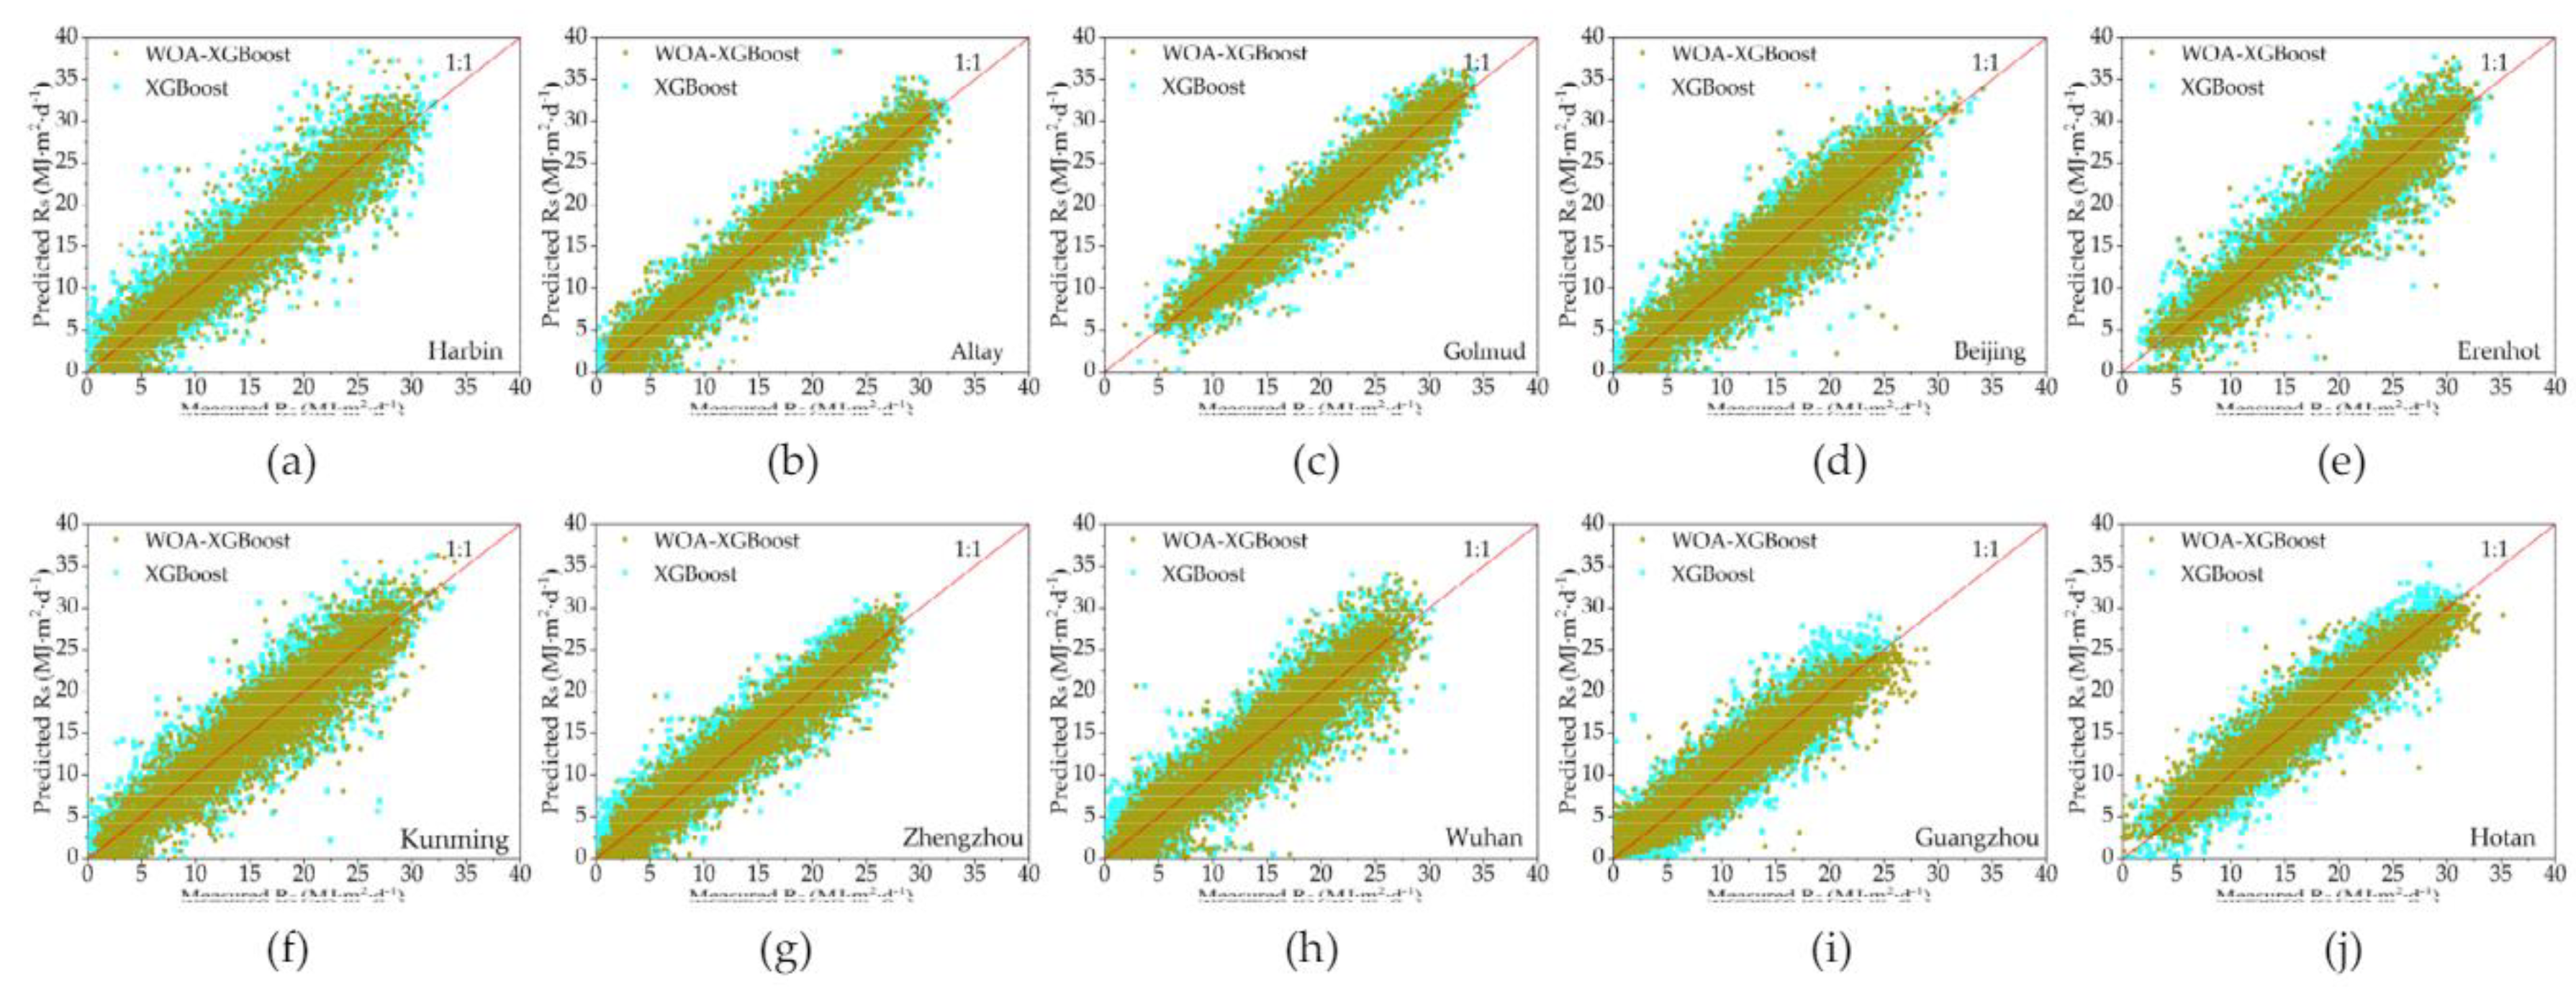
Figure 6.
Percentage increase in testing RMSE over training RMSE for the WOA-XGBoost and XGBoost models.
Figure 6.
Percentage increase in testing RMSE over training RMSE for the WOA-XGBoost and XGBoost models.
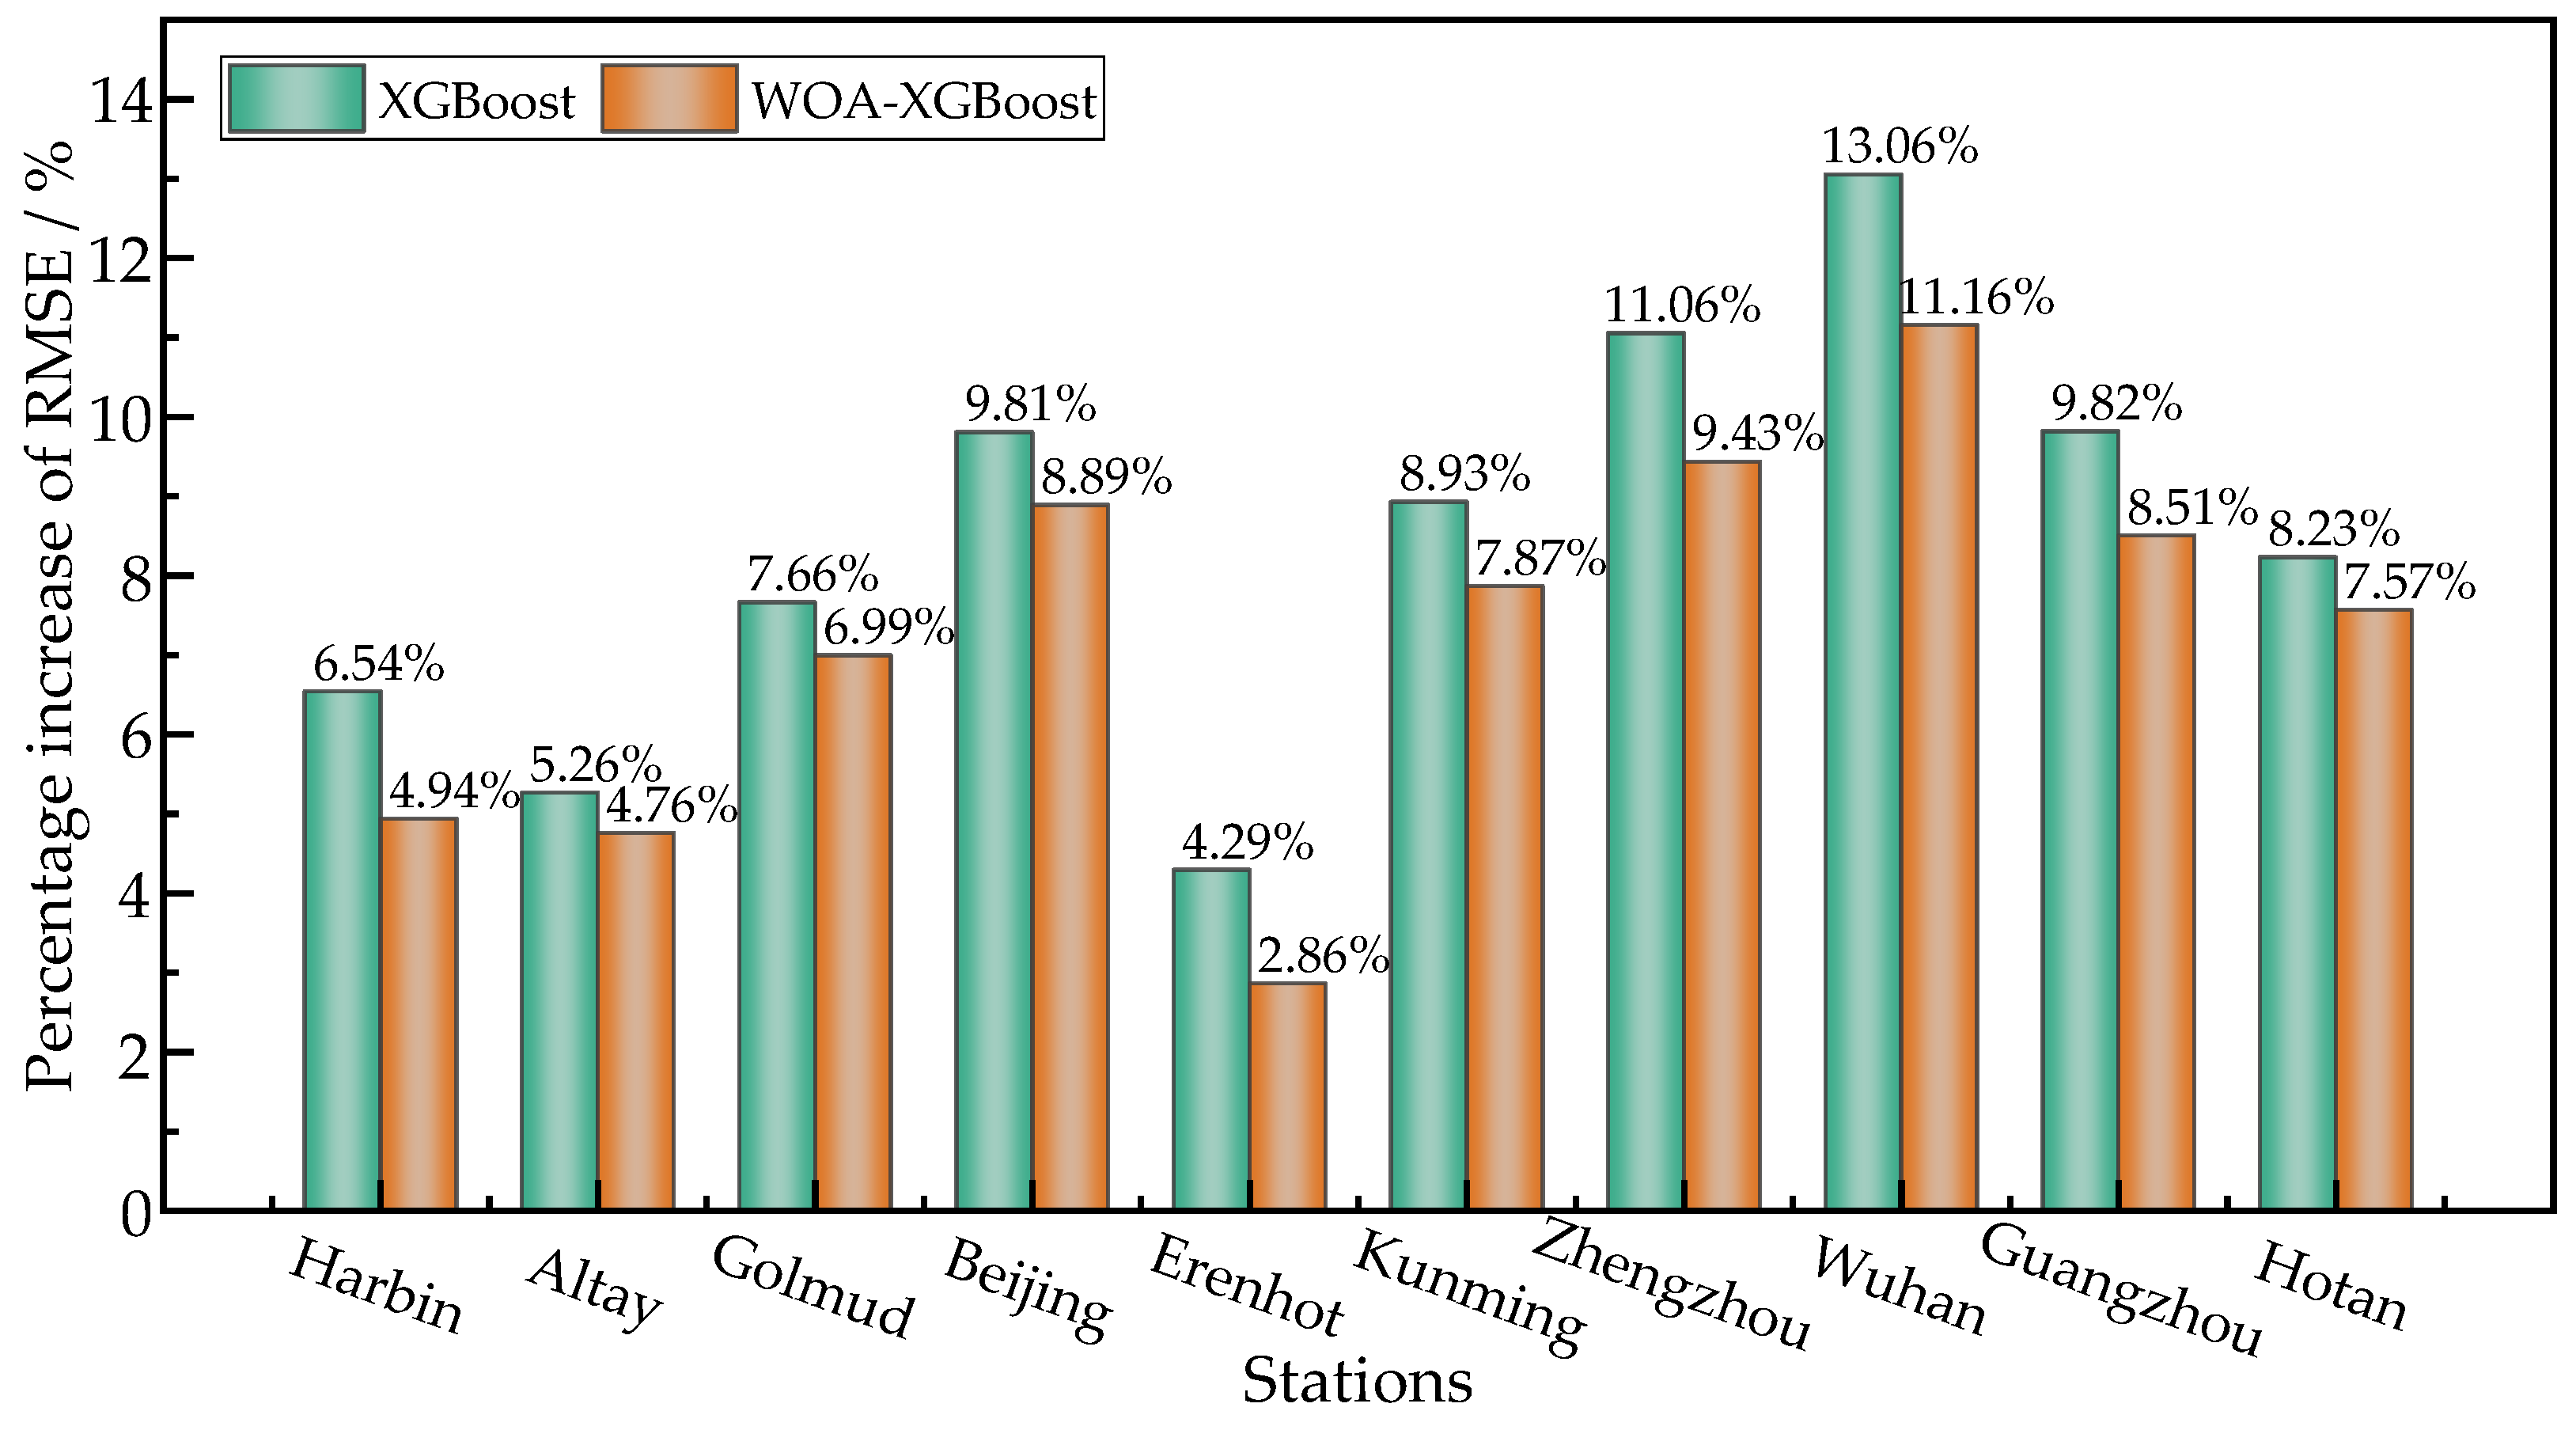
Figure 7.
The experimental platform: (a) Mobile sprinkler machine, and (b) PVPG testing system.
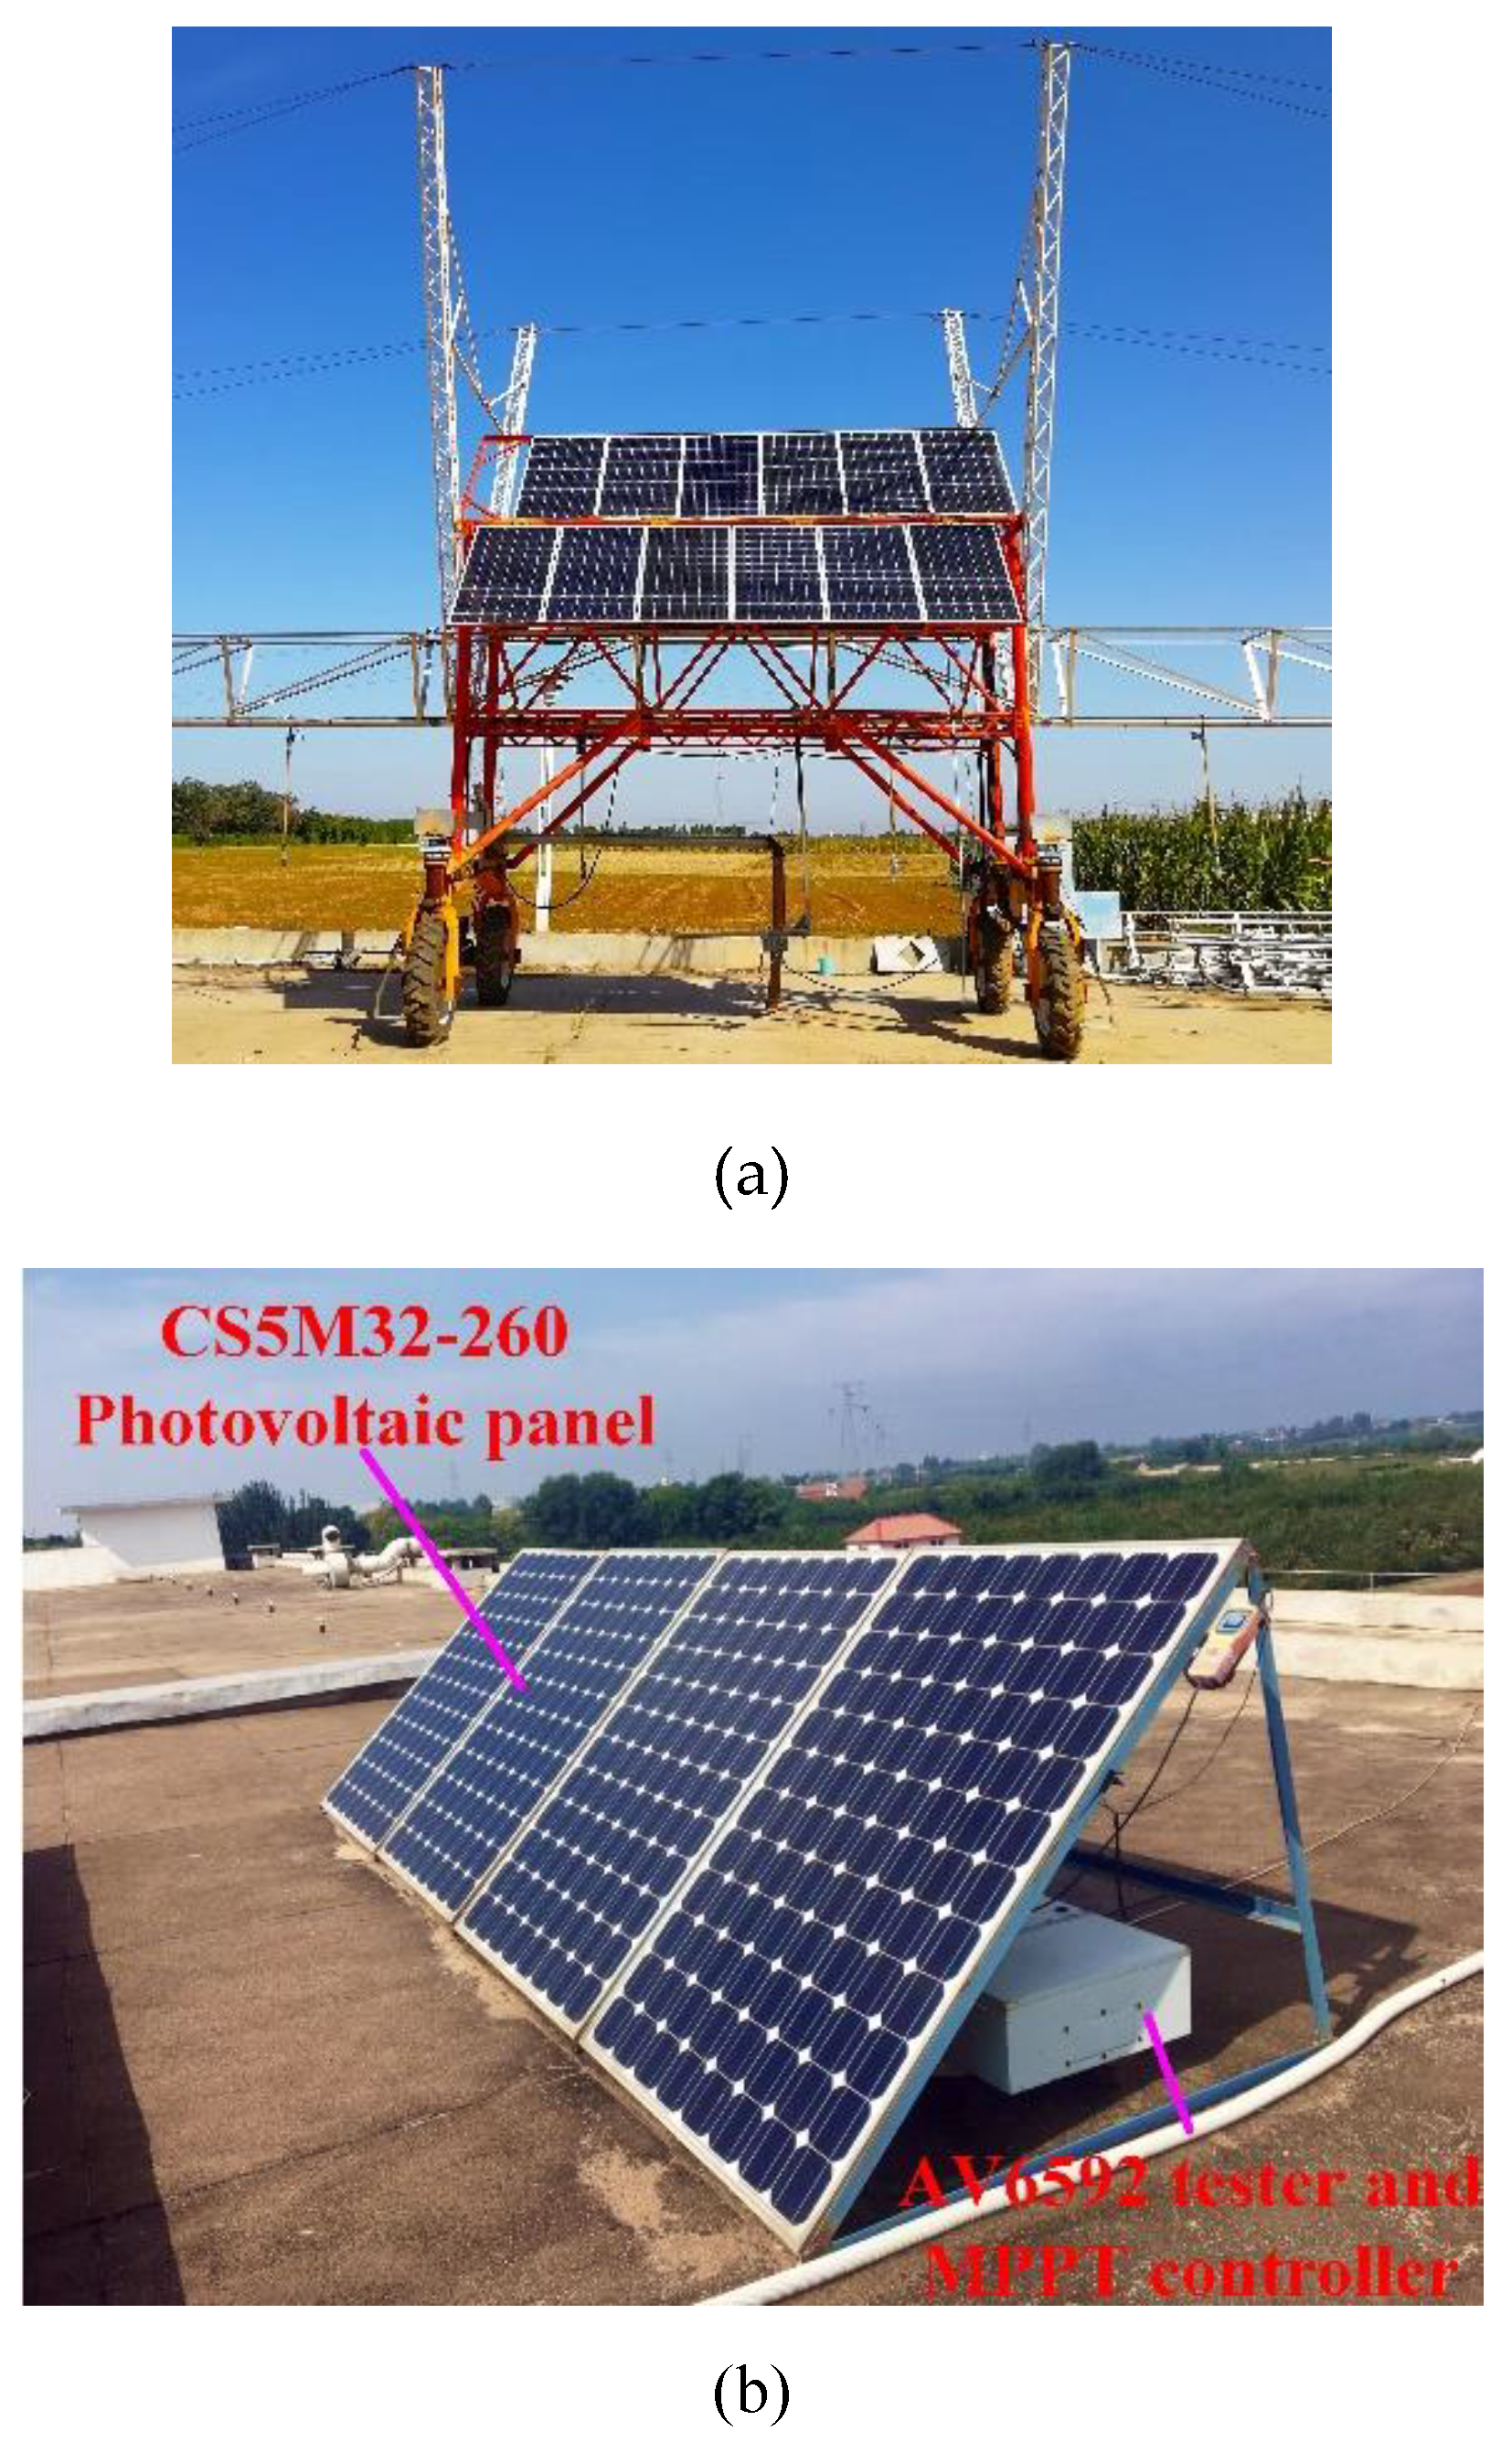
Figure 8.
Comparison between the predicted and measured hourly irradiance values in (a) December 15, 2021, and (b) June 28, 2021.
Figure 8.
Comparison between the predicted and measured hourly irradiance values in (a) December 15, 2021, and (b) June 28, 2021.
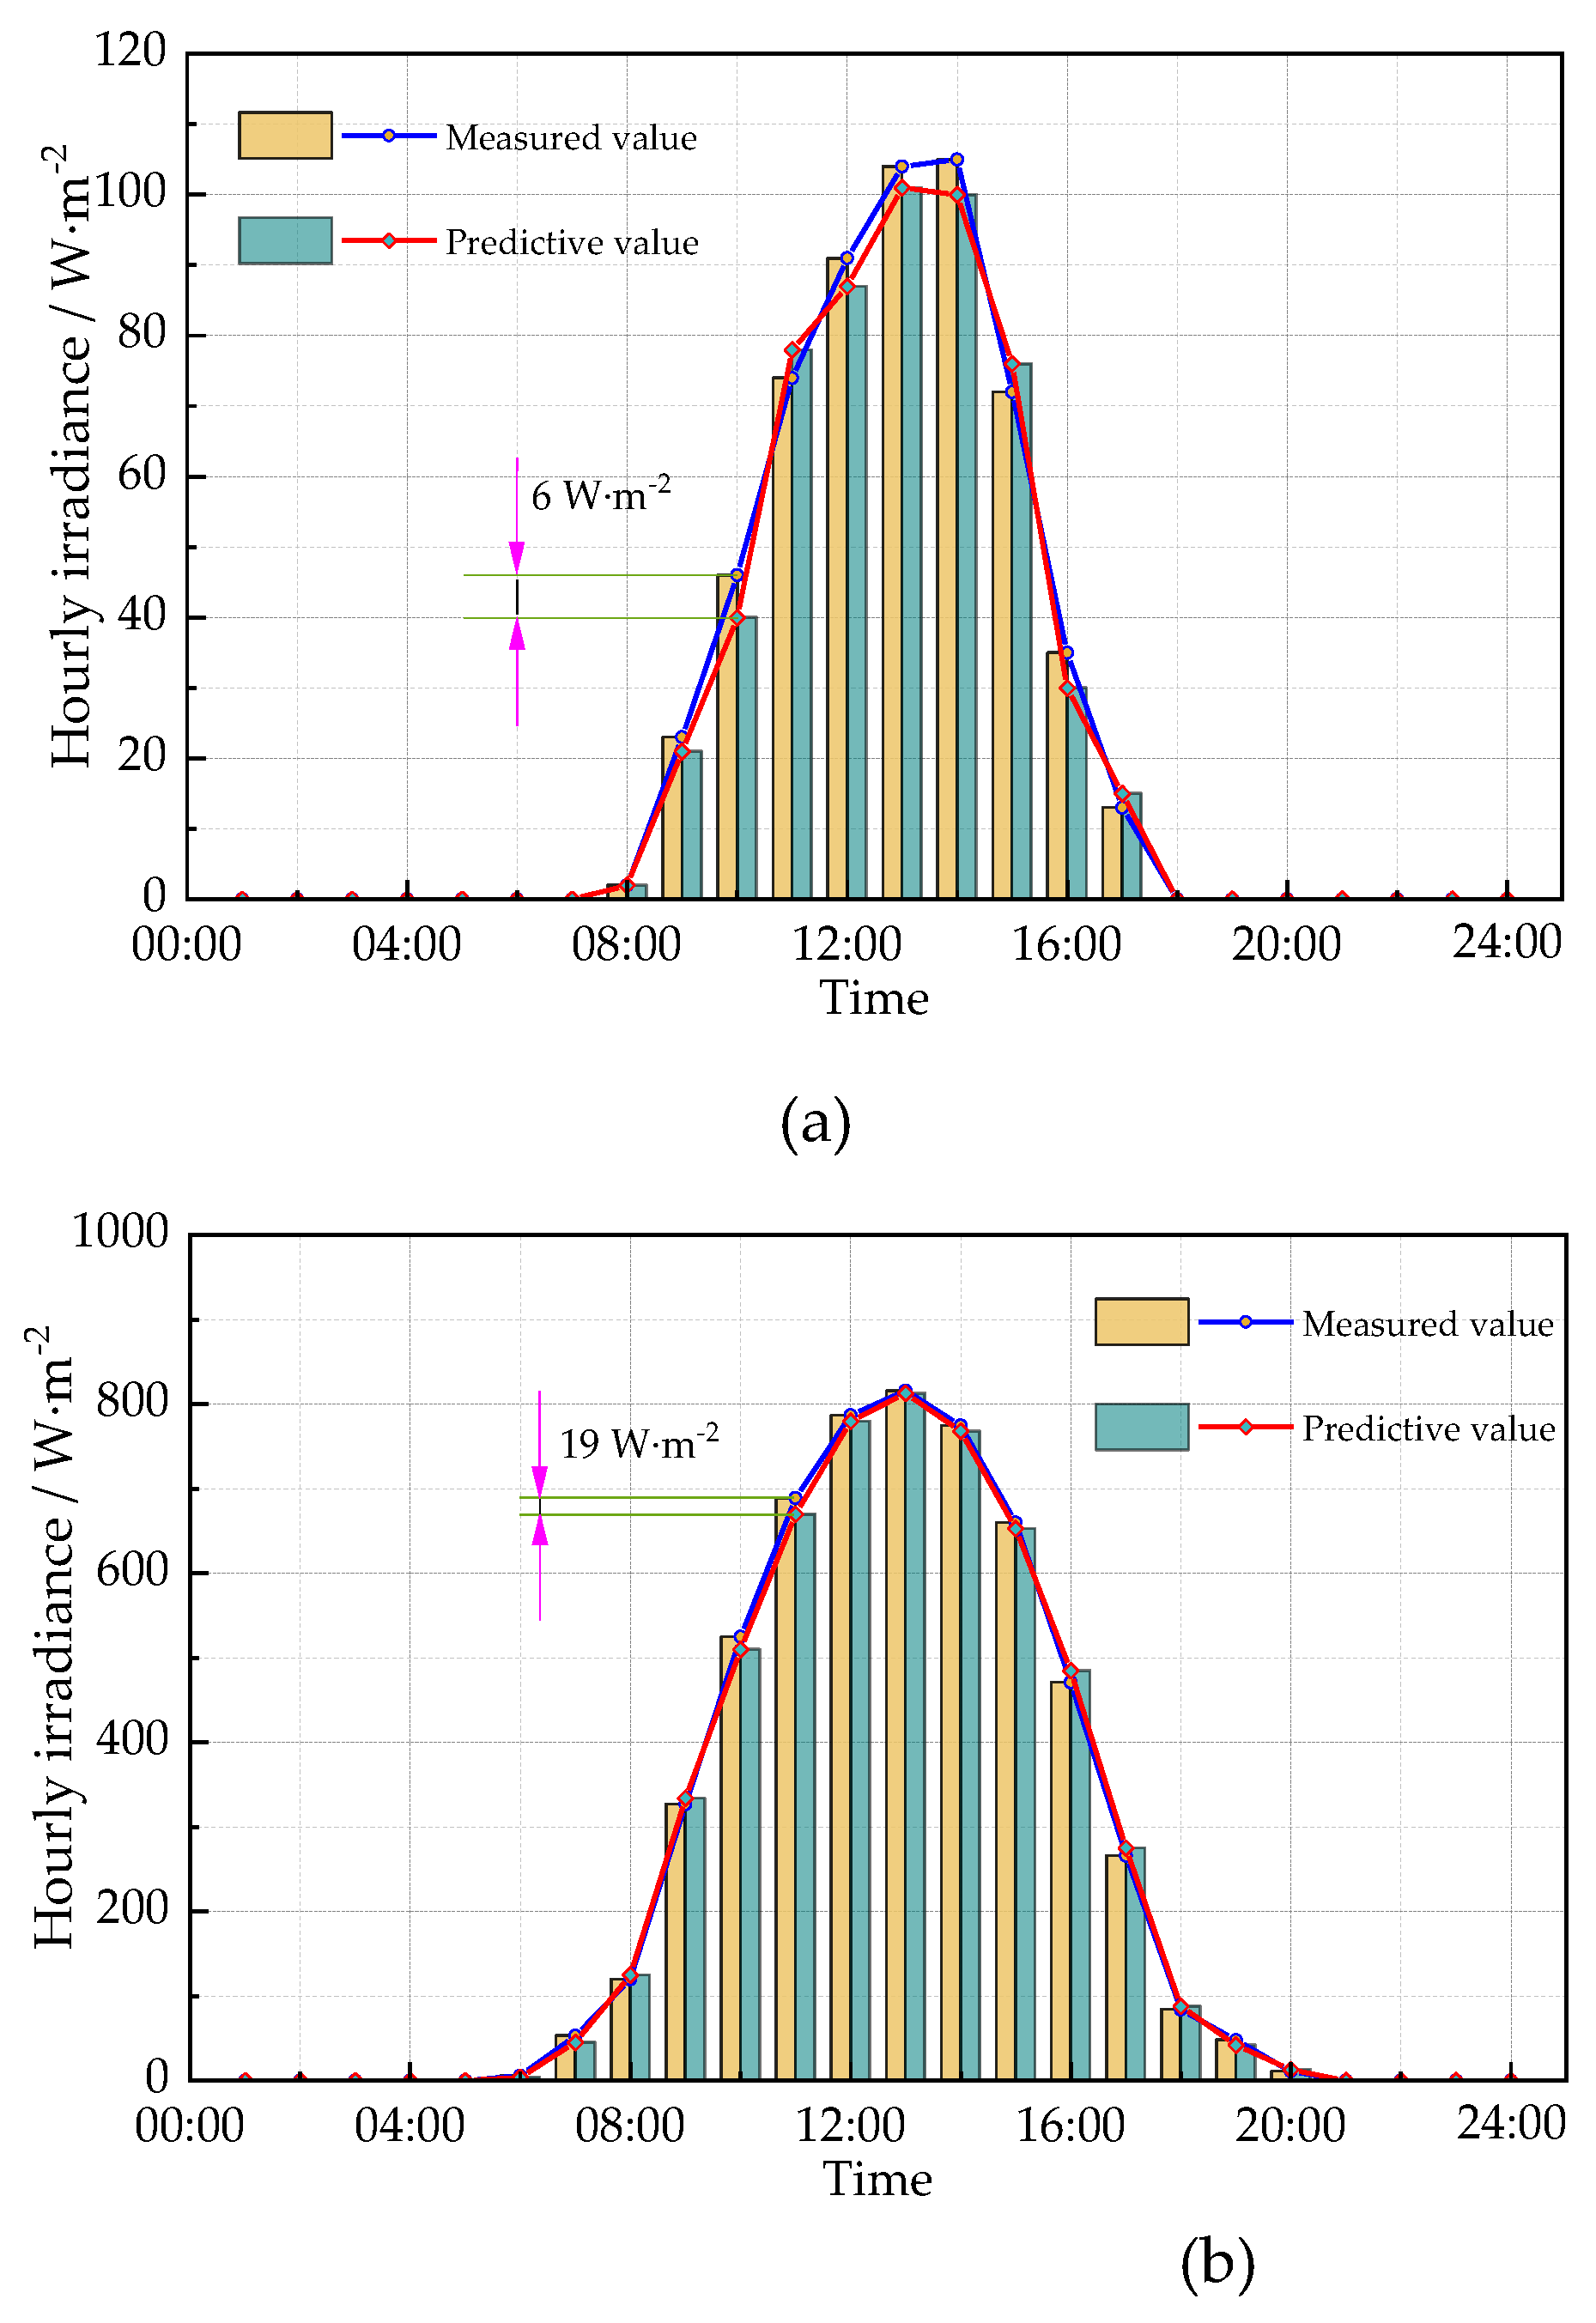

Table 1.
Main performance parameters of the sprinkler.
| Items | Value | Items | Value |
|---|---|---|---|
| Total weight /kg | 3500 | Working speed /m·s-1 | ≤ 1.0 |
| Truss length /m | 70 | Nozzle spacing /m | 3 |
| Spray range /m | 72~76 | Ground clearance /m | 1.8 |
| The unit flow /(m3·h-1) | ≤ 48 | Inlet pressure of sprinkler /MPa | 0.1 |
Table 2.
Spatiotemporal distribution of ten weather stations.
| Station code | Station name | Longitude /N |
Latitude /E |
Altitude /m |
Extraterrestrial radiation Ra /MJ·m-2·d-1 |
Sunlight hours n /h·d-1 |
Maximum temperature Tmax /oC |
Minimum temperature Tmin /oC |
Relative humidity RH /% |
Wind speed w /m·s-1 |
||
|---|---|---|---|---|---|---|---|---|---|---|---|---|
| 50953 | Harbin | 126.46 | 45.45 | 146 | 12.96 | 6.76 | 10.24 | -0.94 | 65.02 | 3.32 | ||
| 51076 | Altay | 88.05 | 47.44. | 735.1 | 82.00 | 1.52 | 10.92 | -1.19 | 58.03 | 2.28 | ||
| 52818 | Golmud | 94.38 | 36.12 | 2806.1 | 19.10 | 8.42 | 13.07 | -1.25 | 32.25 | 2.64 | ||
| 54511 | Beijing | 116.19 | 39.35 | 29.4 | 14.35 | 7.20 | 18.09 | 7.42 | 56.06 | 2.43 | ||
| 53068 | Erenhot | 111.32 | 44.13 | 964.8 | 17.30 | 8.77 | 11.98 | -2.19 | 47.18 | 3.97 | ||
| 56778 | Kunming | 102.41 | 25.01 | 1891.3 | 15.04 | 6.19 | 21.13 | 10.67 | 71.42 | 2.14 | ||
| 57083 | Zhengzhou | 113.39 | 34.43 | 109 | 13.29 | 5.81 | 20.37 | 9.84 | 64.35 | 2.51 | ||
| 57494 | Wuhan | 114.17 | 30.38 | 22.8 | 12.19 | 5.28 | 21.44 | 13.19 | 76.98 | 1.95 | ||
| 59287 | Guangzhou | 113.19 | 23.08 | 6.3 | 11.82 | 4.58 | 26.55 | 18.99 | 76.93 | 1.83 | ||
| 51828 | Hotan | 79.55 | 37.07 | 1374.6 | 16.20 | 7.22 | 19.36 | 7.36 | 41.18 | 1.94 | ||
Table 3.
The combinations of the input meteorological factors.
| Codes | Combinations | |
|---|---|---|
| A1 | Tmax, Tmin, u2, n/N, RH, Ra | |
| A2 | Tmax, Tmin, u2, n/N, Ra | |
| A3 | Tmax, Tmin, u2, RH, Ra | |
| A4 | Tmax, Tmin, n/N, RH, Ra | |
Table 4.
Evaluation metrics calculated on the results of daily global solar radiation estimation obtained by the WOA-XGBoost model.
Table 4.
Evaluation metrics calculated on the results of daily global solar radiation estimation obtained by the WOA-XGBoost model.
| Station | Codes | Training | Testing | ||||||
|---|---|---|---|---|---|---|---|---|---|
| R2 | RMSE/ MJ·m-2·d-1 |
MAE/ MJ·m-2·d-1 |
MSE/ MJ·m-2·d-1 | R2 | RMSE/ MJ·m-2·d-1 |
MAE/ MJ·m-2·d-1 |
MSE/ MJ·m-2·d-1 | ||
| Harbin station(50953) | A1 | 0.936 | 2.021 | 1.477 | 4.121 | 0.922 | 2.126 | 1.427 | 4.958 |
| A2 | 0.924 | 2.132 | 1.511 | 4.987 | 0.901 | 2.341 | 1.506 | 5.304 | |
| A3 | 0.805 | 3.015 | 2.213 | 10.013 | 0.812 | 3.378 | 2.345 | 11.645 | |
| A4 | 0.919 | 2.044 | 1.501 | 4.447 | 0.911 | 2.198 | 1.525 | 5.168 | |
| Altay station(51076) | A1 | 0.963 | 1.642 | 1.174 | 3.017 | 0.962 | 1.724 | 1.197 | 3.334 |
| A2 | 0.958 | 1.705 | 1.209 | 3.258 | 0.953 | 1.828 | 1.255 | 3.436 | |
| A3 | 0.901 | 2.988 | 2.122 | 9.877 | 0.876 | 3.309 | 2.303 | 11.089 | |
| A4 | 0.959 | 1.736 | 1.203 | 3.104 | 0.957 | 1.881 | 1.271 | 3.563 | |
| Golmud station(52818) | A1 | 0.961 | 1.423 | 1.009 | 2.347 | 0.962 | 1.530 | 1.058 | 2.690 |
| A2 | 0.955 | 1.607 | 1.132 | 2.658 | 0.948 | 1.606 | 1.137 | 2.907 | |
| A3 | 0.874 | 2.875 | 2.021 | 9.104 | 0.845 | 2.997 | 2.212 | 9.335 | |
| A4 | 0.951 | 1.533 | 1.011 | 2.612 | 0.957 | 1.623 | 1.117 | 2.882 | |
| Beijing station(54511) | A1 | 0.954 | 1.455 | 1.092 | 2.616 | 0.941 | 1.597 | 1.164 | 3.224 |
| A2 | 0.947 | 1.656 | 1.201 | 2.996 | 0.935 | 1.880 | 1.215 | 3.457 | |
| A3 | 0.889 | 2.788 | 2.065 | 8.565 | 0.811 | 3.137 | 2.138 | 9.806 | |
| A4 | 0.950 | 1.703 | 1.137 | 3.008 | 0.939 | 1.609 | 1.288 | 3.487 | |
| Erenhot station(53068) | A1 | 0.944 | 1.936 | 1.152 | 3.904 | 0.929 | 1.993 | 1.406 | 4.427 |
| A2 | 0.938 | 2.011 | 1.265 | 4.156 | 0.921 | 2.038 | 1.411 | 4.786 | |
| A3 | 0.885 | 3.164 | 2.188 | 10.841 | 0.802 | 3.508 | 2.389 | 12.942 | |
| A4 | 0.943 | 1.979 | 1.139 | 4.026 | 0.923 | 2.019 | 1.277 | 4.457 | |
| Kunming station(56778) | A1 | 0.896 | 2.214 | 1.673 | 5.595 | 0.877 | 2.403 | 1.683 | 6.312 |
| A2 | 0.881 | 2.145 | 1.764 | 5.976 | 0.858 | 2.531 | 1.795 | 6.746 | |
| A3 | 0.805 | 3.013 | 2.334 | 9.801 | 0.816 | 3.181 | 2.397 | 10.586 | |
| A4 | 0.878 | 2.256 | 1.764 | 5.935 | 0.867 | 2.368 | 1.801 | 6.449 | |
| Zhengzhou station(57083) | A1 | 0.950 | 1.584 | 1.175 | 3.067 | 0.942 | 1.749 | 1.262 | 3.598 |
| A2 | 0.935 | 1.735 | 1.315 | 3.542 | 0.927 | 1.965 | 1.343 | 4.021 | |
| A3 | 0.864 | 3.020 | 2.124 | 9.610 | 0.801 | 3.241 | 2.402 | 10.765 | |
| A4 | 0.945 | 1.763 | 1.214 | 3.273 | 0.932 | 1.721 | 1.335 | 3.744 | |
| Wuhan station(57494) | A1 | 0.932 | 2.053 | 1.577 | 5.206 | 0.920 | 2.311 | 1.701 | 5.996 |
| A2 | 0.926 | 2.152 | 1.620 | 5.510 | 0.902 | 2.434 | 1.814 | 6.416 | |
| A3 | 0.875 | 3.204 | 2.112 | 9.997 | 0.816 | 3.483 | 2.543 | 12.743 | |
| A4 | 0.922 | 2.143 | 1.526 | 5.426 | 0.904 | 2.403 | 1.651 | 6.157 | |
| Guangzhou station(59287) | A1 | 0.938 | 1.624 | 1.243 | 3.454 | 0.925 | 1.775 | 1.413 | 4.108 |
| A2 | 0.905 | 1.954 | 1.392 | 4.071 | 0.891 | 2.002 | 1.442 | 4.703 | |
| A3 | 0.849 | 2.553 | 1.678 | 7.486 | 0.810 | 2.589 | 2.071 | 8.864 | |
| A4 | 0.915 | 1.911 | 1.402 | 3.589 | 0.905 | 1.788 | 1.344 | 4.234 | |
| Hotan station(51828) | A1 | 0.942 | 1.612 | 1.193 | 3.012 | 0.935 | 1.744 | 1.239 | 3.576 |
| A2 | 0.931 | 1.689 | 1.202 | 3.223 | 0.921 | 1.670 | 1.321 | 3.654 | |
| A3 | 0.859 | 2.743 | 2.003 | 8.401 | 0.803 | 2.989 | 2.113 | 9.423 | |
| A4 | 0.933 | 1.685 | 1.167 | 3.179 | 0.925 | 1.758 | 1.302 | 3.584 | |
Table 5.
Statistical indices calculated on the results obtained by the WOA-XGBoost and XGBoost models during training and testing phases.
Table 5.
Statistical indices calculated on the results obtained by the WOA-XGBoost and XGBoost models during training and testing phases.
| Model | Training | Testing | ||||||
| R2 | RMSE/ MJ·m-2·d-1 |
MAE/ MJ·m-2·d-1 |
MSE/ MJ·m-2·d-1 |
R2 | RMSE/ MJ·m-2·d-1 |
MAE/ MJ·m-2·d-1 |
MSE/ MJ·m-2·d-1 | |
| WOA-XGBoost | 0.938 | 1.987 | 1.442 | 4.002 | 0.929 | 2.142 | 1.531 | 4.786 |
| XGBoost | 0.925 | 2.102 | 1.493 | 4.034 | 0.912 | 2.298 | 1.598 | 4.858 |
Disclaimer/Publisher’s Note: The statements, opinions and data contained in all publications are solely those of the individual author(s) and contributor(s) and not of MDPI and/or the editor(s). MDPI and/or the editor(s) disclaim responsibility for any injury to people or property resulting from any ideas, methods, instructions or products referred to in the content. |
© 2024 by the authors. Licensee MDPI, Basel, Switzerland. This article is an open access article distributed under the terms and conditions of the Creative Commons Attribution (CC BY) license (http://creativecommons.org/licenses/by/4.0/).
Copyright: This open access article is published under a Creative Commons CC BY 4.0 license, which permit the free download, distribution, and reuse, provided that the author and preprint are cited in any reuse.


