
Submitted:
02 November 2023
Posted:
06 November 2023
You are already at the latest version
Abstract
As renewable energy generation prediction systems have been introduced into the energy trading market, accurate prediction of solar photovoltaic (PV) energy generation has become a crucial challenge for ensuring stable trade of variable energy. Therefore, it is essential to quantitatively investigate and analyze current prediction technology and develop more advanced prediction systems. In this study, three models for predicting PV energy generation were investigated. Multiple regression, random forest, and gradient boosting machine (GBM) models were con-structed for 15 utility-scale power plants throughout South Korea. Model performance was evaluated in terms of root mean square error (RMSE) and mean absolute error (MAE). The multiple regression-based model had an RMSE of 12.00% and MAE of 9.06%. The random forest model had an RMSE of 11.69% and MAE of 8.61%. The GBM model had an RMSE of 11.34% and MAE of 8.18%, indicating its superior accuracy among the three models in predicting PV energy generation. These findings provide valuable insights that may contribute to the development of advanced PV energy generation models and their application in grid operations.
Keywords:
decision tree
; gradient boosting machine (GBM)
; machine learning method
; multiple regression analysis
; photovoltaic plant
; random forest
; solar photovoltaic energy generation
; statistical method
1. Introduction
In October 2021, a renewable energy generation prediction system was introduced into the energy market [1] to address the increased need for accurate prediction of the quantity of energy generated.
This demand for accurate quantitative prediction of energy generation arose for three reasons. First, energy demand patterns have changed tremendously due to COVID-19. Second, the number of self-generation facilities has increased, and their capacity is difficult to track. Finally, although the importance of renewable energy is increasing due to climate change and the depletion of fossil fuels, predicting the quantity of renewable energy produced remains difficult, because it is highly dependent on climatic factors. Therefore, to ensure stable energy supply and demand, establishing a model for the development and improvement of energy generation prediction is crucial.
Several attempts have been made to construct accurate models for prediction of solar energy generation [2,3,4]. To date, most studies have focused on statistical methods for prediction with short lead times (<6 h). In addition, statistical methods are used to correct long-term photovoltaic (PV) forecasts derived from physics-based numerical dynamic method for lead times of 1 day or longer. Traditional statistical methods, particularly time-series models, have been widely used for this purpose. For example, Jung et al. [5] constructed a solar energy generation prediction model using various time-series techniques such as autoregressive integrated moving average (ARIMA) and the vector autoregressive model, and then compared the accuracy of prediction results. Furthermore, regression analysis has been broadly employed to predict solar energy generation [6,7].
To replace traditional time-series techniques or statistical methods, research into constructing a solar energy generation prediction model based on machine learning and deep learning algorithms is being actively conducted [2,3]. Kim et al. [8] applied long short-term memory (LSTM), and Lee and Lee [6] used a support vector machine (SVM) algorithm to construct a solar energy generation model. In addition to LSTM and SVM, several neural network algorithms, such as the recurrent neural network and radial basis function neural network, have been used to predict solar energy generation [10,11,12,13,14,15,16,17].
In this study, we constructed three solar energy generation prediction models based on a statistical model (multiple regression) and two machine learning models (random forest and gradient boosting machine [GBM]) to assess the natural variability of PV power generation. The main objective of this study was to propose an advanced PV prediction method for operational PV plants that is supported by quantitative evidence. This study aimed to compare the accuracy of several prediction models and determine which model performs best in terms of root mean square error (RMSE) and mean absolute error (MAE).
Section 2 provides a detailed description of model construction. The performance of the constructed models is described in Section 3. A discussion of the results in the context of previous research conducted using the same domain and same datasets is provided in Section 4. Finally, a summary and conclusion are presented in Section 5.
2. Academic Background
2.1. Multiple Regression Analysis
Multiple regression analysis is a statistical technique used to analyze the relationship between a dependent variable and two or more independent variables. Multiple regression is the extended version of simple linear regression, which assesses the relationship between one dependent variable and one independent variable. The goal of multiple regression analysis is to elucidate how the independent variables jointly influence the dependent variable. The basic form of the multiple regression equation is as follows.
 |
(1) |
| where | : | dependent variable (also called the outcome variable) |
| : | independent variables | |
| : | intercept, representing the value of when all independent variables are zero | |
| : | coefficients, representing the change in associated with a one-unit change in the corresponding independent variable while all other independent variables are fixed | |
| : | error term, representing the variability of which cannot be explained by the independent variables |
- Linear regression analysis, including both simple regression and multiple regression, depends upon some assumptions being met to obtain accurate results.
- Linearity: the relationship between independent variables and the expected value of the outcome variable is linear.
- Independence: observations are independent of each other, such that the error of each observation is also independent.
- Normality: the variance of error is normally distributed.
- Homoscedasticity: the variance of error is the same for any value of the independent variables.
The main purpose of multiple regression analysis is to estimate the value of coefficients () that best fit the data and create a regression equation that can predict the value of the outcome variable when a new set of independent variable values are given. The ordinary least squares (OLS) method is commonly used to estimate the values of coefficients by minimizing the sum of squared errors, as stated in Equation (2). By differentiating Equation (2) with respect to each coefficient, we can obtain estimates of .
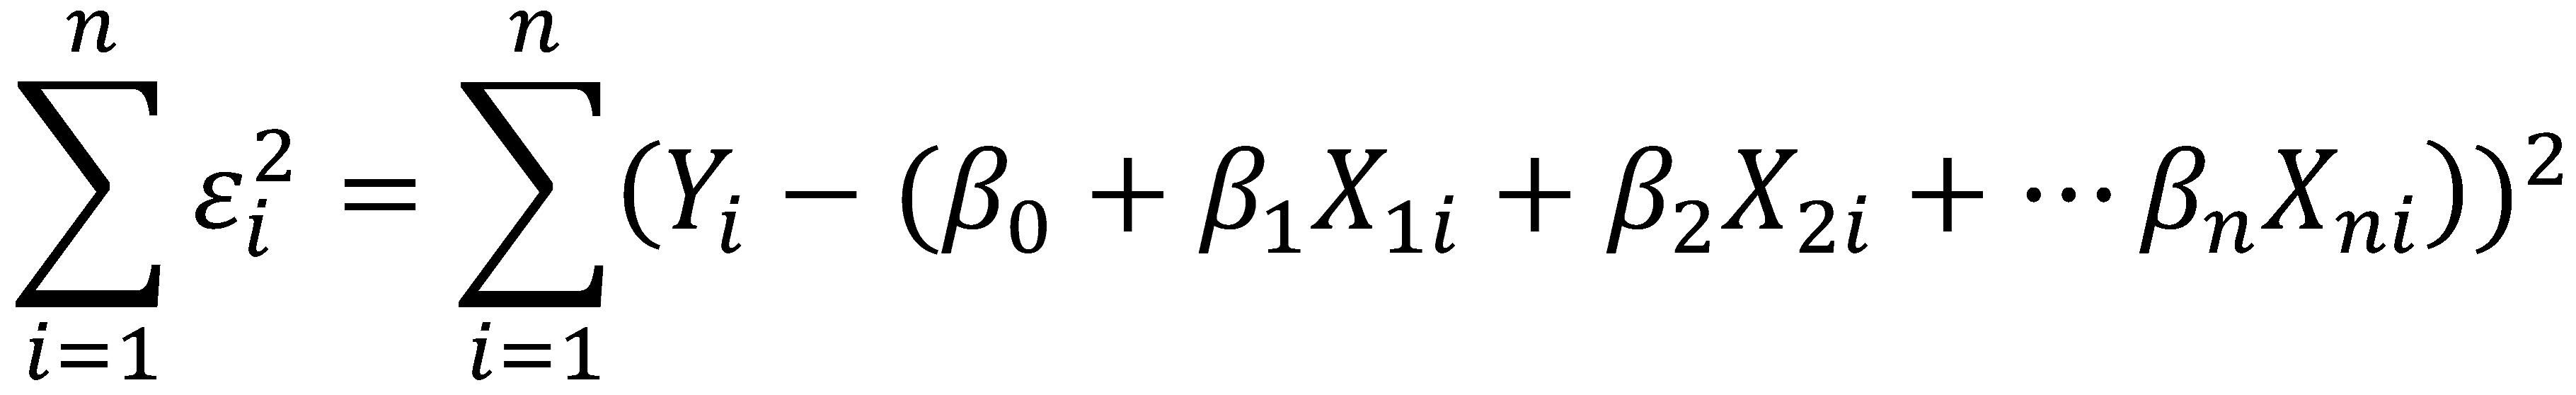 |
(2) |
2.2. Random Forest
Random forest is a representative machine learning algorithm belonging to the family of ensemble methods. An ensemble method combines multiple individual weak prediction models to create a more robust and accurate prediction model. With the random forest algorithm, both classification and regression tasks are possible.
2.2.1. Decision Tree
In the random forest algorithm, a decision tree is used as an individual weak prediction model in the ensemble. The decision tree analyzes data and represents the patterns that exist within the data as a predictable set of rules. This tool is called a decision tree because its output is in the form of a tree.
Figure 1 shows a simple diagram of a decision tree. The initial point at the top is designated the root node. The number of data corresponding to each node decreases as the decision tree continues to branch. After all partitions have been completed, the sum of the numbers of observations belonging to each leaf node will be equal to the number of observations contained in root nodes, meaning that no overlap exists among leaf nodes. Each leaf node returns predicted values of the outcome variable. In classification tasks, the predicted value is the mode of the outcome variable values for each leaf node. For regression tasks, the mean of outcome variable values for each leaf node is considered the predicted value.
When a decision tree is constructed, the algorithm decides which independent variable to use for splitting the data based on the ability of each variable to decrease impurity. The independent variable and value selected for splitting are those that create subsets with the least impurity after the split. Therefore, as the splitting process continues, the data in each node become more homogeneous. Commonly, Gini impurity or entropy is used as the impurity index for classification tasks, and mean square error is used in regression tasks.
Theoretically, a perfect decision tree will split the observations as many times as possible until each leaf node consists of only one observation. However, as the number of splits increases, the tree becomes more complex, and the presence of too many levels and nodes is known as overfitting. To mitigate overfitting in a decision tree, various hyperparameters are set prior to construction. Below are some hyperparameters that prevent overfitting of a decision tree:
- 6.
- Maximum depth of the tree: setting a maximum depth for the decision tree restricts its growth, avoiding the creation of deep and complex trees.
- 7.
- Minimum number of observations for a split: setting the minimum number of observations required for a node ensures that only nodes with sufficient observations are considered for further splitting.
- 8.
- Minimum number of observations per leaf: setting the minimum number of observations required within each leaf node prevents the creation of small, isolated leaves.
2.2.2. Ensemble of Several Decision Trees
The random forest method employs a combination of several decision trees to obtain a more accurate prediction value. Each tree is built from a different subset of data, and each tree provides a prediction value. The final prediction value is determined by aggregating the prediction values from all individual trees. The key concept behind the random forest algorithm is the inclusion of randomness in the model construction process, which benefits model performance by improving generalization and reducing overfitting. This randomness is applied in two ways:
- 9.
- Random subset of data: during the construction of each tree, a random subset of the original dataset is used in a process called bootstrapping. On average, each tree will be trained using approximately two thirds of the dataset, with the remaining third used for validation.
- 10.
- Random subset of independent variables: when building each decision tree, only a random subset of the independent variables is considered for splitting. Therefore, splits in decision trees are made based on a subset of independent variables, introducing diversity among individual trees.
For classification tasks, the final prediction of the random forest is determined as the mode of individual tree predictions. Thus, the category receiving the most votes is selected as the final output. For regression tasks, the final prediction is the mean of all predicted values from individual trees.
In addition to the hyperparameters of the decision tree algorithm, it is necessary to consider how many trees should be combined requires consideration. In general, as the number of trees in the ensemble increases, higher accuracy is expected. However, increasing the number of trees does not always guarantee better performance, and more time is needed for model construction as the number of trees increases. Therefore, researchers should determine the appropriate number of trees to be combined according to the properties of their data or field of study.
2.3. GBM
The random forest and GBM algorithms have some similarities. Both are ensemble learning methods that combine multiple decision trees to make accurate predictions. In both models, the final prediction is obtained by aggregating the prediction values of individual decision trees.
However, there are important differences between these two models. The random forest method creates ensembles of independently created trees, whereas GBM does not. In GBM, the central concept involves connecting several decision trees and correcting the error by generating each subsequent tree based on the error of the previous tree. The algorithm operates by fitting each new tree to the residual (difference between the actual outcome value and predicted value) of the previously constructed tree. The final prediction is the sum of all predicted values from individual trees.
The main hyperparameters initially set in GBM are similar to those of the random forest algorithm, as both methods are based on decision trees. One additional hyperparameter of GBM is the learning rate, which controls the contribution of each decision tree to the final prediction value and determines the extent to which model parameters are adjusted in the direction of the gradient during each iteration of the boosting process. A high learning rate indicates a substantial contribution of each tree to the final prediction, making the model learn quickly. Conversely, a low learning rate reduces the contribution of each tree, making the learning process more prudent.
Figure 2 shows a simple schematic diagram of the gradient boosting algorithm. The initial predicted value is set as the average of the actual value. After the first tree is generated based on the error between the actual and initial predicted values, error relative to the actual value is calculated. Next, a second tree is generated based on the calculated error, and then the error relative to the actual value is calculated again. After repeating this process as many as times as set by the hyperparameter, the final prediction is obtained based on the learning rate of each tree.
Equation (3) expresses how the final predicted value is calculated for each observation.
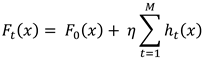 |
(3) |
Where is the initial predicted value, is the final predicted value, is the learning rate, is the predicted error of each tree, and is the number of trees. As noted above, when the initial predicted value is determined as , the error of each tree is calculated times, the learning rate is applied to each tree to sum the error, and a final predicted value is obtained.
3. Model Construction and Evaluation
3.1. Exploratory Data Analysis and Preprocessing
Data observed at 15 sites across South Korea (UTC+9) were used to construct an energy generation prediction model. The data were recorded at 1-h intervals over a period of 2 years, from 00:00 on 1 January 2020 to 23:00 on 31 December 2021. The dataset consists of two data types, the basic dataset (dataset B) and the advanced dataset (dataset A), which are briefly described in Table 1. Dataset B consists of eight variables: date, energy generation quantity (the outcome variable), clear-sky global horizontal irradiance (cGHI), solar zenith angle (Szen), solar azimuth angle (Sazi), extraterrestrial radiation (Extl), predicted ground temperature (Temp_nwp), and predicted global horizontal irradiance (GHI_nwp). Dataset A contains approximately 30 additional weather variables including surface air temperature, surface barometric pressure, sea level pressure, altitude, and visibility.
Below are the preprocessing steps applied prior to construction of the three models.
- 11.
- Step 1: Datasets B and A are combined for all spots. Approximately 30 weather variables present only in dataset A were added to dataset B.
- 12.
- Step 2: Observations with missing values are deleted.
- 13.
- Step 3: The GHI_sat variable is modified. As GHI_sat is a value observed in the past, it is substituted with the value recorded 48 h prior to analysis.
- 14.
- Step 4: Missing values are identified again and substituted with data from the same time, 1 day earlier.
After applying these preprocessing procedures prior to model construction, the data were separated into training and test datasets. The training dataset contains data from 00:00 on 1 January 2020 to 23:00 on 31 December 2020, and the test dataset contains data from 00:00 on 1 January 2021 to 23:00 on 31 December 2021. Figure 3 illustrates the separation of the target variable (energy generation quantity) from one of the 15 points.
3.2. Experiment
3.2.1. Multiple Regression Analysis
In this study, we used the stepwise selection method to set up the multiple linear regression model. To consider the geographical, environmental, and climatic characteristics of each spot, 15 models were constructed, one for each. First, the null model (interceptonly model) was specified as the initial model, and then the optimal model was identified using the forward selection method, which gradually adds independent variables.
When selecting the optimal model, the Bayes information criterion (BIC) was used as a measure of model quality. BIC considers both the goodness of fit of the model and the number of parameters included in the model. The BIC formula penalizes models with more parameters, favoring simpler models. Equation (4) is the formula for BIC in multiple regression analysis:
where is the maximum likelihood function of a model, is the number of observations, and indicates the number of parameters in the model.
 |
(4) |
3.2.2. Random Forest and GBM
Similar to multiple regression analysis, models using the random forest and GBM algorithm were constructed for all 15 spots. When constructing these models, the grid search method was used for hyperparameter selection. The selected values are as follows:
- 15.
- Maximum depth of each tree: 10
- 16.
- Minimum number of observations for a split: 20
- 17.
- Minimum number of observations per leaf: 20
- 18.
- Total number of trees in the ensemble: 100
- 19.
- Learning rate: 0.05 (a hyperparameter only for GBM)
3.3. Evaluating the Accuracy of Energy Generation Prediction Models
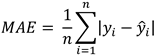
RMSE (Equation 5) and MAE (Equation 6) were used to evaluate the accuracy of the energy generation prediction models. In Equations (5) and (6), n is the number of observations, y_i represents the actual value of the dependent variable (outcome variable) for the ith observation, and y ̂_i indicates the predicted value of the dependent variable for the ith observation.
RMSE is a measure of the average squared difference between predicted and actual values, whereas MAE represents the average absolute difference between predicted and actual values. Because the difference between the actual and predicted value is an evaluation criterion in both RMSE and MAE, a smaller value indicates a more precise approximation of the actual value. The difference between these indexes lies in the weighting of errors. Although both indexes are calculated using the difference between actual and predicted values, MAE gives equal weight to the errors for all observations when calculating the average of the absolute values of error. By contrast, RMSE squares the residuals (i.e., differences between actual and predicted values), averages them, and takes the square root of each value. Therefore, the errors have different weights. Compared to the MAE, RMSE is generally more sensitive to outliers.
 |
(6) |
Table 2 shows the RMSE and MAE values of three models (MR, multiple regression analysis; RF, random forest; and GBM, gradient boosting machine) applied to the test dataset from 00:00 on 1 January 2021 to 23:00 on 31 December 2021 for all 15 spots. Overall, multiple regression had RMSE of 12.00% and MAE of 9.06%. The accuracy of random forest was 11.69% based on RMSE and 8.61% based on MAE. GBM showed an RMSE of 11.34% and MAE of 8.18%, indicating the best accuracy among the three models.
Almost all of the 15 spots assessed showed improvement of accuracy as the model shifted from multiple regression to random forest and from random forest to GBM. Regardless of the model used, spot 1 showed the highest accuracy. At spot 1, error estimates were 9.89% (RMSE) and 7.25% (MAE) for multiple regression, 9.56% (RMSE) and 6.76% (MAE) for random forest, and 9.51% (RMSE) and 6.68% (MAE) for GBM. In contrast, spot 3 had the lowest accuracy, with values of 14.13% (RMSE) and 10.94% (MAE) for multiple regression, 13.56% (RMSE) and 10.18% (MAE) for random forest, and 13.43% (RMSE) and 9.92% (MAE) for GBM.
For visual comparison of the three models, Figure 4 illustrates the actual value of energy generation (black solid line) and values predicted using the three models (orange, green, and blue dotted lines, respectively) for a period of time within the test dataset, from 00:00 on 1 July 2021 to 23:00 on 7 July 2021, for spot 0. Although all three models showed a common tendency toward overestimation or underestimation at certain periods of time, generally, the results showed that GBM (blue dotted line) produces predicted values with the lowest error compared to the actual values.
4. Discussion
Traditionally, time-series analysis has been widely employed for the prediction of solar energy generation. Using the same data, one timeseries analysis method, autoregressive integrated moving average (ARIMA) was applied and its accuracy was compared with those of the multiple regression, random forest, and GBM models.
The ARIMA model uses past observations, errors, and a difference procedure to explain current values. This technique combines the autoregressive (AR) and moving average (MA) models. A timeseries observation Z_t follows the ARIMA(p,d,q) process, where p is the parameter of the AR model, d is a differential parameter, and q is the parameter of the MA model. When the mean value of equals , the equation for the ARIMA model is as follows. In this case, ϕ(B) and θ(B) are polynomials for the AR and MA models, respectively, and B is a back-shift operator.
where
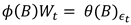 |
(7) |
A detailed explanation of each parameter follows:
- 20
- p: parameter for the AR model. The observation values at time points affect the value at time point.
- 21
- d: parameter for differencing. The observation value at time point is deducted from the value at time point to make the data stationary.
- 22
- q: parameter for the MA model. The error of the continuous observation values affect the value at time point.
After testing whether the data satisfies the assumption of stationarity, parameter values for p,d,and q are inferred by calculating the corrected Akaike’s information criterion (AICc) of the potential model. The residual analysis method, which tests the independence of residuals by calculating the autocorrelation function and partial autocorrelation function of the residuals, is used as a statistical diagnosis method to determine the appropriateness of the inferred model. Finally, we calculate future prediction values using the constructed model. In this study, we used AICc to test appropriateness when inferring the parameter values of p,d,and q. Compared to Akaike’s information criterion, AICc has a penalty added based on the number of parameters. Table 3 shows p,d,and q values for the 15 timeseries models applied to each spot with the training dataset. As described above for the other models, the training dataset contains data from 00:00 on 1 January 2020 to 23:00 on 31 December 2020, and the test dataset contains data from 00:00 on 1 January 2021 to 23:00 on 31 December 2021.
Table 4 lists the RMSE and MAE values from ARIMA for the model evaluation period, which is the period of the test dataset from 00:00 on 1 January 2021 to 23:00 on 31 December 2021. Spot 13 showed the highest accuracy, with RMSE of 16.65% and MAE of 8.42%, and spot 10 showed the lowest accuracy, with RMSE of 52.69% and MAE of 27.76%.
5. Conclusion
Accurate prediction of PV energy generation is essential for ensuring stable grid management. To establish an advanced PV energy generation method, three algorithms were selected and their performance was evaluated for operational PV power plants in South Korea. The purpose of this study was to compare the accuracy of various models, including both statistical and machine learning methods, and determine which model makes the most accurate predictions.
In this study, multiple regression, random forest and GBM models were constructed and an experiment was performed to compare model prediction accuracy based on RMSE and MAE. The experiment was conducted for the period of 2021 at 15 plants across South Korea. GBM had RMSE and MAE values of 9.51–12.89% and 6.68–9.92%, respectively, indicating better performance than the multiple regression and random forest methods. The present study also discussed improvement of this method through direct comparison with the timeseries analysis method ARIMA, which was established in a previous study [2] for the same study period and plants. GBM showed improvements of 7.14–33.67% and 1.74–17.84% in terms of RMSE and MAE, respectively, compared to ARIMA.
To obtain a model with a higher accuracy based on GBM, we plan to construct models including weather variables that strongly influence energy generation prediction [18,19,20,21]. We used all independent variables in the selected dataset when constructing models with GBM. The number of independent variables considered in this study was approximately 60, given that some weather variables are measured both at 21:00 the day before and at 03:00 on the day of observation. However, if only those weather variables with strong impacts on energy generation prediction are selected, model performance will improve as the time required for model construction decreases. In addition, rather than constructing prediction models for 15 spots separately, clustering the analysis sites into groups based on geographical distance or climatic features may provide more accurate models.
Author Contributions
Conceptualization, Yoo-Jung Kim, Na-Hyeong Kim and So-Yeon Park; Data curation, Chang Ki Kim, Myeongchan Oh, Hyun-Goo Kim and Jin-Young Kim; Formal analysis, Yoo-Jung Kim, Na-Hyeong Kim, So-Yeon Park and Yung-Seop Lee; Funding acquisition, Chang Ki Kim and Yung-Seop Lee; Investigation, Chang Ki Kim, Myeongchan Oh, Hyun-Goo Kim, Jin-Young Kim and Yung-Seop Lee; Methodology, Yoo-Jung Kim, Na-Hyeong Kim and So-Yeon Park; Project administration, Chang Ki Kim; Resources, Chang Ki Kim, Myeongchan Oh, Hyun-Goo Kim and Jin-Young Kim; Software, Yoo-Jung Kim, Na-Hyeong Kim and So-Yeon Park; Supervision, So-Yeon Park and Yung-Seop Lee; Validation, Yung-Seop Lee; Visualization, Yoo-Jung Kim and Na-Hyeong Kim; Writing – original draft, Yoo-Jung Kim; Writing – review & editing, Hyun-Goo Kim, Jin-Young Kim and Yung-Seop Lee. All authors will be informed about each step of manuscript processing including submission, revision, revision reminder, etc. via emails from our system or assigned Assistant Editor.
Funding
This was an award-winning work by participating in the “KIER Solar Prediction Academic Competition” which was conducted under framework of the research and development program of the Korea Institute of Energy Research (B3-2416-02). This is supported by the National Research Foundation of Korea (NFR) grant funded by the Korea government (No. NRF-2021R1A2C1007095).
Data Availability Statement
Not applicable.
Conflicts of Interest
The authors declare no conflict of interest.
References
- Hwang, J.-Y. ; Korea Electric Power Corporation Home Page. Available online: https://home.kepco.co.kr/kepco/front/html/WZ/2022_01_02/sub13.html (accessed on 19 April 2023).
- Cheon, J.-H.; Lee, J.-T.; Kim, H.-G; Kang, Y.-H.; Yun, C.-Y.; Kim, C.-K.; Kim, B.-Y.; Kim, J.-Y.; Park, Y.-Y.; Kim, T.-H.; Jo, H.-N. Trend Review of Solar Energy Forecasting Technique. Journal of the Korean Solar Energy Society 2019, 39, 41–54, (in Korean with English abstract). [Google Scholar] [CrossRef]
- Ahmed, R.; Sreeram, V.; Mishra, Y.; Arif, M.D. A review and evaluation of the state-of-the art in PV solar power forecasting: Technniques and optimization. Renewable and Sustainable Energy Reviews 2020, 124, 109792. [Google Scholar] [CrossRef]
- Alcañiz, A.; Grzebyk, D. , Ziar, H., Isabella, O. Trends and gaps in photovoltaic power forecasting with machine learning. Energy Report 2023, 9, 447–471. [Google Scholar] [CrossRef]
- Jung, A.-H.; Lee, D.-H.; Kim, J.-Y.; Kim, C.-K.; Kim, H.-G.; Lee, Y.-S. Regional Photovoltaic Power Forecasting Using Vector Autoregression Model in South Korea. Energies 2022, 15, 7853. [Google Scholar] [CrossRef]
- Zhang, P.; Takano, H.; Murata, J. Daily Solar Radiation Prediction Based on Wavelet Analysis. In Proceedings of the SICE Annual Conference (IEEE), Tokyo, Japan, 13–18 September 2011. [Google Scholar]
- Oudjana, S.H.; Hellal, A.; Mahamed, I.H. Short Term Photovoltaic Power Generation Forecasting Using Neural Network. In Proceedings of the 11th International Conference on Environment and Electrical Engineering (IEEE), Venice, Italy, 18–25 May 2012. [Google Scholar]
- Kim, Y.-S.; Lee, S.-H.; Kim, H.-W. Prediction Method of Photovoltaic Power Generation Based on LSTM Using Weather Information. The Journal of Korean Institute of Communications and Information Sciences 2019, 44, 2231–2238. [Google Scholar] [CrossRef]
- Lee, S.-M.; Lee, W.-J. Development of a System for Predicting Photovoltaic Power Generation and Detecting Defects Using Machine Learning. KIPS Transactions on Computer and Communication Systems 2016, 5, 353–360. [Google Scholar] [CrossRef]
- Yona, A.; Senjyu, T.; Funabashi, T. Application of Recurrent Neural Network to Short Term-ahead Generating Power Forecasting for Photovoltaic System. In Proceedings of the 2007 IEEE Power Engineering Society General Meeting (IEEE), Tampa, Florida, USA, 24–28 June 2007. [Google Scholar]
- Yona, A.; Senjyu, T.; Funabshi, T.; Sekine, H. Application of Neural Network to 24-hours-ahead Generating Power Forecasting for PV System. In Proceedings of the 2008 IEEE Power and Energy Society General Meeting - Conversion and Delivery of Electrical Energy in the 21st Century, Pittsburgh, Pennsylvania, USA, 20–24 July 2008. [Google Scholar]
- Capizzi, G.; Napoli, C.; Bonanno, F. Innovative Second-generation Wavelets Construction with Recurrent Neural Networks for Solar Radiation Forecasting. IEEE Transactions on Neural Networks and Learning Systems 2012, 23, 1805–1815. [Google Scholar] [CrossRef] [PubMed]
- Cao, S.; Weng, W.; Chen, J.; Liu, W.; Yu, G.; Cao, J. Forecast of Solar Irradiance Using Chaos Optimization Neural Networks. In Proceedings of the 2009 Asia-Pacific Power and Energy Engineering Conference (IEEE); Wuhan, China 28-30 March 2009. [Google Scholar]
- Mellit, A.; Pavan, A.M. A 24-hour Forecast of Solar Irradiance Using Artificial Neural Network: Application for Performance Prediction of a Grid-connected PV Plant at Trieste, Italy. Solar Energy 2010, 84, 807–821. [Google Scholar] [CrossRef]
- Wang, F.; Mi, Z.; Su, S.; Zhao, H. Short-term Solar Irradiance Forecasting Model Based on Artificial Neural Network Using Statistical Feature Parameters. Energies 2012, 5, 1355–1370. [Google Scholar] [CrossRef]
- Hocaoğlu, FO. ; Gerek ÖN.; Kurban M. Hourly Solar Radiation Forecasting Using Optimal Coefficient 2-D Linear Filters and Feed-forward Neural Networks. Solar Energy 2008, 82, 714–726. [Google Scholar] [CrossRef]
- Yun, Z.; Quan, Z.; Caixin, S.; Shaolan, L.; Yuming, L.; Yang, S. RBF Neural Network and ANFIS-based Short-term Load Forecasting Approach in Real-time Price Environment. IEEE Transactions on Neural Networks and Learning Systems 2008, 23, 853–858. [Google Scholar] [CrossRef]
- Huang, Y.; Lu, J.; Liu, C.; Xu, X.; Wang, W.; Zhou, X. Comparative Study of Power Forecasting Methods for PV Stations. In Proceedings of the International Conference on Power System Technology (IEEE), Zhejiang, Hangzhou, China, 24–28 October 2010. [Google Scholar]
- Chen, C.; Duan, S.; Cai, T.; Liu, B. Online 24-h Solar Power Forecasting Based on Weather Type Classification Using Artificial Neural Network. Solar Energy 2011, 85, 2856–2870. [Google Scholar] [CrossRef]
- Kim, G.G. .; Choi, J.H; Park, S.Y.; Bhang, B.G.; Nam, W.B.; Cha, H.L.; Park, N.S. Prediction Model for PV Performance with Correlation Analysis of Environmental Variables. IEEE Journal of Photovoltaics 2019, 9, 832–841. [Google Scholar] [CrossRef]
- Schwingshackl, C.; Petitta, M.; Wagner, J.E; Belluardo, G.; Moser, D.; Castelli, M.; Zebisch, M.; Tetzlaff, A. Wind Effect on PV Module Temperature: Analysis of Different Techniques for an Accurate Estimation. Energy Procedia 2013, 40, 77–86. [Google Scholar] [CrossRef]
Figure 1.
Simple diagram of a decision tree.
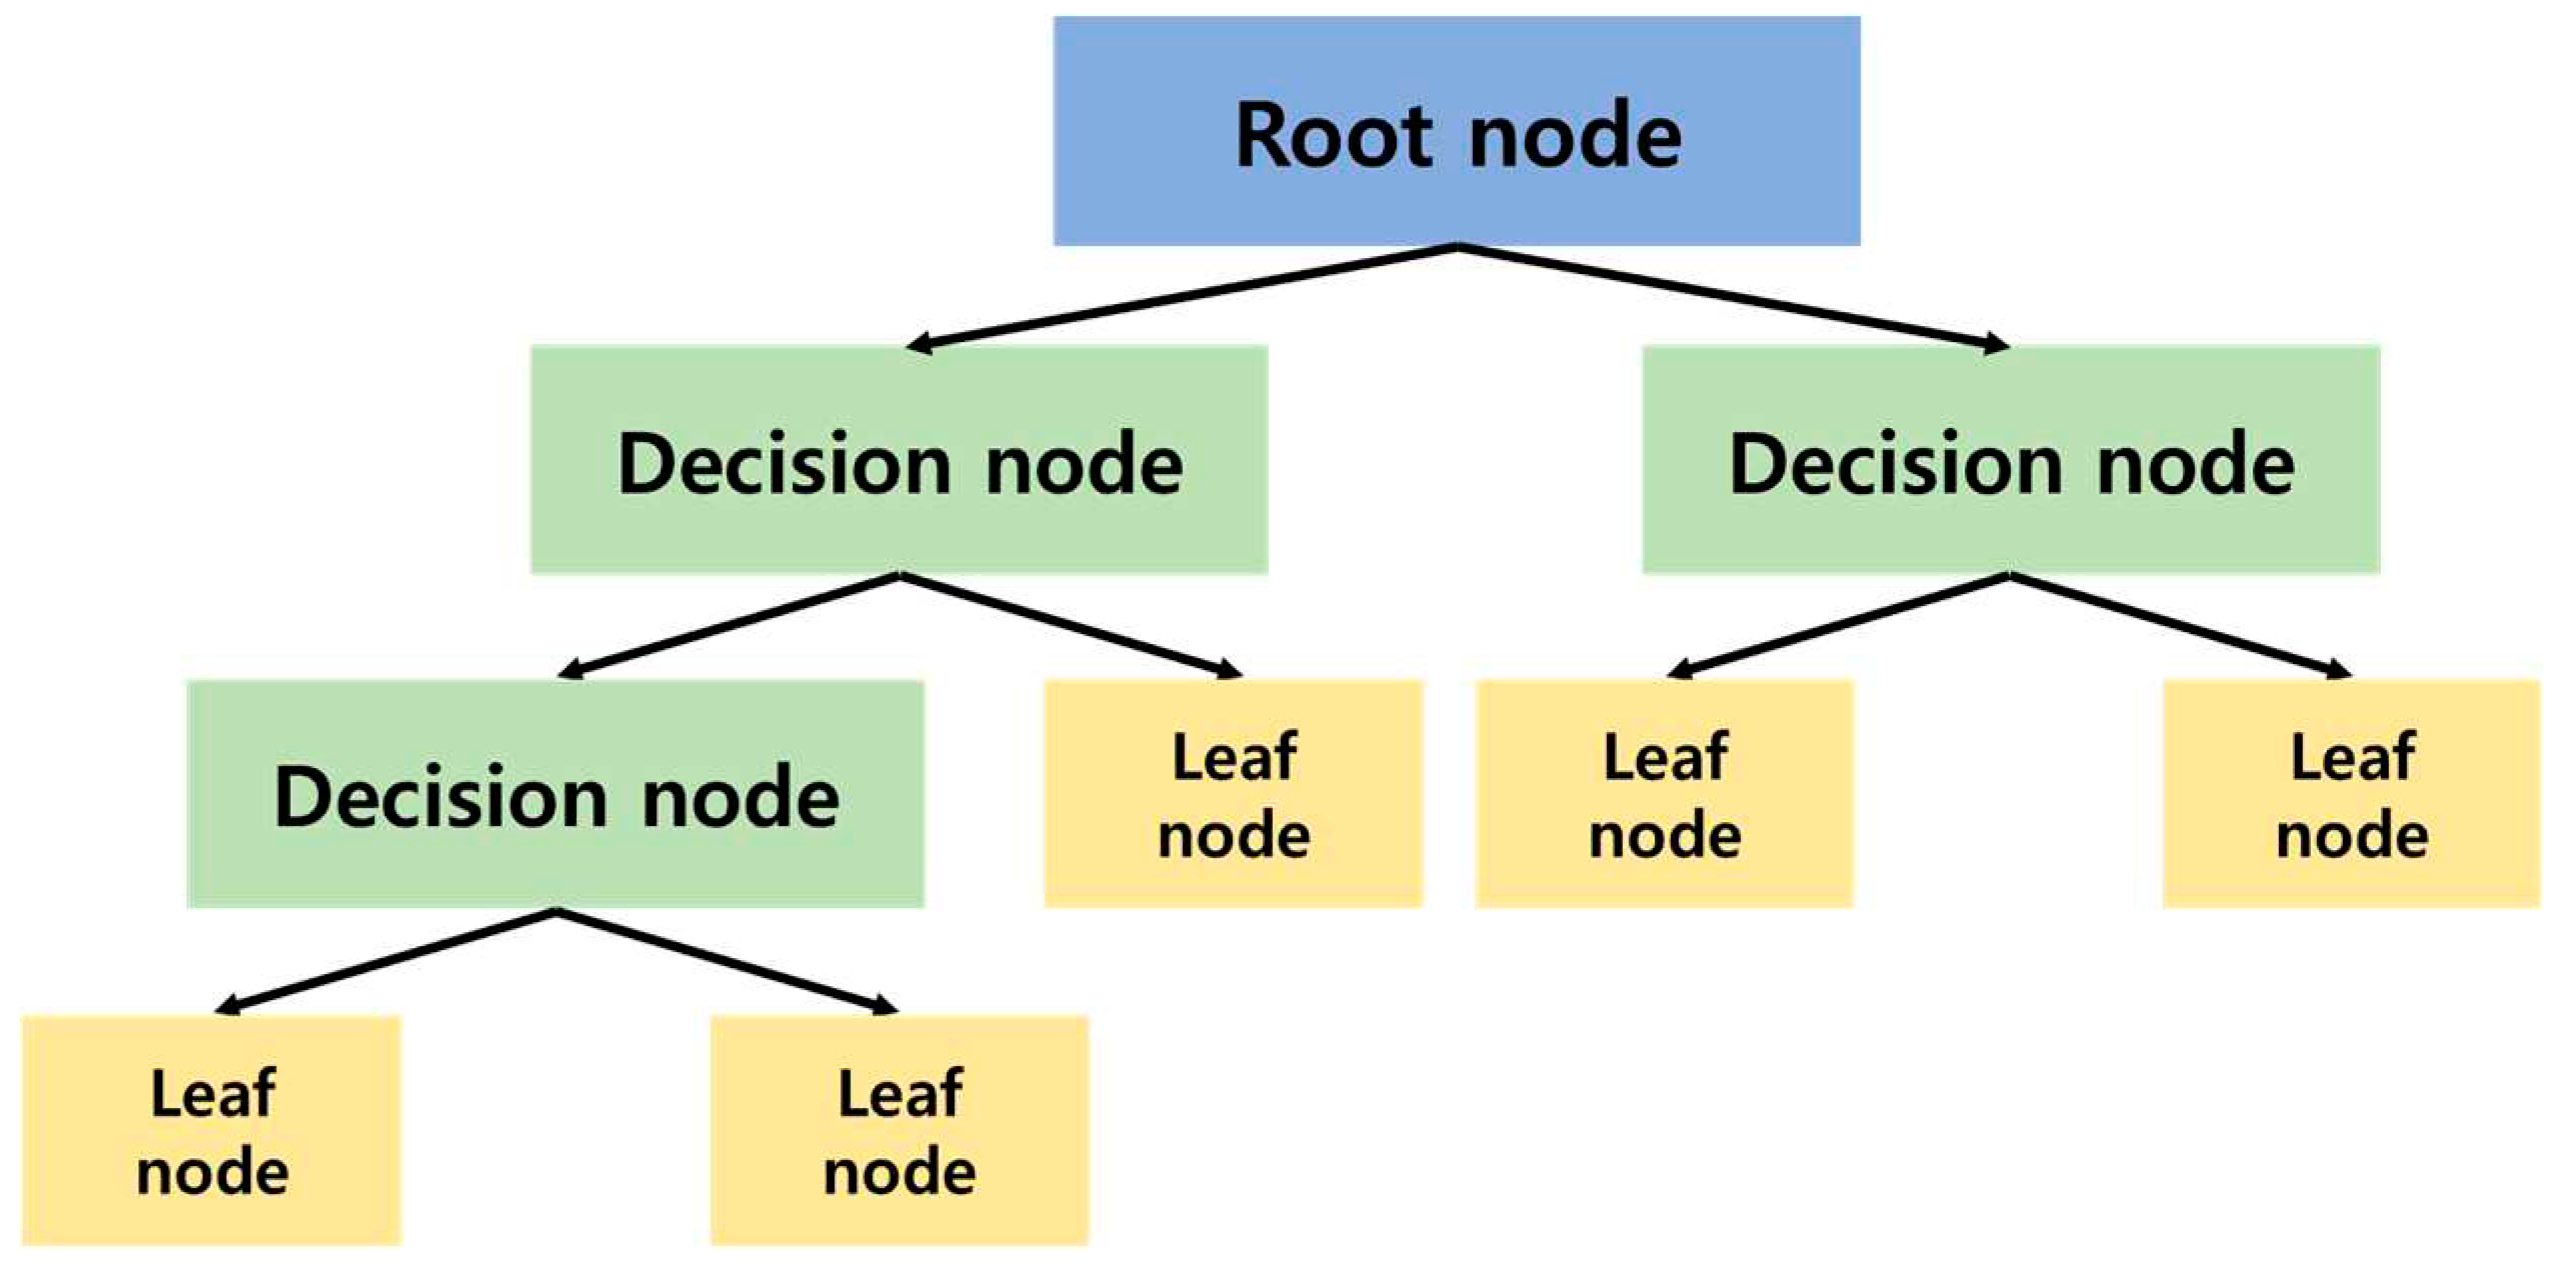
Figure 2.
Conceptual diagram of the gradient boosting machine.
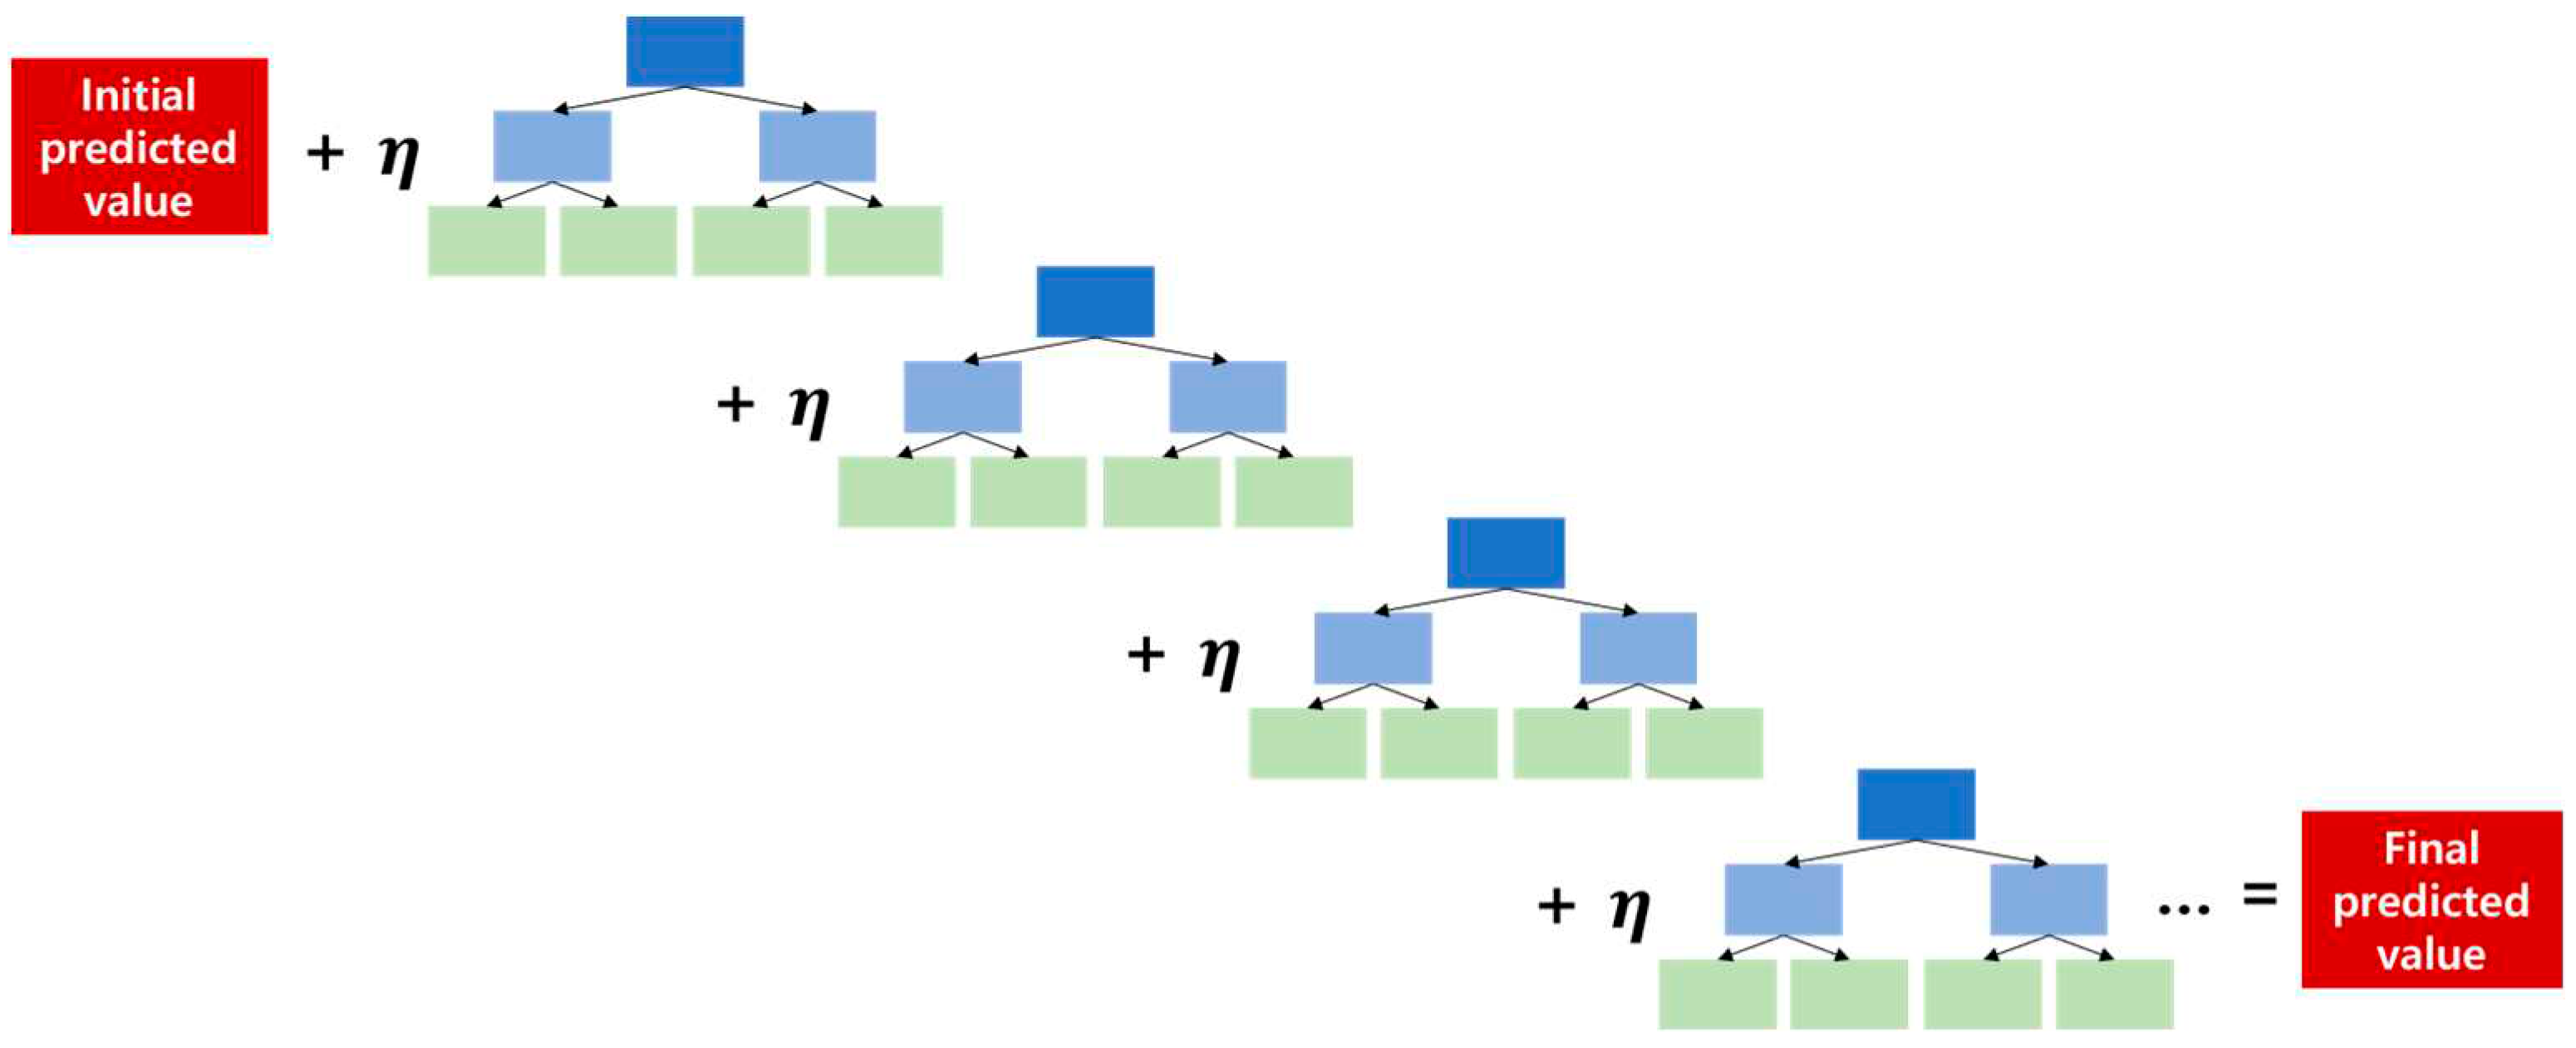
Figure 3.
Overview of the training and test datasets for energy generation in one spot.
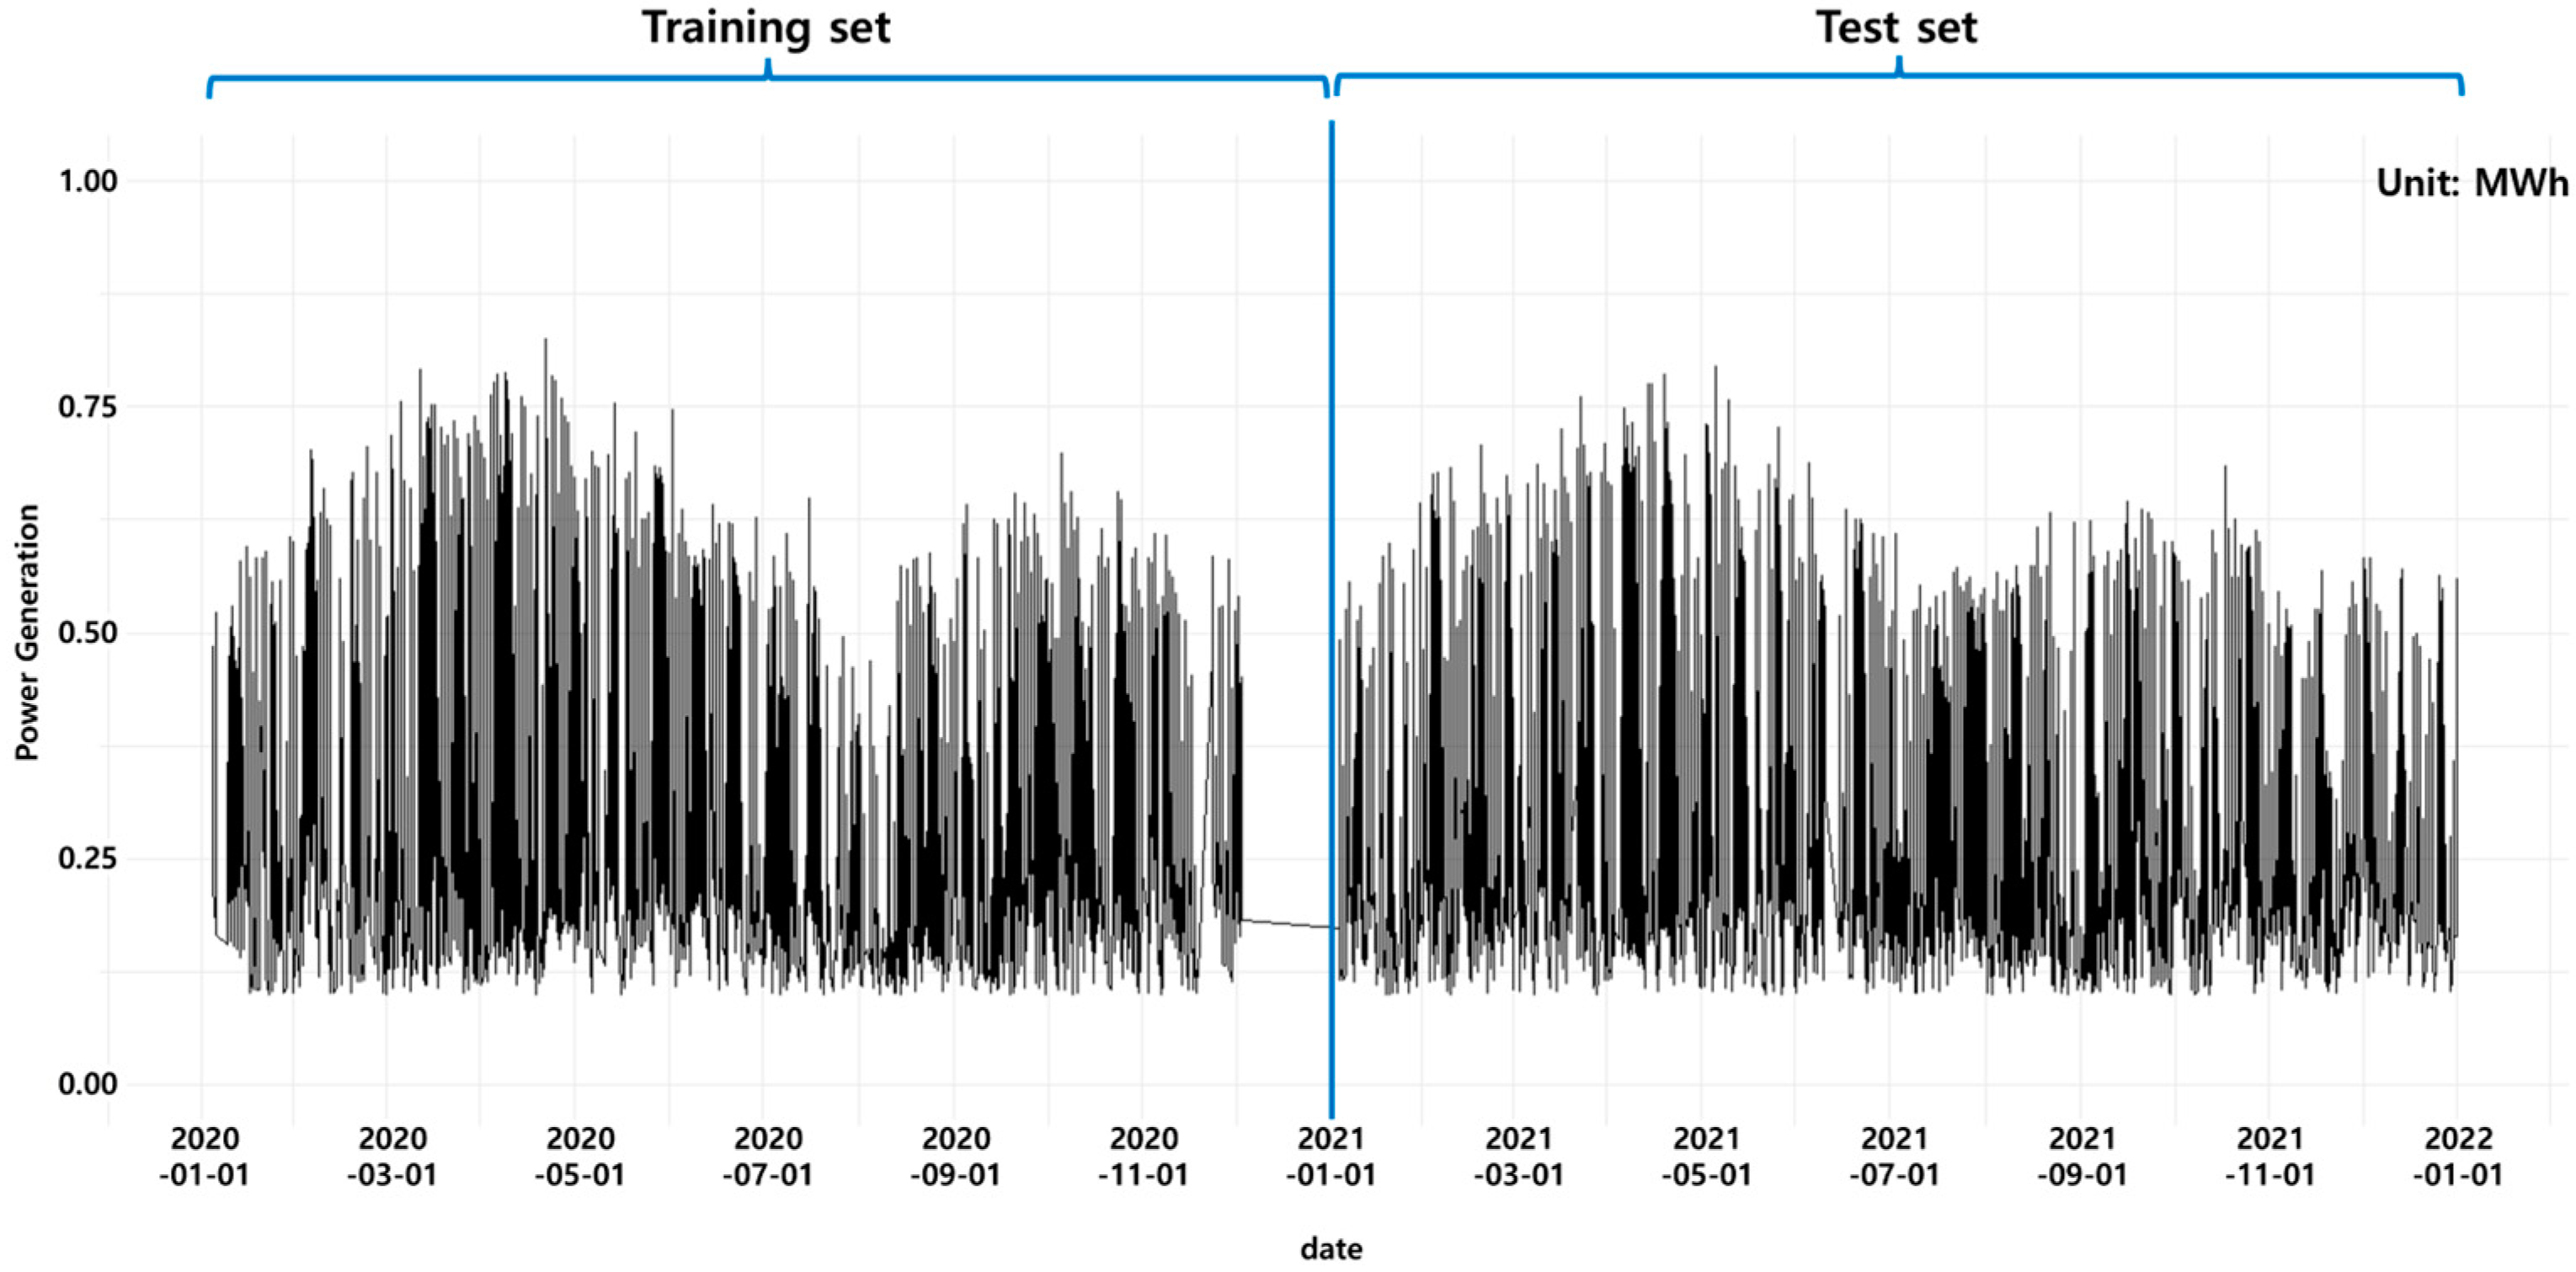
Figure 4.
Actual and predicted values of energy generation from three models for spot 0.
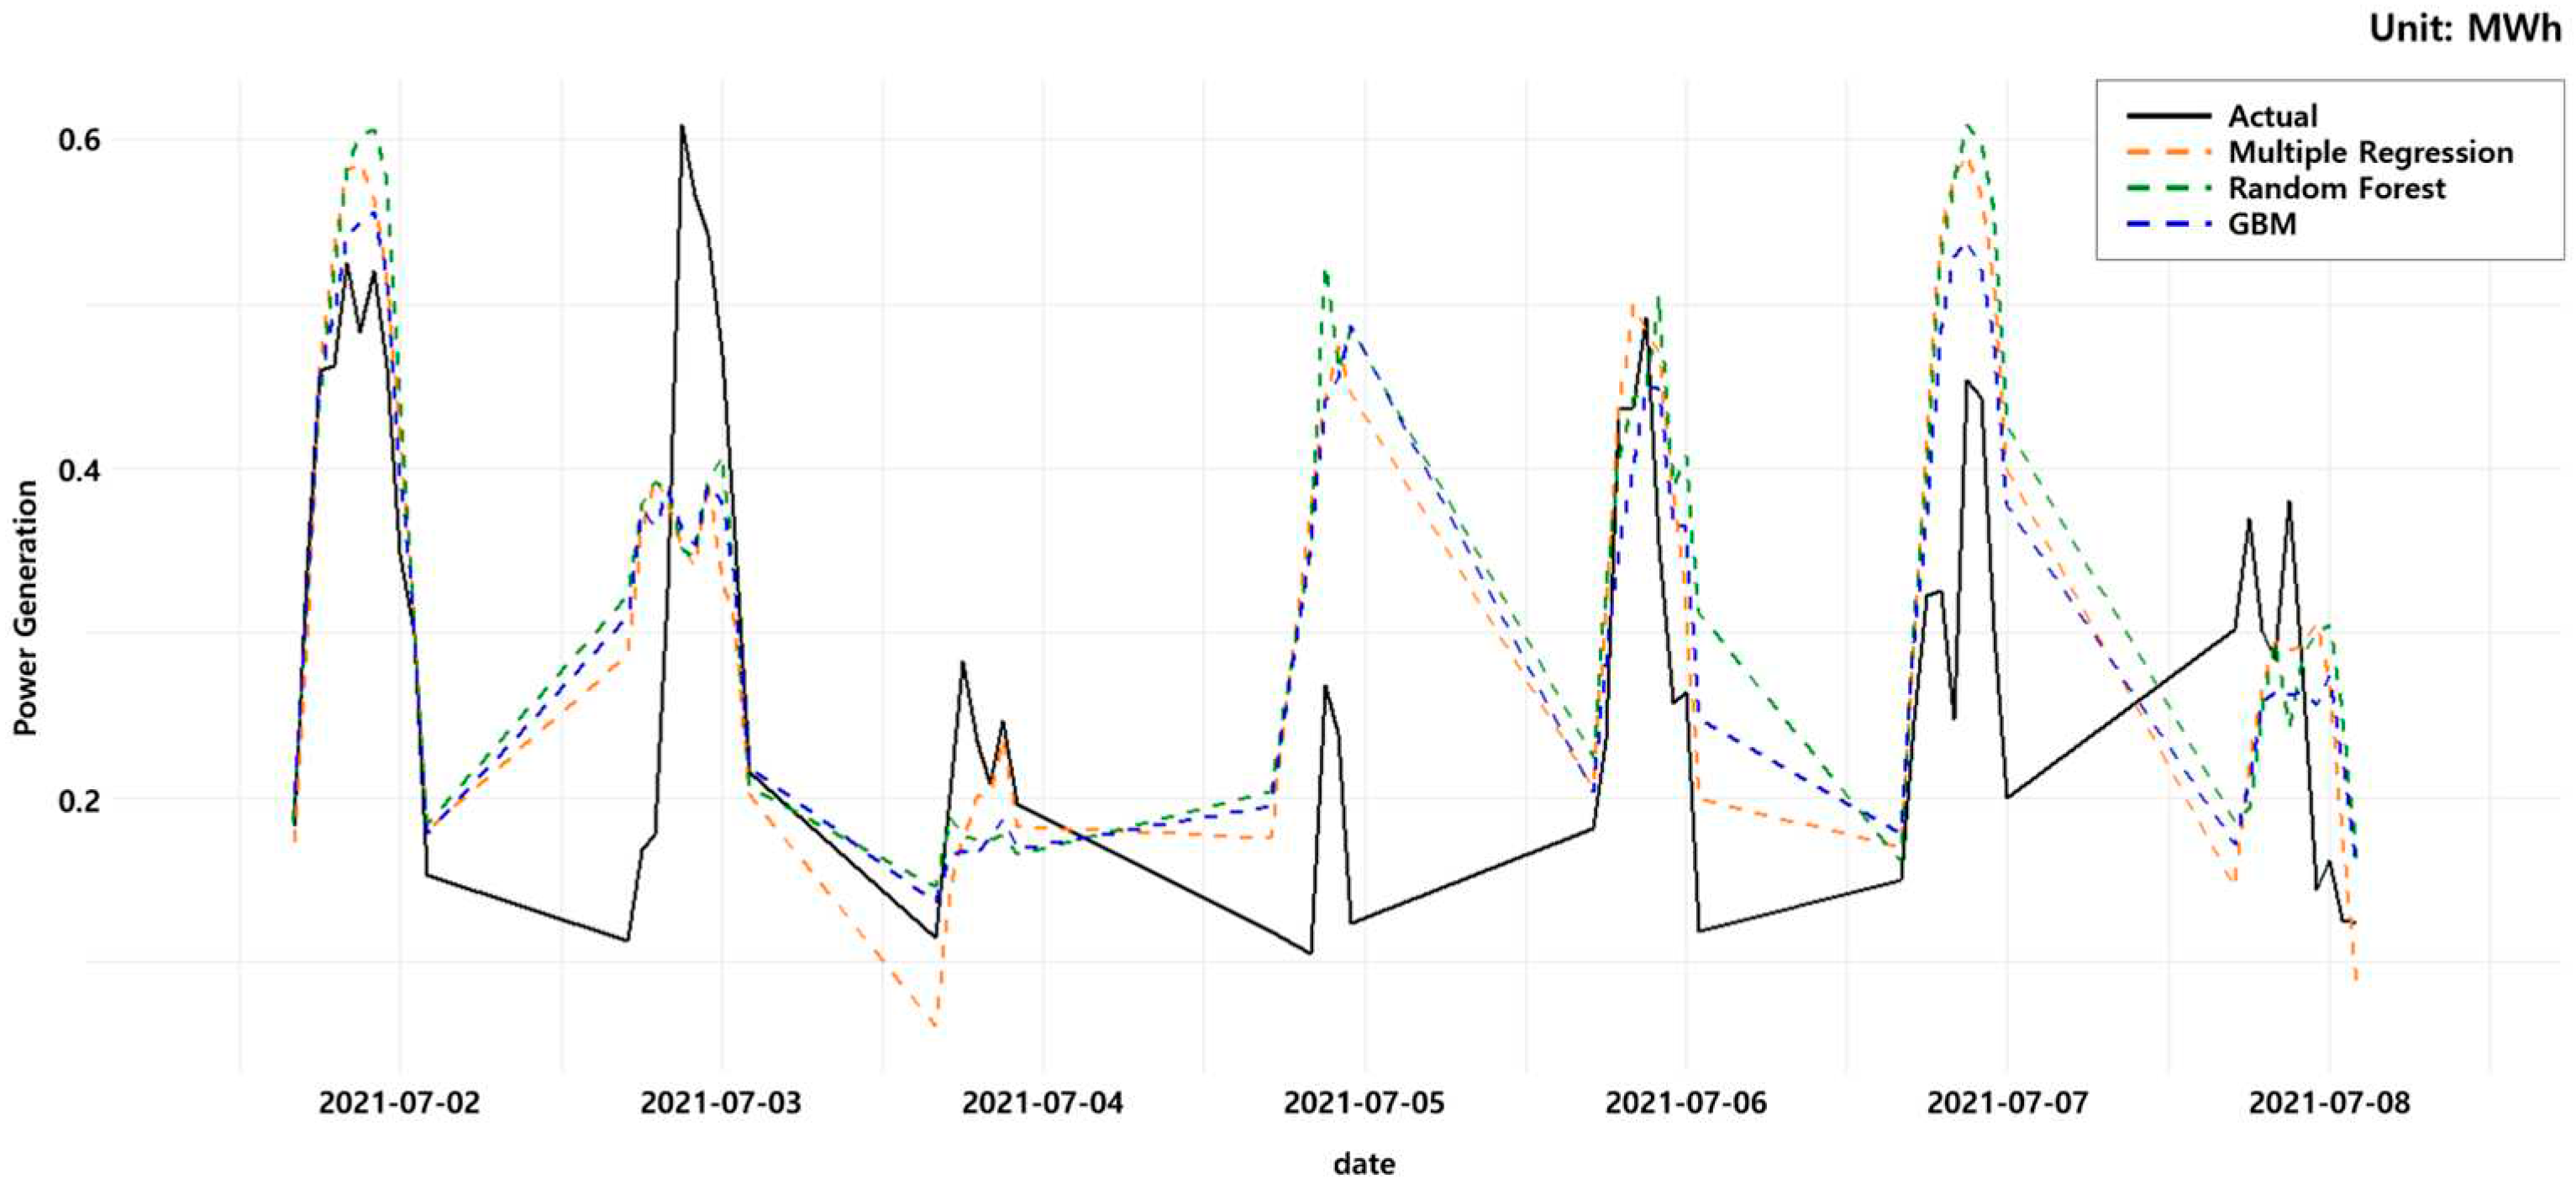

Table 1.
Variables included in datasets A and B.
| Variable | Description | Dataset A | Dataset B | Unit |
| date | Date | O | O | |
| KPX | Energy generation quantity (outcome variable) | O | O | MWh |
| cGHI | Clear-sky global horizontal irradiance | O | O | Wh/m2 |
| Szen | Sun zenith angle | O | O | Degree |
| Sazi | Sun azimuth angle | O | O | Degree |
| ExtI | Extraterrestrial radiation | O | O | Wh/m2 |
| Temp_nwp | Predicted ground temperature | O | K | |
| GHI_nwp | Predicted global horizontal irradiance | O | Wh/m2 | |
| GHI_sat | Satellite-based global horizontal irradiance | O | Wh/m2 | |
| TMP_P0_L1_GLC0 * | Surface air temperature | O | K | |
| TMP_P0_L103_GLC0 * | Air temperature at 1. 5 m altitude | O | K | |
| DPT_P0_L103_GLC0 * | Dew point at 1. 5 m altitude | O | K | |
| TTDIA_P0_L103_GLC0 * | Temperature change rate at 1. 5 m altitude | O | K/s | |
| RH_P0_L103_GLC0 * | Relative humidity at 1. 5 m altitude | O | % | |
| UGRD_P0_L103_GLC0 * | U component of wind speed at 10 m altitude | O | m/s | |
| VGRD_P0_L103_GLC0 * | V component of wind speed at 10 m altitude | O | m/s | |
| PRES_P0_L1_GLC0 * | Surface barometric pressure | O | Pa | |
| PRMSL_P0_L101_GLC0 * | Sea level pressure | O | Pa | |
| DIST_P0_L1_GLC0 * | Altitude | O | m | |
| HPBL_P0_L220_GLC0 * | Boundary layer altitude | O | m | |
| LCDC_P0_L200_GLC0 * | Low-level cloud cover | O | 0–1 | |
| MCDC_P0_L200_GLC0 * | Mid-level cloud cover | O | 0–1 | |
| HCDC_P0_L200_GLC0 * | High-level cloud cover | O | 0–1 | |
| VIS_P0_L103_GLC0 * | Visibility | O | m | |
| TMAX_P8_L103_GLC0_max1h * | Maximum temperature in 1 h | O | K | |
| TMIN_P8_L103_GLC0_min1h * | Minimum temperature in 1 h | O | K | |
| LHTFL_P8_L1_GLC0_avg1h * | Latent heat flux 1-h average | O | W/m2 | |
| NCPCP_P8_L1_GLC0_acc1h * | Non-flowing hourly accumulated precipitation | O | kg/m2 | |
| LSPRATE_P8_L1_GLC0_avg1h * | Non-flowing hourly average precipitation | O | kg/m2/s | |
| LSSRATE_P8_L1_GLC0_avg1h * | Non-flowing hourly average snowfall rate | O | kg/m2/s | |
| CPRAT_P8_L1_GLC0_acc1h * | Convective hourly accumulated precipitation | O | kg/m2 | |
| MCONV_P8_L1_GLC0_acc1h * | Moisture convergence rate | O | kg/kg/s | |
| FRICV_P8_L103_GLC0_max1h * | Maximum turbulent wind speed in 1 h | O | m/s | |
| FRICV_P8_L103_GLC0_min1h * | Minimum turbulent wind speed in 1 h | O | m/s | |
| DSWRF_P8_L1_GLC0_avg1h * | Total solar radiation 1-h average | O | W/m2 | |
| VBDSF_P8_L1_GLC0_avg1h * | Direct radiation 1-h average | O | W/m2 | |
| DLWRF_P8_L1_GLC0_avg1h * | Longwave radiation 1-h average | O | W/m2 |
* Measured at both 21:00 the day before and 03:00 on the day, respectively; therefore, these variables have two values.
Table 2.
Accuracy comparison among three models for each spot.
| MR | RF | GBM | ||||
|---|---|---|---|---|---|---|
| RMSE | MAE | RMSE | MAE | RMSE | MAE | |
| All | 12.00% | 9.06% | 11.69% | 8.61% | 11.34% | 8.18% |
| Spot 0 | 10.10% | 7.62% | 9.71% | 7.16% | 9.62% | 7.02% |
| Spot 1 | 9.89% | 7.25% | 9.56% | 6.76% | 9.51% | 6.68% |
| Spot 2 | 11.94% | 8.86% | 11.37% | 8.22% | 11.20% | 8.01% |
| Spot 3 | 14.13% | 10.94% | 13.56% | 10.18% | 13.43% | 9.92% |
| Spot 4 | 10.65% | 7.70% | 10.81% | 7.69% | 10.63% | 7.50% |
| Spot 5 | 13.09% | 10.07% | 12.73% | 9.40% | 12.70% | 9.20% |
| Spot 6 | 10.32% | 7.66% | 9.89% | 7.14% | 9.95% | 7.12% |
| Spot 7 | 11.48% | 8.39% | 11.45% | 8.02% | 11.27% | 7.82% |
| Spot 8 | 12.31% | 9.51% | 11.68% | 8.66% | 11.51% | 8.36% |
| Spot 9 | 13.94% | 9.57% | 11.32% | 8.36% | 11.15% | 8.15% |
| Spot 10 | 13.05% | 9.95% | 12.96% | 9.68% | 12.89% | 9.55% |
| Spot 11 | 12.04% | 8.50% | 10.98% | 7.76% | 10.96% | 7.57% |
| Spot 12 | 13.08% | 10.11% | 12.55% | 9.35% | 12.50% | 9.17% |
| Spot 13 | 11.49% | 8.92% | 11.34% | 8.60% | 11.32% | 8.50% |
| Spot 14 | 11.58% | 8.63% | 11.40% | 8.33% | 11.44% | 8.23% |
Table 3.
Autoregressive integrated moving average (ARIMA) model results for each spot.
| Spot | |
|---|---|
| Spot 0 | (5, 1, 0) |
| Spot 1 | (5, 1, 0) |
| Spot 2 | (5, 1, 0) |
| Spot 3 | (5, 1, 0) |
| Spot 4 | (5, 1, 0) |
| Spot 5 | (5, 1, 0) |
| Spot 6 | (5, 1, 0) |
| Spot 7 | (1, 1, 0) |
| Spot 8 | (5, 1, 0) |
| Spot 9 | (5, 1, 0) |
| Spot 10 | (5, 1, 0) |
| Spot 11 | (1, 1, 0) |
| Spot 12 | (5, 1, 0) |
| Spot 13 | (1, 1, 0) |
| Spot 14 | (1, 1, 0) |
Table 4.
RMSE and MAE values of ARIMA model results for each spot
| Spot | RMSE | MAE |
|---|---|---|
| Spot 0 | 25.90% | 13.92% |
| Spot 1 | 21.47% | 11.48% |
| Spot 2 | 29.07% | 15.57% |
| Spot 3 | 37.27% | 19.49% |
| Spot 4 | 24.61% | 13.00% |
| Spot 5 | 20.27% | 10.52% |
| Spot 6 | 35.30% | 18.87% |
| Spot 7 | 21.65% | 11.03% |
| Spot 8 | 46.56% | 24.71% |
| Spot 9 | 19.16% | 10.18% |
| Spot 10 | 52.69% | 27.76% |
| Spot 11 | 19.95% | 10.26% |
| Spot 12 | 51.29% | 26.88% |
| Spot 13 | 16.65% | 8.42% |
| Spot 14 | 35.33% | 18.08% |
Disclaimer/Publisher’s Note: The statements, opinions and data contained in all publications are solely those of the individual author(s) and contributor(s) and not of MDPI and/or the editor(s). MDPI and/or the editor(s) disclaim responsibility for any injury to people or property resulting from any ideas, methods, instructions or products referred to in the content. |
© 2023 by the authors. Licensee MDPI, Basel, Switzerland. This article is an open access article distributed under the terms and conditions of the Creative Commons Attribution (CC BY) license (http://creativecommons.org/licenses/by/4.0/).
Copyright: This open access article is published under a Creative Commons CC BY 4.0 license, which permit the free download, distribution, and reuse, provided that the author and preprint are cited in any reuse.


