
Submitted:
24 June 2024
Posted:
25 June 2024
You are already at the latest version
Abstract
The presence and localization of plant metabolites are indicative of physiological processes, e.g., under biotic and abiotic stress conditions. Further, the chemical composition of plant parts is related to their quality as food or for medicinal applications. Mass spectrometry imaging (MSI) has become a popular analytical technique for exploring and visualizing the spatial distribution of plant molecules within a tissue. This review provides a summary of mass spectrometry methods used for mapping and identifying
metabolites in plant tissues. We present the benefits and the disadvantages of both vacuum and ambient ionization methods, considering direct and indirect approaches.
Finally, we discuss the current limitations in annotating and identifying molecules and perspectives for future investigations.
Keywords:
plant metabolomics
; mass spectrometry imaging
; compound identification
1. Mass Spectrometry Imaging of Plants
Plant metabolites have been extensively studied as a source of bioactive compounds for different industries. Plant biology has sought to elucidate when, where, and which secondary metabolites act as chemical mediators between plants and their surrounding environment [1].
Gas chromatography (GC) and liquid chromatography (LC) coupled to mass spectrometry (MS) are routinely used analytical methods for studying plant metabolites. However, the precise location within the tissues remains unknown due to the limitation of sample extraction [2].
Mass spectrometry imaging (MSI) is a technique that generates a snapshot of the distribution of molecules in biological tissue at a specific time. MSI permits the visualization of a diverse range of compounds in a single experiment. MS is a universal method, and, in contrast with other techniques like antibody-based strategies, MS allows the exploration of a more comprehensive chemical profile within the same experiment. Consequently, MSI represents an exciting opportunity to refine our knowledge of plant physiology.
Nevertheless, compound identification from MSI datasets can be challenging because each sampled spot may contain multiple overlapping signals, which are difficult to separate by experimental or data processing methods. Therefore, MSI is more a quantification than an identification technique.
Here, we review the state-of-the-art plant MSI, levels of confidence for metabolite identification, and experimental and computational strategies that can be used at different stages of MSI projects to enrich, separate, and identify metabolites.
MSI is a label-free technique for the untargeted analysis of secondary metabolites without prior knowledge. Independently from the manufacturer, an MSI setup consists of a sampling plate where the tissue is positioned, an ionization/desorption source, a mass analyzer, and a detector.
Over the past two decades, new ionization sources have expanded the range of detectable compounds. The joint goals are to allow direct analyses and enhance sensitivity [3]. Among the numerous ionization sources, we can distinguish two principal categories depending on the pressure conditions of the ionization/desorption source, i.e., analysis in vacuum or ambient conditions.
Matrix-Assisted Laser Desorption Ionization (MALDI) and Secondary Ion Mass Spectrometry (SIMS) represent the most popular ionization techniques under vacuum conditions [4]. SIMS uses highly energetic primary ions for ionization, resulting in a high degree of fragmentation and making this technique less attractive for identifying unknown species [5]. In MALDI, analytes are co-crystalized with a chemical matrix. The matrix is a small molecule that absorbs the energy from a highly energetic ultraviolet (UV) or infrared (IR) laser. A significant challenge in MALDI imaging experiments is the high number of interference signals from the chemical matrix, which often overlap with the metabolites of interest [6]. Another critical aspect is the sample preparation, which consists of a multi-step process that may result in the delocalization of the analytes and, subsequently, erroneous interpretation of the results. MALDI was used for the first time in plant science in 2005 to detect and image agrochemicals in soybean plants [7].
In 2007, the colloidal graphite-assisted laser desorption ionization (GALDI) technique was introduced as an alternative to the standard MALDI matrixes. Due to its hydrophobic nature, graphite is more compatible with plant material. GALDI was used to image small molecules in strawberry and apple slices. Fatty acids and flavonoids were analyzed in negative mode at the femtomole range. The molecules were detected directly and subsequently identified by comparing the MS and MS/MS spectra with those of standards [8,9].
In 2009, A matrix-free approach was presented to analyze flavonoids in the model plant Arabidopsis thaliana. This technique was introduced as laser desorption ionization (LDI) and is ideal for UV-absorbing compounds [10]. In the same year, Harada et al. presented a mass-microscopic atmospheric-pressure (AP) LDI [11]. A UV laser under ambient conditions was combined with an optical microscope to image fresh ginger rhizome sections. The imaging system was coupled to a quadrupole ion trap time-of-flight (QIT-TOF) instrument, which facilitated the identification since tandem MS could be compared to the authentic standard. Another approach used an LDI to image trichomes from wild tomatoes (Solanum habrochaites). In this report, the authors used a carbon-substrate-based method to transfer the trichomes from the tissue to the carbon slide, resulting in images with high spatial resolution [12]. LC-MS confirmed the identification of metabolites. Postsource decay LDI mass spectra were acquired to verify the metabolite structures further.
In MALDI-2, an additional laser improves the sensitivity and detection of low-abundant compounds by offering a second ionization stage [13]. MALDI-2 was used for imaging apple (Malus domestica) sections. Compared with conventional MALDI, sugars and phenolic compounds were detected with an increment of two orders of magnitude.
AP-MALDI was introduced in 2000 to overcome the sublimation of matrixes under high vacuum conditions [14]. In 2007, AP-MALDI was applied for the first time to study plant tissues. Initially, a mid-IR laser was used to visualize sugars and citric acid on strawberry skin [15]. Using an IR laser eliminates the necessity of an external chemical matrix because the water content in the tissue serves as a matrix for absorbing the laser energy.
The AP scanning microprobe (S)MALDI was developed for high lateral resolution [16]. A single laser pulse per pixel was applied for imaging peptides. In 2014, this system was used to image plant tissues; the rhizome of Glycyrrhiza glabra was investigated, and two isobaric saponins were mapped with high lateral resolution. Further MS/MS analysis confirmed their identity [17].
A series of ambient ionization mass spectrometry (AIMS) techniques have also been developed. Their popularity relies on their ability to perform direct analysis, reducing or eliminating the sample preparation. AIMS analyses are conducted under natural conditions where plant tissues do not undergo significant changes. The AIMS techniques can be classified based on the desorption/ionization mechanism. This classification includes spray-based, plasma-based, and coupled techniques [18].
Desorption electrospray (DESI) is the most common spray-based technique for MSI under ambient conditions. DESI was presented in 2004 [19] and later coupled to imaging platforms [20]. DESI does not require a matrix application; instead, it relies on an electrically charged solvent that impacts the surface of the tissues. The analyte extraction depends on the solvent used, the sample’s complexity, and the setup’s geometry [21]. DESI has been used for direct and indirect analyses of plant tissues. In the direct mode, biological tissues are mounted on the sampling stage without prior preparation. The first example of direct DESI imaging analysis was presented in 2009, where the macroalga Callophycus serratus was studied; bromophycolides were mapped before and after mechanical damage. Identification of the secondary metabolites was corroborated by comparison of the extracts using LC-MS analysis with pure standards [22]. However, direct DESI imaging in plant tissues has a main obstacle: the penetration of the cuticular wax layer. To overcome this problem, Janfelt’s group presented an indirect DESI imaging technique in 2011. The imprinting of the sample using a micro-porous Teflon surface extracts the compounds from their natural matrix while maintaining the spatial integrity of the sample. Leaves and petals of Hypericum perforatum and Datura stramonium leaves were investigated, and compound identification was achieved with tandem MS on the imprints [23]. A couple of months later, Cooks’ group presented the same approach to investigate the catabolic products from chlorophyll in Cercidiphyllum japonicum leaves. Tandem MS using collision-induced dissociation (CID) verified the identity of the catabolites [24].
Direct real-time analysis (DART) was the first ambient technique based on plasma [25]. DART generates the plasma using a direct current discharge and a helium flow. The temperature of plasma impacting the sample surface ranges between 250 °C and 350 °C. The lack of a defined plasma jet and its high temperature makes DART impractical for imaging applications. 2008 low-temperature plasma (LTP) MS was introduced [26]. An alternating high voltage, high frequency, and low gas flow produces a dielectric barrier discharge. The temperature at the sample surface is maintained around 30 °C. A double dielectric barrier probe was presented in 2013 [27]. This LTP with a defined plasma beam diameter and a controlled temperature was suitable for directly analyzing plant tissues. Soon after, the LTP was used for imaging the distribution of capsaicin and other small metabolites in a cross-section of chili ( Capsicum annum Jalapeño pepper) fruit [28]. In this example, the spatial resolution was limited to 1 mm; however, it was sufficient to demonstrate that capsaicin is distributed and limited to specific fruit compartments. A 3D-printed version of the LTP probe with about 200 m plasma jet diameter can be used for LTP MSI with improved lateral resolution and in vivo analysis of plants, such as nicotine biosynthesis in tobacco [29,30].
Coupled techniques separate the desorption and the ionization of the analytes. Surface sampling with a laser has several advantages for imaging applications. Lasers can be optically focused to provide high spatial resolution [31]. Laser ablation electrospray ionization (LAESI) was presented in 2007 as a coupled technique for directly analyzing biological samples [32]. Tissue-specific metabolites from Tagetes patula seedlings were reported and tentatively identified based on the combination of accurate masses, database, isotopic distribution, and using tandem MS. The year after, an imaging study showed the capabilities of LAESI for plant analysis [33]. Leaves from Aphelandra squarrosa were imaged, and characteristic metabolites from green and yellow areas were identified using tandem mass spectrometry. MALDESI was developed as a combined technique, including applying a matrix followed by a laser to ablate the area and a second ionization process using electrospray [34]. The desorption ionization mechanism is similar to LAESI; for IR-MALDESI, applying an ice layer as a matrix showed an increase in the ion intensity by an order of magnitude [35].
In 2020, IR-MALDESI was used to image cherry tomatoes’ metabolites [36]. The authors employed discovery-driven and literature-driven methods for identifying compounds in tomato MSI. Discovery-driven involves analyzing the spatial distribution of selected ions and correlating other ions with the same distribution pattern. The authors used the tool MSiCorrelation in the open software MSIreader [37]. After assessing the distribution of the most relevant ions, a literature-driven method was used, and the ions were searched against literature and database resources. For example, thirty-five structural isomers were found for the ion 273,0757 m/ z, and from these, naringenin chalcone was selected as the most likely metabolite. Laser ablation atmospheric pressure photoionization (LA-APPI) is another approach presented in 2014 to investigate the distribution of active compounds in sage (Salvia officinalis) leaves [38]. The tentative assignment of the primary ions was based on previous reports.
Plasma-based techniques have also benefited from adding an extra desorption source and have been used for imaging plant tissues. In 2008, an Nd:YAG laser ablation (LA) was coupled to a flowing atmospheric-pressure afterglow (FAPA), demonstrating the capabilities for imaging. In this report, the authors doped celery stock with caffeine and imaged it [39], concluding that adding a laser improves the detection of compounds and makes imaging analysis possible. In 2014, a plasma-assisted laser desorption ionization mass spectrometry (PALDI-MS) was presented using a DART ionization source and a 532 nm laser [40]. The study demonstrates the non-uniform distribution of the active components baicalein and wogonin in the Radix Scutellariae root. The accurate mass-to-charge ratio confirmed the identity of these compounds. In 2017, a similar study was presented using a 213 nm Nd:YAG solid-state UV laser and DART; this technique was called laser ablation direct analysis in real-time (LADI). LADI-MS was used to image the spatial distribution of the alkaloid biosynthesis products in the Datura leichhardtii seed [41]. MALDI-MS/MS was used to corroborate the identity of the observed masses. In 2019, another plasma-based approach was presented; a UV diode laser was coupled to an LTP to improve the desorption of less volatile compounds and delimitate the area of analysis [42]. This coupled technique LD-LTP was used to image mescaline in the cactus San Pedro (Echinopsis pachanoi), nicotine in tobacco (Nicotiana tabacum) seedlings, and tropane alkaloids in jimsonweed (Datura stramonium) fruits and seeds. This technique demonstrated its flexibility for the analysis of macroscopic and mesoscopic samples. The identification of targeted molecules was conducted using MS/MS. In 2024, a similar concept was put together using a 532 nm laser ablation system followed by a dielectric barrier discharge ionization (LA-DBDI) to study pesticide uptake and translocation in tomato plants [43].
The imaging techniques described here are examples of MSI under vacuum and ambient conditions, as well as coupled techniques. Now, we will review methods for elucidating and validating plant molecules from MSI experiments.
2. Plant Compound Elucidation in Mass Spectrometry Imaging (MSI)
The metabolomics standards initiative defined four plus one) levels of metabolite identification, which reflect their experimental support [44,45]. These levels were revised, and now, using five levels of confidence is recommended for both untargeted metabolomics and MSI experiments [46,47,48].
We represent them in reverse order with examples of applications from the least to the highest confidence level:
- Level 5 - Exact mass of interest: The raw data contain defined m/z signals that can be mapped to the sampled surface. With sufficient analytical resolution, it can be assumed that the m/z features correspond to unique compounds. Of course, isobaric molecules cannot be distinguished. Features are not identified; however, quantitation and statistical analyses for finding regions of interest (ROIs) or potential biomarkers are possible.
- Level 4 - Molecular formula: High-resolution mass spectrometry (HR-MS) data, fragmentation experiments, and isotopic patterns permit calculating the chemical sum formula. The results can be compared with databases to find a possible match.
- Level 3 - Tentative structure: Using HR-MS data, tandem MS directly from tissues, in-source decay spectra, isotope distribution, and databases. More than one compound can be explained using the available data. This level requires complementary information, such as multimodal imaging techniques, fluorescence microscopy, IR spectroscopy, immunolocalization, chemical staining for functional groups, tissue extracts, and subsequent analysis using GC-MS and LC-MS.
- Level 2 - Probable structure: Further refinement leads to a single structure candidate. The results obtained in level 3 are assessed using expert knowledge, biological context, and bioinformatic analyses. For example, genome analyses and chemoinformatics can reveal theoretically possible metabolites.
- Level 1 - Confirmed structure: Unequivocal three-dimensional chemical structure identification. Requiring at least two independent and orthogonal methods should provide different types of information and not be affected by the exact source of error. For example, Nuclear Magnetic Resonance (NMR) supports structural studies, and isotopic labeling techniques enable tracing the path of a molecule through a reaction or a metabolic pathway. An authentic standard is required; in MSI, it is a common practice to spike it into a replicated biological tissue.
Figure 1 illustrates the confidence levels for mass spectrometry imaging experiments and suggests methods for compound identifications that can be combined with mass spectrometry imaging (MSI).
Reaching level 1 for proper chemical identification is challenging for several reasons, such as the need for reference standards, low signal intensities and low abundance for the compound of interest, and the overlap of m/z features. Therefore, it is crucial to define the biological question and, based on this, identify a suitable experimental strategy. The following section discusses the steps commonly used to perform MSI experiments.
3. Experimental Steps in MSI
Figure 2 presents the four steps of MSI studies:
- Sample preparation.
- MSI analysis (data collection).
- MSI data analysis.
- Supportive techniques.
3.1. Sample Preparation
MSI analysis typically requires extensive preparation to accurately capture the metabolic status of the biological tissue at a specific point and under defined conditions (e.g., seedlings under drought stress vs control seedlings). Over the past 20 years, the predominant technique for MSI in plant science has been MALDI, followed by the emerging ambient ionization technique DESI. Ambient ionization techniques require much less sample preparation, and ideally, the biological materials can be analyzed `as is.’
3.1.1. Sample Preservation
It is essential to have appropriate handling and preservation techniques for the samples to ensure the molecules’ original distribution, abundance, and identity. Variables such as water content, storage time, and temperature to quench metabolism have to be considered. Plant tissues are commonly freeze-dried (e.g., for SIMS analysis) or frozen, sectioned, and stored at -80 ºC (e.g., for MALDI or DESI analyses) to prevent enzymatic degradation or analyte diffusion [49]. Freezing biological material with a high water content without further precautions is not recommended. Immediate freezing and storing plant tissues can alter the sample’s initial shape over time due to water sublimation, which causes tissue shrinking and the delocalization of compounds. A strategy to avoid delocalization is to slide tissue sections, mount them in glass slides, vacuum-dry them, and then store samples in falcon tubes with holes vacuum-sealed in plastic bags [3]. Using a method that quenches the metabolism is highly recommended for any biological sample. For example, after being embedded in gelatin and immediately frozen for cryosectioning, maize leaves may be warmed and vacuum-dried [50].
3.1.2. Sectioning
Once the biological tissue has been adequately preserved, the next step is typically the sectioning via a microtome or a cryo-microtome, and the resulting sections are mounted on a flat surface. However, this step depends on the compounds of interest, the selected MSI technique, and the tissue type. For example, for MALDI imaging, conductive glass slides are recommended [4]. The thickness of the tissue sample is also essential. Finer slices improve the conductivity in MALDI experiments. Cutting thin tissue slices with a high water content is technically challenging. Typically, plant tissue slices are in the range of 50 m [3]. Thin tissue sections are not always necessary, e.g., for tiny seeds (1-3 mm in diameter). There is a limitation due to the thickness of some seeds, leaves, flowers, and even small roots; therefore, it can not be sectioned. Thus, the tissues may be studied intact or imprinted [51,52]. In 2015, transversal cuts of maize leaves with a thickness of 10 m were obtained [50]. Thin tissue slices were also achieved by placing a root between two polystyrene sections and cutting it tangentially [53].
Histology methods for sectioning have been widely adopted for MSI. However, plant tissue fixation, washing, and staining are incompatible with MS-based techniques. Polyethylene glycol should be avoided because of metabolite diffusion and signal suppression [3]. New ambient imaging techniques presented reduce the sample preservation and sectioning; for instance, with the use of LD-LTP and LADI, sample preservation is not necessary for tissues with low water content, and sectioning of the samples can be accomplished with a scalpel [41,42].
3.1.3. Matrix Application
In MALDI and MALDESI, a chemical matrix is required. Commonly, this matrix is a small organic compound that facilitates the desorption and ionization of the compounds of interest. The matrix choice is analyte-dependent and is crucial for MSI to avoid metabolite diffusion, which is an essential issue in matrix-based techniques. In the case of laser-based methods, there are alternative options to standard MALDI matrixes. For LDI-MSI, a matrix is not necessary [54]. An alternative approach is using nanoparticles, which have the advantage that they do not ionize themselves, thus reducing the matrix interference. In 2020, Shiono et al., demonstrated that the use of nanoparticles for laser desorption ionization improved the detection of phytohormones from 5 to 9 of the nine tested phytohormones, compared with MALDI [55].
3.1.4. Liberation of Plant Cell Compounds
Adequate sample handling avoids diffusion and degradation through enzymatic processes, light, heat, and atmospheric exposure [3]. The preparation and treatments employed before the analysis in plant samples differ from those used in mammalian tissues because of the plant cuticle and the cell wall barriers. Three strategies have been employed to address these challenges.
The first strategy is using an efficient ionization/desorption source according to the plant tissue. Alternatively, coupled ionization/desorption techniques may be employed. In this case, a desorption/ablation source penetrates the tissue, facilitating the release of the molecules. Subsequently or simultaneously, an ionization source is employed to assist the process, for example, a laser, as in LAESI or LD-LTP.
The second strategy involves imprinting a plant tissue section on flat surfaces, such as PTFE or nylon sheets [24,52]. This approach is considered an indirect technique for MSI. This previous process avoids the potential for interferences caused by the cuticle, cellular wall, and water content.
The third strategy is to remove the plant cuticle, which can be achieved through two methods: a chemical wash-off, which facilitates the removal of the wax layer from tissues and, thereby, boosts detectable compounds that would otherwise be undetectable in a direct technique. The analysis of chloroform-dipped Arabidopsis leaves was presented in 2008 by Cha et al. [9]. However, this process may also result in the delocalization or washing away of many other compounds, as Tong et al. demonstrated in 2022 [51].
3.1.5. Derivatization
In-situ derivatization, also known as on-tissue chemical derivatization (OTCD), is a process whereby the molecules are chemically modified directly on the tissue to enhance their ionization efficiency and detection. For instance, such chemical treatment is employed when the compounds of interest have low ionization efficiency or stability. Also, the concentration of the analytes of interest may be low, leading to interference in their detection from other compounds. MSI analysis is expected to detect unwanted molecules, which can give rise to interferences or matrix effects and mask the targeted molecules. Consequently, an in-situ derivatization may be employed. Nevertheless, as with any chemical modification, the OTCD is specific for functional groups, and thus, this is used for targeted metabolomics.
A promising OTCD on plant tissue was reported in 2023 by Zemaitis et al. to enhance the detection in MSI using MALDI [56]. The authors applied 4-(2-((4-bromophenethyl) dimethylammonio) ethoxy) benzenaminium bromide (4-APEBA) to derivatize molecules from soybean nodules and poplar roots. The application of 4-APEBA increased the detection of various compounds, including amino acids and hormones, reducing sugars, aldehydes, carboxylic acids, and others [57]. This chemical reagent represents a promising tool for MSI as it enables imaging of the distribution of metabolites of opposite polarities and hydrophobicities [56].
3.2. MSI Analysis (Data Collection)
The confidence in assigning molecular identities is reduced In mass spectrometry imaging (MSI) because of the absence of separation methods. Therefore, it is recommended to use high-resolution (HR) or ultra-high-resolution analyzers (UHR) MS analyzers. Furthermore, including other methods, such as ion mobility spectrometry (IMS), mass fragmentation experiments, and utilizing isotopically labeled standard reagents, can increase the confidence level of compound identifications.
This section will discuss these approaches and their respective limitations. Using HR-MS or UHR-MS for imaging can reduce isobaric interferences, improving the identification confidence, but UHR-MS is not a routine approach in MSI of plants [48].
Recently, the combination of MALDI with Fourier-transform ion cyclotron resonance (FT-ICR) for MSI has been reported. As FT-ICR is considered a technique of UHR, combining FT-ICR with MALDI can potentially increase the confidence level in plant MSI. However, higher mass and spatial resolutions require higher measurement times and computational power [58].
Another critical element is the spatial resolution for MSI, crucial to answering a biological question. For example, a high spatial resolution allows for exploring the metabolites at the single-cell and organelles level [10]. In 2009, Holscher et al., reported the distribution of secondary metabolites in Arabidopsis thaliana and Hypericum species at the single-cell level, using LDI, achieving a lateral resolution of 10 x 10 m. This resolution is sufficient for sampling at the plant cell level (10-100 m) [59]. Harada et al. (2009) demonstrated MSI of volatiles at the organelle level of the ginger rhizome by LDI-QIT-TOF [11].
In addition, the precision of the sampling stage and the synchronization with the mass analyzer are crucial for the correct assembly of the MSI datasets.
3.3. MSI Data Analysis
Mass spectrometry data analysis workflows require the following steps [60]:
1. Raw data import/export and conversion (if necessary). 2. Spectra preprocessing. 3. Features analysis. 4. Statistics and data mining. 5. Integration and interpretation.
MSI data analysis is similar but includes features focused on visualization and quantification. Usually, an MSI analysis contains several hundreds or even thousands of features, and depending on the research question, identifying these ions can be less or more complex. The steps for analyzing MSI data are more directed toward visualizing metabolite distribution and biological interpretation. The first step for analyzing MSI data involves creating the spatial distribution of any given mass-to-charge value or range.
Commercial instruments with MSI setup have vendor-specific software for data processing. In addition, academic instrument developers and programmers are creating in-house software to analyze the data recorded with their own or any given MSI instruments [61]. The vendor’s software requires purchasing a license, which can be costly and sometimes lacks the functions needed to answer a bioanalytical question. Therefore, MSI data processing workflows with open-source software are attractive for academic researchers. A file conversion from instrument data to community file formats is usually necessary. The standardized data format for mass spectrometry imaging data imzML has facilitated data management and MSI data exchange [62]. Many vendors’ software can now read imzML files (MassLynx, FlexImaging, Imaging For Windows) or provide an option to export imzML files (http://ms-imaging.org/imzml/software-tools/). In addition, several open-source MSI programs provide data conversion [63] and support for imzML files [37,64,65,66,67].
PRIDE (https://www.ebi.ac.uk/pride/) [68] and METASPACE (https://metaspace2020.eu/) provide public repositories for uploading MSI files to facilitate collaboration in the research community.
The analysis of MSI data often includes visualization of metabolite distribution, quantitation, or other statistical features, including principal component analysis (PCA). Free and vendor software, such as MSiReader and msiQuant [37,69], is available.
In addition, the open-source program RmsiGUI integrates the control of a robotic imaging platform and the compilation of imzML [61]. Software like MSiReader or RmsiGUI (R package) allows the overlay of optical and ion images [37,61].
In general, MSI software has options for visualization, normalization, or multivariate analysis, but only a few include a molecular annotation/identification function, such as LipostarMSI, METASPACE, Scils Lab, or Cardinal [70,71,72].
MSI Software offers essential functions for understanding plant metabolism, like color scale intensity-based for ion distribution, to compare the distribution between different single scale colors. Programs like Datacube Explore or Scils Lab offer ROI quantification, which can help understand the state of plant metabolism.
Accurate mass filtering (e.g., HRMS) and a tandem MSI analysis support the identification of compounds from MSI experiments. An R package, rMSIFragment, recently included a function to improve lipidomics annotation considering in-source fragmentation [73]. In 2023, Wadie et al. developed METASPACE-ML, a machine-learning model for METASPACE, which includes a false rate discovery (FDR) calculation, to improve the reliability in metabolite annotation [71]. Most data used to train the model were MALDI-based and are still in development. However, tools like METASPACE-ML and rMSIfragment will increase the confidence for future MSI data annotation and identification.
Several free MSI data processing programs are implemented in the free statistical computing and graphics programming language R. R has an active user community and many additional data evaluation and visualization packages. However, R is an interpreter and, therefore, relatively slow. Reading imzML with the Julia language resulted in 100 times faster loading speeds than R, demonstrating the potential for the future data mining of massive MSI datasets [74].
Using dedicated databases for plants (e.g., PlantCyc, https://www.plantcyc.org) increases the confidence in compound identification compared to using generic databases [75].
Integrating MSI with multi-omics is a promising and valuable approach to understanding the gene-metabolite relationship and discovering novel gene-associated metabolites [76]. In 2020, Dong et al., demonstrated that coupling MSI with RNA interference, gene silencing, agro-infiltration, or samples derived from plant natural variation could spatially map an entire metabolic pathway [76].
Despite the advances in software for MSI data processing, there is still much left to do. Currently, MSI data analysis is mainly manual, which is time-consuming and error-prone. Thus, the development of automated analysis of MSI datasets is required. For a more detailed revision of MSI software, check Weiskirchen et al., 2019 [66].
3.4. Supportive Techniques
Even with HR-MS instruments, identifying and confirming structural isomers is complicated [77]. Therefore, verifying compounds identified in an MSI experiment usually requires supportive techniques. For fragmentation studies on the features of interest, it is recommended to use the same ionization source and references. Fragmentation patterns can be compared with or without spiking the tissue.
ROIs can also be extracted from the tissue and analyzed with LC-MS [51,77]. Recovering the ROI is also handy when reference standards are unavailable [11,52].
Additional techniques are often used to analyze the analytes’ chemical and physical properties, e.g., using HPLC coupled to diode array detection (DAD).

Table 2.
Overview of strategies for mass spectrometry imaging (MSI) and supportive techniques used in the identification of plant metabolites. Abbreviations are listed below.
Table 2.
Overview of strategies for mass spectrometry imaging (MSI) and supportive techniques used in the identification of plant metabolites. Abbreviations are listed below.
| Chemical Class | Analyte | MSI Techn. | Orthol. Methods | Complementary Techn. | ID Level | Refs. |
|---|---|---|---|---|---|---|
| Phenolic compounds | Resveratrol, pterostilbene, stilbene phytoalexins | LDI and MALDI | HPLC-DAD | Fluorescence imaging (macroscopy), confocal fluorescence microscopy | Level 2 | [78] |
| Volatiles and phenolic compounds | Gingerol and terpenoids | AP-LDI | AP LDI MS/MS | Optical microscopy | Level 2 | [11] |
| Flavonoids | Kaempferol, quercetin and isorhamnetin | LDI | AP-MALDI and CID (TOF/TOF) | - | Level 2 | [10] |
| Flavanones | Baicalein, baicalin, wogonin | MALDI | MALDI-Q-TOF-MS | Optical microscopy | Level 2 | [79] |
| Phenolic compounds and carbohydrates | Jasmone, hexose sugars, salvigenin, flavonoids, and fatty acyl glycosides | DESI-MSI | FS FAAS | - | Level, 2, level 3 and level 4 | [80] |
| S-glucosides | Glucosinolates | MALDI, LAESI | ESI (chip-ESI) | - | Level 2 | [81] |
| Phenolic compounds and carbohydrates | Salvianolic acid J | DESI | LC-MS | - | Level 3 | [51] |
| Organic acids, phenolics and oligosaccharides | Ascorbic acid, citric acid, palmitic acid, linoleic acid, linolenic acid, oleic acid, apigenin, kaempferol, ellagic acid, quercetin, apigenin, fructose, glucose, sucrose | MALDI, GALDI | - | - | Level 2 | [82] |
| Amino acids, phenolic compounds, lipids | Indoxyl, clemastanin B, isatindigobisindoloside G, gluconapin, guanine, adenine, adenosine, sucrose, histidine, lysine, arginine, proline, citric acid, malic acid, linolenic acid, | MALDI | DESI-Q-TOF | - | Level 2 | [83] |
| Hydrocarbons and flavonoids | C29 alkane, kaempferol-hexose and quercetin-rhamnose | MALDI | DESI-MS, LAESI-MS, SIMS | - | Level 2 | [84] |
| Phenolic compounds | Resveratrol, pterostilbene, stilbene phytoalexins | LDI and MALDI | HPLC-DAD | Fluorescence imaging (macroscopy), confocal fluorescence microscopy | Level 2 | [78] |
| Glycoalkaloids and anthocyanins | Tomatidine, -tomatine, dehydrotomatine | MALDI | LC-MS/GC-MS | Electron microscopy imaging | Level 1 | [76] |
| Fatty acid and amino acids | Palmitic acid, stearic acid, oleic acid, inositol, -Alanine and tomatidine | MALDI | - | RT-qPCR | Level 2 | [85] |
| Organic acids | Citrate, malate, succinate, fumarate | MALDI | UPLC-HRMS/MS | - | Level 1 | [52] |
| Anthocyanins | Choline, pelargonidin | MALDI, SIMS | MALDI-MS/MS | Optical microscopy | Level 2 | [86] |
| Lipids | Cuticular lipids | MALDI | GC-MS | - | Level 5 | [87] |
| Terpenoids and diterpenoids | Vitexilactone, vietrifolin D, rotundifuran | MALDI | GC-MS | - | Level 3 | [88] |
| Lipid droplet associated protein | Wax ester & Triacylglycerol | MALDI | - | Confocal micrographs of LDAP | Level 4 | [89] |
| Nitrogenated and phenolic compounds | Cocaine, cinnamoylocaine, benzoylecgonine, etc | MALDI, LDI | ESI | - | Level 4 | [90] |
| Organic acids, carbohydrates, flavonoids, lipids | Nobiletin, phenylalanine, trans-Jasmonic Acid, quinic acid, ABA, other | DESI | LC-MS/MS | - | Level 3 | [91] |
| Triacylglycerol and phosphatidylcholines | Palmitic acid, vaccenic, linoleic, and -linoleic acids | MALDI | NMR, ESI | - | Level 1 | [92] |
| Phytohormones | Abscisic, auxin, cytokinin, jasmonic acid, salicylic acid | PALDI | MALDI | - | Level 2 | [55] |
Microscopy can be supported by staining, immunolabelling, and label-free techniques. These labeling methods allow the detection of specific molecules in plant tissues and provide information about the location of enzymes, lipids, carbohydrates, and other molecules.
Dyes like Congo Red or Calcofluor White (CW) stain carbohydrates such as the -(1→4)-glucans such as cellulose, callose, xyloglucans, and chitin [93,94].
In contrast, label-free imaging techniques use novel imaging technologies that do not require stains or fluorescent markers for visualizing plant cell organelles and structures. Ultraviolet microscopy enables the visualization of lignin and other aromatic compounds within plant tissue.
In 2017, Becker et al., demonstrated the efficacy of combining other imaging techniques with MSI. The researchers employed MALDI and LDI for MSI and confocal fluorescence microscopy (CLSM) to study the distribution of phenolic compounds (stilbene phytoalexins, namely resveratrol, pterostilbene, piceids, and viniferins) in grapevine leaf (Vitis vinifera). Moreover, the authors supported their findings in MSI using CLSM and HPLC-DAD techniques to detect, corroborate, and quantify phenolic compounds. CLSM produces high-resolution images without damaging the sample, thus allowing the acquisition of fluorescent images at the organ, tissue, and multicellular levels. Using LDI for MSI (266 nm laser) in positive mode, they could detect, characterize, and localize metabolites such as stilbenes without matrix application. HPLC with a diode array detector (DAD) added quantitative data and validated stilbenes’ compound identification.
Dong et al. in 2020 not only used MSI but complemented MSI information with different reverse genetics approaches to elucidate gene function [76]. They highlighted the potential of integrating MSI with reverse genetics techniques to elucidate gene functions by analyzing the spatial distribution of metabolites and correlating the MSI results with gene expression. The study employed Virus-Induced Gene Silencing (VIGS), an RNA-mediated reverse genetics technology, to downregulate endogenous genes and analyze their functions and was complemented with liquid chromatography-mass spectrometry (LC-MS), gas chromatography-mass spectrometry (GC-MS). In addition, the study employed scanning electron microscopy (SEM) as a complementary imaging technique.
The continued development of multimodal imaging workflows integrating MSI with super-resolution fluorescence microscopy, electron microscopy, spectroscopic imaging techniques like Raman and FTIR, and other emerging methods holds tremendous potential. Innovative multimodal image acquisition, data fusion algorithms, and open data repositories will be critical for fully exploiting the power of multi-scale, multimodal chemical imaging in both fundamental plant biology research and applied areas like food science, bioenergy, and phytoremediation.
4. Conclusions and Outlook
Mass spectrometry imaging (MSI) of plants has become a routine method for plant research. However, the unequivocal identification (ID level of 1) of chemical structures in MSI data is still challenging. Depending on the bioanalytical question, we suggest a targeted MSI strategy for specific compounds or the statistical analysis and data mining of m/z features with lower ID confidence (level 2-5), with a subsequent identification of features of interest using complementary methods.
High-resolution mass spectrometry (HR-MS) analyzers with ion mobility pre-separation facilitate the discrimination of distinct molecule ions. Nevertheless, in most cases, complementary analytical methods will be necessary for identification. In addition, the comparison with authentic reference standards for level 5 identifications is not trivial in MSI, and new strategies are needed to overcome practical limitations.
In the near future, we expect advances in integrating instrumental methods with chemoinformatic tools that use advanced algorithms such as machine learning and artificial intelligence to detect and identify biologically important features in MSI datasets. A prerequisite for these developments is the adoption of community file formats, FAIR data sharing and algorithms, and software with permissive, open licenses.
Author Contributions
Conceptualization, N.S.G.R., A.M.P. and R.W.; methodology, N.S.G.R., C.D.S.A., H.E.R.A., A.M.P. and R.W.; software, N.S.G.R., C.D.S.A., H.E.R.A., A.M.P. and R.W.; validation, N.S.G.R., C.D.S.A., H.E.R.A., A.M.P. and R.W.; formal analysis, N.S.G.R., C.D.S.A., H.E.R.A., A.M.P. and R.W.; investigation, N.S.G.R., C.D.S.A., H.E.R.A., A.M.P. and R.W.; resources, N.S.G.R., C.D.S.A., H.E.R.A., A.M.P. and R.W.; data curation, N.S.G.R., C.D.S.A., H.E.R.A., A.M.P. and R.W.; writing—original draft preparation, N.S.G.R., C.D.S.A., H.E.R.A., A.M.P. and R.W.; writing—review and editing, N.S.G.R., C.D.S.A., H.E.R.A., A.M.P. and R.W.; visualization, N.S.G.R., C.D.S.A. and H.E.R.A.; supervision, N.S.G.R., A.M.P. and R.W.; project administration, A.M.P. and R.W.; funding acquisition, R.W. All authors have read and agreed to the published version of the manuscript.
Conflicts of Interest
R.W. is inventor of the patent “Non-thermal plasma jet device as source of spatial ionisation for ambient mass spectrometry and method of application” (WO 2014/057409) and a shareholder of the company Kuturabi SA de CV. The funders had no role in the design of the study; in the collection, analyses, or interpretation of data; in the writing of the manuscript, or in the decision to publish the results.
Abbreviations
We followed the "Periodic Table of Mass Spectrometry (MS) Terms" [95]. The following abbreviations are used in this manuscript:
| ABA | Abscisic acid |
| AP | Atmospheric pressure |
| LDI | Laser desorption ionization |
| MALDI | Matrix assisted laser desorption ionization |
| SMALDI | Scanning microprobe matrix assisted laser desorption ionization |
| CW | Calcofluor-white |
| CLSM | Confocal laser scanning microscopy |
| DAD | Diode array detector |
| DART | Direct analysis in real time |
| DESI | Desorption electrospray ionization |
| EIC | Extracted-ion chromatogram |
| FAPA | Flowing atmospheric-pressure afterglow |
| FDR | False discovery rate |
| FS-FAAS | Fast sequential flame atomic-absorption spectrometry |
| FT-ICR | Fourier-transform ion cyclotron resonance |
| FT-IR | Fourier-transform infrared spectroscopy |
| GALDI | Graphite-assisted laser desorption ionization |
| GC | Gas chromatography |
| GFP | Green fluorescent protein |
| HR | High resolution |
| IR | Infrared |
| LA | Laser ablation |
| DBDI | Dielectric barrier discharge ionization |
| LADI | Laser ablation direct analysis in real time |
| LAESI | Laser electrospray ionization |
| LAAPI | Laser ablation atmospheric pressure photoionization |
| LC | Liquid chromatography |
| LDAP | Liquid droplet-associated protein |
| LDI | Laser desorption ionization |
| LD-LTP | Laser desorption low-temperature plasma |
| LMD | Laser micro-dissection |
| LTP | Low-temperature plasma |
| MALDESI | Matrix-assisted laser desorption electrospray ionization |
| MALDI | Matrix-assisted laser desorption ionization |
| MS | Mass spectrometry |
| MSI | Mass spectrometry imaging |
| Nd:YAG | Neodymium-doped yttrium aluminum garnet |
| NMR | Nuclear magnetic resonance |
| OTCD | On-tissue chemical derivatization |
| PALDI | Plasma assisted laser desorption ionization |
| QIT | Quadrupole ion trap |
| ROI | Regions-of-interest |
| SAMDI | Self-assembled monolayer desorption ionization |
| SIMS | Secondary-ion mass spectrometry |
| SEM | Scanning electron microscopy |
| TOF | Time of flight |
| UHR | Ultra high resolution |
| UPLC | Ultra performance liquid chromatography |
| UV | Ultraviolet |
| VIGS | Virus-induced gene silencing |
References
- Jacobowitz, J.R.; Weng, J.K. Exploring Uncharted Territories of Plant Specialized Metabolism in the Postgenomic Era. Annu. Rev. Plant Biol. 2020, 71, 631–658. [Google Scholar] [CrossRef]
- Salem, M.A.; Perez De Souza, L.; Serag, A.; Fernie, A.R.; Farag, M.A.; Ezzat, S.M.; Alseekh, S. Metabolomics in the Context of Plant Natural Products Research: From Sample Preparation to Metabolite Analysis. Metabolites 2020, 10, 37. [Google Scholar] [CrossRef]
- Dong, Y.; Li, B.; Malitsky, S.; Rogachev, I.; Aharoni, A.; Kaftan, F.; Svatoš, A.; Franceschi, P. Sample Preparation for Mass Spectrometry Imaging of Plant Tissues: A Review. Front. Plant Sci. 2016, 7. [Google Scholar] [CrossRef] [PubMed]
- Zhu, X.; Xu, T.; Peng, C.; Wu, S. Advances in MALDI Mass Spectrometry Imaging Single Cell and Tissues. Front. Chem. 2022, 9, 782432. [Google Scholar] [CrossRef] [PubMed]
- Yoon, S.; Lee, T.G. Biological tissue sample preparation for time-of-flight secondary ion mass spectrometry (ToF–SIMS) imaging. Nano Convergence 2018, 5, 24. [Google Scholar] [CrossRef]
- Cornett, D.S.; Frappier, S.L.; Caprioli, R.M. MALDI-FTICR Imaging Mass Spectrometry of Drugs and Metabolites in Tissue. Anal. Chem. 2008, 80, 5648–5653. [Google Scholar] [CrossRef] [PubMed]
- Mullen, A.K.; Clench, M.R.; Crosland, S.; Sharples, K.R. Determination of agrochemical compounds in soya plants by imaging matrix-assisted laser desorption/ionisation mass spectrometry. Rapid Comm Mass Spectrometry 2005, 19, 2507–2516. [Google Scholar] [CrossRef] [PubMed]
- Cha, S.; Yeung, E.S. Colloidal Graphite-Assisted Laser Desorption/Ionization Mass Spectrometry and MS ⌃\textrmn of Small Molecules. 1. Imaging of Cerebrosides Directly from Rat Brain Tissue. Analytical Chemistry 2007, 79, 2373–2385. [Google Scholar] [CrossRef] [PubMed]
- Cha, S.; Zhang, H.; Ilarslan, H.I.; Wurtele, E.S.; Brachova, L.; Nikolau, B.J.; Yeung, E.S. Direct profiling and imaging of plant metabolites in intact tissues by using colloidal graphite-assisted laser desorption ionization mass spectrometry. The Plant Journal 2008, 55, 348–360. [Google Scholar] [CrossRef]
- Hölscher, D.; Shroff, R.; Knop, K.; Gottschaldt, M.; Crecelius, A.; Schneider, B.; Heckel, D.G.; Schubert, U.S.; Svatoš, A. Matrix-free UV-laser desorption/ionization (LDI) mass spectrometric imaging at the single-cell level: distribution of secondary metabolites of Arabidopsis thaliana and Hypericum species. The Plant Journal 2009, 60, 907–918. [Google Scholar] [CrossRef]
- Harada, T.; Yuba-Kubo, A.; Sugiura, Y.; Zaima, N.; Hayasaka, T.; Goto-Inoue, N.; Wakui, M.; Suematsu, M.; Takeshita, K.; Ogawa, K.; Yoshida, Y.; Setou, M. Visualization of Volatile Substances in Different Organelles with an Atmospheric-Pressure Mass Microscope. Anal. Chem. 2009, 81, 9153–9157. [Google Scholar] [CrossRef] [PubMed]
- Li, C.; Wang, Z.; Jones, A.D. Chemical imaging of trichome specialized metabolites using contact printing and laser desorption/ionization mass spectrometry. Anal Bioanal Chem 2014, 406, 171–182. [Google Scholar] [CrossRef] [PubMed]
- Soltwisch, J.; Kettling, H.; Vens-Cappell, S.; Wiegelmann, M.; Müthing, J.; Dreisewerd, K. Mass spectrometry imaging with laser-induced postionization. Science 2015, 348, 211–215. [Google Scholar] [CrossRef] [PubMed]
- Laiko, V.V.; Baldwin, M.A.; Burlingame, A.L. Atmospheric Pressure Matrix-Assisted Laser Desorption/ Ionization Mass Spectrometry. Anal. Chem. 2000, 72, 652–657. [Google Scholar] [CrossRef] [PubMed]
- Li, Y.; Shrestha, B.; Vertes, A. Atmospheric Pressure Molecular Imaging by Infrared MALDI Mass Spectrometry. Anal. Chem. 2007, 79, 523–532. [Google Scholar] [CrossRef]
- Koestler, M.; Kirsch, D.; Hester, A.; Leisner, A.; Guenther, S.; Spengler, B. A high-resolution scanning microprobe matrix-assisted laser desorption/ionization ion source for imaging analysis on an ion trap/Fourier transform ion cyclotron resonance mass spectrometer. Rapid Comm Mass Spectrometry 2008, 22, 3275–3285. [Google Scholar] [CrossRef]
- Li, B.; Bhandari, D.R.; Janfelt, C.; Römpp, A.; Spengler, B. Natural products in Glycyrrhiza glabra (licorice) rhizome imaged at the cellular level by atmospheric pressure matrix-assisted laser desorption/ionization tandem mass spectrometry imaging. The Plant Journal 2014, 80, 161–171. [Google Scholar] [CrossRef]
- Martínez-Jarquín, S.; Winkler, R. Low-temperature plasma (LTP) jets for mass spectrometry (MS): Ion processes, instrumental set-ups, and application examples. TrAC Trends in Analytical Chemistry 2017, 89, 133–145. [Google Scholar] [CrossRef]
- Takáts, Z.; Wiseman, J.M.; Gologan, B.; Cooks, R.G. Mass Spectrometry Sampling Under Ambient Conditions with Desorption Electrospray Ionization. Science 2004, 306, 471–473. [Google Scholar] [CrossRef] [PubMed]
- Ifa, D.R.; Wiseman, J.M.; Song, Q.; Cooks, R.G. Development of capabilities for imaging mass spectrometry under ambient conditions with desorption electrospray ionization (DESI). International Journal of Mass Spectrometry 2007, 259, 8–15. [Google Scholar] [CrossRef]
- Perez, C.J.; Bagga, A.K.; Prova, S.S.; Yousefi Taemeh, M.; Ifa, D.R. Review and perspectives on the applications of mass spectrometry imaging under ambient conditions. Rapid Comm Mass Spectrometry 2019, 33, 27–53. [Google Scholar] [CrossRef] [PubMed]
- Lane, A.L.; Nyadong, L.; Galhena, A.S.; Shearer, T.L.; Stout, E.P.; Parry, R.M.; Kwasnik, M.; Wang, M.D.; Hay, M.E.; Fernandez, F.M.; Kubanek, J. Desorption electrospray ionization mass spectrometry reveals surface-mediated antifungal chemical defense of a tropical seaweed. Proc. Natl. Acad. Sci. U.S.A. 2009, 106, 7314–7319. [Google Scholar] [CrossRef] [PubMed]
- Thunig, J.; Hansen, S.H.; Janfelt, C. Analysis of Secondary Plant Metabolites by Indirect Desorption Electrospray Ionization Imaging Mass Spectrometry. Anal. Chem. 2011, 83, 3256–3259. [Google Scholar] [CrossRef] [PubMed]
- Müller, T.; Oradu, S.; Ifa, D.R.; Cooks, R.G.; Kräutler, B. Direct Plant Tissue Analysis and Imprint Imaging by Desorption Electrospray Ionization Mass Spectrometry. Anal. Chem. 2011, 83, 5754–5761. [Google Scholar] [CrossRef] [PubMed]
- Cody, R.B.; Laramée, J.A.; Durst, H.D. Versatile new ion source for the analysis of materials in open air under ambient conditions. Anal. Chem. 2005, 77, 2297–2302. [Google Scholar] [CrossRef] [PubMed]
- Harper, J.D.; Charipar, N.A.; Mulligan, C.C.; Zhang, X.; Cooks, R.G.; Ouyang, Z. Low-Temperature Plasma Probe for Ambient Desorption Ionization. Anal. Chem. 2008, 80, 9097–9104. [Google Scholar] [CrossRef] [PubMed]
- Martinez-Jarquin, S.; Winkler, R. Design of a low-temperature plasma (LTP) probe with adjustable output temperature and variable beam diameter for the direct detection of organic molecules. Rapid Communications in Mass Spectrometry 2013, 27, 629–634. [Google Scholar] [CrossRef] [PubMed]
- Maldonado-Torres, M.; López-Hernández, J.F.; Jiménez-Sandoval, P.; Winkler, R. ’Plug and Play’ assembly of a low-temperature plasma ionization mass spectrometry imaging (LTP-MSI) system. Journal of proteomics 2014, 102C, 60–65. [Google Scholar] [CrossRef]
- Martínez-Jarquín, S.; Moreno-Pedraza, A.; Guillén-Alonso, H.; Winkler, R. Template for 3D Printing a Low-Temperature Plasma Probe. Anal. Chem. 2016, 88, 6976–6980. [Google Scholar] [CrossRef]
- Martínez-Jarquín, S.; Herrera-Ubaldo, H.; de Folter, S.; Winkler, R. In vivo monitoring of nicotine biosynthesis in tobacco leaves by low-temperature plasma mass spectrometry. Talanta 2018, 185, 324–327. [Google Scholar] [CrossRef]
- Feider, C.L.; Krieger, A.; DeHoog, R.J.; Eberlin, L.S. Ambient Ionization Mass Spectrometry: Recent Developments and Applications. Anal. Chem. 2019, 91, 4266–4290. [Google Scholar] [CrossRef]
- Nemes, P.; Vertes, A. Laser Ablation Electrospray Ionization for Atmospheric Pressure, in Vivo, and Imaging Mass Spectrometry. Anal. Chem. 2007, 79, 8098–8106. [Google Scholar] [CrossRef]
- Nemes, P.; Barton, A.A.; Li, Y.; Vertes, A. Ambient Molecular Imaging and Depth Profiling of Live Tissue by Infrared Laser Ablation Electrospray Ionization Mass Spectrometry. Anal. Chem. 2008, 80, 4575–4582. [Google Scholar] [CrossRef]
- Sampson, J.S.; Hawkridge, A.M.; Muddiman, D.C. Generation and detection of multiply-charged peptides and proteins by matrix-assisted laser desorption electrospray ionization (MALDESI) fourier transform ion cyclotron resonance mass spectrometry. J. Am. Soc. Mass Spectrom. 2006, 17, 1712–1716. [Google Scholar] [CrossRef]
- Bokhart, M.T.; Muddiman, D.C. Infrared matrix-assisted laser desorption electrospray ionization mass spectrometry imaging analysis of biospecimens. Analyst 2016, 141, 5236–5245. [Google Scholar] [CrossRef]
- Bagley, M.C.; Pace, C.L.; Ekelöf, M.; Muddiman, D.C. Infrared matrix-assisted laser desorption electrospray ionization (IR-MALDESI) mass spectrometry imaging analysis of endogenous metabolites in cherry tomatoes. Analyst 2020, 145, 5516–5523. [Google Scholar] [CrossRef]
- Bokhart, M.T.; Nazari, M.; Garrard, K.P.; Muddiman, D.C. MSiReader v1.0: Evolving Open-Source Mass Spectrometry Imaging Software for Targeted and Untargeted Analyses. J. Am. Soc. Mass Spectrom. 2018, 29, 8–16. [Google Scholar] [CrossRef]
- Vaikkinen, A.; Shrestha, B.; Koivisto, J.; Kostiainen, R.; Vertes, A.; Kauppila, T.J. Laser ablation atmospheric pressure photoionization mass spectrometry imaging of phytochemicals from sage leaves. Rapid Communications in Mass Spectrometry 2014, 28, 2490–2496. [Google Scholar] [CrossRef]
- Shelley, J.T.; Ray, S.J.; Hieftje, G.M. Laser Ablation Coupled to a Flowing Atmospheric Pressure Afterglow for Ambient Mass Spectral Imaging. Anal. Chem. 2008, 80, 8308–8313. [Google Scholar] [CrossRef]
- Feng, B.; Zhang, J.; Chang, C.; Li, L.; Li, M.; Xiong, X.; Guo, C.; Tang, F.; Bai, Y.; Liu, H. Ambient Mass Spectrometry Imaging: Plasma Assisted Laser Desorption Ionization Mass Spectrometry Imaging and Its Applications. Anal. Chem. 2014, 86, 4164–4169. [Google Scholar] [CrossRef] [PubMed]
- Fowble, K.L.; Teramoto, K.; Cody, R.B.; Edwards, D.; Guarrera, D.; Musah, R.A. Development of “Laser Ablation Direct Analysis in Real Time Imaging” Mass Spectrometry: Application to Spatial Distribution Mapping of Metabolites Along the Biosynthetic Cascade Leading to Synthesis of Atropine and Scopolamine in Plant Tissue. Anal. Chem. 2017, 89, 3421–3429. [Google Scholar] [CrossRef] [PubMed]
- Moreno-Pedraza, A.; Rosas-Román, I.; Garcia-Rojas, N.S.; Guillén-Alonso, H.; Ovando-Vázquez, C.; Díaz-Ramírez, D.; Cuevas-Contreras, J.; Vergara, F.; Marsch-Martínez, N.; Molina-Torres, J.; Winkler, R. Elucidating the Distribution of Plant Metabolites from Native Tissues with Laser Desorption Low-Temperature Plasma Mass Spectrometry Imaging. Anal. Chem. 2019, 91, 2734–2743. [Google Scholar] [CrossRef]
- You, X.; Lu, Q.; Guan, X.; Xu, Z.; Zenobi, R. Pesticide uptake and translocation in plants monitored in situ via laser ablation dielectric barrier discharge ionization mass spectrometry imaging. Sensors and Actuators B: Chemical 2024, 409, 135532. [Google Scholar] [CrossRef]
- Sumner, L.W.; Amberg, A.; Barrett, D.; Beale, M.H.; Beger, R.; Daykin, C.A.; Fan, T.W.M.; Fiehn, O.; Goodacre, R.; Griffin, J.L.; Hankemeier, T.; Hardy, N.; Harnly, J.; Higashi, R.; Kopka, J.; Lane, A.N.; Lindon, J.C.; Marriott, P.; Nicholls, A.W.; Reily, M.D.; Thaden, J.J.; Viant, M.R. Proposed minimum reporting standards for chemical analysis Chemical Analysis Working Group (CAWG) Metabolomics Standards Initiative (MSI). Metabolomics 2007, 3, 211–221. [Google Scholar] [CrossRef]
- Wishart, D.S.; Godzien, J.; Gil-de-la Fuente, A.; Mandal, R.; Rajabzadeh, R.; Pirimoghadam, H.; Ladner-Keay, C.; Otero, A.; Barbas, C. CHAPTER 3:Metabolomics. In Processing Metabolomics and Proteomics Data with Open Software; Royal Society of Chemistry, 2020; pp. 41–95. [CrossRef]
- Schymanski, E.L.; Jeon, J.; Gulde, R.; Fenner, K.; Ruff, M.; Singer, H.P.; Hollender, J. Identifying Small Molecules via High Resolution Mass Spectrometry: Communicating Confidence. Environ. Sci. Technol. 2014, 48, 2097–2098, Publisher: American Chemical Society. [Google Scholar] [CrossRef]
- Schrimpe-Rutledge, A.C.; Codreanu, S.G.; Sherrod, S.D.; McLean, J.A. Untargeted Metabolomics Strategies—Challenges and Emerging Directions. J. Am. Soc. Mass Spectrom. 2016, 27, 1897–1905. [Google Scholar] [CrossRef]
- Baquer, G.; Sementé, L.; Mahamdi, T.; Correig, X.; Ràfols, P.; García-Altares, M. What are we imaging? Software tools and experimental strategies for annotation and identification of small molecules in mass spectrometry imaging. Mass Spectrometry Reviews 2023, 42, 1927–1964. [Google Scholar] [CrossRef] [PubMed]
- Bjarnholt, N.; Li, B.; D’Alvise, J.; Janfelt, C. Mass spectrometry imaging of plant metabolites – principles and possibilities. Nat. Prod. Rep. 2014, 31, 818–837. [Google Scholar] [CrossRef]
- Korte, A.R.; Yandeau-Nelson, M.D.; Nikolau, B.J.; Lee, Y.J. Subcellular-level resolution MALDI-MS imaging of maize leaf metabolites by MALDI-linear ion trap-Orbitrap mass spectrometer. Anal Bioanal Chem 2015, 407, 2301–2309. [Google Scholar] [CrossRef]
- Tong, Q.; Zhang, C.; Tu, Y.; Chen, J.; Li, Q.; Zeng, Z.; Wang, F.; Sun, L.; Huang, D.; Li, M.; Qiu, S.; Chen, W. Biosynthesis-based spatial metabolome of Salvia miltiorrhiza Bunge by combining metabolomics approaches with mass spectrometry-imaging. Talanta 2022, 238, 123045. [Google Scholar] [CrossRef]
- Gomez-Zepeda, D.; Frausto, M.; Nájera-González, H.; Herrera-Estrella, L.; Ordaz-Ortiz, J. Mass spectrometry-based quantification and spatial localization of small organic acid exudates in plant roots under phosphorus deficiency and aluminum toxicity. The Plant Journal 2021, 106, 1791–1806. [Google Scholar] [CrossRef] [PubMed]
- Bhandari, D.R.; Wang, Q.; Friedt, W.; Spengler, B.; Gottwald, S.; Römpp, A. High resolution mass spectrometry imaging of plant tissues: towards a plant metabolite atlas. Analyst 2015, 140, 7696–7709. [Google Scholar] [CrossRef] [PubMed]
- Arendowski, A.; Ruman, T. Laser Desorption/Ionisation Mass Spectrometry Imaging of European Yew ( <span style="font-variant:small-caps;"> Taxus baccata </span> ) on Gold Nanoparticle-enhanced Target. Phytochemical Analysis 2017, 28, 448–453. [Google Scholar] [CrossRef] [PubMed]
- Shiono, K.; Taira, S. Imaging of Multiple Plant Hormones in Roots of Rice ( Oryza sativa ) Using Nanoparticle-Assisted Laser Desorption/Ionization Mass Spectrometry. J. Agric. Food Chem. 2020, 68, 6770–6775. [Google Scholar] [CrossRef] [PubMed]
- Zemaitis, K.J.; Lin, V.S.; Ahkami, A.H.; Winkler, T.E.; Anderton, C.R.; Veličković, D. Expanded Coverage of Phytocompounds by Mass Spectrometry Imaging Using On-Tissue Chemical Derivatization by 4-APEBA. Anal. Chem. 2023, 95, 12701–12709. [Google Scholar] [CrossRef] [PubMed]
- Merdas, M.; Lagarrigue, M.; Vanbellingen, Q.; Umbdenstock, T.; Da Violante, G.; Pineau, C. On-tissue chemical derivatization reagents for matrix-assisted laser desorption/ionization mass spectrometry imaging. J Mass Spectrom 2021, 56, e4731. [Google Scholar] [CrossRef] [PubMed]
- Maia, M.; Figueiredo, A.; Cordeiro, C.; Sousa Silva, M. FT-ICR-MS-based metabolomics: A deep dive into plant metabolism. Mass Spectrometry Reviews 2023, 42, 1535–1556. [Google Scholar] [CrossRef] [PubMed]
- Jurić, I.; González-Pérez, V.; Hibberd, J.M.; Edwards, G.; Burroughs, N.J. Size matters for single-cell C4 photosynthesis in Bienertia. Journal of Experimental Botany 2017, 68, 255–267. [Google Scholar] [CrossRef]
- Winkler, R. An evolving computational platform for biological mass spectrometry: workflows, statistics and data mining with MASSyPup64. PeerJ 2015, 3, 1–34. [Google Scholar] [CrossRef]
- Rosas-Román, I.; Ovando-Vázquez, C.; Moreno-Pedraza, A.; Guillén-Alonso, H.; Winkler, R. Open LabBot and RmsiGUI: Community development kit for sampling automation and ambient imaging. Microchemical Journal 2020, 152, 104343. [Google Scholar] [CrossRef]
- Schramm, T.; Hester, Z.; Klinkert, I.; Both, J.P.; Heeren, R.M.; Brunelle, A.; Laprévote, O.; Desbenoit, N.; Robbe, M.F.; Stoeckli, M.; Spengler, B.; Römpp, A. imzML — A common data format for the flexible exchange and processing of mass spectrometry imaging data. Journal of Proteomics 2012, 75, 5106–5110. [Google Scholar] [CrossRef]
- Kessner, D.; Chambers, M.; Burke, R.; Agus, D.; Mallick, P. ProteoWizard: Open source software for rapid proteomics tools development. Bioinformatics 2008, 24, 2534–2536. [Google Scholar] [CrossRef] [PubMed]
- Bemis, K.D.; Harry, A.; Eberlin, L.S.; Ferreira, C.; van de Ven, S.M.; Mallick, P.; Stolowitz, M.; Vitek, O. Cardinal: an R package for statistical analysis of mass spectrometry-based imaging experiments. Bioinformatics 2015, 31, 2418–2420. [Google Scholar] [CrossRef] [PubMed]
- Gibb, S.; Franceschi, P. MALDIquantForeign: Import/Export Routines for ’MALDIquant’, 2019.
- Weiskirchen, R.; Weiskirchen, S.; Kim, P.; Winkler, R. Software solutions for evaluation and visualization of laser ablation inductively coupled plasma mass spectrometry imaging (LA-ICP-MSI) data: a short overview. Journal of Cheminformatics 2019, 11, 16. [Google Scholar] [CrossRef]
- Rosas-Román, I.; Winkler, R. Contrast optimization of mass spectrometry imaging (MSI) data visualization by threshold intensity quantization (TrIQ). PeerJ Comput. Sci. 2021, 7, e585. [Google Scholar] [CrossRef] [PubMed]
- Perez-Riverol, Y.; Bai, J.; Bandla, C.; García-Seisdedos, D.; Hewapathirana, S.; Kamatchinathan, S.; Kundu, D.; Prakash, A.; Frericks-Zipper, A.; Eisenacher, M.; Walzer, M.; Wang, S.; Brazma, A.; Vizcaíno, J. The PRIDE database resources in 2022: a hub for mass spectrometry-based proteomics evidences. Nucleic Acids Research 2022, 50, D543–D552. [Google Scholar] [CrossRef]
- Källback, P.; Nilsson, A.; Shariatgorji, M.; Andrén, P.E. msIQuant – Quantitation Software for Mass Spectrometry Imaging Enabling Fast Access, Visualization, and Analysis of Large Data Sets. Anal. Chem. 2016, 88, 4346–4353, Publisher: American Chemical Society. [Google Scholar] [CrossRef]
- Tortorella, S.; Tiberi, P.; Bowman, A.P.; Claes, B.S.R.; Ščupáková, K.; Heeren, R.M.A.; Ellis, S.R.; Cruciani, G. LipostarMSI: Comprehensive, Vendor-Neutral Software for Visualization, Data Analysis, and Automated Molecular Identification in Mass Spectrometry Imaging. J. Am. Soc. Mass Spectrom. 2020, 31, 155–163, Publisher: American Society for Mass Spectrometry. Published by the American Chemical Society. All rights reserved. [Google Scholar] [CrossRef] [PubMed]
- Wadie, B.; Stuart, L.; Rath, C.M.; Drotleff, B.; Mamedov, S.; Alexandrov, T. METASPACE-ML: Metabolite annotation for imaging mass spectrometry using machine learning, 2023. [CrossRef]
- Bemis, K.A.; Föll, M.C.; Guo, D.; Lakkimsetty, S.S.; Vitek, O. Cardinal v.3: a versatile open-source software for mass spectrometry imaging analysis. Nat Methods 2023, 20, 1883–1886, Publisher: Nature Publishing Group. [Google Scholar] [CrossRef]
- Baquer, G.; Sementé, L.; Ràfols, P.; Martín-Saiz, L.; Bookmeyer, C.; Fernández, J.A.; Correig, X.; García-Altares, M. rMSIfragment: improving MALDI-MSI lipidomics through automated in-source fragment annotation. J Cheminform 2023, 15, 80. [Google Scholar] [CrossRef]
- Rosas-Román, I.; Guillén-Alonso, H.; Moreno-Pedraza, A.; Winkler, R. Technical Note: mzML and imzML Libraries for Processing Mass Spectrometry Data with the High-Performance Programming Language Julia. Anal. Chem. 2024, 96, 3999–4004. [Google Scholar] [CrossRef] [PubMed]
- Winkler, R. SpiderMass: semantic database creation and tripartite metabolite identification strategy. Journal of Mass Spectrometry 2015, 50, 538–541. [Google Scholar] [CrossRef] [PubMed]
- Dong, Y.; Sonawane, P.; Cohen, H.; Polturak, G.; Feldberg, L.; Avivi, S.H.; Rogachev, I.; Aharoni, A. High mass resolution, spatial metabolite mapping enhances the current plant gene and pathway discovery toolbox. New Phytologist 2020, 228, 1986–2002. [Google Scholar] [CrossRef] [PubMed]
- Etalo, D.W.; De Vos, R.C.; Joosten, M.H.; Hall, R.D. Spatially Resolved Plant Metabolomics: Some Potentials and Limitations of Laser-Ablation Electrospray Ionization Mass Spectrometry Metabolite Imaging. Plant Physiology 2015, 169, 1424–1435. [Google Scholar] [CrossRef] [PubMed]
- Becker, L.; Bellow, S.; Carré, V.; Latouche, G.; Poutaraud, A.; Merdinoglu, D.; Brown, S.C.; Cerovic, Z.G.; Chaimbault, P. Correlative Analysis of Fluorescent Phytoalexins by Mass Spectrometry Imaging and Fluorescence Microscopy in Grapevine Leaves. Anal. Chem. 2017, 89, 7099–7106. [Google Scholar] [CrossRef] [PubMed]
- Huang, L.; Nie, L.; Dong, J.; Yao, L.; Kang, S.; Dai, Z.; Wei, F.; Ma, S. Differential distribution of phytochemicals in Scutellariae Radix and Scutellariae Amoenae Radix using microscopic mass spectrometry imaging. Arabian Journal of Chemistry 2023, 16, 104590. [Google Scholar] [CrossRef]
- Teles, V.D.L.G.; Sousa, G.V.; Vendramini, P.H.; Augusti, R.; Costa, L.M. Identification of Metabolites in Basil Leaves by Desorption Electrospray Ionization Mass Spectrometry Imaging after Cd Contamination. ACS Agric. Sci. Technol. 2021, 1, 21–28. [Google Scholar] [CrossRef]
- Shroff, R.; Schramm, K.; Jeschke, V.; Nemes, P.; Vertes, A.; Gershenzon, J.; Svatoš, A. Quantification of plant surface metabolites by matrix-assisted laser desorption–ionization mass spectrometry imaging: glucosinolates on <span style="font-variant:small-caps;">A</span> rabidopsis thaliana leaves. The Plant Journal 2015, 81, 961–972. [Google Scholar] [CrossRef]
- Zhang, H.; Cha, S.; Yeung, E.S. Colloidal Graphite-Assisted Laser Desorption/Ionization MS and MS n of Small Molecules. 2. Direct Profiling and MS Imaging of Small Metabolites from Fruits. Anal. Chem. 2007, 79, 6575–6584. [Google Scholar] [CrossRef]
- Nie, L.X.; Huang, L.Y.; Wang, X.P.; Lv, L.F.; Yang, X.X.; Jia, X.F.; Kang, S.; Yao, L.W.; Dai, Z.; Ma, S.C. Desorption Electrospray Ionization Mass Spectrometry Imaging Illustrates the Quality Characters of Isatidis Radix. Front. Plant Sci. 2022, 13, 897528. [Google Scholar] [CrossRef]
- Lee, Y.J.; Perdian, D.C.; Song, Z.; Yeung, E.S.; Nikolau, B.J. Use of mass spectrometry for imaging metabolites in plants. The Plant Journal 2012, 70, 81–95. [Google Scholar] [CrossRef]
- Asakura, H.; Taira, S.; Funaki, J.; Yamakawa, T.; Abe, K.; Asakura, T. Mass Spectrometry Imaging Analysis of Metabolic Changes in Green and Red Tomato Fruits Exposed to Drought Stress. Applied Sciences 2021, 12, 216. [Google Scholar] [CrossRef]
- Seaman, C.; Flinders, B.; Eijkel, G.; Heeren, R.M.A.; Bricklebank, N.; Clench, M.R. “Afterlife Experiment”: Use of MALDI-MS and SIMS Imaging for the Study of the Nitrogen Cycle within Plants. Anal. Chem. 2014, 86, 10071–10077. [Google Scholar] [CrossRef] [PubMed]
- Alexander, L.E.; Gilbertson, J.S.; Xie, B.; Song, Z.; Nikolau, B.J. High spatial resolution imaging of the dynamics of cuticular lipid deposition during Arabidopsis flower development. Plant Direct 2021, 5, e00322. [Google Scholar] [CrossRef] [PubMed]
- Heskes, A.M.; Sundram, T.C.; Boughton, B.A.; Jensen, N.B.; Hansen, N.L.; Crocoll, C.; Cozzi, F.; Rasmussen, S.; Hamberger, B.; Hamberger, B.; Staerk, D.; Møller, B.L.; Pateraki, I. Biosynthesis of bioactive diterpenoids in the medicinal plant Vitex agnus-castus. The Plant Journal 2018, 93, 943–958. [Google Scholar] [CrossRef] [PubMed]
- Sturtevant, D.; Lu, S.; Zhou, Z.W.; Shen, Y.; Wang, S.; Song, J.M.; Zhong, J.; Burks, D.J.; Yang, Z.Q.; Yang, Q.Y.; Cannon, A.E.; Herrfurth, C.; Feussner, I.; Borisjuk, L.; Munz, E.; Verbeck, G.F.; Wang, X.; Azad, R.K.; Singleton, B.; Dyer, J.M.; Chen, L.L.; Chapman, K.D.; Guo, L. The genome of jojoba ( Simmondsia chinensis ): A taxonomically isolated species that directs wax ester accumulation in its seeds. Sci. Adv. 2020, 6, eaay3240. [Google Scholar] [CrossRef] [PubMed]
- Dos Santos, N.A.; De Almeida, C.M.; Gonçalves, F.F.; Ortiz, R.S.; Kuster, R.M.; Saquetto, D.; Romão, W. Analysis of Erythroxylum coca Leaves by Imaging Mass Spectrometry (MALDI–FT–ICR IMS). Journal of the American Society for Mass Spectrometry 2021, 32, 946–955. [Google Scholar] [CrossRef] [PubMed]
- De Moraes Pontes, J.G.; Vendramini, P.H.; Fernandes, L.S.; De Souza, F.H.; Pilau, E.J.; Eberlin, M.N.; Magnani, R.F.; Wulff, N.A.; Fill, T.P. Mass spectrometry imaging as a potential technique for diagnostic of Huanglongbing disease using fast and simple sample preparation. Sci Rep 2020, 10, 13457. [Google Scholar] [CrossRef] [PubMed]
- Woodfield, H.K.; Sturtevant, D.; Borisjuk, L.; Munz, E.; Guschina, I.A.; Chapman, K.; Harwood, J.L. Spatial and Temporal Mapping of Key Lipid Species in Brassica napus Seeds. Plant Physiol. 2017, 173, 1998–2009. [Google Scholar] [CrossRef]
- Hughes, J.; McCully, M.E. The Use of an Optical Brightener in the Study of Plant Structure. Stain Technology 1975, 50, 319–329, Publisher: Taylor & Francis_eprint. [Google Scholar] [CrossRef]
- Zhao, Y.; Man, Y.; Wen, J.; Guo, Y.; Lin, J. Advances in Imaging Plant Cell Walls. Trends in Plant Science 2019, 24, 867–878. [Google Scholar] [CrossRef] [PubMed]
- Analytical Methods, C.A.N. A ‘Periodic Table’ of mass spectrometry instrumentation and acronyms. Anal. Methods 2017, 9, 5086–5090. [Google Scholar] [CrossRef]
Figure 1.
Levels of confidence for the identification of compounds in mass spectrometry imaging.
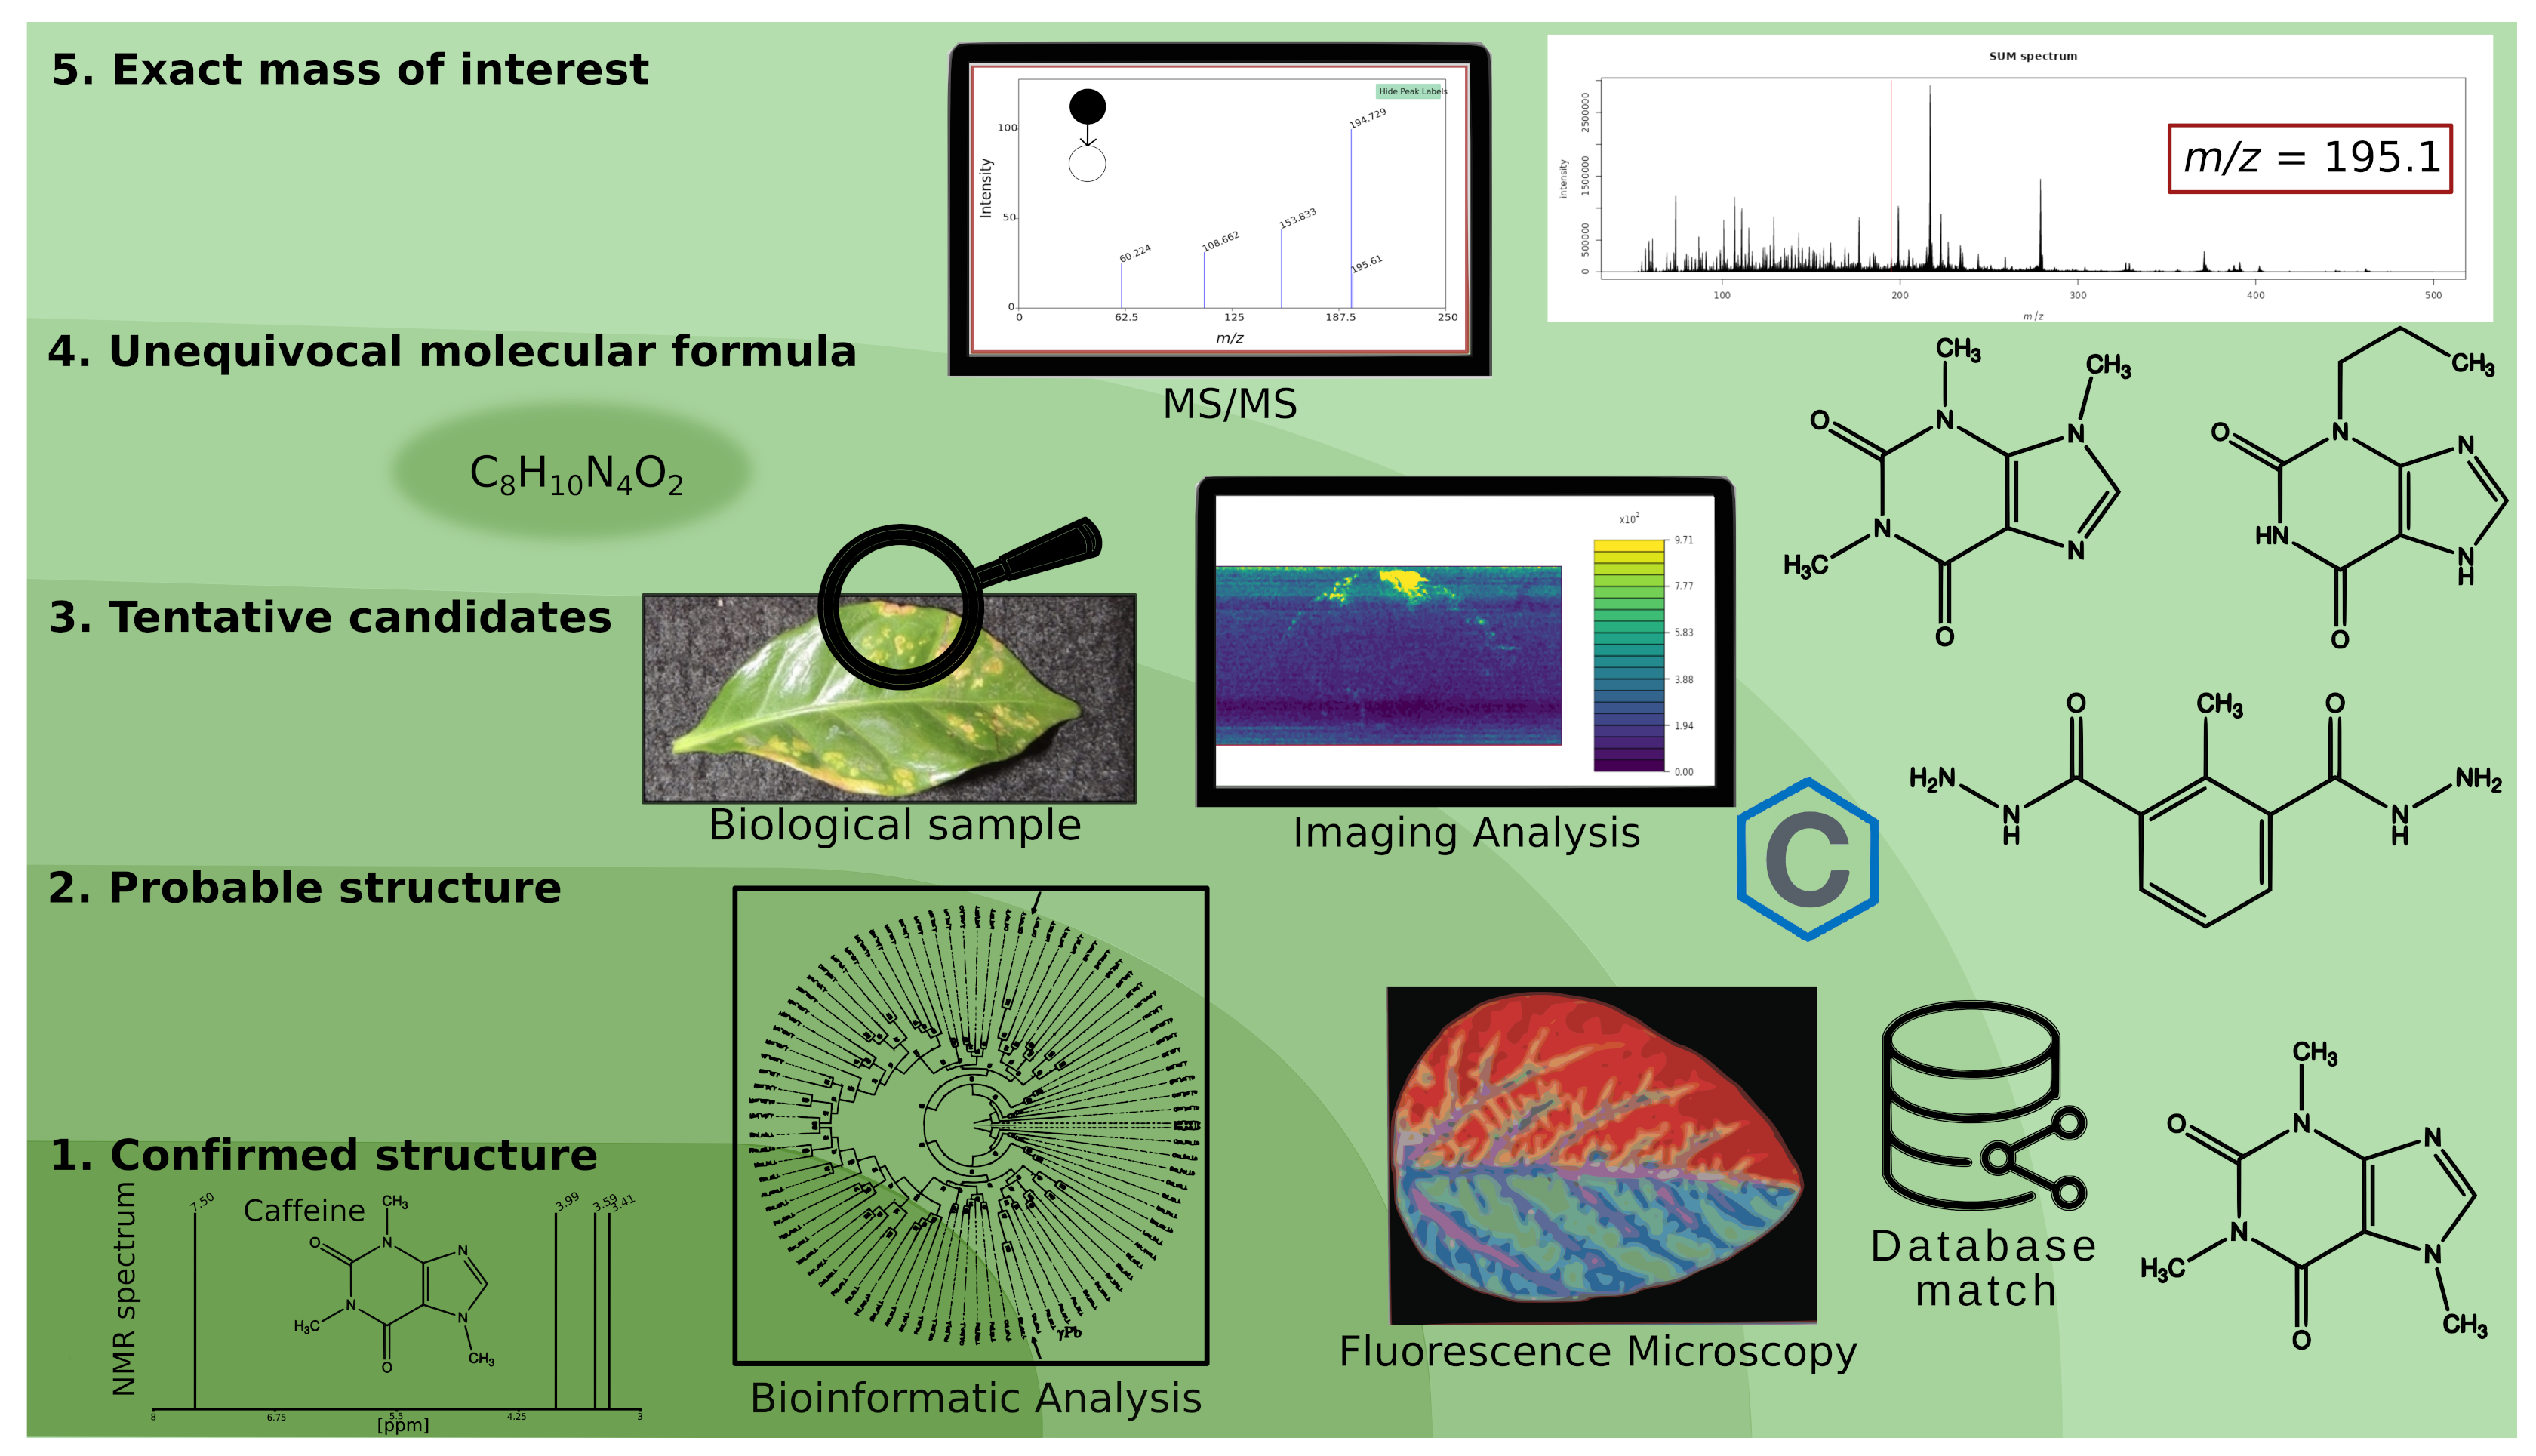
Figure 2.
Experimental steps of mass spectrometry imaging (MSI).
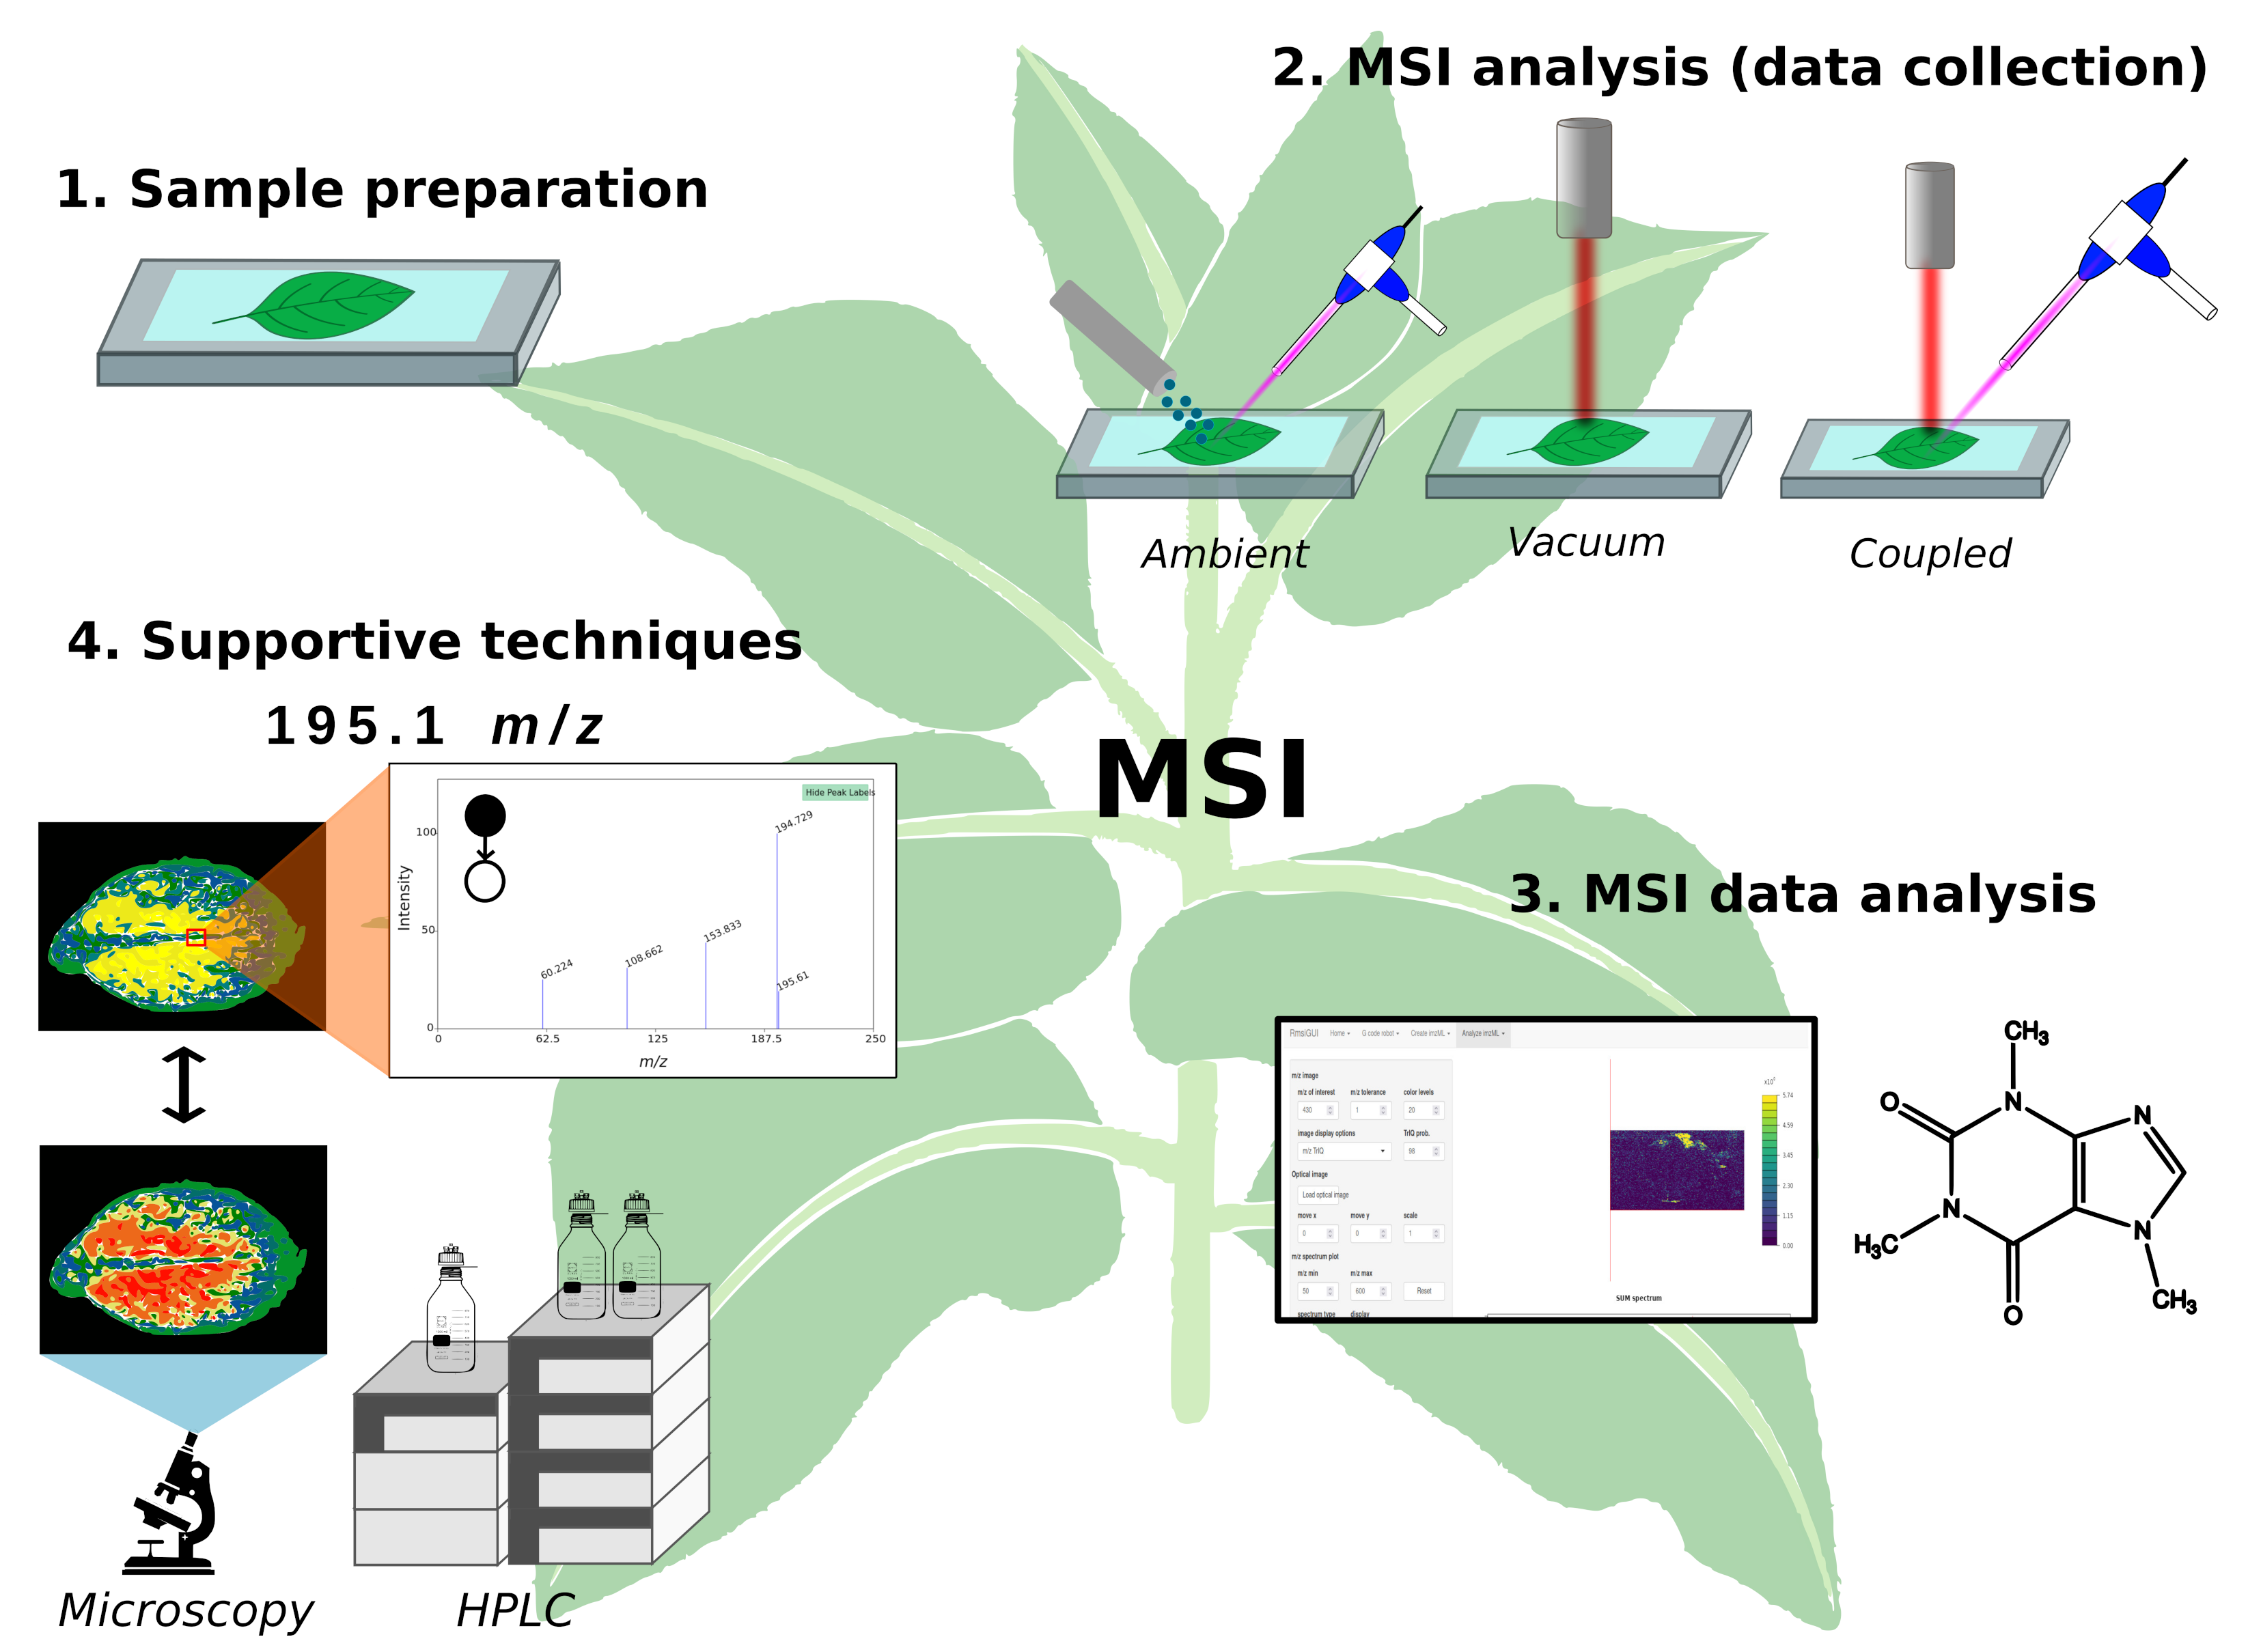
Table 1.
Identification levels for mass spectrometry imaging (MSI) with examples of applicable methods.
Table 1.
Identification levels for mass spectrometry imaging (MSI) with examples of applicable methods.
| ID Level | Requirement | Mass Spectrometry Imaging |
|---|---|---|
| 1 – Confirmed structure | Unambiguous (3D) structure from at least two independent and orthogonal methods, which refer to methods that provide different types of information and are not affected by the same sources of error and comparison to an authentic reference sample. | Recovery of material from regions-of-interest (ROI), which are specific areas selected for detailed analysis; structural studies with orthogonal methods (e.g., NMR and HR-MSn); isotopic label studies, which involve the use of isotopes to trace the path of a molecule through a reaction or a metabolic pathway. |
| 2 – Probable structure (single candidate) | Like Level 3, but with only one candidate left. | Filtering results with expert knowledge and bioinformatic analyses (e.g., theoretically possible metabolites from genome analyses and chemoinformatics). |
| 3 – Tentative structure (multiple candidates) | HR-MS(n) data match with databases and are congruent with additional experiments and the biological context. Still, more than one compound can be explained with the available data. | High-resolution m/z data, direct fragmentation from tissues, in-source decay spectra, and isotope distribution data. Matching with databases and comparison with theoretical spectra. Multimodal imaging (e.g., fluorescence and infrared spectroscopy microscopy; immunolocalization); complementary studies with excisions from regions-of-interest (ROIs) or complete extractions, using GC-MS and LC-MS; chemical staining for functional groups. |
| 4 – Molecular formula | HR-MS(n) and isotopic distribution data of m/z features that support the elemental composition of compounds | Calculation of theoretical mass spectra and comparison with experimental data; database matches. |
| 5 – Exact mass of interest | m/z features are not identified, but unique. | Quantitation and statistical evaluation of m/z bins according to their signal intensity. |
Disclaimer/Publisher’s Note: The statements, opinions and data contained in all publications are solely those of the individual author(s) and contributor(s) and not of MDPI and/or the editor(s). MDPI and/or the editor(s) disclaim responsibility for any injury to people or property resulting from any ideas, methods, instructions or products referred to in the content. |
© 2024 by the authors. Licensee MDPI, Basel, Switzerland. This article is an open access article distributed under the terms and conditions of the Creative Commons Attribution (CC BY) license (http://creativecommons.org/licenses/by/4.0/).
Copyright: This open access article is published under a Creative Commons CC BY 4.0 license, which permit the free download, distribution, and reuse, provided that the author and preprint are cited in any reuse.


