
Submitted:
20 June 2024
Posted:
20 June 2024
You are already at the latest version
Abstract
This study investigated the effect of replacing part of the dietary soybean meal with either polymer-coated urea or gelatinized starch urea on the performance, nutrient digestibility, blood biochemical indexes, ruminal fermentation and rumen microflora of Angus heifers. The urea release profiles of two kinds of slow-release urea were evaluated in vitro and indicated a superior nitrogen retention with the polymer-coated urea. 210 purebred Angus cattle (BW = 314.26 kg) were divided into three groups: no urea group (CON), polymer-coated urea group (PCU), gelatinized starch urea group (GSU), 20g/kg polymer-coated urea or 25g/kg gelatinized starch urea was used to replace part of soybean meal in the concentrate feed respectively according to the principle of iso-metabolic energy and iso-nitrogenous. During the whole experiment, the ADG of PCU group was higher than both the GSU group and the CON group. The feed-weight ratio of the PCU group was significantly lower than both the GSU group and the CON group during the 90-day feeding period. The ADF apparent digestibility in the PCU group was significantly higher than that of the CON group, and extremely significantly higher than that of the GSU group. On the 86th day, the ALB content in the PCU group was significantly higher than that in the CON group. The contents of acetic acid and butyric acid, total volatile fatty acid and propionic acid were significantly higher in the PCU group than in the CON group. Bacterial diversity analysis found that the abundance of Firmicutes was higher in the PCU group than that in the GSU group and the CON group at the phylum level, and inverse result was observed in Bacteroidetes. The abundance of Paraprevotella was higher in the PCU group, whereas higher abundance of Prevotella was found in the GSU group at the genus level. These results indicate that both polymer-coated urea and gelatinized starch urea can replace part of soybean meal in the diet, and the amount of substitution in this trial had no diverse effect on the performance of Angus heifers, and the effect and economic benefits brought by polymer-coated urea were better than gelatinized starch urea.
Keywords:
slow-release urea
; heifers
; production performance
; rumen fermentation
; rumen microflora
1. Introduction
With the rapid development of ruminant animal breeding industry, animal production in China is facing serious challenges including resource constraints, environmental requirements for sustainable development and growing demand for animal protein. Dietary protein plays an important role in ruminant nutrition, providing amino acids and nitrogen sources for rumen microbial protein production. However, it usually comes from expensive feed, such as soybean meal [1]. In China, the shortage of protein feed resources has become a neck problem in our breeding industry, which has seriously restricted the healthy progress of ruminant breeding in China. Therefore, the development and utilization of protein feed substitutes, including non-protein nitrogen, to reduce the utilization of soybean meal is one of the most important and difficult topics at present [2].
Urea is a nitrogenous substance excreted by mammals, and the urea cycle in ruminants is unique to their nutritional metabolism. Due to its low cost, good availability, easy handling and application, it is an important protein supplement source for ruminants [1]. Urea is rapidly hydrolyzed into ammonia by urease secreted by bacteria after entering the rumen, and then synthesized into microbial protein to make use of the organism. However, the rate of hydrolysis of urea in the rumen is much faster than the rate of ammonia utilization by rumen microorganisms, thus causing the accumulation of ammonia in the rumen or polluting the environment by excreting with urine, resulting in the waste of nitrogen source [3]. Therefore, synchronizing N supply with microbial requirements in the rumen is an essential nutritional strategy to improve rumen energy and N utilization. Slow-release urea is an efficient non-protein nitrogen [4]. The main slow-release urea products used in ruminant are polymer-coated urea and gelatinized starch urea, both of which have different slow-release protocols and large price differences. Both of them in fattening cattle have shown to improve animal performance without affecting rumen fermentation, but their effects on rumen microorganisms are rarely reported. Therefore, the purpose of this experiment was to study polymer-coated urea and gelatinized starch urea in the production of Angus heifers in relation to production performance, nutrient digestibility, blood biochemical indexes, rumen fermentation indexes and rumen microbial flora.
2. Materials and Methods
2.1. Animals, Diets and Treatments
210 pure-bred Angus cows (average weight 314.26 kg, average month age 12.96) were randomly divided into three groups: the control group was fed the basal diet without urea (CON); the polymer-coated urea group with 20 g/kg polymer-coated urea instead of partial soybean meal in concentrate diet (PCU); and the gelatinized starch urea group which used 25 g/kg gelatinized starch urea to partially replace soybean meal in the concentrate (GSU). Notably, the polymer-coated urea used in this experiment was provided by Alltech, namely SRU (Optigen®). It is composed of urea evenly coated with a semi-permeable vegetable fat matrix containing 880 g/kg urea (410 g/kg N, 2560 g/kg crude protein (CP) and 110g-120 g/kg fat (Salami et al, 2020). Gelatinized starch urea was purchased from Hebei Xingmu Agricultural Products Technology Co., Ltd., raw materials are composed of urea and sodium chloride, carrier is corn and bentonite, about 0.3. The measured content of CP was 2032 g/kg. The polymer-coated urea and the gelatinized starch urea were added in meal form to the complete feed and thoroughly mixed. Diets contained no antibiotics or other growth promoters. The basal diet was prepared according to the beef cattle nutrition NRC (2016) [5]. The experimental diets were formulated to be of equal energy and nitrogen. The dietary composition and nutritional level of specific total mixed ration (TMR) are shown in Table 1, and the composition and nutritional level of concentrate supplements are shown in Table 2.
The experimental cattle were fed separately by group, and the experimental diets were all fed in the form of TMR, twice a day at 9:00 and 16:00. Cattle were allowed ad libitum access to both the mash feed and straw from February 13 to May 19, 2020 at the second breeding farm of Zhonghe Heng Rui (Guizhou) Co., Ltd. Within each barn cattle had free access to a water tank, that was cleaned once every two days, to ensure clean water quality. A loader was used to clean up cattle manure twice a week and the barn is disinfected with a spray every afternoon. Cattle were individually fed the basal diet for 1 wk prior to being switched to the assigned treatments for the 12 wk experimental period.

Table 1.
Ingredient and chemical composition of total mixed rations (as-fed basis).
| Item | Diet | ||
|---|---|---|---|
| CON | PCU | GSU | |
| Straw (kg) | 2.8 | 2.8 | 2.8 |
| Corn silage (kg) | 9.0 | 9.0 | 9.0 |
| Concentrate supplements (kg) | 2.3 | 2.3 | 2.3 |
| Total (kg) | 14.1 | 14.1 | 14.1 |
| Chemical composition (%,DM) | |||
| Dry matter (%) | 49.39 | 49.39 | 49.40 |
| ME (MCal/kg) | 2.22 | 2.23 | 2.24 |
| Crude protein (%) | 11.77 | 11.76 | 11.75 |
| EE (%) | 2.67 | 2.76 | 2.77 |
| NDF (%) | 51.38 | 51.44 | 51.29 |
| ADF (%) | 30.14 | 30.07 | 30.02 |
Table 2.
Ingredient and chemical composition of concentrated feed supplement (air-dried basis).
| Item | CON | PCU | GSU |
|---|---|---|---|
| Corn | 20.0 | 30.4 | 30.8 |
| Palm meal | 10.0 | 13.0 | 13.0 |
| Wheat bran | 16.2 | 16.8 | 15.5 |
| Sprayed corn husk | 11.0 | 10.0 | 10.0 |
| Soybean meal | 13.0 | 2.0 | 2.0 |
| Rapeseed meal | 6.0 | 5.0 | 5.0 |
| Sesame meal | 8.0 | 6.0 | 6.4 |
| DDGS | 10.0 | 9.0 | 9.0 |
| Polymer-coated urea | — | 2.0 | — |
| Gelatinized starch urea | — | — | 2.5 |
| Premix | 5.8 | 5.8 | 5.8 |
| Total | 100.0 | 100.0 | 100.0 |
| Chemical composition (%,DM) | |||
| Dry matter (%) | 88.45 | 87.43 | 88.45 |
| ME (MCal/kg) | 2.79 | 2.78 | 2.79 |
| Crude Protein (%) | 24.76 | 24.76 | 24.74 |
2.2. Dissolution of Slow-Release Urea
Urea release from the slow-release urea materials was determined by the methods of Lang (2015) and Pan & Zhang (2018) [6,7]. 3.00 g paradimethylaminobenzaldehyde (PDAB) was dissolved in 150 mL anhydrous ethanol, and then 15 mL concentrated hydrochloric acid was added and mixed well. 0.1250 g pure urea was accurately weighed, dissolved in 250 mL volumetric flask, diluted with distilled water to scale, the solution of urea content is 0.5000 g. Take the appropriate amount of 0.5000 mg/mL urea standard solution, with reagent blank as the reference, under the condition of the same dosage of chromogenic agent and chromogenic time change wavelength, determination of absorbance.
Accurately absorb 0.5000 mg/mL urea standard solution 0.00、1.00、2.00、3.00、4.00、5.00、6.00 ml in 25 mL colorimetric tube and corresponding numbers, accurately add chromogenic agent 10 mL, diluted with distilled water to scale, fully shaken; After the bubbles disappeared for 20 min, the measurement was carried out by spectrophotometer at the maximum wavelength using a 1 cm cuvette with the blank without urea standard solution as a reference. Then in vitro dissolution experiments were performed.
Three replicate samples each of 4.47 g polymer-coated urea or 5.63 g gelatinized starch urea were accurately weighed, and placed into 750mL of phosphate buffer solution at pH 6.8, shaken at 38°C and 100 r/min was then used to simulate the rumen environment. Samples were taken at 1 h, 2 h, 3 h, 4 h, 6 h and 8 h, and absorbance was measured by spectrophotometer. The release amount of urea at each time point was calculated according to the change of absorbance.
2.3. Growth Performance
All cattle were weighed before morning feeding at the beginning of the trial period and once every 30 days. The feed intake of test cattle was recorded daily. The recorded data were used to calculate the average feed intake, average daily gain and feed to gain.
2.4. Nutrient Digestibility
A digestion test was conducted in the last week of the trial, and six cows were selected from each group and feed and fecal samples were collected for three consecutive days. About 500 g TMR samples were collected by five-point sampling method after each feeding during the digestion test. Fecal samples were collected through the rectum every 6 h, and about 200 g were collected each time, of which 100 g was nitrogen-fixed with 0.1 hydrochloric acid. After the digestion test the samples of each cattle were mixed, then frozen at -20℃. Feed and fecal samples were dried overnight (or until dry) in a conventional drying oven at 55℃. Dry samples were ground through a 1-mm screen using a pulverizing mill. Feed and fecal samples were analyzed individually for dry matter (DM), crude protein (CP), ether extract (EE) and ash [8]. Sequential analyses of neutral detergent fiber (NDF) and acid detergent fiber (ADF) was determined by the procedure of Van Soest [9]. The acid-insoluble ash (AIA) was used as an internal marker to determine the apparent digestibility of nutrients. TMR, orts and fecal samples were analyzed according to the procedures by GB/T23742-2009.The apparent digestibility of nutrients was calculated as follows: Apparent Digestibility of Nutrients = [1 - (Ad ⅹ Nf) / (Af ⅹ Nd)] ⅹ 100; where Ad = AIA in the diets (g/kg); Af = AIA in the feces(g/kg); Nd = the concentration of a nutrient in the diet (g/kg); Nf = the concentration of a nutrient in the feces (g/kg).
2.5. Biochemical Parameters
Ten cattle were selected from each group and on the 49th and 86th days of the experimental period 10 mL blood samples were collected from the anterior jugular vein in vacuum tubes with and without anticoagulant. The blood in the anticoagulant tube was fully mixed with the anticoagulant, while the blood in the non-anticoagulant tubes was not mixed. After the supernatant was separated, the blood was centrifuged (3500 r/min, 10 min). The serum and plasma were separated into 1.5 mL tubes, stored at -20°C, and transferred back to the laboratory and stored at -80 °C. The blood plasma samples were analyzed to determine the concentration of total protein (TP), albumin (ALB), globulin (GLOB), alanine aminotransferase (ALT), aspartate aminotransferase (AST), alkaline phosphatase (ALP), glucose (GLU), total cholesterol (TC), blood urea-N (BUN), blood ammonia (AN). These biochemical indexes were measured by automatic biochemical analyzer (Beckman AU5800) according to the instructions of the corresponding detection kits (Zhengsheng North Control Biological Technology Co., Ltd), apart from the serum total cholesterol detection kit purchased from Hydrocephalus Medical Co., Ltd.
2.6. Ruminal Fermentation
On the 86th day of the trial period, ten cattle in each group were selected for rumen fluid collection two hours after the morning feeding. Rumen fluid was collected by ruminal sampler (Wuhan Kolibo). The sampling catheter was inserted into the rumen through the mouth and esophagus. The first100 mL of ruminal fluid was collected and was discarded. Another 200 mL of ruminal fluid was collected, filtered through four layers of gauze, and a subsample wasstored in a 10 mL centrifuge tube at -20℃. At the same time, the pH of ruminal fluid before filtering was measured with a pH meter (Shanghai Youke Instrumentation Co., Ltd) determined directly by pH meter. The samples were taken back to the laboratory and transferred to a -80℃ freezer. The total microbial protein (MCP) in rumen fluid was detected by Coomassie brilliant blue method and the concentration of ammonia nitrogen was measured [10,11]. VFA were determined using high-performance liquid chromatography [12].
2.7. DNA Extraction and 16S rRNA Pyrosequencing
Another three animals from each group of similar age and weight were selected for a second set of rumen fluid sampling following the procedures above. After storage at -80℃ these samples were sent to the sequencing department of Sheng Gong Biotech (Shanghai) Co., Ltd. for sequencing. The main procedures were sample DNA extraction, library construction and sequencing. The DNA was extracted by extraction kit, and the DNA integrity was detected by 0.01 agarose gel electrophoresis. Then, the target sequence was enriched by highly specific primers, and finally the bioinformatics analysis was carried out by sequencing data. Rumen bacteria selective amplification region is 16SV3-V4, rumen fungi selective amplification region is ITS1-2.
2.8. Statistical Analysis
All the original data obtained in the experiment were processed by Excel 2007. SPSS 22.0 statistical software was used for one-way analysis of variance (ANOVA) of the data. Duncan’s method was used for multiple comparisons between groups. Significant differences were declared at P < 0.05. Differences at 0.05 < P ≤ 0.10 were considered as a trend toward significance.
3. Results
3.1. Urea Dissolution Profiles
The two slow-release urea forms in this study had different dissolution profiles in phosphate buffer solution at pH 6.8 (Figure 1). After two hours, the release rate of the urea in polymer-coated urea was 624.30 g/kg, while the rate of the urea in gelatinized starch urea was 935.30 g/kg. After 8h of digestion, the dissolve rate of urea in polymer-coated urea was 951.00 g/kg, and the rate in gelatinized starch urea was 999.30 g/kg, indicating that both urea forms could be almost completely digested with time (Table 3).
3.2. Growth Performance
For the period from day 31-60 ADG in the PCU group was significantly higher than that in the CON group (P < 0.05) and the GSU group (P < 0.05). In addition, the ADG of the GSU group was lower (P < 0.05) than the CON group. The feed-weight ratio of the PCU group was significantly lower than both the CON group (P < 0.05) and the GSU group (P < 0.05) (Table 4). Similarly, over the full experimental period, ADG in the PCU group was significantly higher than that in the GSU group (P < 0.05) and extremely significantly higher than that in the CON group (P < 0.05). The feed-weight ratio of PCU group was significantly lower than both the GSU group (P < 0.05) and the CON group (P < 0.05) during the 90-day feeding period. There was no significant difference in other growth performance indexes of each test cycle (P < 0.05).
3.3. Apparent Digestibility
The apparent digestibility of EE in the GSU group was significantly higher than that in CON group (P < 0.05) with the PCU group intermediate (Table 5). The ADF apparent digestibility in the PCU group was significantly higher than that of the CON group (P < 0.05), and extremely significantly higher than that of the GSU group (P < 0.05). Organic matter, crude protein and NDF apparent digestibility were not different.
3.4. Serum Biochemical Indexes
Among the serum biochemical indexes of blood samples collected on the 49th day, the ALT activity in the GSU group was significantly higher than that in the PCU group (P < 0.05), while the NUG was intermediate. Blood urea-N (BUN), blood ammonia (AN), total protein (TP), albumin (ALB), globulin (GLOB), aspartate aminotransferase (AST) and total cholesterol (TC) among all groups were not different (P > 0.05) (Table 6). In the serum biochemical indexes of blood samples collected on the 86th day, the ALB content in the PCU group was significantly higher than that in the CON group (P < 0.05), with the GSU group being intermediate. The AN concentration and ALT activities in the GSU group were significantly higher than those in the CON group. The AST activities was higher in the GSU group than the PCU group with con intermediate. There were no significant differences in BUN, TP, GLOB and TC among the groups.
3.5. Rumen Fermentation Indexes
In the fermentation indexes of rumen fluid samples, the contents of acetate and butyrate (P < 0.05), total VFA and propionate (P < 0.05) in the PCU group were higher than those in the CON group (Table 7). The contents of propionate and butyrate in the GSU group were also higher than those in CON group (P < 0.05). The ratio of acetate to propionate in the CON group was significantly higher than that of both the PCU and GSU groups (P < 0.05). There was no significant difference in either rumen pH or NH3-N (P > 0.05).
3.6. Rumen Bacterial Community
The total DNA extracted from rumen fluid was detected by 1% agarose gel electrophoresis (Figure 2). The length of DNA was about 20 kb and there was obvious bright band, indicating that the quality of sample DNA extraction was great and the concentration was high, which could be used for subsequent detection and analysis.
3.7. Sample Sequence Information
In this experiment, 1,257,144 original sequences and 1,246,088 effective sequences were obtained from the three groups of samples. The average length of effective sequences was 420.04 bp, 419.69 bp, 420.89 bp, 420.68 bp, 417.93 bp, 420.31 bp, 421.12 bp, 421.55 bp and 421.94 bp, respectively. The optimized proportion of high-quality sequence was 99.43%, 99.66%, 99.26%, 99.75%, 95.89%, 99.47%, 99.26%, 99.36% and 99.77%, respectively. (Table 8)
3.8. Diversity of Rumen Bacterial Community Structure
As presented in Table 9, several indices of microbial diversity differed among the treatment groups indicating higher species richness of bacteria in the PCU group. Chao1 index in the PCU group was significantly higher than that in the GSU group (P < 0.05), with CON intermediate. ACE index of the PCU group was greater than that in the GSU group (P < 0.05), NUG was also greater (P < 0.05) than the GSU group. The Shannon index of the PCU group was significantly higher than that of the GSU group (P < 0.05), indicating that the diversity of bacteria in the PCU group was higher than that in the GSU group.
3.9. Bacterial Community Structure Analysis Based on Gate Level
The dominant phyla of rumen bacteria in cattle across all three treatment groups were Bacteroidetes, Firmicutes and Proteobacteria (Figure 3). The respective relative abundance for the CON group was 61.95%, 24.86% and 7.35 57.35%, 28.37% and 6.98%% for the PCU group, and was 69.21%, 17.61% and 8.43% for the GSU group (Table 10). The relative abundance of Bacteroidetes in the GSU group was significantly higher than that in PCU group (P < 0.05). Compared with the CON group, the relative abundance of Firmicutes in the PCU group was 14.12% higher (P > 0.05), while that in the GSU group was 29.16% lower (P > 0.05). There was no significant difference in the relative abundance of bacterial communities at other phylum levels (P > 0.05).
3.10. Bacterial Community Structure Analysis Based on Genus Level
The proportion of Prevotella content in the GSU group was significantly higher than that in the PCU group (P < 0.05); Paraprevotella in the PCU group was significantly higher than that in the CON group and the GSU group (P < 0.05) (Table 11). There was no significant difference in the proportion of bacterial communities in other genera measured (P > 0.05). While not significant, the PCU group had higher levels of Ruminococcus (3.61% and 32.31%), and Ruminobacter (127.40% and 22.06%) compared with the CON and GSU groups, respectively.
3.11. Total DNA Integrity Results of Ruminal Fungi
The total DNA extracted from rumen fluid was detected by 1% agarose gel electrophoresis (Figure 4). The DNA length was about 20 kb and had obvious bright bands, indicating that the quality of DNA extraction was good, and the concentration was high, which allowed for subsequent detection and analysis.
3.11. Sample Sequence Information
A total of 511,819 raw fungal sequences were obtained in this study. After quality control and filtering, 506,943 valid sequences were analyzed. The average length of effective sequences was 277.58 bp, 275.62 bp, 286.12 bp, 290.17 bp, 286.13 bp, 292.67 bp, 287.73 bp, 259.96 bp and 220.55 bp, respectively. The optimized proportion of high-quality sequence was 99.62%, 99.88%, 99.80%, 99.77%, 95.23%, 99.67%, 99.62%, 99.89%, 96.05% respectively (Table 12).
3.12. Diversity of Ruminal Fungi Community Structure
There was no significant difference in Chao1 index, ACE index, Shannon index and Simpson index among the groups (P > 0.05) (Table 13). Therefore, there was no significant difference in species richness, evenness or diversity of fungi in the samples.
3.13. Fungi Community Structure Analysis Based on Gate Level
Four phylum of fungi were obtained by annotation of three groups of rumen microorganisms (Figure 5). The dominant ruminal fungi in each group were Neocallimastigomycota and Ascomycota (Table 14). Their relative abundances in the CON group were 67.42% and 20.09%, respectively. In the PCU group their abundances were 75.45% and 12.40%, and the GSU group 38.56% and 36.40%. Compared with the CON group, the PCU group had greater Neocallimastigomycota (11.91%, P > 0.05), lower Ascomycota (38.28%, P > 0.05) and lower Basidiomycota (38.41%, P > 0.05). The GSU group showed the opposite effect with lower Neocallimastigomycota (42.81%, P > 0.05), greater Ascomycota (42.81%, P > 0.05), and greater Basidiomycetes (121.85%, P > 0.05) as compared to the CON.
3.14. Analysis of Fungal Community Structure Based on Genus Level
The 11 fungi genera with highest relative abundance in the rumen across all treatments were Orpinomyces, Piromyces, Anaeromyces, Cyllamyces, Caecomyces, Aspergillus, Pseudeurotium, Debaryomyce, Sporobolomyces, Aureobasidium, and Neobulgaria (Figure 5). The relative abundance of Orpinomyces in the PCU group and GSU groups was lower by 4.36% and 20.19%, respectively, compared with the CON group (P > 0.05). Similarly, the relative abundance of Piromyces was lower by 18.01% and 49.07% (P > 0.05) respectively. Compared with the no urea group, the relative abundance of Anaeromyces in the PCU group was 46.87% greater (P > 0.05), and that in the GSU group 73.21% lower (P > 0.05). The relative abundance of Cyllamyces in the PCU group and the GSU group was lower by 0.25% and 52.65% compared with the no urea group (P > 0.05). The relative abundance of Caecomyces was 211.97% (PCU) and 39.77% (GSU) higher (P > 0.05). The relative abundance of Neobulgaria was also greater (P > 0.05) by 120.00% and 400.00% for PCU and GSU respectively (Table 15). This section may be divided by subheadings. It should provide a concise and precise description of the experimental results, their interpretation, as well as the experimental conclusions that can be drawn.
4. Discussion
Polymer-coated urea and gelatinized starch urea are two commonly used slow-release urea sources in ruminant feed [1]. There is a large body of work available on slow-release nitrogen sources. Urea that is released too quickly will not align with the microbial digestion and energy availability from other feedstuffs. At the same time, if the release rate of urea is too slow, the urea may not be fully available to the rumen microbes before passing out of the rumen, minimizing it’s benefits to rumen fermentation [7]. The results of this experiment showed that the gelatinized starch urea reached 93.53% release after two hours, thus the slow-release effect was poor. Previous research with 22 gelatinized starch urea samples collected from eight sources nationwide found that the dissolution of six samples was above 90% in 2 hours [13]. The release of nitrogen from the polymer-coated urea was 62.43% at the second hour and 95.10% after eight hours. This suggest slower sustained release of urea that is more likely to be fully utilized by rumen microbes.
The addition of polymer-coated urea and gelatinized starch urea to replace some protein ingredients in beef cattle diets in this study had no effect on feed intake, which is in agreement with the results of previous studies. There was no significant difference in DMI, ADG and feed-to-weight ratio of beef cattle compared with soybean meal group when 1.1% of the polymer-coated urea (Optigen 1200, Alltech Inc.) was added to the diet [14]. Diets supplemented with 1.2% the slow-release urea (Agri-Nutrient Technology Group) showed non-significant differences in DMI, ADG and feed-to-weight ratio of beef cattle compared to the control group [15]. The differences in DMI, ADG and feed-to-weight ratio were not significant in the Angus steers diets supplemented with 1.3% and 3.1% of the Optigen II (Alltech, Lexington, KY) compared to the group supplemented with 1.2% of conventional urea, but ADG and feed utilization efficiency were higher in the PCU group than in the conventional urea group [16]. It has also been shown that under isoenergetic and isonitrogenous conditions, DMI, ADG and feed utilization efficiency were higher among all groups than in the control group when urea phosphate was added at no more than 4% to the concentrate supplement, which is consistent with the results of previous studies; however, when urea phosphate was added at 8% to the concentrate supplement, DMI, ADG and feed utilization efficiency of beef cattle were significantly lower than in the control group [17]. In this trial, polymer-coated urea and gelatinized starch urea were added at 2% and 2.5%, respectively, in this trial. The results showed that in the second month, the average daily weight gain of the PCU group were significantly higher than that of the CON group and the GSU group, and the feed to weight ratio was significantly lower than that of the other two groups; Throughout the test period, the ADG of the PCU group was significantly higher than that of the GSU group and significantly higher than that of the CON group, while the feed to weight ratio was significantly lower than that of the other two groups. It suggests that the best weight gain effect of polymer-coated urea may be related to its better slow-release performance, which can continue to release urea after 2h of feeding, maintain the appropriate rumen concentration of ammonia nitrogen, provide more nitrogen sources for rumen microorganisms, and increase nitrogen deposition. The results of some studies showed that the feed to weight ratio increased when urea (Shandong Ningjin County Yongxing Chemical Co., Ltd.) was inserted at 0.8% or more [18]. For the inconsistent results of this study, the reason may be related to the structure of the diet and CP level, the test diet in the refined to concentrate-roughage ratio of 4:6, crude protein content of 14%, while the present test diet refined to concentrate-roughage ratio of about 7:3, the diet NDF content is higher crude protein content is lower at 11.8%, may be in the case of high roughage content and low protein diets added urea is conducive to improve the feed conversion efficiency. The daily weight gain and feed conversion efficiency in the first month of the GSU group were higher than those of the other two group, which may be due to the different adaptation mechanisms and adaptation time of separate slow-release urea rumen microorganisms. The polymer-coated urea may take a longer time to adapt because of the microencapsulation and the release of urea after 2h, and the ammonia-using bacteria continue to keep growing and reproducing, which may take a longer time to adapt; whereas most of the urea was released in the gelatinized starch urea at the second hour, and the addition of starch in the gelatinized starch urea was more consistent with the trend of dietary ammonia release and energy-nitrogen balance, so the rumen microorganisms had a shorter adaptation time to the gelatinized starch urea.
In this study the use of slow-release urea in the diets of cattle had no significant effect on the apparent digestibility of OM, CP or NDF. This counters previous research where the utilization rate of low-quality forage and digestibility of dry matter and crude protein was improved by adding appropriate amount of slow-release urea which lignin as a carrier to sheep diet [19]. Similarly, replacing a portion of the soybean meal in fattening cattle diets with slow-release urea has been shown to significantly increase apparent digestibility of organic matter [20]. The apparent digestibility of EE and ADF in the PCU group was significantly higher than that in the no urea group and the gelatinized starch urea group in this study. The variation in effects on digestibility seen across trials may be related to the diet structure. The high forage structure diet slows down the rumen fermentation rate, and the addition of slow-release urea in low-protein diet provides continuous ammonia. Ammonia can promote the growth and reproduction of fiber-degrading bacteria, thereby improving the apparent digestibility of EE and ADF in the diet [21].
Under normal conditions, urea in the rumen is degraded into ammonia, and rumen microorganisms use ammonia to synthesize bacterial protein. Excessive unused ammonia is absorbed by rumen wall into the blood [22]. The blood ammonia concentration is closely related to the crude protein level in the diet. If the blood ammonia concentration increases, it indicates that the urea in the diet is wasted and not fully utilized by the microbial population [23]. The results of this experiment showed no significant difference in the blood ammonia concentration between the PCU group and the CON group, indicating that the polymer-coated urea was well utilized in the rumen. This is consistent with previous studies [24]. However, in the 12th week, the blood ammonia concentration in the GSU group was significantly higher than that in the CON group, indicating that the degradation rate of gelatinized starch urea in the rumen was faster than the rumen microorganisms were able to utilize the urea, resulting in a waste of nitrogen and a lack of synchronization in protein synthesis with urea release. Serum total protein (TP) can reflect the absorption, synthesis and metabolism of body proteins, albumin (ALB) is a sensitive indicator of early nutritional status of proteins, while serum BUN can reflect nitrogen metabolism and deposition as well as the utilization of crude protein in feed [25]. The results of this study showed that there was no significant difference in TP, GLOB or BUN contents among groups on the 49th or 86th day, which was consistent with previous studies [26,27]. However, the ALB values in the PCU group was significantly higher than that of the no urea group on the 86th day, and the blood ammonia concentration of the PCU group was not significantly different from that of the CON group on the86th day, indicating that the ammonia produced by the degradation of polymer-coated urea could be effectively utilized by rumen microorganisms, protein metabolism was enhanced, and blood mobilized large amounts of ALB to transport raw materials and metabolites for the synthesis of somatic tissues. Aspartate aminotransferase (AST) and alanine aminotransferase (ALT) in serum are important indicators reflecting liver function, which are involved in trans amino metabolism [28]. In this study, consistent with a previous study on the addition of different levels of urea to the diet of beef cattle, no significant difference in AST and ALT was found between the PCU group and the no urea group on the 49th and 86th days [29]. ALT in the GSU group was significantly higher than the PCU group on the 49th day and the CON group on the 86th day which suggests that gelatinized starch urea increased the burden of liver [27]. Taken in combination, these blood indicators of nitrogen metabolism are consistent with previous studies, and indicate that the addition of slow-release urea in the diet has little impact on protein metabolism in beef cattle.
Ruminal pH is the basic index for evaluating rumen fermentation. Rumen content pH is the result of the interaction between volatile fatty acids (VFA) in chyme and buffer salts in saliva, and the comprehensive effect of rumen epithelium on VFA absorption and outflow with chyme [30]. Appropriate rumen pH is necessary for the robust microbial activity responsible for fiber digestion in ruminants [31]. The results of this study showed that the pH values of the PCU group and the GSU group were lower than those of the CON group, but the difference was not significant. One study showed that the addition of 0.5% and 1% urea to the test diets resulted in significantly lower rumen pH compared to the control group [29]. The addition of urea caused the rumen pH to be lower than the CON group probably because the addition of urea increased the rumen microbial activity and increased the production of VFA, which led to a decrease in rumen pH. The NH3-N concentration in rumen can reflect the urea decomposition by rumen microorganisms and the utilization of protein in diet, with high values indicating that the nitrogen source in diet is sufficient, and rumen microorganisms may not be fully utilized, resulting in nitrogen waste; while low values indicate insufficient nitrogen availability for the cellulolytic bacteria which reduces the activity of cellulolytic bacteria and the efficiency of fiber decomposition [32]. In line with previous studies, the results of this study showed that there was no significant difference in NH3-N concentration in each treatment group [33]. NH3-N in the rumen of ruminants is the main source of nitrogen for the synthesis of microbial proteins, which are the primary source of nitrogen for the synthesis of MCP [34]. Dietary structure, rumen nitrogen and carbon sources, vitamins, mineral elements and rumen environment all affect the synthesis of rumen MCP [35]. In the present study there was no significant difference in MCP among groups, indicating that feeding urea did not affect rumen MCP synthesis. VFA content and ratio have a great influence on the energy use efficiency of ruminants, and VFA concentration in the rumen is also the main factor affecting rumen pH [36]. The results of this experimental study showed that the TVFA content of the PCU group was significantly higher than that of the CON group. This result ties in well with previous studies wherein the TVFA content in the rumen was significantly higher than that in the no urea group when the addition of SRU was less than 1.5% in diet of beef cattle [29]. However, it does run contrary to the results of adding polymer-coated urea into the diet of castrated bulls without increasing the content of rumen TVFA. As with other measures, these differences may be related to the diet structure [14]. In this study, the forage content in dry matter of TMR diet accounted for 70%, while the forage content in dry matter of TMR diet in the Pinos’s study was only 15.6%, which was a high concentrate diet.
The concentration of acetate in the rumen may be related to the absorption rate of VFA [37]. The molar ratio of acetate is positively correlated with the crude content in the diet, and as the activity of cellulolytic bacteria increased, the level of acetate also increased [38]. For ruminants, propionate is an important sugar-producing substance, and the improvement of propionate is conducive to improving the production performance of animals [39]. Propionate fermentation can utilize H2 produced by acetate and butyrate fermentation to improve feed efficiency [40]. Butyrate is a major product of rumen microbial fermentation and a precursor for the synthesis of milk fat and body fat [41]. The results of this trial showed that the content of acetate, butyrate, and propionate in the PCU group was significantly higher than that in the CON group; The content of propionate and butyrate in the GSU group was significantly higher than that in the CON group. It is suggested that the addition of slow-release urea increased the rumen VFA content and promoted carbohydrate degradation because the addition of urea may have provided continuous NH3-N to the cellulolytic bacteria, and the stimulation of NH3-N increased the viability of the cellulolytic bacteria and promoted the degradation of fiber in the feed, while the increase in acetate concentration increased the activity of the cellulolytic bacteria. The acetate: propionate ratio can reflect the utilization efficiency of energy in the rumen. With the decrease of the acetate: propionate ratio in the rumen, the feed utilization efficiency and nitrogen deposition capacity can be improved [42]. The acetate: propionate ratio reflects the energy utilization efficiency of rumen, and affect the microbial flora and energy utilization efficiency in the rumen [43]. The results of this study showed that the acetate-propionate ratio in the PCU group and the GSU group was significantly higher than that in the CON group. When combined, the VFA results of this trial indicate that the addition of slow-release urea likely promoted the degradation of carbohydrates by providing a continuous NH3-N supply to ruminal bacteria, while the increase of acetate concentration increases the activity of cellulolytic bacteria.
The NH3-N concentration in rumen can reflect the urea decomposition by rumen microorganisms and the utilization of protein in diet, with high values indicating that the nitrogen source in diet is sufficient, and rumen microorganisms may not be fully utilized, resulting in nitrogen waste; while low values indicate insufficient nitrogen availability for the cellulolytic bacteria which reduces the activity of cellulolytic bacteria and the efficiency of fiber decomposition [32]. In line with previous studies, the results of this study showed that there was no significant difference in NH3-N concentration in each treatment group [33].
Diet structure has a great influence on microbial community composition. Rumen microorganisms can quickly respond to changes in diets and adjust their community structure accordingly [44]. The sequencing data in this study showed that the dominant bacterial phyla in the rumen fluid of beef cattle were Bacteroidetes and Firmicutes, which is consistent with previous reports on beef cattle, goats and sheep [45,46,47]. Generally, Bacteroidetes rumen bacteria are related to the degradation of non-fibrous carbohydrates, and cannot secrete cellulase, so they are not the main functional bacteria in fiber degradation [48]. Firmicutes include Ruminal coccus, Vibrio butyricum and other fiber-degrading bacteria, which play an important role in the process of fiber degradation [49]. This experiment found that the relative abundance of Bacteroidetes in GSU group was significantly higher than that in PCU group, and the relative abundance of Firmicutes in PCU group was 14.12% higher than that in the CON group. The bacterial community included Prevotella, succinate, Butyrivibrio, Ruminococcus and a large number of unclassified genera. The relative abundance of Prevotella was the highest in the CON group and the PCU group. Conversely the relative proportion of Paraprevotella was highest in the PCU group. Prevotella can degrade starch and plant cell wall polysaccharides in the rumen, but cannot degrade cellulose, which plays an important role in the degradation of protein in the rumen [50]. The differences at the genus level among the treatment groups may be related to the addition of different slow-release urea.
It plays an important role in the degradation of plant fibers in the diet through both physical and enzymatic degradation [51]. Neocallimastigomycota has been isolated from digestive tract of cattle, goats, sheep and horses [52]. Microorganisms of Neocallimastigomycota can also provide microbial proteins for hosts. Ascomycota is the largest group of microorganisms in the fungal community, which is mainly involved in the degradation of lignin and keratin in the diet [53]. Across all three treatments Neocallimastigomycota, Ascomycota and Basidiomycota were the dominant rumen fungal phyla, which is consistent with previous reports in dairy cows and other ruminants [54]. The nitrogen sources required for fungal growth are ammonia nitrogen and amino acids, but fungi are more inclined to synthesize proteins using mixed amino acids, thus amino acids are better than ammonia in promoting the growth of ruminal fungi [55]. This may be the reason that slow-release urea did not affect the ruminal fungi in this study. We only analyzed the fungi in the rumen fluid, but there was a significant difference between the solid phase of the rumen fluid and the fungi in the liquid phase of the rumen fluid. We speculate that this may be one of the reasons that the addition of the polymer-coated urea and gelatinized starch urea had no obvious effect on the rumen fungi.
5. Conclusions
The urea release profile of polymer-coated urea was superior to that of gelatinized starch urea, which could help synchronize nitrogen release with energy metabolism in the rumen and improve microbial growth patterns. The addition of polymer-coated urea in the diet resulted in changes to the composition of the rumen microbial flora, specifically resulting in greater species richness and diversity of rumen microorganisms and the relative abundance of fiber-degrading bacteria. This likely translated to rumen fermentation benefits through more VFA production and higher apparent digestibility of ADF. These benefits in turn led to greater daily gain of the cattle. Based on these results, in the case of high dietary crude feed content, the use of partially polymer-coated urea or gelatinized starch urea instead of protein raw materials in the diet had no adverse effect on beef cattle production performance, and the former was more beneficial to performance than the latter.
Author Contributions
Conceptualization, J.C.; methodology, C.F. and H.L.; software, Z.Z. and Y.X.; validation, W.J. and G.Z.; formal analysis, Y.X.; investigation, A.F.K.; resources, A.F.K.; data curation, H.L.; writing—original draft preparation, C.F.; writing—review and editing, J.C.; visualization, C.F.; supervision, J.C.; project administration, W.J.; funding acquisition, G.Z. All authors have read and agreed to the published version of the manuscript.
Funding
This research was funded by the National Key Research and Development Program of China, grant number 2022YFD1301101.
Institutional Review Board Statement
The experimental protocol and sample collection were carried out in accordance with the Regulations on the Administration of Laboratory Animals implemented by the National Science and Technology Commission of the People's Republic of China. The experiment was approved by the Committee of the College of Animal Science and Technology, Anhui Agricultural University, Hefei, China (No. SYDW-P20190600601).
Data Availability Statement
Due to restrictions, data are available upon request.
Acknowledgments
We are grateful to Beijing Alltech Biological Products Co., Ltd. for their financial support.
Conflicts of Interest
The authors declare no conflicts of interest.
References
- Wang, M.Z.; Yang, S.H.; Liu, F.Y.; Zhang, Z.B.; Zhao, J. Research progress on preparation technology of slow-release urea and its application in ruminant production. Chin. Dairy. 2021, No.237, 32-39.
- Zhao, X.L.; Wang R.H.; Yao J.C.; X, X.L. Analysis of the current situation and problems of soybean import trade in China. Food Sci. Technol. Res. 2020, 45, 20-22.
- Liang, H.; Zhao, E.L.; Feng, C.Y.; Wang, J.F.; Xu, L.J.; Li Z.M.; Yang, S.T.; Ge, Y.; Li, L.Z.; Qu, M.R. Effects of slow-release urea on in vitro rumen fermentation parameters, growth performance, nutrient digestibility and serum metabolites of beef cattle. Semin. Cienc. Agrar. 2020, 41, 1399-1414. [CrossRef]
- Tian, J.X.; Zheng, N.; Wang, J.Q.; Zhao, S.G. Research progress on ruminant coated slow-release urea feed. Chin. J. Anim. Nutr. 2021, 33, 6656-6665.
- NRC (National Research Council). Nutrient Requirements of Beef Cattle, eighth rev. ed.; Publisher: Washington, DC: National Academy Press, USA, 2016.
- Lang, D.L. Determination of coated urea slow-release concentration change by spectrophotometry. Shandong. Chem. Ind. 2015, 44, 92-93.
- Pan, Z.M.; Zhang, L.H. Preparation and performance test of a slow-release urea for ruminants. Sci. Technol. Soc. 2018, 136-137.
- Zhang, L.Y. Feed analyses and quality test, 3rd ed.; China Agricultural University Press: Beijing, China, 2007.
- Van Soest, P.J. Methods for dietary fiber, neutral detergent fiber, and non-starch polysaccharides in relation to animal nutrition. J. Dairy. Sci. 1991, 74, 3583-3597. [CrossRef]
- Gu, X.W.; Zhao, G.Q.; Jin, X.J.; Guo, P. Effects of Chinese herbal medicine additives on dry matter intake and rumen environment of dairy cows. China. Dairy. Cattle. 2010, No.178, 18-21.
- Feng, Z.C.; Gao, M. Improvement of method for determination of ammonia nitrogen content in rumen fluid by colorimetric method. Anim. Feed. Sci. Technol. 2010, 31, 37.
- Bo, X.; Bo, F.; Fang, S.M.; Zhao, L.J.; Guo, C.H. Study on Determination of Volatile Fatty Acids in Rumen Contents by Reversed Phase High Performance Liquid Chromatography. China. Feed. 2014, No.513, 28-29.
- Deng, L.Q.; Zhang, J.M.; Zhao, Q.Y.; Wang, J.Q. Study on quality and safety evaluation of gelatinized starch urea from different sources. Acta. Agri. Boreal. Sinica. 2011, 26, 290-294.
- Pinos-Rodriguez, J.M.; Pena, L.Y.; Gonzalez-Munoz, S.S.; Barcena, R.; Salem, A. Effects of a slow-release coated urea product on growth performance and ruminal fermentation in beef steers. Ital. J. Anim. Sci. 2010, 9, 16-19. [CrossRef]
- Taylor-Edwards, C.C.; Hibbard, G.; Kitts, S.E.; McLeod, K.R.; Axe, D.E.; Vanzant, E.S.; Kristensen, N.B.; Harmon, D.L. Effects of slow-release urea on ruminal digesta characteristics and growth performance in beef steers. J. Anim. Sci. 2009, 87, 761-767.
- Bourg, B.M.; Tedeschi, L.O.; Wickersham, T.A.; Tricarico, J.M. Effects of a slow-release urea product on performance, carcass characteristics, and nitrogen balance of steers fed steam-flaked corn. J. Anim. Sci. 2019, 90, 3914-3923. [CrossRef]
- Ji, S.K.; Zhang, F.; Sun, Y.K.; Deng, K.D.; Wang, B.; Tu, Y.; Zhang, N.F.; Jiang, C.G.; Wang, S.Q.; Diao, Q.Y. Influence of dietary slow-release urea on growth performance, organ development and serum biochemical parameters of mutton sheep. J. Anim. Physiol. Anim. Nutr. 2017, 101, 964-973. [CrossRef]
- Jiang, L.; Meng, Q.X.; Ren, L.P.; Huo, Y.L.; Wang, L.W.; Ding, J.; Zhao, J.W. Effects of dietary urea supplemental level on growth performance and blood biochemical indexes of growing-finishing cattle. Zhongguo. Nong. Ye. Ke. Xue. 2012, 45, 761-767. [CrossRef]
- Puga, D.C.; Galina, H.M.; Perez-Gil, R.F.; Sangines, G.L.; Aguilera, B.A.; Haenlein, G.F.W. Effect of a controlled-release urea supplement on rumen fermentation in sheep fed a diet of sugar cane tops (Saccharum officinarum), corn stubble (Zea mays) and King grass (Pennisetum purpureum). Small. Rumin. Res. 2001, 39, 269-276. [CrossRef]
- Galina, M.A.; Perez, G.; Ortiz, R.M.A.; Hummel, J.D.; Orskov, R.E. Effect of slow-release urea supplementation on fattening of steers fed sugar cane tops (Saccharum officinarum) and maize (Zea mays): ruminal fermentation, feed intake and digestibility. Livest. Prod. Sci, 2003, 83, 1-11. [CrossRef]
- Guo, W.; Li, W.J.; Hu, X.Z.; Lv, X.K.; Cui, K.; Diao, Q.Y. Research progress on the application of low protein diet in ruminants. Feed. Industr. 2020, 41, 47-51.
- Bartley, E.E.; Davidovich, A.D.; Barr, G.W.; Griffel, G.W.; Dayton, A.D.; Deyoe, C.W.; Bechtle, R.M. Ammonia toxicity in cattle. I. Rumen and blood changes associated with toxicity and treatment methods. J. Anim. Sci. 1976, 43, 835-841. [CrossRef]
- Froslie, A. Feed-related urea poisoning in ruminants. Folia Vet. Lat. 1977, 7, 17-31.
- Bao, Y.Q.; Shi, J.C.; Ding, L.F.; Du, H.H.; Shen, J.Q.; Cui, Y.L. Experimental Study on Safety Feeding of Slow-release Non-protein Nitrogen Expanded Feed Additive. Mod. Anim. Husb. Sci. Tech. 2009, No. 173, 138-139.
- Swenson M.J. Physiology of Domestic Animals. Beijing Science and Technology Publishing: Beijing, China, 1976.
- Wang, H.; Luo, J.; Zhang, W.; Zhang, T.Y.; Yang, D.K. Effects of a novel slow-release non-protein nitrogen supplemental level on lactation performance and blood biochemical indexes of dairy goats. Chin. J. Anim. Nutr. 2014, 26, 718-724.
- Zhao, E.L.; Feng, C.Y.; Wang, J.F.; Bai, J.; Li, Y.J.; Li, M.F.; Xin, J.P.; Ge, Y.; Li, L.Z.; Liang, H.; Xu, L.J.; Qu, M.R.; Li, T.T. Effects of a new type of slow-release urea replacing part of soybean meal in diet on growth performance, nutrient digestibility and blood biochemical indexes of beef cattle. Chin. Anim. Husb. Vet. Med. 2019, 46, 994-1001.
- Lv, J.L.; Xiao, Q.; Chen, Y.P.; Fan, X.G.; Liu, X.; Liu, F.; Luo, G.P.; Zhang, B.S.; Wang, S. Effects of magnesium isoglycyrrhizinate on AST, ALT, and serum levels of Th1 cytokines in patients with allo-HSCT. Int. Immunopharmacol. 2017, 46, 56-61. [CrossRef]
- Li, Y.S. Effects of dietary urea supplemental level on rumen fermentation performance and blood biochemical indexes of Qinchuan beef cattle. Master thesis, Northwest A&F University, Yuling, China, 2017.
- Tang, L.B. Effects of dietary concentrate to forage ratio on ruminants. Anim. Agri. 2017, 49-50.
- Nagaraja, T.G.; Titgemeyer, E.C. Ruminal acidosis in beef cattle: The current microbiological and nutritional outlook. J. Dairy. Sci. 2007, 90, E17-E38. [CrossRef]
- Hristov, A.N.; Ropp, J.K.; Hunt, C.W. Effect of barley and its amylopectin content on ruminal fermentation and bacterial utilization of ammonia-N in vitro. Anim. Feed. Sci. Tech. 2002, 99, 25-36. [CrossRef]
- Zhang, J.J. Effects of feed slow-release urea on in vitro rumen fermentation parameters, growth performance and blood parameters of reserve dairy cows and beef cattle. Master thesis, Lanzhou University, Lanzhou, 2018.
- Wang, L.; Sun, Y.D.; Liu, X.W.; Sun, G.Q. Effects of cysteamine on rumen microbial protein production, milk performance and nitrogen excretion in dairy cows. Chin. J. Anim. Nutr. 2015, 27, 1262-1669.
- Wei, H.Z.; Mo, Y. Advances in the mechanism and influencing factors of rumen microbial protein synthesis in ruminants. Beijing. Agri. 2012, No.518, 122.
- Qi, Z.L.; Ga, E.D.; Jin, S.G.; Lu, S.F.; Zheng, L.D.; Wang, J.Y. Study on the degradation of rumen dry matter and starch in common feed of dairy cows. Pratac. Sci. 2006, 63-68.
- Lu, D.X. Development of green nutrition technology for ruminants. Chin. J. Anim. Nutr. 1999, 1-16.
- Liu, Y.J.; Wang, C.; Liu, Q.; Guo, G.; Huo, W.J.; Zhang, J.; Pei, C.X.; Zhang, Y.L. Effects of dietary isobutyric acid supplementation on growth performance, rumen fermentation and cellulolytic bacteria of calves. Cao. Ye. Xue. Bao. 2019, 28, 151-158.
- Pang, X.D.; Tang, H.C.; Zhuang, S.; Wang, T. Study on the application of organic acids in ruminant nutrition. Dairy. Sci. Technol. 2006, 130-132.
- Xu, Z.X.; Li, D.F.; Yu, C.W.; Li, S.J.; Gao, M.; Hu, H.L.; Liu, D.C. Effects of microbial fermented feed on rumen fermentation function and in vitro digestibility of dietary nutrients in dairy cows. Acta Vet. Zootech. Sin. 2021, 33, 1513-1522.
- Li, Y.M.; Luan, J.M.; Zhang, M.; Jin, Y.H.; Xia, G.J.; Geng, C.Y. Effects of different concentrations of Bacillus subtilis on rumen fermentation characteristics in vitro.Zhongguo. Xu. Mu. Shou. Yi. 2019, 46, 1031-1037.
- Xiong, B.H.; Lu, D.X.; Zhang, Z.Y. Effects of changes in the molar ratio of rumen acetic acid to propionic acid on rumen fermentation and blood parameters. Acta Vet. Zootech. Sin. 2002, 537-543.
- Carrico, J.A.; Pinto, F.R.; Simas, C.; Nunes, S.; Sousa, N.G.; Frazao, N.; de Lencastre, H.; Almeida, J.S. Assessment of band-based similarity coefficients for automatic type and subtype classification of microbial isolates analyzed by pulsed-field gel electrophoresis. J. Clin. Microbiol. 2005, 43, 5483-5490. [CrossRef]
- Hooper, L.V.; Wong, M.H.; Thelin, A.; Hansson, L.; Falk, P.C.; Gordon, J.I. Molecular analysis of commensal host-microbial relations hips in the intestine. Science. 2001, 291, 881-884. [CrossRef]
- Belanche, A.; de la Fuente, G.; Newbold, C.J. Effect of progressive inoculation of fauna-free sheep with holotrich protozoa and total-fauna on rumen fermentation, microbial diversity and methane emissions. Fems. Microbiol. Ecol. 2015, 91, 1-10. [CrossRef]
- Jewell, K.A.; McCormick, C.A.; Odt, C.L.; Weimer, P.J.; Suen, G. Ruminal bacterial community composition in dairy cows is dynamic over the course of two lactations and correlates with feed efficiency. Appl. Environ. Microb. 2015, 81, 4697-4710. [CrossRef]
- Wetzels, S.U.; Mann, E.; Metzler-Zebeli, B.U.; Wagner, M.; Klevenhusen, F.; Zebeli, Q.; Schmitz-Esser, S. Pyrosequencing reveals shifts in the bacterial epimural community relative to dietary concentrate amount in goats. J. Dairy. Sci. 2015, 98, 5572-5587. [CrossRef]
- Dong, C.X.; Zhang, J.L.; Guo, X.F.; Li, Y.H.; Yang, J.; Zhang, X.S. Research progress on the effects of tannins on ruminant production performance, rumen fermentation and microflora. Acta. Veterinaria. Et. Zootechnica. Sinica. 2020, 51, 234-242.
- Evans, N.J.; Brown, J.M.; Murray, R.D.; Getty, B.; Birtles, R.J.; Hart, C.A.; Carter, S.D. Characterization of Novel Bovine Gastrointestinal Tract Treponema Isolates and Comparison with Bovine Digital Dermatitis Treponemes. Appl. Environ. Microb. 2011, 77, 138-147. [CrossRef]
- Zhang, J.; Zhang, L.L.; Xu, X.F. Research progress of Prevotella in ruminant rumen. China. Feed. 2020, No.651, 17-21.
- Liggenstoffer, A.S.; Youssef, N.H.; Couger, M.B.; Elshahed, M.S. Phylogenetic diversity and community structure of anaerobic gut fungi (phylum Neocallimastigomycota) in ruminant and non-ruminant herbivores. Isme. J. 2010, 4, 1225-1235. [CrossRef]
- Gruninger, R.J.; Puniya, A.K.; Callaghan, T.M.; Edwards, J.E.; Youssef, N.; Dagar, S.S.; Fliegerova, K.; Griffith, G.W.; Forster, R.; Tsang, A.; McAllister, T.; Elshahed M.S. Anaerobic fungi (phylum Neocallimastigomycota): advances in understanding their taxonomy, life cycle, ecology, role and biotechnological potential. Fems. Microbiol. Ecol. 2014, 90, 1-17. [CrossRef]
- Belanche, A.; Doreau, M.; Edwards, J.E.; Moorby, J.M.; Pinloche, E.; Newbold, C.J. J. Nutr. 2012, 142, 1684-1692.
- Kumar, S.; Indugu, N.; Vecchiarelli, B.; Pitta, D.W. Associative patterns among anaerobic fungi, methanogenic archaea, and bacterial communities in response to changes in diet and age in the rumen of dairy cows. Front. Microbiol. 2015, 6, 781. [CrossRef]
- Orpin, C.G.; Munn, E.A. Neocallimastix patriciarum sp.nov., a new member of the Neocallimasticaceae inhabiting the rumen of sheep. Trans. Br. Mycol. Soc. 1986, 86, 178-181. [CrossRef]
Figure 1.
Dissolution of polymer-coated urea and gelatinized.

Figure 2.
Agarose gel electrophoresis of DNA sample. From left to right, the strips are: CON 1; CON 2; CON 3; PCU1; PCU 2; PCU 3; GSU 1; GSU 2; GSU 3.
Figure 2.
Agarose gel electrophoresis of DNA sample. From left to right, the strips are: CON 1; CON 2; CON 3; PCU1; PCU 2; PCU 3; GSU 1; GSU 2; GSU 3.
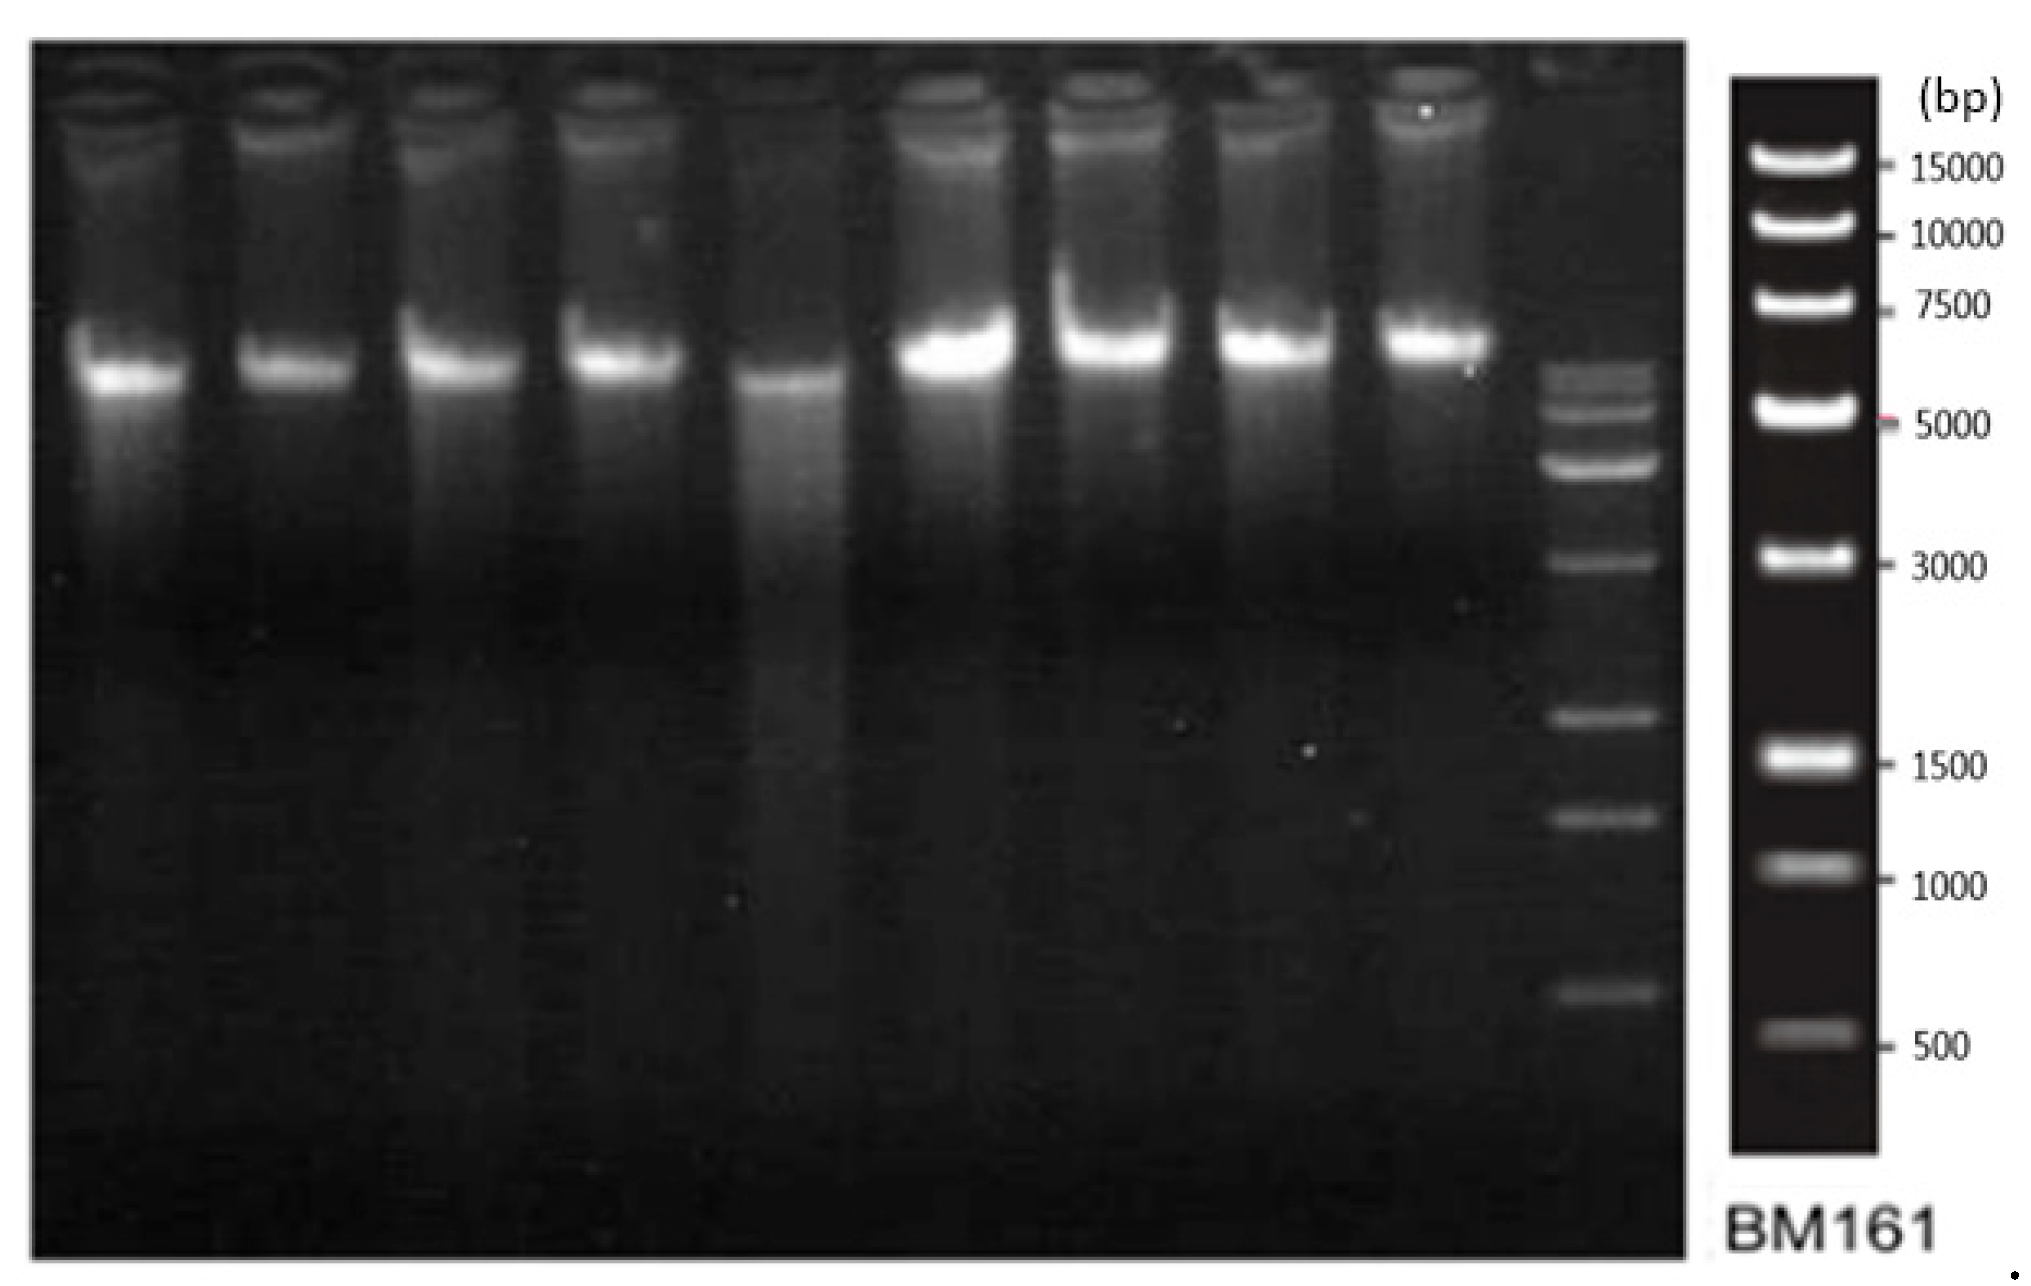
Figure 3.
Histogram of relative abundance distribution of bacteria based on phylum level and genus.
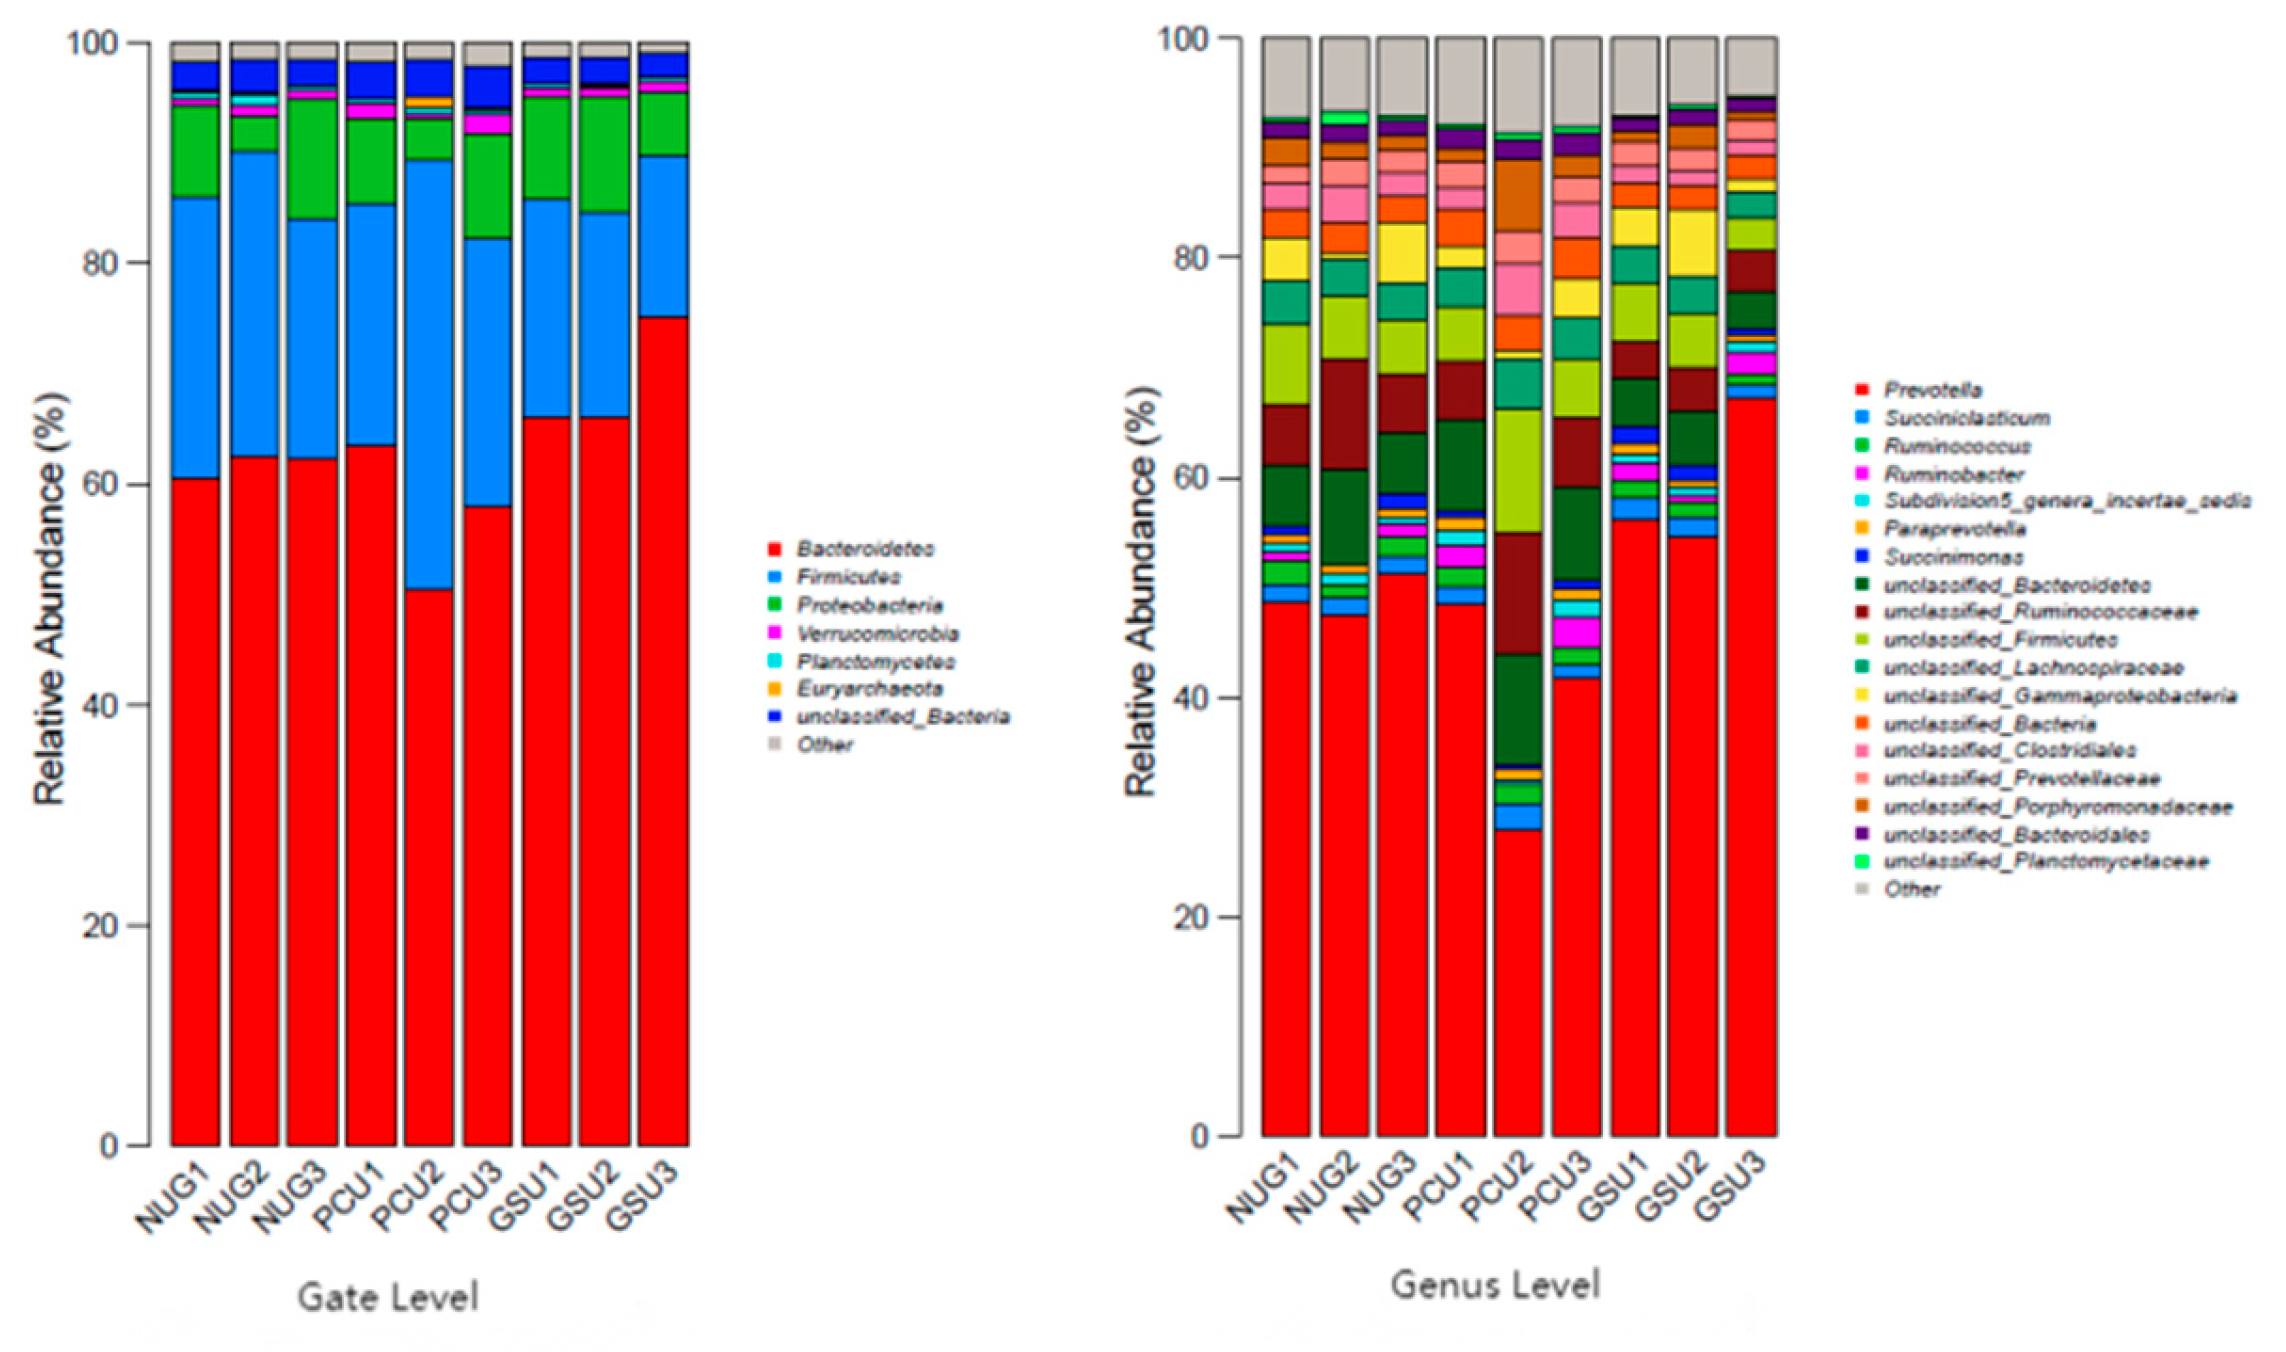
Figure 4.
Agarose gel electrophoresis of DNA samples.
Figure 5.
Histogram of relative abundance of fungi at the phylum and genus levels.
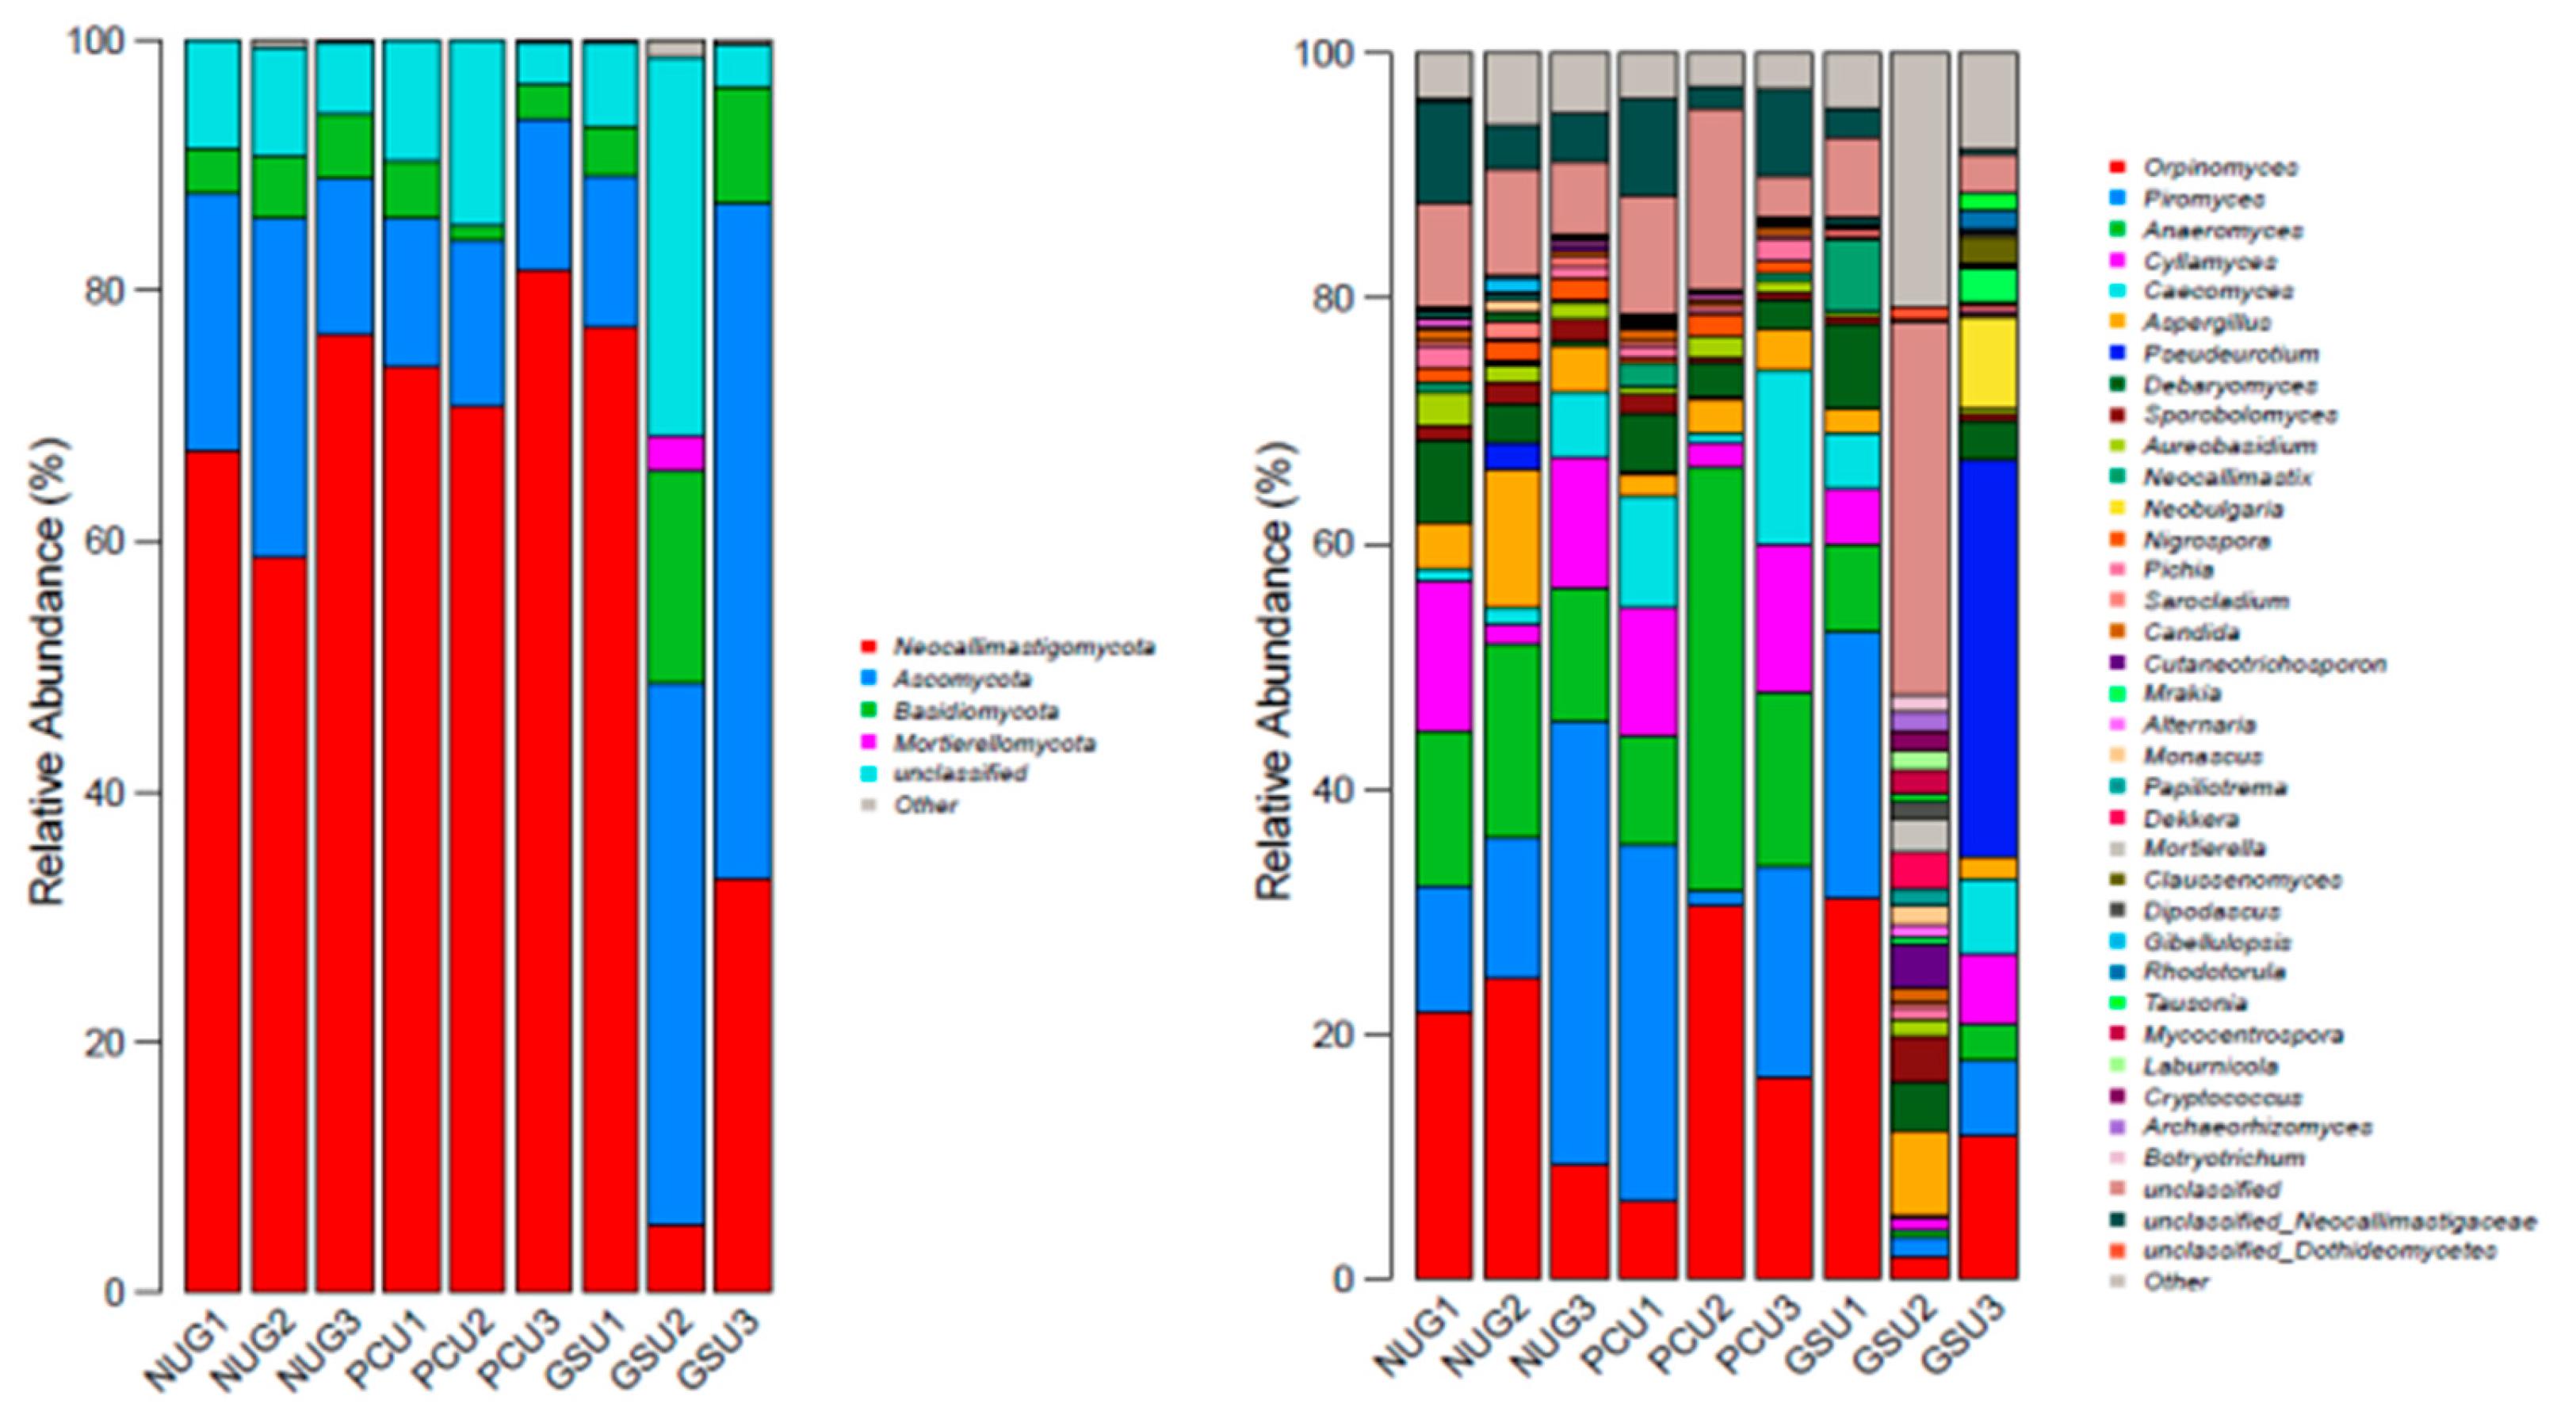
Table 3.
Dissolution rate of different slow-release urea.
| Item | Culture time(hour) | |||||
|---|---|---|---|---|---|---|
| 1 | 2 | 3 | 4 | 6 | 8 | |
| Polymer-coated urea PCU g/kg | 522.70 ±46.20 |
624.30 ±53.80 |
749.70 ±85.60 |
850.00 ±20.00 |
913.30 ±12.50 |
951.00 ±26.70 |
| Gelatinized starch urea GSU g/kg | 933.00 ±3.60 |
935.30 ±2.90 |
925.00 ±7.00 |
948.70 ±4.90 |
983.00 ±26.90 |
999.30 ±17.00 |
Table 4.
Effects of different nitrogen sources on the growth performance of beef cattle.
| Item | CON | PCU | GSU | P value |
|---|---|---|---|---|
| Initial body weight, kg | 321.91±44.40 | 323.97±46.96 | 322.24±46.51 | 0.960 |
| 30d body weight, kg | 347.76±46.07 | 350.84±47.84 | 349.87±48.11 | 0.925 |
| 60d body weight, kg | 370.83±46.21 | 376.89±50.52 | 370.60±48.85 | 0.686 |
| 90d body weight, kg | 384.59±44.69 | 392.80±48.97 | 386.29±49.16 | 0.561 |
| Average daily gain (ADG), kgd-1 | ||||
| 0-30 d | 0.86±0.20 | 0.90±0.25 | 0.92±0.23 | 0.298 |
| 31-60 d | 0.77±0.20b | 0.87±0.20a | 0.69±0.19c | <0.001 |
| 61-90 d | 0.46±0.23 | 0.53±0.22 | 0.52±0.22 | 0.116 |
| 0-90 d | 0.70±0.09b | 0.76±0.14a | 0.71±0.13b | 0.003 |
| Dry matter intake (DMI), kg | ||||
| 0-30 d | 6.76±0.38 | 6.69±0.33 | 6.77±0.29 | 0.946 |
| 31-60 d | 6.91±0.20 | 6.89±0.19 | 6.95±0.18 | 0.912 |
| 61-90 d | 7.03±0.20 | 6.93±0.13 | 7.02±0.26 | 0.936 |
| 0-90 d | 6.90±0.29 | 6.84±0.25 | 6.91±0.27 | 0.924 |
| Feed-weight ratio(DMI/ADG) | ||||
| 0-30 d | 8.54±3.67 | 8.13±2.75 | 7.89±2.41 | 0.437 |
| 31-60 d | 9.65±3.22b | 8.72±4.43b | 11.37±5.73a | 0.003 |
| 61-90 d | 18.57±20.05 | 15.87±9.36 | 12.18±28.23 | 0.190 |
| 0-90 d | 10.09±1.39a | 9.33±2.38b | 10.05±2.00a | 0.040 |
a, b, c Mean values within a row with different letters differ at P < 0.05.
Table 5.
Effects of different nitrogen sources on the apparent digestibility of nutrients in cattle.
Table 5.
Effects of different nitrogen sources on the apparent digestibility of nutrients in cattle.
| Item | CON | PCU | GSU | P value |
|---|---|---|---|---|
| Organic matter (OM) | 69.27±0.13 | 69.13±1.01 | 69.31±0.23 | 0.930 |
| Crude protein (CP) | 66.98±2.18 | 66.93±0.98 | 67.19±1.67 | 0.980 |
| Ether extract (EE) | 85.84±0.59b | 87.07±1.42ab | 87.70±0.36a | 0.032 |
| Neutral detergent fiber (NDF) | 60.79±2.25 | 63.22±2.88 | 63.70±1.90 | 0.293 |
| Acid detergent fiber (ADF) | 56.74±1.25b | 57.79±1.16a | 55.36±1.12b | 0.043 |
a, b Mean values within a row with different letters differ at P < 0.05.
Table 6.
Effects of different slow-release urea on Serum Biochemical Indexes in Beef Cattle.
| Item | CON | PCU | GSU | P value |
|---|---|---|---|---|
| 49th Day | ||||
| BUN(mmol/L) | 3.73±0.58 | 3.53±0.50 | 3.72±0.34 | 0.600 |
| AN(μmol/L) | 91.88±11.43 | 97.25±18.90 | 99.38±12.11 | 0.208 |
| TP(g/L) | 61.10±3.41 | 62.00±0.98 | 62.20±2.89 | 0.630 |
| ALB(g/L) | 35.54±1.15 | 35.24±2.18 | 36.05±1.36 | 0.539 |
| GLOB(g/L) | 25.56±2.90 | 25.61±3.06 | 26.15±2.76 | 0.882 |
| A/C | 1.41±0.17 | 1.39±0.19 | 1.39±0.16 | 0.980 |
| ALT(U/L) | 22.19±2.05ab | 21.48±2.11b | 24.23±3.75a | 0.041 |
| AST(U/L) | 50.18±4.10 | 46.78±5.44 | 50.56±4.63 | 0.175 |
| TC (mmol/L) | 3.63±0.70 | 3.74±0.46 | 3.64±0.51 | 0.886 |
| 86th Day | ||||
| BUN(mmol/L) | 3.64±0.48 | 3.66±0.41 | 3.68±0.22 | 0.976 |
| AN(μmol/L) | 86.50±17.31b | 95.50±14.47ab | 105.44±14.20a | 0.023 |
| TP(g/L) | 59.54±3.45 | 61.41±2.99 | 59.80±2.33 | 0.316 |
| ALB(g/L) | 33.29±1.81b | 35.02±1.42a | 34.05±1.05ab | 0.041 |
| GLOB(g/L) | 27.26±1.47 | 26.39±2.68 | 25.54±1.34 | 0.198 |
| A/C | 1.28±0.13 | 1.34±0.16 | 1.31±0.11 | 0.595 |
| ALT(U/L) | 21.50±1.66b | 21.87±1.55ab | 23.72±2.98a | 0.039 |
| AST(U/L) | 48.14±6.73ab | 44.68±5.28b | 51.42±7.10a | 0.046 |
| TC (mmol/L) | 3.36±0.59 | 3.46±0.42 | 3.25±0.42 | 0.630 |
a, b Mean values within a row with different letters differ at P < 0.05.
Table 7.
Effects of different slow-release urea on rumen fermentation index in beef cattle.
| Item | CON | PCU | GSU | P value |
|---|---|---|---|---|
| Rumen pH | 7.04±0.20 | 7.01±0.10 | 7.00±0.13 | 0.816 |
| NH3-N (mg/dL) | 14.69±0.24c | 14.33±0.12b | 13.95±0.20a | 0.002 |
| Total VFA (mmol/L) | 71.54±12.02b | 82.53±4.97a | 78.21±5.67ab | 0.015 |
| Acetate (mmol/L) | 41.47±7.56b | 46.95±2.96a | 43.86±4.38ab | 0.043 |
| Propionate (mmol/L) | 18.50±3.74b | 22.26±1.59a | 21.00±1.89a | 0.008 |
| Butyrate (mmol/L) | 11.56±1.40b | 13.32±1.42a | 13.35±2.02a | 0.030 |
| Acetate/propionate | 2.26±0.20a | 2.11±0.10b | 2.09±0.91b | 0.020 |
a, b, c Mean values within a row with different letters differ at P < 0.05.
Table 8.
Sequencing information of ruminal Bacteria.
| Sample ID | Raw Reads | Effect Reads | Mean Length | Effective sequence ratio% |
|---|---|---|---|---|
| NUG1 | 137422 | 136632 | 420.04 | 99.43 |
| NUG2 | 121124 | 120716 | 419.69 | 99.66 |
| NUG3 | 130021 | 129065 | 420.89 | 99.26 |
| PCU1 | 144836 | 144470 | 420.68 | 99.75 |
| PCU2 | 132545 | 127094 | 417.93 | 95.89 |
| PCU3 | 138826 | 138093 | 420.31 | 99.47 |
| GSU1 | 145376 | 144299 | 421.12 | 99.26 |
| GSU2 | 140075 | 139183 | 421.55 | 99.36 |
| GSU3 | 166919 | 166536 | 421.94 | 99.77 |
Table 9.
Alpha diversity index statistical table of ruminal bacterial.
| Item | CON | PCU | GSU |
|---|---|---|---|
| Chao1_index | 2060.44±44.57ab | 2091.41±55.39a | 1977.89±14.60b |
| ACE index | 2043.16±22.14ab | 2078.21±39.74a | 1973.46±17.62b |
| Shannon index | 5.63±0.06ab | 5.86±0.10a | 5.33±0.19b |
| Simpson index | 0.01±0.00 | 0.01±0.00 | 0.02±0.00 |
| Coverage % | 99.67±0.05 | 99.72±0.08 | 99.73±0.04 |
a, b Mean values within a row with different letters differ at P < 0.05.
Table 10.
Statistical table of proportion of ruminal dominant bacteria level of sample.
| Item | CON | PCU | GSU |
|---|---|---|---|
| Bacteroidetes | 61.95±1.03ab | 57.35±6.52b | 69.21±5.27a |
| Firmicutes | 24.86±3.08 | 28.37±9.24 | 17.61±2.74 |
| Proteobacteria | 7.35±3.96 | 6.98±2.97 | 8.43±2.45 |
| Verrucomicrobia | 0.80±0.16 | 1.15±0.66 | 0.89±0.18 |
| Planctomycetes | 0.66±0.42 | 0.47±0.10 | 0.28±0.03 |
| Euryarchaeota | 0.12±0.11 | 0.45±0.48 | 0.12±0.86 |
a, b Mean values within a row with different letters differ at P < 0.05.
Table 11.
Statistical table of proportion of ruminal dominant bacteria in sample.
| Item | NUG | PCU | GSU |
|---|---|---|---|
| Prevotella | 49.04±1.94ab | 39.37±10.48b | 59.34±6.87a |
| Succiniclasticum | 1.68±0.06 | 1.66±0.58 | 1.67±0.42 |
| Ruminococcus | 1.66±0.40 | 1.72±0.08 | 1.30±0.24 |
| Ruminobacter | 0.73±0.60 | 1.66±1.35 | 1.36±0.63 |
| Subdivision5_genera_incertae_sedis | 0.74±0.14 | 1.09±0.65 | 0.85±0.18 |
| Paraprevotella | 0.78±0.23b | 1.09±0.14a | 0.76±0.96b |
| Succinimonas | 0.76±0.65 | 0.59±0.16 | 1.13±0.55 |
a, b Mean values within a row with different letters differ at P < 0.05.
Table 12.
Sequencing information of ruminal Fungi.
| Sample ID | Raw Reads | Effect Reads | Mean Len | Effect Reads ratio% |
|---|---|---|---|---|
| NUG1 | 41825 | 41666 | 277.58 | 99.62 |
| NUG2 | 69116 | 69031 | 275.62 | 99.88 |
| NUG3 | 60506 | 60384 | 286.12 | 99.80 |
| PCU1 | 49506 | 49391 | 290.17 | 99.77 |
| PCU2 | 39492 | 39189 | 286.13 | 95.23 |
| PCU3 | 45498 | 45350 | 292.67 | 99.67 |
| GSU1 | 46290 | 46116 | 287.73 | 99.62 |
| GSU2 | 65615 | 65545 | 259.96 | 99.89 |
| GSU3 | 93971 | 90262 | 220.55 | 96.05 |
Table 13.
Alpha diversity index statistical table of ruminal fungi.
| Item | CON | PCU | GSU |
|---|---|---|---|
| Chao1_index | 433.89±34.50 | 484.27±109.50 | 609.86±144.27 |
| ACE index | 434.55±37.08 | 479.06±108.76 | 605.47±146.49 |
| Shannon index | 3.75±0.23 | 3.81±0.15 | 3.97±0.98 |
| Simpson index | 0.07±0.04 | 0.05±0.02 | 0.08±0.06 |
| Coverage % | 99.92±0.06 | 99.87±0.06 | 99.92±0.06 |
Table 14.
The statistical table of the proportion of the level of dominant fungi in the rumen of the sample.
Table 14.
The statistical table of the proportion of the level of dominant fungi in the rumen of the sample.
| Item | CON | PCU | GSU |
|---|---|---|---|
| Neocallimastigomycota | 67.42±8.89 | 75.45±5.59 | 38.56±36.21 |
| Ascomycota | 20.09±7.36 | 12.40±0.78 | 36.40±21.76 |
| Basidiomycota | 4.53±0.84 | 2.79±1.77 | 10.05±6.62 |
| Mortierellomycota | 0.03±0.02 | 0.00±0.00 | 0.93±1.55 |
| Unclassified | 7.67±1.60 | 9.29±5.73 | 13.41±14.78 |
| Other | 0.26±0.29 | 0.06±0.05 | 0.65±0.57 |
Table 15.
Statistical table of the proportion of rumen dominant fungi in samples.
| Item | NUG | PCU | GSU |
|---|---|---|---|
| Orpinomyces | 18.57±8.08 | 17.76±12.14 | 14.82±14.86 |
| Piromyces | 19.32±14.62 | 15.84±14.02 | 9.84±10.62 |
| Anaeromyces | 13.10±2.56 | 19.24±13.57 | 3.51±3.26 |
| Cyllamyces | 8.11±5.73 | 8.09±5.45 | 3.84±2.46 |
| Caecomyces | 2.59±2.32 | 8.08±6.81 | 3.62±3.10 |
| Aspergillus | 6.27±4.34 | 2.66±0.81 | 3.50±2.88 |
| Pseudeurotium | 0.74±1.28 | 0.04±0.01 | 10.80±18.69 |
| Debaryomyces | 3.42±3.19 | 3.35±1.33 | 4.74±1.92 |
| Sporobolomyces | 1.56±0.48 | 0.82±0.66 | 1.71±1.84 |
| Aureobasidium | 1.86±0.89 | 1.16±0.67 | 0.66±0.58 |
| Neocallimastix | 0.40±0.39 | 0.88±1.06 | 2.00±3.41 |
Disclaimer/Publisher’s Note: The statements, opinions and data contained in all publications are solely those of the individual author(s) and contributor(s) and not of MDPI and/or the editor(s). MDPI and/or the editor(s) disclaim responsibility for any injury to people or property resulting from any ideas, methods, instructions or products referred to in the content. |
© 2024 by the authors. Licensee MDPI, Basel, Switzerland. This article is an open access article distributed under the terms and conditions of the Creative Commons Attribution (CC BY) license (http://creativecommons.org/licenses/by/4.0/).
Copyright: This open access article is published under a Creative Commons CC BY 4.0 license, which permit the free download, distribution, and reuse, provided that the author and preprint are cited in any reuse.


