
Submitted:
24 May 2023
Posted:
25 May 2023
You are already at the latest version
Abstract
Wheat and corn silages are widely used as ruminant feed in Israel due to their availability and cost-effectiveness. To ensure long-term preservation without compromising nutritional quality, effective methods must be employed. Inclusion of additives during harvest and ensiling can enhance efficiency and address preservation challenges. In the current study, the effects of microbial inoculum (MI) and urea on the chemical composition, amino acid profiles, aerobic stability, and in vitro digestibility of wheat and corn silages were investigated. Samples of wheat and corn were subjected to four treatments: control, MI, Urea, and a combination of MI+Urea. The treatments were ensiled in anaerobic conditions and opened after 1, 7, 14, or 28 days. Results showed that additives improved the quality parameters of wheat and corn silages. The inclusion of MI produced the most aerobically stable silages. The inclusion of urea in silages deteriorated aerobic stability. Additives improved in vitro cell wall carbohydrates digestibility in both silages and was the best when MI was combined with urea. These results imply additives could be incorporated in silages to enhance their nutritional value, aerobic stability and digestibility. Nonetheless, increased CP content with additives was not accompanied with parallel increase in amino acids content in corn silage.
Keywords:
Silage
; corn
; wheat
; microbial inoculum
; amino acids
; digestibility
1. Introduction
Ensiling is one of the best known successful preservation methods with minimal nutritional value loss [1]. This feed preservation method is dependent on several factors, the first important one before ensiling is the stage of maturity at which the silage material is harvested. The anaerobic ensiling conditions facilitate lactic acid production by lactic acid producing bacteria (LAB) that may occasionally be accompanied by other organic acids such as acetic acid. These acids are responsible for the decrease in pH and stabilizing the silage [2]. The contribution of short chain volatile fatty acids (VFAs; acetic, propionic acid and butyric acid) to silage acidity is negligible because of being weak acids and their relatively low concentration in silages. However, every acid has a unique organoleptic feature, which may be positive or negative in silages. For instance, acetic acid improves the aerobic stability of silages, propionic acid is implicated in improving the flavor of the silage whereas butyric acid is usually associated with bad odour indicative of activity of undesirable microorganisms during ensiling [3]. A rapid production of these acids minimizes nutrient loss. Moreover, chopping mechanism and dry matter (DM) content of ensiled material, transportation, particle size and sugars as well as any other supplements will influence the fermentation process and the quality of the silage [1,4].
A wide range of ensiling additives are available at the markets. The goals of these are mainly to reduce DM losses during the ensiling process, encourage a rapid drop in pH value, prolong the shelf life during aerobic exposure after opening the bunker/silo, and increase intake by ruminants [5]. Biological additives such as anaerobic bacteria inoculum are preferred on chemical additives [6].
The use of heterofermentative microbial inoculum (MI) also known as effective microorganisms (EM) is a technology that was developed by Professor Teruo Higa at the University of Ryukyus, Okinawa, Japan, in 1982 [7,8]. Microbial inoculum is a liquid preparation that contains beneficial bacteria (including LAB) in the form of yoghurt, grown on a medium of sugar cane molasses and water [7]. Microbial inoculum operates on the principle of competitive exclusion [9]. Bacteria produced in MI secrete materials that support life, health and rejuvenation including; vitamins, enzymes, antioxidants, amino acids and more according to [8,10]. By doing so, they create in their environment a positive and powerful presence that makes it difficult for unfavorable microorganisms to reside and thrive [10,11,12].
On the other hand additive such as urea provides available N to microbes during the ensiling process and hence may prevent proteolysis of plant material and may increase microbial protein [1]. Moreover, excess urea-N provides non-protein nitrogen (NPN) which is beneficial in ruminants’ rations since it is a major building block in the synthesis of amino acids and proteins by ruminal bacteria [13,14]. However, in order to be efficiently utilized, urea should be added to a high available energy forages with relatively low protein content such as corn in order to obtain an optimal synchrony between available energy and N. However, there is a draw back with the use of urea as a silage additive because it impairs the decline in pH which is vital in preserving the silage [14].
Corn and wheat are the major fodder crops in Israel used for silage making. Being a summer and winter crops, respectively allows a continues supply of high quality forage resources to high producing dairy cows rations. To overcome challenges such as, climate changes, aerobic stability after opening the bunker, minimize DM losses, and improve nutritional values, additives including MI and urea might be beneficial [15].
We hypothesized that the addition of MI and urea (combined or separately) would improve the ensiling process by enhancing rapid decrease of pH and maintaining it, improve aerobic stability and improve digestibility of wheat and corn silages. We also hypothesized that urea might increase the CP content and alter AAs profile by minimizing degradation of plants N and enhance bacterial protein synthesis.
2. Materials and Methods
2.1. Experimental Design
Prior to ensiling the forages, one-liter glass jars (equipped with a rubber band and lid that enable gas release only; Foxhome, Rehovot, Israel) were sterilized in an oven at a temperature of 120OC for 48 hours to kill any undesirable bacteria that would interfere with the ensiling process. The jars were packed with chopped corn forage, airtight sealed to simulate the anaerobic conditions in the silo. Following the challenges with the jars (tedious and difficult compaction), vacuum bags were used as a more viable and efficient option for ensiling forages. The method was approved in our laboratory as efficient as the glass jars and was used for preparing wheat silage as described below.
The wheat silages were packed into nylon bags and vacuum sealed using a vacuum machine (Kunba; model DZ-400/ZT, Kesem, Israel). The sealing of the vacuum bags was easier and faster, generated a 100% airtight environment and most importantly created uniformity in the compression of the ensiled material.
Wheat and corn forages were harvested at the right maturity period during the growing season from commercial fields that were meant to be ensiled. The harvested corn was collected at the end of August, in Nahalal, Israel (32° 41' 24" N, 35° 11' 48" E) while the harvested wheat was collected at the beginning of April, in Masu’ot Yitzhak, Israel (31° 42′ 12″ N, 34° 41′ 22″ E). As part of the harvest process, the forage was mechanically chopped to a length of 2-4 cm prior to ensiling.
The corn and wheat forages were divided into four treatments before ensiling. Control- where corn or wheat forage was ensiled without any additives. MI- a liquid microbial inoculum additive (supplied by EM-Zoo®, Israel), which was applied at a dosage of 1 liter per 1 ton of fresh matter according to the manufacturer’s instructions. Urea – an addition of 4 liters of liquid urea with a concentration of 21% N which was applied at a rate of 4L per 1 ton of fresh matter. MI+Urea- a combined treatment comprising both preparations, with the same dosages detailed as above.
Each treatment was mixed separately in an63 L electric concrete mixer (Karnaf, HCM650, Petah Tikva, Israel) for 10 minutes in order to homogenously mix the additives. This was followed by packing corn forage in glass jars and wheat in vacuum-sealed bags. Both the jars and vacuum-sealed bags were weighed and marked before forage packing. Approximately 1 kg of fresh matter was packed in the jars or vacuum-sealed bags. Weight after packing was also recorded. All treatments were ensiled at room temperature for 1, 7, 14 and 28 days (n=4 for each ensiling period).
2.2. Chemical Analyses of Silages
After opening the jars or vacuum-sealed bags, 100g of silage was sampled and immediately was agitated with 400ml of distilled water in a blender (Vitamix, model E310, Natanya, Israel). The filtrate was used for pH measurement using a pH meter (Satorius Ag-Gottingen, Germany). A portion of the filtrate was used for microbial analysis; enumeration of LAB using Rogosa SL Agar (Himedia, Mumbai, India) according to [16], enumeration of molds and yeast using Malt Extract Agar (Sigma-Aldrich, Rehovot, Israel) according to the detailed method described by [17]. The colonies were counted using a Colony Counter device (CLC-57, MRC, Holon, Israel). Other portions of the filtrate were stored at -20OC and later were used to volatile fatty acids (VFA) analysis [18] using hp gas chromatograph (model 5890A), Lactic Acid (LA) concentration using a calorimetric method [19].
The rest of silage samples after opening (day 1, 7, 14 and 28) were dried at 60OC for 48 hours, ground through a knife mill (Thomas-Willey Laboratory Mill, model 4, Philadelphia, USA) to pass through a 2mm screen. Samples were subjected to full chemical analysis. Absolute dry matter (DM) was determined by placing samples in an air-forced oven at 105˚C overnight. Ash and organic matter (OM) were determined by ashing in a muffle furnace at 600˚C for 3 hours. Ether extract (EE) was determined using the Soxhlet method with petroleum ether (30-40˚C; Merck, Rehovot, Israel) as solvent for 8 h. Crude protein content was measured using the Kjeldahl method with an automatic Kjeldahl machine (KjelMaster K-375-Buchi, Flawil, Switzerland)
Neutral detergent fiber (NDF; heat stable alpha-amylase was added to solution), acid detergent fiber (ADF), and hemicellulose analyses were also done using an Ankom machine (Ankom220 Fiber Analyser®, Macedon, NY, USA) as described by [20]. In vitro dry matter digestibility (IVDMD) and in vitro NDF digestibility (IVNDFD) assays were performed according to the protocol of [21]. Rumen fluid was withdrawn from two ruminally fistulated wether Assaf sheep which were maintained on standard ration containing 2.42 mega calories of metabolic energy, 12% CP per kg DM basis. Ration consisted 73% roughage feeds (wheat silage, clover hay, wheat hay), and the rest grains, minerals, and vitamins to satisfy the maintenance requirements according to NRC recommendations [22]. The use and procedures for the fistulated sheep was approved by the IACUC (AG-15544), in accordance with the Animal Safety Guidelines of the Hebrew University of Jerusalem.
Dry samples of silage materials of the 28 days were subjected to acid hydrolysis (n=4) to determine amino acids (AAs) content after grinding to pass a 1mm screen according to detailed protocol described by [23] including recovery test. The quantitative analysis of amino acids was carried out using the LC-MS/MS system which consisted of Nexera X2 UPLC (Shimadzu; Ontario, Canada) coupled to the QTRAP 6500+ mass spectrometer (Sciex; Toronto, Canada). Chromatographic separations were carried out using HILC-Z HPLC column (150×2.1 mm, 2.7µm, Agilent) employing linear gradient of acetonitrile/water with 100 mM ammonium formate. The mass spectrometer was operated upon positive ESI in MRM mode. Calibration samples containing 28 individual amino acids (purchased from Sigma-Aldrich; Rehovot, Israel) were prepared at concentrations from 5 ng/ml to 5000 ng/ml. The samples were spiked with a mixture of 20 isotopically labeled amino acids used as internal standards (purchased from Cambridge Isotopes; United Kingdom) at final concentration 100 ng/ml per sample. AAs profile was expressed as g/ 100 CP.
2.3. Aerobic Stability Assay
Samples (approximately 150g) for ensiling days 14 and 28 were incubated for 5 days at room temperature as described by [24]. At the end of the 5th day of aerobic exposure, the amount of CO2 emitted was calculated and later was used to calculate sugar loss. Samples of the 28 days silage were used for pH measurement and moulds and yeast enumeration.
2.4. Statistical Analysis
Data was exported from an excel sheet to JMP Pro® (Ver. 16.0.0, SAS Institute Inc., Cary, NC, USA) and subjected to a two-way ANOVA (additive, day of ensiling, and interaction). The data was further subjected to Dunnett’s test to compare the control to the additives treatments at p < 0.05. The data is presented as LSMeans and SEM.
3. Results
The chemical composition of the corn and wheat forage prior to ensiling is summarised in Table 1. Dry matter content of wheat forage was 31% while 44% for the corn vegetative material. The pH values measured on the green material was 5.5 and 6.5 for the wheat and the corn forages, respectively. Crude protein content was higher in corn plant material as expected compared to the wheat material. Corn forage had some advantage with the Hemicellulose content.

Table 1.
Chemical composition of the forages samples before ensiling on DM basis (except DM).
| pH | DM | OM | CP | NDF | ADF | Hemicellulose | |
|---|---|---|---|---|---|---|---|
| Corn forage | 5.50±0.08 | 30.6±0.48 | 95.7±0.24 | 8.7±0.65 | 52.2±2.46 | 28.4±1.62 | 23.9±0.85 |
| Wheat forage | 6.49±0.01 | 43.8±0.25 | 93.3±0.18 | 9.7±0.45 | 57.2±1.01 | 29.5±0.54 | 27.7±0.53 |
3.1. pH of Wheat and Corn Sialge
Results of wheat silage pH showed that there was an interaction effect between treatment and days of ensiling (P< 0.0001; Table 2). The main reason for this was the inconsistent changes (drop) of the pH values between days and treatments effects. Results also demonstrate that a steep drop of pH happened between day 1 and 7 and milder changes continued to 28 days of ensiling (P< 0.0001). On average lowest pH values were recorded in the MI treatment followed by control, Urea, and MI+Urea. At 28 days of ensiling pH values differed from the control (3.84) being lowest for MI (3.73), intermediate for MI+Urea (3.90) and highest for Urea (3.93).
Looking at the corn silage values (Table 2) there was an interaction between treatment and days of ensiling (P< 0.0047). This mainly happened because changes of pH values in MI treatment showed a mild increase up to 28 days (3.7 at day 7 vs. 3.9 at day 28) in contrast to the rest of treatments, which showed a similar value to day 7. Similar to wheat silage the main drop of pH values happened between day 1 and 7, however baring in mind that that values of original material were dramatically different (Table 1). At day 28, compared to control, pH values were highest in MI treatment (3.97 vs. 3.68).
3.2. Temperature of Wheat and Corn Silage
Temperature of wheat silage was different among treatments, lowest in control and highest in Urea and MI+Urea (P< 0.0087; 21.0, 21.4 and 21.7˚C for control, MI and both Urea and MI+Urea, respectively; Figure 1a. Temperature was as well different among days of ensiling with the highest at day 7 and lowest at day 14 (P< 0.0001; 21.6, 22.2, 20.8 and 21.2˚C for days; 1, 7, 14 and 28, respectively). Interaction between treatment and days of ensiling (P< 0.0292) existed, mainly because of the behaviour of temperature drop in the control compared to the rest (Figure 1a). It’s worth noting that the temperature differences in wheat silage were less than 1˚C.
Corn Silage had an inverse trend for treatment, highest temperature was recorded in control and lowest in MI+Urea (P< 0.0001; 27.4, 27.8, 28.0 and 28.2˚C for MI+Urea, Urea, MI and control, respectively; Figure 1b. However, days of ensiling had a trend similar to wheat silage with the highest temperature recorded on day 1 and lowest on day 28 (P< 0.0037; 27.4, 26.8 and 25.3˚C for 1, 7, 14 and 28 days, respectively). It is also worth mentioning that the temperature was between 3 to 10O C higher in corn than in wheat silage (seasonal differences).
3.3. In Vitro Digestibility of Wheat and Corn Silage
3.3.1. In Vitro DMD of Wheat and Corn Silage
An interaction of day by treatment effect existed on IVDMD of wheat silage. Mainly this effect correlated to the behaviour of IVDMD of control compared to the rest of treatments (Table 3). In the control treatment the IVDMD increased by time (57.2 to 61.7%) while the rest of treatments decreased by days of ensiling. However, at 28 days of ensiling Urea treatment was the lowest compared to control and other treatment (52.6 vs. 57.6%). The main effect of treatment was significant on IVDMD and appeared to be the highest in control and lowest for urea and MI+Urea, and intermediate for MI (P< 0.0058; 58.4, 56.7 , 55.1 and 54.8% for control, MI, MI+Urea and urea, respectively; Table 3). Days in ensiling did not affect the IVDMD.
Corn silage, on the other hand, IVDMD was affected by the treatment being highest in the control and MI and lowest for Urea and MI+Urea (P< 0.006; 58.4 vs. 49.2%; Table 3). At day 28 of ensiling Urea treatment differed from the control and was lowest among treatments (45.9 vs. 54.1%).
3.3.2. In vitro NDFD of wheat and corn silage.
Interaction effect of treatment by days of ensiling was observed on IVNFD in wheat silage. This existed because in general, days negatively affected IVNDFD, however this was only true during all days in MI treatment. The drop in IVNDFD was not consistent with the rest of treatments compared to MI. For example, in MI+Urea IVNDFD dropped down to day 14 and then was increased toward 28 days (42% vs. 45%). In Urea treatment, between day 7 and 14 there was an increase, and then steep drop toward day 28 (42% vs. 44% vs. 40%, respectively). Additives increased IVNDFD in wheat silage with the highest values measured in MI and lowest in control treatment (P< 0.0001; 44.5, 43.9 , 42.2 and 40.1% for MI, MI+Urea, Urea and control, respectively; Table 4). IVNDFD decreased with increase in ensiling days (P< 0.0014; 44.0, 42.6, 42.4 and 41.6% for day 1, 7, 14 and 28, respectively. At 28 days in ensiling IVNDFD was highest in MI+Urea compared to control and the rest of treatments.
Similar to wheat silage, corn silage exhibited interaction effects of treatment by days of ensiling on IVNDFD (Table 4). This existed because inconsistency of treatments effects during the ensiling period. For example MI+Urea and Urea almost did not affect the values of IVNDFD over time. however, in the control and MI treatments there was a decrease in the values especially after day 7 through 28. Nonetheless, the main effect of treatment revealed the highest values were for MI+Urea and Urea (47%) compared to lower values (40%) in control and MI. Corn silage IVNDFD generally decreased with days of ensiling. It was highest at day 7 and lowest at day 14 (P< 0.0368; 44.8, 43.6, 43.4 and 42.5% for day 7, 1, 28 and 14, respectively). At day 28 of ensiling MI+Urea and Urea treatments were the highest compared to control. Compared to control values IVNDFD of corn silage was highest in MI+Urea through all the days.
3.4. Volatile Fatty Acids Cocentration of Wheat and Corn Silage
Table 5 describes the concentration of individual and total VFA in wheat silage. Total VFA did not differ between treatments and averaged 2.16g/ 100g DM. However, propionic acid concentration decreased with days of ensiling and stabilized after day 14 (Table 5). Butyric acid could barely be detected.
For corn silage, additives treatment and days in ensiling increased ethanol concentration (Table 6). It was highest in MI+Urea compared to the other treatments (P< 0.0001; 10.50, 5.12, 3.98 and 3.61 g/ 100g DM; for control, MI+Urea, urea, MI and, respectively; Table 6).
Total VFA production in corn silage was affected by treatment and days of ensiling being highest at day 28 and lowest at day 7 (P< 0.0001; 3.53, 2.94, 2.49 and 2.14g/100g DM for day 28, 14, 7, and 1, respectively). However, at 28 days concentrations of total VFA were similar among treatments. It is worth mentioning that individual VFAs such as propionic and acetic acids were affected by treatments and days of ensiling (Table 6) and a noticeable increase by days. Nonetheless, at day 28 of ensiling acetic acid concentration was similar to all treatments and averaged 3.21g/ 100g DM) and propionic acid was highest in MI treatment. An interaction affect existed on propionic acid because in MI treatment comparing to others, it continues to increase while in the rest showed a constant concentration.
3.5. Lactic Acid concentration of wheat and corn silage
The concentration of LA in wheat silage tended to be statistically different for additive treatment; the additives increased LA, control had the lowest and MI had the highest concentration (P< 0.0772; 1.0, 1.2 and 1.3 g/100g DM for control, MI+Urea, Urea and MI, respectively; Figure 2a). LA increased with ensiling days (P< 0.0001; 0.2, 1.2 1.5 and 1.9 for days; 1, 7, 14 and 28, respectively).
For corn silage LA concentration was lowest in MI and highest in Urea additive treatments (P< 0.0084; 2.2, 2.6, 2.7 and 2.8 for MI, MI+Urea, control and urea, respectively). Corn silage also tended to be statistically different for ensiling days, it increased with ensiling days with the lowest concentration at day1 and highest at both day 14 and 28. (P< 0.0769; 2.3, 2.6 and 2.7g/100g DM for 1, 7 and both day 14 and 28, respectively; Figure 2b).
3.6. Aerobic Stability of Wheat and Corn Silage
Additives reduced dramatically CO2 emissions in wheat silage. CO2 emission was highest in control (more than 7 fold) compared with MI (Table 7). CO2 emission increased to almost twice with ensiling days (P< 0.0217; 20.5 and 12.3g/kg DM for day 28 and 14, respectively). CO2 emission was significantly different between treatments and day of ensiling, with lower emissions on day 14 than day 28 (P< 0.0011; Figure 3a; Table 7). The interaction effect that existed can be explained by the behaviour of CO2 release from control and MI treatments which was linear between days 14 and 28 while in MI+Urea and Urea was flat (Figure 3a). The calculated sugar loss equivalent also followed a similar trend as the CO2 emission for additives treatment. At day 28 the aerobic exposure caused significant loss of sugars in the control and Urea treatments (25.2g) compared to MI and MI+Urea (2.75g). Moulds count and pH value after 5 days of aerobic exposure at 28 days of ensiling (Table 7) for all treatment additives were significantly smaller than the control. The pH values of the exposed silage with additives were on average 4.37 compared to 7.1 in the control and lowest for (3.9) for the MI treatment.
The aerobic exposure of corn silage showed a different phenomenon than the wheat silage (Table 7 and Figure 3). CO2 emission was the lowest for MI at 28 days of ensiling and all treatments were differed from the control being highest for MI+Urea. Days in ensiling decreased CO2 production (P< 0.0001) and at 28 days in silage all treatments had a similar value (41.1g/ kgDM). The same trends observed for the calculated sugar losses. Moulds and pH did not differ between treatment afer exposure for 5 days in corn silage at 28 days of ensiling and averaged 9.2 (Log CFU/ gDM) and 4.0, respectively.
3.7. Chemical Composition of Wheat and Corn Silage
3.7.1. Crude Protein Content of Wheat and Corn Silage
Crude protein content of wheat silage was different among treatments, with the lowest content in control and MI, and highest in Urea and MI+Urea (P< 0.0005; 9.0, 9.2, 9.6 and 9.7% for control, MI, Urea and MI+Urea, respectively; Table 8). At day 1 and 7, both Urea and MI+Urea were higher in CP content compared to control. However, at day 28 all treatments were similar.
Interaction effect of treatment by days of ensiling existed on CP content in corn silage (Table 8). This interaction mainly was caused by the different behaviour within treatments of ensiling process. For example both treatments involved the addition of urea began with higher CP content and while in Urea treatment CP content was constant during the days of ensiling in MI+Urea CP content increased at day 28 to reach 12.5%. On the other hand, in the control treatment CP content increased up to day 14 and then decreased at 28 days of ensiling. In MI treatment CP content increased by days of ensiling and reached 10.5% at day 28 compared to 8.35% at day 1. In general, results of corn silage showed that CP was different among treatments, was lowest in control and highest in MI+Urea (P< 0.0001; 8.4, 9.5, 11.0 and 11.1% for Control, MI, Urea and MI+Urea, respectively). Crude protein content had statistical differences among days of ensiling with the lowest content at day 1 and highest at day 28 (P< 0.0001; 9.5, 9.9, 10.1 and 10.5% for days; 1, 7, 14 and 28, respectively). Compared to control all treatments were higher in CP content during the ensiling days.
3.7.2. Cell Wall Carbohydrates and Other Parameters of Wheat and Corn Silage
All detailed data on cell wall carbohydrate content of both silages (NDF, ADF, hemicellulose) and DM content are presented in the supplementary material; Figure S1, Tables S1 and S2. In general, wheat silage differed in NDF and ADF among treatments with highest value in the control compared with the rest (P< 0.005; 59.4 vs. 58.0% and 29.2 vs. 28.2%, respectively; Figure S1). Days of ensiling caused an increase in NDF and ADF content and was lowest at day 1 (P< 0.0001; 56.4 vs. 59.1%, and 27.6 vs. 28.8%, respectively; Figure S1). Hemicellulose content was similar (P< 0.07) among treatments and averaged 29.7%; Table S1. However, during the ensiling process hemicellulose content increased up to day 7 and then decreased to reach the values of day 1 (Table S1). DM content of silages at 28 days of ensiling was 42.7% and decreased during ensiling (Table S2).
Corn silage NDF, ADF, hemicellulose, and DM contents differed between treatments (Figure S1, Tables S1 and S2). NDF content was lower in Urea treatment compared to the rest (P< 0.0001; 48.4 vs. 51.6%). During ensiling NDF content interchanged and was highest at 15 day (P< 0.0002; 52.8%) and then at 28 days it stabilized to be 50.1%. Moreover, this behaviour was not similar within treatments and caused an interaction effect where MI and Urea treatments showed an increase toward 15 days and drop again towered 28 days while the control and MI+Urea showed constant values through the days. On the other hand, ADF content differed between treatment and was highest in the control (P< 0.0001; 33.5%), lowest in Urea (28.6%) and intermediate in MI and MI+Urea (30.6%). Days of treatments increased (P< 0.0001) ADF content and reach average value of 31.3% compared to 30.0% at day 1. The increase in ADF content behaviour differed between treatments during the ensiling days and caused interaction effect (P< 0.0001). While in the control ADF content increased, in the MI+Urea it stayed stable. In Urea and MI treatments it increased up to 15 days and then decreased toward day 28 (Figure S1). Hemicellulose content decreased (P< 0.0001; Table S1) during ensiling and was highest at day 1 (22.1%) lower during the rest of ensiling days (19.4%). Hemicellulose content was lowest (P< 0.0001) in control (18.6%) compared to 21.0% to the rest. An interaction effect of treatment by days of ensiling existed similar to NDF and ADF. DM content decreased (P< 0.0001; Table S2) during ensiling and at 28 days it averaged 30.0%. Treatments had significant effect of DM content (P< 0.0001) being lowest in the control and interaction existed with similar pattern as for the cell was carbohydrates.
3.8. Amino Acids Profile of Wheat and Corn Silage
Amino acids profile in wheat silage was similar between treatments (Table 9). However, Methionine and Lysine contents (expressed as a percentage of essential AAs; EAAs) was affected by additives. Methionine profile was the lowest in MI+Urea and differed from the control being 1.31% compared to 2.31% in the rest. On the other hand, Lysine profile was lowest in Urea treatment compared with other treatments (6.06 vs. 6.59%). Considering the AA acids measured, the profile of total AA (TAA) as % of CP was similar among treatments. However, MI+Urea treatment numerically had a higher number compared to others.
Amino acids analysis for corn silage (Table 10) showed in general that additives caused a decrease in profile of some essential AAs (EAAs) (lysine, histidine, valine and phenylalanine), the lowest being consistently in MI+Urea, the variation between control (highest) and MI+Urea (lowest) ranged from 0.44 to 1.44 % units Table 10. Similar trend was also observed some non-EAAs (NEAAs; serine, glutamic acid, glycine, tyrosine and aminobutyric acid) with a difference between 0.59 to 2.16% units. Profile of TAA in wheat silage tended to (P< 0.053) to be lowest in MI+Urea, highest in control, and intermediate in MI and Urea treatments. When compared to control, MI+Urea differed and was significantly lower.
4. Discussion
Silage making is considered the best way to ensure continuous supply of high quality forage all year around in intensive farming systems such as dairy cows. Winter crops such as wheat and corn as representative of summer crops, in Israel are the main sources of high quality roughages for dairy farming. Hence, to ensure that in the current study we investigated the effect of heterofermentative life culture additive (MI), urea, and their combination on the quality and dynamic of fermentation. We further studied the effect of the above on aerobic stability which is detrimental during the stage of feeding practices and on the quality of the CP (i.e. AAs profile).
4.1. Dry Matter of Forages and pH Value of Silages
Dry matter content of wheat forage prior to ensiling were above the maximum value recommendation and the corn forage were within the range [25,26]. A 44% DM in this study in Israel is considered high, but can still be ensiled. High DM content could be related to later harvest relative to stage of maturity (milk to dough; [26] or agronomical and weather circumstances. Ensilaging forage comprising a DM content lower than 25% may result in undesirable fermentation products [27] whereas a content higher than 50% is defined as difficult to ensile hindering efficient fermentation [25]. The DM content of all silages were maintained within the original forages (Table S2). At 28 days, in wheat silage the DM content in Urea treatment was higher than the control and in corn silage Urea and MI+Urea differed from the control. This could be attributed to a more efficient utilization of the nutrients when additives were involved during the fermentation process. Additionally, the supplements may contribute to DM content [28]. However, caution must be taken when relating to DM content because this study was conducted in laboratory setting which may not mimic large scale silos or bunkers [29].
The pH is one of the main indicators of the silage quality and success of anaerobic fermentation and sufficient organic acids production mainly LA [29,30]. The acidic pH is responsible for preserving the silage by preventing the development of undesired microorganisms which may lead to silage deterioration [31]. In all treatments for both corn and wheat silages at 28 days of ensiling the pH values were below 4 which is desired for excellent preservation. This further indicate that both forages had enough water-soluble carbohydrates content and a weak buffering capacity [26]. However, in corn silage a sharp drop in pH was observed after one day in fermentation and remained almost constant up to 28 days. These dynamics were similar to both silages reported elsewhere [26]. In corn silage the sharp drop in pH within one day could be attributed to the high water soluble carbohydrates that make corn easy to ensile [32,33]. The pH in the MI treatment was highest in corn and lowest in wheat silages compared to others at day 28. This differences between the two silages mimics the dynamics of developments of hetero-fermentative LAB in the MI treatment, availability of water-soluble carbohydrates, and the production of LA and acetic acid which become pronounced in later stages of the fermentation process [26]. In hetero-fermentative additives LA is converted to acetic acid and 1,2-propanediol [34] which might affected the pH values depending on the fermentation dynamics. The higher pH values observed in Urea and MI+Urea treatments at day 28 of fermentation in wheat silage is reflection of the above mentioned dynamics together with the effect of urea prolonging the fermentation duration which could hamper the rapid decrease of pH [35].
It should be mentioned that the fermentation dynamics after 4 weeks of fermentation change and might affect the pH values of both silages in large scales farming conditions [26].
4.2. Temperature Dynamics in Silages
Silage temperature is a combined reflection of the environment and microbial activity dynamics. It is believed that temperature of silages stabilizes when fermentation mature and reach a steady state where no further major microbial activities occurs and stable environmental conditions. Hence, changes in silage temperatures herein reflect the differences between the forages, treatments, and season (winter vs. summer).
Temperature in the control treatment of wheat silage dropped between day 7 and day 14 and remained at 21˚C while other treatments with additives remained higher. The increase in temperature could be attributed to increased activity of microorganisms that generate heat during the early stages of the fermentation [2,10]. A higher temperature in additives treatments (22OC) relative to the control (21OC) is still within the desirable optimal range (25-40OC), bearing in mind the microorganisms have a wider temperature range to thrive 5-50OC [36,37]. The temperature was generally lower and almost levelled after 14 days of ensiling which could be attributed to conditions that hamper microbial activity and stability [1]. This is vital in reducing loss of nutrients such as proteins [2].
In corn silage (summer crop), the temperatures were highest after 1 day in ensiling and then was reduced and stabilized. Stabilized temperature and silage maturation is essential to minimize nutrient losses as mentioned above. Despite having higher temperatures (28OC), all treatments in corn silages were within the optimal range (25-40OC) and similar to the temperatures in silos [2].
4.3. In Vitro Digestibility of Silages
The in vitro experiments were conducted to evaluate the digestibility of DM and the NDF of the silages and give some comparative insight on the effect of additives on nutritional values. Cell wall carbohydrates digestibility is one of the parameters that may mirror the effect of the biological activity (hydrolysis and synthesis) of epiphytic and inoculated bacteria. In general, the in vitro digestibility for silages at 28 days in all treatments were within the range values summarized elsewhere [26,38].
During ensiling, additives decreased in vitro digestibility of DM and NDF compared to control in wheat silages, which had a mild increase. Different dynamics in digestibility values within treatments was observed with additives. During the first 4 weeks of ensiling the dynamics of the biological processes are considered not stable and takes between one to 6 months to stabilize [26]. However, at 28 days of ensiling the IVDMD were lower in additive treatments which may be as a result of intensive fermentation process that utilized fermentable nutrients including hemicellulose hydrolyses which converts into pentoses reducing the NDF content [1]. These results contradict with the findings of [38], where comparison between Lactobacilli inoculum and control did not show differences in digestibility of wheat silage. The IVNDFD of wheat silage at 28 days was highest in MI+Urea compared to other treatments, which imply synergistic effect of supplying available source of N that probably prompt the hydrolysis of hemicellulose as mentioned above and increased digestibility of NDF.
For corn silages, MI did not affect IVDMD or IVNDFD in agreement with [38]. Looking at day 28 results of both Urea and MI+Urea treatments on IVDMD and INNDFD gives an interesting deeper insight of the treatment effects on the dynamics of fermentation that occurred. Both treatments decreased the IVDMD which emphasize the utilization of available nutrients and further the addition of urea supplied available N encouraging microbial growth decreasing overall ruminal digestibility of DM [39,40]. However, IVNDFD in these treatments increased by 24% compared to the control. This show the effects of intensive fermentation in corn silage that occurred when supplying available nutrients (mainly N) and MI which further hydrolyzed cell wall components and bounds to be readily available to ruminal microbes [28,38].
4.4. Cell Wall Carbohydrates Contents of Silages
The cell wall carbohydrates contents at 28 days of ensiling of wheat silage had minor differences among the treatments. However, the dynamics of hemicellulose content (as discussed above) indicated that hydrolysis of NDF happened and released hemicellulose (up to day 7) and then was used to support bacterial fermentation and release organic acids and thus loss of DM which might mask the actual contents of cell wallcomponents [31]. These dynamics happened in all treatments despite the anticipation that MI treatment would decrease NDF content by hydrolysis of the hemicellulose for better bacterial fermentation [25].
For corn silages, the dynamics and changes in ADF and hemicellulose contents were pronounced mainly at day 1 and 7 of ensiling. It was observed on day 1 that hemicellulose content was increased (released) especially in Urea treatment and on day 7 all additives were higher than the control. This was followed by higher IVNDFD in both Urea treatments. At day 28 Urea and MI+Urea had higher IVNDFD while MI alone was similar value to control. This emphasizes the effect of urea on hydrolysis and dissociation of cell wall carbohydrates as was suggested by [28,41]. On the other hand, urea might also improve enzymatic bio-hydrolysis by supplying readily available nitrogen to enhance fermentation as was discussed earlier. However, this claim was not supported by the profile of CP and AAs (see later discussion).
4.5. Lactic and VFAs in Silages
Lactic and VFAs are by products of fermentation during ensiling which are essential for preserving silages and decreasing the pH values. Mainly acetic, propionic and butyric acids each having different effects on silages. Heterofermentative cultures (such as those in the MI supplement) ferment pentoses into lactic and acetic acid [42]. Acetic acid has a special interest because it possesses an antimycotic activity, that together with lactic acid prevents the development of fungi and molds under aerobic conditions (see later discussion).
In wheat silages, despite the absence of significant differences, total VFAs (mainly acetic acid) were 17% higher in all additives treatments compared to control at 28 days of ensiling. Lactic acid increased by days and in all the additive treatments, was highest in MI treatment at 28 days, and led to the lowest pH. These results are in agreement with similar findings who showed that the pH of wheat forage that was ensiled with Lactobacilli cultures (homofermentative or heterofermentative) had lower pH than the control [43,44].
On the other hand, organic acids production in corn silages were affected by days of ensiling and treatments. Total VFAs production at 28 days were 70-90% higher among treatments compared to wheat silage mainly because of acetic acid with notable production of propionic and butyric acids. In MI treatment propionic acid was the highest while acetic acid, total VFAs, and lactic acid were the lowest. The later were similar to results of wheat silage. This could be as a result of the rapid proliferation of MI and drop in pH causing depression in the fermentation rate. Propionic acid, is believed to be responsible for flavour [3] was 10 times more in the MI than in the other treatments. These results are similar to a study conducted by [45]. The addition of urea is recommended in energy-rich silage such as corn, enhancing fermentation depicted by high lactic acid concentration [46]. Hence, both Urea and MI+Urea had higher total VFAs and lactic acid similar to [28,47] who showed that urea hindered the pH decline in corn silage despite an increase in lactic acid production.
That being said, it should be remembered that production of lactic and acetic acids continues with days of fermentation and peaks after one or 3 months depending on the forage origin and maturity [26].
4.6. Aerobic Stability of Silages
Aerobic stability success is actually a multifunction expression of silage firmness, fermentation organic acids, other functional by products, and independent factors such as environmental temperature.
In general, the inclusion of MI in forages produced the most aerobically stable silages indicated mainly by lower CO2 emission. In wheat silage, stability was confirmed by all parameters measured e.g. lower pH value, CO2 emissions, and molds CFU relative to other treatments. The least stable silages were the control and MI+Urea. Corn silage on the other hand, all treatments had the same pH values and CFU of molds.
The inclusion of urea in silages compromised aerobic stability of silages. This might happened by means of supplying substrate to aerobic microorganisms and buffering capacity by supplying ammonium as bio-hydrolysis by-product that might increase the pH levels and prompt molds activity [1,48]. Concentrations of lactic and acetic acids are considered the most pronounced factors to affect aerobic stability especially when heterofermentative Lactobacilli inoculum is added to silages [3,30,49]. The MI additive is considered a heterofermentative inoculum and from this point of view, our findings agree with several studies in which heterofermentative Lactobacilli added to wheat silages improved aerobic stability [43,49,50]. However, the concentration of acetic acid was lower in MI in both silages at 28 days of fermentation suggesting that other factors might be involved in aerobic stability performances. According to Higa the MI preparation contains additional microorganisms other than Lactobacilli, whose proliferation leads to the production of antioxidant substances [10,51]. Their amount and influence were not examined in this study. However, it is apparent that they might have played a major role in improving the aerobic stability in the MI treatments despite the lesser amounts of lactic and acetic acids in these treatments relative to the other treatments.
4.7. Crude Protein and AA Content in Silages
Crude protein and AA contents were measured to give a deeper insight on the effect of additives on true CP and NPN fraction. The AA analysis was performed after hydrolysis on dried silages at 28 days thus the results reflects both free and bound AA contents. That being said, it should be noted that most of AA in silages are recovered in the free form [52,53]. In general the dynamics by day of CP content in wheat silages during ensiling was the same within treatments however, additives influenced the CP content and was higher by 6% in Urea and MI+Urea than in the control and MI alone. However, this differed in the corn silages and CP contents were influenced both by days of ensiling and treatments. At day 28 of ensiling MI+Urea had 56% more CP and both MI and Urea treatments had extra 35% than the control. This phenomena can be explained by the differential dynamics of microbial activity in wheat and corn silages which was very rapid in corn compared to wheat (rapid vs. slow drop in pH). Slower drop in pH during the first 7 days of ensiling might have allowed more endogenous plant and microbial enzymatic activity including urea and protein hydrolysis in wheat silages compared to corn [5,41,53] hence, lower CP content. Some of the plant enzymes function at higher pH environment (pH 7-8; [53]). However, at later stages of ensiling when pH was lowest in both silages, there was an advantage for CP content in corn silage probably because of intact urea and bio-synthesis [1,48]. However, the latter was not supported by the profile of TAAs in corn silage.
Individual and total AA profile in wheat silage were similar among treatments. Total AAs profile averaged 60% of CP which is in line with other findings [52,53,54]. Lysine and methionine profile relative to total EAA was lowest in Urea and MI+Urea, respectively which might imply extensive metabolism (e.g. hydrolysis or/and synthesis) of microbial communities in silages [52]. Total AA content in corn silages was the lowest in the MI+Urea treatment (52%) compared to 65% for others. Hence, the actual extra CP content in MI and Urea treatments were not as a results of protein biosynthesis confirming our previous conclusion related to the rapid fermentation effect. It further strengthen the conclusion that in MI+Urea the extra CP content originated from urea (NPN) which remained intact in corn silage. Moreover, the negative significant effect of additives on some of the essential and non-essential AA profile in corn silage is in line with our conclusive understanding that there were no microbial biosynthesis of CP in silages as a result of additives. Whether there is an advantage off the effect of this extra CP on growth or production performances for ruminants are beyond the scope of this study, and remains yet to be determined in vivo.
5. Conclusions
In general additives in this study improved the quality parameters of wheat and corn silages. This was done by improving the fermentation process and producing organic acids. The inclusion of MI produced the most aerobically stable silages indicated mainly by lower CO2 emission and pH values especially in wheat silage. The inclusion of urea in silages compromised aerobic stability. Neither of the additives affected the true CP content of silage. However, higher CP content was observed in all additive combinations in corn silage. This addition of NPN might be useful in ruminants’ rations however, caution must be taken with access N in high producing ruminants. Additives improved IVNDFD in both silages and was the best when MI was combined with urea. This happened because of partial hydrolysis of cell wall carbohydrates namely hemicellulose and was better pronounced in corn silage.
Supplementary Materials
The following supporting information can be downloaded at the website of this paper posted on Preprints.org, Table S1: The effect of additives and ensiling days on Hemicellulose content of wheat and corn silage, Table S1: The effect of additives and ensiling days on DM content of wheat and corn silage, Figure S1: a. The NDF content of wheat silage with additives treatment at various days of ensiling; b. The NDF content of corn silage with additives treatment at various days of ensiling; c. The ADF content of wheat silage with additives treatment at various days of ensiling; d. The ADF content of corn silage with additives treatment at various days of ensiling.
Author Contributions
Conceptualization, P.W., I.P., and S.J.M.; methodology, P.W., I.P., C.S., J.B.A., and H.T.; software, P.W.; validation, S.J.M.; formal analysis, P.W., I.P., and C.S.; investigation, P.W., and I.P.; resources, S.J.M., and H.T.; data curation, P.W., AND I.P.; writing—original draft preparation,P.W., and I.P.; writing—review and editing, S.J.M; visualization, P.W., and I.P.; supervision, S.J.M.; project administration, S.J.M.; funding acquisition, S.J.M. All authors have read and agreed to the published version of the manuscript.
Funding
This research received no external funding.
Institutional Review Board Statement
All procedures involving animal experiments were approved by the IACUC of the Hebrew University of Jerusalem (ethical approval number AG-14102).
Informed Consent Statement
Not applicable.
Data Availability Statement
supporting data of this research will be available on request from the corresponding author.
Acknowledgments
The authors thank EM-ZOO® Israel for donating the heterofermentative inoculum and urea for the project.
Conflicts of Interest
The authors declare no conflict of interest.
References
- Bolsen, K.K.; Ashbell, G.; Weinberg, Z.G. Silage fermentation and silage additives - Review. Asian-Australas. J. Anim. Sci. 1996, 9, 483–494. [Google Scholar] [CrossRef]
- Schroeder, J.W. Silage Fermentation and Preservation; 2004; pp. 1–8.
- Seglar, B. Fermentation analysis and silage quality testing. In Proceedings of the Minnesota Dairy Health Conference; University of Minnesota: Minneapolis, MN, USA, 2003; pp. 119–136. [Google Scholar]
- 4. Pitt. Silage and Hay preservation, 1: Agriculture, and Engineering Service, 1990.
- Charmley, E. Towards improved silage quality – A review. Can. J. Anim. Sci. 2001, 81, 157–168. [Google Scholar] [CrossRef]
- Weinberg, Z.G.; Muck, R.E. New trends and opportunities in the development and use of inoculants for silage. FEMS Microbiol. Rev. 1996, 19, 53–68. [Google Scholar] [CrossRef]
- Higa, T.; Parr, J.F. Beneficial and effective microorganisms for a sustainable agriculture and environment; International Nature Farming Research Center Atami: 1994; Volume 1.
- Higa, T.; Wididana, G. The concept and theories of effective microorganisms. In Proceedings of the Proceedings of the first international conference on Kyusei nature farming.; pp. 1991118–124.
- Hardin, G. The Competitive Exclusion Principle: An idea that took a century to be born has implications in ecology, economics, and genetics. Science 1960, 131, 1292–1297. [Google Scholar] [CrossRef] [PubMed]
- Higa, T. The technology of effective microorganisms–Concept and philosophy. In Proceedings of the Proceedings of a seminar on the application of effective microorganisms (EM) techniques in organic farming, organised by the International Society of the Royal Agricultural College; 2001. [Google Scholar]
- Higa, T. Kyusei nature farming and environmental management through effective microorganisms–the past, present and future. In Proceedings of the Seventh International Conference on Kyusei Nature Farming, Christchurch, New Zealand; 2003. [Google Scholar]
- Higa, T. Effective microorganisms–A holistic technology for humankind. In Proceedings of the Proceeding of Fix International Conference on Kyusei Nature Farming; 1999; pp. 19–28. [Google Scholar]
- Cherdthong, A.; Wanapat, M. Development of urea products as rumen slow-release feed for ruminant production: A review. Aust. J. Basic Appl. Sci. 2010, 4, 2232–2241. [Google Scholar]
- Bentley, O.G.; Klosterman, E.W.; Engle, P. The use of urea to increase the crude protein content of corn silage for fattening steers. 1955.
- Elferink, S.; Driehuis, F.; Gottschal, J.C.; Spoelstra, S.F. Silage fermentation processes and their manipulation. FAO Plant Prod. Prot. Pap. 2000, 17–30. [Google Scholar]
- Rogosa, M.; Mitchell, J.A.; Wiseman, R.F. A selective medium for the isolation and enumeration of oral and fecal lactobacilli. J. Bacteriol. 1951, 62, 132. [Google Scholar] [CrossRef]
- Ashbell, G.; Pahlow, G.; Dinter, B.; Weinberg, Z. Dynamics of orange peel fermentation during ensilage. J. Appl. Bacteriol. 1987, 63, 275–279. [Google Scholar]
- Erwin, E.; Marco, G.J.; Emery, E. Volatile fatty acid analyses of blood and rumen fluid by gas chromatography. J. Dairy Sci. 1961, 44, 1768–1771. [Google Scholar] [CrossRef]
- Barker, S.; Summerson, W.H. The colorimetric determination of lactic acid in biological material. J. Biol. Chem. 1941, 138, 535–554. [Google Scholar] [CrossRef]
- Van Soest, P.v.; Robertson, J.B.; Lewis, B.A. Methods for dietary fiber, neutral detergent fiber, and nonstarch polysaccharides in relation to animal nutrition. J. Dairy Sci. 1991, 74, 3583–3597. [Google Scholar] [CrossRef]
- Tilley, J.; Terry, d.R. A two-stage technique for the in vitro digestion of forage crops. Grass Forage Sci. 1963, 18, 104–111. [Google Scholar]
- 22. NRC. Nutrient requirements of small ruminants: Sheep, goats, cervids, and new world camelids.
- Tagari, H.; Bergman, E. Intestinal disappearance and portal blood appearance of amino acids in sheep. J. Nutr. 1978, 108, 790–803. [Google Scholar] [CrossRef] [PubMed]
- Ashbell, G.; Weinberg, Z.; Azrieli, A.; Hen, Y.; Horev, B. A simple system to study the aerobic determination of silages. Can. Agric. Eng. 1991, 34, 171–175. [Google Scholar]
- Yitbarek, M.B.; Tamir, B. Silage Additives: Review. Open J. Appl. Sci. 2014, 04, 258–274. [Google Scholar] [CrossRef]
- Weinberg, Z.; Chen, Y. Effects of storage period on the composition of whole crop wheat and corn silages. Anim. Feed Sci. Technol. 2013, 185, 196–200. [Google Scholar] [CrossRef]
- Henderson, N. Silage additives. Anim. Feed Sci. Technol. 1993, 45, 35–56. [Google Scholar]
- Demirel, M.; Yilmaz, I.; Deniz, S.; Kaplan, O.; Akdeniz, H. Effect of addition of urea or urea plus molasses to different corn silages harvested at dough stage on silage quality and digestible dry matter yield. J. Appl. Anim. Res. 2003, 24, 7–16. [Google Scholar] [CrossRef]
- Weinberg, Z.; Chen, Y.; Solomon, R. The quality of commercial wheat silages in Israel. J. Dairy Sci. 2009, 92, 638–644. [Google Scholar]
- Oliveira, A.S.; Weinberg, Z.G.; Ogunade, I.M.; Cervantes, A.A.P.; Arriola, K.G.; Jiang, Y.; Kim, D.; Li, X.; Gonçalves, M.C.M.; Vyas, D.; et al. Meta-analysis of effects of inoculation with homofermentative and facultative heterofermentative lactic acid bacteria on silage fermentation, aerobic stability, and the performance of dairy cows. J. Dairy Sci. 2017, 100, 4587–4603. [Google Scholar] [CrossRef]
- Wang, Z.; Tan, Z.; Wu, G.; Wang, L.; Qin, G.; Wang, Y.; Pang, H. Microbial community and fermentation characteristic of whole-crop wheat silage treated by lactic acid bacteria and Artemisia argyi during ensiling and aerobic exposure. Front. Microbiol. 2022, 13. [Google Scholar] [CrossRef]
- Kleinschmit, D.H.; Schmidt, R.J.; Kung, L. The effects of various antifungal additives on the fermentation and aerobic stability of corn silage. J. Dairy Sci. 2005, 88, 2130–2139. [Google Scholar] [CrossRef]
- Sanderson, M.A. Aerobic stability and in vitro fiber digestibility of microbially inoculated corn and sorghum silages. J. Anim. Sci. 1993, 71, 505–514. [Google Scholar] [CrossRef] [PubMed]
- Pahlow, G.; Muck, R.E.; Driehuis, F.; Elferink, S.J.O.; Spoelstra, S.F. Microbiology of ensiling. Silage Sci. Technol. 2003, 42, 31–93. [Google Scholar]
- Kaiser, A.G.; Piltz, J.W.; Burns, H.M.; Griffiths, N.W. Top Fodder Successful Silage, 2nd. ed.; Dairy Australia and New South Wales Department of Primary Industries: 2004; pp. 1–33.
- Elferink, S.J.W.H.O.; Driehuis, F.; Gottschal, J.C.; Spoelstra, S.F. Silage fermentation processes and their manipulation. FAO Plant Prod. Prot. Pap. 2000, 17–30. [Google Scholar]
- Zhang, M.; Lv, H.; Tan, Z.; Li, Y.; Wang, Y.; Pang, H.; Li, Z.; Jiao, Z.; Jin, Q. Improving the fermentation quality of wheat straw silage stored at low temperature by psychrotrophic lactic acid bacteria. Anim. Sci. J. 2017, 88, 277–285. [Google Scholar] [CrossRef]
- Weinberg, Z.G.; Shatz, O.; Chen, Y.; Yosef, E.; Nikbahat, M.; Ben-Ghedalia, D.; Miron, J. Effect of lactic acid bacteria inoculants on in vitro digestibility of wheat and corn silages. J. Dairy Sci. 2007, 90, 4754–4762. [Google Scholar] [CrossRef] [PubMed]
- Griswold, K.E.; Hoover, W.H.; Miller, T.K.; Thayne, W.V. Effect of form of nitrogen on growth of ruminal microbes in continuous culture. J. Anim. Sci. 1996, 74, 483–483. [Google Scholar] [CrossRef] [PubMed]
- Niimi, M.; Kawamura, O. Fermentation and Cell Wall Degradation In Guineagrass And Italian Ryegrass Silages. In Proceedings of the International Grassland Congress Proceedings; 2021; pp. 1–7. [Google Scholar]
- Bolsen, K.; Ashbell, G.; Weinberg, Z. Silage fermentation and silage additives-Review. Asian-Australas. J. Anim. Sci. 1996, 9, 483–494. [Google Scholar]
- Muck, R.E.; Nadeau, E.M.G.; McAllister, T.A.; Contreras-Govea, F.E.; Santos, M.C.; Kung, L. Silage review: Recent advances and future uses of silage additives. J. Dairy Sci. 2018, 101, 3980–4000. [Google Scholar] [CrossRef]
- Filya, I.; Ashbell, G.; Hen, Y.; Weinberg, Z.G. The effect of bacterial inoculants on the fermentation and aerobic stability of whole crop wheat silage. Anim. Feed Sci. Technol. 2000, 88, 39–46. [Google Scholar] [CrossRef]
- Weinberg, Z.G.; Ashbell, G.; Hen, Y.; Azrieli, A. The effect of applying lactic acid bacteria at ensiling on the aerobic stability of silages. J. Appl. Bacteriol. 1993, 75, 512–518. [Google Scholar] [CrossRef]
- Kristensen, N.B.; Sloth, K.H.; Højberg, O.; Spliid, N.H.; Jensen, C.; Thøgersen, R. Effects of microbial inoculants on corn silage fermentation, microbial contents, aerobic stability, and milk production under field conditions. J. Dairy Sci. 2010, 93, 3764–3774. [Google Scholar] [CrossRef] [PubMed]
- Bentley, O.G.; Klosterman, E.W. The Use of Urea to Increase the Crude Protein Content of Corn Silage for Fattening Steers. 1955, 20.
- Schmutz, W.G.; Brown, L.D.; Thomas, J.W. Nutritive Value of Corn Silages Treated with Chemical Additives for Lactation. J. Dairy Sci. 1969, 52, 1408–1412. [Google Scholar] [CrossRef]
- Huber, J.; Bucholtz, H.; Boman, R. Ammonia versus urea-treated silages with varying urea in concentrate. J. Dairy Sci. 1980, 63, 76–81. [Google Scholar] [PubMed]
- Weinberg, Z.G.; Szakacs, G.; Ashbell, G.; Hen, Y. The effect of Lactobacillus buchneri and L. plantarum, applied at ensiling, on the ensiling fermentation and aerobic stability of wheat and sorghum silages. J. Ind. Microbiol. Biotechnol. 1999, 23, 218–222. [Google Scholar] [CrossRef]
- Kung, L.; Schmidt, R.J.; Ebling, T.E.; Hu, W. The effect of Lactobacillus buchneri 40788 on the fermentation and aerobic stability of ground and whole high-moisture corn. J. Dairy Sci. 2007, 90, 2309–2314. [Google Scholar] [CrossRef]
- Higa. Kyusei Nature Farming and Environmental Management Through Effective Microorganisms - The Past, Present and Future. In Proceedings of the Seventh International Conference on Kyusei Nature Farming, 2003; pp. 1–5.
- Ashbell, G.; Theune, H.; Sklan, D. Changes in amino acid compounds of wheat plants during ensiling and aerobic exposure: The influence of propionic acid and urea phosphate-calcium propionate. J. Agric. Sci. 1984, 102, 667–672. [Google Scholar] [CrossRef]
- Winters, A.L.; Fychan, R.; Jones, R. Effect of formic acid and a bacterial inoculant on the amino acid composition of grass silage and on animal performance. Grass Forage Sci. 2001, 56, 181–192. [Google Scholar] [CrossRef]
- Luo, C.; Wang, D.; Lu, N.; Li, H.; Liu, G.; Cao, Z.; Yang, H.; Li, S.; Yu, X.; Shao, W. Analysis of chemical composition, amino acid content, and rumen degradation characteristics of six organic feeds. Animals 2022, 12, 682. [Google Scholar] [CrossRef]
Figure 1.
a. Temperature of wheat silage with additives treatment at various days of ensiling; b. Temperature of corn silage with additives treatment at various days of ensiling. *0.05, and **0.01: Statistical significance after LSMeans Dunnett test.
Figure 1.
a. Temperature of wheat silage with additives treatment at various days of ensiling; b. Temperature of corn silage with additives treatment at various days of ensiling. *0.05, and **0.01: Statistical significance after LSMeans Dunnett test.
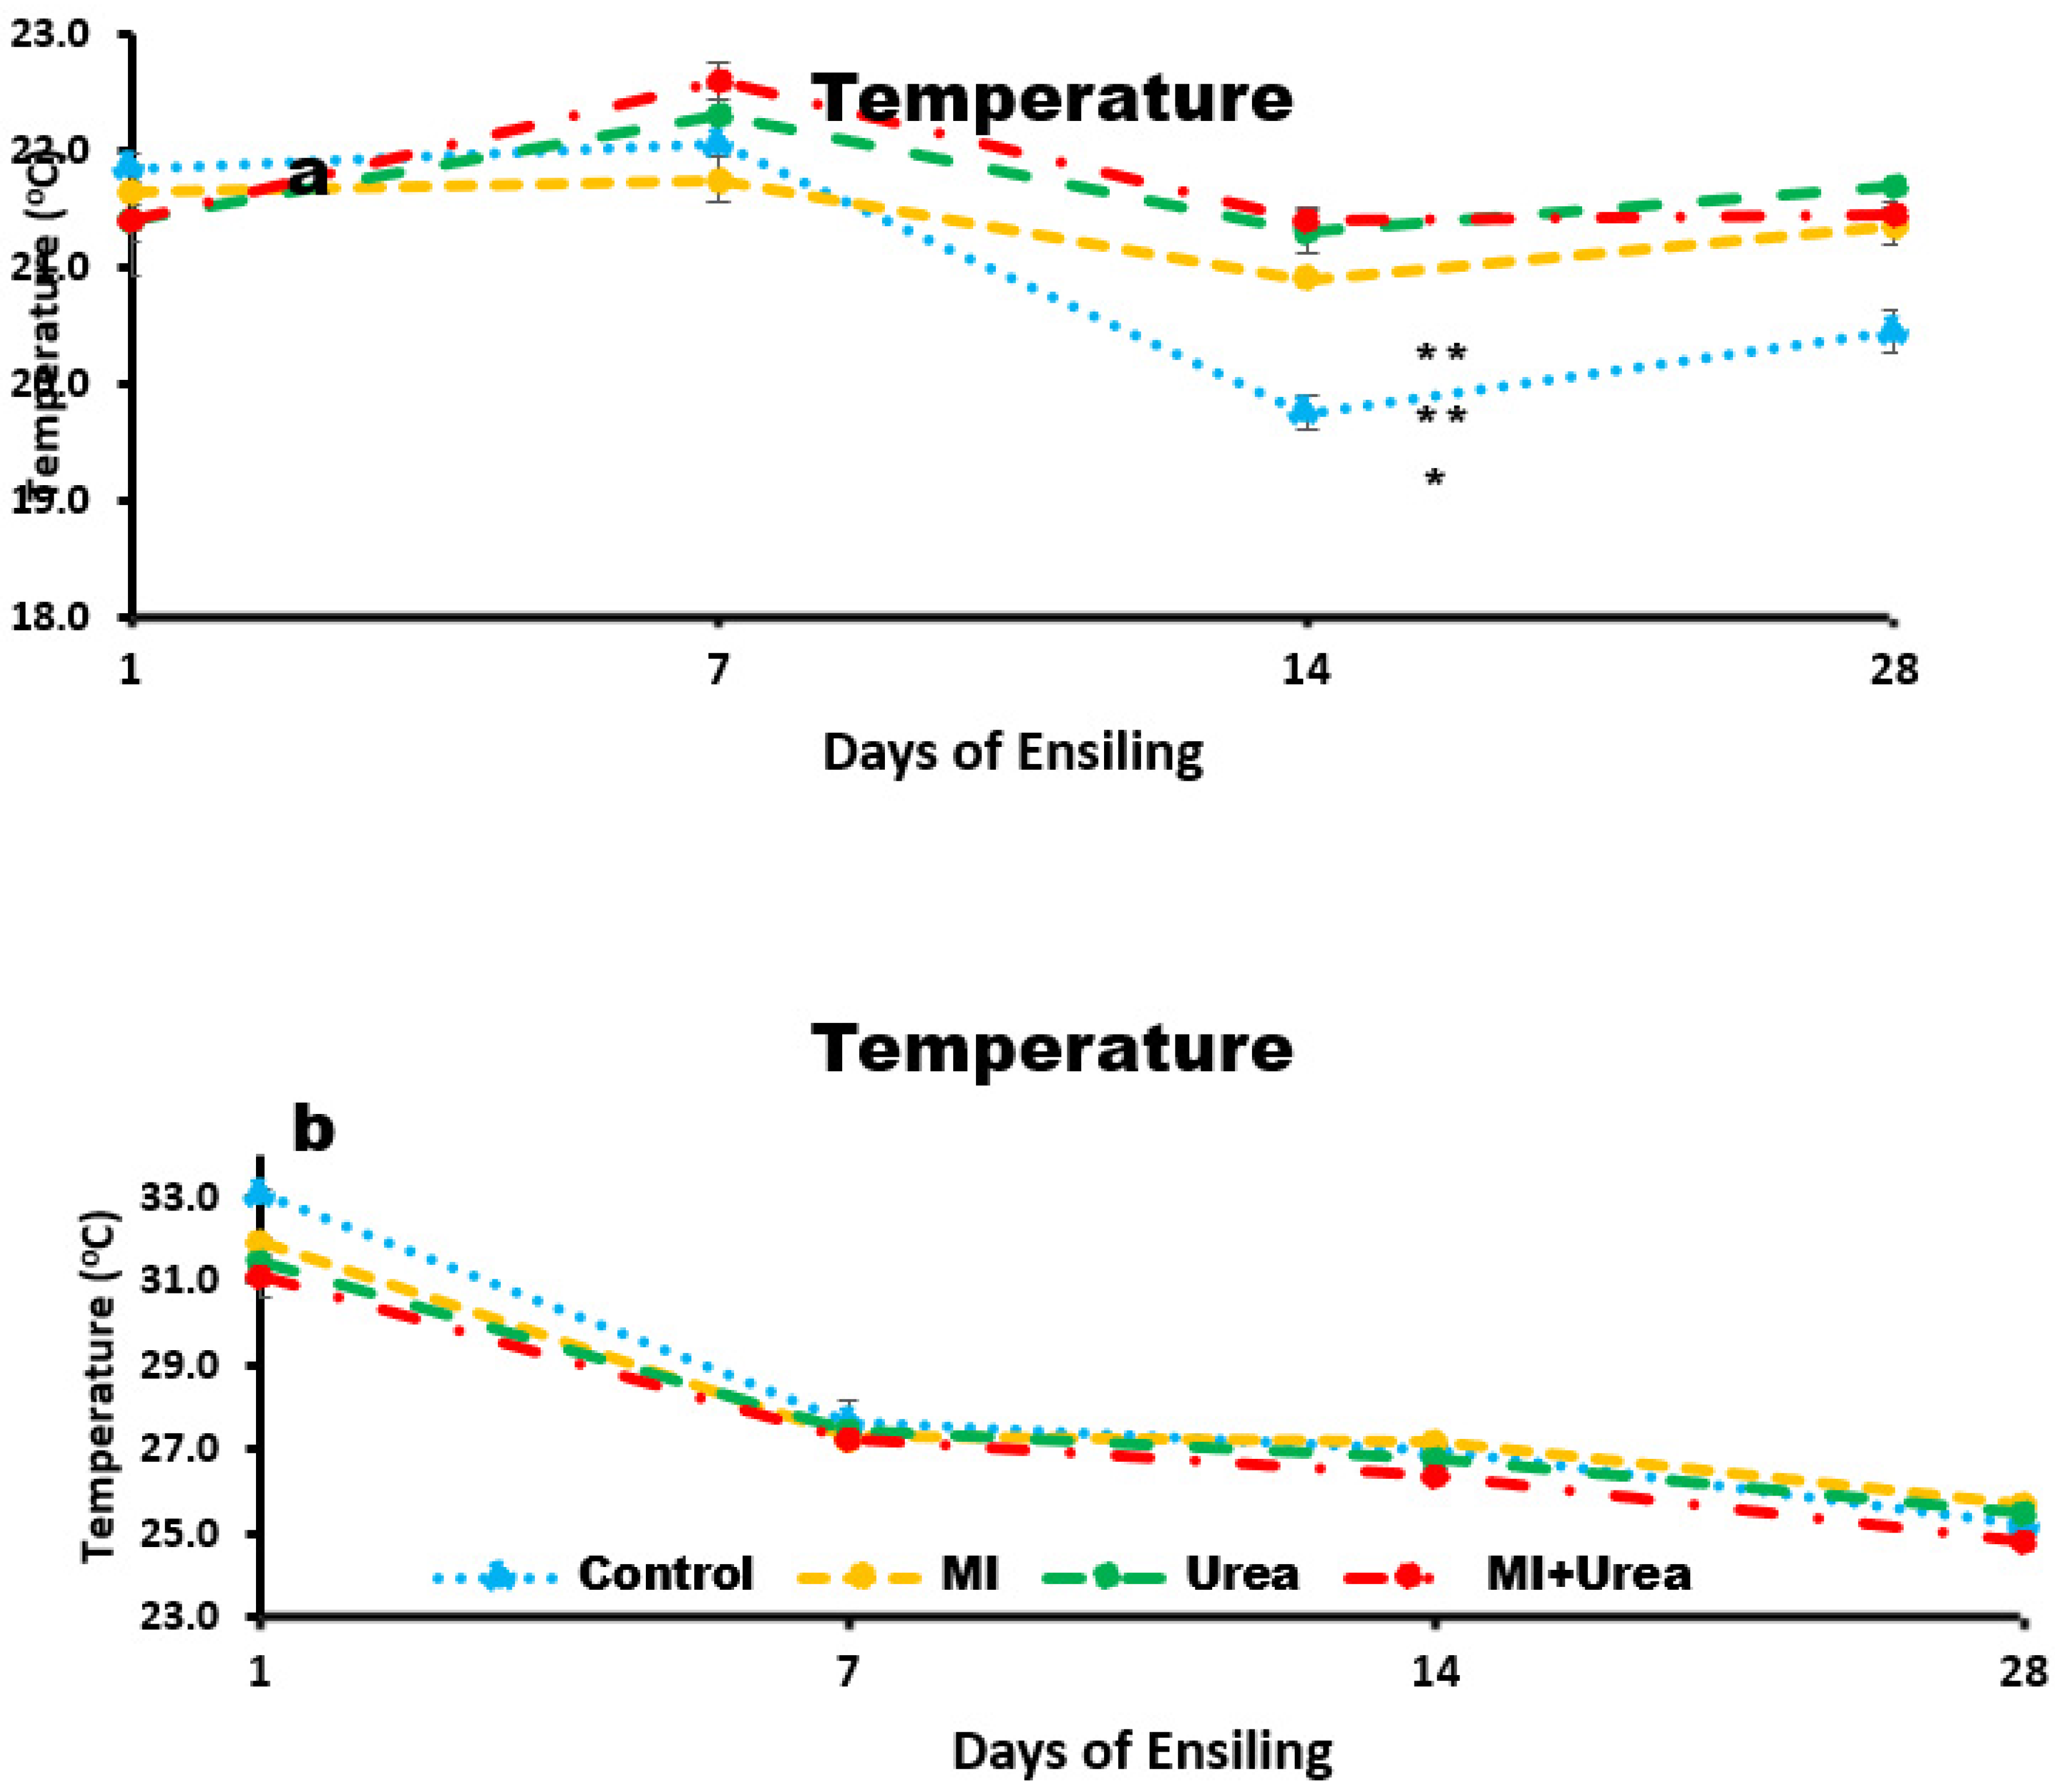
Figure 2.
a. Lactic acid concentration of wheat silage with additives treatment at various days of ensiling; b. Lactic acid concentration of corn silage with additives treatment at various days of ensiling. *0.05 Statistical significance after LSMeans Dunnett test.
Figure 2.
a. Lactic acid concentration of wheat silage with additives treatment at various days of ensiling; b. Lactic acid concentration of corn silage with additives treatment at various days of ensiling. *0.05 Statistical significance after LSMeans Dunnett test.
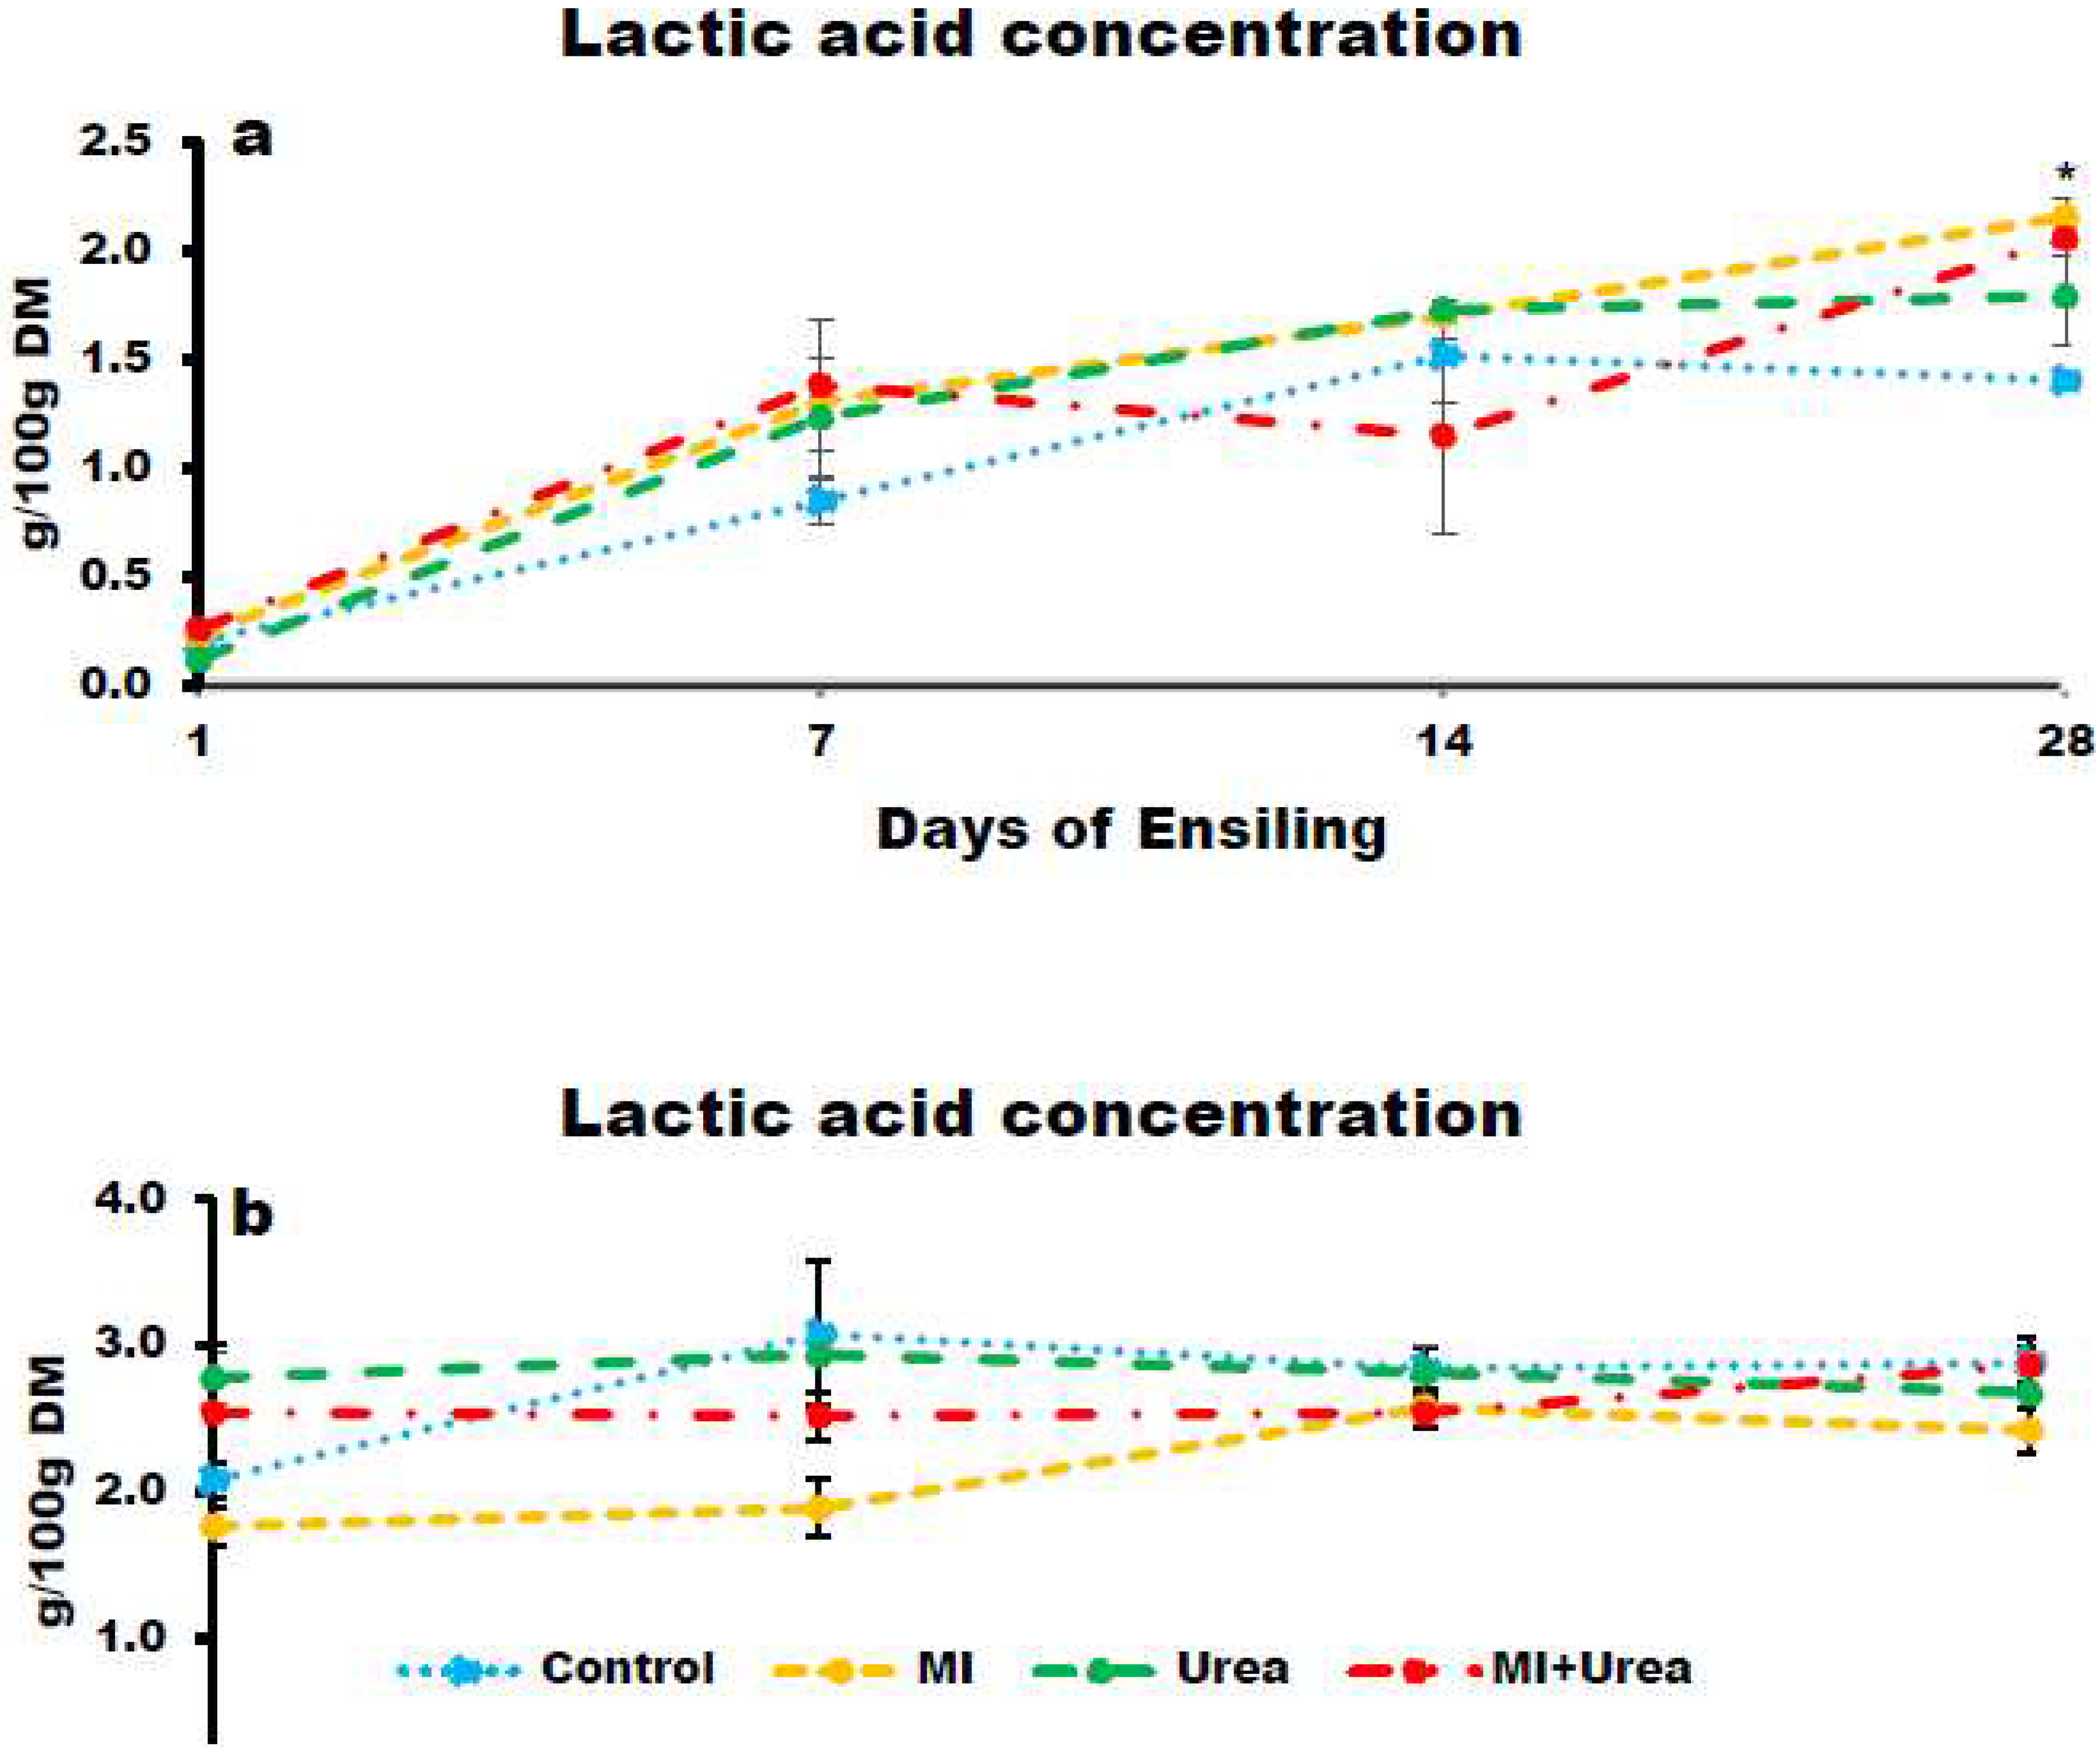
Figure 3.
a. The amount of carbon dioxide emitted from wheat silage during a 5-day exposure to air at 14 and 28 days of ensiling; b. The amount of carbon dioxide emitted from corn silage during a 5-day exposure to air at 14 and 28 days of ensiling. **0.01 and ***0.001: Statistical significance LSMeans Dunnett test.
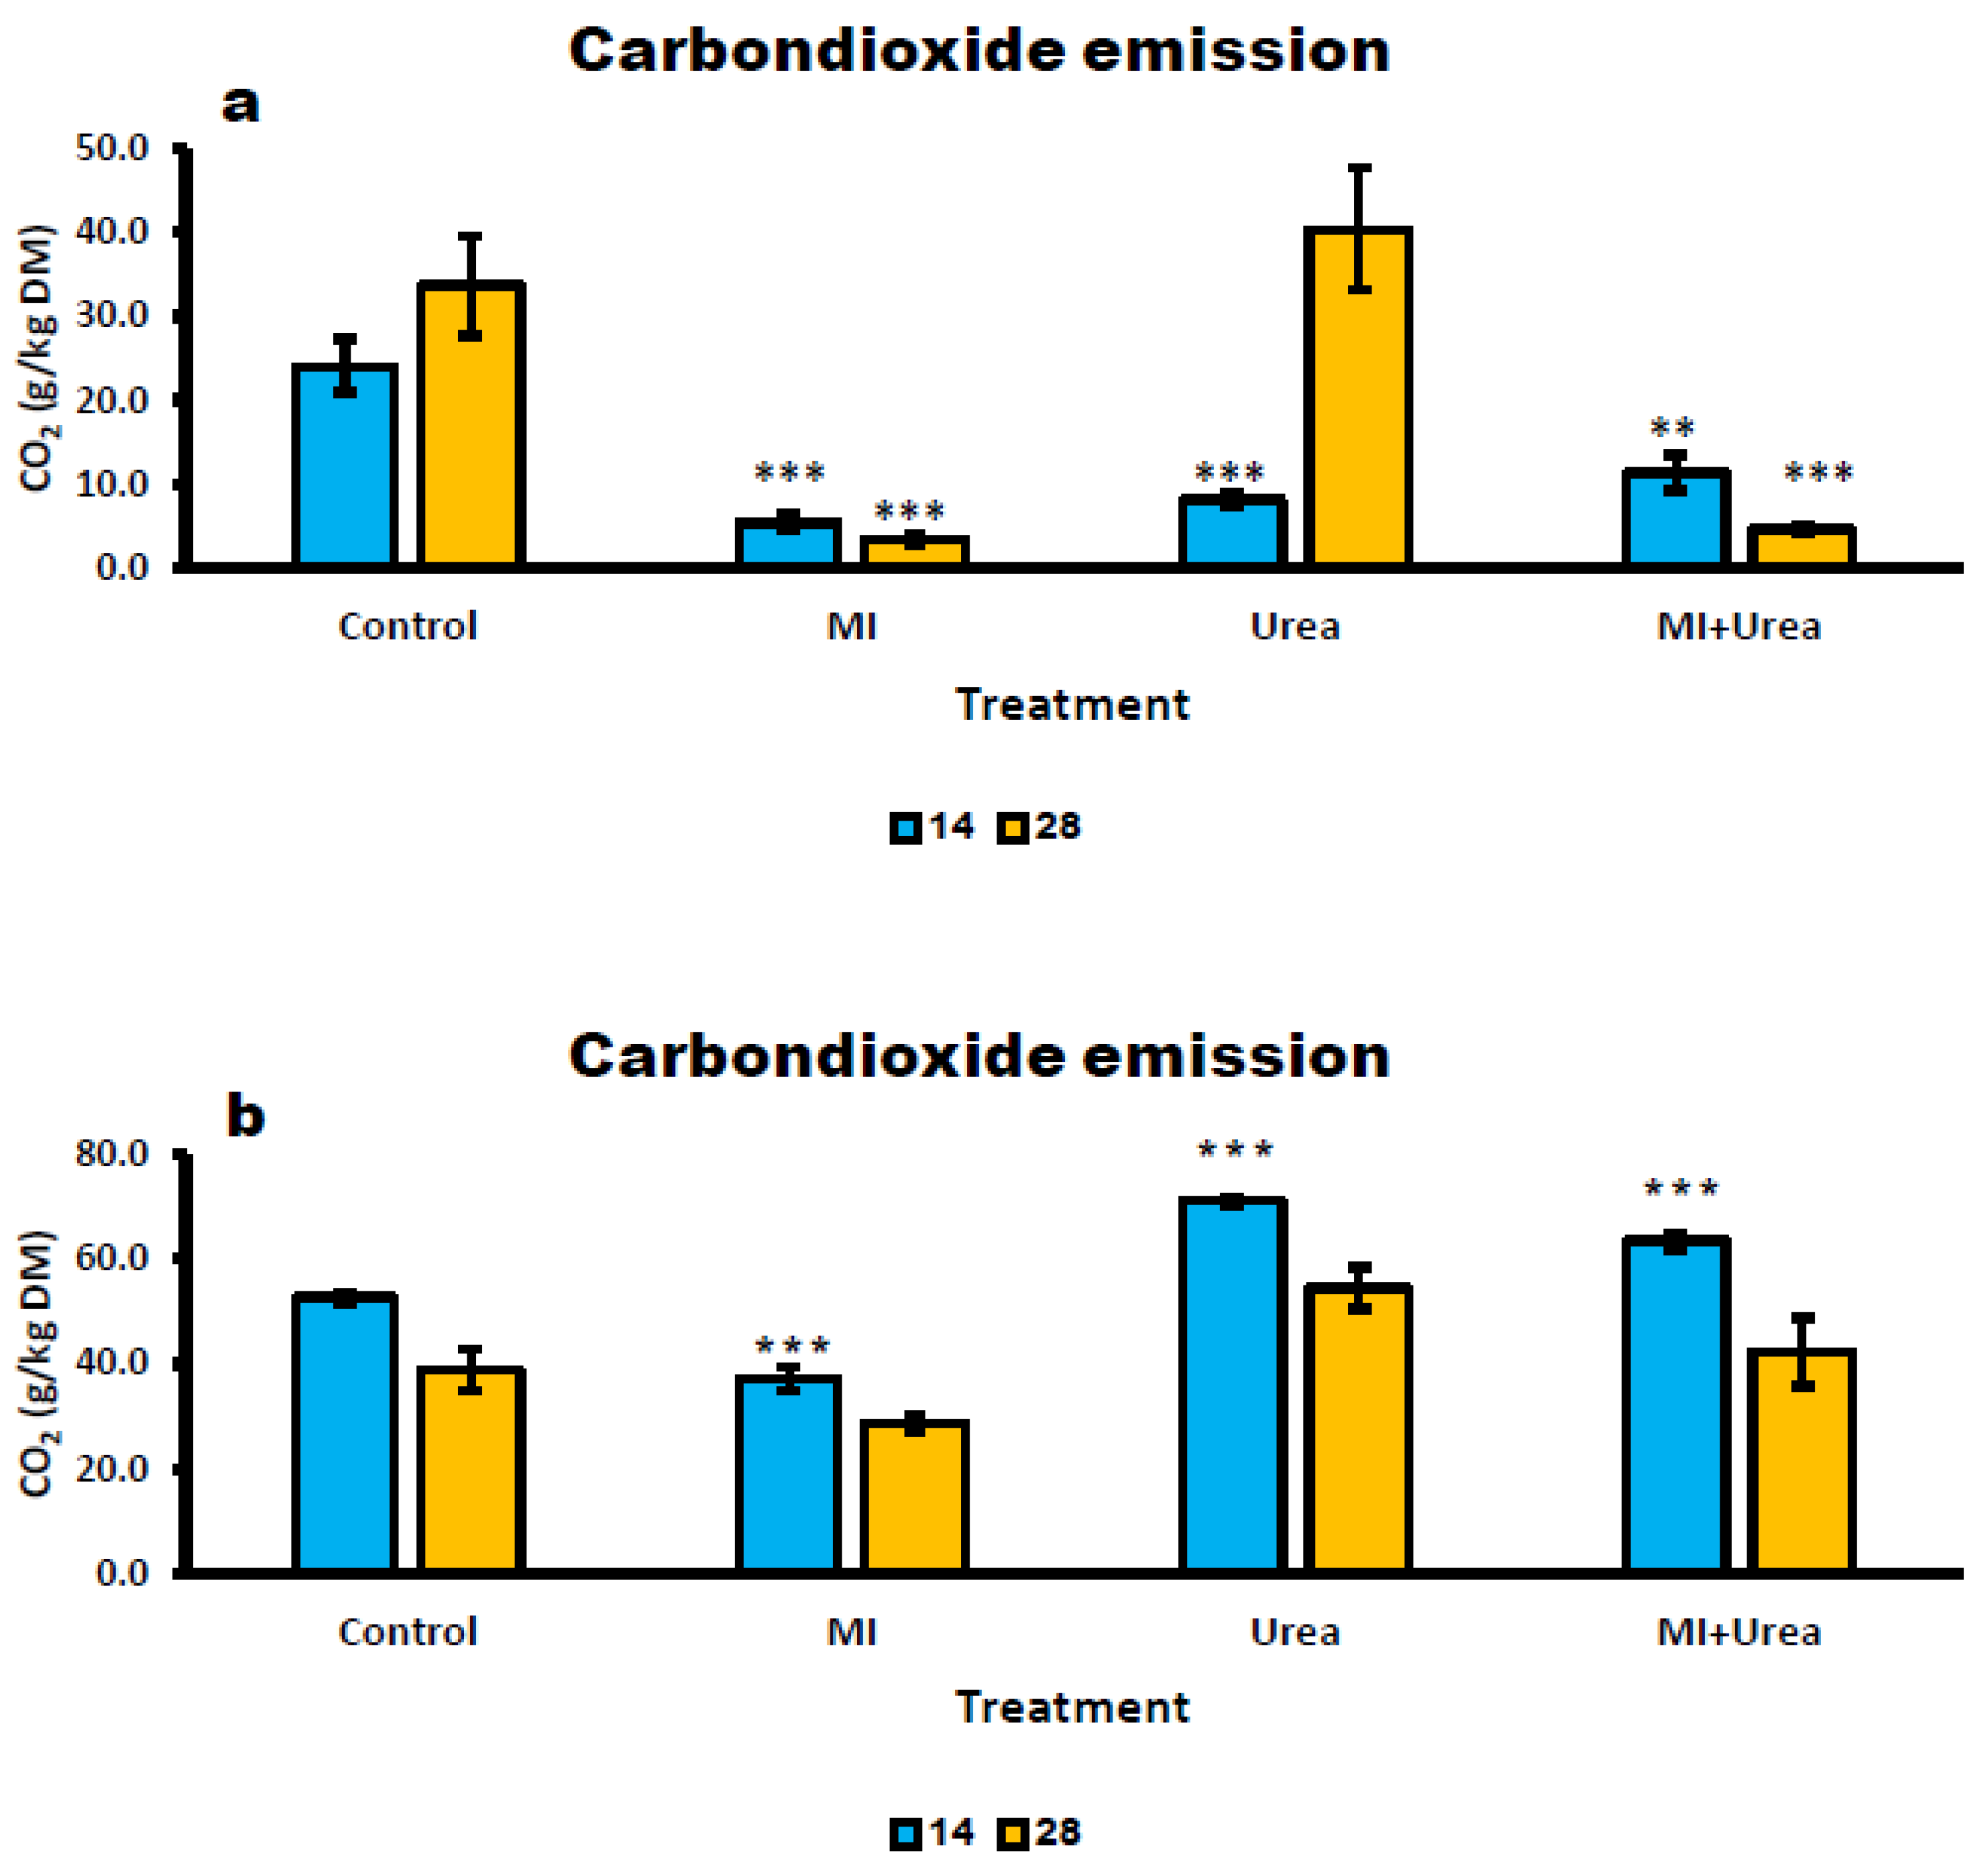
Table 2.
The effect of additives and ensiling days on pH of wheat and corn silage.
| Wheat silage | ||||||||
|---|---|---|---|---|---|---|---|---|
| Days | Treatment | Main Effect (P -Value) | ||||||
| Control | MI | Urea | MI+Urea | SEM | Trt | Day | Trt×Day | |
| 1 | 6.64b | 6.52b | 6.97a** | 6.99a** | 0.078 | <.0001 | <.0001 | <.0001 |
| 7 | 4.33a | 4.16b* | 4.36a | 4.41a | 0.037 | |||
| 14 | 3.96ab | 3.81b | 4.00a | 4.02a | 0.033 | |||
| 28 | 3.84c | 3.73d*** | 3.93a*** | 3.90b** | 0.029 | |||
| Corn silage | ||||||||
| Days | Treatment | Main Effect (P -Value) | ||||||
| Control | MI | Urea | MI+Urea | SEM | Trt | Day | Trt×Day | |
| 1 | 3.75 | 3.86 | 3.90 | 3.86 | 0.031 | 0.0047 | 0.0008 | 0.0399 |
| 7 | 3.62 | 3.68 | 3.65 | 3.73 | 0.021 | |||
| 14 | 3.89 | 3.98 | 3.80 | 3.72 | 0.045 | |||
| 28 | 3.62b | 3.97a** | 3.74b | 3.68b | 0.053 | |||
LS means in rows with different superscripts differ, * 0.05, ** 0.01 and *** 0.001: Statistical significance after LSMeans Dunnett test, SEM: Standard error of the mean.
Table 3.
The effect of additives and ensiling days on IVDMD (%) of wheat and corn silage.
| Wheat silage | ||||||||
| Treatment | Main Effect (P -Value) | |||||||
| Days | Control | MI | Urea | MI+Urea | SEM | Trt | Day | Trt*Day |
| 1 | 57.2 | 60.2 | 54.0 | 55.7 | 1.001 | 0.0058 | 0.7763 | 0.0099 |
| 7 | 55.6 | 57.8 | 55.9 | 54.1 | 0.710 | |||
| 14 | 59.0 | 54.7 | 57.0 | 53.7* | 0.840 | |||
| 28 | 61.7a | 54.2ab | 52.6b* | 56.8ab | 1.436 | |||
| Corn silage | ||||||||
| Treatment | Main Effect (P -Value) | |||||||
| Days | Control | MI | Urea | MI+Urea | SEM | Trt | Day | Trt*Day |
| 1 | 60.8a | 57.2ab | 52.2bc** | 48.6c** | 1.804 | <.0001 | 0.1549 | 0.1328 |
| 7 | 60.4 | 54.1 | 49.9* | 50.2* | 1.838 | |||
| 14 | 60.4a | 61.0a | 50.0b | 47.1b | 2.393 | |||
| 28 | 55.8ab | 56.7a | 45.9b* | 49.9ab | 1.793 | |||
LS means in rows with different superscripts differ, *0.05, **0.01 and ***0.001: Statistical significance after LSMeans Dunnett test, SEM: Standard error of the mean.
Table 4.
The effect of additives and ensiling days on IVNDFD (%) of wheat and corn silage.
| Wheat silage | ||||||||
| Treatment | Main Effect (P -Value) | |||||||
| Days | Control | MI | Urea | MI+Urea | SEM | Trt | Day | Trt*Day |
| 1 | 39.5c | 48.1a*** | 43.2b* | 45.1ab*** | 0.771 | <.0001 | 0.0014 | <.0001 |
| 7 | 39.9b | 45.1a** | 41.9ab | 43.7b* | 0.575 | |||
| 14 | 40.6b | 43.0ab | 44.0a* | 41.9ab | 0.461 | |||
| 28 | 40.3b | 41.6b | 39.9b | 44.8a*** | 0.528 | |||
| Corn silage | ||||||||
| Treatment | Main Effect (P -Value) | |||||||
| Days | Control | MI | Urea | MI+Urea | SEM | Trt | Day | Trt*Day |
| 1 | 42.6bc | 38.9c | 45.2ab | 47.5a* | 0.807 | <.0001 | 0.0368 | 0.0008 |
| 7 | 43.4ab | 43.2b | 45.3ab | 47.5a* | 0.607 | |||
| 14 | 40.0b | 36.5b | 48.3a*** | 45.2a* | 0.990 | |||
| 28 | 38.2b | 40.3b | 47.6a*** | 47.3a*** | 0.903 | |||
LS means in rows with different superscripts differ, *0.05, ** 0.01 and *** 0.001: Statistical significance after LSMeans Dunnett test, SEM: Standard error of the mean.
Table 5.
The effect of additives and ensiling days on volatile fatty acids (g/100g DM) of wheat silage.
Table 5.
The effect of additives and ensiling days on volatile fatty acids (g/100g DM) of wheat silage.
| Wheat silage | ||||||||
| Treatment | ||||||||
| Control | MI | Urea | MI+Urea | Main Effect (P -Value) | ||||
| Days | Acetic Acid (g/100g DM) | SEM | Trt | Day | Trt*Day | |||
| 1 | 1.89 | 1.75 | 2.01 | 2.08 | 0.130 | 0.2098 | 0.6174 | 0.9963 |
| 7 | 1.98 | 1.84 | 2.18 | 2.27 | 0.084 | |||
| 14 | 1.89 | 1.93 | 1.91 | 2.15 | 0.051 | |||
| 28 | 1.89 | 2.07 | 2.24 | 2.31 | 0.118 | Main Effect (P -Value) | ||
| Days | Propionic Acid (g/100g DM) | SEM | Trt | Day | Trt*Day | |||
| 1 | 0.10 | 0.05 | 0.05 | 0.06 | 0.012 | 0.2001 | 0.0256 | 0.4722 |
| 7 | 0.04 | 0.04 | 0.04 | 0.01 | 0.008 | |||
| 14 | 0.05 | 0.01 | 0.03 | 0.03 | 0.008 | |||
| 28 | 0.02 | 0.02 | 0.04* | 0.04* | 0.004 | Main Effect (P -Value) | ||
| Days | Butyric Acid (g/100g DM) | SEM | Trt | Day | Trt*Day | |||
| 1 | 0.02 | 0.01 | N.D | N.D | 0.004 | 0.0513 | 0.0771 | 0.3841 |
| 7 | N.D | N.D | N.D | N.D | 0.000 | |||
| 14 | N.D | N.D | N.D | N.D | 0.000 | |||
| 28 | N.D | N.D | N.D | N.D | 0.000 | Main Effect (P -Value) | ||
| Days | Total Acid (g/100g DM) | SEM | Trt | Day | Trt*Day | |||
| 1 | 2.08 | 1.91 | 2.07 | 2.15 | 0.130 | 0.4212 | 0.8159 | 0.9945 |
| 7 | 2.11 | 1.95 | 2.22 | 2.28 | 0.081 | |||
| 14 | 2.03 | 1.94 | 1.95 | 2.18 | 0.050 | |||
| 28 | 1.91 | 2.09 | 2.28 | 2.35 | 0.120 | |||
* 0.05: Statistical significance at p < 0.05 after LSMeans Dunnett test, SEM: Standard error of the mean, N.D: Non Detectable:.
Table 6.
The effect of additives and ensiling days on Volatile Fatty Acids (g/100g DM) of corn silage.
Table 6.
The effect of additives and ensiling days on Volatile Fatty Acids (g/100g DM) of corn silage.
| Corn Silage | ||||||||
| Treatment | ||||||||
| Control | MI | Urea | MI+Urea | Main Effect (P -Value) | ||||
| Days | Acetic Acid (g/100g DM) | SEM | Trt | Day | Trt*Day | |||
| 1 | 1.59b | 0.87b | 2.50a* | 2.86a* | 0.300 | <.0001 | <.0001 | 0.1581 |
| 7 | 1.68bc | 1.34c | 2.96ab | 3.45a* | 0.346 | |||
| 14 | 2.31bc | 1.73c | 3.00ab | 3.60a* | 0.274 | |||
| 28 | 3.42 | 2.27 | 3.57 | 3.60 | 0.227 | Main Effect (P -Value) | ||
| Days | Propionic Acid (g/100g DM) | SEM | Trt | Day | Trt*Day | |||
| 1 | 0.02 | 0.16 | 0.02 | 0.02 | 0.027 | <.0001 | 0.0274 | 0.0328 |
| 7 | 0.01b | 0.08a* | 0.02ab | 0.02ab | 0.012 | |||
| 14 | 0.02b | 0.22a*** | 0.02b | 0.01b | 0.033 | |||
| 28 | 0.03b | 0.29a** | 0.03b | 0.02b | 0.044 | Main Effect (P -Value) | ||
| Days | Butyric Acid (g/100g DM) | SEM | Trt | Day | Trt*Day | |||
| 1 | 0.08ab | 0.05b | 0.12a | 0.11a | 0.012 | <.0001 | 0.0122 | 0.3739 |
| 7 | 0.07 | 0.05 | 0.12 | 0.13 | 0.013 | |||
| 14 | 0.10 | 0.05 | 0.23 | 0.14 | 0.028 | |||
| 28 | 0.15ab | 0.07b | 0.18a | 0.16ab | 0.017 | Main Effect (P -Value) | ||
| Days | Total Acid (g/100g DM) | SEM | Trt | Day | Trt*Day | |||
| 1 | 1.68bc | 1.09c | 2.65ab* | 3.12a* | 0.308 | <.0001 | <.0001 | 0.2612 |
| 7 | 1.77b | 1.47b | 3.11ab | 3.60a* | 0.354 | |||
| 14 | 2.44bc | 2.01c | 3.25ab | 4.05a** | 0.303 | |||
| 28 | 3.60ab | 2.63b | 3.79ab | 4.09a | 0.226 | |||
LSmeans in rows with different superscripts differ, *0.05, **0.01 and ***0.001: Statistical significance after LSMeans Dunnett test, SEM: Standard error of the mean, N.D: Non Detectable.
Table 7.
The effect of additives and ensiling days on aerobic stability of wheat and corn silage.
| Wheat silage | |||||||||
| Treatment | |||||||||
| Control | MI | Urea | MI+Urea | Main Effect (P -Value) | |||||
| Days | 1CO2 (g/kg DM) | SEM | Trt | Day | Trt*Day | ||||
| 14 | 24.1a | 5.4b*** | 8.2b*** | 11.4b** | 2.166 | <.0001 | 0.0217 | 0.0011 | |
| 28 | 33.7a | 3.4b*** | 40.4a | 4.7b*** | 4.122 | ||||
| 2Sugar loss (g) | |||||||||
| 14 | 16.4a | 3.7b*** | 5.6b*** | 7.8b** | 1.473 | <.0001 | 0.0217 | 0.0011 | |
| 28 | 22.9a | 2.3b*** | 27.5a | 3.2b*** | 2.803 | ||||
| 3Moulds (Log CFU g/DM) | SEM | ||||||||
| 28 | 9.1 | 7.9*** | 8.2*** | 8.1*** | 0.112 | <.0001 | |||
| pH | SEM | ||||||||
| 28 | 7.1 | 3.9*** | 5.1*** | 4.1*** | 0.272 | <.0001 | |||
| Corn silage | |||||||||
| CO2 (g/kg DM) | SEM | Trt | Day | Trt*Day | |||||
| 14 | 52.7c | 37.2d*** | 71.2a*** | 63.5b** | 3.273 | <.0001 | <.0001 | 0.3411 | |
| 28 | 38.8ab | 28.7b | 54.5a | 42.4ab | 3.007 | ||||
| Sugar loss (g) | SEM | Trt | Day | Trt*Day | |||||
| 14 | 35.5c | 27.3d*** | 47.8a*** | 43.2b*** | 1.868 | <.0001 | <.0001 | 0.3208 | |
| 28 | 26.4ab | 20.4b | 34.7a | 35.5a | 1.927 | ||||
| Moulds (Log CFU g/DM) | SEM | ||||||||
| 28 | 9.2 | 9.1 | 9.3 | 9.1 | 0.059 | 0.3948 | |||
| pH | SEM | ||||||||
| 28 | 4.3 | 4.1 | 3.9 | 3.7 | 0.097 | 0.1882 | |||
| 1 The amount of carbon dioxide emitted from the silage during a 5-day exposure to air, 2 Amount of sugar lost from the silages during the 5-day exposure to air and 3 Colony Forming Unit – CFU – a measure that expresses the number of mold populations that have developed in 1 gram of dry matter; LSmeans in rows with different superscripts differ, **0.01 and ***0.001: Statistical significance after LSMeans Dunnett test, SEM: Standard error of the mean. | |||||||||
Table 8.
The effect of additives and ensiling days on crude protein content (%) 1of wheat and corn silage.
Table 8.
The effect of additives and ensiling days on crude protein content (%) 1of wheat and corn silage.
| Wheat silage | ||||||||
| Days | Treatment | Main Effect (P -Value) | ||||||
| Control | MI | Urea | MI+Urea | SEM | Trt | Day | Trt*Day | |
| 1 | 9.02bc | 8.81c | 9.83ab* | 9.89a* | 0.152 | 0.0005 | 0.3004 | 0.2427 |
| 7 | 8.53b | 9.25ab | 9.66a** | 9.60a** | 0.144 | |||
| 14 | 9.30 | 8.90 | 9.45 | 9.47 | 0.163 | |||
| 28 | 9.17 | 9.73 | 9.60 | 9.80 | 0.133 | |||
| Corn silage | ||||||||
| Days | Treatment | Main Effect (P -Value) | ||||||
| Control | MI | Urea | MI+Urea | SEM | Trt | Day | Trt*Day | |
| 1 | 8.33b | 8.35b | 10.8a*** | 10.5a*** | 0.318 | <.0001 | <.0001 | <.0001 |
| 7 | 8.28c | 9.81b*** | 10.9a*** | 10.5ab*** | 0.281 | |||
| 14 | 9.18b | 9.28b | 11.0a*** | 11.0ac*** | 0.255 | |||
| 28 | 7.99c | 10.5b*** | 11.1b*** | 12.5a*** | 0.420 | |||
LSmeans in rows with different superscripts differ, *0.05, **0.01 and ***0.001: Statistical significance at p < 0.05 after LSMeans Dunnett test, SEM: Standard error of the mean.
Table 9.
Amino acids composition (g/100g CP) of wheat silage.
| Additive | ||||||
|---|---|---|---|---|---|---|
| Amino acid | Control | MI | Urea | MI+Urea | SEM | Main Effect (P -Value) |
| Essential | ||||||
| Lysine | 1.78 | 1.94 | 2.01 | 1.91 | 0.107 | 0.9385 |
| Histidine | 1.15 | 1.17 | 1.26 | 1.03 | 0.066 | 0.7777 |
| Valine | 2.31 | 3.29 | 4.04 | 3.31 | 0.286 | 0.1883 |
| Phenylalanine | 3.13 | 3.06 | 3.51 | 2.84 | 0.171 | 0.6873 |
| Arginine | 1.84 | 1.50 | 2.04 | 1.49 | 0.112 | 0.2126 |
| Threonine | 2.83 | 2.85 | 3.09 | 2.64 | 0.107 | 0.6365 |
| Methionine | 0.64 | 0.67 | 0.76 | 0.37 | 0.064 | 0.1307 |
| Isoleucine | 10.10 | 11.80 | 12.14 | 11.51 | 0.753 | 0.8641 |
| Leucine | 3.42 | 3.39 | 4.18 | 3.34 | 0.221 | 0.5864 |
| Non-essential | ||||||
| Serine | 2.71 | 2.78 | 2.87 | 2.41 | 0.130 | 0.7342 |
| Glutamic acid | 9.95 | 8.84 | 10.71 | 9.34 | 0.405 | 0.4836 |
| Glycine | 3.66 | 3.95 | 4.09 | 4.04 | 0.106 | 0.6061 |
| Tyrosine | 1.77 | 1.93 | 2.20 | 2.00 | 0.121 | 0.7670 |
| -Aminobutyric acid | 1.38 | 1.48 | 1.25 | 1.61 | 0.073 | 0.4426 |
| Proline | 4.40 | 4.32 | 4.70 | 4.37 | 0.156 | 0.8209 |
| Alanine | 4.23 | 4.43 | 5.62 | 4.84 | 0.316 | 0.5081 |
| Hydroxyproline | 0.50 | 0.49 | 0.41 | 0.51 | 0.017 | 0.1235 |
| Lysine % EAA1 | 6.49a | 6.56a | 6.06b | 6.71a | 0.099 | 0.0480 |
| Methionine % EAA2 | 2.37a | 2.27a | 2.29a | 1.31b* | 0.172 | 0.0132 |
| TEAA % CP3 | 27.19 | 29.67 | 33.03 | 28.44 | 1.692 | 0.7537 |
| TAA % CP | 56.37 | 58.72 | 58.30 | 65.54 | 9.343 | 0.7815 |
| Lysine % EAA1: Lysine expressed as a percentage of Essential Amino Acids; Methionine % EAA2: Methionine expressed as a percentage of Essential Amino Acids; TEAA % CP3: Total Essential Amino Acids expressed as a percentage of Crude Protein; Means within the same row with different superscripts differ; *0.05: Statistical significance after LSMeans Dunnett test, SEM: Standard error of the mean. | ||||||
Table 10.
Table 10. Amino acids composition (g/100g CP) of corn silage
| Additive | ||||||
|---|---|---|---|---|---|---|
| Amino acid | Control | MI | Urea | MI+Urea | SEM | Main Effect (P -Value) |
| Essential | ||||||
| Lysine | 2.56a | 2.08b* | 2.04b* | 1.81b** | 0.107 | 0.0118 |
| Histidine | 1.46a | 1.38a | 1.21b* | 1.02c** | 0.065 | 0.0028 |
| Valine | 4.42a | 3.84a | 3.97a | 2.98b* | 0.213 | 0.0326 |
| Phenylalanine | 3.96a | 3.59ab | 3.22bc* | 2.72c** | 0.181 | 0.0125 |
| Arginine | 2.27a | 2.15a | 1.85ab | 1.64b | 0.104 | 0.0509 |
| Threonine | 3.58 | 3.16 | 2.76 | 2.64 | 0.154 | 0.0617 |
| Methionine | 0.90 | 0.82 | 0.54 | 0.65 | 0.061 | 0.0792 |
| Isoleucine | 9.54 | 10.92 | 11.35 | 8.59 | 0.698 | 0.5852 |
| Leucine | 6.44 | 5.42 | 4.76 | 4.23 | 0.350 | 0.0764 |
| Non-essential | ||||||
| Serine | 3.43a | 2.78b* | 2.90b* | 2.62b** | 0.020 | 0.0096 |
| Glutamic acid | 8.84a | 8.29a | 9.33a | 6.68b* | 0.407 | 0.0346 |
| Glycine | 4.66a | 3.91b | 4.05ab | 3.36b* | 0.188 | 0.0311 |
| Tyrosine | 2.17a | 1.94a | 1.90a | 1.58b* | 0.083 | 0.0217 |
| -Aminobutyric acid | 2.15a | 1.57b | 1.36b* | 1.51b* | 0.122 | 0.0309 |
| Proline | 4.82 | 4.39 | 4.25 | 3.75 | 0.162 | 0.0707 |
| Alanine | 7.65 | 6.67 | 5.90 | 5.70 | 0.319 | 0.0550 |
| Hydroxyproline | 0.63 | 0.48 | 0.48 | 0.43 | 0.033 | 0.0941 |
| Lysine % EAA1 | 7.32 | 6.27 | 6.45 | 6.88 | 0.205 | 0.2976 |
| Methionine % EAA2 | 2.58 | 2.47 | 1.69 | 2.49 | 0.160 | 0.1296 |
| TEAA % CP3 | 35.14 | 33.37 | 31.70 | 26.28 | 1.473 | 0.1288 |
| TAA % CP | 69.86 | 63.58 | 62.33 | 52.22* | 4.106 | 0.0533 |
| Lysine % EAA1: Lysine expressed as a percentage of Essential Amino Acids; Methionine % EAA2: Methionine expressed as a percentage of Essential Amino Acids; TEAA % CP3: Total Essential Amino Acids expressed as a percentage of Crude Protein; Means within the same row with different superscripts differ; *0.05 and **0.01: Statistical significance at p < 0.05 after LSMeans Dunnett test, SEM: Standard error of the mean. | ||||||
Disclaimer/Publisher’s Note: The statements, opinions and data contained in all publications are solely those of the individual author(s) and contributor(s) and not of MDPI and/or the editor(s). MDPI and/or the editor(s) disclaim responsibility for any injury to people or property resulting from any ideas, methods, instructions or products referred to in the content. |
© 2023 by the authors. Licensee MDPI, Basel, Switzerland. This article is an open access article distributed under the terms and conditions of the Creative Commons Attribution (CC BY) license (http://creativecommons.org/licenses/by/4.0/).
Copyright: This open access article is published under a Creative Commons CC BY 4.0 license, which permit the free download, distribution, and reuse, provided that the author and preprint are cited in any reuse.


