

Submitted:
19 June 2024
Posted:
20 June 2024
You are already at the latest version
Abstract
The inherent capabilities of the K-means++ algorithm to approximate system dynamics within complex systems are subjected by constructing a network structure that captures interconnections among identified components, extending its original purpose as a data clustering method and transforming it into a tool for systems analysis. Leveraging advanced measurement technologies and sophisticated data collection systems, the K-means++ algorithm unveils hidden relationships among components and identifies critical elements.
This study explored the algorithm's potential, facilitating the identification of critical components to enhance system operation, control, optimization, and decision-making and examining the practicality and resiliency of the method in real-world application with noisy and limited data. A case study conducted on power systems (IEEE 39-bus and IEEE 300-bus systems) exemplifies K-means++'s capacity to accurately identify critical components and approximate system dynamics, supported by performance metrics affirming its effectiveness and robustness in system analysis through measurements of bus similarity within clusters based on standard deviation and comparison of net tie-line flows in equivalent networks with the original network across scenarios.
Performance metrics, including the Silhouette Score, Davies-Bouldin Index, and Variation of Information (VI) score, further validated K-means++'s performance, yielding reliable and consistent results.
Keywords:
Complex systems
; Critical components
; Dynamic identification
; K-means++
; Measurement-based
; Network equivalence
; Power systems
; System analysis
; System dynamics.
1. Introduction
Analyzing complex systems is vital for understanding their intricate dynamics and interactions, including emergent behaviors, across various domains to identify critical components and improve system operation, control, optimization, and decision-making [1].
In practical scenarios, uncovering the underlying dynamics of a system can be a formidable challenge, with these dynamics often needing to be discovered or entirely unknown [2,3]. The widespread adoption of advanced measurement technologies and sophisticated data collection systems has led to the generation of an unprecedented volume of data.
However, regarding system identification, the observed data often needs to encapsulate the whole dimension of structural information that needs to be deduced, but also, the data obtained from observations is noisy and limited due to experimental constraints. These issues exist primarily because the structural information is veiled within measurable data in an unknown fashion, and the solution space for all potential structural configurations resides within an exceedingly high-dimensional realm [4,5].
This study demonstrates the K-means++ algorithm's intrinsic capabilities for approximating system dynamics and identifying critical components in complex systems by constructing a network structure that captures identified components' interconnections, thus transcending its original application as data clustering method, to become a tool for systems analysis and cybernetics. We will demonstrate the performance of the method through our case study and examine the potential of the method for practical application by evaluating the resiliency of K-means++ to the limited and noisy data.
Within the data-rich environment, the K-means++ algorithm comes to the forefront, guided by the principles of Information Theory, notably Shannon's theory [6]. This algorithm goes beyond mere data analysis; it unveils concealed relationships among components, identifies critical elements, and facilitates profound insights with implications for informed decision-making and optimization within complex systems [7].
K-means++ excels in its clustering approach, grouping data points based on characteristics, optimizing the objective function to identify cluster centers representing key equilibrium points within the system, and employing these centers as feature space vectors embodying average data point characteristics within each cluster [8,9,10]. By deploying K-means++ with measurements, researchers can identify pivotal nodes within these networks, akin to identifying influential agents within social or information networks, as described in network theory [11]. This capability is pivotal for assessing system resilience, vulnerabilities, and potential cascading effects in complex systems.
A key advantage is constructing a network structure by directly connecting data points within the same cluster while retaining all components (no truncation) to ensure a comprehensive representation in an equivalent low-rank data space [9,12]. It is important to note that the norm minimization method in K-means++ is particularly notable for efficiently addressing sparse recovery problems while enabling more accurate estimation of weak variables, unlike the matching pursuit algorithm, which eliminates them [13]. This characteristic enables the inclusion of higher-order terms when modeling the system, which are commonly considered as noise and neglected, such as the impact of interactions among agents in the power grid that gain prominence through integrating inverter-based resources.
Although the sensitivity of K-means++ to initial cluster center placement, the need to predefine the number of clusters, and vulnerability to outliers pose challenges, but strategic initialization and exploration of optimal cluster numbers, coupled with robust clustering approaches, mitigate limitations, rendering K-means++ a tool for system analysis [14].
Precisely in this study, the conducted case on power systems demonstrates the potential of K-means++ in identifying critical components and approximating system dynamics within complex systems, supported by performance metrics confirming its effectiveness and robustness in system analysis. By selecting two benchmark systems, the IEEE 39-bus and IEEE 300-bus systems, the study ensures the generalizability and applicability of the findings across different complex systems [15].
The study assesses K-means++ effectiveness by measuring bus similarity within clusters based on standard deviation and comparing net tie-line flows in equivalent networks with the original network across scenarios [7,16].
In order to assess the vulnerability of the K-means++ algorithm to limited data, this study conducted an analysis to demonstrate the convergence of K-means++ results across different data intervals. Each interval incorporated fresh real-time measurement data into the algorithm's input. The recorded results were examined using a designated positive correlation factor.
Moreover, to evaluate how well the K-means++ algorithm can handle real-world scenarios characterized by observation noise, we also conducted a study using the IEEE 300 bus system introducing the worst-case scenario regrading noise.
Furthermore, additional performance metrics, including Silhouette Score [17], Davies-Bouldin Index [18], and Variation of Information (VI) score [19], were utilized to assess K-means++'s performances, leading to the attainment of reliable and consistent results.
The subsequent sections of this manuscript are organized as follows. Section II provides an explanation of the K-means++ algorithm an its intrinsic capabilities. Section III demonstrates the case study on power grid for evaluating the potentials of K-means++ in system identification and presents the obtained outcomes. The further analysis, using multiple performance metric, and discussion over the results is presented in Section IV. The final section comprises the concluding remarks, emphasizing the results' significance and elucidating potential research directions for future studies.
2. K-Means++ System Analysis
The K-means++ algorithm emerges as a robust framework for identifying critical components and the faithful representation of system dynamics within intricate and multifaceted complex systems. This efficacy is intrinsically rooted in a carefully orchestrated process that integrates probabilistic distance initialization and optimizing a foundational objective function [14]. The amalgamation of these elements culminates in the judicious selection of centroids, which inherently encapsulate equilibrium points intrinsic to the system [7,14,20].
Within the K-means++ algorithmic paradigm, the process of selecting centroids commences with a strategic consideration of probabilistic distances [21]. This involves computing the distance from the centroid to its closest neighbor within the existing set of centroids . Mathematically, this distance calculation is denoted as follows [7,22]:
This nuanced step ensures a judicious distribution of centroids across the data space, promoting a balanced representation of critical components and enhancing the algorithm's sensitivity to system dynamics [7,20].
At the heart of the K-means++ methodology is optimizing an essential objective function, which is pivotal in selecting centroids that intricately mirror equilibrium points within the system. Formally, this objective function is expressed as [22]:
In this formulation, represents the set of clusters, denotes the total number of clusters, signifies the data points belonging to the cluster, denotes a data point, and symbolizes the centroid of the cluster.
The intricate interplay between probabilistic distance initialization and objective function optimization culminates in the establishment of probabilities that govern the subsequent centroid selection process. This involves the computation of probabilities for each data point, signifying the likelihood of its selection as the next centroid [7,22]. Mathematically, this probability is defined as [22]:
where represents the sum of squared distances of data points from previously chosen centroids. Importantly, this probability is normalized to ensure a coherent selection process.
Ultimately, the culmination of these intricately woven steps leads to the probabilistic selection of the next centroid based on the established probabilities. This probabilistic framework empowers the K-means++ algorithm to strategically position centroids in underrepresented regions, thereby enhancing the algorithm's capacity to discern and model critical components that contribute to system dynamics [7,20,21,22].
The K-means++ algorithm offers advantages such as improved initialization and efficient convergence by probabilistically selecting centroids, making it suitable for large datasets [21]. However, it is sensitive to initial centroid placement and can struggle with non-spherical clusters. Its assumption of equal variance may not fit all data distributions, and outliers can impact results [22]. Researchers should weigh these strengths and limitations when applying K-means++ to diverse real-world scenarios, considering data characteristics and analysis goals [7,21,22].
The K-means++ algorithm's prowess in identifying critical components and representing system dynamics is rooted in an interplay of probabilistic distance considerations and objective function optimization [21]. By judiciously balancing probabilistic selection with optimization objectives, the algorithm unveils latent relationships and patterns, solidifying its role as an indispensable tool for comprehending the nuanced behaviors of complex systems [22].
Lemma 1.
The Efficacy of K-means++ Algorithm in Unveiling Latent Relationships within Complex Systems
Proof:
The K-means++ algorithm's ability to uncover latent relationships and patterns in intricate systems is founded on a rigorous interplay between probabilistic distance considerations and optimization of the objective function.
Let:
- -
- X represents the set of data points in the complex system.
- -
- C represents the set of centroids chosen during initialization.
- -
- For each x in X, D(x) is defined as the minimum squared Euclidean distance to the nearest centroid in C.
D(x) signifies the squared Euclidean distance
Let:
- -
- The K-means++ algorithm aims to minimize squared distances between data points and their assigned centroids.
- -
- W(C) signifies this objective function for a centroid set C.
- -
- The iterative centroid updates aim at minimizing W(C).
- -
- denotes the centroid closest to data point
- -
- indicates the Euclidean distance.
Let:
- -
- The K-means++ algorithm employs a strategic centroid initialization technique, resulting in a network structure reminiscent of a complete graph.
- -
- This structure is denoted as G, with nodes representing centroids, data points, and edges symbolizing connections.
Edges within G are established based on Voronoi partitioning created by centroids. Data points in the same Voronoi region are directly linked to their corresponding centroid. Such connections reflect proximity and similarity, yielding a quantitative indication of shared characteristics.
The network structure is a potent tool to capture the intricate relationships and interactions among different patterns or states within the data, thus shedding light on the underlying dynamics.
Conclusion: The K-means++ algorithm's competence in identifying critical components and deciphering system dynamics is underpinned by the meticulous interplay of probabilistic distance considerations and objective function optimization. In conjunction with creating a network structure that mimics relationships among critical components, this substantiates the algorithm's indispensable role in comprehending the complex behaviors of intricate systems.
The K-means++ algorithm leverages a combination of Voronoi partitioning and centroid initialization to construct a network structure that bears semblance to a complete graph. This network structure is a powerful tool for unraveling the intricate and often concealed relationships among identified critical components, shedding light on the interconnections that underscore the system's dynamics [21].
At the core of this mechanism lies the strategic initialization of centroids, a step that contributes to creating this network structure [22]. By placing centroids in a well-thought-out manner, the algorithm effectively establishes strong connections between data points and their corresponding centroids. This connectivity forms the foundation of the network representation, allowing it to accurately capture the interconnections and underlying relationships between the system's critical components, which are organized into distinct clusters [7,15,22].
In this network representation, the bonds between data points and centroids are analogous to edges in a graph. Specifically, data points within the same cluster are directly connected [21]. Beyond the construction of this network, the K-means++ algorithm's strategic initialization of centroids engenders several consequential benefits [21,22]:
Enhanced algorithm convergence: The judicious arrangement of centroids aids in enhancing the algorithm's convergence. By ensuring balanced and informed placement, the algorithm converges more rapidly, speeding up identifying critical components and their relationships.
Insights into underlying dynamics: The network structure visually represents the underlying dynamics and interactions among data points within each cluster. This visualization allows for a deeper understanding of how these critical components relate and interact, facilitating extracting of meaningful insights.
Comprehensive representation: K-means++ identifies principal components that capture the most significant variations in the data. This selection process ensures a comprehensive representation of the system's complexity while avoiding the loss of essential information. Consequently, the resulting network encapsulates the system's behavior succinctly yet comprehensively.
Compact, well-defined clusters: The algorithm calculates within-cluster distances, creating compact and well-defined clusters. This characteristic aids in grouping data points that share intrinsic similarities, further enabling the network structure to depict relationships among these critical components accurately.
Integrating the K-means++ algorithm into systems science and engineering constitutes a significant advancement, ushering in transformative perspectives and promising avenues that resonate throughout a spectrum of applications [22,23]. This adoption ushers in a fresh era of optimization for system operation, management, and stability but also empowers decision-makers with insights that bolster system reliability [23].
3. Demonstration Analysis: A Case Study on Power Grid
The investigation conducted on power systems in this study is a showcase of the K-means++ algorithm's inherent capabilities in identifying system dynamics and critical components. In doing so, it illuminates the algorithm's applicability in system modeling, stability analysis, and efficiency enhancement, particularly within the complex systems.
The interactions among agents are considered to identify critical components within the power grid, where each agent represents a node. These agents engage in strategic decision-making, and the payoffs they receive at time t, denoted as , play a pivotal role in our analysis. These payoffs are determined by the product of their respective strategies, and , where i and j refer to individual agents:
represents the set of neighboring agents connected to agent i within the grid.
In recognition of real-world complexities, we account for the presence of noise in the observation process, affecting payoff calculations' accuracy. Consequently, the observed payoff, , is expressed as:
Here, ε signifies the noise observed during a single time interval, and represents the additive noise observed for node i at time point t. It's worth noting that is influenced by the number of neighbors connected to node i.
After calculating payoffs, agents adapt their strategies following the proportion rule, thereby modifying their decision-making processes. Precisely, agents adjust their strategies using the following probability formula:
Here, D represents the maximum payoff difference within the payoff matrix, and ⟨k⟩ denotes the maximum degree among agents i and j, represented as To identify critical components lies the intricate relationship between strategies and payoffs for each agent within the power grid. As the neighbor set remains undisclosed, this relationship can be concisely expressed as:
Where = 1 indicates the presence of a link between agent i and agent j, while = 0 signifies no such link. The virtual payoff, (t), is a product of the strategic choices made by agents i and j and becomes an actual payoff only when a link between the two agents exists.
To address our problem comprehensively, we adopt a matrix formulation for network structure identification. Given the recorded strategies and payoffs across various nodes and time points , our relationship between observed data , the time-series virtual payoff matrix , and the enigmatic network structure vector is defined as:
Where represents the virtual payoff matrix, represents the payoff vector, and signifies the adjacency vector representing the network structure. The composition of the virtual payoff matrix is constructed based on the strategies and payoffs recorded across nodes and time intervals.
Acknowledging the practical occurrence of noise-contaminated data in real-world scenarios, our approach accommodates this phenomenon. Hence, our relationship between observed data, the virtual payoff matrix, and the network structure vector is extended to:
where represents the observation noise vector specific to agent i.
Our primary objective remains to leverage the K-means++ algorithm effectively for the identification and evaluation of critical components within power grids.
Two benchmark power systems were selected to lay the foundation for this demonstration: the IEEE 39-bus system and the IEEE 300-bus system. The deliberate choice of these systems, characterized by diverse configurations and complexities, serves a twofold purpose [7,25,26].
Firstly, it fosters the generalizability of the findings, underscoring their relevance and transferability across a spectrum of intricate systems [25,26]. Secondly, this selection endeavors to establish a foundation for comprehending how the K-means++ algorithm can be harnessed to effectively analyze the behavior of general complex systems that span diverse engineering and scientific disciplines [25,26].
The K-means++ algorithm's ability to construct an all-encompassing network structure is central to the assessment. This structure, as described in the Algorithm 1, is instrumental in encapsulating the relationships that interlink critical components within the system [7].
| Algorithm 1 k-means++ algorithm |
|
Input: Network with buses, range of k values for silhouette analysis Step 1: Initialization and Centroid Selection (K-means++) Initialize randomly distinct centroids: , , ..., . Step 2: k-means++ Clustering Repeat until convergence: a. For each bus in the network: Calculate the Euclidean distance between and each centroid . Assign bus to the cluster with the closest centroid. b. For each cluster : Recalculate the centroid using the formula: . Step 3: Silhouette Value Analysis For each value of in the specified range: a. For each bus in each cluster : Calculate the average closeness using AED measure based on tie-lines. b. For each bus in each cluster : Calculate the minimum of average closeness concerning other clusters . c. For each bus in each cluster : Calculate the silhouette coefficient for each cluster using and . Calculate the average silhouette coefficient for all buses in each cluster . d. Calculate the average silhouette coefficient for all clusters in this value of . Step 4: Selecting Optimal k based on Silhouette Analysis Choose the value of k that maximizes the average silhouette coefficient , indicating the optimal cluster arrangement. Step 5: Final Clusters and Centroids Apply the k-means++ algorithm with the optimal to obtain the final clusters and centroids. Output: Optimal clusters of buses, the value of determined by silhouette analysis This combined algorithm integrates the k-means++ clustering algorithm with the silhouette value analysis to determine the optimal number of clusters and achieve accurate clustering results. The k-means++ algorithm initializes centroids and refines cluster assignments. At the same time, the silhouette analysis assesses the quality of clusters. It identifies the most appropriate value of for optimal Clustering. The final clusters and centroids are obtained using the selected optimal value. |
The similarity between buses residing within each cluster is evaluated. This assessment hinges upon calculating the standard deviation. This metric affords insights into the level of uniformity and cohesion within the clusters. The algorithm's capacity to discern interconnected critical components is applied by analyzing the similarity of buses.
A pivotal evaluation entails comparing net tie-line flows within networks generated by K-means++. These derived networks stand against the original network. This comparative analysis yields insights into how the K-means++-generated network captures the dynamics of the original system.
3.1. Case Study on IEEE 39-Bus System
The IEEE 39-bus system [25], presented in Figure 1, is a standard test case composed of 39 buses, 10 generators, and 18 loads arranged in two interconnected areas linked by four tie-lines. The two areas consist of 24 and 15 buses, respectively, with Bus 30 designated as the slack bus. Two tie-lines are utilized to connect the two areas, forming a basis for clustering. K-means++ method employs average Euclidean distances to cluster buses based on their relationship with the tie-lines.
The accuracy of tie-line flows in equivalent networks, constructed by the K-means++, is analyzed by comparing them with flows in the original network. Different scenarios involving various tie-line combinations are investigated.
The utilization of the K-means++ algorithm in the context of our study has yielded a compelling outcome – the development of a low-rank representation of the complex system through the process of clustering the original network. This achievement is a testament to the algorithm's capability to distill intricate system dynamics into a more manageable structure while preserving critical eigenstructure information. In essence, this low-rank network functions as a complete graph, showcasing the underlying eigenstructure of the system without any deletion of eigenvectors, a critical facet that underlines K-means++ significance.
The graphical depiction of the low-rank network for the IEEE 39-bus system, as depicted in Figure 2, encapsulates the intricate interplay of critical components and their corresponding eigenvalues, offering a concise and insightful view of the system's structural dynamics.
To gauge the robustness and resilience of the K-means++ algorithm, an investigation was undertaken to examine the influence of selecting different buses as the slack bus, a pivotal point in power grid analysis. The results of this investigation, summarized in Table 1, demonstrate the algorithm's independence from the choice of the slack bus within the system.
The precision of the K-means++ algorithm in identifying critical components and the eigenstructure of the system, regardless of the slack bus selection, underscores its robustness in real-world scenarios. This robustness, in turn, offers practitioners and researchers greater flexibility in utilizing the algorithm across a spectrum of complex systems.
The comparison of net tie-line flows under different tie-line combination cases is presented in Table 2. The results indicate that the net tie-line flows in the equivalent networks generated using the K-means++ algorithm exhibit high accuracy.
Furthermore, cluster quality is assessed by examining the similarity of buses within clusters. This similarity is quantified by calculating each cluster's average standard deviation of Euclidean distances. The results in Figure 3 illustrate that the proposed algorithm generates clusters with greater bus similarity, leading to more accurate net tie-line flows.
3.2. Case Study on IEEE 300-Bus System
The IEEE 300-bus system, established by the IEEE Test Systems Task Force in 1993 [26], is a comprehensive test case consisting of 300 buses, 69 generators, and 195 loads, as shown in Figure 4. The interconnected areas are linked through 409 transmission lines. The system is divided into two major areas connected by four tie-lines to scrutinize the effects on transmission line flows. The areas contain 111 and 189 buses, with total loads of 11824.31 MW and 11,701.54 MW, respectively. Slack bus designation is assigned to Bus 7049.
Delving in the deeper theoretical discussion, similar to the manifold learning approach for understanding complex networks, utilizing K-means++, allows to extract meaningful information about the IEEE 300-bus system's structure and critical components in a low-dimensional space, i.e., the low-rank complete graph.
Much like in the manifold learning approach where pairwise distances between samples correspond to shortest paths over the constructed network, our goal is to preserve the essential relationships in the high-dimensional system data as we reduce it to a more manageable and interpretable low-dimensional representation. This process aids in uncovering the inherent structure of the power grid, just as manifold learning unveils the underlying geometry of complex datasets.
K-means++ can identify clusters or groups of nodes that can be thought of as regions in the low-dimensional space. Importantly, this aligns with the concept of conformal models, where distances and relationships in the high-dimensional space are preserved and equivalent in the low-dimensional representation [27,28,29].
Figure 5 illustrates the concept of organizing and grouping data points within a network by mapping them to specific positions or clusters. In part (a) of Figure 5, nodes within a network are embedded into a hyperbolic plane, emphasizing their angular positions and relationships based on their similarity or proximity to centroids. These centroids, akin to the angular positions in hyperbolic embedding, represent central points around which data points are grouped. Furthermore, the assignment of radial coordinates in part (b) of the Figure 5, reflecting the rank of nodes by degree, aligns with K-means++ in the sense that centroids are strategically placed to maximize their proximity to data points. This ensures that data points are grouped around central locations, analogous to how nodes are organized according to their radial coordinates.
The K-means++ method generates different clusters for the same network, and their accuracy is analyzed based on tie-line flow in the equivalent networks. Cluster quality is also assessed in terms of the similarity of buses within each cluster.
The accuracy of tie-line flows in equivalent networks is evaluated by comparing them with those in the original 300-bus network. Different combinations of two tie-lines connecting the network areas are considered. Table 3 presents the results for various scenarios. It is observed that the K-means++ method consistently generates accurate net tie-line flows in the equivalent network.
Cluster quality assessment is conducted by analyzing the similarity of buses within clusters. The standard deviation of Euclidean distances is used to quantify this similarity. The results in Figure 6 indicate that the K-means++ algorithm yields clusters with closer bus relationships, resulting in equivalent networks that closely match the original network's tie-line flows.
3.3. K-Means++ Performance with Limited Data Availability
In practical power grid operations, where network conditions may change rapidly. The algorithm's ability to converge to a stable identified system (topology) ensures its reliability and adaptability in dynamic operational environments. One of the observations in our investigation pertains to the convergence behavior of the K-means++ algorithm. As the method processes and analyzes a continuous stream of data, it gradually converges to a specific network representation and topology.
A specific correlation factor commonly used in statistics is the Pearson correlation coefficient. The Pearson correlation coefficient measures the linear relationship between two sets of data, typically represented as variables X and Y [30]. A positive correlation factor, denoted as rpos, is a specialized correlation measure designed to assess the strength of a positive association between two sets of data. Unlike traditional Pearson correlation coefficients that range from -1 to 1, rpos operates exclusively in the positive domain, with positive correlation represented as 1. Mathematically, it is defined as:
Here, and represent the means of variables X and Y, respectively.
This study conducted an analysis of the recorded outcomes of the K-means++ algorithm at various time steps, with each time step involving the addition of a new block of real-time measurement data to the algorithm's input. The recorded results were examined using a designated positive correlation factor. This behavior is characterized by a steady increase in the correlation factor as an increasing volume of data becomes available. Remarkably, as the dataset grows and more real-time voltage observations are integrated into the analysis, the correlation factor tends towards a value of 1. As illustrated in Figure 7, the investigation findings demonstrate that the K-means++ algorithm exhibits convergence behavior, reaching a stable outcome after approximately 120 observations, while after 50 observations, the algorithm maintains an error rate of less than 10%.
In practical terms, this result underscores the algorithm's adaptability and reliability for real-time power grid management. This not only streamlines decision-making processes for power grid operators but also enhances the algorithm's practical applicability in dynamic and fast-evolving grid scenarios.
To further examine the practical applicability of our method in high-dimensional scenarios, we evaluated the results of power flow simulations across tie-lines in various scenarios within the IEEE 300-bus system. These evaluations were conducted using subsets of the available data, specifically 0.5 and 0.8 of the 2000 observation data pool. The results of these evaluations are summarized in Table 4. Notably, the K-means++ algorithm consistently exhibited convergence behavior across all cases, showcasing low errors, even when utilizing just 0.5 of the available data.
3.4. K-Means++ Performance in Presence of Noise
In order to assess the adaptability and resilience of the K-means++ algorithm in real-world scenarios often plagued by observation noise, we conducted an investigation utilizing the IEEE 300 bus system. In this study, we deliberately introduced uniform noise within the range [0, ], where denotes the noise strength. In the context of power grid measurements, it is typically recommended to keep noise strengths within the range of 0.01 to 0.1 or lower to ensure the accuracy and reliability of results, especially for tasks such as voltage and current monitoring, fault detection, and system stability analysis [31]. Therefore, our investigation tested the algorithm's performance under the highest acceptable noise margin, i.e., .
Table 5 provides an overview of the structural identification outcomes for the IEEE 300 bus system under the influence of noise with a noise strength parameter of . These results unequivocally demonstrate that moderate noise levels have a negligible impact on the performance of the K-means++ algorithm.
The theoretical underpinning for these observations lies in the intrinsic attributes of the algorithm itself. K-means++ possesses an inherent capability to segregate data and form clusters. Even when confronted with low noise levels, the algorithm's proficiency in identifying distinct clusters remains largely unaffected. Consequently, these findings underscore K-means++ as a robust clustering algorithm capable of maintaining its efficacy in the presence of observation noise. Such resilience proves particularly advantageous in practical applications characterized by noisy data.
4. Further Analysis on K-Means++ Robustness to Approximate System Dynamics
To further measure the effectiveness and robustness of the K-means++ approach in approximating system dynamics and identifying critical components an array of selected performance metrics was employed. These metrics serve as objective standards and unravel the intricate sophistication of the algorithm's performance, affirming its capability to unravel the underlying complexities of power systems.
Silhouette Score: The Silhouette Score, a pivotal metric in this evaluation, plays a central role in quantifying cluster separation. This measure considers the distance between data points within a cluster and those in the nearest neighboring cluster, providing insights into the quality of cluster assignments. The Silhouette Score ranges from -1 to 1, where higher values indicate better-defined and well-separated clusters, while negative values imply data points might have been assigned to the wrong clusters [17].
In this study, the Silhouette Score is employed to assess the effectiveness of the K-means++ algorithm in partitioning data into distinct clusters. The remarkable Silhouette Scores of 0.85 for the IEEE 39-bus system and an even more impressive 0.87 for the IEEE 300-bus system signify the algorithm's proficiency in creating well-separated clusters. These scores indicate the algorithm's ability to accurately capture the intricate dynamics intrinsic to power grid behavior, shedding light on the emergent behaviors within the system.
Davies-Bouldin Index: The Davies-Bouldin Index is a crucial measure of the K-means++ algorithm's capability to distinguish critical components within power systems [18]. Calculated by considering the average distance between each cluster's centroid and the centroids of its neighboring clusters, lower Davies-Bouldin Index values suggest more distinct and well-separated clusters. In this context, the Davies-Bouldin Index takes values of 0.28 for the IEEE 39-bus system and 0.23 for the IEEE 300-bus system. These scores reinforce the algorithm's prowess in identifying pivotal elements that significantly shape the overall system behavior [18]. The noteworthy feature of these low Davies-Bouldin Index values is their indication of the algorithm's ability to create coherent and precisely defined clusters [18]. This capacity is pivotal as it mirrors the intricate interconnections and relationships inherent in the power system's architecture, enhancing the algorithm's utility in uncovering critical insights into system dynamics.
Variation of Information: The analysis extends to stability assessment, in which the Variation of Information (VI) score plays a pivotal role [19]. This metric provides valuable insight into the algorithm's robustness within the context of power grid analysis [19]. The Variation of Information score quantifies the difference between two clustering, measuring how much information is gained or lost when transitioning from one clustering to another [19]. The achieved Variation of Information scores is as low as 0.06 for both the IEEE 39-bus and IEEE 300-bus systems. These notably low scores affirm the algorithm's unwavering consistency in approximating power system dynamics and accurately identifying critical components. The stability metric, represented by the Variation of Information score, is a testament to the algorithm's reliability and resilience [19]. This reinforces its role as a dependable and trustworthy tool for conducting in-depth system analysis within the intricate domain of power systems, offering valuable insights into the behavior and interactions of complex systems.
In sum, the utilization of diverse performance metrics, including the Silhouette Score, Davies-Bouldin Index, and Variation of Information score, serves as a rigorous validation of the K-means++ algorithm's potency in approximating power system dynamics and uncovering critical components. These metrics collectively attest to the algorithm's efficacy in constructing well-separated clusters, identifying pivotal elements, and affirming its stability and reliability in the intricate arena of power grid analysis.
5. Conclusions
This paper serves as a resounding testament to the significance of the K-means++ algorithm, transcending its conventional role as a mere clustering technique to emerge as a tool in systems analysis and cybernetics. Leveraging measurement-based analysis, this study:
- -
- showcases the algorithm's prowess in identifying critical components,
- -
- sheds light on its ability to approximate complex systems' intricate dynamics,
- -
- demonstrated the resilience of K-means++ performance to the noise,
- -
- examined the practical potential of the incorporating K-means++ in real-time application with limited available data,
- -
- provide a demonstration through a case study, centered on the power system, of this transformative potential,
- -
- further fortified by additional performance metrics.
The synergy between the algorithm's ability to accurately model net tie-line flows and foster clusters with increased bus similarity not only signified its capability to reveal latent patterns and inherent system dynamics, highlighting its transformative potential for comprehensive system analysis, but also extended to the broader power system research and application domain, suggesting potential applications in long-term planning, optimization, and strategic decision-making. This research provides a foundation for further investigation into equilibrium points and their relationships within power systems, potentially leading to more efficient system restoration, fault management, and operational enhancements.
From a broader perspective, the attributes of the K-means++ approach offer versatility that extends beyond power grids. It has the potential to be applied in various domains, such as transportation networks, social systems, and telecommunications, by effectively capturing complex interrelationships within systems.
Authors' Contributions
The contributions of the authors for this research article are as follows: Conceptualization, Reza Saeed Kandezy and John Jiang; methodology, Reza Saeed Kandezy; software, Reza Saeed Kandezy; validation, Reza Saeed Kandezy and John Jiang; formal analysis, Reza Saeed Kandezy; investigation, Reza Saeed Kandezy; resources, John Jiang; data curation, Reza Saeed Kandezy; writing—original draft preparation, Reza Saeed Kandezy; writing—review and editing, Reza Saeed Kandezy; visualization, Reza Saeed Kandezy; supervision, John Jiang. All authors have read and agreed to the published version of the manuscript.
Funding
This research received no external funding.
Availability of data and materials
Not applicable.
Acknowledgments
We express our profound appreciation to all those who contributed directly or indirectly to the successful completion of this research paper with their valuable time, insights, recommendations, and support.
Competing interests
The authors declare that they have no competing interests.
References
- Fujimoto, Richard, Conrad Bock, Wei Chen, Ernest Page, and Jitesh H. Panchal, eds. Research challenges in modeling and simulation for engineering complex systems. Cham, Switzerland: Springer International Publishing, 2017.
- Hempel, Stefan, Aneta Koseska, Jürgen Kurths, and Zora Nikoloski. "Inner composition alignment for inferring directed networks from short time series." Physical review letters 107, no. 5 (2011): 054101. [CrossRef]
- Liu, Hui, Jun-An Lu, Jinhu Lü, and David J. Hill. "Structure identification of uncertain general complex dynamical networks with time delay." Automatica 45, no. 8 (2009): 1799-1807. [CrossRef]
- Han, Xiao, Zhesi Shen, Wen-Xu Wang, and Zengru Di. "Robust reconstruction of complex networks from sparse data." Physical review letters 114, no. 2 (2015): 028701. [CrossRef]
- Zhang, Yichi, Chunhua Yang, Keke Huang, Marko Jusup, Zhen Wang, and Xuelong Li. "Reconstructing heterogeneous networks via compressive sensing and clustering." IEEE Transactions on Emerging Topics in Computational Intelligence 5, no. 6 (2020): 920-930. [CrossRef]
- Kim, M.W., Kim, K.T. and Youn, H.Y., 2019, December. Node Clustering Based on Feature Correlation and Maximum Entropy for WSN. In 2019 Tenth International Conference on Intelligent Control and Information Processing (ICICIP) (pp. 184-191). IEEE.
- Sharma, D., Thulasiraman, K., Wu, D. and Jiang, J.N., 2019. A network science-based k-means++ clustering method for power systems network equivalence. Computational Social Networks, 6, pp.1-25. [CrossRef]
- Deshpande, A., Kacham, P. and Pratap, R., 2020, August. Robust $ k $-means++. In Conference on Uncertainty in Artificial Intelligence (pp. 799-808). PMLR.
- Wan, L., Zhang, G., Li, H. and Li, C., 2021. A novel bearing fault diagnosis method using spark-based parallel ACO-K-Means clustering algorithm. IEEE Access, 9, pp.28753-28768. [CrossRef]
- Xiong, H., Wu, J. and Chen, J., 2006, August. K-means clustering versus validation measures: a data distribution perspective. In Proceedings of the 12th ACM SIGKDD international conference on Knowledge discovery and data mining (pp. 779-784).
- Anderson, B.D. and Vongpanitlerd, S., 2013. Network analysis and synthesis: a modern systems theory approach. Courier Corporation.
- Jabi, M., Pedersoli, M., Mitiche, A. and Ayed, I.B., 2019. Deep clustering: On the link between discriminative models and k-means. IEEE transactions on pattern analysis and machine intelligence, 43(6), pp.1887-1896. [CrossRef]
- Mallat, Stéphane G., and Zhifeng Zhang. "Matching pursuits with time-frequency dictionaries." IEEE Transactions on signal processing 41, no. 12 (1993): 3397-3415. [CrossRef]
- Makarychev, K., Reddy, A. and Shan, L., 2020. Improved guarantees for k-means++ and k-means++ parallel. Advances in Neural Information Processing Systems, 33, pp.16142-16152.
- Huang, R., Chen, Y., Yin, T., Li, X., Li, A., Tan, J., Yu, W., Liu, Y. and Huang, Q., 2021. Accelerated derivative-free deep reinforcement learning for large-scale grid emergency voltage control. IEEE Transactions on Power Systems, 37(1), pp.14-25. [CrossRef]
- Rafiq, M.N., Sharma, D., Wu, D., Jiang, J.N. and Kang, C., 2017, September. Average electrical distance-based bus clustering method for network equivalence. In 2017 19th International Conference on Intelligent System Application to Power Systems (ISAP) (pp. 1-6). IEEE.
- Shahapure, K.R. and Nicholas, C., 2020, October. Cluster quality analysis using silhouette score. In 2020 IEEE 7th international conference on data science and advanced analytics (DSAA) (pp. 747-748). IEEE.
- Petrovic, S., 2006, October. A comparison between the silhouette index and the davies-bouldin index in labelling ids clusters. In Proceedings of the 11th Nordic workshop of secure IT systems (Vol. 2006, pp. 53-64). Citeseer.
- Meilă, M., 2003, August. Comparing clusterings by the variation of information. In Learning Theory and Kernel Machines: 16th Annual Conference on Learning Theory and 7th Kernel Workshop, COLT/Kernel 2003, Washington, DC, USA, August 24-27, 2003. Proceedings (pp. 173-187). Berlin, Heidelberg: Springer Berlin Heidelberg.
- Meng, J., Yu, Z., Cai, Y. and Wang, X., 2023. K-Means++ Clustering Algorithm in Categorization of Glass Cultural Relics. Applied Sciences, 13(8), p.4736. [CrossRef]
- Arthur, D. and Vassilvitskii, S., 2007, January. K-means++ the advantages of careful seeding. In Proceedings of the eighteenth annual ACM-SIAM symposium on Discrete algorithms (pp. 1027-1035).
- Drineas, P., Frieze, A., Kannan, R., Vempala, S. and Vinay, V., 2004. Clustering large graphs via the singular value decomposition. Machine learning, 56, pp.9-33. [CrossRef]
- Ran, D., Jiaxin, H. and Yuzhe, H., 2020, June. Application of a Combined Model based on K-means++ and XGBoost in Traffic Congestion Prediction. In 2020 5th International Conference on Smart Grid and Electrical Automation (ICSGEA) (pp. 413-418). IEEE.
- Gao, M., Pan, S., Chen, S., Li, Y., Pan, N., Pan, D. and Shen, X., 2021. Identification method of electrical load for electrical appliances based on K-Means++ and GCN. IEEE Access, 9, pp.27026-27037. [CrossRef]
- Luc Gérin-Lajoie. IEEE PES Task Force on Benchmark Systems for Stability Controls[R]. EMTP-RV 39-bus system, Version 1.5 - Mars 04, 2015.
- Grigg, C., Wong, P., Albrecht, P., Allan, R., Bhavaraju, M., Billinton, R., Chen, Q., Fong, C., Haddad, S., Kuruganty, S. and Li, W., 1999. The IEEE reliability test system-1996. A report prepared by the reliability test system task force of the application of probability methods subcommittee. IEEE Transactions on power systems, 14(3), pp.1010-1020. [CrossRef]
- Cayton, Lawrence. Algorithms for manifold learning. eScholarship, University of California, 2008.
- Belkin, Mikhail, and Partha Niyogi. "Laplacian eigenmaps and spectral techniques for embedding and clustering." Advances in neural information processing systems 14 (2001).
- Zemel, Richard, and Miguel Carreira-Perpiñán. "Proximity graphs for clustering and manifold learning." Advances in neural information processing systems 17 (2004).
- Cohen, Israel, Yiteng Huang, Jingdong Chen, Jacob Benesty, Jacob Benesty, Jingdong Chen, Yiteng Huang, and Israel Cohen. "Pearson correlation coefficient." Noise reduction in speech processing (2009): 1-4.
- López-Caraballo, Carlos Hugo, Juan A. Lazzús, Ignacio Salfate, Pedro Rojas, Marco Rivera, and Luis Palma-Chilla. "Impact of noise on a dynamical system: Prediction and uncertainties from a swarm-optimized neural network." Computational Intelligence and Neuroscience 2015 (2015): 74-74. [CrossRef]
Figure 1.
The single line diagram of IEEE 39-bus system.
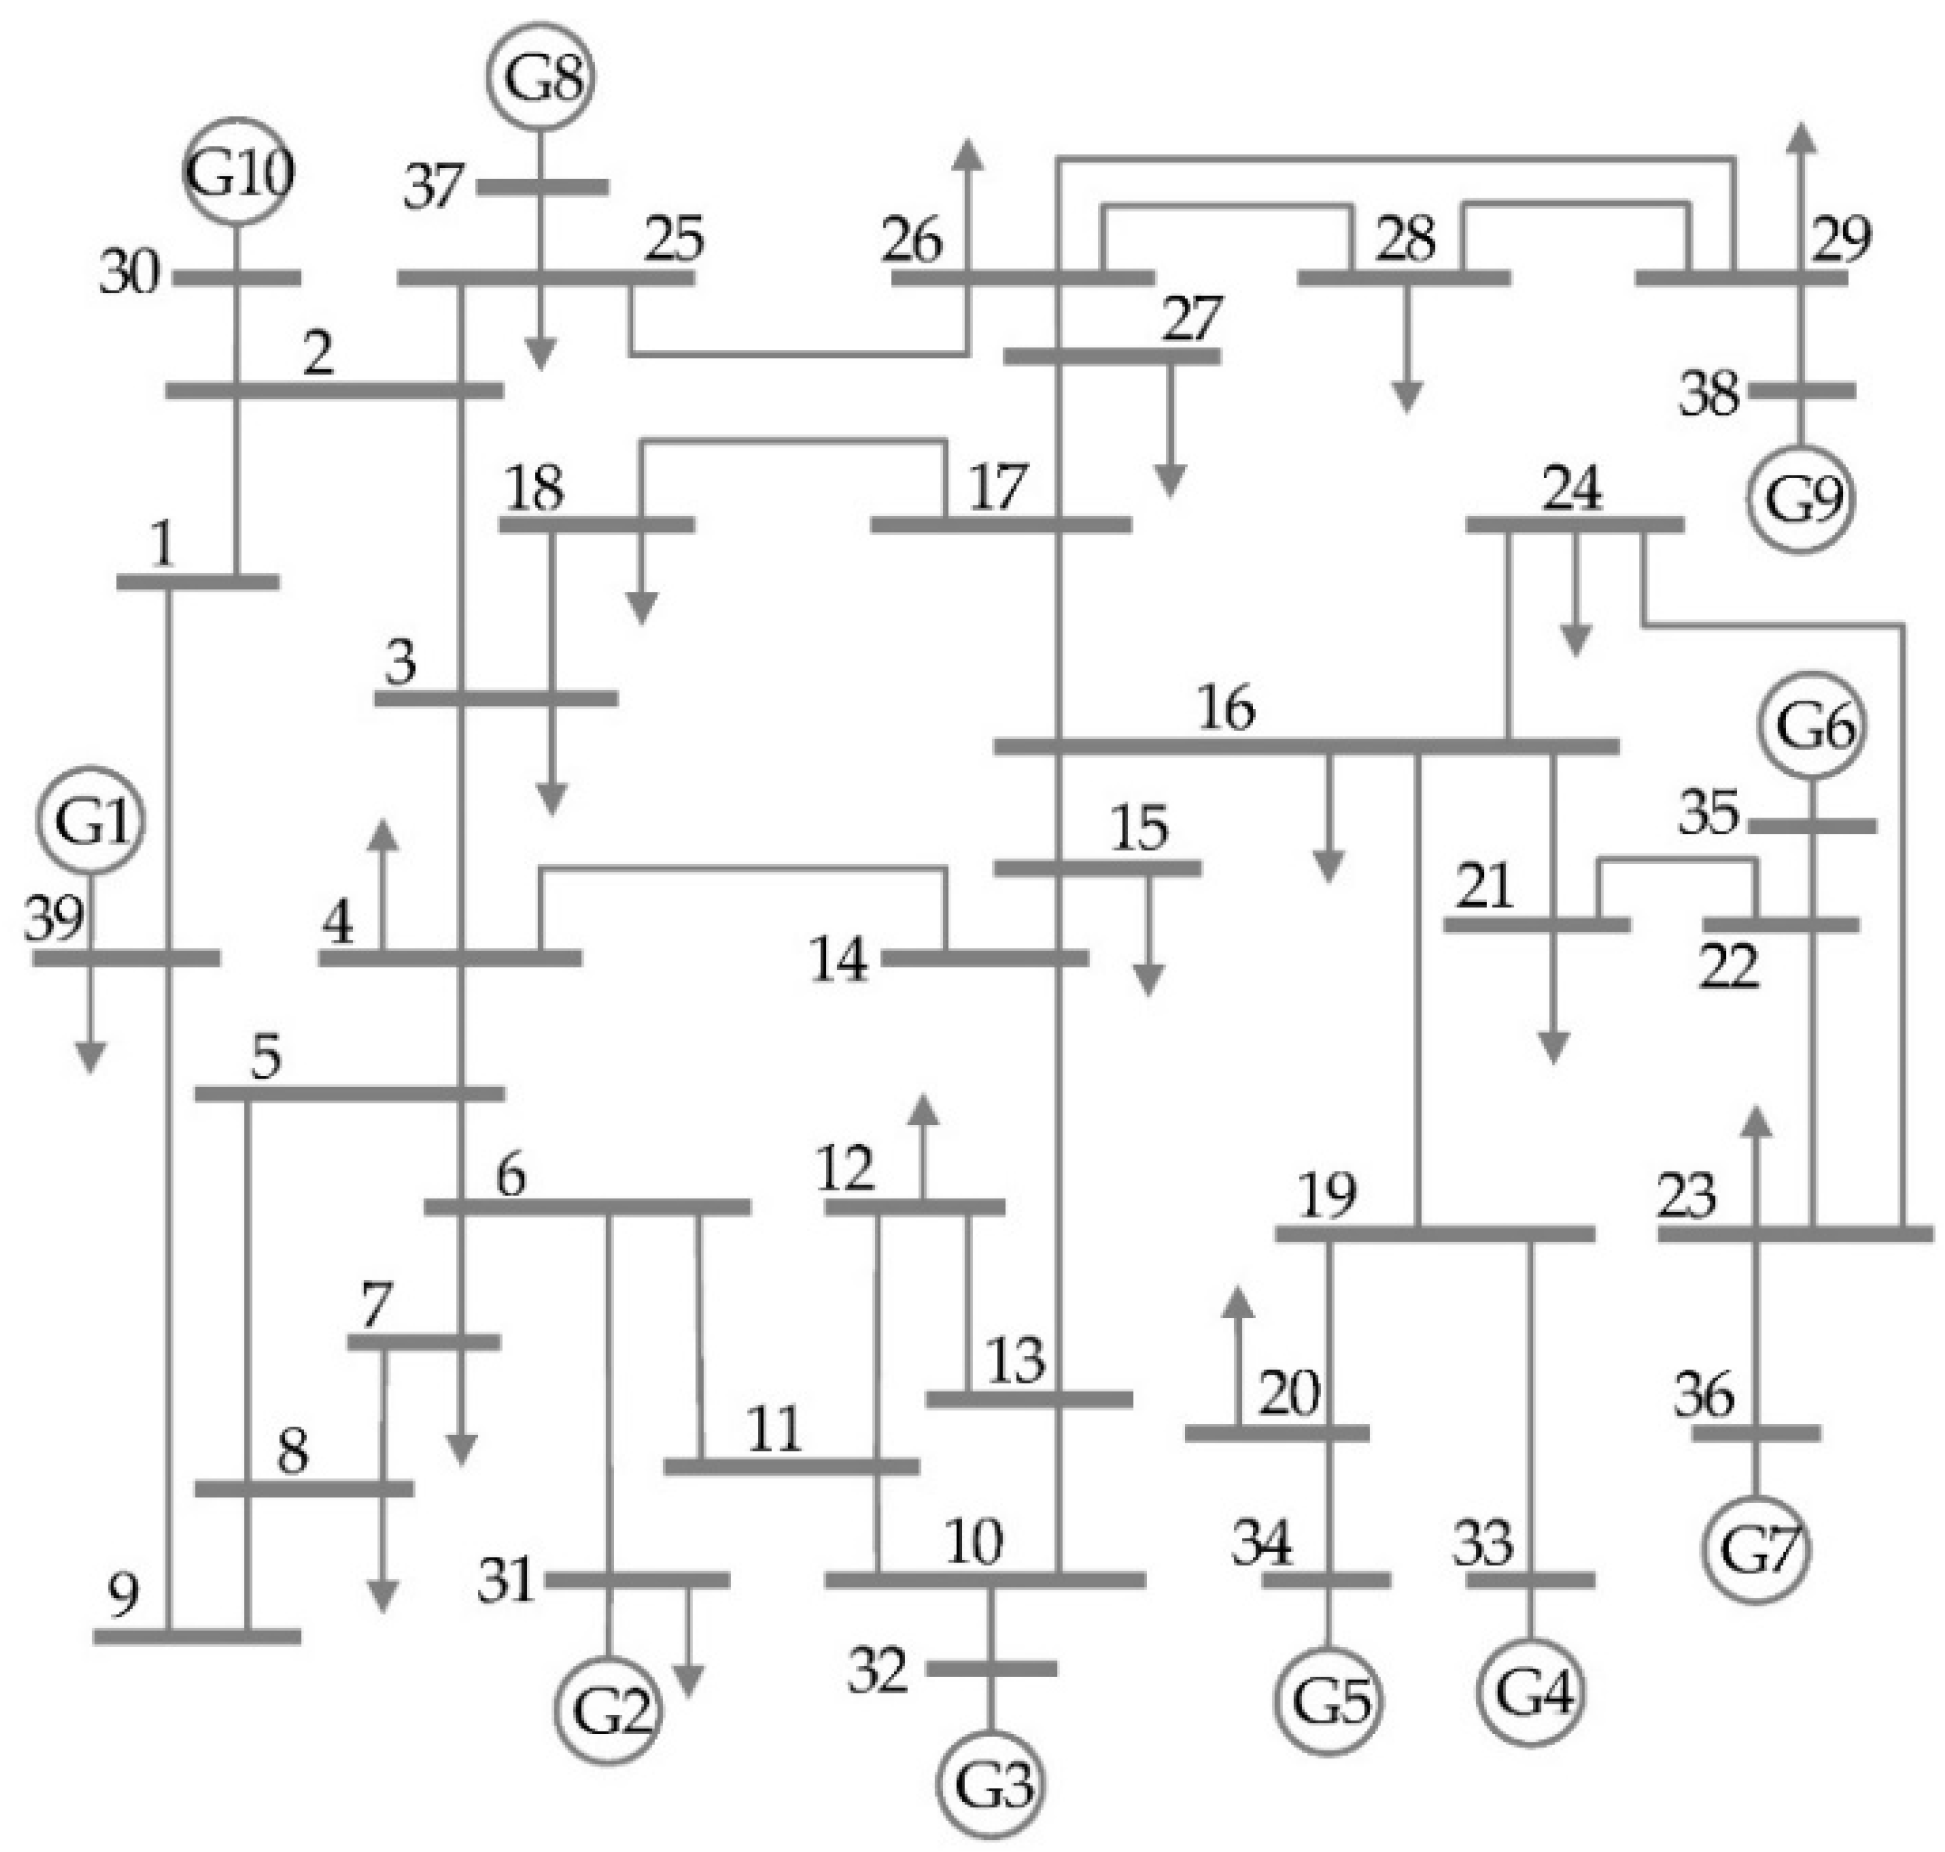
Figure 2.
The low-rank complete graph of identified clusters for slack generator 39 and tie-line 25-26.
Figure 2.
The low-rank complete graph of identified clusters for slack generator 39 and tie-line 25-26.
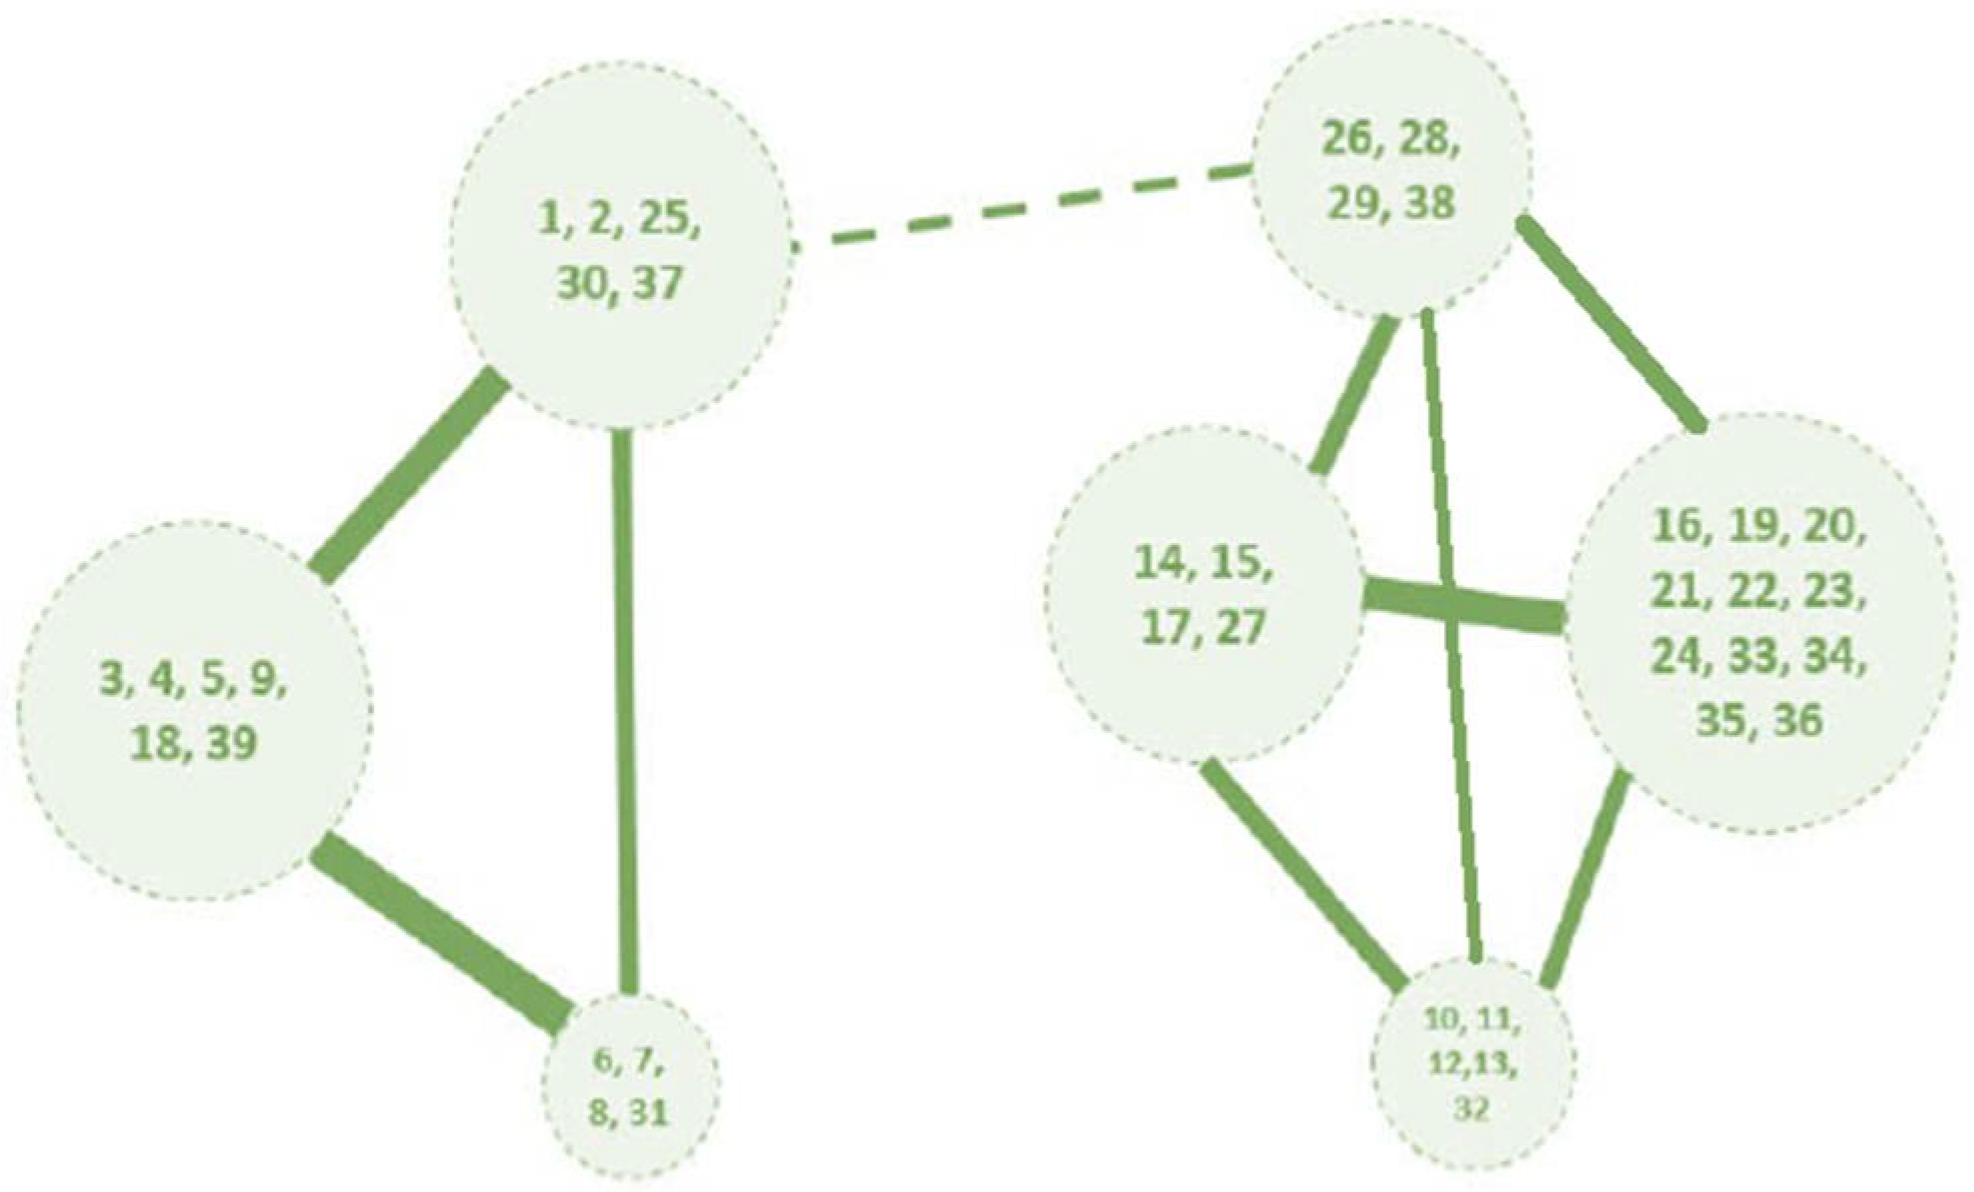
Figure 3.
Averages of standard deviations of Euclidean distances in K-means++ clusters for 39-bus system.
Figure 3.
Averages of standard deviations of Euclidean distances in K-means++ clusters for 39-bus system.
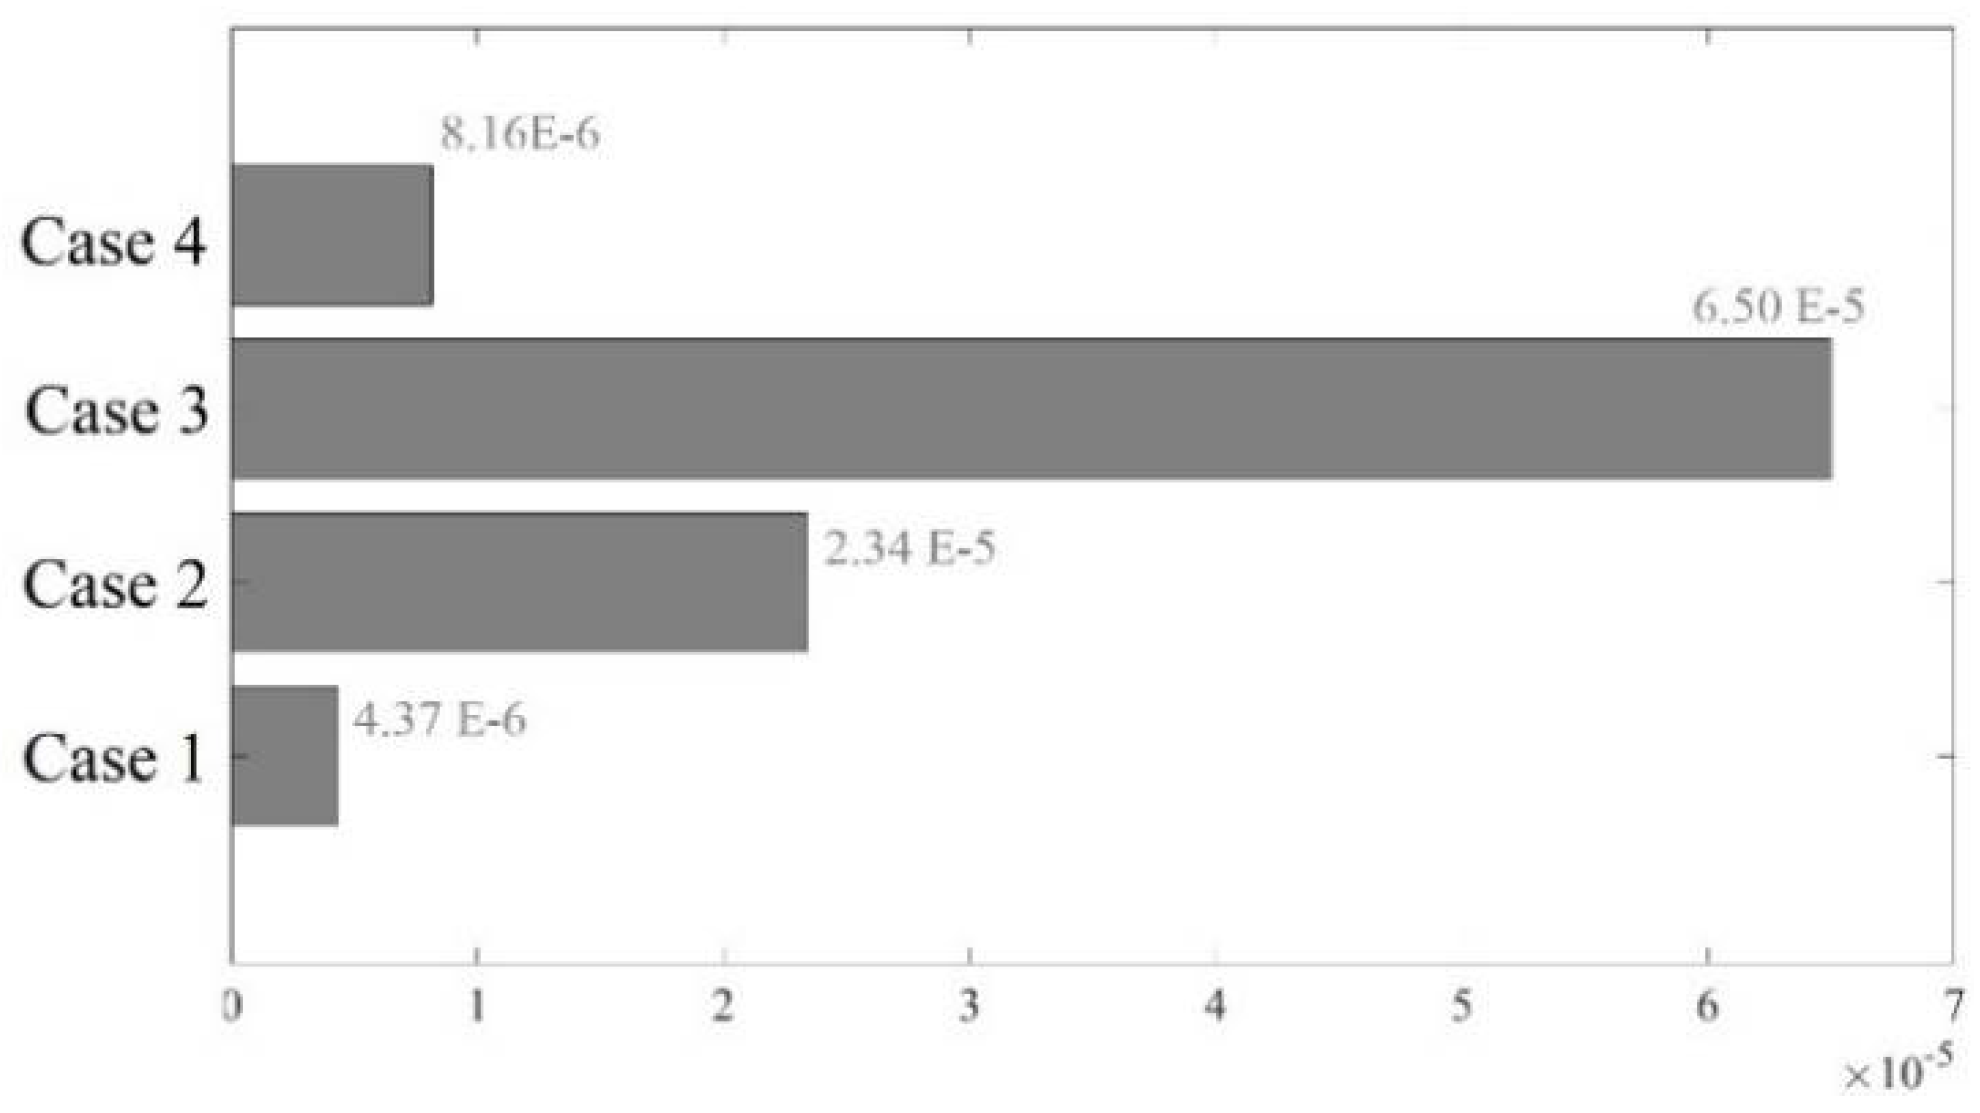
Figure 4.
The single line diagram of IEEE 300-bus system.
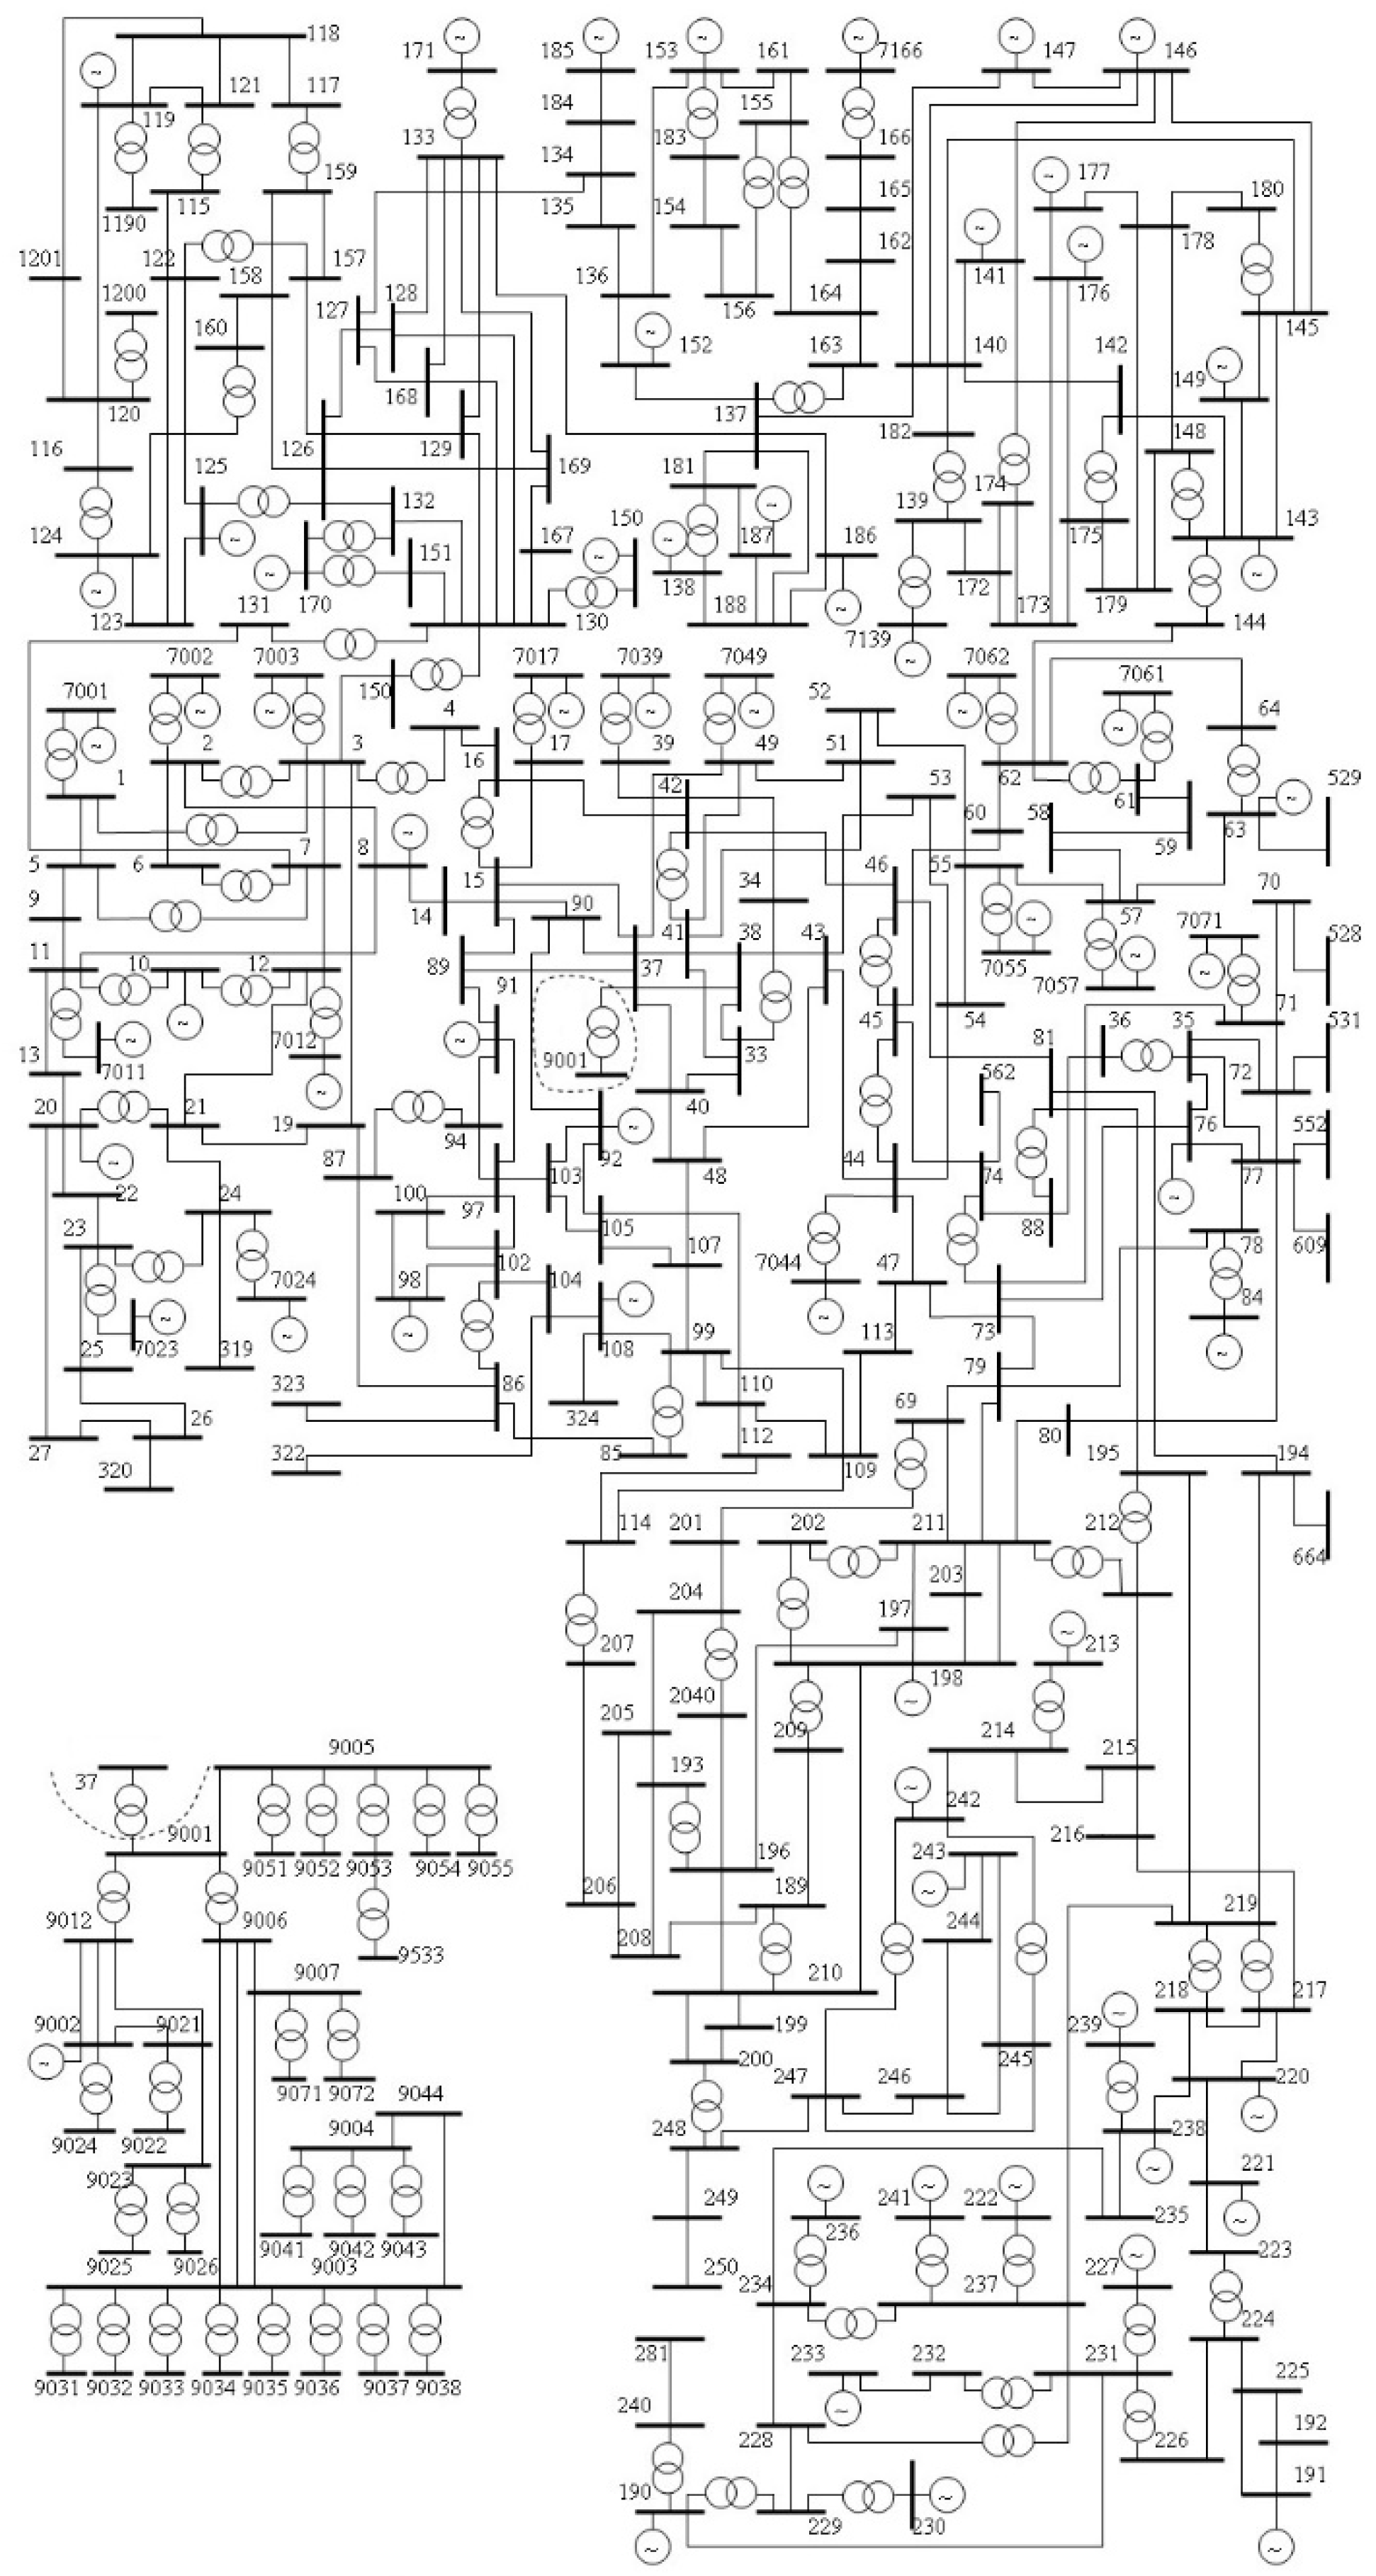
Figure 5.
Illustration of intrinsic hyperbolic network embedding in K-means++, a) angular and b) radial coordinates mapping.
Figure 5.
Illustration of intrinsic hyperbolic network embedding in K-means++, a) angular and b) radial coordinates mapping.
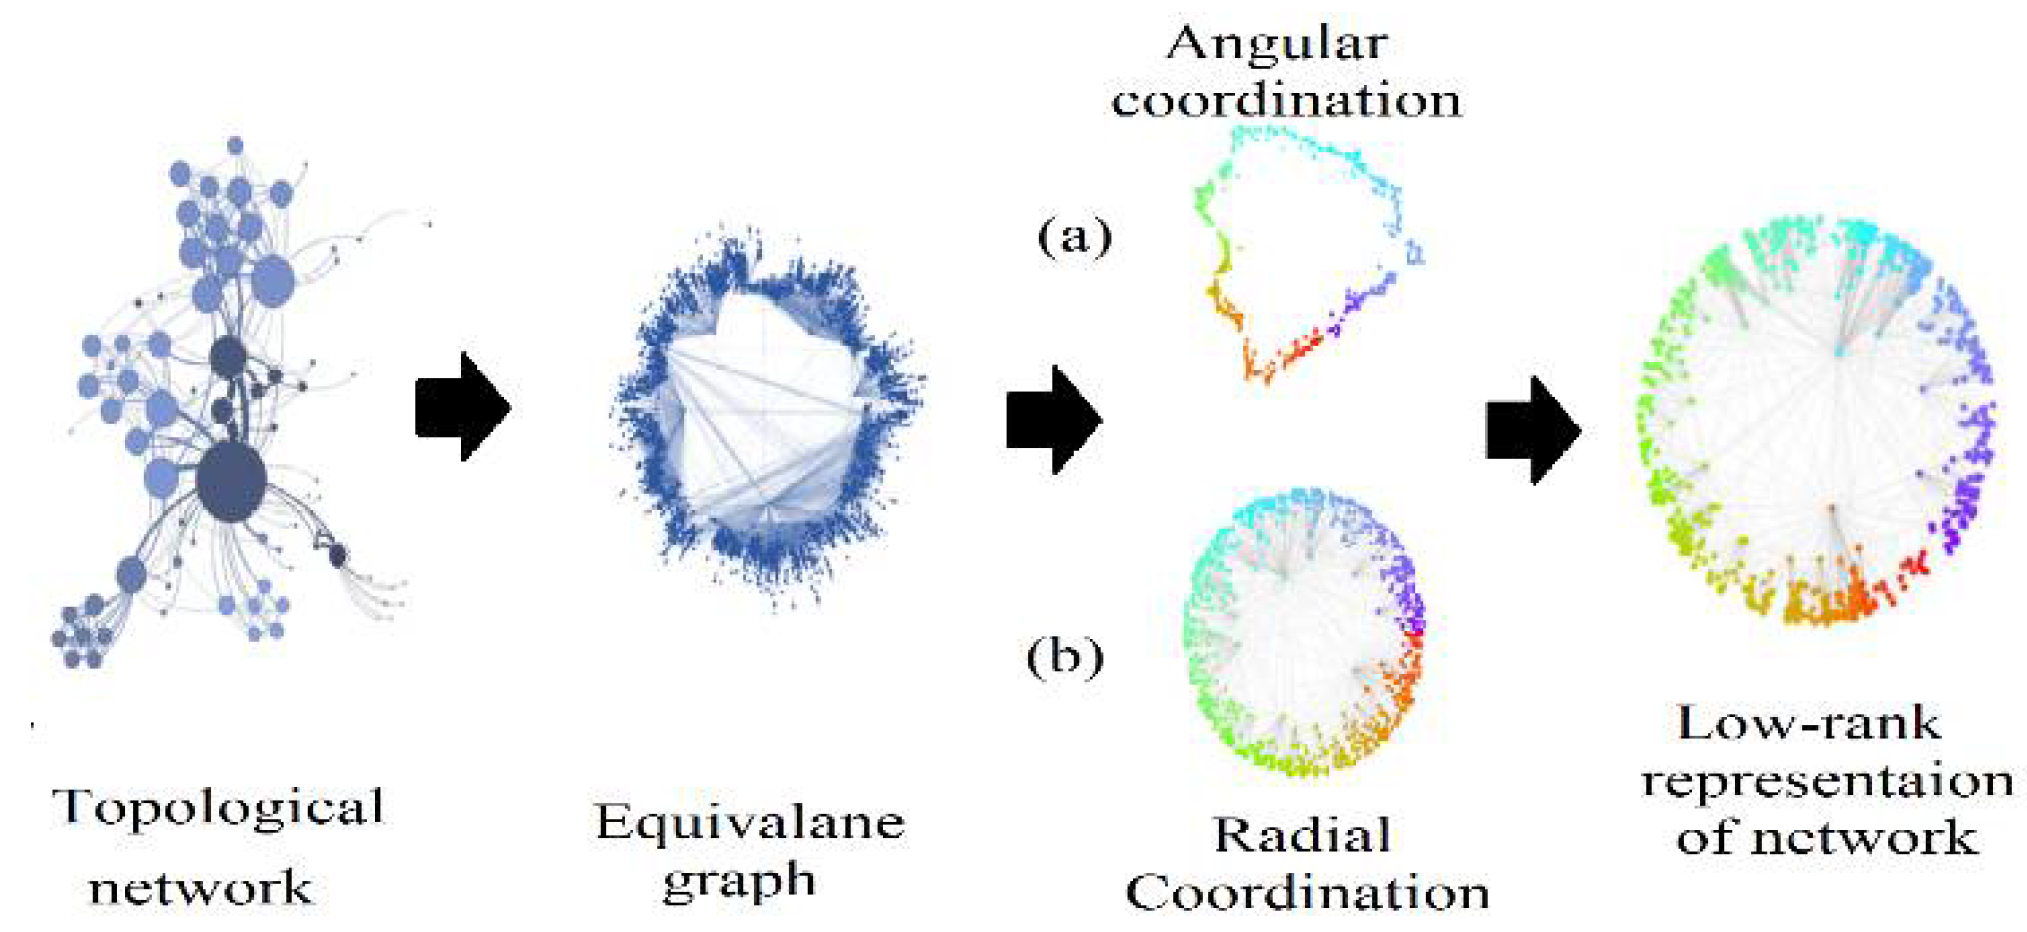
Figure 6.
Averages of standard deviations of Euclidean distances in K-means++ clusters for 300-bus system.
Figure 6.
Averages of standard deviations of Euclidean distances in K-means++ clusters for 300-bus system.
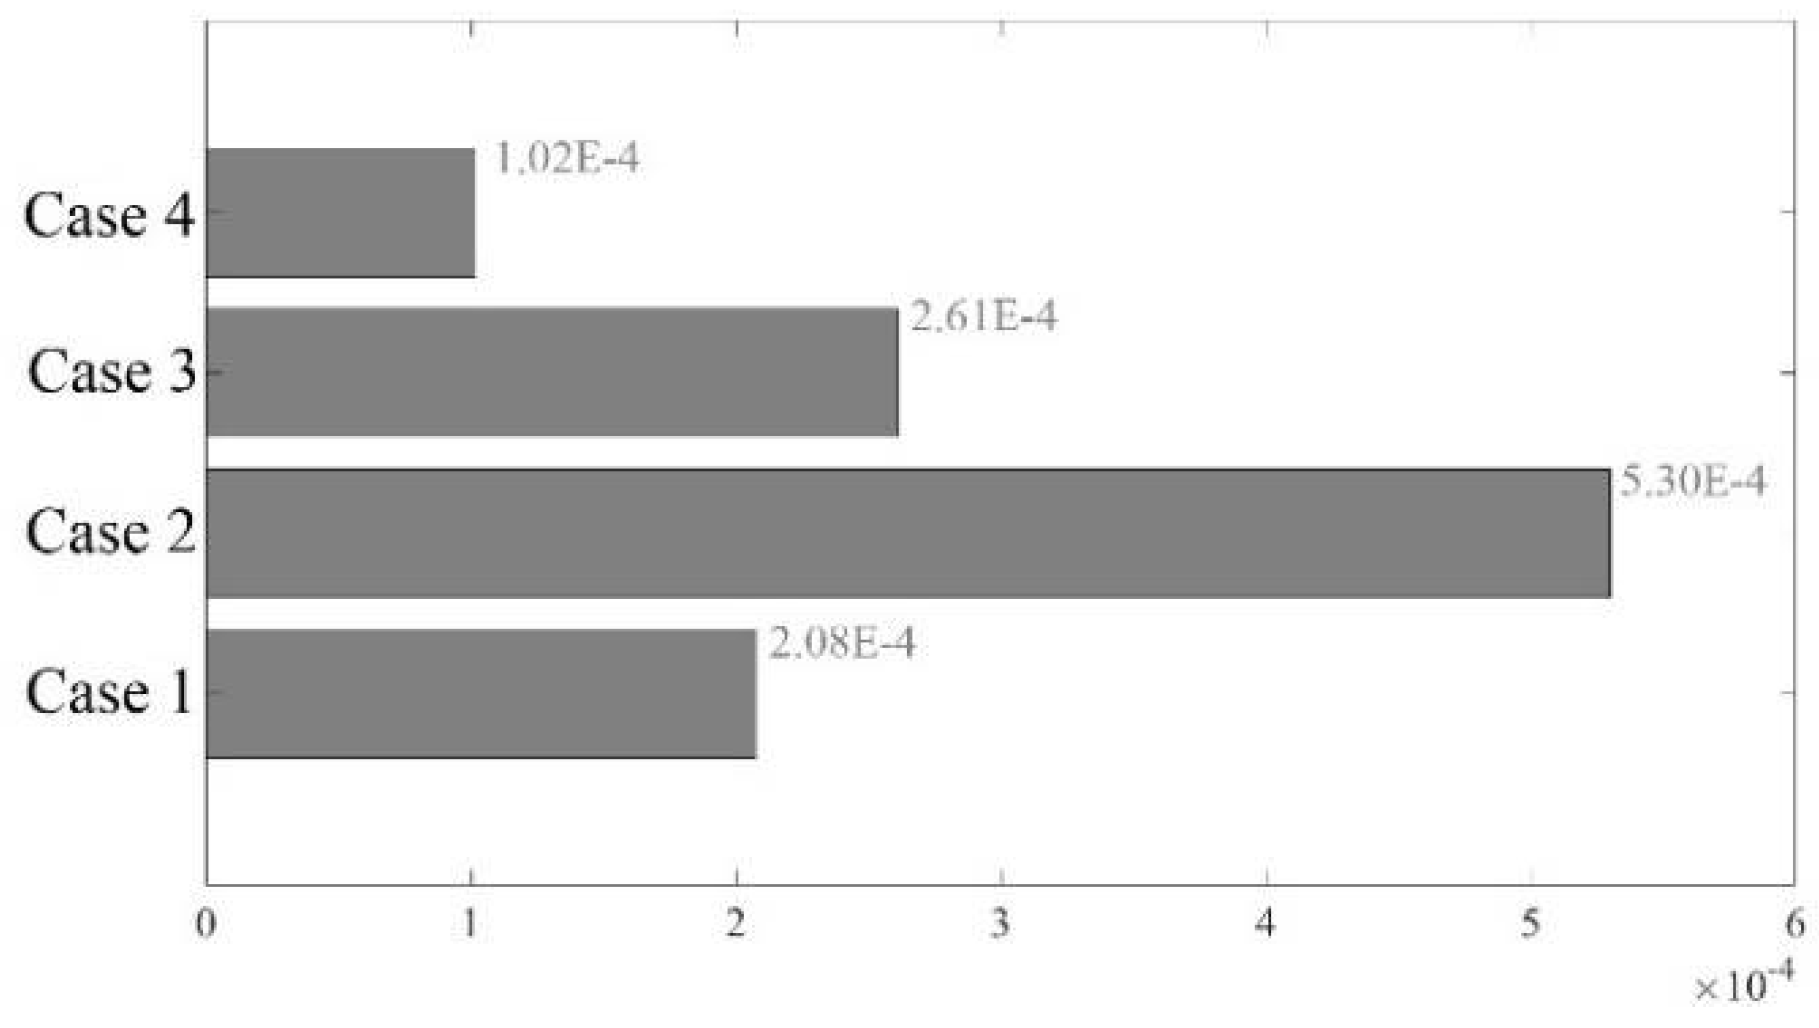
Figure 7.
Illustration of the convergence in the K-means++ system identification for 39-bus system.
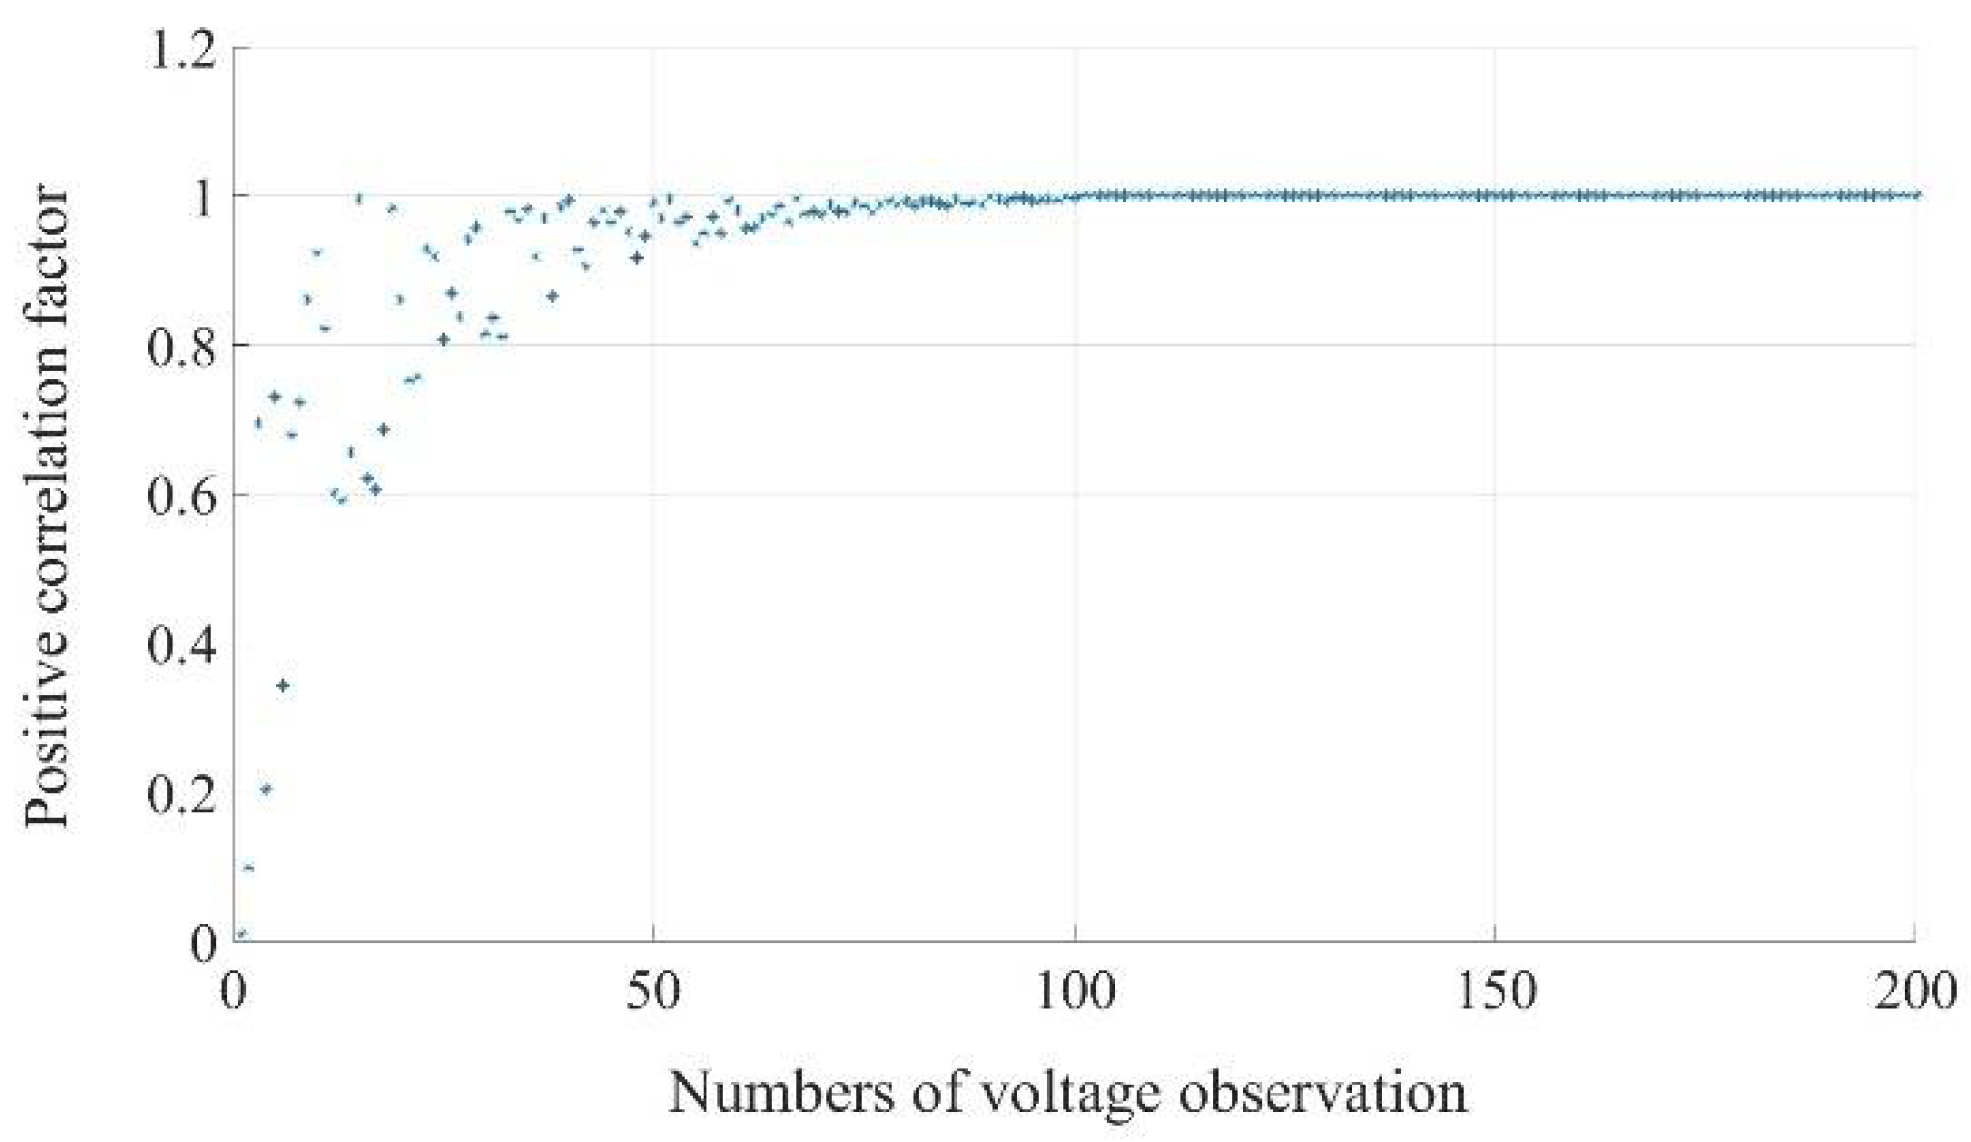

Table 1.
Identified clusters in the low-rank representation of IEEE 39 bus system with different slack generator for tie-line 25-26.
Table 1.
Identified clusters in the low-rank representation of IEEE 39 bus system with different slack generator for tie-line 25-26.
| Slack bus 30 | Slack bus 39 | ||
|---|---|---|---|
|
Cluster Name |
Buses in Clusters |
Cluster Name |
Buses in Clusters |
| 1 | 26, 28, 29, 38 | 1 | 26, 28, 29, 38 |
| 2 | 16, 19, 20, 21, 22, 23, 24, 33, 34, 35, 36 | 2 | 16, 19, 20, 21, 22, 23, 24, 33, 34, 35, 36 |
| 3 | 10, 11, 12, 13, 32 | 3 | 10, 11, 12, 13, 32 |
| 4 | 14, 15, 17, 27 | 4 | 14, 15, 17, 27 |
| 5 | 25, 30, 37, 1, 2 | 5 | 25, 30, 37, 1, 2 |
| 6 | 3, 4, 5, 9, 18, 39 | 6 | 3, 4, 5, 9, 18, 39 |
| 7 | 6, 7, 8, 31 | 7 | 6, 7, 8, 31 |
Table 2.
Comparison of net tie-line power flows in the original network and K-means++ equivalent networks for 39 bus system.
Table 2.
Comparison of net tie-line power flows in the original network and K-means++ equivalent networks for 39 bus system.
| Case# | Tie-line combination | Original Network flow (MW) |
K-means++ equivalent network | |
|---|---|---|---|---|
| Flow (MW) | Deviation (%) | |||
| 1 | TL25–26/TL17–18 | 41.30 | 41.34 | 0.10 |
| 2 | TL25–26/TL4–14 | 35.78 | 35.75 | 0.09 |
| 3 | TL25–26/TL6–11 | 41.50 | 40.49 | 2.43 |
| 4 | TL4–14/TL6–11 | 32.81 | 32.77 | 0.12 |
Table 3.
Comparison of net tie-line power flows in the original network and K-means++ equivalent networks for 300 bus system.
Table 3.
Comparison of net tie-line power flows in the original network and K-means++ equivalent networks for 300 bus system.
| Case# | Tie-line combination | Original Network flow (MW) |
K-means++ equivalent network | |
|---|---|---|---|---|
| Flow (MW) | Deviation (%) | |||
| 1 | TL19–87/TL4–16 | 1051.79 | 1032.31 | 1.85 |
| 2 | TL19–87/TL62–144 | 55.34 | 57.93 | 4.68 |
| 3 | TL8–14/TL62–144 | 450.86 | 487.01 | 8.02 |
| 4 | TL4–16/TL62–144 | 994.46 | 973.19 | 2.14 |
Table 4.
Performance comparison of K-means++ using net tie-line power flows for the IEEE 300 bus system under different data availability conditions: full, 0.8, and 0.5.
Table 4.
Performance comparison of K-means++ using net tie-line power flows for the IEEE 300 bus system under different data availability conditions: full, 0.8, and 0.5.
| Case# | Tie-line combination | Original Network flow (MW) |
K-means++ equivalent network Flow (MW) | ||
|---|---|---|---|---|---|
| Full data | 0.8 data | 0.5 data | |||
| 1 | TL19–87/TL4–16 | 1051.79 | 1032.31 | 1032.27 | 1031.13 |
| 2 | TL19–87/TL62–144 | 55.34 | 57.93 | 57.84 | 57.39 |
| 3 | TL8–14/TL62–144 | 450.86 | 487.01 | 486.55 | 486.02 |
| 4 | TL4–16/TL62–144 | 994.46 | 973.19 | 973.01 | 972.88 |
Table 5.
Performance comparison of K-means++ using net tie-line power flows for the IEEE 300 bus system with noisy data.
Table 5.
Performance comparison of K-means++ using net tie-line power flows for the IEEE 300 bus system with noisy data.
| Case# | Tie-line combination | Original Network flow (MW) |
K-means++ equivalent network Flow (MW) | |
|---|---|---|---|---|
| Without Noise | With Noise |
|||
| 1 | TL19–87/TL4–16 | 1051.79 | 1032.31 | 1034.33 |
| 2 | TL19–87/TL62–144 | 55.34 | 57.93 | 57.82 |
| 3 | TL8–14/TL62–144 | 450.86 | 487.01 | 490.03 |
| 4 | TL4–16/TL62–144 | 994.46 | 973.19 | 980.75 |
Disclaimer/Publisher’s Note: The statements, opinions and data contained in all publications are solely those of the individual author(s) and contributor(s) and not of MDPI and/or the editor(s). MDPI and/or the editor(s) disclaim responsibility for any injury to people or property resulting from any ideas, methods, instructions or products referred to in the content. |
© 2024 by the authors. Licensee MDPI, Basel, Switzerland. This article is an open access article distributed under the terms and conditions of the Creative Commons Attribution (CC BY) license (http://creativecommons.org/licenses/by/4.0/).
Copyright: This open access article is published under a Creative Commons CC BY 4.0 license, which permit the free download, distribution, and reuse, provided that the author and preprint are cited in any reuse.


