
Submitted:
14 June 2024
Posted:
14 June 2024
You are already at the latest version
Abstract
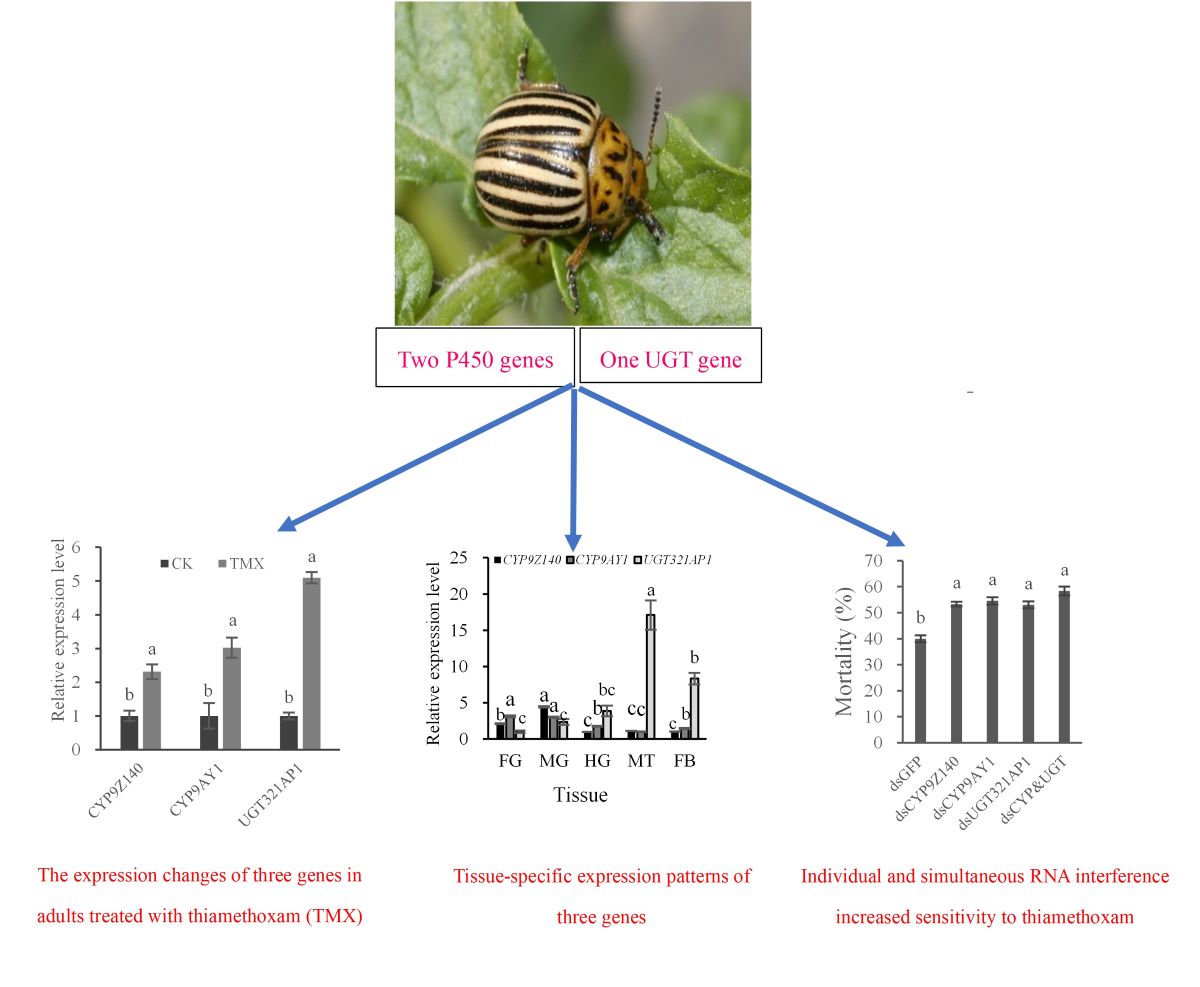
Cytochrome P450 monooxygenases (P450s) and UDP-glycosyltransferases (UGTs) are involved in the evolution of insecticide resistance. Leptinotarsa decemlineata (Say), Colorado potato beetle (CPB), is the notorious insect that has developed resistance to various of insecticides including neonicotinoids. This study investigated whether the differentially expressed P450 genes CYP9Z140 and CYP9AY1 and UGT gene UGT321AP1, found from our transcriptome results conferred resistance to thiamethoxam in L. decemlineata. Resistance monitoring showed that sampled field populations of L. decemlineata adults collected from Urumqi City, Qapqal, Jimsar and Mulei County of Xinjiang in 2021-2023 developed low levels to thiamethoxam with resistance ratios ranging from 6.66- to 9.52-fold. Expression analyses indicated that CYP9Z140, CYP9AY1, and UGT321AP1 were significantly upregulated in thiamethoxam-resistant populations compared with susceptible population. The expression of all three genes also increased significantly after thiamethoxam treatment compared with control. Spatiotemporal expression patterns showed that the highest expression of CYP9Z140 and CYP9AY1 occurred in pupae and midgut, whereas UGT321AP1 was highly expressed in adults and Malpighian tubules. Knocking down all three genes individually or simultaneously using RNA interference increased the sensitivity of adult L. decemlineata to thiamethoxam. These results suggest that overexpression of CYP9Z140, CYP9AY1, and UGT321AP1 contribute to the development of thiamethoxam resistance in L. decemlineata and provide scientific basis for improving new resistance management of CPB.
Keywords:
Leptinotarsa decemlineata
; thiamethoxam
; resistance
; cytochrome P450
; UDP-glycosyltransferase
; RNA interference
1. Introduction
The Colorado potato beetle (CPB), Leptinotarsa decemlineata Say (Coleoptera: Chrysomelidae), is a notorious insect pest of solanaceous crops causing considerable economic losses. In China, the beetle is mainly distributed in the north potato-growing areas north of Tianshan in Xinjiang and has spread to northeast China in recent years, which poses serious threat to the potato production [1]. Currently, the application of various insecticides is still the most effective way to control CPB. The neonicotinoid agent thiamethoxam has been commonly applied for CPB in Xinjiang for nearly two decades; however, such excessive reliance has led inevitably to resistance developing in local CPB populations [2,3].
Insects develop insecticide resistance typically by decreased target sensitivity and enhanced metabolic detoxification. Mutations in nicotinic acetylcholine receptor (nAChR) subunits α1, α3, and β1 confer resistance to the neonicotinoid insecticide imidacloprid against Nilaparvata lugens and Aphis gossypii [4,5], whereas downregulation of the nAChR subunits Ldα1, Ldα3, Ldα8, and Ldβ1 from L. decemlineata is involved in thiamethoxam tolerance [6,7,8]. In addition, research has shown that resistance to neonicotinoids was commonly related to the enhanced activity of detoxification enzymes, particularly cytochrome P450 monooxygenases (P450s). Whole-genome sequence analysis and simultaneous examination of the expression of multiple genes revealed that P450 gene upregulation in insecticide-resistant strains resulting from the evolutionary plasticity of P450 was common in many species [9,10]; for example, overexpressed P450 genes involved in insect resistance to imidacloprid and/or thiamethoxam include CYP6CM1 and CYP6DB3 in Bemisia tabaci; CYP6ER1 and CYP6AY1 in N. lugens; CYP6FV12 in Bradysia odoriphaga; and CYP6CY14 and CYP6DA1 in A. gossypii [11,12,13,14,15,16]. Other overexpressed P450 genes have also been found in imidacloprid-resistant beetles. Zhu et al. [17] reported 41 P450 genes that showed significantly higher expression in imidacloprid-resistant strains of L. decemlineata compared with sensitive populations. Follow-up studies identified a series of upregulated P450 genes, including CYP9Z26, CYP6BQ5, CYP4Q3, CYP9Z25, CYP9Z29, CYP6BJa/b, CYP6BJ1v1, and CYP6K1 [18,19,20,21].
In addition to P450s, as key phase II enzymes in detoxification, insect uridine diphosphate glycosyltransferases (UGTs) have also received attention in insecticide resistance research. For example, the midgut-specific overexpression of UGT341A4, UGT344B49, and UGT344M2 significantly increased insensitivity to cyantraniliprole in A. gossypii [22], whereas the upregulated expression of FoUGT466B1, FoUGT468A3, and FoUGT468A4 contributed to spinosad resistance in Frankliniella occidentalis [23]. UGT352A5 was also reported to be responsible for conferring thiamethoxam resistance in B. tabaci [24], while Kaplanoglu et al. [21] found that overexpression of UGT2 was related to imidacloprid resistance in resistant L. decemlineata.
Thus, different insect species and even different populations of the same insect have different metabolic resistance mechanisms to the same insecticide. However, there is limited information about which genes are involved in the molecular metabolic mechanism of resistance to thiamethoxam in CPB. In this study, transcriptome analysis was performed to screen genes encoding detoxifying enzymes that were differentially expressed between thiamethoxam-resistant and sensitive CPB populations in Xinjiang. The expression of two upregulated P450 CYP9e2-like genes (CYP9Z140 and CYP9AY1) and one UGT gene (UGT321AP1) was further verified and analyzed in different field populations, stages and tissues, and in response to thiamethoxam via quantitative real-time PCR (RT-qPCR). RNA interference (RNAi) was then used to suppress expression of these genes to explore their roles in thiamethoxam resistance. These results provided a basis for better understanding the molecular mechanisms of the metabolic resistance of L. decemlineata to neonicotinoid insecticides.
2. Materials and Methods
2.1. Insects
Ten CPB populations were collected from different potato fields of Qapqal County (QPQLZ and QPQLB), Mulei County (ML), Jimusa County (JMSL, JMST, JMSQ, JMSD1 and JMSD2), and Urumqi City (URMQY and URMQA) in Xinjiang from June to July in 2021, 2022 and 2023 (Table 1). The CPB were fed with potato leaf and kept in a rearing room at 26±1℃, 50–60% relative humidity and 16 h/8 h light/dark cycle. Adults with same size and good growth were selected for subsequent experiments.
2.2. Bioassay
The contact toxicity of thiamethoxam of CPB adults was assayed using a topical application method. Thiamethoxam (97% powder, Jiangsu Bangsheng Biotechnology Co., Ltd, Huaian, Jiangsu) was diluted to at least five different concentrations with analytical-grade acetone to result in a 10–100% mortality range of test insects. Ten adults were treated individually with 1.1 μL of insecticide solution or acetone as control, which was applied to their ventral area using a microapplicator (Hamilton Company, Reno, NV, USA), and then added to Petri dishes (9 cm in diameter and 1.5 cm in height) containing fresh potato leaves and maintained under the conditions described above. Each treatment had three replicates. The standard reference for dead beetles was based on Liu et al. [2] and beetle mortality was recorded after 72 h of treatment.
2.3. RNA-Sequencing Data Analysis
Twelve adults (three as a repeat) for each population, including a thiamethoxam-susceptible population and two resistant populations with low level resistance to thiamethoxam, were sent on dry ice to Biomarker Technologies Co., Ltd (Beijing, China), for RNA extraction, cDNA library construction, and RNA sequencing. Sequencing was performed on an Illumina Novaseq 6000 platform using a 150 bp paired-end sequencing strategy. The clean reads were aligned to the reference genome of L. decemlineata from the relevant genome website (ftp://ftp.ncbi.nlm.nih.gov/genomes/all/GCF/000/500/325/GCF_000500325.1_Ldec_2.0/GCF_0 00500325.1_Ldec_2.0_genomic.fna.gz). Differential expression levels between susceptible and resistant populations were analyzed using the DESeq2 R package (1.20.0), based on fragments per kilobase per million (FPKM). The false discovery rate (FDR) was used to identify the threshold of the P-value in multiple tests to compute the significant difference. Genes with an absolute value of log2Fold Change >1 and FDR core <0.05 found by DESeq2 were considered to be differentially expressed.
The cloud blast feature in the Blasto2GO software was used to annotate the transcripts by comparing the sequences with the arthropod non-redundant protein data database with a Blast expectation value (e-value) of 1.0E–5 as a cutoff. Gene Ontology (GO) enrichment analysis was performed using Perl script by plotting the GO information of the differentially expressed genes (DEGs) retrieved from Blasto2GO against all GOs from the L. decemlineata genome data. The obtained annotation was enriched and refined using TopGo (R package). Kyoto Encyclopedia of Genes and Genomes (KEGG) pathways were assigned to the assembled sequences by perl script.
2.4. Sequence and Phylogenetic Analysis
P450 and UGT genes identified from the transcriptome and genome data of L. decemlineata were cloned and verified by reverse transcription PCR (RT-PCR). Total RNA was extracted from a mixture of eggs, first-fourth-instar larvae, pupae, and adults of L. decemlineata. Multiple alignments of sequences were performed using ClustalW, and the structural domains were detected based on comparison with other identified sequences. The theoretical isoelectric points (pIs) and molecular weights (Mw) were analyzed by ExPASy (https://web.expasy.org/protparam/). MEGA 7 was utilized to construct the phylogenetic trees via the neighbor joining method with 1,000 bootstrap replications based on the amino acid sequences of CYP9e2 and UGT genes from other insects acquired through similarity searches of the NCBI database. The three verified genes were named by the P450 (David R. Nelson, Department of Molecular Sciences, University of Tennessee, Memphis, TN, USA) and UTG nomenclature committees (https://labs.wsu.edu/ugt/), as CYP9Z140, CYP9AY1, and UGT321AP1, respectively.
2.5. Preparation of Samples for Expression Analysis
Three adults (a mix of females and males, 3–10 days after eclosion) were sampled from each population from the eight sample sites in Xinjiang (detailed in Table 1) to determine the expression difference of three candidate genes among different CPB field populations. In addition, we collected 30 eggs (E), 30 1st-instar larvae (L1), 20 2nd-instar larvae (L2), ten 3rd-instar larvae (L3), as well as three 4th-instar larvae (L4), pupae (P) and adults (A), respectively, from the URMQA population to examine the stage-specific expression of three genes. To compare tissue expression of candidate genes, the foreguts, midguts, hindguts, Malpighian tubules, fat bodies, head, thorax, and abdomen were dissected from five adults of URMQA, respectively. Three adults were sampled from the survival of URMQA treated with either LD50 of thiamethoxam or acetone treatment (as control) for 72 h was used to determine the inducible expression profiles of three genes. The sample size above is taken as a biological replication and each treatment (population) had three biological replicates. All samples were frozen quickly in liquid nitrogen and stored at –80°C until use.
2.6. Total RNA Isolation and cDNA Synthesis
Total RNA from the above mentioned samples was isolated using Yfx Total RNA Extraction Reagent (Yi Fei Xue Biotechnology Co., Ltd., Nanjing, China) and following manufacturer’s protocol. The concentration of the RNA samples was analyzed on a NanoDrop 1000 spectrophotometer (Thermo Fisher Scientific, Waltham, MA, USA). The first-strand cDNA was then synthesized by using a PrimeScript RT reagent kit (TaKaRa Biotechnology Co., Ltd., Dalian, China).
2.7. Real-Time Quantitative PCR
The transcript levels of CYP9Z140, CYP9AY1, and UGT321AP1 were determined using a Biosystems 7500 Real-time PCR System (Applied Biosystems Inc., Foster City, CA, USA) with ChamQTM SYBR qPCR Master Mix (Vazyme Biotech Co., Ltd, Nanjing, China). qPCR reaction mixtures comprised: 10 μL SYBR Green, 0.4 μL of each primer, 1 μL cDNA template, and 8.2 μL RNase-free water. The reaction involved the following steps: initial step at 95°C for 30 s, followed by 40 cycles of 9°C for 5 s and 60°C for 34 s. The primers used are detailed in Table 2. There were three independent biological replicates for each qPCR experiment. The relative expression of the target genes was calculated according to the 2−ΔΔCT method [25], with RPL4 and Ef1a as reference genes, based on Zhu et al. [17].
2.8. RNA Interference
CYP9Z140-double-stranded (ds)RNA, CYP9AY1-dsRNA, UGT321AP1-dsRNA, and GFP-dsRNA were expressed using Escherichia coli HT115 (DE3) competent cells lacking RNase III, following the methods of Qu et al. [6] and Shi et al. [8].
Potato leaves of similar size were dipped in bacterial solutions containing dsCYP9Z140, dsCYP9AY1, dsUGT321AP1, and dsGFP (as control) for 30 min, and then placed in plastic feeding chambers with 17 cm in length, 11.7 cm in width and 5 cm in height after air dry. Adult CPB collected from URMQA were carefully transferred into each chamber containing treated leaves. Thirty beetles were used for each treatment, and all treatments were replicated 6 times. A fresh supply of treated potato leaves was provided daily. To silence the three genes simultaneously, the beetles were fed a mixture of dsRNA of the three genes at a 1:1:1 ratio.
After 6 days of continuous feeding on treated leaves, four replicates from each treatment group (12 adults) were used to extract total RNA for measuring the expression levels of the target genes, as detailed above. The remaining beetles from each treatment group were used to determine the susceptibility to thiamethoxam. Adults were treated with a median lethal dose (LD50) of thiamethoxam (0.2963 μg/adult), with the same amount of acetone used as a control. Each treatment was repeated four times with 15–20 adults each. The number of dead beetles in each group was then recorded, as described above.
2.9. Statistical Analysis
Bioassay data were corrected for control mortality by Abott’s formular. Median lethal doses (LD50) and 95% fiducial limits (FL) were estimated via the PoloPlus software (Leora Software, Berkeley, CA, USA). The resistance ratio (RR) was calculated by dividing the LD50 value of the field population by the LD50 value of the susceptible population and was quantified according to Shi et al. [3]. The quantitative data and mortality exposed to thiamethoxam after RNAi were expressed as the mean ± standard error (SE) from at least three biological replicates. Data of transcriptome validation and inducible expression were analyzed to compare the difference between two treatments using the Student’s t-test. The remaining data were analyzed by one-way analysis of variance (ANOVA) followed by Tukey's multiple comparison tests. Statistical analysis was carried out using GraphPad Prism 8.02 and SPSS statistics (IBM SPSS Statistics 27 software, Chicago, IL, USA). Statistical differences were considered significant at P<0.05.
3. Results
3.1. Resistance Levels of Leptinotarsa Decemlineata Populations to Thiamethoxam
The sensitivity to thiamethoxam of L. decemlineata field populations collected from Xinjiang in 2021, 2022 and 2023 were assayed by topical application (Table 3). The URMQY population was considered to be relatively sensitive. In 2021, the ML population remained sensitive to thiamethoxam, with a RR of 2.18-fold, whereas the URMQA population showed decreased susceptibility, with a RR of 3.04-fold. The JMSL and QPQLZ populations developed 7.18 and 8.33-fold low levels of resistance to thiamethoxam, respectively. In 2022, the URMQA and JMST populations had low levels of resistance and decreased susceptibility, with RRs of 9.53 and 3.23-fold, respectively. In 2023, Both ML and JMSD1 developed low resistance, with RRs of 7.42 and 6.66-fold, respectively. The JMSQ, URMQA, and JMSD2 populations showed decreased susceptibility with RRs ranging from 3.04-fold to 4.63-fold. QPQLB remained sensitive to thiamethoxam throughout the study period. The results of resistance monitoring to thiamethoxam may provide the basis for effective control of L. decemlineata.
3.2. Transcriptome Analysis
Illumina short-read sequences from mRNAs isolated from the URMQY, QPQLZ, and JMSL populations were compiled into a transcriptome, generating 26,114,887, 21,000,522, and 24,582,542 usable reads, respectively. The percentage of Q30 bases was 93.39% and above, and the GC content of each population ranged from 40.52% to 41.23% (Table 4).
Analysis of the log-fold change in expression of genes that were significantly up or down regulated in all samples revealed 813 DEGs between the URMQY and JMSL populations, of which 263 (32.35%) were upregulated and 550 (67.65%) were downregulated. In addition, there were 883 DEGs detected between the URMQY and QPQLZ populations, of which 254 (28.77%) were upregulated and 629 (71.23%) were downregulated.
GO analyses indicated that the annotated DEGs could be divided into three different categories: biological process (BP); cellular component (CC); and molecular function (MF) (Figure 1). In each of these three main categories, the terms “metabolic process”, “cellular process”, “cell part”, “binding”, and “catalytic activity” were the most dominant. The top 20 enriched KEGG pathways were mainly linked with metabolism of xenobiotics (Figure 2).
Several classes of detoxifying enzyme involved in enzymatic detoxification mechanisms were upregulated between susceptible and resistant populations (Table 5). Two P450 genes with a fold change >2 and FDR score <0.0001 (ID: 111518298 and 111508919) and two UTG genes were used for subsequent analysis.
The RT-qPCR was performed to confirm the transcript expression obtained from the RNA-sequencing data. The expression levels of CYP9Z140 and CYP9AY1 in QPQLZ population and UGT321AP1 in JMSL population were significantly enhanced by 1.92, 2.04, and 36.4 times, respectively (P< 0.05) compared with URMQY population, which was consistent with the transcriptome results (Figure 3). However, UGT324BR1 was not upregulated significantly in the QPQLZ population compared with URMQY population and, thus, was not considered as a candidate gene for follow-up studies.
3.3. Gene Structure and Phylogenetic Analysis
The structural features of the two P450 genes (CYP9Z140 and CYP9AY1) are illustrated in Figure 4A. The full-length genes contained a 1,578 bp open reading frame (ORF) encoding 525 amino acid residues. The theoretical isoelectric points (pI) were 8.95 and 5.73, and the molecular weights (Mw) were 60.435 and 60.727 kDa, respectively. Conserved domains in the genes are common to cytochrome P450s, and included the C-helix motif (WxxxR), I-helix motif (GxE/DTT/S), K-helix motif (ExLR), the conserved amino acid sequence PxxFxP motif, and the heme-binding motif (PFxxGxxxCxG). Structural features of the UGT gene UGT321AP1 are shown in Figure 5A. The full-length cDNA of UGT321AP1 encoded 517 amino acids. Its pI and Mw were 6.88 and 59.20 kDa, respectively. Similar to UTGs in other insects, the signal peptide of UGT321AP1 was found at the N terminus and the signature motif ([FVA]-[LIVMF]-[TS]-[HQ]-[SGAC]-G-x(2)-[STG]-x(2)-[DE]-x(6)-P-[LIVMFA]–[LIVMFA]-x(2)-P-[LMVFIQ]-x(2)-[DE]-Q) was situated in the middle of the C-terminal domain; two sugar donor-binding site domains (DBR1 and DBR2) were also predicted for the amino acid sequences. A hydrophobic transmembrane domain containing ~29 hydrophobic amino acid residues was found at the C terminus.
The phylogenetic relationships of the three genes from L. decemlineata and related P450s and UGTs from other insects are shown in Figure 4B and 5B. The translated proteins of P450s shared the highest amino acid sequence identity with the CYP9 subfamily of Tenebrio molitor and Diabrotica virgifera virgifera from Coleoptera. UGT321AP was clustered in the branch of Tribolium castaneum (Coleoptera).
3.4. Expression Analysis of P450 and UGT Genes
RT-qPCR was used to analyze and compare the expression levels of the three genes in CPB adults from different field populations (Figure 6). In 2021, the expression levels of CYP9Z140 in QPQLZ and URMQA populations, CYP9AY1 in QPQLZ and JMSL populations, and UGT321AP in URMQA and JMSL populations increased significantly by 1.93 and 3.15 times (F=29.37, df=4, 10; P<0.05), 1.62 and 1.71 times (F=7.83, df=4, 10; P<0.05), and 12.78 and 21.06 times (F=29.124, df=4, 10; P<0.05), respectively, compared with URMQY population. In 2022, the transcript levels of CYP9Z140 and UGT321AP were significantly increased in URMQA population by 1.73 times (F=18.149, df=2, 6; P<0.05) and 23.30 times (F=36.933, df=2, 6; P<0.05), respectively. In 2023, CYP9Z140 was overexpressed in URMQA, JMSD1, JMSD2, and ML populations by 1.71, 2.01, 1.69 and 2.11-fold, respectively (F=5.771, df=6,14; P<0.05). CYP9AY1 expression in URMQA and JMSD1 populations increased by 1.84 and 6.25 times, respectively (F=22.586, df=6,14; P<0.05), whereas that of UGT321AP was upregulated by 2.47, 1.66, 5.85, 3.16, 1.65, and 3.07 times (F=36.299, df=6,14, P<0.05) in JMSD1, JMSD2, URMQA, ML, JMSQ, and QPQLB populations, respectively. There were no other significant differences in the expression of the genes between URMQY population and other field populations across any of the study years.
To study the effect of neonicotinoids on the expression of CYP9Z140, CYP9AY1, and UGT321AP1, the mRNA levels in URMQY adults treated with thiamethoxam LD50 for 72 h were determined and analyzed by RT-qPCR (Figure 7). Thiamethoxam treatment significantly increased the expression of all three genes by 2.31 (t=3.217, P=0.0324), 3.03 (t=5.446, P=0.0055), and 5.01-fold (t=5.796, P=0.0044), respectively, compared with the control.
To identify the tissue-specific detoxification gene(s) that accounts for thiamethoxam resistance, the expression patterns of CYP9Z140, CYP9AY1, and UGT321AP were analyzed by RT-qPCR in the seven developmental stages (eggs, first to fourth instar larvae, pupae, and adults), different tissues (foregut, midgut, hindgut, fat body, and Malpighian tubules) and different body parts (head, thorax, and abdomen) of L. decemlineata. CYP9Z140, CYP9AY1, and UGT321AP1 were transcribed throughout all developmental stages of L. decemlineata. In the developmental stages, a similar pattern was detected between CYP9Z140 and CYP9AY1, whereas there were clear differences in the developmental expression levels of UGT321AP1 (Figure 8A). The expression of the two CYP450 genes were highest in pupae, followed by adult and fourth instar larva, and was lowest in the egg stage. The expression levels of CYP9Z140 and CYP9AY1 in the pupae, fourth instar larvae and adults were 31.10, 14.81, and 14.45 (F=331.277, df=6,14; P<0.05) and 20.79, 13.35, and 15.84 times (F=67.698, df=6,14; P<0.05) higher than those in the egg stage, respectively. UGT321AP1 expression was highest in the second-instar larvae and adults, and lowest in first, second, and fourth-instar larvae and pupae (F=41.726, df=6,14; P<0.05). Tissue expression patterns showed that expression of the two P450 genes was highest in mid-gut, whereas that of UGT321AP1 was highest in Malpighian tubules (Figure 8B). The expression of UGT321AP1 in head and thorax was higher than that in abdomen, with no significant difference in expression of the two P450 in the different body parts of CPB adults (Figure 8C).
3.5. RNAi Effects of CYP9Z140, CYP9AY1, and UGT321AP on Leptinotarsa Decemlineata
The RT-qPCR was used to detect the expression levels of CYP9Z140, CYP9AY1 and UGT321AP in beetles fed on individual dsRNA and a mixture targeting three genes at a ratio of 1:1:11 for 6 days. The results showed that expression of CYP9Z140, CYP9AY1 and UGT321AP significantly reduced by 88.86% and 87.28% (F=143.4401, df=2,6 P<0.05), 79.37% and 95.08% (F=184.814, df=2,6; P<0.05), and 84.23% and 78.27% (F=41.105, df=2,6; P<0.05), respectively compared with dsGFP (control) after individual and simultaneous RNAi (Figure 9A). Thiamethoxam at LD50 was also used to determine changes in the sensitivity of the treated CPB. The mortality of adults fed dsCYP9Z40, dsCYP9AY1, dsUGT321AP, and a mixture of the three dsRNAs significantly increased, by 10.53%, 14.55%, 13.03%, and 18.33% (F=30.218, df=4,15, P<0.05), respectively compared with the control group (Figure 9B).
4. Discussion
CPB is a species characterized by the rapid development of resistance to a variety of insecticides [26]. With extensive application of neonicotinoids for control of CPB in Xinjiang, it is necessary to continuously monitor such resistance. In current study, the resistance levels to thiamethoxam of CPB from different areas of Xinjiang were investigated across three sample years (2021–2023). The LD50 value of the QPQLZ population to thiamethoxam (0.2592 μg⸳ adult-1) was >0.0196 μg⸳ adult-1 of individuals from the same population collected in 2010 [2], while the resistance level, with a RR of 8.33-fold, was higher than the RR of 4.3-fold reported by Shi et al. [3]. The resistance level to thiamethoxam in the ML population increased from 2.18-fold in 2021 to 7.42-fold in 2023, whereas the JMST, JMSQ, and JMSD2 populations exhibited decreased susceptibility to thiamethoxam. By contrast, the URMQA population in 2022, and JMSD1 and JMSL populations showed low resistance. We investigated and found that Arika suspension (thiamethoxam being as main ingredients) has been applied long-term in the Jimusar (JMS) region to control CBP. This could explain why all tested populations from Jimusar showed decreased levels of tolerance to thiamethoxam.
Developments in molecular biology and genomics have led to the mechanism of insecticide resistance mediated by genes encoding detoxification enzymes to become a hot research topic. Many studies have reported that overexpression of P450 and UGT genes can lead to resistance of pests to neonicotinoid insecticides. For example, Zhu et al. [17] revealed 41 highly expressed P450 genes in imidacloprid-resistant populations of CPB from Long Island, New York, USA. Using transcriptional analysis, Clements et al. [18,19] found that expression levels of CYP9Z26 and CYP96K1 in imidacloprid-resistant adults from Wisconsin, USA were significantly increased after imidacloprid treatment. In addition, qPCR analysis showed that CYP6K1 was also overexpressed in field populations under long-term use of neonicotinoid insecticides [27]. Kaplanoglu et al. [21] revealed that overexpression of two genes encoding detoxifying enzymes (CYP4Q3 and UGT2) contributed to imidacloprid resistance in medium-level imidacloprid-resistant CPB populations. Based on these studies, it appears that overexpressed detoxification enzyme genes related to neonicotinoid resistance in CPB differ across populations with diverse resistance backgrounds. Thus, in the present study, transcriptome analysis was used to compare susceptible and resistant populations of L. decemlineata, revealing the DEGs CYP9Z140, CYP9AY, and UGT321AP1, as verified by qPCR. However, there was no evidence to suggest that these genes were directly involved in neonicotinoid resistance.
Further qPCR analysis showed that CYP9Z140, CYP9AY1, and UGT321AP1 were overexpressed significantly in thiamethoxam-resistant adults from the QPQLZ and JMSL populations in 2021, URMQA population in 2022, and JMSD1 and ML population in 2023, comparable to CYP9e2-like genes reported to be overexpressed in resistant compared with susceptible adults [3]. Therefore, we speculated that these genes were related to the resistance of L. decemlineata to thiamethoxam, based on the results of constitutive expression analyses of different resistant populations in Xinjiang.
Many studies have shown that insect P450 and UGT genes can be induced by insecticides. For example, CYP6AX1 and CYP6AY1 of N. lugens and CYP6AY3v2 of Laodelphax striatellus were upregulated in the presence of imidacloprid [28,29]. The expression of UGT352A4 and UGT352A5 in the thiamethoxam-resistant B. tabaci strain significantly increased after thiamethoxam treatment [24]. Our study showed that thiamethoxam exposure significantly increased expression of the three genes in URMQY adults. Similarly, the transcript level of CYP9e2 increased 4.2-fold in L. decemlineata exposed to clothianidin [30]. In addition, CYP9e2-like genes are involved in insect resistance to a variety of insecticides. Oppert et al. [31] found that expression of CYP9e2 in susceptible populations of T. castaneum increased when exposed to sublethal doses of phosphine. Jiang et al. [32] reported that the relative expression level of AcCYP9e2 in the midgut of Apis cerana workers was significantly higher than that of the control group after exposure to flumethrin. Gao et al. [33] revealed by transcriptome analysis that CYP9e2 of Plutella xylostella was upregulated after treatment with chlorantraniliprole, cypermethrin, dinotefuran, indoxacarb, and spinosad. Therefore, we further speculate that CYP9Z140, CYP9AY1, and UGT321AP1 are associated with the detoxification of thiamethoxam in L. decemlineata.
The specific spatiotemporal expression patterns of genes encoding detoxifying enzyme are usually linked to their protein function. The current analysis showed that CYP9Z140, CYP9AY1, and UGT321AP1 were detected in all developmental stages and tissues of CPB, albeit with significantly different expression levels. Expression of CYP9Z140 and CYP9AY1 was highest in pupae and midgut, while that of UGT321AP1 was highest in adults and Malpighian tubules. In addition, UGT321AP1 showed higher expression in head and thorax than in the abdomen of CPB, whereas expression of CYP9Z140 and CYP9AY1 showed no difference among the body parts. Similarly, CYP6FV12 of B. odoriphaga was highly expressed in the midgut and but expressed at low levels in eggs [14] and CYP303a1 of Drosophila melanogaster was markedly overexpressed during the pupal stage [34]. UGT353G2 in B. tabaci adults had highest expression across different development stages [35]. However, the highest stage-specific expression of CYP6FV12 was observed in fourth-instar nymphs of B. odoriphaga and Cyp303a1 had the highest expression in the ring gland of D. melanogaster. The insect midgut and Malpighian tubules are important organs for detoxifying exogenic compounds, such as insecticides. Thus, our stage and tissue-specific expression profiles suggested that these three genes were involved in CPB resistance to thiamethoxam and that the major detoxification action stages might occur in adults and pupae, followed fourth-instar larvae.
Many studies have indirectly verified the roles of P450 and UGT genes in pest resistance through RNAi. For example, results from RNAi showed that CYP6ER1 not only had a role in the resistance of N. lugens to imidacloprid, but was also closely related to the generation of thiamethoxam and dinotefuran resistance [12,36]. In addition, the overexpressed gene CYP6CY14 was confirmed as having important role in thiamethoxam resistance of A. gossypii [13]. The ingestion of dsRNAs for L. decemlineata successfully reduced the expression of CYP9Z26 and CYP9Z29 and increased imidacloprid susceptibility of test beetles [20,21,26,37]. In our study, after L. decemlineata adults were continuously fed with bacterial solutions containing individual or mixed dsRNA of three genes for 6 days, the expression levels of the target genes and the tolerance of test beetles to thiamethoxam were significantly decreased compared with dsGFP treatment. The roles of CYP9e2-like genes in insecticide resistance of insects have also been reported. Bouafoura et al. [30] found that CYP9e2 knockdown increased the susceptibility of L. decemlineata to clothianidin. A cytochrome P450, CYP9E2 and a long non-coding RNA gene lncRNA-2 were found upregulated spinosad resistant population of CPB and Knock-down of these two genes using RNAi resulted in a significant increase of spinosad sensitivity, which imply CYP9E2 and lncRNA-2 jointly contribute to spinosad resistance [38]. In addition, the suppression of UGT353G2 expression by RNAi substantially increased sensitivity to multiple neonicotinoids in resistant strains of B. tabaci, indicating the involvement of UGT353G2 in the neonicotinoid resistance of whitefly [35]. The current study not only confirmed overexpression of the three target genes as an important resistance mechanism to neonicotinoids, but also indicated that different populations of L. decemlineata had different metabolic molecular mechanisms based on the RNAi effects of UGT321AP1, CYP9Z140, and CYP9AY1 on sensitivity to thiamethoxam. Our findings suggested that RNAi-triggered knockdown of CYP9Z140, CYP9AY1, and UGT321AP1 resulted in an increased susceptibility to thiamethoxam in adults of the field populations, which may provide scientific basis for improving new management of L. decemlineata.
Our study results showed that two P450 genes and one UGT gene conferred resistance to thiamethoxam, indicating that thiamethoxam resistance in L. decemlineata develop by a complex mechanism. Thus, other detoxification genes related to thiamethoxam resistance of CPB need to be screened and identified. Furthermore, the regulatory mechanism of CYP9Z140, CYP9AY1, and UGT321AP1 expression remains to be elucidated.
5. Conclusions
In summary, this study showed by resistance monitoring that most test populations in Xinjiang developed low resistance to thiamethoxam. The results of RT-qPCR analysis determined not only that CYP9Z140, CYP9AY1, and UGT321AP1 were overexpressed in resistant populations, but also that their expression was induced by thiamethoxam and that they were highly expressed in midgut and Malpighian tubules. RNAi further confirmed the roles of the genes in the development of resistance to thiamethoxam against L. decemlineata. These results will facilitate the development of CPB resistance management strategies.
Funding
This study was supported and funded by Major Science and Technology Projects in Xinjiang (No. 2023A02006) and the Stabilization support project of Xinjiang Academy of Agricultural Sciences, China (No. xjnkywdzc-2022004).
References
- Yan, J.J., Guo, W.C., Li, G.Q., Pan, H.P., Chen, B., Hou, W.W., Li, S.H., Gao, Y.L. Current status and prospects of the management of important insect pests on potato in China. Plant Protec. 2023, 49(5):190-195. [CrossRef]
- Liu, P., Jiang, W.H., Lu, W.P., Li, G.Q. Susceptibility of Colorado potato beetle Leptinotarsa decemlineata adults from northern Xinjiang Uygur autonomous region to four neonicotinoids. Chinese J. Pestic. Sci. 2011, (13), 271-275.
- Shi, X., Li, S., Wang, Z.M., Fu, K.Y., Fu, W.J., Jiang, W.H. Resistance monitoring to thiamethoxam and expression analysis of cytochrome P450 genes in Leptinotarsa decemlineata from Xinjiang. Scientia Agricultura Sinica. 2021, 54(14), 3004-3016. [CrossRef]
- Liu, Z.W., Williamson, M.S., Lansdell, S.J., Denholm, I., Han, Z.J., Millar, N.S. A nicotinic acetylcholine receptor mutation conferring target-site resistance to imidacloprid in Nilaparvata lugens (brown planthopper). Proc. Natl. Acad. Sci. USA 2005, 102(24), 8420-8425. [CrossRef]
- Hirata, K., Jouraku, A., Kuwazaki, S., Kanazawa, J., Iwasa, T. The R81T mutation in the nicotinic acetylcholine receptor of Aphis gossypii is associated with neonicotinoid insecticide resistance with differential effects for cyano- and nitro-substituted neonicotinoids. Pestic. Biochem. Physiol. 2017,143, 57-65. [CrossRef]
- Qu, Y., Chen, J.H., Li, C.G., Wang, Q., Guo, W.C., Han, Z.J., Jiang, W.H. The subunit gene Ldα1 of nicotinic acetylcholine receptors plays important roles in the toxicity of imidacloprid and thiamethoxam against Leptinotarsa decemlineata. Pestic. Biochem. Physiol. 2016, 127(2), 51-58. [CrossRef]
- Wang, Z.M., Li, S., Shi, C.C., Xie, L.J., Fu, K.Y., Jiang, W.H. The actions of neonicotinoid insecticides on nicotinic acetylcholine subunits Ldα1 and Ldα8 of Leptinotarsa decemlineata and assembled receptors. Insect Sci. 2022, 29,1387-1400. [CrossRef]
- Shi, C.C., Tian, Y.T., Wang, Y.Q., Guo, W.C., Jiang, W.H. The interaction of nicotinic acetylcholine receptor subunits Ldα3, Ldα8 and Ldβ1 with neonicotinoids in Colorado potato beetle, Leptinotarsa decemlineata. Pestic. Biochem. Physiol. 2023, 195,105558. [CrossRef]
- Li, X.C., Schuler, M.A., Berenbaum, M.R. Molecular mechanisms of metabolic resistance to synthetic and natural xenobiotics. Annu. Rev. Entomol. 2007, 52, 231–253. . [CrossRef]
- Feyereisen, R., Dermauw, W., Leeuwen, T.V. Genotype to phenotype, the molecular and physiological dimensions of resistance in arthropods. Pestic. Biochem. Physiol. 2015, 121, 61–77. . [CrossRef]
- Karunker, I., Morou, E., Nikou, D., Nauen, R., Sertchook, R., Stevenson, B.J., Paine, M.J.I., Morin, S., Vontas, J. Structural model and functional characterization of the Bemisia tabaci CYP6CM1vQ, a cytochrome P450 associated with high levels of imidacloprid resistance. Insect. Biochem. Mol. Biol. 2009, 39, 697–706. [CrossRef]
- Zhang, Y.X., Yang, Y.X., Sun, H.H., Liu, Z.W. Metabolic imidacloprid resistance in the brown planthopper, Nilaparvata lugens, relies on multiple P450 enzymes. Insect Biochem. Mol. Biol. 2016, 79, 50–56. [CrossRef]
- Wu, Y.Q., Xu, H.F., Pan, Y., Gao, X.W., Xi, J.H., Zhang, J.H., Shang, Q.L. Expression profile changes of cytochrome P450 genes between thiamethoxam susceptible and resistant strains of Aphis gossypii Glover. Pestic. Biochem. Physiol. 2018,149, 1-7. [CrossRef]
- Chen, C.Y., Shan, T.S., Liu, Y., Wang, C.C., Shi, X.Y., Gao, X.W. Identification and functional analysis of a cytochrome P450 gene involved in imidacloprid resistance in Bradysia odoriphaga Yang et Zhang. Pestic. Biochem. Physiol. 2019,153,129-135. [CrossRef]
- Zhang, H.H., Yang, H.L., Dong, W.Y., Gu, Z.X., Wang, C.C., Chen, A.Q., Shi, X.Y., Gao, X.W. Mutations in the nAChR β1 subunit and overexpression of P450 genes are associated with high resistance to thiamethoxam in melon aphid, Aphis gossypii Glover. Comp. Biochem. Physiol. Part B. 2022, 258, 110682. [CrossRef]
- Wei, X.G., Hu, J.Y., Yang, J., Yin, C., Du, T.H., Huang, M.J., Fu, B.L., Gong, P.P., Liang, J.J., Liu, S.N., Xue, H., He, C., Ji, Y., Du, H., Zhang, R., Wang, C., Li, J.K., Yang, X., Zhang YJ. Cytochrome P450 CYP6DB3 was involved in thiamethoxam and imidacloprid resistance in Bemisia tabaci Q (Hemiptera: Aleyrodidae). Pestic. Biochem. Physiol. 2023, 194, 105468. [CrossRef]
- Zhu, F., Moural, T.W., Nelson, D.R., Palli, S.R. A specialist herbivore pest adaptation to xenobiotics through up-regulation of multiple cytochrome P450s. Sci. Rep. 2016, 6 (1), 20421. [CrossRef]
- Clements, J., Schoville, S., Peterson, N., Lan, Q., Groves, R.L. Characterizing molecular mechanisms of imidacloprid resistance in melect populations of Leptinotarsa decemlineata in the central sands region of Wisconsin. PLOS ONE 2016,11 (1), e0147844. [CrossRef]
- Clements, J., Sanchez-Sedillo, B., Bradfield, A.C., Groves, R.L. Transcriptomic analysis reveals similarities in genetic activation of detoxification mechanisms resulting from imidacloprid and chlorothalonil exposure. PLOS ONE 2018,13(10), e0205881. [CrossRef]
- Kalsi, M., Palli, SR. Transcription factor cap n collar C regulates multiple cytochrome P450 genes conferring adaptation to potato plant allelochemicals and resistance to imidacloprid in Leptinotarsa decemlineata (Say). Insect Biochem. Mol. Biol. 2017, 83, 1–12. [CrossRef]
- Kaplanoglu, E., Chapman, P., Scott, I.M., Donly, C. Overexpression of a cytochrome P450 and a UDP-glycosyltransferase is associated with imidacloprid resistance in the Colorado potato beetle, Leptinotarsa decemlineata. Sci. Rep. 2017, 7, 1762. [CrossRef]
- Zeng, X.C., Pan, Y., Tian, F.Y., Li, J.Y., Xu, H.F., Liu, X.M., Chen, X.W., Gao, X.W., Peng, T.F., Bi, R., Shang, Q.L. Functional validation of key cytochrome P450 monooxygenase and UDP-glycosyltransferase genes conferring cyantraniliprole resistance in Aphis gossypii Glover. Pestic. Biochem. Physiol. 2021, 176, 104879. [CrossRef]
- Wang, J., Wan, Y.R., Zhang, Y., Yuan, J.J., Zheng, X.B., Cao, H.Y., Qian, K.H., Feng, J.M., Tang, Y.X., Chen, S.R., Zhang, Y.J., Zhou, X.G., Liang, P., Wu, Q.J. Uridine diphosphate glucosyltransferases are involved in spinosad resistance in western flower thrips Frankliniella occidentalis (Pergande). J. Hazard Mater. 2024, 466, 133575. [CrossRef]
- Du, T.H., Fu, B.L., Wei, X.G., Yin, C., Yang, J., Huang, M.J., Liang, J.J., Gong, P.P., Liu, S.N., Xue, H., Hu, J.Y., Diao, Y.C., Gui, L.Y., Yang, X., Zhang, Y.J. Knockdown of UGT352A5 decreases the thiamethoxam resistance in Bemisia tabaci (Hemiptera: Gennadius). Int. J. Biol. Macromol. 2021,186, 100-108. [CrossRef]
- Livak, K.J., Schmittgen, T.D. Analysis of relative gene expression data using real-time quantitative PCR and the 2−ΔΔCT method. Methods (San Diego, Calif.) 2011, 25, 402–408. [CrossRef]
- Naqqash, M.N., Gӧkce, A., Aksoy, E., Bakhsh, A. Downregulation of imidacloprid resistant genes alters the biological parameters in Colorado potato beetle, Leptinotarsa decemlineata (Say) (chrysomelidae: Coleoptera). Chemosphere 2020, 124857. [CrossRef]
- Clements, J., Olson, J.M., Sedillo, B.S., Bradford, B., Groves, R.L. Changes in emergence phenology, fatty acid composition, and xenobiotic-metabolizing enzyme expression is associated with increased insecticide resistance in the Colorado potato beetle. Arch. Insect Biochem. Physiol. 2020,103, e21630. [CrossRef]
- Yang, Z.F., Yang, H.Y., He, G.C. Cloning and characterization of two cytochrome P450 CYP6AX1 and CYP6AY1 cDNAs from Nilaparvata lugens Stl (Homoptera: Delphacidae). Arch. Insect Biochem. Physiol. 2010, 64(2), 88-99. [CrossRef]
- Wang, R., Zhu, Y., Deng, L., Zhang, H., Wang, Q., Yin, M., Song, P., Elzaki, M.E.A., Han, Z., Wu, M. Imidacloprid is hydroxylated by Laodelphax striatellus CYP6AY3v2. Insect Mol. Biol. 2017, 26(5), 543-551. [CrossRef]
- Bouafoura, R., Bastarache, P., Ouédraogo, B.C., Dumas, P., Moffat, C. E., Vickruck, J.L., Morin, P.J. Characterization of insecticide response-associated transcripts in the Colo rado potato beetle: relevance of selected cytochrome P450s and clothianidin. Insects 2022, 13(5), 505. [CrossRef]
- Oppert, B., Guedes, R.N.C., Aikins, M.J., Perkin, L., Chen, Z., Phillips, T.W., Zhu, K.Y., Opit, G.P., Hoon, K., Sun, Y.M., Meredith, G, Bramlett, K., Hernandez, N.S., Sanderson, B., Taylor, M.W., Dhingra, D., Blakey, B., Lorenzen, M., Adedipe, F., Arthur, F. Genes related to mitochondrial functions are differentially expressed in phosphine-resistant and -susceptible Tribolium castaneum. BMC Genomics 2015, 16, 968. [CrossRef]
- Jiang, W.J., He, X.J., Wang, Z.L., Yan, W.Y., Zeng, Z.J., Wu, X.B. Cloning and expression analysis of cytochrome CYP9E2 gene in the Chinese honeybee, Apis cerana cerana. Acta Entomologica Sinica 2016, 59 (10), 1050 -1057. [CrossRef]
- Gao, Y., Kim, K., Kwon, D.H., Jeong, I.H, Clark, J.M., Lee, S.H. Transcriptome-based identification and characterization of genes commonly responding to five different insecticides in the diamondback moth, Plutella xylostella. Pestic. Biochem. Physiol. 2018, 144, 1–9. [CrossRef]
- Wu, L.X., Jia, Q.Q., Zhang, X.B., Zhang, X.Y., Liu, S.N., Park, Y., Feyereisen, R., Zhu, K., Ma, E., Zhang, J.Z., Li, S. CYP303A1 has a conserved function in adult eclosion in Locusta migratoria and Drosophila melanogaster. Insect Biochem. Mol. Biol. 2019, 113, 103210. [CrossRef]
- Du, T.H., Yin, C., Gui, L.Y., Liang, J.J., Liu, S.N., Fu, B.L., He, C., Yang, J., Wei, X.G., Gong, P.P., Huang, M.J., Xue, H., Hu, J.Y., Du, H., Ji, Y., Zhang, R., Wang, C., Zhang, C.J., Yang, X., Zhang, Y.J. Over-expression of UDP-glycosyltransferase UGT353G2 confers resistance to neonicotinoids in whitefly (Bemisia tabaci). Pestic. Biochem. Physiol. 2023, 196,105635. [CrossRef]
- Sun, X.Q., Gong, Y.H., Ali, S., Hou, M.L. Mechanisms of resistance to thiamethoxam and dinotefuran compared to imidacloprid in the brown planthopper: Roles of cytochrome P450 monooxygenase and a P450 gene CYP6ER1. Pestic. Biochem. Physiol. 2018, 150, 17–26. [CrossRef]
- Clements, J., Schoville, S., Peterson, N., Huseth, A.S., Lan, Q., Groves. R.L. RNA interference of three up-regulated transcripts associated with insecticide resistance in an imidacloprid resistant population of Leptinotarsa decemlineata. Pestic. Biochem. Physiol. 2017, 135: 35-40. [CrossRef]
- Kaplanoglu, E., Scott, I. M., Vickruck, J., Donly, C. Role of CYP9E2 and a long non-coding RNA gene in resistance to a spinosad insecticide in the Colorado potato beetle, Leptinotarsa decemlineata. PLOS ONE, 2024, 19(5), e0304037. [CrossRef]
Figure 1.
GO functional annotation of differentially expressed genes. Figure 1. Gene ontology (GO) functional annotation of differentially expressed genes.
Figure 1.
GO functional annotation of differentially expressed genes. Figure 1. Gene ontology (GO) functional annotation of differentially expressed genes.
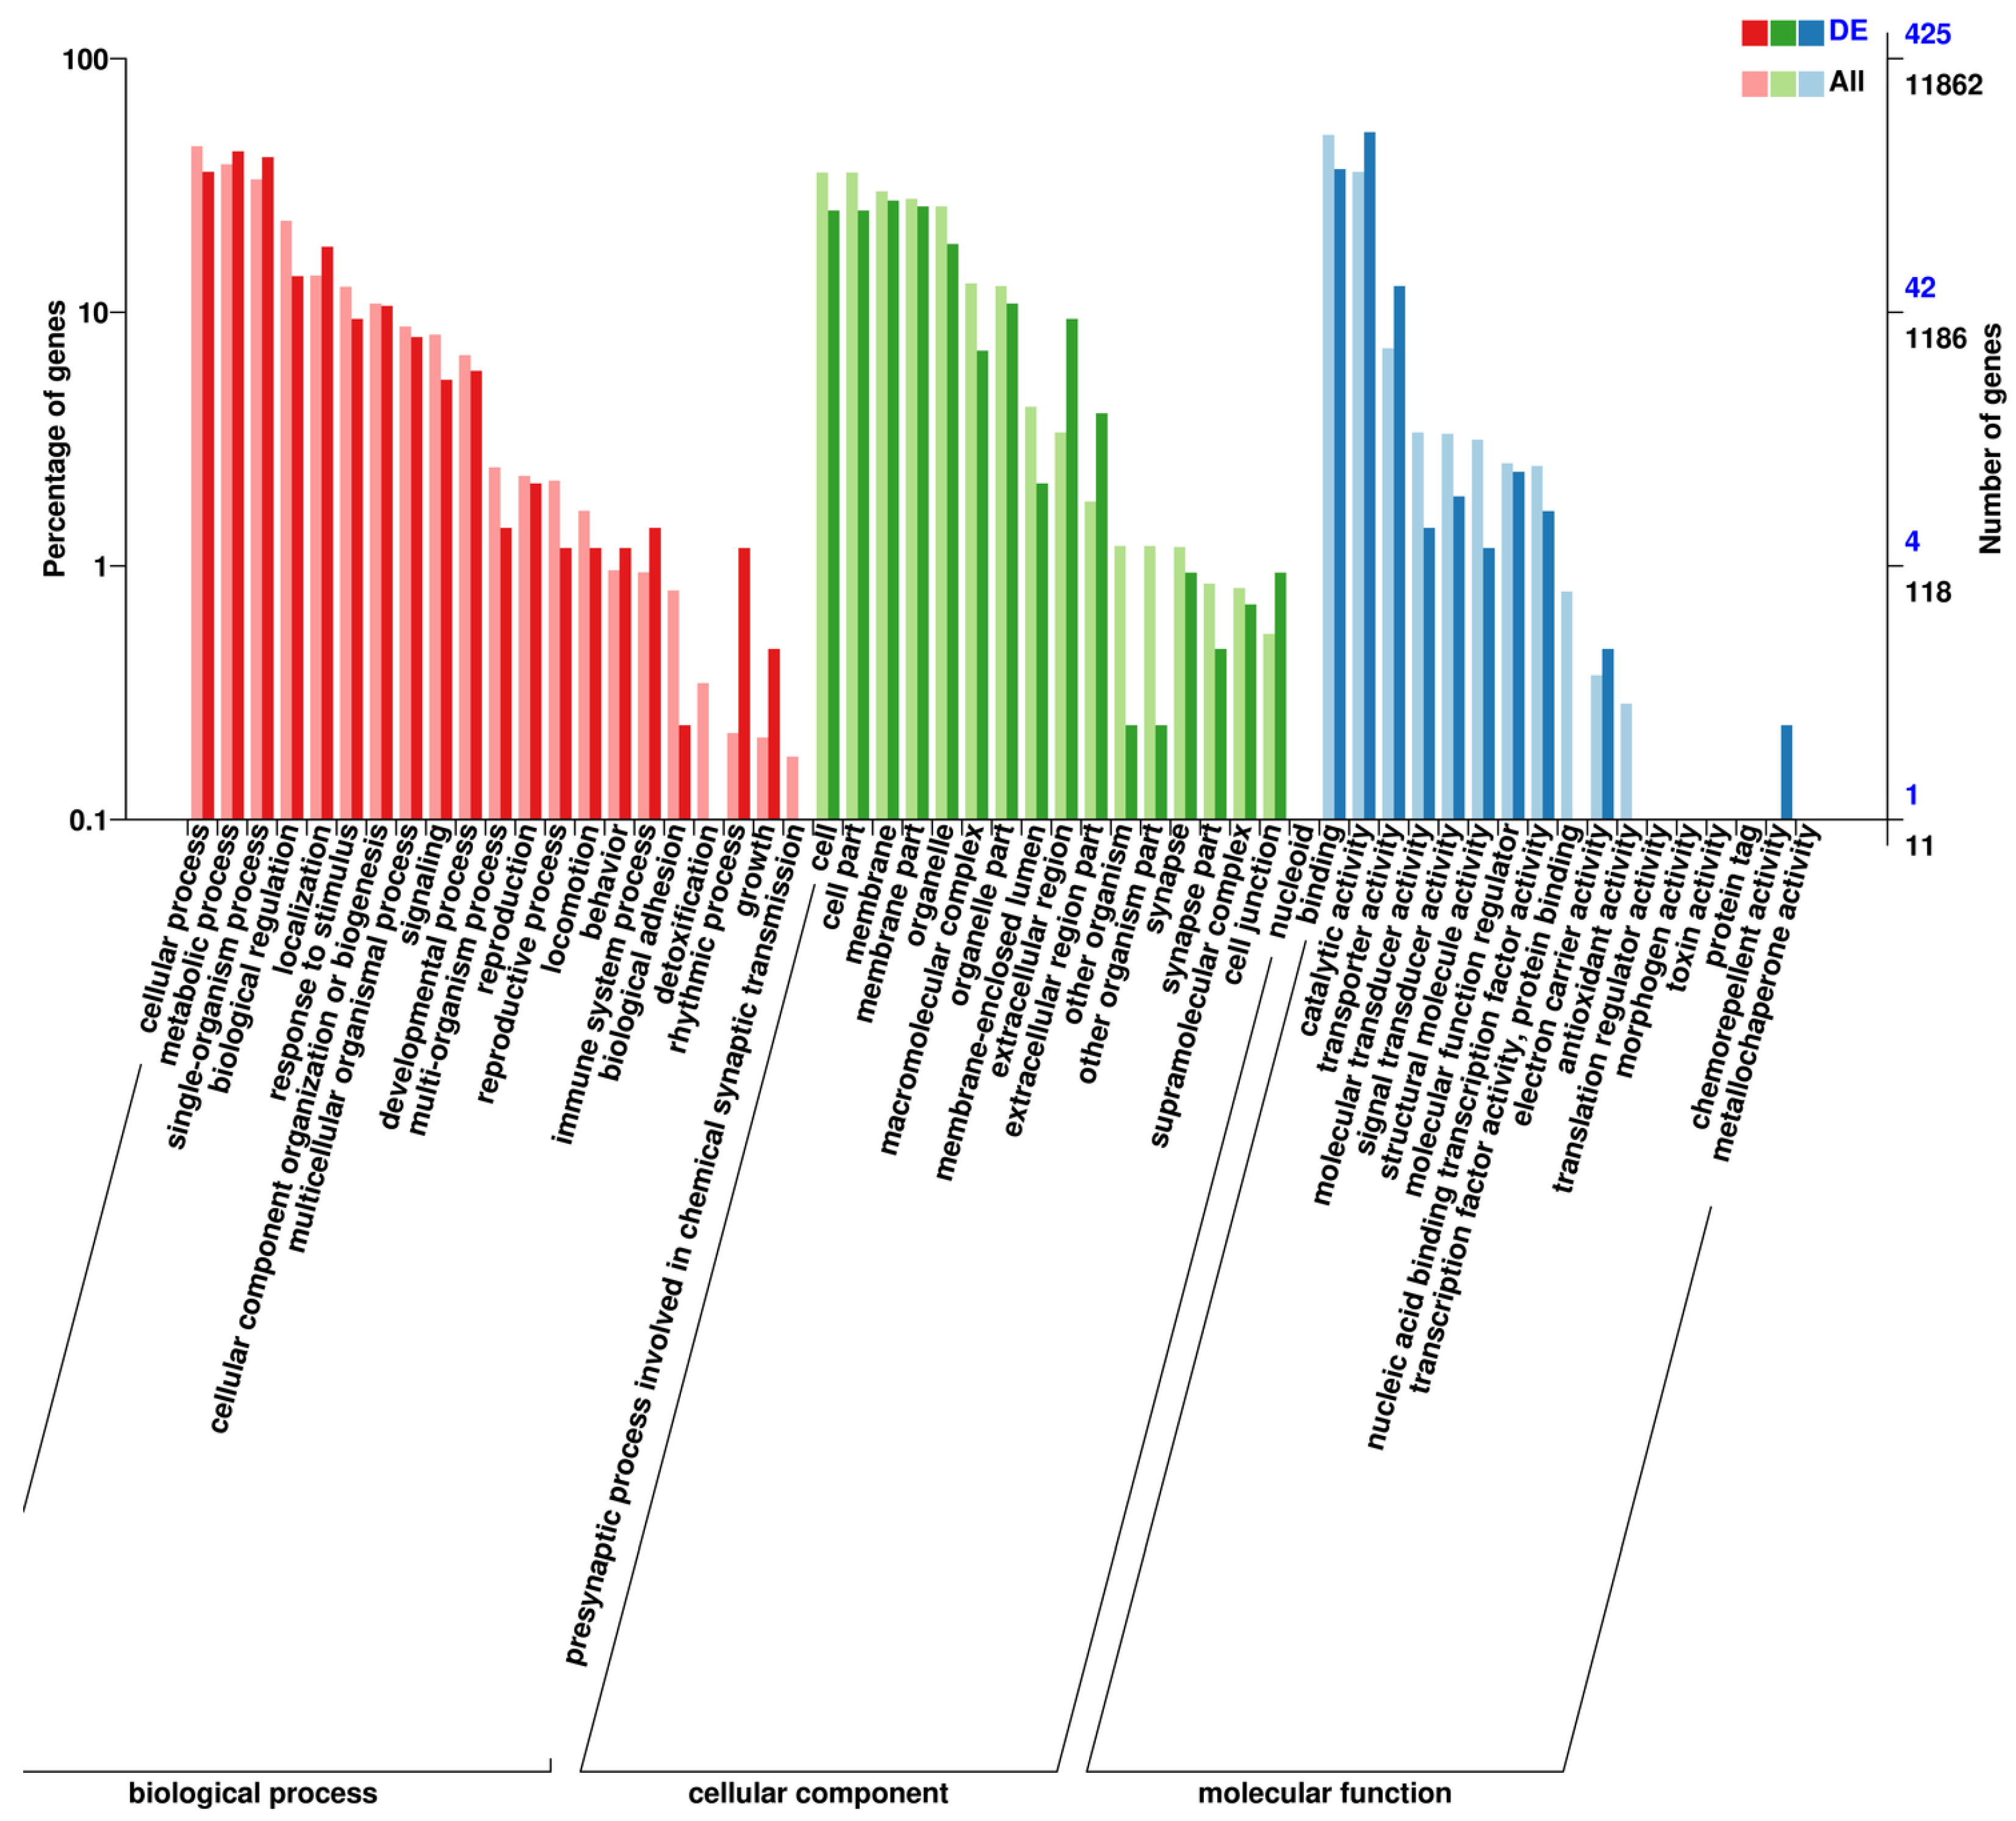
Figure 2.
KEGG enrichment histogram of differentially expressed genes. Figure 2. Kyoto Encyclopedia of Genes and Genomes (KEGG) enrichment histogram of differentially expressed genes.
Figure 2.
KEGG enrichment histogram of differentially expressed genes. Figure 2. Kyoto Encyclopedia of Genes and Genomes (KEGG) enrichment histogram of differentially expressed genes.
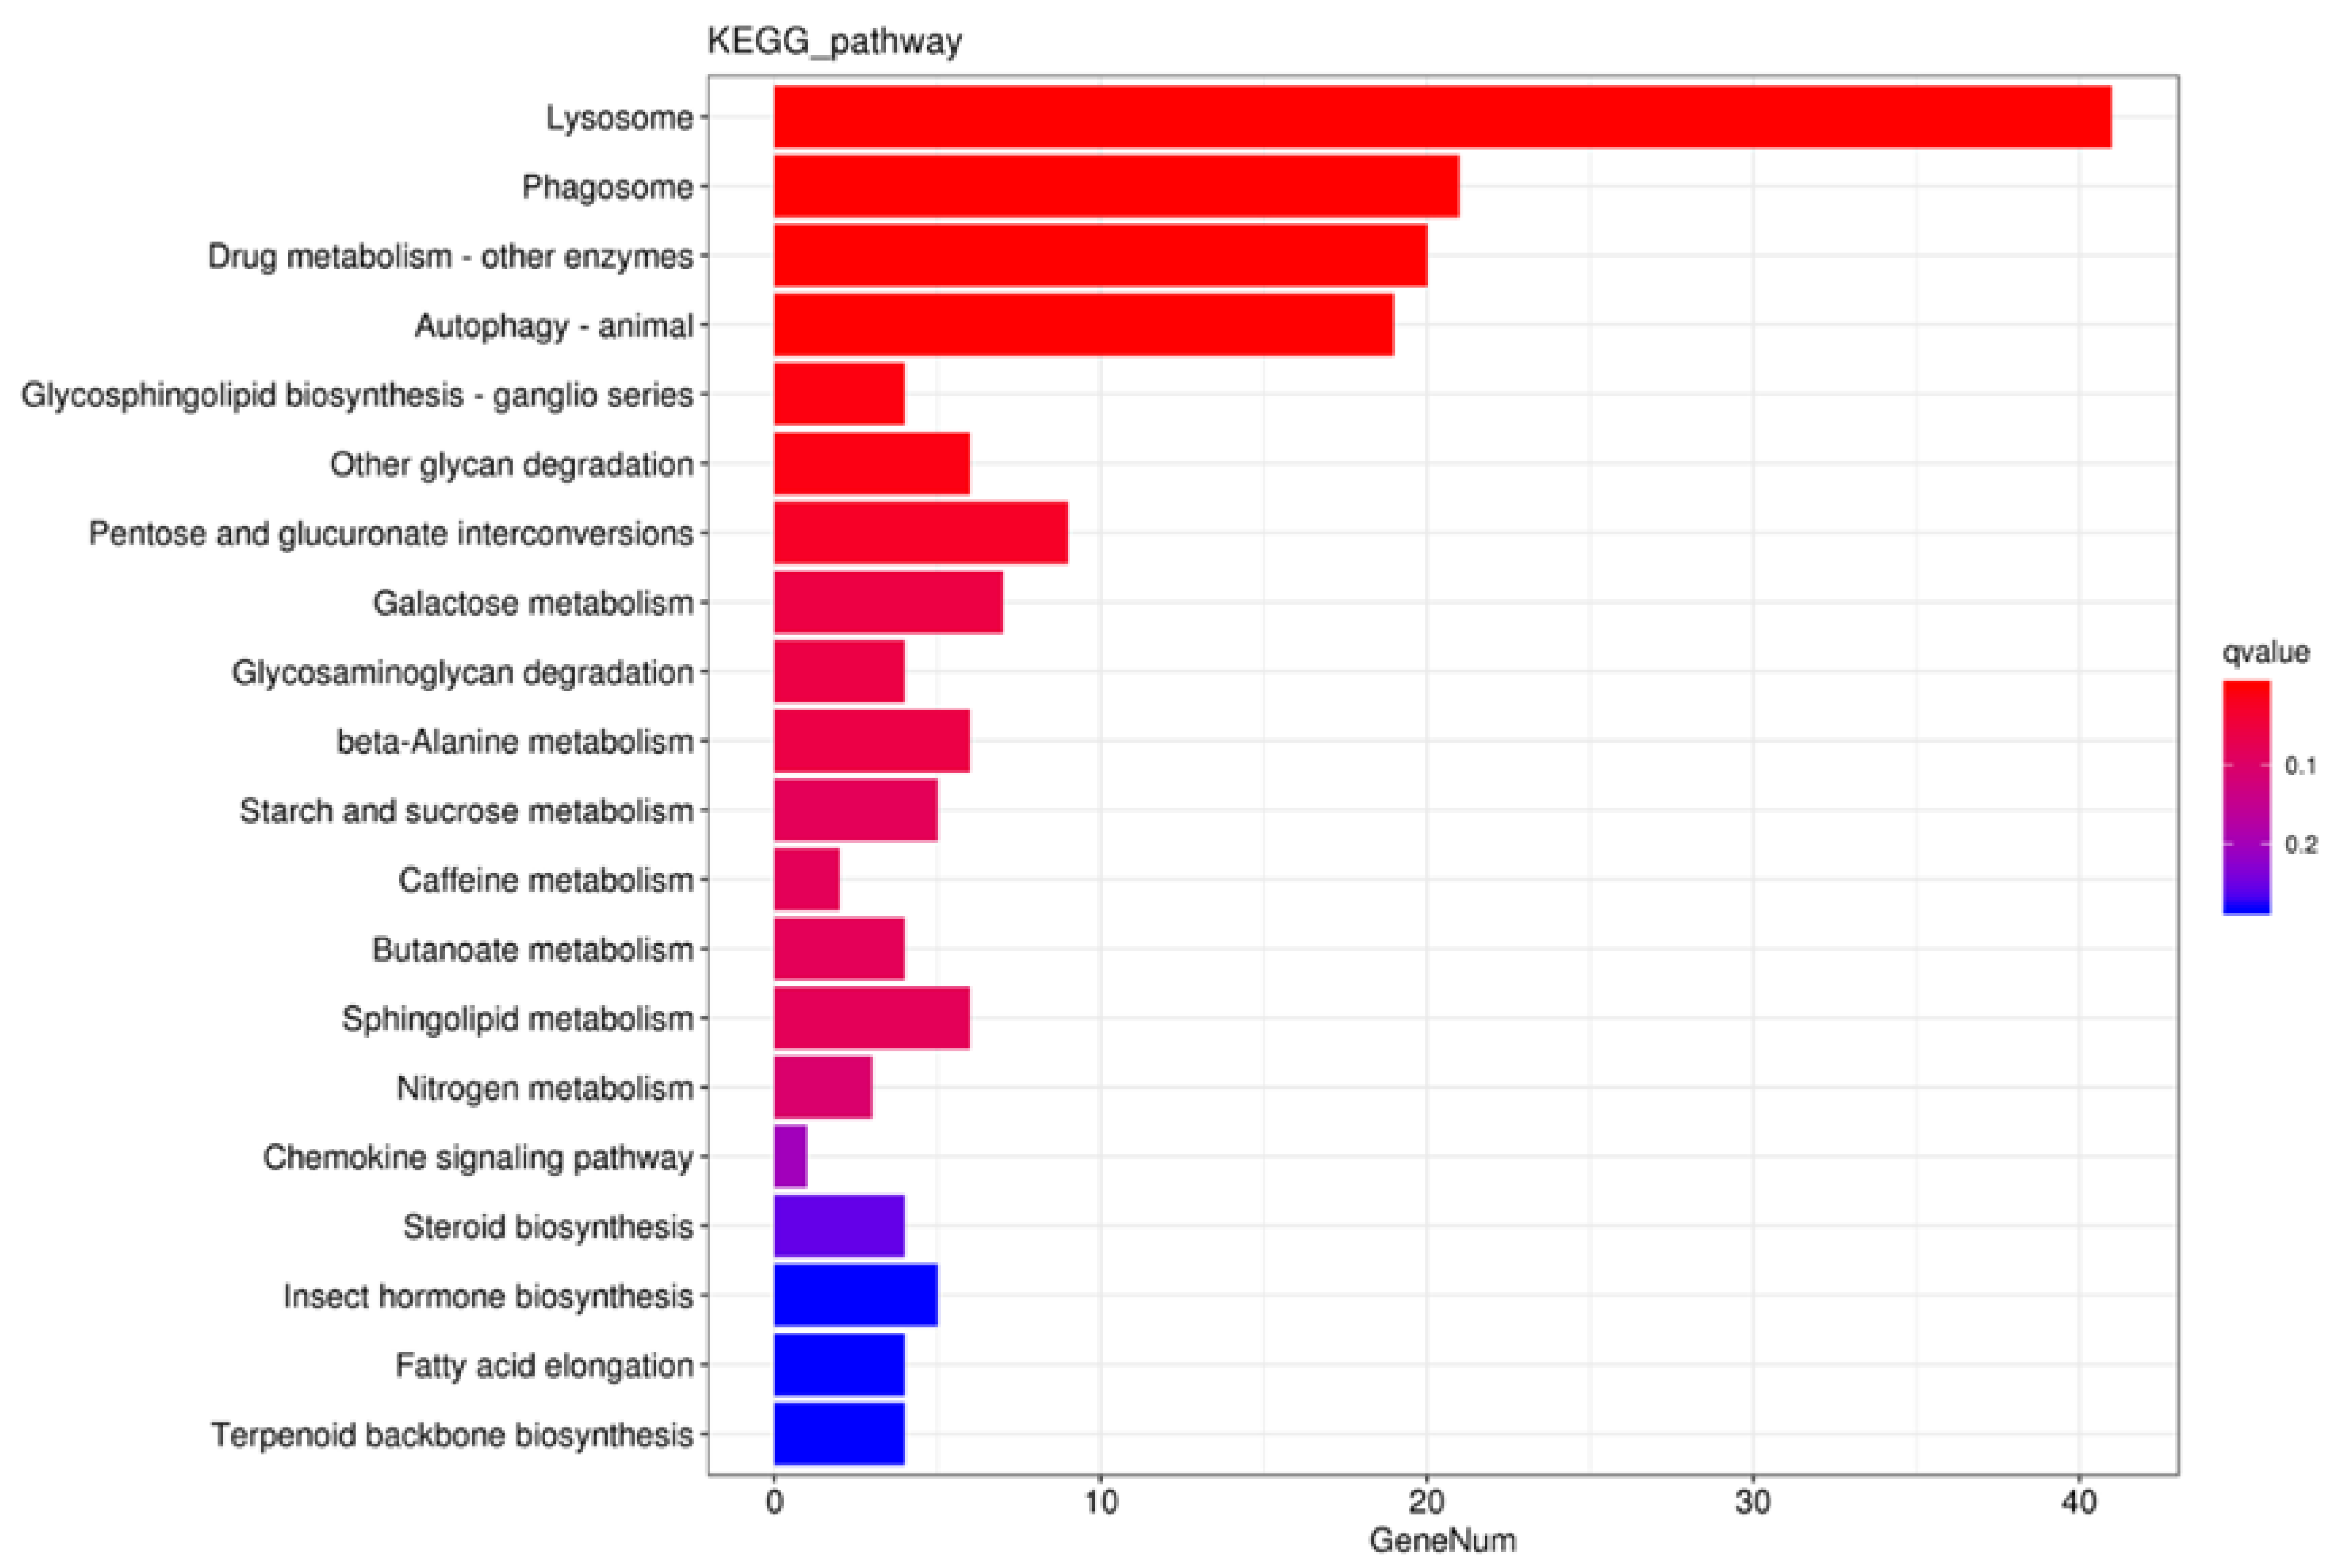
Figure 3.
Quantitative validation of differentially expressed genes from transcriptome data. Fold increase in normalized mRNA expression levels of P450 and UGT genes in resistant populations JMSL (collected from Jimsar Couty) or QPQLZ (collected from Qapqal County) in 2021 relative to normalized expression levels (set to one) in susceptible population (URMQY, collected from Urumqi City). Bar labeled in each column indicates sample mean ± SE. Asterisks (*) represent significant changes in the mRNA transcript level of each gene in qPCR results at P < 0.05 level (Student's t-test). Figure 3. Quantitative validation of differentially expressed genes from transcriptome data.
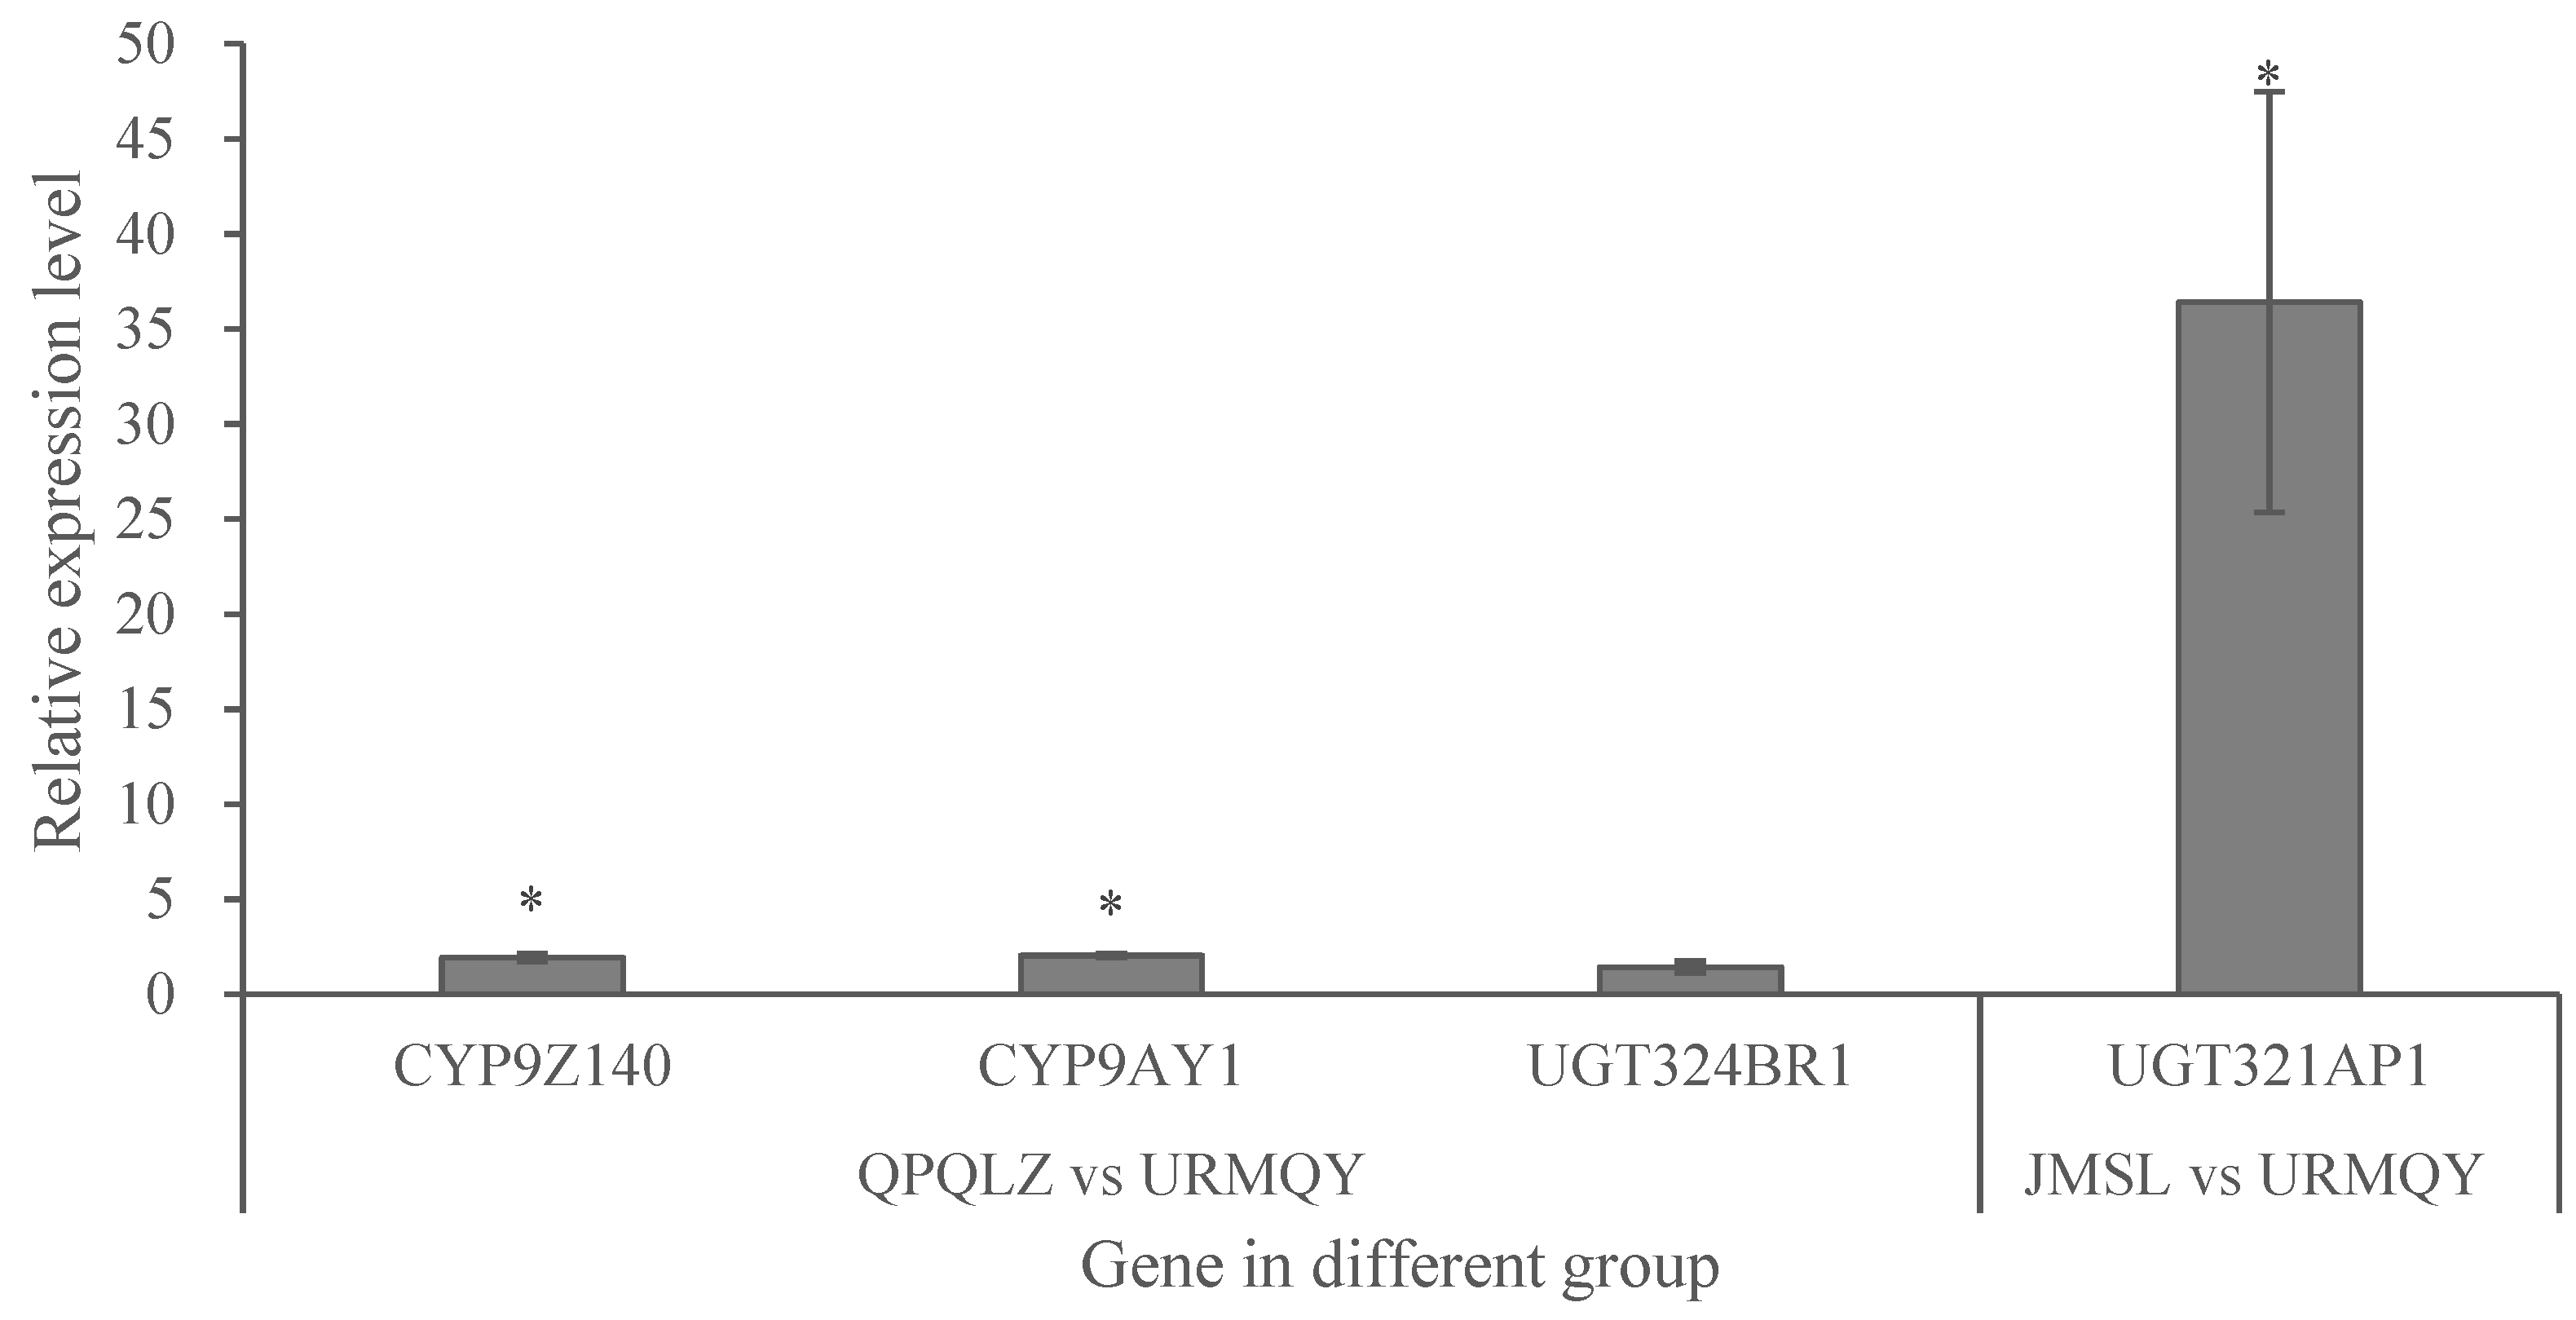
Figure 4.
Bioinformatic analysis of two P450 genes CYP9Z140 and CYP9AY1 from L. decemlineata. (A) Alignment of amino acid sequences of CYP9Z140, CYP9AY1 and related P450 gene CYP9Z1 from Tribolium castaneum. Conserved motifs were highlighted in the sequences, including the helix-C motif (WxxxR), the oxygen-binding motif (helix I) ([A/G] GX [E/D] T[T/S]), the helix K motif (EXXRXXP), the conserved Meander motif (PXXFXP) and the heme-binding motif (PFXXGXXXCXG). Red arrows indicate the conservative amino acid for catalytic activity. (B) Phylogenetic tree of CYP9Z140 and CYP9AY1 and related P450s from other insects. Bootstrap values (1000 replicates) are indicated next to the branches, and GenBank accession numbers are shown in parentheses. The black dot indicates CYP9Z140 and CYP9AY1 in L. decemlineata. Figure 4. Bioinformatic analysis of two P450 genes, CYP9Z140 and CYP9AY1, from Leptinotarsa decemlineata.
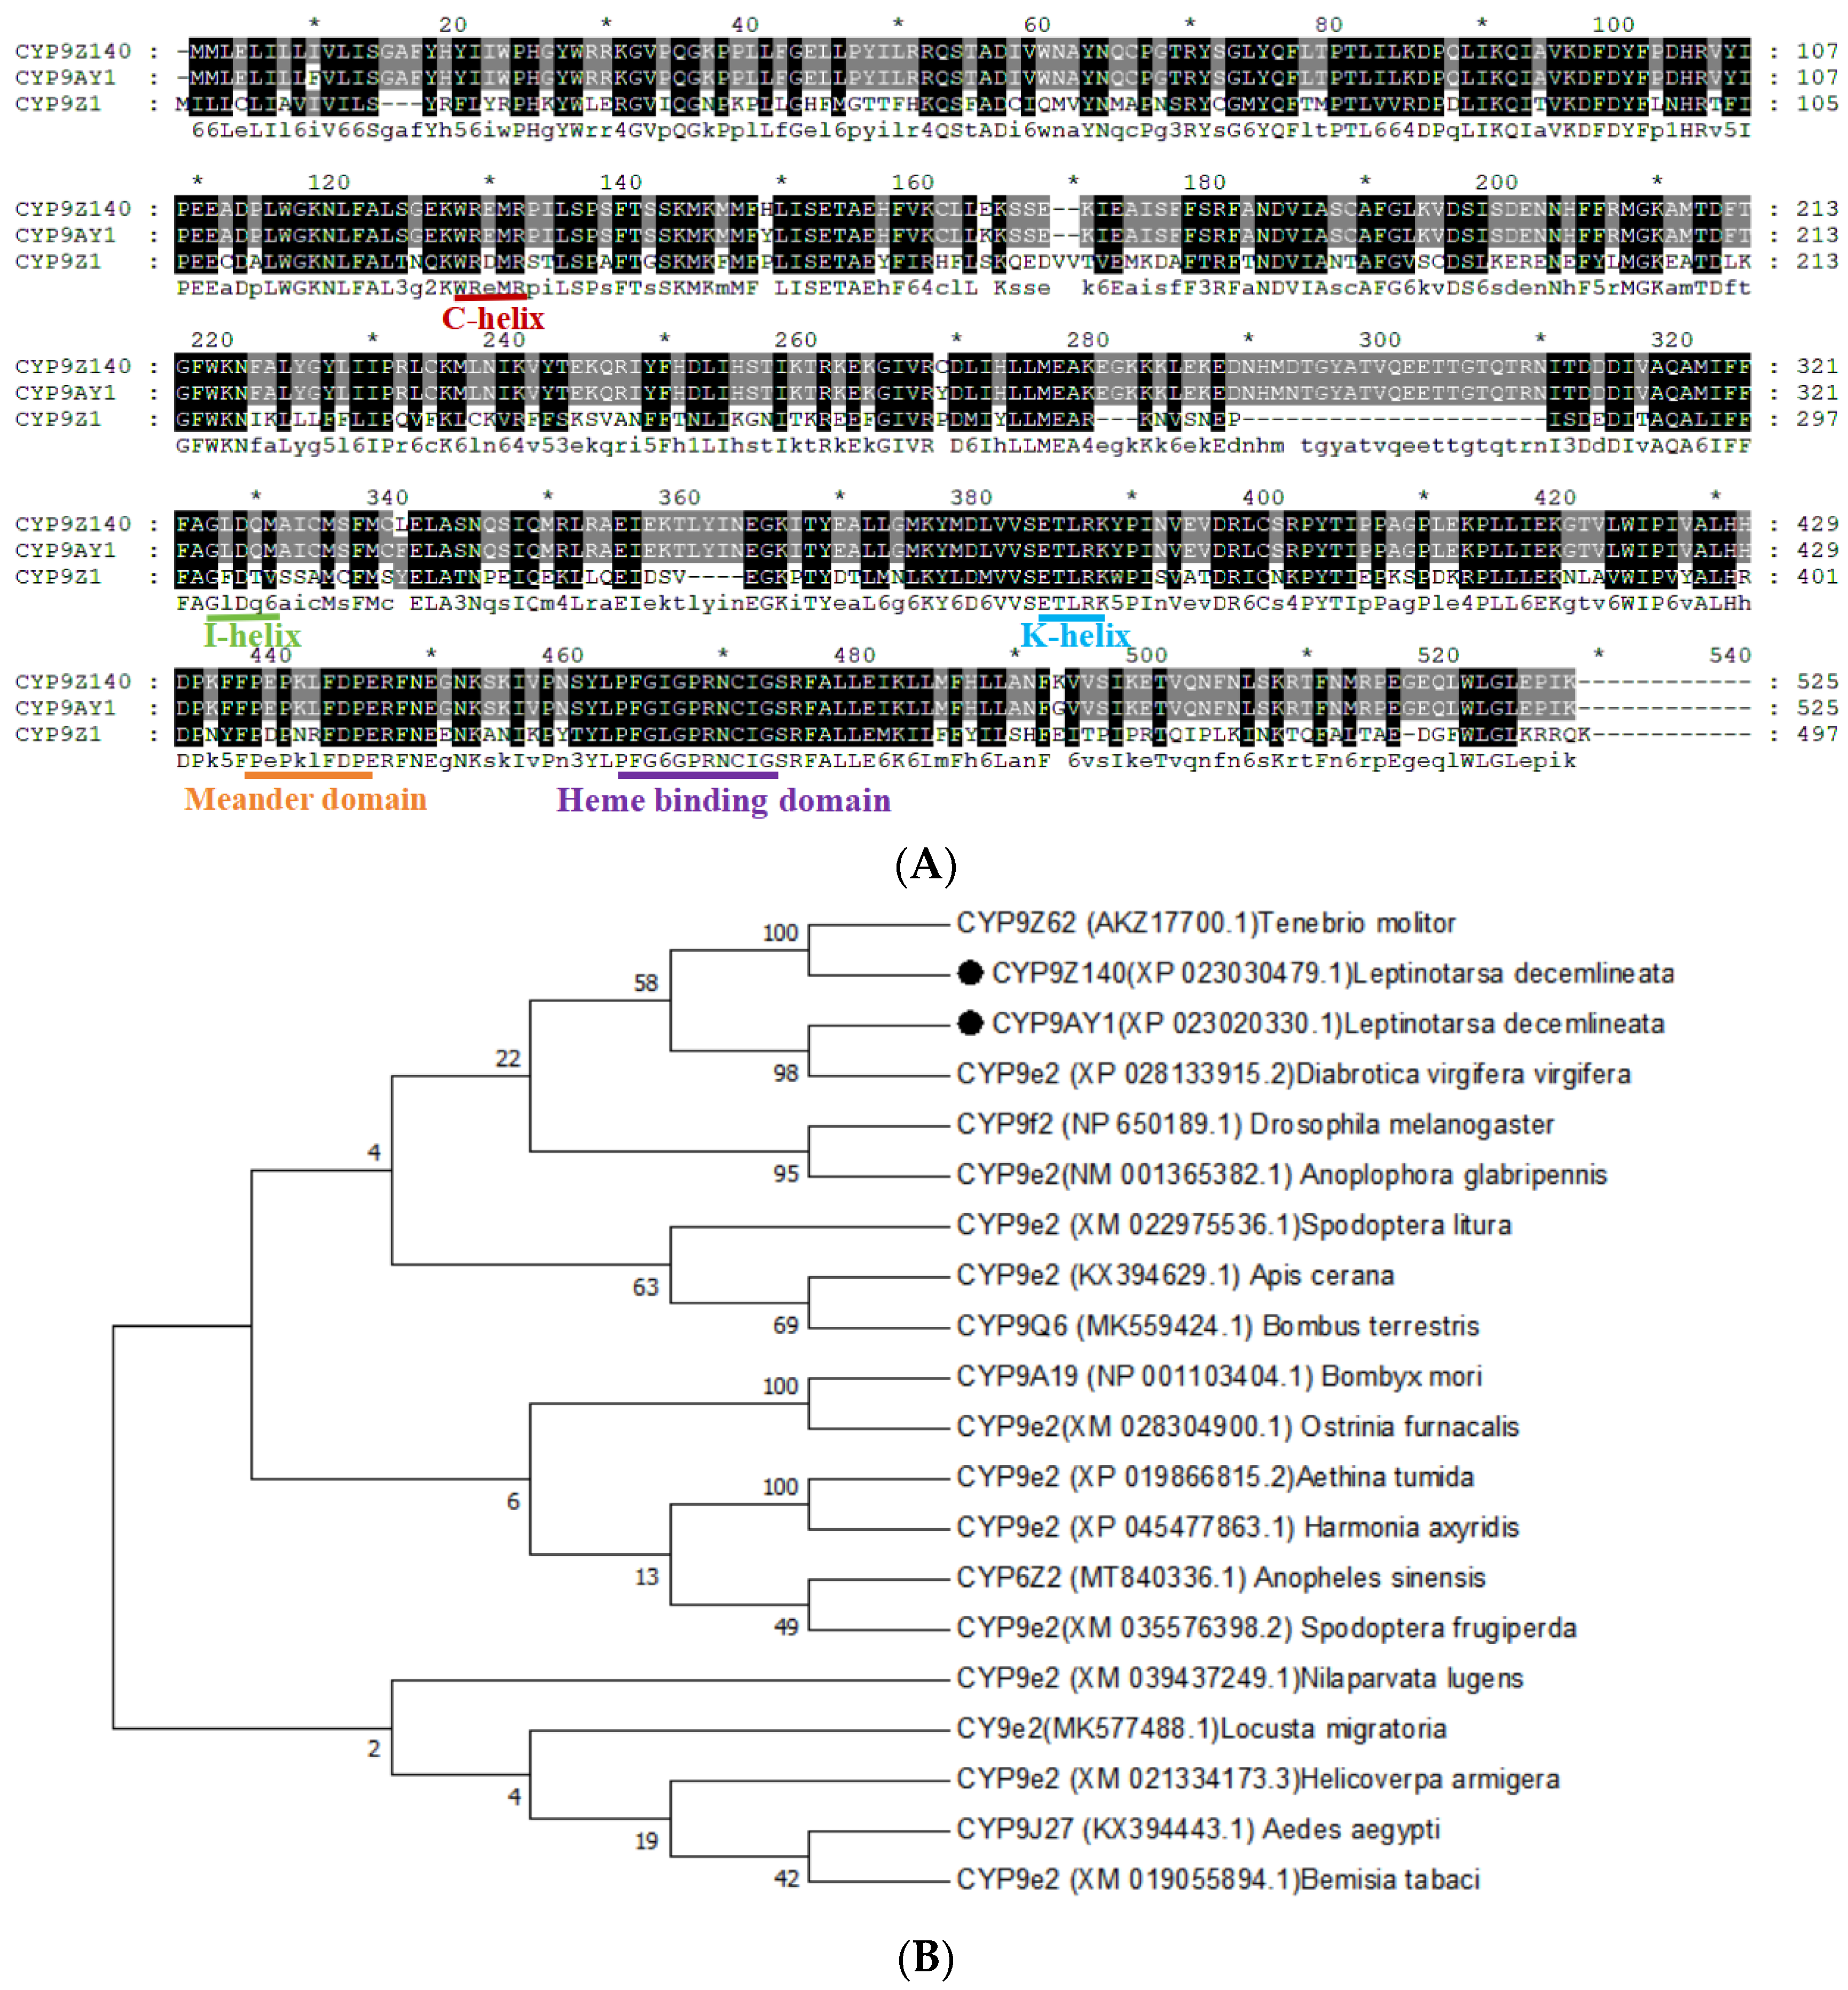
Figure 5.
Bioinformatic analysis of UGT gene UGT321AP1 from L. decemlineata. (A) Alignment of amino acid sequences of UGT321AP1 and related UGT gene from Tribolium castaneum, Sitophilos oryzae and Anoplophora glabripennis. The signal peptides in the N terminus are shown with a blue underline. The UGT signature motif is boxed. The transmembrane domains in the C-terminal half and cytoplasmic tail are shown in green and purple underline. The red bars under the sequences indicate the two donor-binding regions (DBR1 and DBR2). (B) Phylogenetic tree of UGT321AP1 and related UGTs from other insects. Bootstrap values (1000 replicates) are indicated next to the branches, and GenBank accession numbers are shown in parentheses. The black dot indicates UGT321AP1 in L. decemlineata. Figure 5. Bioinformatic analysis of the UGT gene UGT321AP1 from Leptinotarsa decemlineata.
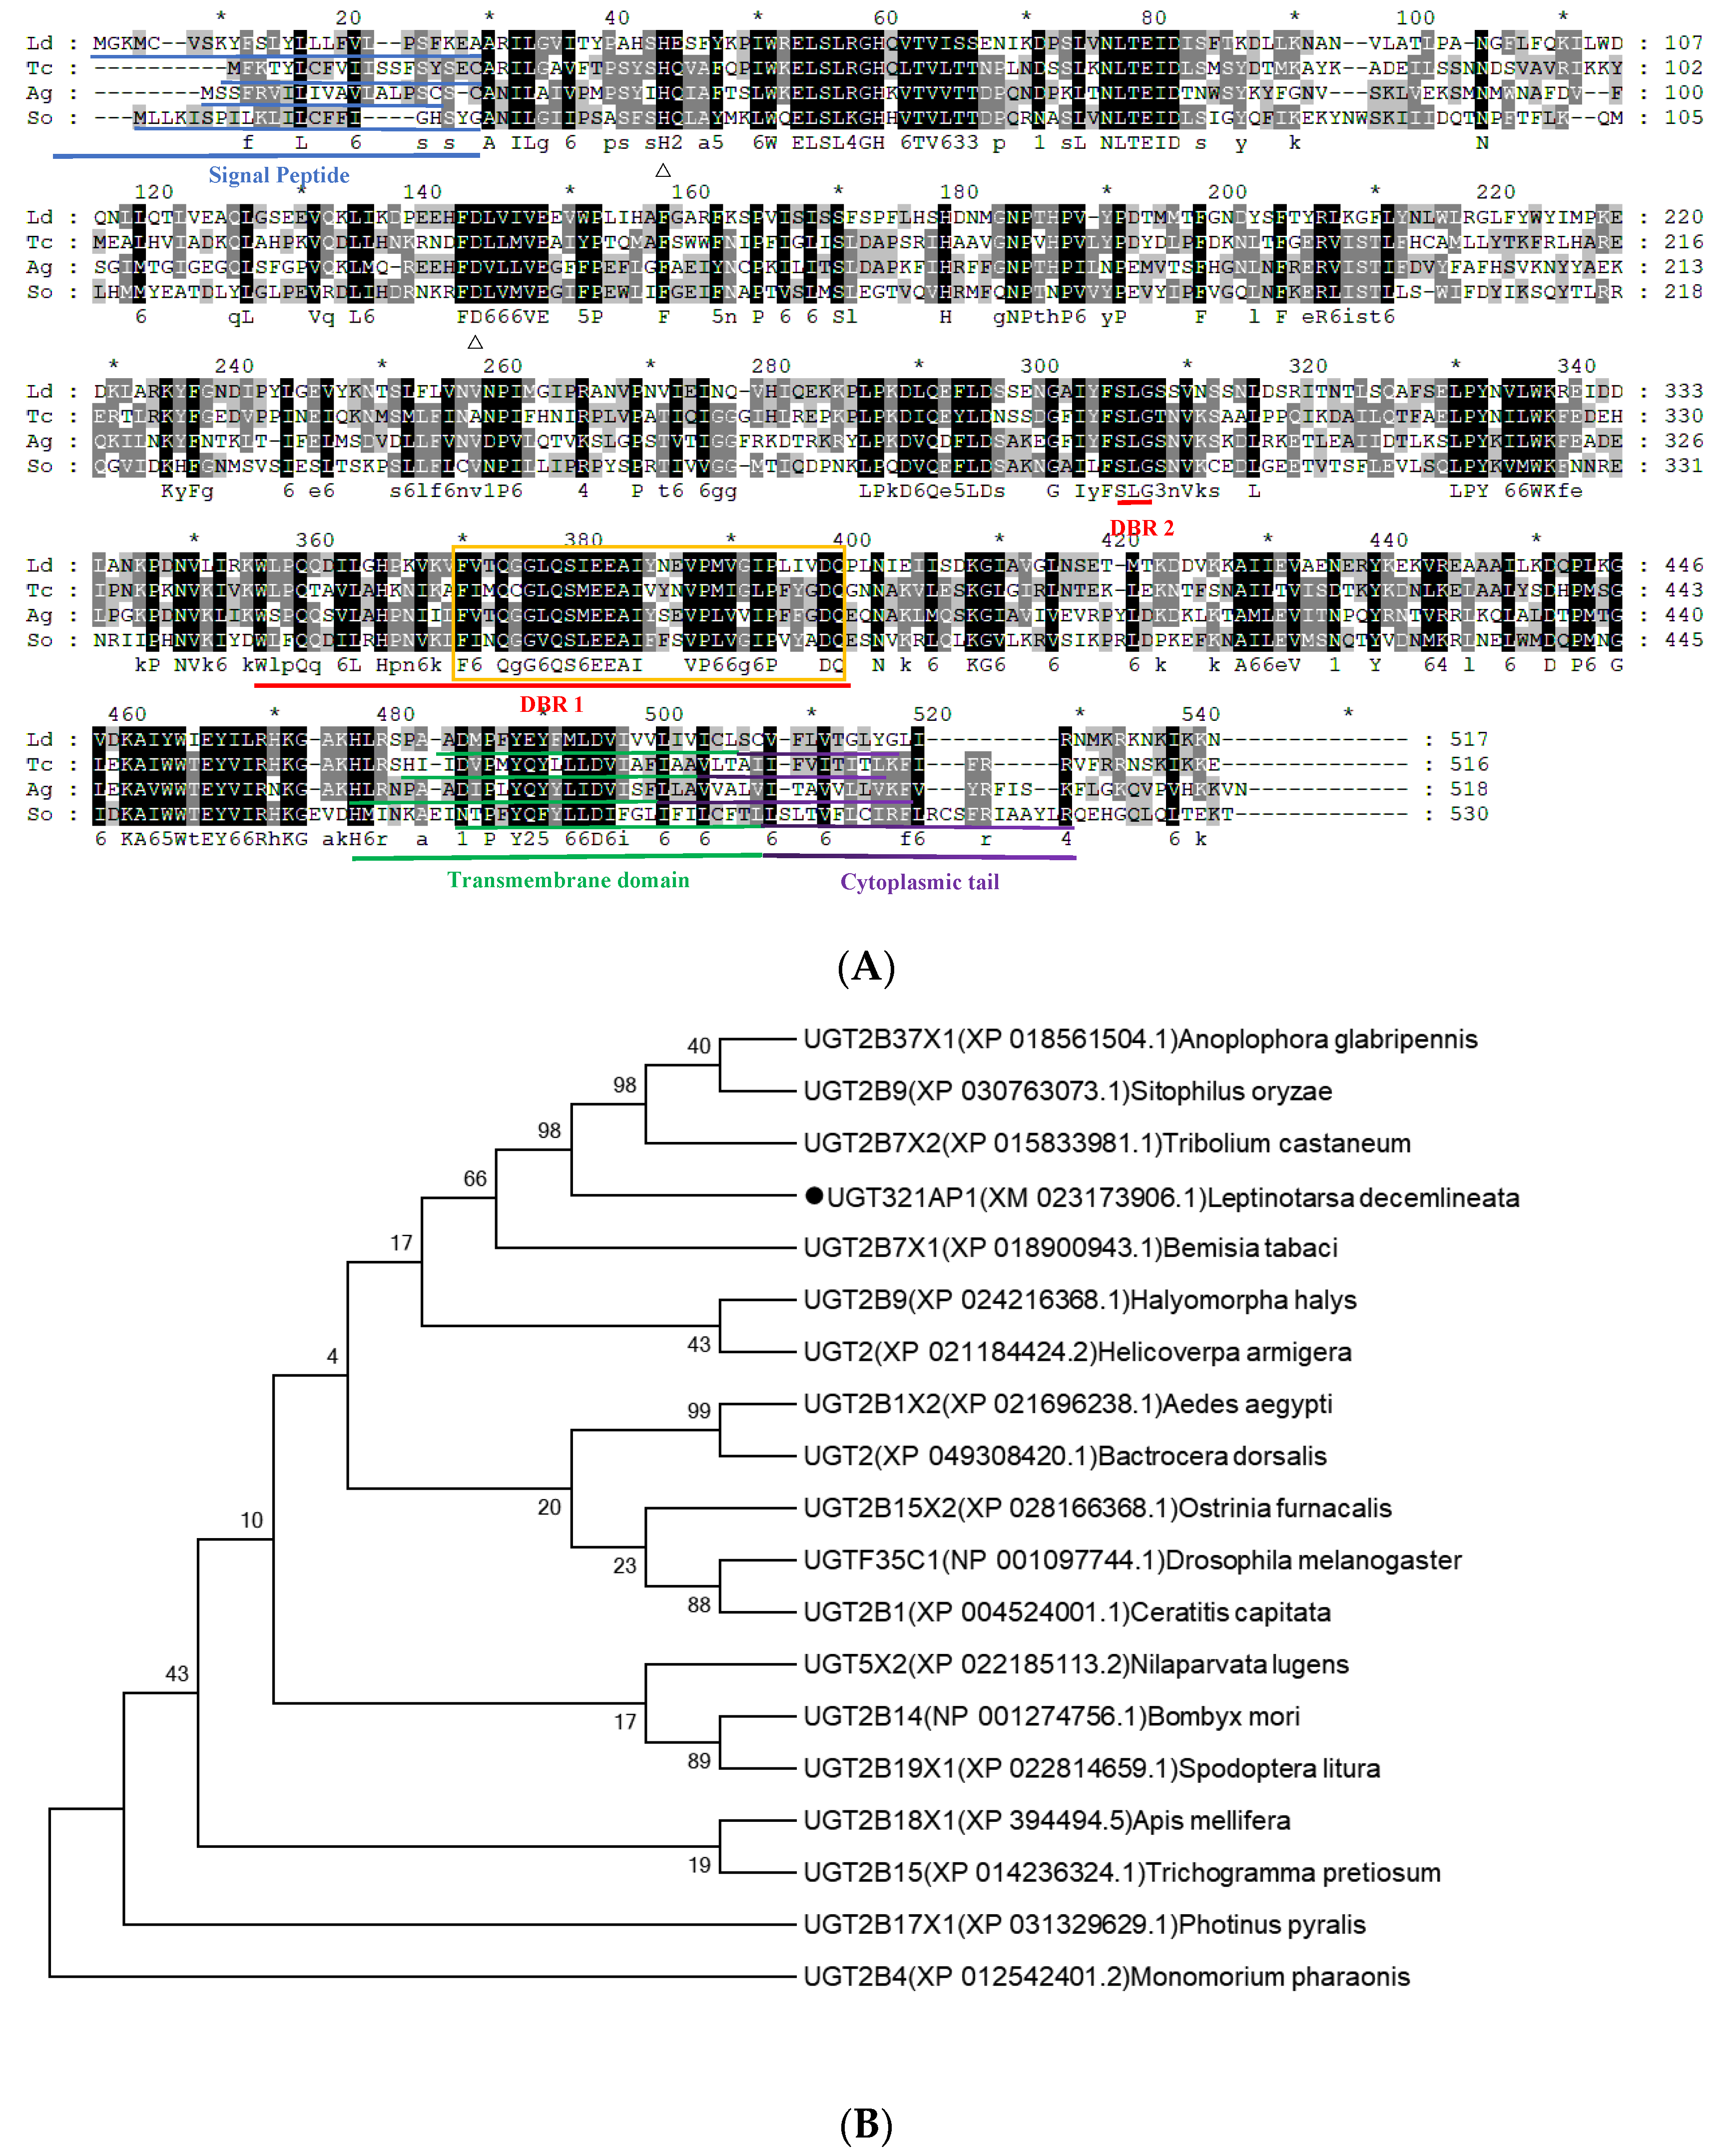
Figure 6.
Relative expression levels of CYP9Z140, CYP9AY1 and UGT321AP in different field populations of Leptinotarsa decemlineata in 2021, 2022 and 2023. Data are expressed as mean relative quantity ± SE. The expression levels of the three genes were normalized and calculated using EF-1α and RPL4 as internal reference genes. Different lowercase letters above the bars represent significant expression differences of each gene in different populations compared to susceptible population using one-way ANOVA followed by Tukey's multiple comparisons (P < 0.05). Figure 6. Relative expression levels of CYP9Z140, CYP9AY1, and UGT321AP in different field populations of Leptinotarsa decemlineata in 2021, 2022, and 2023.
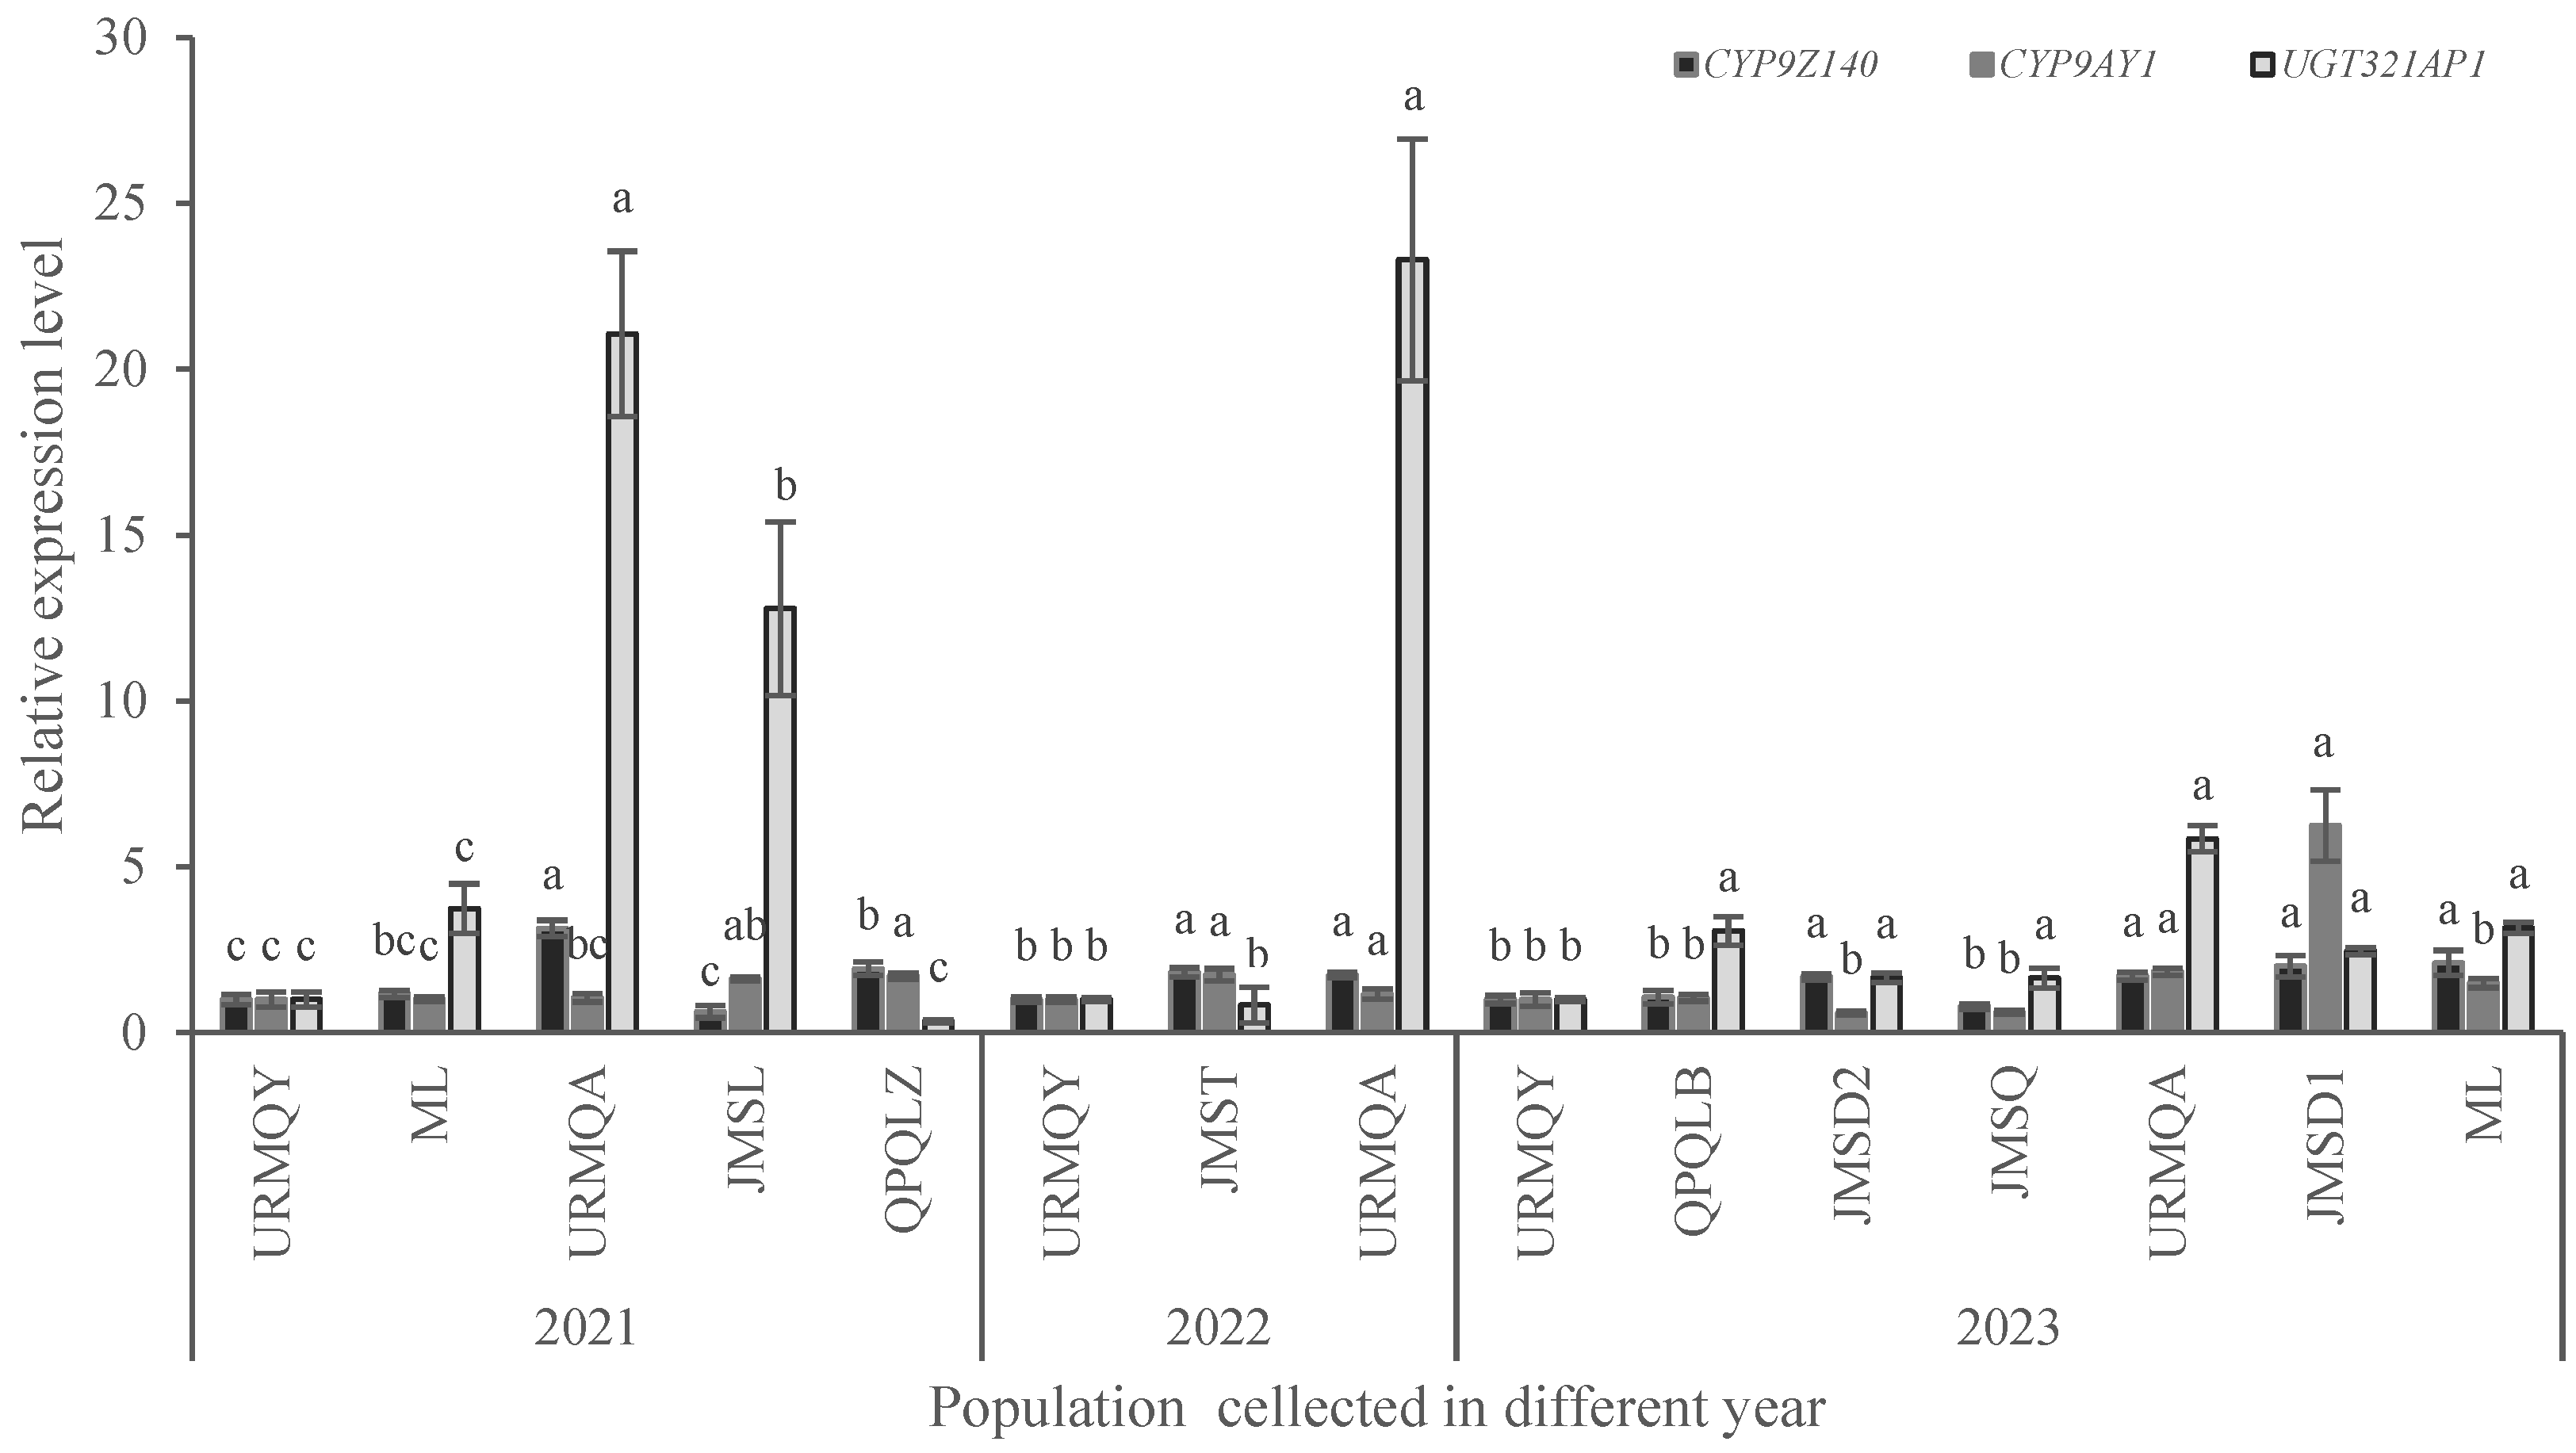
Figure 7.
Expression levels of P450 and UGT genes in Leptinotarsa decemlineata adults treated with LD50 of thiamethoxam (TMX). The mRNA expression levels of three genes in URMQA population exposure to acetone for 72 h were used as controls. The expression of the test genes was normalized and calculated using EF-1α and RPL4 as internal reference genes. Different lowercase letters above the bars represent significant differences in mRNA levels between treatment and control for each gene by Student's t-test (n = 3, mean relative quantity±SE, P < 0.05). Figure 7. Expression levels of P450 and UGT genes in Leptinotarsa decemlineata adults treated with LD50 of thiamethoxam (TMX).
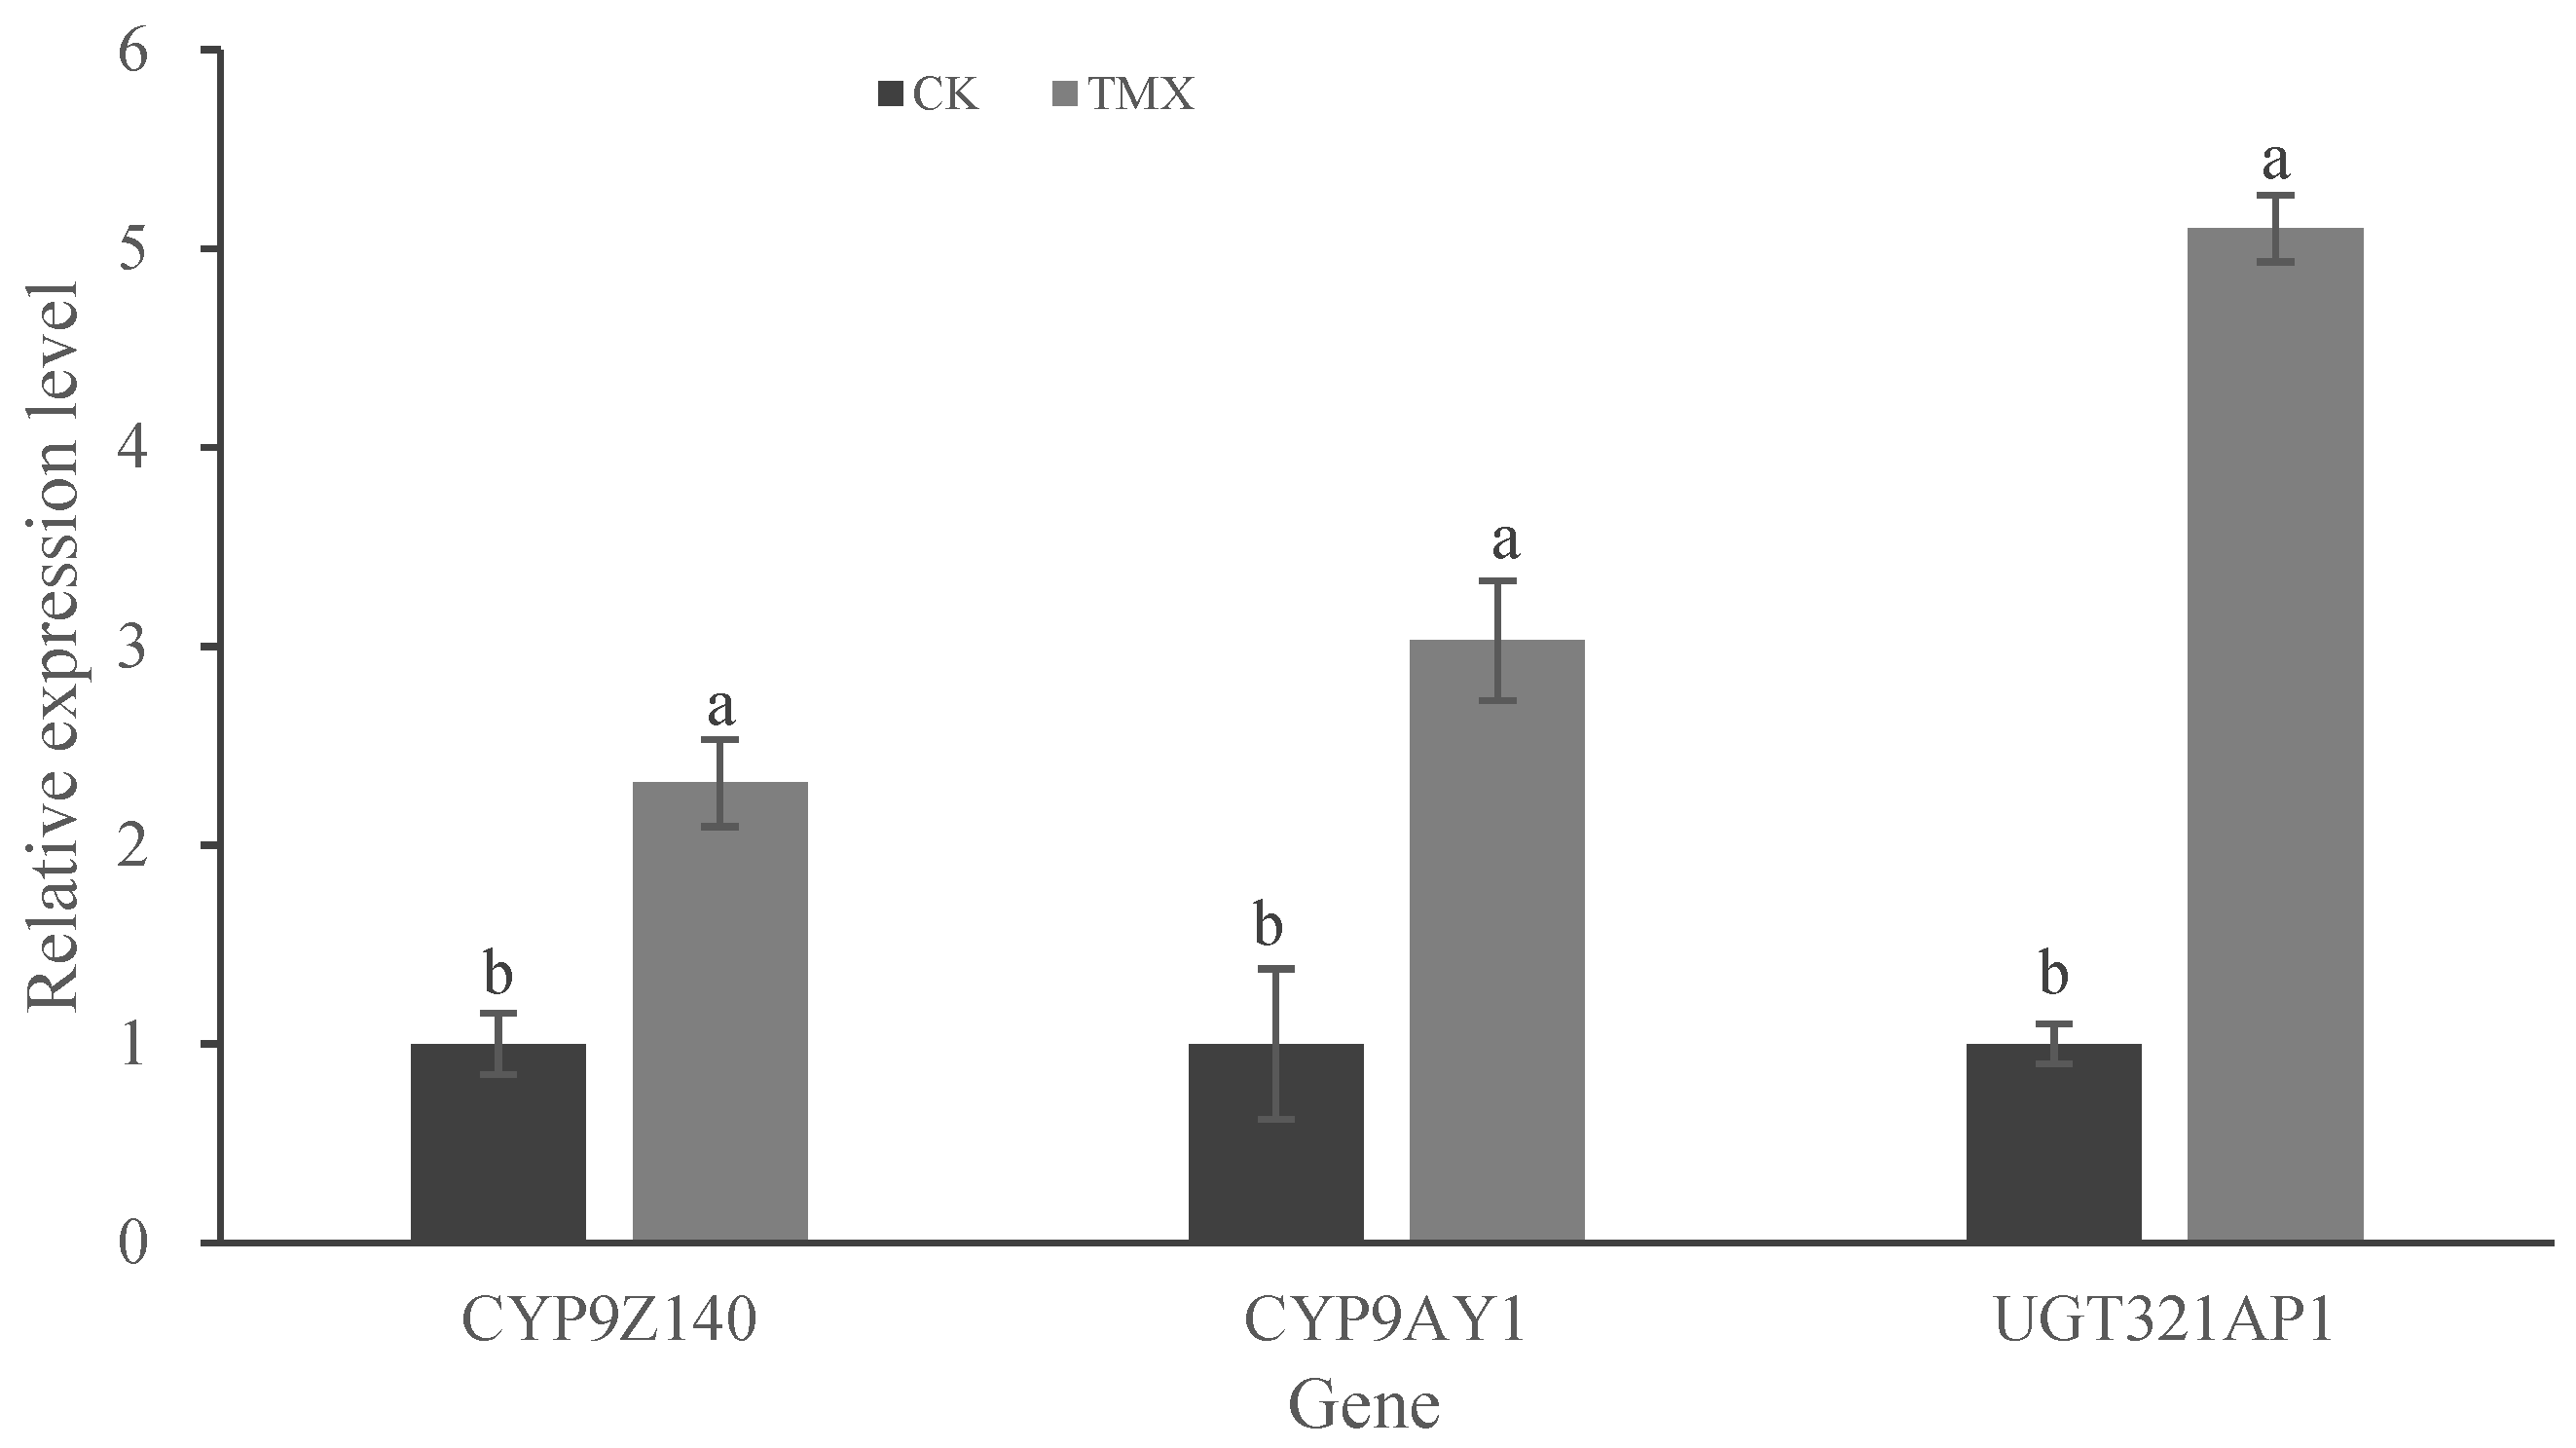
Figure 8.
Spatiotemporal expression patterns of CYP9Z140, CYP9AY1 and UGT321AP in Leptinotarsa decemlineata. (A) Relative expression levels of the three genes in developmental stages. L1: firs-instar larva; L2: second larva; L3: third-instar larva; L4: fourth-instar larva; P: pupe; A: adult. (B) Relative expression levels of the three genes in different tissues of Leptinotarsa decemlineata adults. FG: foregut; MG: midgut; HG: hindgut; MT: Malpighian tubule; FB: fat body. (C) Relative expression levels of the three genes in different parts of Leptinotarsa decemlineata adults. H: head; T: thorax; Ab: abdomen. Data are expressed as mean relative quantity ± SEM. Different lowercase letters above the bars represent significant differences in mRNA levels for each gene in different stages or tissues using one-way ANOVA followed by Tukey's multiple comparisons (n = 3, P < 0.05). Figure 8. Spatiotemporal expression patterns of CYP9Z140, CYP9AY1, and UGT321AP in Leptinotarsa decemlineata.
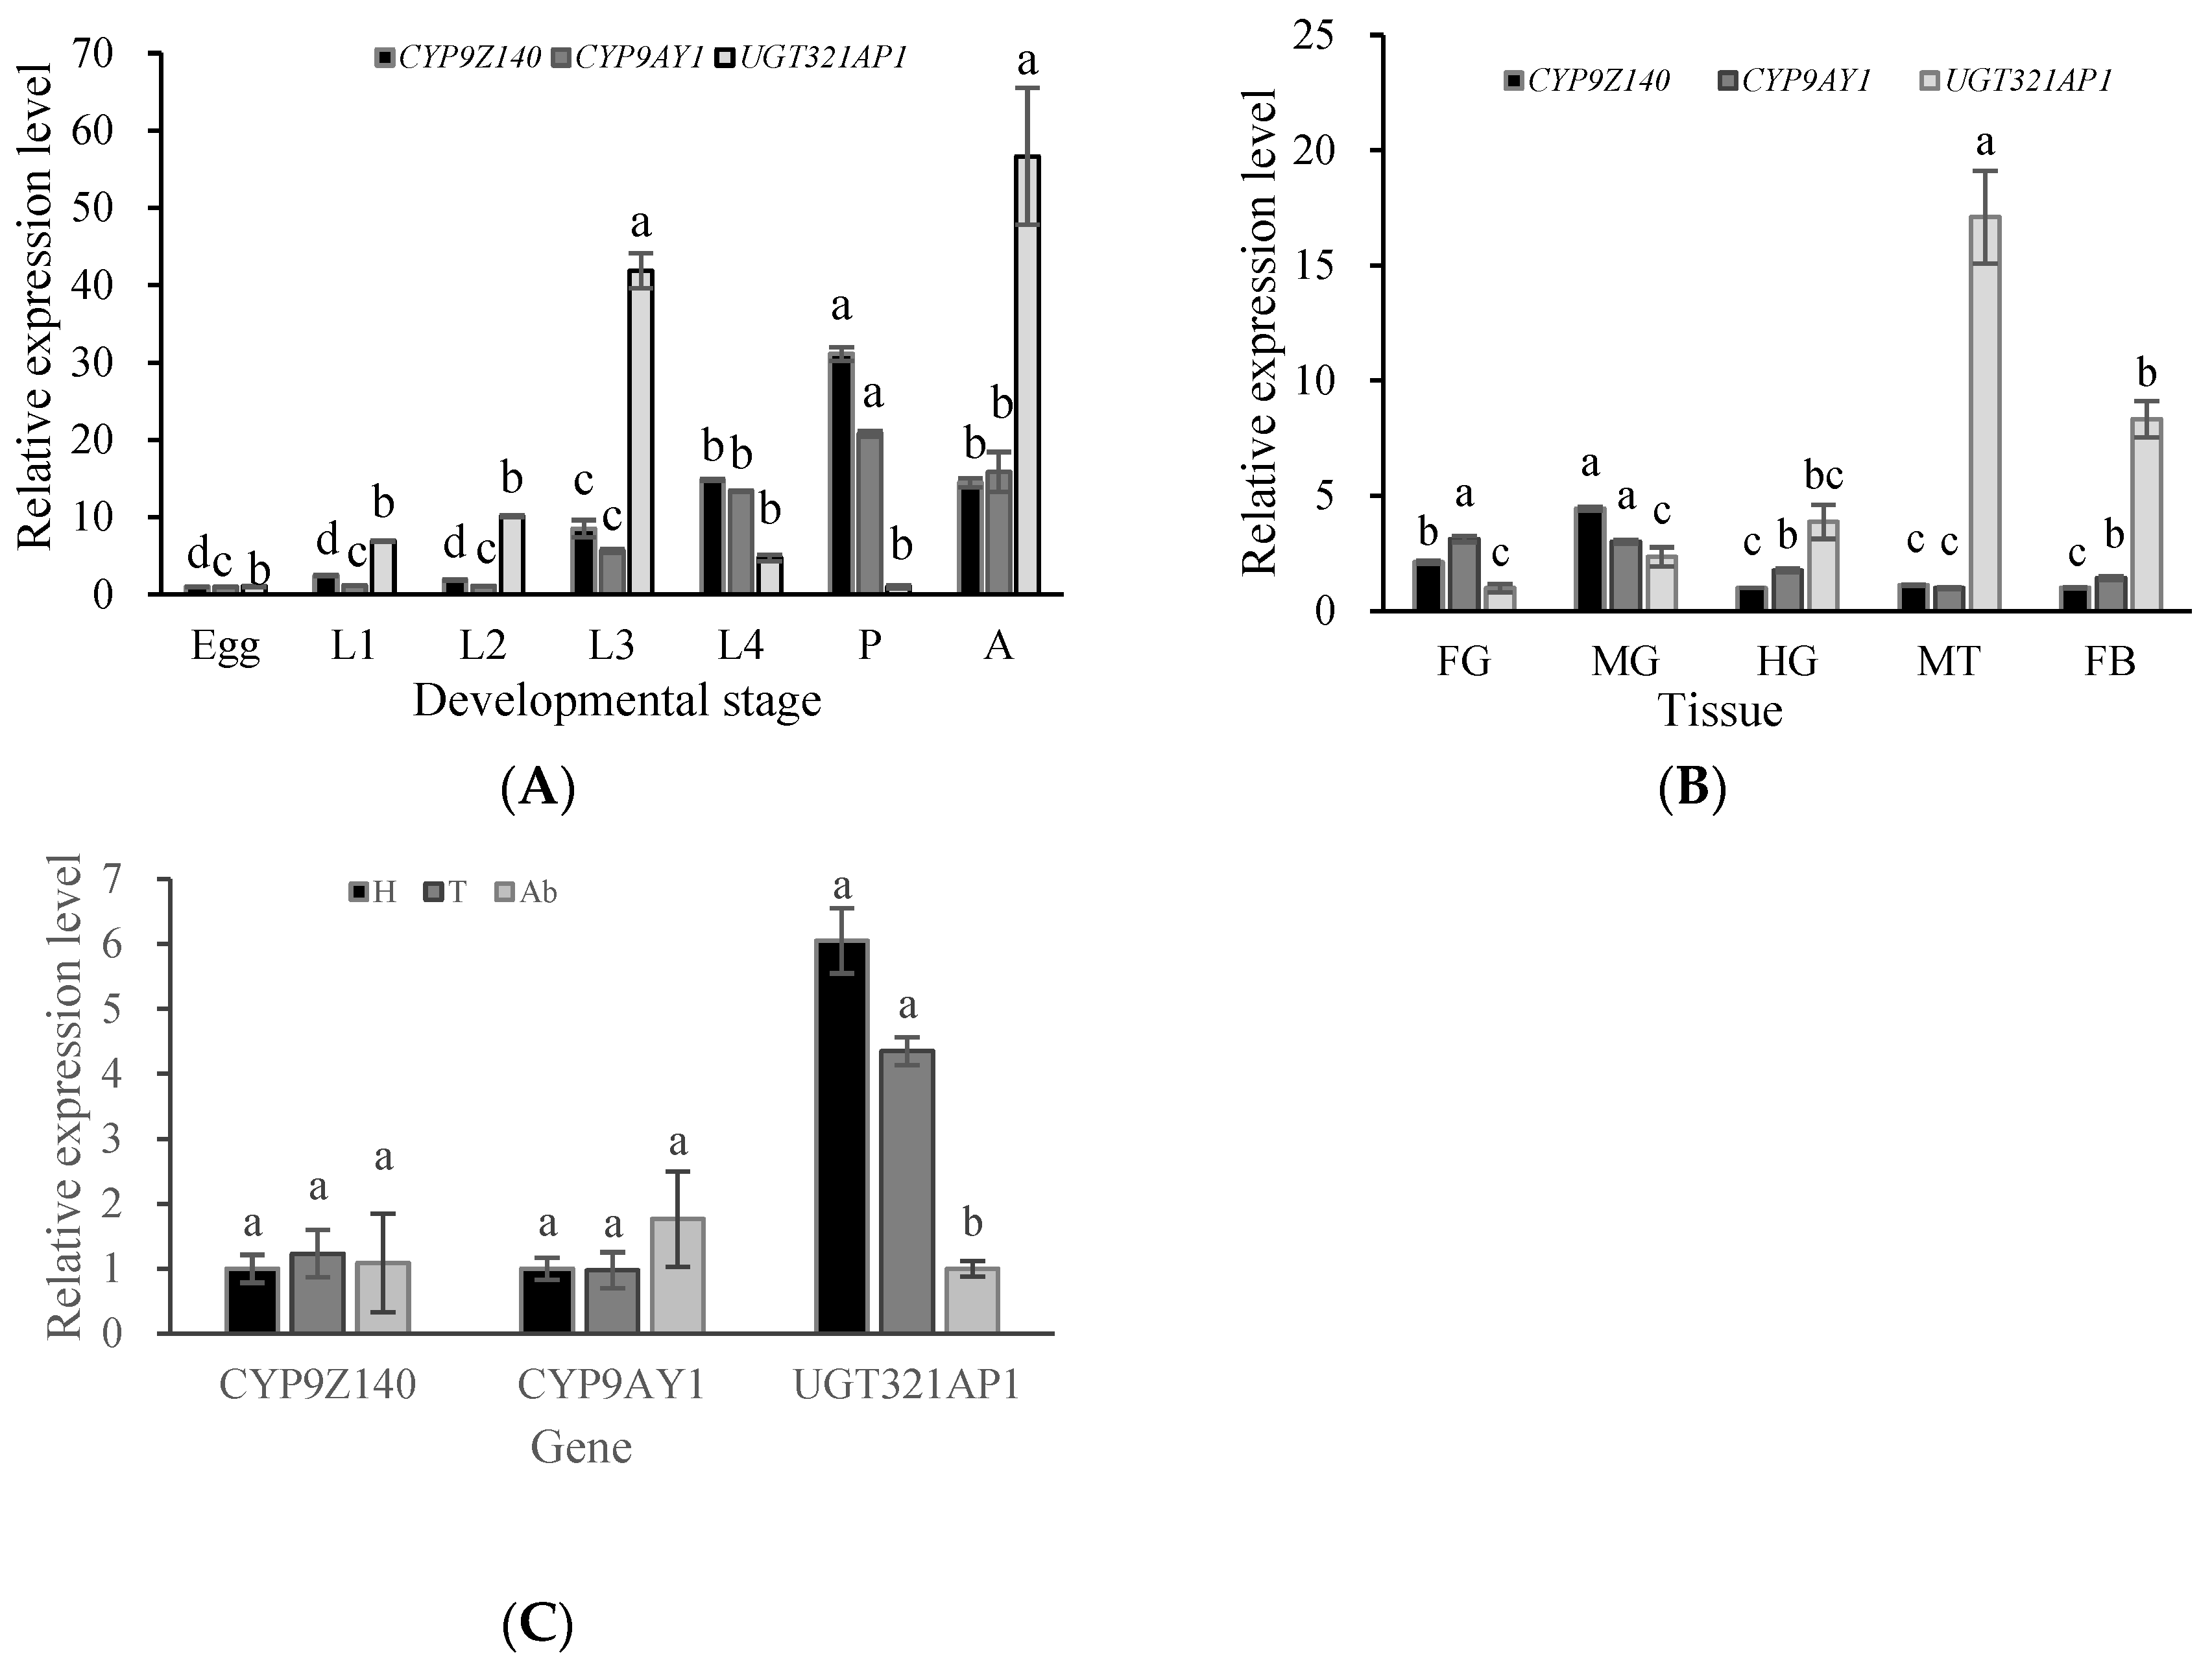
Figure 9.
Effects of RNA interference on three gene mRNA expression (A) and on sensitivity to thiamethoxam of adult Leptinotarsa decemlineata (B). (A) Quantitative PCR analysis was used to determine the expression of CYP9Z140, CYP9AY1 and UGT321AP in URMQA adults after feeding on a diet containing individual dsRNA or a mixture of dsRNA (dsCYP9Z140, dsCYP9AY and dsUGT321AP1) for 6 days. The expression level obtained with dsRNA of target genes is shown relative to that obtained with dsGFP, which was assigned a value of 1. (B) Mortality was recorded for adult Leptinotarsa decemline exposed to thiamethoxam (0.2963 μg/adult) for 72 h after individual and simultaneous RNAi for 6 d. Adults were fed with dsGFP as control. All values are means + SE of three biological replicates. Different lowercase letters above the bars represent significant differences for each treatment using one-way ANOVA followed by Tukey's multiple comparisons (n = 3, P < 0.05). Figure 9. Effects of RNA interference on three gene mRNA expression (A) and on sensitivity to thiamethoxam of adult Leptinotarsa decemlineata (B).
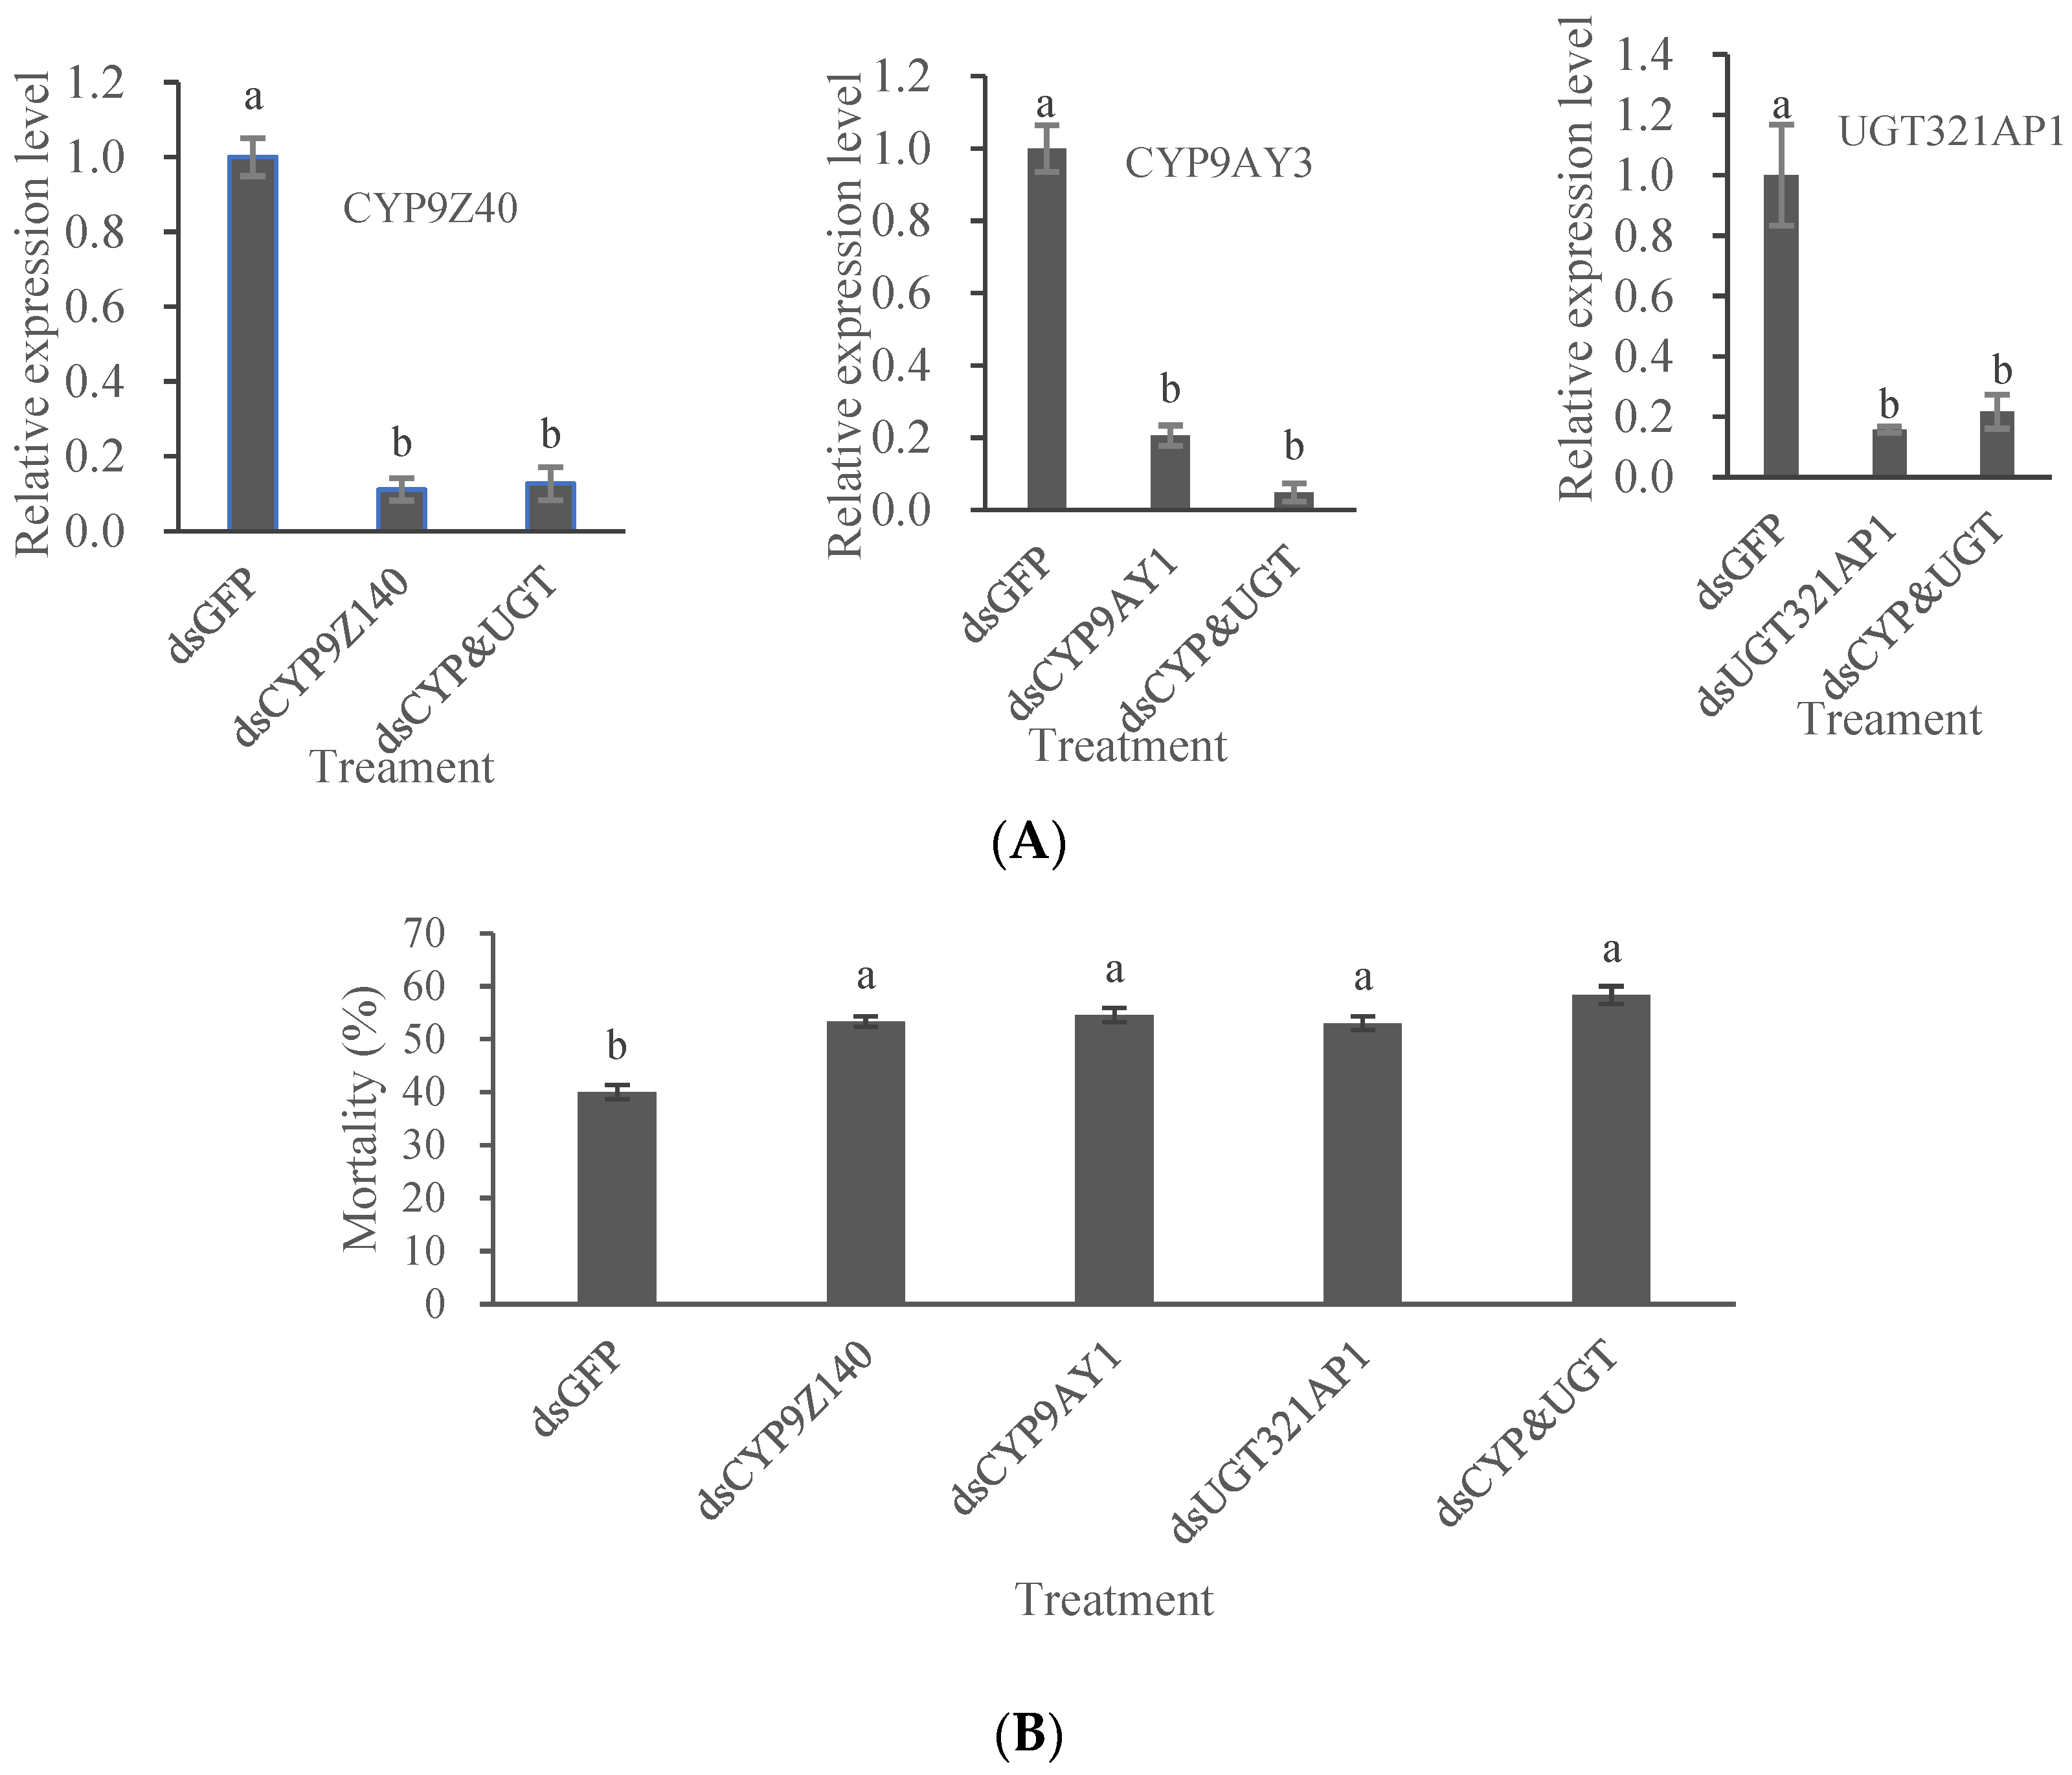

Table 1.
Background information of Leptinotarsa decemlineata populations collected from Xinjiang.
| Sampling date | Population | Sampling location |
| 2021.6 | QPQLZ | Development zone of Zakuqiniulu Town, Qapqal County, Yili Prefecture |
| 2021.6 | ML | Dongcheng Town, Mulei County, Changji Prefecture |
| 2021.6 | JMSL | Louzhuangzi Village, Jimsar County, Changji Prefecture |
| 2021.6 | URMQA | Anningqu Town, new urban area of Urumqi City |
| 2021,7 | URMQY | Yongfeng Town, Urumqi County |
| 2022, 6 | JMST | Taiping Village, Jimsar County, Changji Prefecture |
| 20022,7 | URMQA | Anningqu town, new urban area of Urumqi City |
| 2023.6 | URMQA | Anningqu Town, new urban area of Urumqi City |
| 2023.6 | JMSQ | Quanzijie Town, Jimsar County, Changji Prefecture |
| 2023.6 | ML | Dongcheng Town, Mulei County, Changji Prefecture |
| 2023.7 | QPQLB | Development zone of Ba Town, Qapqal County, Yili Prefecture |
| 2023.7 | JMSD1 | Dayou Town, Jimsar County, Changji Prefecture |
| 2023.8 | JMSD2 | Dayou Town, Jimsar County, Changji Prefecture |
Table 2.
Primers and their application in the study.
| Gene | GenBank accession | Primer sequence (5'–3') | Product size (bp) | Application |
| CYP9Z140 | XP_023030479.1 | F: TAACGAGTTTAGCGTCAG | 1881 | Cloning |
| R: CAATTGTTAATATGGAAGAC | ||||
| CYP9AY1 | XP_023020330.1 | F: TCGGTGGAATACCCATAT | 1916 | |
| R: CAAACCAAATCCAAAACA | ||||
| UGT321AP1 | XM_023173906.1 | F:TCGAAACAGTGTTGGATATT | 1663 | |
| R:AGTTTGACATGGCAACTTAG | ||||
| CYP9Z140 | F: ACATGGCCCGAGGAATTGTA | 157 | qPCR | |
| R: TTTTCAACGGCAAGGACCAC | ||||
| CYP9AY1 | F: CATTCGGCATTGGTCCAAGA | 163 | ||
| R: CCTTCTGGGCGCATATTGAA | ||||
| UGT321AP1 | F: CATCAGGAAATGGCTACCGC R: AGACCCACAGCTATGCCTTT |
189 | ||
| RPL4 | EB761170 | F: AAAGAAACGAGCATTGCCCTTCC | 119 | |
| R: TTGTCGCTGACACTGTAGGGTTGA | ||||
| Ef1α | EB754313 | F: AAGGTTCCTTCAAGTATGCGTGGG | 184 | |
| R: GCACAATCAGCTTGCGATGTACCA | ||||
| CYP9Z140 | F: AGATCAGCAAACAGCCAGTAGTCAC | 394 | RNAi | |
| R: TATTAGCCCACAATGGATCAACATC | ||||
| CYP9AY1 | F: TCGCAAATGATGTTATAGCTTCTTG | 231 | ||
| R: ATGGTACTATGGATGAGGTCGTGAA | ||||
| UGT321AP1 | F: CGTCGCTGGTTAATCTCA R: GGGTGCGTAGGGTTGC |
337 |
Table 3.
Susceptibility to thiamethoxam of different populations of Leptinotarsa decemlineata adult in Xinjiang (2021–2023).
Table 3.
Susceptibility to thiamethoxam of different populations of Leptinotarsa decemlineata adult in Xinjiang (2021–2023).
| Year | Population | Slope±SE | LD50 (µg/beetle) / (95% FL) | Resistance ratio |
| 2021 | URMQY | 2.1167±0.0528 | 0.0311 (0.0238-0.0408) | 1.00 |
| QPQLZ | 1.7757±0.1442 | 0.2592 (0.1797-0.3741) | 8.33 | |
| JMSL | 3.0319±0.2467 | 0.2234 (0.1870-0.2669) | 7.18 | |
| URMQA | 2.0484±0.0546 | 0.0944 (0.0717-0.1243) | 3.04 | |
| ML | 2.5969±0.1200 | 0.0679 (0.0549-0.0842) | 2.18 | |
| 2022 | URMQA | 1.5184±0.0336 | 0.2963 (0.1505-0.5834) | 9.52 |
| JMST | 2.6984±0.1913 | 0.1006 (0.0823-0.1228) | 3.23 | |
| 2023 | ML | 1.0797±0.0213 | 0.2309 (0.1057-0.5044) | 7.42 |
| JMSD1 | 1.9694±0.1116 | 0.2072 (0.1445-0.2970) | 6.66 | |
| URMQA | 1.5521±0.0887 | 0.1440 (0.0838-0.2083) | 4.63 | |
| JMSQ | 3.5502±0.1599 | 0.1310 (0.1068-0.1485) | 4.21 | |
| JMSD2 | 1.9202±0.0577 | 0.0946 (0.0630-0.1422) | 3.04 | |
| QPQLB | 1.3473±0.0956 | 0.0690 (0.0355-0.1319) | 2.22 |
Table 4.
Sequencing results of different populations of Leptinotarsa decemlineataa.
| Samples | Clean reads | Clean bases | GC content (%) | Q30 (%) |
| URMQY21 | 26,114,887 | 7,748,786,787 | 41.23 | 94.17 |
| JMSL | 24,582,542 | 7,263,561,882 | 40.52 | 93.39 |
| QPQLZ | 21,000,522 | 6,225,521,885 | 40.94 | 94.16 |
aClean reads: total number of pair-end reads of clean data; Clean bases: total number of bases; GC content: percentage of G and C bases in the DNA or RNA molecule; Q30%: percentage of bases with a mass value ≥30.
Table 5.
P450 and UTG genes upregulated significantly in different groups of Leptinotarsa decemlineata transcriptome.
Table 5.
P450 and UTG genes upregulated significantly in different groups of Leptinotarsa decemlineata transcriptome.
| Gene function | Gene ID | URMQY21 vs JMSL | URMQY21 vs QPQLZ | ||
| log2FC | FDR value | log2FC | FDR value | ||
| CYP4C1-like | 111503441 | 1.47 | 0.0018 | ||
| CYP12a5 | 111514589 | 1.64 | 0.0167 | ||
| CYP9e2-like | 111508872 | 1.30 | 0.0035 | ||
| CYP9e2-like | 111518298 | 2.28 | 1.44E-17 | ||
| CYP9e2-like | 111508919 | 1.56 | 5.11E-07 | ||
| CYP4V2-like | 111510743 | 1.46 | 0.0453 | ||
| CYP6a13 | 111506689 | 1.33 | 0.0004 | ||
| CYP4c3-like | 111504218 | 1.47 | 0.0132 | ||
| UTG2B4-like | 111517685 | 2.43 | 0.004 | ||
| UTG2B7-like | 111518183 | 2.50 | 0.008 | ||
Disclaimer/Publisher’s Note: The statements, opinions and data contained in all publications are solely those of the individual author(s) and contributor(s) and not of MDPI and/or the editor(s). MDPI and/or the editor(s) disclaim responsibility for any injury to people or property resulting from any ideas, methods, instructions or products referred to in the content. |
© 2024 by the authors. Licensee MDPI, Basel, Switzerland. This article is an open access article distributed under the terms and conditions of the Creative Commons Attribution (CC BY) license (http://creativecommons.org/licenses/by/4.0/).
Copyright: This open access article is published under a Creative Commons CC BY 4.0 license, which permit the free download, distribution, and reuse, provided that the author and preprint are cited in any reuse.


