Submitted:
11 June 2024
Posted:
12 June 2024
You are already at the latest version
Abstract
Aimed to obtain purple garlic varieties, 360 bolting bulbs from the Protected Geographical Indication (PGI) “Las Pedroñeras” were selected for their size, and the presence of abundant external scales. After a further selection, 243 out of the 360 bulbs were discarded due to undesired characteristics, as light purple color, high number of small cloves, cloves affected by Fusarium spp. and mites, among other. It was stablished that each bulb would give rise to a family. Thus, 117 families were planted under a random design during season 2021-2022. Either physiological, morphological and phenological traits were assessed for each family, and the affectations by pest and pathogens were also controlled. After the assessment of this trial, 103 out 117 families remained in the program, and were used for the establishment of a second trial the next season. Unlike the first trial, after the evaluations only 23 families remained in the program. There was observed a high variability for most of traits, with a great influence of families. The phenotypic behavior of families was significative influenced by environment, highlighting the need of their assessment under different environmental conditions. The high variability registered for the target sample, opens the possibility to select new garlic varieties from this PGI.
Keywords:
Allium sativum (L.)
; clonal selection
; genotype-environment interaction
; landrace
; plant breeding
; selection pressure
1. Introduction
Garlic (Allium sativum L.) is a species from Amaryllidaceae family [1,2,3,4,5], cultivated from sub-tropical to boreal regions [6]. Its primary center of origin is located in Central Asia, extending through Middle East regions to reach the Mediterranean basin [5,6,7]. Garlic has been used from early times, from 5000 to 2000 years ago, by Babylonian, Chinese, Egyptian and Indian cultures [8,9] for its medicinal properties, as well as for its folkloric, and culinary uses [9].
Although garlic is considered the second most important species in Allium genus, after onion, only few thousands of varieties has been used throughout history [10]. Nowadays, the total number of cultivars available worldwide is set up around 600 [11]. Either biological, technological, and social factors might contribute to this situation. Frequently, few distinctions are made by famers and producers, being the most distinguishable characteristics bolting-not bolting, red-white, early-late, and local-exotic garlics [10]. This highlights the need to develop new varieties, designed for intensive agriculture, and adapted to the current environmental and legislative conditions, having besides exceptional characteristics, like a higher content of organosulfur compounds among other metabolites.
Garlic has been mostly unamenable to conventional plant improvement techniques, since has almost lost its capacity for sexual reproduction [11]. Whereas only wild types can produce true-seeds in some regions of Kazakhstan and Kyrgyzstan [9,12], propagation of garlic is only possible using asexual propagules, mostly cloves, becoming an important limitation for combining traits by the mating of outstanding parents. Under these conditions, it would be expected a great homogeneity in commercial exploitations, and germplasm collections. Nevertheless, wide variations have been registered and documented, for morphological, phenological, biochemical, and physiological traits, as well as for the tolerance to biotic stresses [13,14,15,16,17,18,19,20]. It is not clear what is the main cause of this phenotypic and genetic heterogeneity; however, has been suggested that the accumulation of changes from natural mutations, the crossing between ancient ancestors [9,10], and the occurring of epigenetic events might provoke this unexpected variability [21,22]. Thus, these naturally occurring variations would offer a great opportunity for the selection of superior genotypes.
The target of this research is the violet or purple (morado) garlics, from the Protected Geographical Indication (PGI) “Las Pedroñeras” (Spain). It is characterized by the color of their cloves’ tunics, giving the name to this indigenous ecotype [23]. Bulbs are, in general, medium size with spherical shape, bearing 8-12 cloves in average, and unlike cloves, their scales are mostly white. This violet garlic has a high content of organosulfur substances, and iodide, giving a spice flavor, and facilitating its conservation. These characteristics become the “Ajo Morado de Las Pedroñeras” a valuable landrace for practicing selection. Although some attempts have been made for the creation of varieties by selection from this PGI [24,25], and other ecotypes [11,16], is still recognized the scarcity of varieties worldwide in the context of a modern agriculture.
Therefore, this research, using this landrace as target, is aimed to determine (1) if there is enough phenotypic variability to practice selection; (2) which are the traits with the greatest variability; (3) if families can be separated by physiological, morphological and phenological characters; and (4) if there is any chance to select clonal varieties.
2. Materials and Methods
2.1. Plant Material, and Statements for the Field Trials
Violet or purple (morado) garlics, from the Protected Geographical Indication (PGI) “Las Pedroñeras” (Spain), were used as starting materials. For virus removing, meristems from outstanding materials were in vitro cultured, following the same protocol described by Bhojwani et al. [26]. The first clonal generation (G0), formed by mixed materials, was planted under an insect-proof net-house in the campaign 2019-2020. The second clonal generation (G1) was cultivated using similar conditions during the season 2020-2021. After the harvest, 360 bolting bulbs were randomly selected according to their weights (>50g), and the presence of abundant external scales (>5). After removing external scales, only bulbs with healthy purple cloves, bearing few small cloves (<25%), and without pest damages were selected; thus, 243 out the 360 bulbs were discarded. It was ruled that a bulb would form a family; therefore, each one would be properly identified, and its individuality would be preserved. The rest of 117 families were planted (5 cloves/family) in an insect-proof net-house using a random design. In parallel, all families were in vitro introduced (2-5 meristems/ family), to speed-up the reproduction of plant materials to be used on further experiments. After the first assessment of families at the end of growing cycle, 103 out 117 were randomly planted during the season 2022-2023. In this case, each family was represented by a variable number of plants, between 35 and 65 each.
2.2. Phenotypic Selection
The first trial (117 families) was established on December 3rd, 2021 in an insect-proof net-house property of SAT Peregrin at 191m AMSL (above mean sea level) [coordinates 37.396960, -1.741961, Pulpí, Almería, Spain]. The initiation (SI, weeks) and the length of sprouting (SP, weeks), and the initiation (DIF, weeks) and the length of flowering (DFF, weeks) were controlled. After 26 weeks of cultivation, the number of active leaves (LN_26), the plant height (PH, mm), the pseudo-stem height (PSH, mm), and the diameter at the base of pseudo-stem (PSD, mm) were measured. After harvest (June 24th, 2022), bulbs were storage under controlled conditions (temperature was adjusted to 19-21°C, and relative humidity to 50-60%). Five months after harvest, the bulb weight (BW, g), the bulb diameter (BD, mm), and the number of cloves (C) were registered. The second trial (103 families) was planted on November 25th, 2022, in a different insect-proof net-house at 781m AMSL [coordinates 38.007285, -1.912556, Caravaca, Murcia, Spain], and was harvested during the 31th week of cultivation (June 28th, 2023). Because of climatic disorders during the 26th week, were not possible the evaluation of DIF, DFF, LN_26, PH, PSH and PSD. Since more volume of bulbs per family was available, the number of small (SC) and large (LC) cloves was counted; the weight of small (SW, g) and all cloves (CW, g) per bulb, and the unitary weight of small (UWSC, g) and large (UWLC, g) cloves were weighted; and the potential yield was estimated (Y, kg ha-1). The values of PSD and BD are the average of 2 perpendicular measures. The sphericity of bulbs (Φ) was calculated as the rate between the lower BD/ the higher BD. As active leaves were considered those leaves with green portions, regardless their wilting degree. The PH was measured from the base of pseudo-stem to the tip of the largest leaf, and the PSH from the base to the latest visible insertion-point of the sheath with the leaf blade (Figure 1). The potential yield (Y) was calculated multiplying the average BW by the planting density (270000 plants ha-1). The percentage of lost caused by the reduced size of cloves (WtP, %) was determined as the ratio between the number of small cloves and the total number of cloves. Other traits were also considered as the premature sprouting of cloves, the percentage of plants affected by the formation of external cloves and/or bulbs (P), the burst of lateral shoots, the sprouting of multiple plants per planted clove, and the damages caused by pathogens (mainly Fusarium spp.), and pests (mainly eriophyid mites).
2.3. Statistical Analysis
Statistical data processing was performed using R language [27], and its integrated development environment (IDE) RStudio. For analysis of variance (ANOVA), the function ‘aov ()’ was used. The assessment of ANOVA assumptions was performed using the function ‘gvlma ()’ [28]. For those dependent variables that do not fits to the ANOVA assumptions, a Kruskall-Wallis test was used {kruskal.test ()}. The effect size for parametric and non-parametric analysis, were determined using ω2 (square omega) and ε2 (square epsilon) [29], respectively. For the interpretation of effect sizes, the rules of Sawilowsky [30] were followed. The post hoc tests, and figures were made with ‘posthoc ()’ and ‘barplot ()’ functions, respectively. The Pearson’s correlation among variables were performed using ‘apa.cor.table ()’, and graphs generated with ‘pair.panels ()’ function from package {psych}. To determine the contribution of traits to whole variance, a principal component analysis (PCA) was conducted using the function ‘PCA ()’ {FactoMiner} [31]. The graphical joint representation of components and variables was made with function ‘fviz_pca_biplot ()’. Euclidean distance matrix among families were calculated {get_dist ()} for the construction of dendrograms. To determine the optimal number of clusters, the ‘NbClust ()’ function was used by ‘kmeans’ method. The assignation of each family to the suggested clusters was made with ‘kmeans ()’ function, performing 30 starts. Dendrograms were generated with ‘fviz_dend ()’.
3. Results
3.1. The First Trial. Season 2021-2022
During cultivation, some undesired physiological disorders were observed. Therefore, 14 out the 117 families were discarded, 11 affected by the early sprouting of cloves, 2 with the sprouting of multiple plants per planted clove, and 1 with the presence of plants with a burst of multiple lateral shoots.
Regarding quantitative characters, a great variability was registered for all the assessed traits (Table 1), with medium effect sizes of families on most of them, except for the leaf number (LN_26), and the sphericity of bulbs (Φ).
The correlation analysis showed significative relationships among some traits (Figure 2). As was expected, the bulb weight (BW) and diameter (BD) are mutually dependent (r=0.99***). Similarly, BW and BD are highly correlated with the pseudo-stem diameter (PSD), the number of active leaves (LN_26), and the plant height (PH). For PSD and LN_26 was also calculated a positive direct relationship (r=0.71***) between them. Interestingly, only a medium positive association was calculated between the number of cloves, and BW (r=0.56***) and BD (r=0.56***). Whereas, medium and negative correlations were registered for the initiation of flowering (DIF), and PSH (r=-0.49***) and PH (r=-0.30**). On the other side, there was not found any relationship (r=0.09n.s.) between the initiation (SI) and the length of sprouting (SP).
According to the principal component analysis (PCA) for 12 traits, the components 1 and 2 explained 54,7% of whole variance. For PC1, the traits with the higher contributions were BD, BW, PSD, PH, LN_26, and C; whereas for PC2, PSH, and the phenological characters SI, SP, DIF, and DFF were the most important (Figure 3). The biplot representation of families on PC1 and PC2, suggests the formation of 3 main groups. On the right of PC1 are clustered those families with the higher values associated with productivity (BW, BD, and C), whereas, on the left are the less productive families, and in the center are the average ones.
Among the 30-index used by function ‘NbClust’, most of them (9) recommended 2 as the optimal number of clusters; although 8-index also suggested 3 clusters as the best option. Nevertheless, the majority rule was followed, therefore dendrogram was constructed using only 2 clusters. Thus, in cluster I (blue, on the right) were gathered 44 families, and the resting 67 in cluster II (red, on the left) (Figure 4). Whereas in the cluster I were mostly ubicated those families with the highest productive potential (BW >50g, and BD >48mm), in the second were gathered those with the lowest values for BW and BD.
3.2. The Second Trial. Season 2022-2023
Unlike the first trial, in this occasion 80 out of the 103 families (77.7%) were discarded: 41 (51.25%) by low yield, 34 (42.5%) affected by physiological disorders, and 5 (6.25%) with different affectations caused by Fusarium spp., and/or mite attacks.
During this season there was a high incidence of the abnormal sprouting of cloves. Therefore, for the positive selection a threshold of 20% of plants affected by this physiological disorder per family was established. Thus, 25 families were eliminated from the selection program during the cultivation period. After the assessment of bulbs, other 9, affected by the formation of external bulbs/cloves, were also discarded.
The calculation of the potential yield showed great differences among families, ranging from 8874 to 19800kg ha-1, with an average of 13353.9kg ha-1 for the 69 assessed families. Since the lower yield to practice selection was fitted on 14000kg ha-1, 41 families were removed from the selection program.
Like the first trial, significative differences were registered for all traits (Figure 5 and Table 2), although the effect sizes of families were reduced. Nevertheless, still remained a relative high variability for the bulb diameter, the total number of cloves, and the number of small cloves as well. Noteworthy, was the greater variation (F value, 8.018 vs 3.225), and effect size (ω2, 0.31 vs 0.12) registered for the number of small cloves regarding the largest ones.
Although there was a reduction on the calculated value of ‘r’ regarding the first trial between BD and BW, it is still considered high (r=0.78***). Whereas, the correlations among the number of cloves (C), and bulb diameters and weights were quite similar to the previous trial: 0.53** and 0.55**, respectively (Figure 6). As was expected, the total number of cloves positively correlated with the number of small cloves (r=0.88***), and the large ones (r=0.74***). The unitary weight of large cloves (UWLC) is close related with BW (r=0.84***), and BD (r=0.64***). High correlation was also calculated for the yield with the bulb diameter and weight, the number of cloves, and the unitary weight of large cloves. Positive high correlations were registered for the percentage of lost (WtP), and the number (r=0.83***) and weight (r=0.93***) of small cloves; however, there was not determined any association between WtP, and yield (r=0.06n.s.). Whereas, the sphericity had a negative correlation (r=-0.51**) with the sprouting of lateral shoots and/or the formation of external cloves and/or bulbs (P).
Regardless a reduction of whole variability, it was still possible to separate the families by clusters (Figure 7). Again, most of indexes (13 out 30) used by the function ‘NbClust’ suggested the formation of 2 groups. Thus, families 54, 75, 233 and 344 were grouped in an isolated cluster (right blue cluster). These families are in general those with the highest yield (averaging 18418.5kg ha-1), as well as the longest sprouting period (2-3 weeks).
For the 23 families that remain in the program, a classification of the different commercial categories according to BD was performed (Table 3). Since is expected that the higher the yield, the higher the percentage of bulbs on the superior categories (A-C), and vice versa; four groups were created on the base of their potential yield, avoiding biased comparations among families with quite different yields. Whereas for group I most of bulbs are gathered on C category, the other three produced mostly bulbs from B one. However, striking differences inside the same group were observed. For example, unlike most of families inside of group I, family 283 produce more bulbs of D category (53.3%) than C (26.7%); whereas families 100, and 256 had a greater equilibrium on the distribution of categories B to D. For groups II and IV, is outstanding the behavior of families 233 and 75, producing the highest percentages of the greatest bulbs (A category), 46.7% and 33.3%, respectively.
3.3. Interaction Genotype-Environment (G×E)
Since clustering based on phenotype already suggested the existence of genotypic differences, the influence of location (Pulpí-Almudema) on the behavior of families, and the interaction family-location (F×L) were also analyzed. Either the family (except for the sphericity of bulb), the location, and the interaction F×L had significative differences on the assessed variables; however, had variable effects (Table 4). The location had the greatest influence on the bulb diameter, followed by the bulb weight, the number of cloves, and its sphericity. Although the effect sizes for the interaction F×L were considered small, or very small (for sphericity of bulbs), it was significative.
4. Discussion
The first step on every selection program is to determine if phenotypic variations for the interest traits exist on the target population. This is especially critical for vegetatively propagated species, as garlic, since the only sources of variation come from the natural mutations, the accumulation of pre-existing sexual variations, and the epigenetic changes [22,32]. As garlic is asexually propagated, it would be expected a high phenotypical homogeneity in their populations; however, for both trials, significative differences were observed for all the assessed variables. Those traits close related with yield (bulb weight and diameter, and the number of cloves) were among the most influenced by families, as well as some other traits as plant height, pseudo-stem diameter and height, and the number of active leaves. Phenological characters, as the initiation and the period of sprouting, and the initiation of flowering had an important contribution to the registered variation. Similarly, various authors have previously detected great phenotypic and genotypic variations in natural and commercial populations, as well as in germplasm collections [11,33,34,35,36,37]. Like the present research, statistic differences have been registered among different accessions for bulb diameter and weight [17,35,36,37,38,39,40,41]; bulb color [35,39]; clove number [35,38,39,40]; plant height [39,40]; pseudo-stem height and diameter [40]; number of green leaves [39,40]; plants forming multiple shoots [15]; number of external sheaths [35,39], among other traits. Additionally, for most of these have been calculated from moderate to great heritabilities [33,36], allowing thus to consider the possibility to select stable clones. Therefore, the results here presented set the bases for the obtaining of new violet varieties from the PGI “Morado de las Pedroñeras”, as has been previously stated for various local and national selection programs [11,15,16,20,34,39].
The establishment of mathematical relationships among characters might contribute to speed up the selection of high productive genotypes. Hence, positive high correlations have been found among yield components and the plant heigh, the pseudo-stem diameter and heigh, and the number active leaves, which is in agreement with previous reports [33,36].
Likely, the number of cloves is the most controversial trait on garlic improvement programs, since frequently the higher the number of cloves, the higher the weight of bulbs [35,42]. However, at the same time, the higher the number of cloves per bulbs, the higher the number of small cloves, which is an undesirable trait. For the assessed families, positive high correlation was calculated for the percentage of lost caused by the number and weight of small cloves. The obtaining of varieties with large and uniform cloves is a critical objective for garlic improvement programs, with great economical repercussion both on “seed” (cloves) production protocols, and productivity. In an apparent contradiction, the yield was not influenced by the percentage of lost, likely because the selection was focused on those bulbs/families with a reduced number of small cloves. This suggests the need to select varieties with a low number of small cloves, to reduce the economical loses, especially during production of “seeds”, and peeled cloves. Nevertheless, the viability to select on the base of the low number of small cloves must be confirmed during the next years, since this trait seems to be highly influenced by environment [42], agricultural managements [43], and biological factors [44]. This was partially confirmed by the results of ANOVAs, once significative differences were registered for the families, the locations, and the interaction between them on the total number of cloves per bulbs.
Undoubtedly, the obtaining of high yields is the final goal of every improvement program. For this trait, great variations among families were registered, ranging from 8874 to 19800kg ha-1. The establishment of a threshold of 14000kg ha-1, allowed the positive selection of 23 out 69 families, averaging a potential yield of 15857.2kg ha-1. This represent outstanding results, since the historical yields of this PGI are setup between 9000 to 10000kg ha-1, would reaching as much as 13000kg ha-1 under optimal exploitation conditions [23,45].
For species as garlic, the yield by itself do not express its real productivity, being important to differentiate between agronomic and marketable yield; since frequently the last one determines the success of commercial exploitations [46]. Certainly, the occurring of multiple external bulb/cloves do not have negative affectations on the weight of bulbs, at the contrary, this kind of bulbs has usually showed the greatest sizes; but this is an undesirable characteristic that reduce their commercial value. The early sprouting of cloves is also a great affectation that reduce the usage of bulbs; in fact, famers from Syria do not appreciate new genotypes prone to the formation of multiple shoots [15]. Although sphericity has a reduced influence on agronomic yield, it has been included in some selection programs [47,48], once it facilitates the management of bulbs after harvest, the manipulation during packaging, and the increase the acceptance both producers and consumers.
After the classification of bulbs by size categories, was also observed that there were variations among families with similar yields, becoming an aspect to be considered for those selection programs aimed to obtain the greatest proportions of big bulbs.
The phenotypic characterization has allowed the clustering of families suggesting the existence of genetic differences, which has to be further confirmed by mean of properly DNA-based tests. This is in agreement with previous reports, which have demonstrated the effects of genetic factors on phenotype, allowing the selection of new garlic varieties [11,16,34]. However, in some cases the genetic similarity among accessions does not correlate with the phenotypic variations registered [49], suggesting the occurring of other variations sources than genotypic.
For the first trial, was calculated variable effect sizes of families on the evaluated traits. However, because of practicing of selection, their effects were drastically reduced for the second trial, but were still enough to separate phenotypically the resting 23 families at the end of the assessment of the second trial (Figure 7). Similarly, in an experiment conducted during 13 years, has been observed a reduction in polymorphism as a consequence of the increasing of the selection pressure; although the remaining variability was sufficient for the morphological classification of genotypes [32].
A critical step for the selection programs is to determine the response of families to different environmental conditions. In USA, has been observed that bulb diameter and weight were influenced by the location, likely because of variations in mineral composition of soil [17]. For Belltall landrace was also registered variations in bulb size, and clove heterogeneity depending on the cultivation place, being determined its identity by environmental factors [42]. The assessing of 14 garlic genotypes in six locations during 2 years, under conditions of Ethiopia, revealed significative G×E interactions for yield, and other traits, mostly caused by different weather conditions [50]. Similarly, for the current research, either size and weight of bulbs, and the number of cloves were the most influenced by family, location, and the interaction between them (F×L). This highlights the importance to assess the families for those conditions where they will be exploited, to perform solid recommendations to producers.
In this first approaching to the selection of high-productive garlic varieties from this purple PGI “Morado de las Pedroñeras”, has been registered a high variability on the target population for most of the assessed traits. These are mostly associated to either productive, physiological, and phenological traits, assuring a reasonably well characterization of each family. Thus, it was possible the clustering of families according their phenotypes. Since the G×E interactions were statistically significative for the weight, the diameter, the sphericity, and the number of cloves of bulbs, it is mandatory the evaluation of candidates to varieties under different environments, and management conditions. The next step must be focused on the assessing of new variation sources, and the genetic and/or epigenetic characterization of phenotypes. These results could be used as a reference for the clonal selection from different ecotypes.
Author Contributions
Conceptualization, R.J.L.M.; Data curation, R.J.L.M., A.R.H. and J.A.M.M; Formal analysis, R.J.L.M.; Investigation, R.J.L.M., A.R.H. and J.A.M.M; Methodology, R.J.L.M.; Resources, R.J.L.M., A.R.H. and J.A.M.M; Project administration, R.J.L.M.; Supervision, R.J.L.M.; Validation, R.J.L.M.; Visualization, R.J.L.M.; Writing—original draft preparation, R.J.L.M.; Writing—review and editing, R.J.L.M., and A.R.H. All authors have read and agreed to the published version of the manuscript.
Data Availability Statement
All data are available within this publication.
Acknowledgments
We would like to express our gratitude to Jorge González Aguilera Ph D (Universidade Estadual de Mato Grosso do Sul, Brazil), and Jordi Voltas Ph D (Universitat de Lleida, Spain) for reviewing the draft, and for their comments and criticisms.
Conflicts of Interest
The authors declare no conflicts of interest.
References
- APG. An update of the Angiosperm Phylogeny Group classification for the orders and families of flowering plants: APG III. Bot J Linn Soc 2009, 161, 105–121. [Google Scholar] [CrossRef]
- Chase, M. W.; Reveal, J. L.; Fay, M. F. A. Subfamilial classification for the expanded asparagalean families Amaryllidaceae, Asparagaceae and Xanthorrhoeaceae. Bot J Linn Soc 2009, 161, 132–136. [Google Scholar] [CrossRef]
- Haston, E.; Richardson, J. E.; Stevens, P. F.; Chase, M. W.; Harris, D. J. The Linear Angiosperm Phylogeny Group (LAPG) III: a linear sequence of the families in APG III. Bot J Linn Soc 2009, 161, 128–131. [Google Scholar] [CrossRef]
- Li, Q. Q.; Zhou, S. D.; He, X. J.; Yu, Y.; Zhang, Y. C.; Wei, X. Q. Phylogeny and biogeography of Allium (Amaryllidaceae: Allieae) based on nuclear ribosomal internal transcribed spacer and chloroplast rps16 sequences, focusing on the inclusion of species endemic to China. Ann Bot 2010, 106, 709–733. [Google Scholar] [CrossRef]
- Choi, H. J.; Giussani, L. M.; Jang, C. G.; Oh, B. U.; Cota-Sánchez, J. H. Systematics of disjunct northeastern Asian and northern north American Allium (Amaryllidaceae). Botany 2012, 90, 491–508. [Google Scholar] [CrossRef]
- Fritsch, R. M.; Friesen, N. Evolution, domestication and taxonomy. In Allium crop science: recent advances. Rabinowitch, H.D.; Currah, L. Eds. Wallingford UK: CABI publishing, 2002; pp. 5–30. [Google Scholar]
- Kamenetsky, R.; Khassanov, F.; Rabinowitch, H. D.; Auger, J.; Kik, C. Garlic biodiversity and genetic resources. Med Aromat Plant Sci Biotechnol 2007, 1, 1–5. [Google Scholar]
- Simon, P. W.; Jenderek, M. M. Flowering, seed production, and the genesis of garlic breeding. In Plant breeding reviews, 23. Janik J. Ed. John Wiley & Sons, Inc., 2003, pp. 211-244.
- Dhall, R. K.; Cavagnaro, P. F.; Singh, H.; Mandal, S. History, evolution and domestication of garlic: a review. Plant Syst Evol 2023, 309, 33. [Google Scholar] [CrossRef]
- Simon, P.W. The origins and distribution of garlic: how many garlics are there? https://www.ars.usda.gov/midwest-area/madison-wi/vegetable-crops-research/docs/simon-garlic-origins/ (Last updated March 3, 2020).
- Shemesh-Mayer, E.; Kamenetsky-Goldstein, R. Traditional and Novel Approaches in Garlic (Allium sativum L.) Breeding. In Advances in Plant Breeding Strategies: Vegetable Crops. Bulb, Roots and Tubers. Al-Khairy, J. M.; Mohan Jain, S.; Jhonson, D. V. Eds. Springer Nature Switzerland AG, Cham, Switzerland, 2021; Volume 8, pp. 3–49.
- Etoh, T. Fertility of the garlic clones collected in Soviet Central Asia. Hort J 1986, 55, 312–319. [Google Scholar]
- Lallemand, J.; Messian, C. M.; Briand, F.; Etoh, T. Delimitation of varietal groups in garlic (Allium sativum L. ) by morphological, physiological and biochemical. characters. In I International Symposium on Edible Alliaceae, Mendoza, Argentina, Burba, J. L.; Galmarini, C. R. Eds., Acta Hortic 1997, 433, pp. 123–132. [Google Scholar]
- Chovelon, V.; Souche, S.; Delecolle, B.; Etoh, T.; Messiaen, C. M.; Lot, H. Resistance to onion yellow dwarf virus and leek yellow stripe virus found in a fertile garlic clone. In Proceeding of the II International Symposium on Edible Alliaceae, Adelaide, Australia, Armstrong, J. Ed., Acta Hortic 2001, 555, pp. 243-246.
- Al-Safadi, B.; Arabi, M. I. E.; Ayyoubi, Z. Differences in quantitative and qualitative characteristics of local and introduced cultivars and mutated lines of garlic. Journal of Vegetable Crop Production 2003, 9, 21–31. [Google Scholar] [CrossRef]
- Burba, J. L.; Portela, J. A.; Lanzavechia, S. Argentine garlic I: a wide offer of clonal cultivars. In Proceeding of the IV International Symposium on Edible Alliaceae, Beijing, China, Guangshu, L. Ed., Acta Hortic 2005, 688, pp. 291–296. [Google Scholar] [CrossRef]
- Volk, G. M.; Stern, D. Phenotypic characteristics of ten garlic cultivars grown at different North American locations. HortScience 2009, 44, 1238–1247. [Google Scholar] [CrossRef]
- García-Lampasona, S. , Asprelli, P., Burba, J. L. Genetic analysis of a garlic (Allium sativum L.) germplasm collection from Argentina. Sci Hortic 2012, 138, 183–189. [Google Scholar] [CrossRef]
- Wang, H.; Wu, Y.; Liu, X.; Du, Z.; Qiu, Y.; Song, J.; Zhang, X.; Li, X. Resistance and clonal selection among Allium sativum L. germplasm resources to Delia antiqua M. and its correlation with allicin content. Pest Manag Sci 2019, 75, 2830–2839. [Google Scholar] [CrossRef]
- Barboza, K.; Salinas, M. C.; Acuña, C. V.; Bannoud, F.; Beretta, V.; Garcia-Lampasona, S.; Burba, J. L.; Galmarini, C. R.; Cavagnaro, P. F. Assessment of genetic diversity and population structure in a garlic (Allium sativum L.) germplasm collection varying in bulb content of pyruvate, phenolics, and solids. Sci Hortic 2020, 261, 108900. [Google Scholar] [CrossRef]
- Ferreira de Carvalho, J.; de Jager, V.; van Gurp, T.P.; Wagemaker, N. C. A. M.; Verhoeven, K. J. F. Recent and dynamic transposable elements contribute to genomic divergence under asexuality. BMC Genomics 2016, 17, 884. [Google Scholar] [CrossRef] [PubMed]
- Sun, X.; Zhu, S.; Li, N. , Cheng, Y.; Zhao, J.; Qiao, X;... Liu, T. A chromosome-level genome assembly of garlic (Allium sativum) provides insights into genome evolution and allicin biosynthesis. Mol Plant 2020, 13, 1328–1339. [Google Scholar] [CrossRef]
- Ajo Morado de Las Pedroñeras. Description. EC No: ES/PGI/005/0228/12.03.2002. GI 1204. The International Appellations of Origin. World Intellectual Property Organization (WIPO), Geneva, Switzerland, 2023, pp. 1-18.
- Peña-Iglesias, A. El ajo: virosis, fisiopatías y selección clonal y sanitaria. II: Científico-experimental. Boletín de Sanidad Vegetal. Plagas 1988, 14, 493–553. [Google Scholar]
- RAEA. Ensayo de variedades comerciales de ajo. Campaña 2005-2006. Instituto de Investigación de Formación Agraria y Pesquera. Consejería de Innovación, Ciencia y Empresa. Consejería de Agricultura y Pesca. Junta de Andalucía, 2006, pp. 1-92.
- Bhojwani, S. S.; Cohen, D.; Fry, P. R. Production of virus-free garlic and field performance of micropropagated plants. Sci Hortic 1982, 18(1), 39–43. [Google Scholar] [CrossRef]
- R Core Team. R. A language and environment for statistical computing. In R Foundation for Statistical Computing; R Foundation: Vienna, Austria, 2013. [Google Scholar]
- Peña, E. A.; Slate, E. H. Global validation of linear model assumptions. J Am Stat Assoc 2006, 101, 341–354. [Google Scholar] [CrossRef]
- Tomczak, M.; Tomczak, E. The need to report effect size estimates revisited. An overview of some recommended measures of effect size. Trends Sport Sci 2014, 1, 19–25. [Google Scholar]
- Sawilowsky, S. S. New effect size rules of thumb. Journal of modern applied statistical methods 2009, 8(2), 26. [Google Scholar] [CrossRef]
- Lê, S.; Josse, J.; Husson, F. FactoMineR: A Package for Multivariate Analysis. J Stat Softw 2008, 25, 1–18. [Google Scholar] [CrossRef]
- Gimenez, M. D.; García Lampasona, S. Before-after analysis of genetic and epigenetic markers in garlic: A 13-year experiment. Sci Hortic 2018, 240, 23–28. [Google Scholar] [CrossRef]
- Figliuolo, G.; Candido, V.; Logozzo, G.; Miccolis, V.; Spagnoletti Zeuli, P. L. Genetic evaluation of cultivated garlic germplasm (Allium sativum L. and A. ampeloprasum L.). Euphytica 2001, 121, 325–334. [Google Scholar] [CrossRef]
- García-Lampasona, S.; Asprelli, P.; Burba, J. L. Genetic analysis of a garlic (Allium sativum L.) germplasm collection from Argentina. Sci Hortic 2012, 138, 183–189. [Google Scholar] [CrossRef]
- Ragas, R. E. G.; Padron, F. K. J. R.; Ruedas, M. Y. A. D. Analysis of the morpho-anatomical traits of four major garlic (Allium sativum L.) cultivars in the Philippines. Appl Ecol Environ Res 2019, 17. [Google Scholar] [CrossRef]
- Benke, A. P.; Khar, A.; Mahajan, V.; Gupta, A.; Singh, M. Study on dispersion of genetic variation among Indian garlic ecotypes using agro morphological traits. Indian J Gen Plant Breed 2020, 80, 94–102. [Google Scholar] [CrossRef]
- Khar, A.; Hirata, S.; Abdelrahman, M.; Shigyo, M.; Singh, H. Breeding and genomic approaches for climate-resilient garlic. In Genomic Designing of Climate-Smart Vegetable Crops; Chittaranjan, K., Ed.; Springer Nature: Switzerland, 2020; pp. 359–383. [Google Scholar]
- Baghalian, K.; Ziai, S. A.; Naghavi, M. R.; Badi, H. N.; Khalighi, A. Evaluation of allicin content and botanical traits in Iranian garlic (Allium sativum L.) ecotypes. Sci Hortic 2005, 103, 155–166. [Google Scholar] [CrossRef]
- Panthee, D. R.; Kc, R. B. , Regmi, H. N.; Subedi, P. P.; Bhattarai, S.; Dhakal, J. Diversity analysis of garlic (Allium sativum L.) germplasms available in Nepal based on morphological characters. Genet Resour Crop Evol 2006, 53, 205–212. [Google Scholar] [CrossRef]
- Jabbes, N.; Arnault, I.; Auger, J.; Dridi, B. A. M.; Hannachi, C. Agro-morphological markers and organo-sulphur compounds to assess diversity in Tunisian garlic landraces. Sci Hortic 2012, 148, 47–54. [Google Scholar] [CrossRef]
- Tchorzewska, D.; Bocianowski, J.; Najda, A.; Dąbrowska, A.; Winiarczyk, K. Effect of environment fluctuations on biomass and allicin level in Allium sativum (cv. Harnas, Arkus) and Allium ampeloprasum var. ampeloprasum (GHG-L). J Appl Bot Food Qual 2017, 90. [Google Scholar]
- Casals, J.; Rivera, A.; Campo, S.; Aymerich, E.; Isern, H.; Fenero, D.; Garriga, A.; Palou, A.; Monfort, A.; Howad, W.; Rodríguez, M. A.; Riu, M.; Roig-Villanova, I. Phenotypic diversity and distinctiveness of the Belltall garlic landrace. Front Plant Sci, 2003; 13, 1004069. [Google Scholar] [CrossRef]
- Nasir, S.; Regasa, T.; Yirgu, M. Influence of clove weight and planting depth on yield and yield components of garlic (Allium sativum L.). American-Eurasian J Agric Environ Sci 2017, 17, 315–319. [Google Scholar]
- IPGRI, ECP/GR, AVRDC. Descriptors for Allium (Allium spp.). International Plant Genetic Resources Institute, Rome, Italy; European Cooperative Programme for Crop Genetic Resources Networks (ECP/GR), Asian Vegetable Research and Development Center, Taiwan, 2001, pp. 1-42.
- Quintero, J. J. El cultivo del ajo. Hojas Divulgadoras, Ministerio de Agricultura, Pesca y Alimentación, España, 1984, 1/84, pp. 1-16.
- Hoopes, R. W.; Plaisted, R. L. Potato. In Principles of Cultivar Development: Crop Species. Fehr, W. R. Ed. Macmillan Publishing Company, New York, USA, 1987; Volume 2, pp. 385-436.
- Tascón Rodríguez, C.; Morales, D. A.; Ríos Mesa, D. J. Caracterización morfológica preliminar de un grupo de ajos de la Isla de Tenerife. In XXXVI Seminario de Técnicos y Especialistas en Horticultura: Ibiza, 2006. Centro de Publicaciones Agrarias, Pesqueras y Alimentarias, España, 2007, pp. 53-58.
- Chen, S.; Chen, W.; Shen, X.; Yang, Y.; Qi, F.; Liu, Y.; Meng, H. Analysis of the genetic diversity of garlic (Allium sativum L.) by simple sequence repeat and inter simple sequence repeat analysis and agro-morphological traits. Biochem Syst Ecol 2014, 55, 260–267. [Google Scholar] [CrossRef]
- Papaioannou, C.; Fassou, G.; Petropoulos, S. A.; Lamari, F. N.; Bebeli, P. J.; Papasotiropoulos, V. Evaluation of the genetic diversity of Greek garlic (Allium sativum L.) accessions using DNA markers and association with phenotypic and chemical variation. Agriculture 2023, 13, 1408. [Google Scholar] [CrossRef]
- Mengistu, F.G.; Mossie, G.A.; Fita, G.T. Evaluation of garlic genotypes for yield performance and stability using GGE biplot analysis and genotype by environment interaction. Plant Genet Resour 2023, 21, 490–496. [Google Scholar] [CrossRef]
Figure 1.
Representation of a garlic plant, and morphological descriptions of some of its traits.
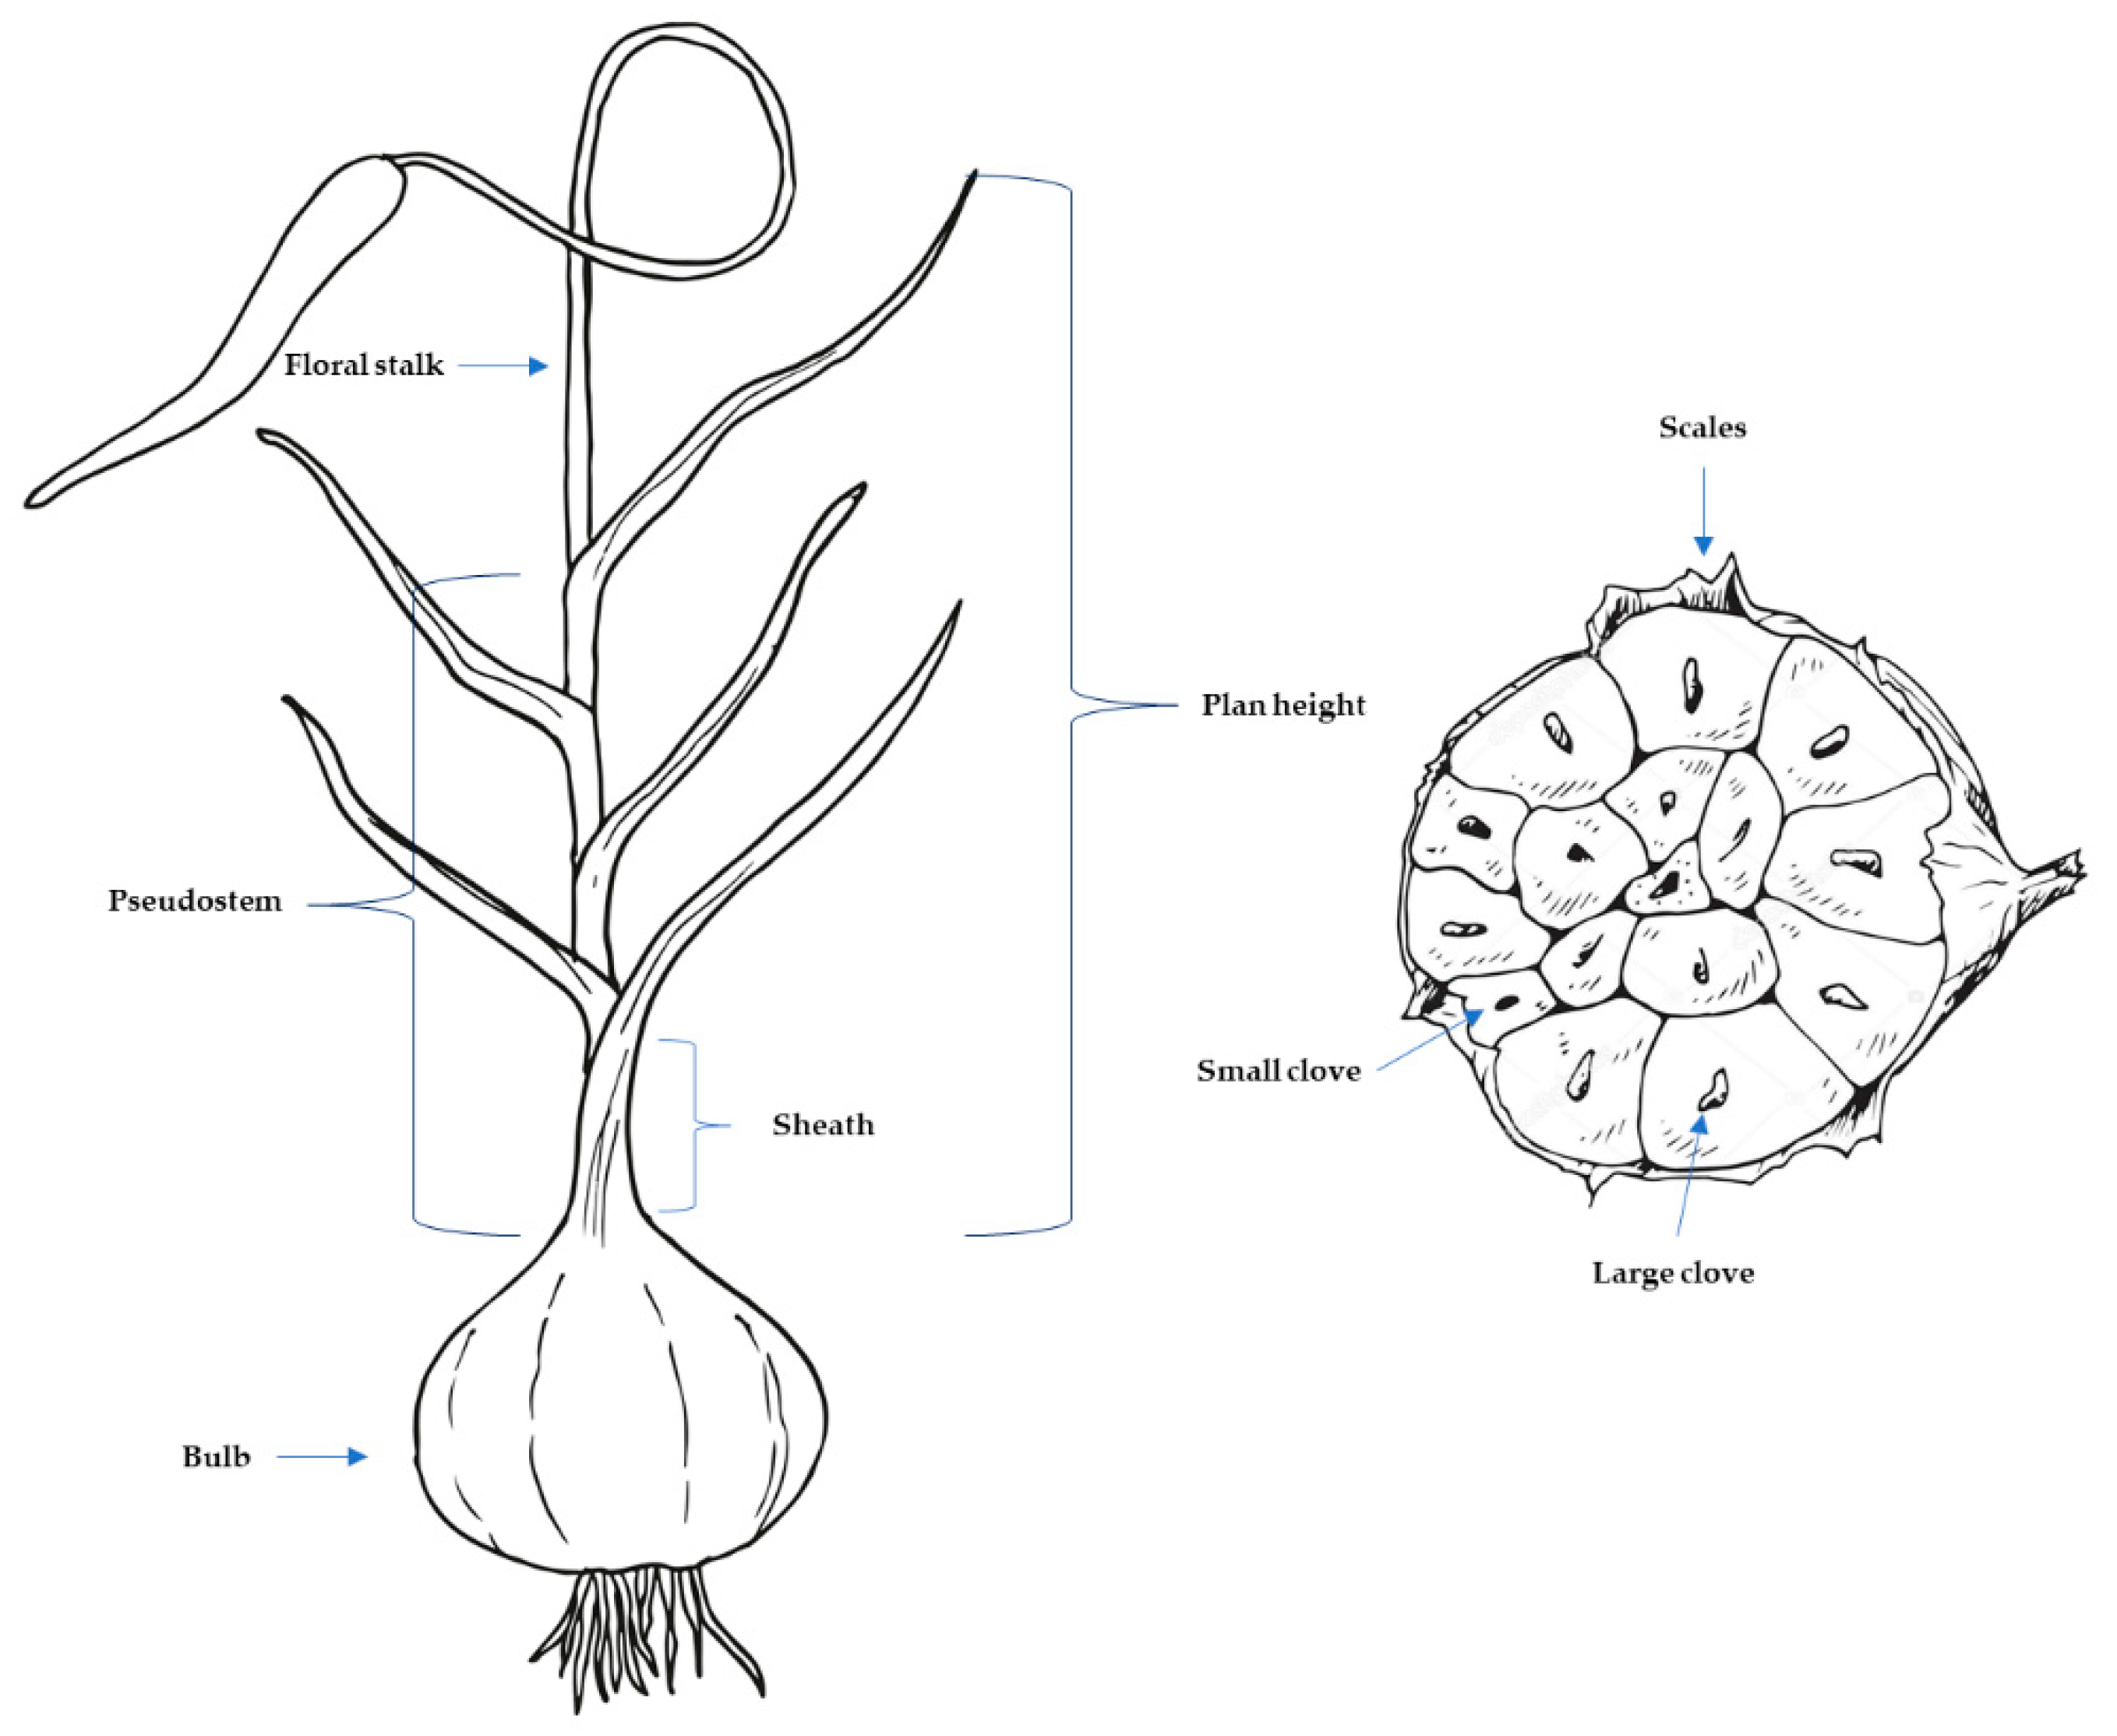
Figure 2.
Pearson’s correlation among phenotypic characters, showing the histograms of correlation, and the scatterplots for the assessed traits. First trial (season 2021-2022). * Indicate signification for p < .05. ** Indicate signification for p < .01. *** Indicate signification for p < .001. Legend: PSH, pseudo-stem height; PSD, pseudo-stem diameter; LN-26, number of active leaves; PH, plant height; BD, bulb diameter; Φ, sphericity of bulb; BW, bulb weight; C, number of cloves.
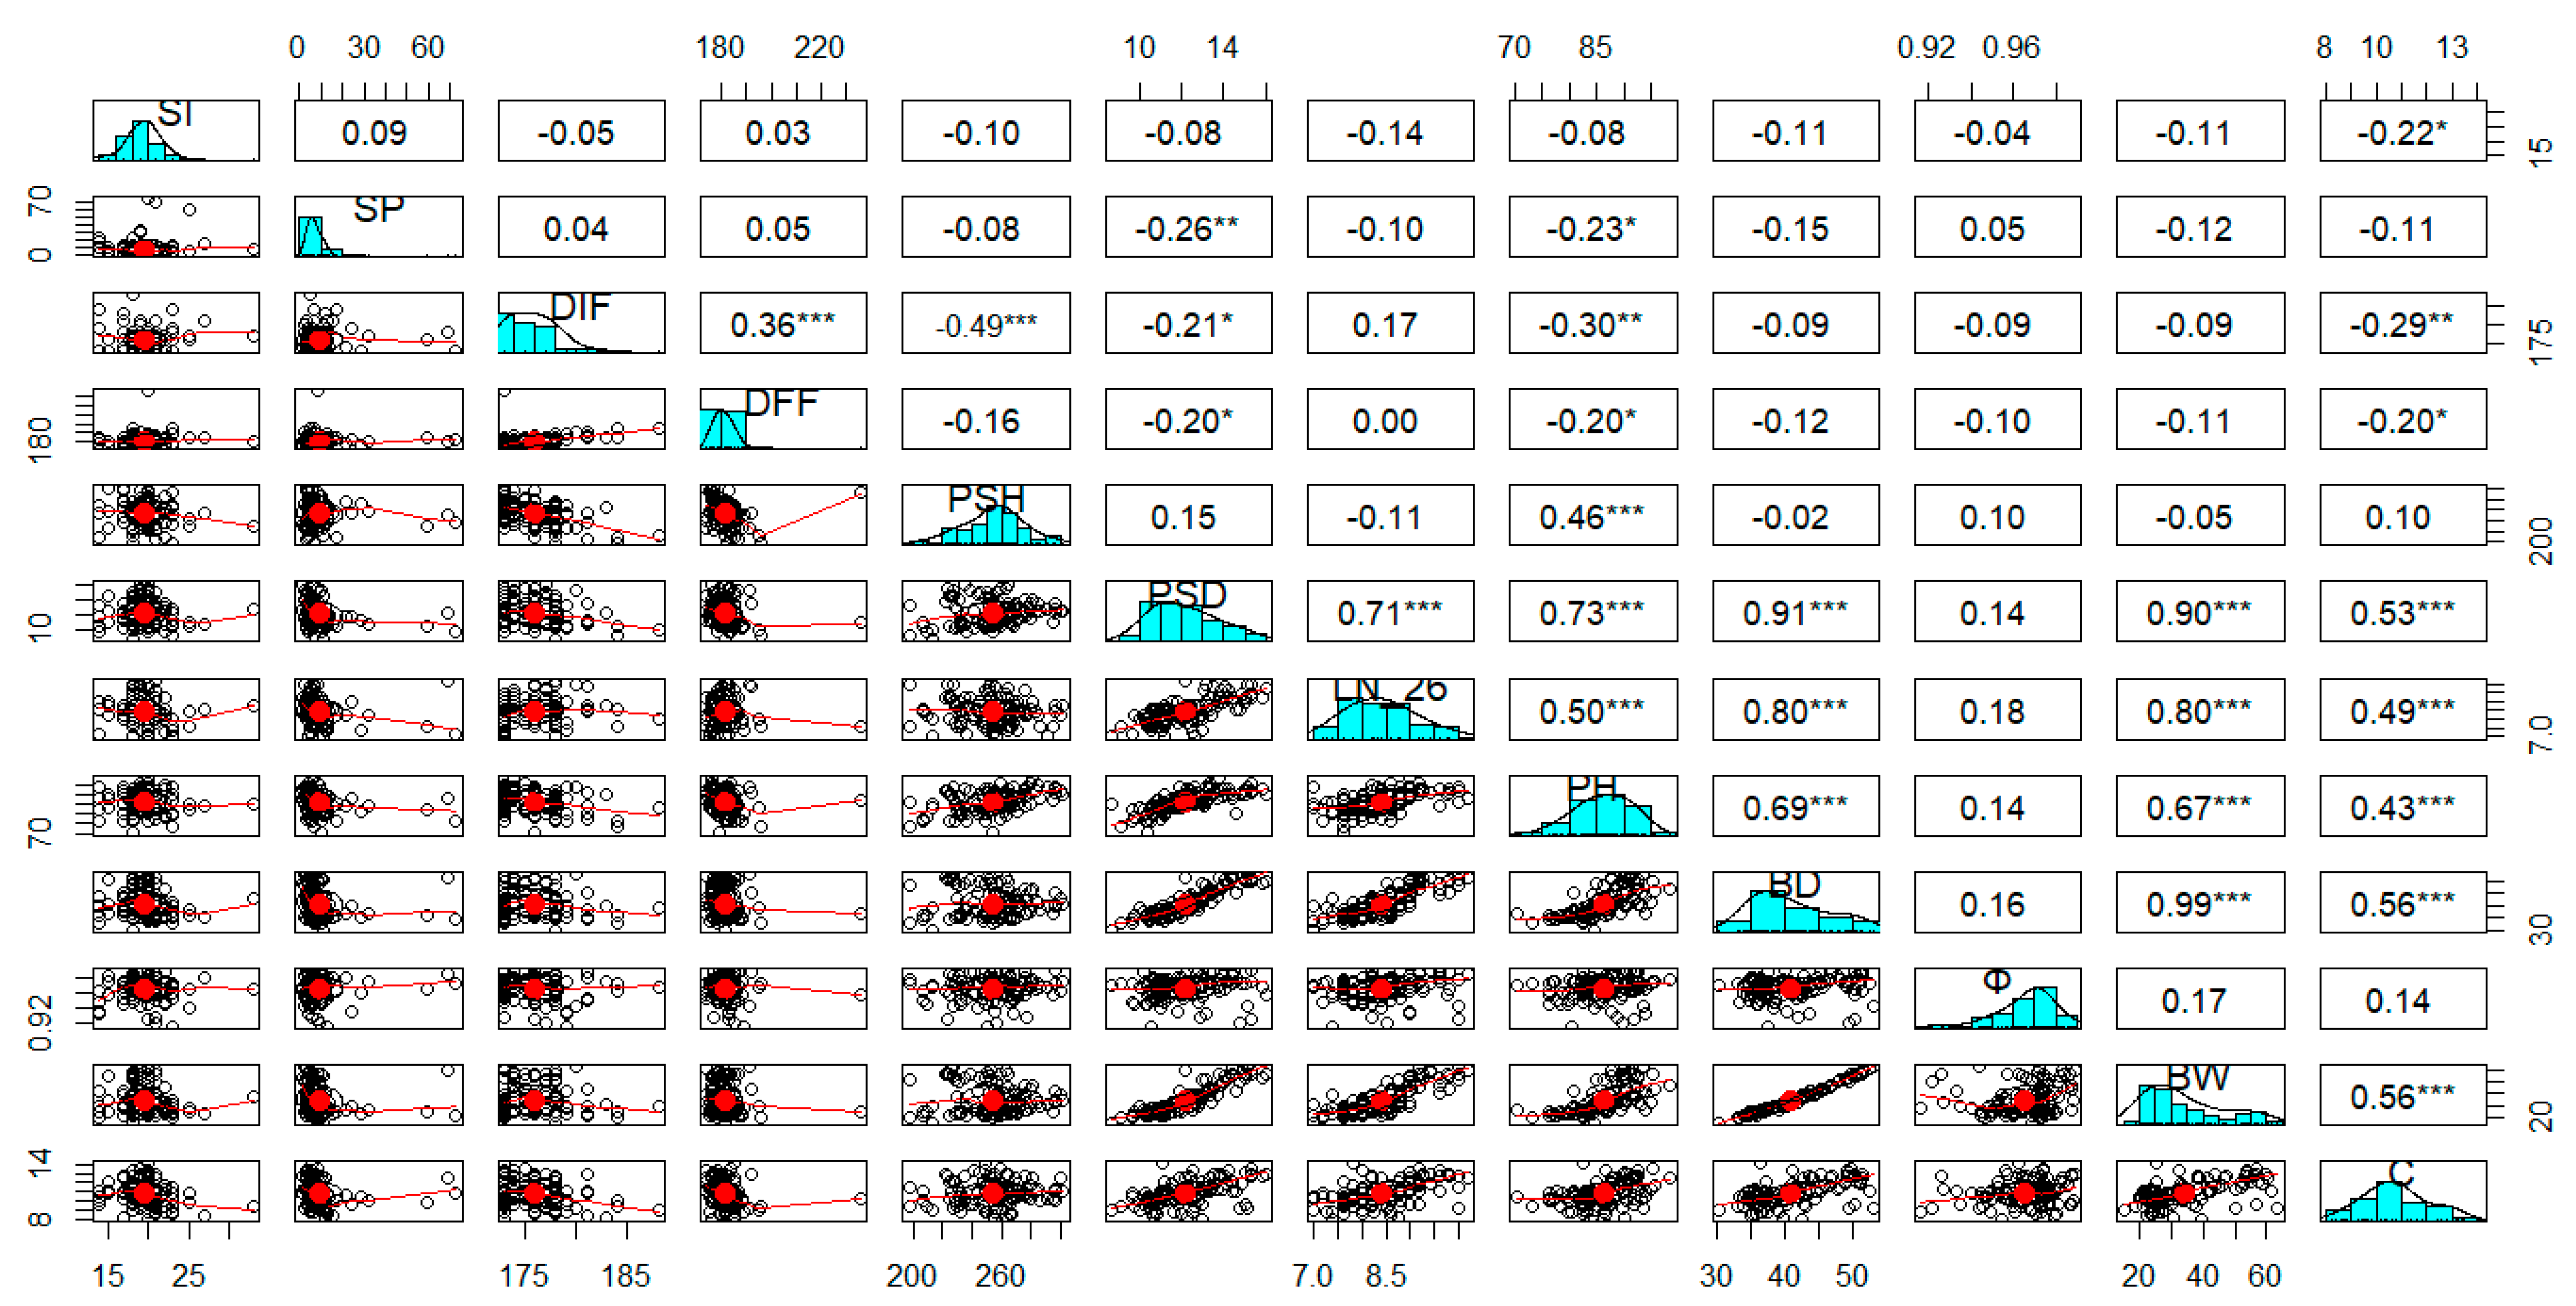
Figure 3.
Scatterplot of bidimensional representation of 111 out 117 families and 12 traits on the first (Dim 1), and the second (Dim 2) components. For 6 families were not possible to complete the assessment because of abundant early sprouting of shoots. Legend: PSH, pseudo-stem height; PSD, pseudo-stem diameter; LN-26, number of active leaves; PH, plant height; BD, bulb diameter; Φ, sphericity of bulb; BW, bulb weight; C, number of cloves.
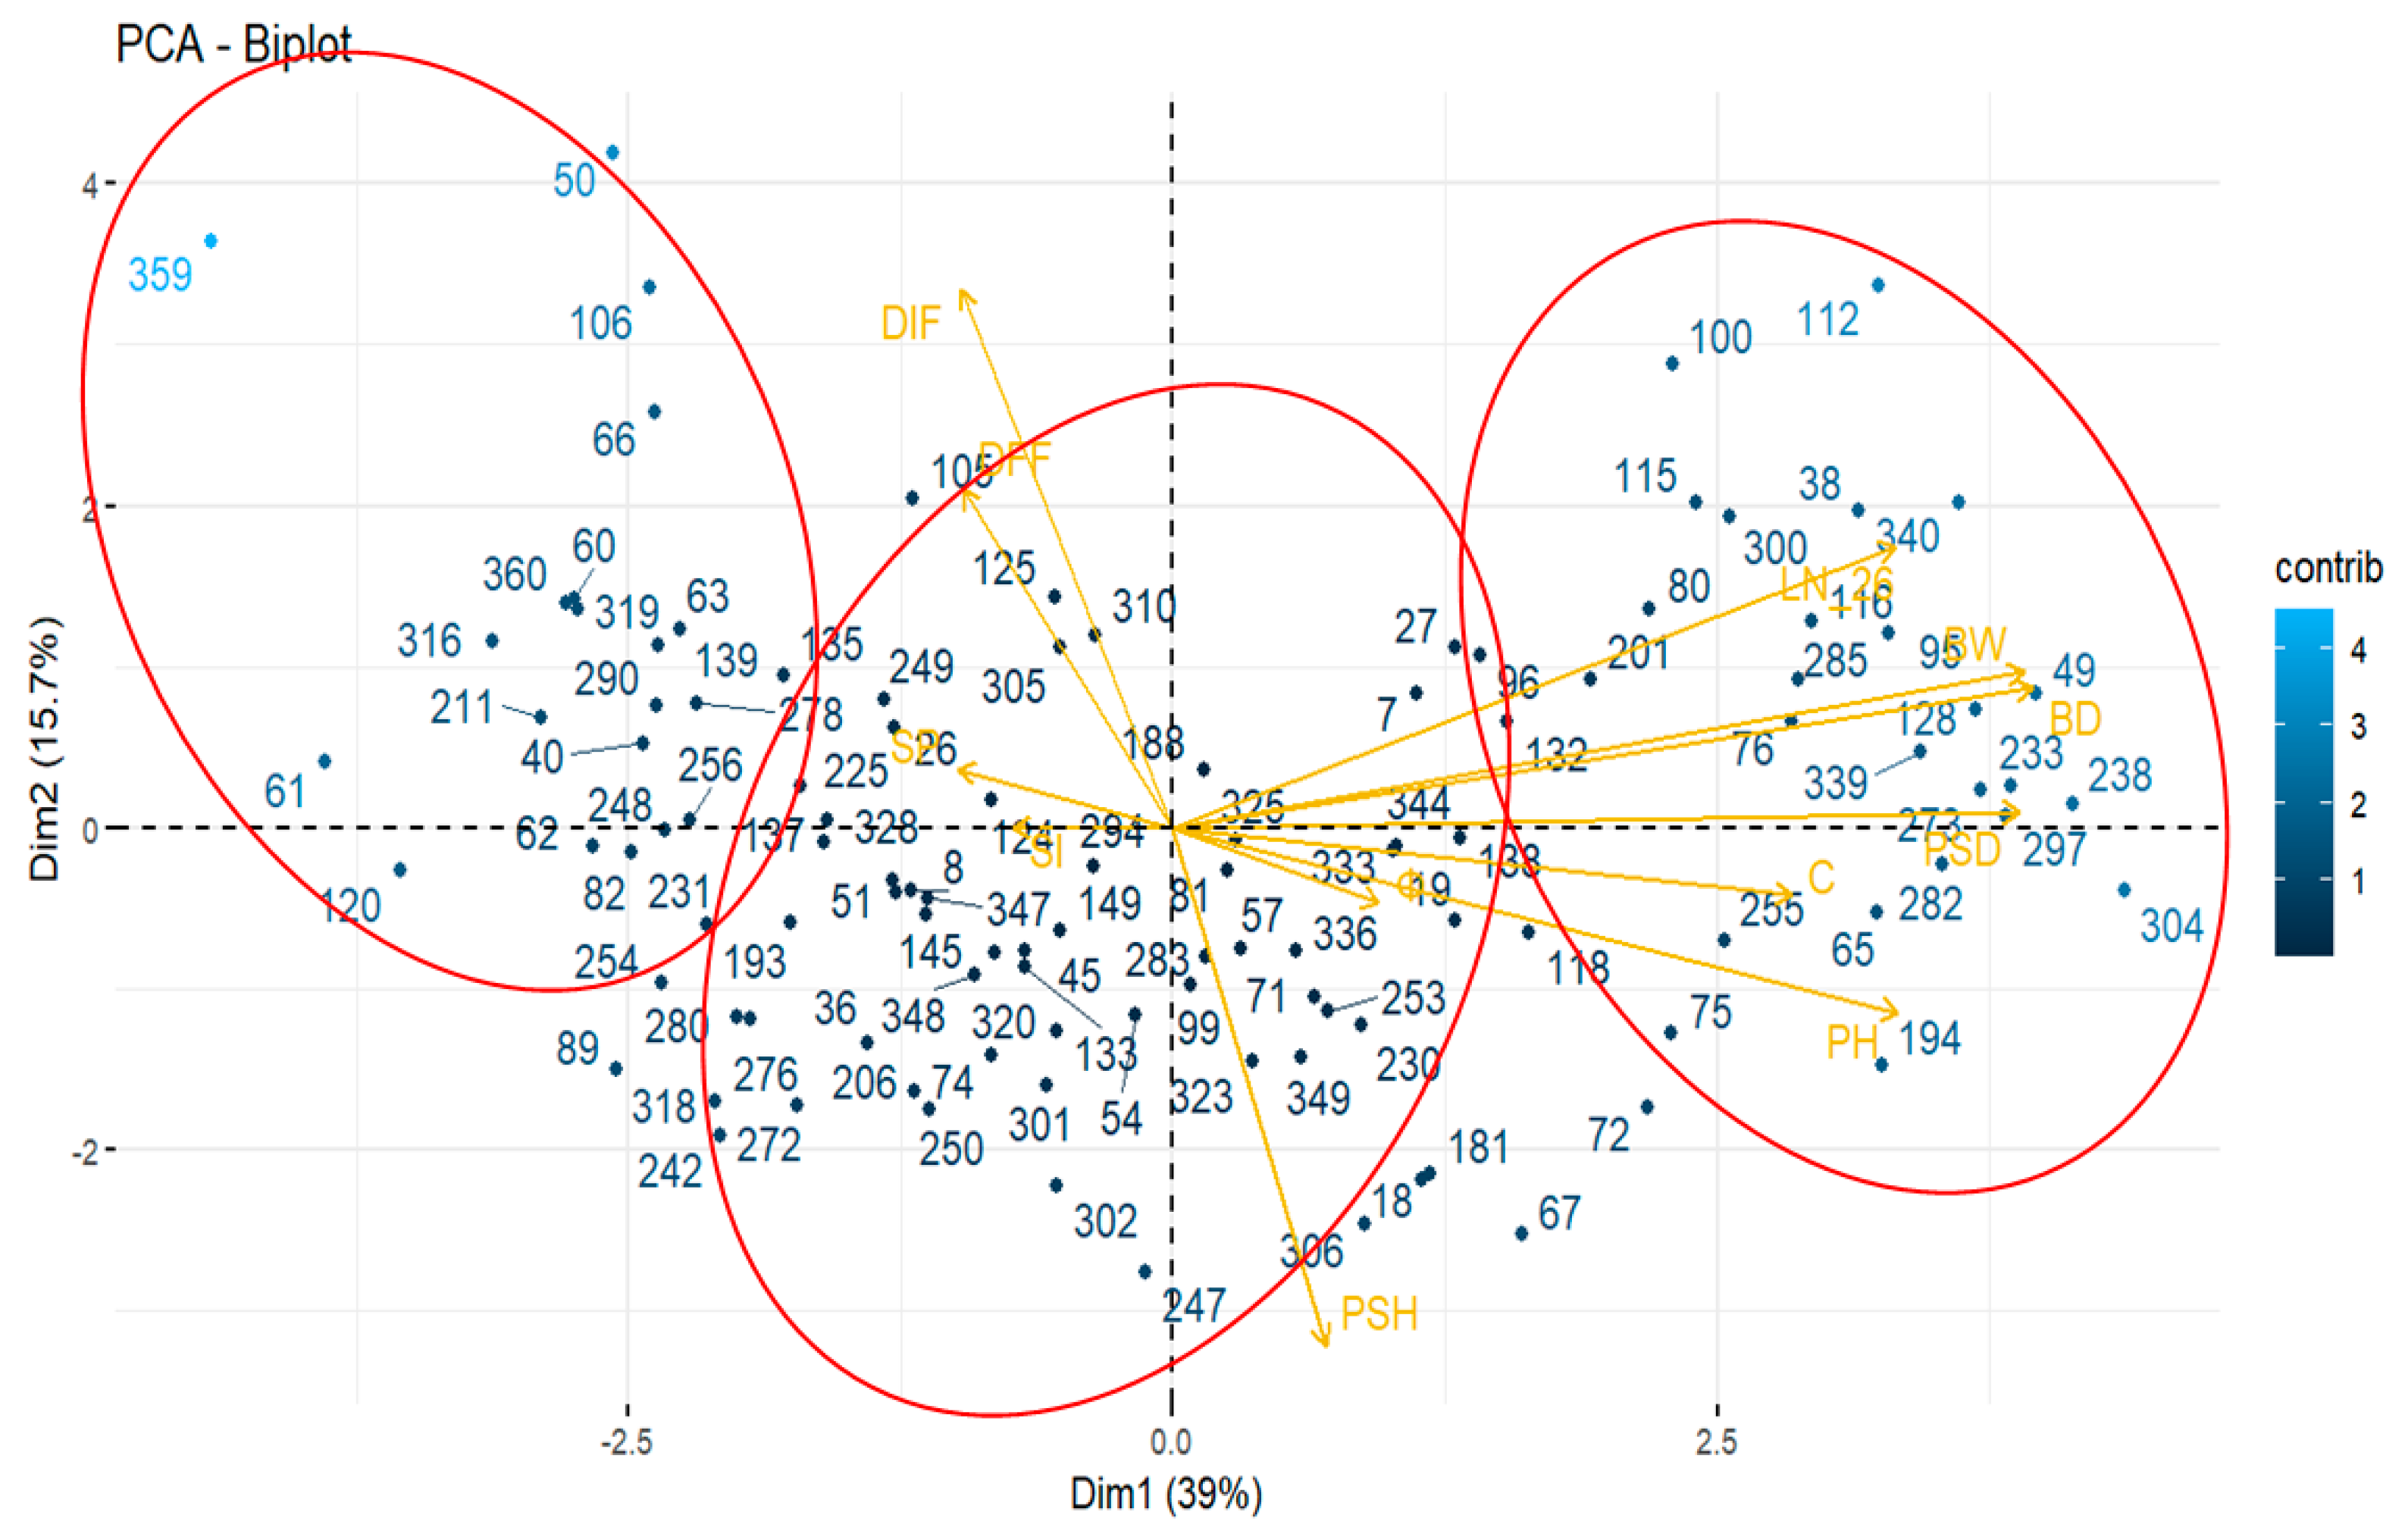
Figure 4.
Clustering of 111 out 117 families based on the Euclidean distance for 12 morphological and phenological traits. For 6 families were not possible to complete the assessment because of abundant early sprouting of shoots. First trial (season 2021-2022).
Figure 4.
Clustering of 111 out 117 families based on the Euclidean distance for 12 morphological and phenological traits. For 6 families were not possible to complete the assessment because of abundant early sprouting of shoots. First trial (season 2021-2022).
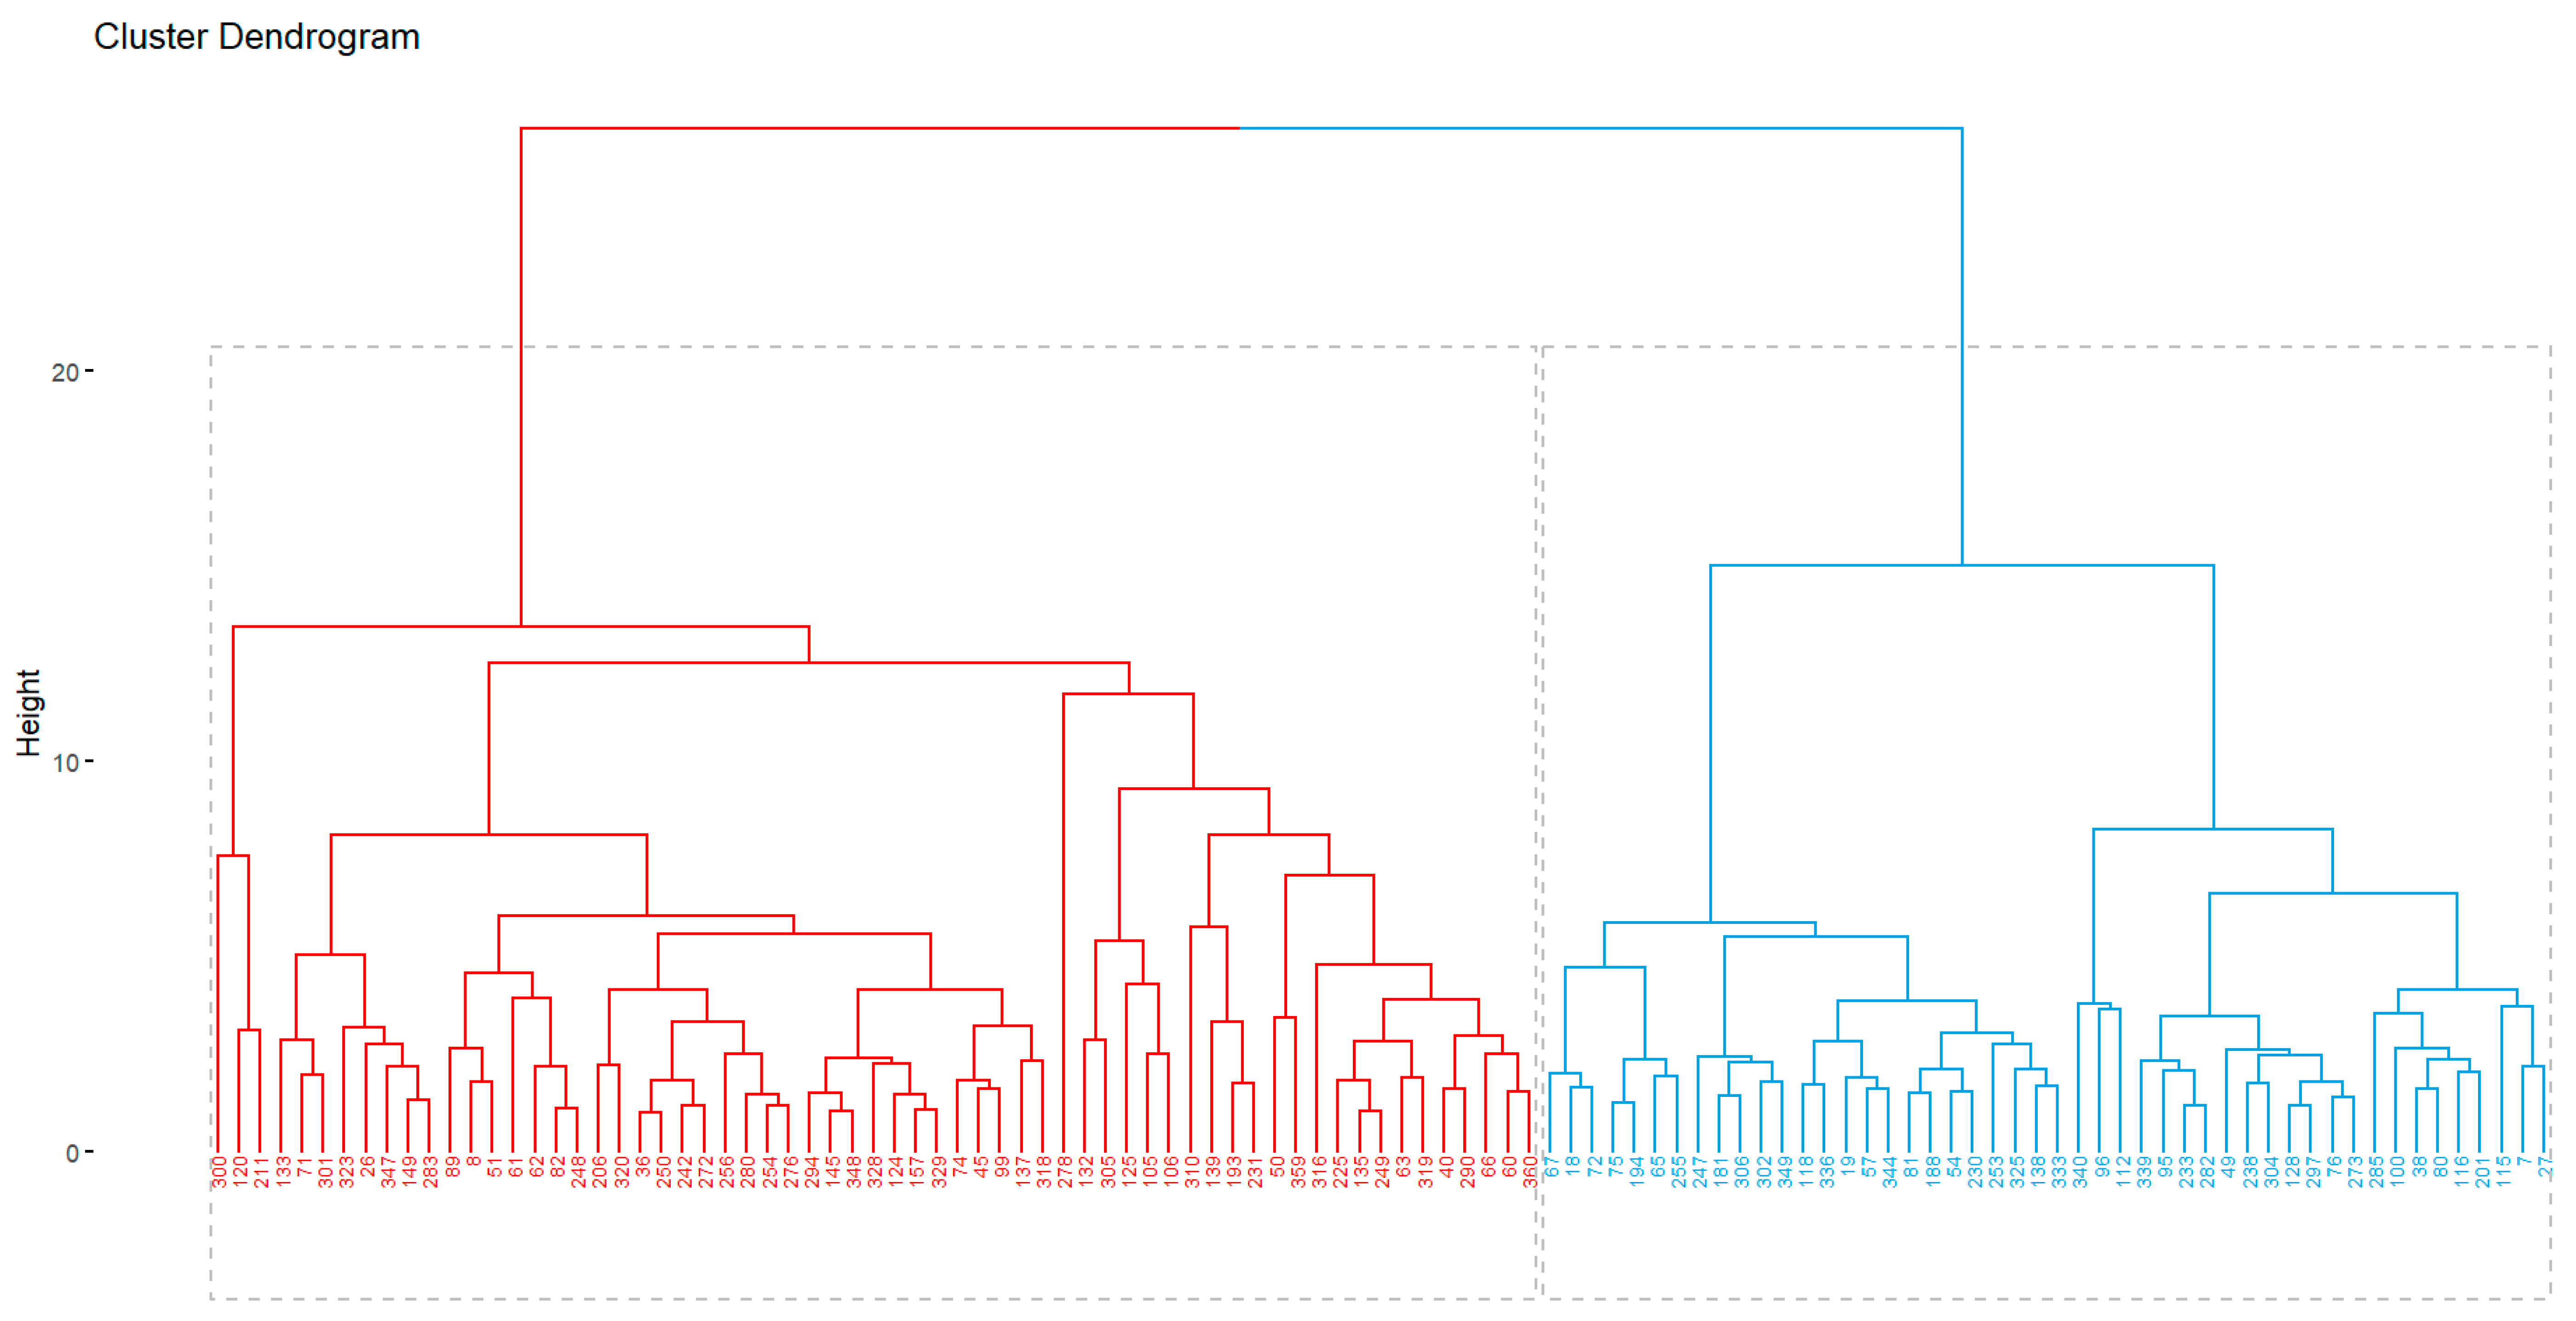
Figure 5.
Phenotype of bulbs (a-d) and cloves (e, f) from families (a) 89, (b) 40, (c, f) 344, (d) 26, and (e) 157. Families 26 and 89 were discarded from the selection program because of the formation of external cloves (signaled with red arrows), and low yield, respectively. Although selection was performed for the PGI “Morado de las Pedroñeras” (purple or violet garlic), important differences in color can be observed. Second trial (season 2022-2023).
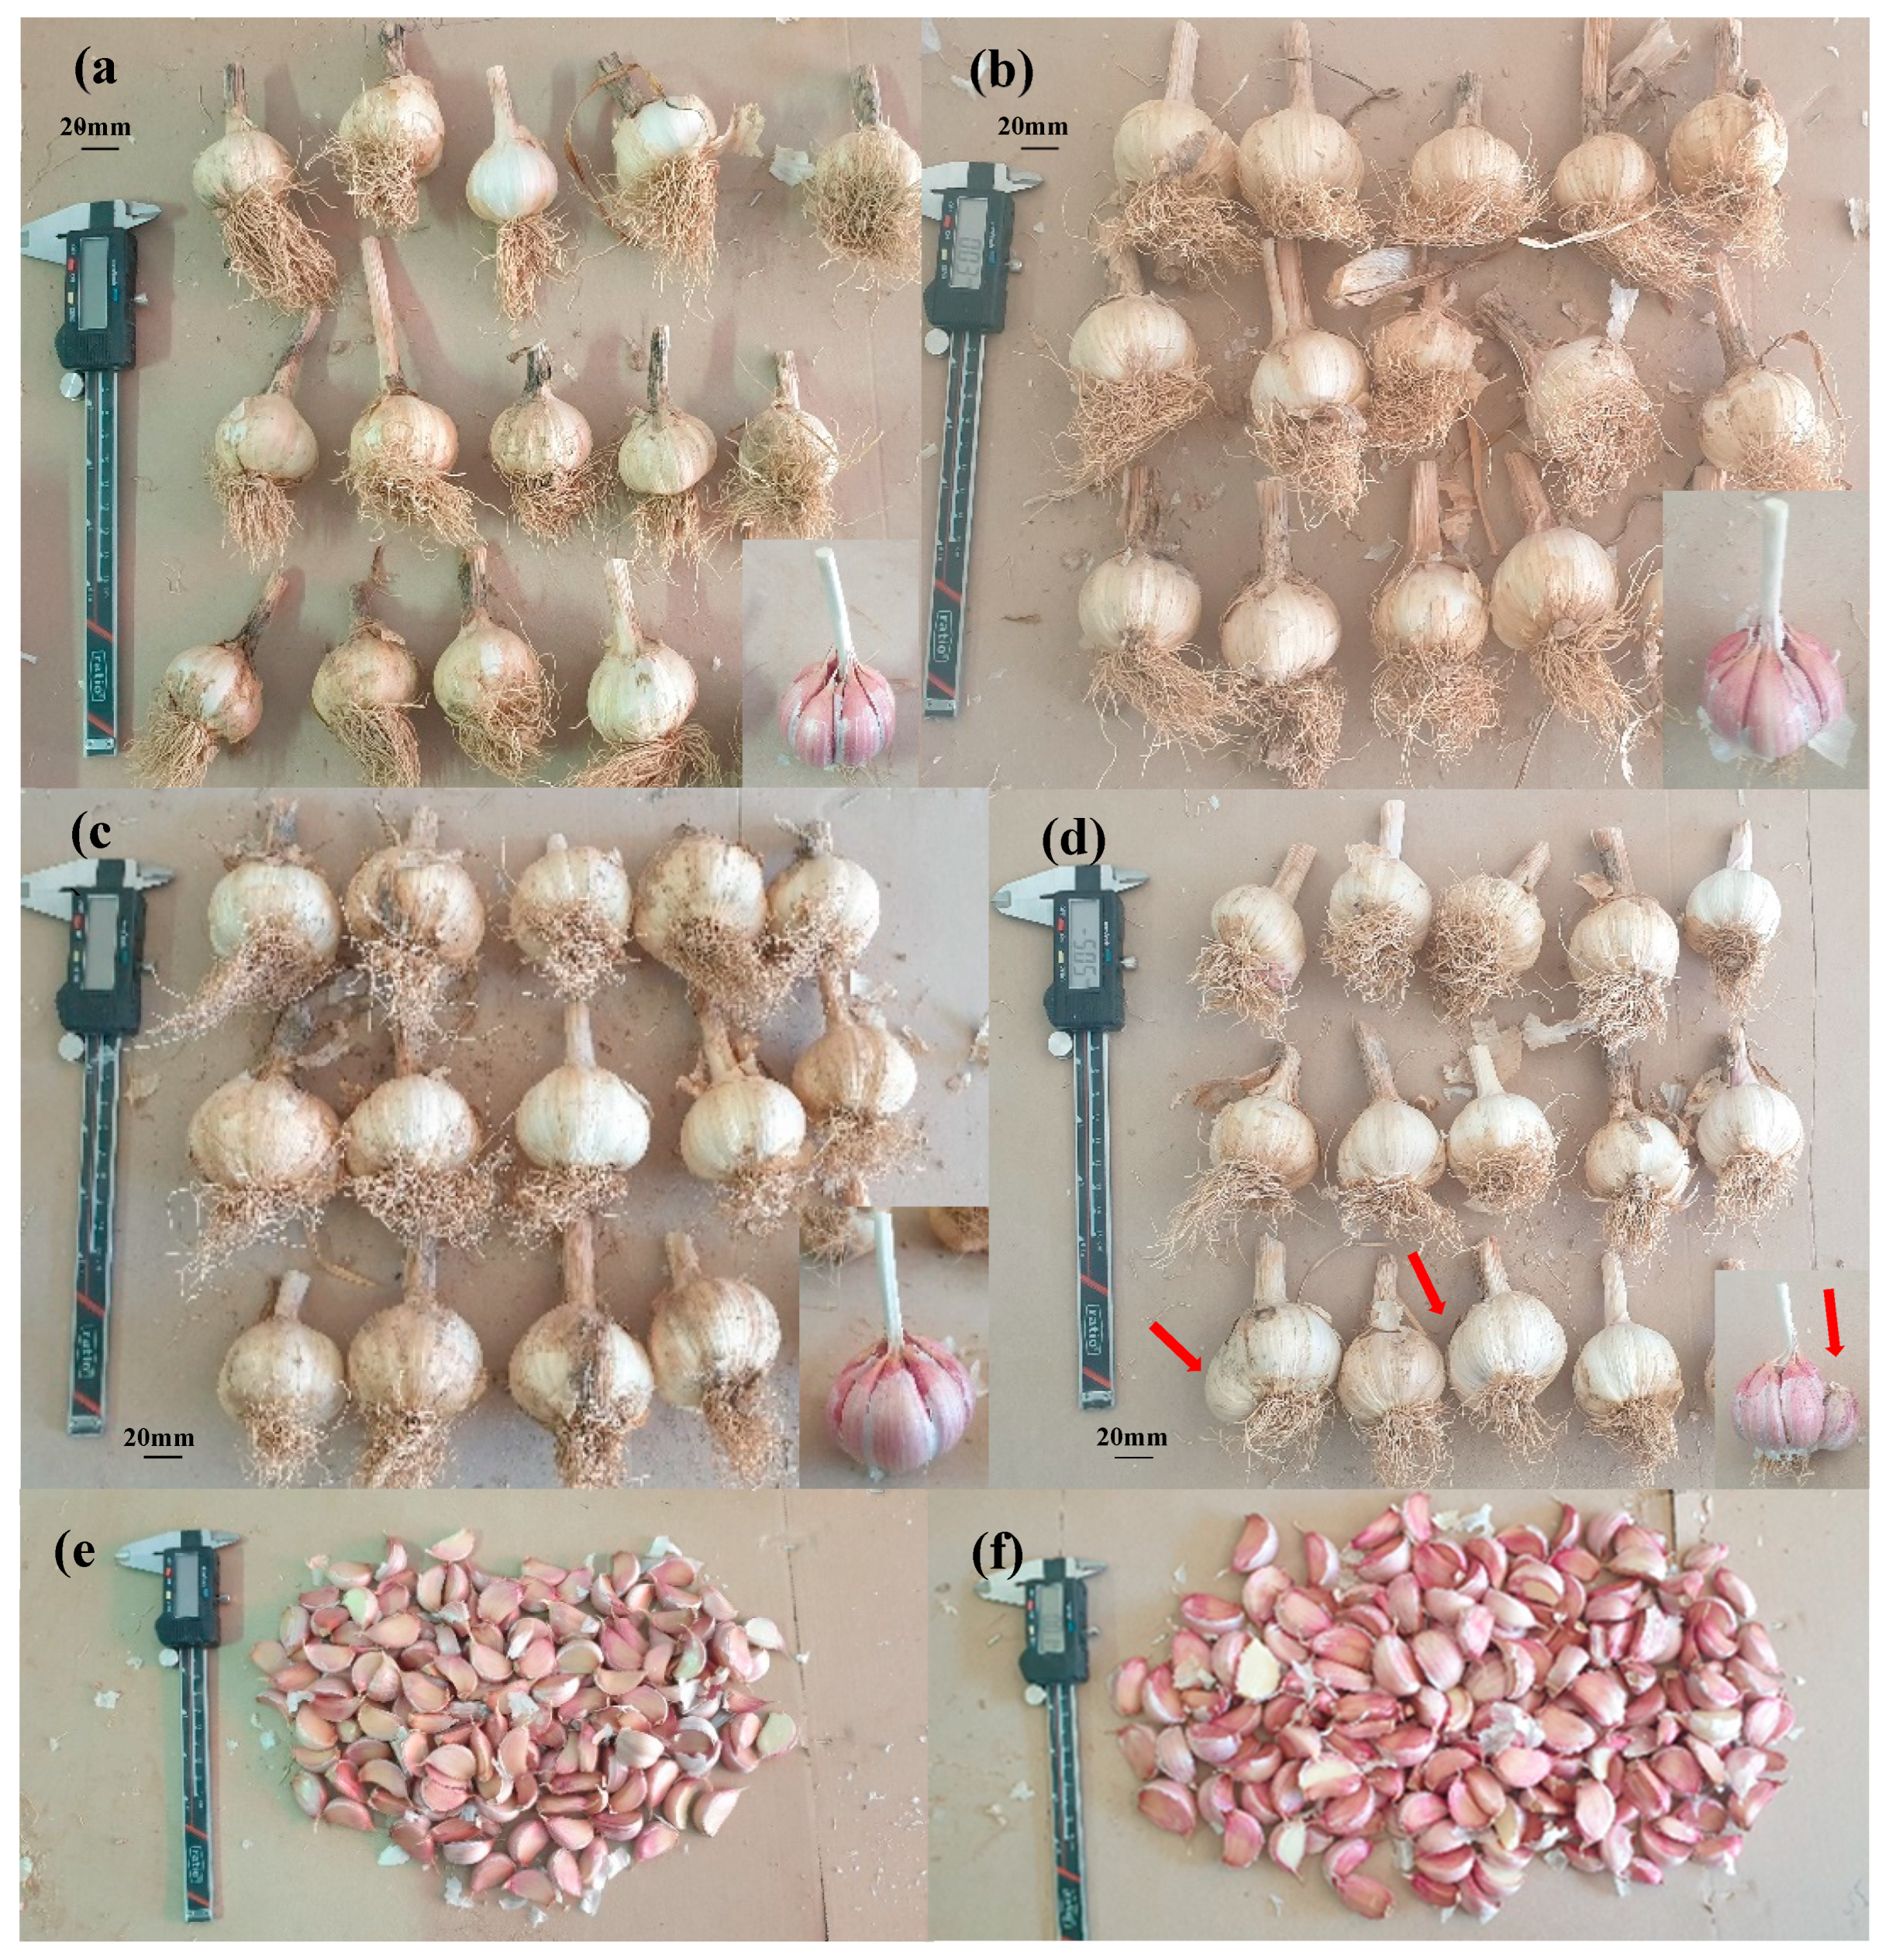
Figure 6.
Pearson’s correlation among phenotypic characters, showing the histograms of correlation, and the scatterplots for assessed traits. Second trial (season 2022-2023). * Indicate signification for p < .05. ** Indicate signification for p < .01. *** Indicate signification for p < .001. Legend: BD, bulb diameter; Φ, sphericity of bulb; BW, bulb weight; C, number of cloves; SC, number of small cloves; LC, number of large cloves; CW, total clove weight; SCW, weight of small cloves; P, percentage of bulbs with external cloves; WtP, percentage of lost cause for reduced size of cloves; UWLC, unitary weight of large cloves; UWSC, unitary weight of small cloves; Y, potential yield.
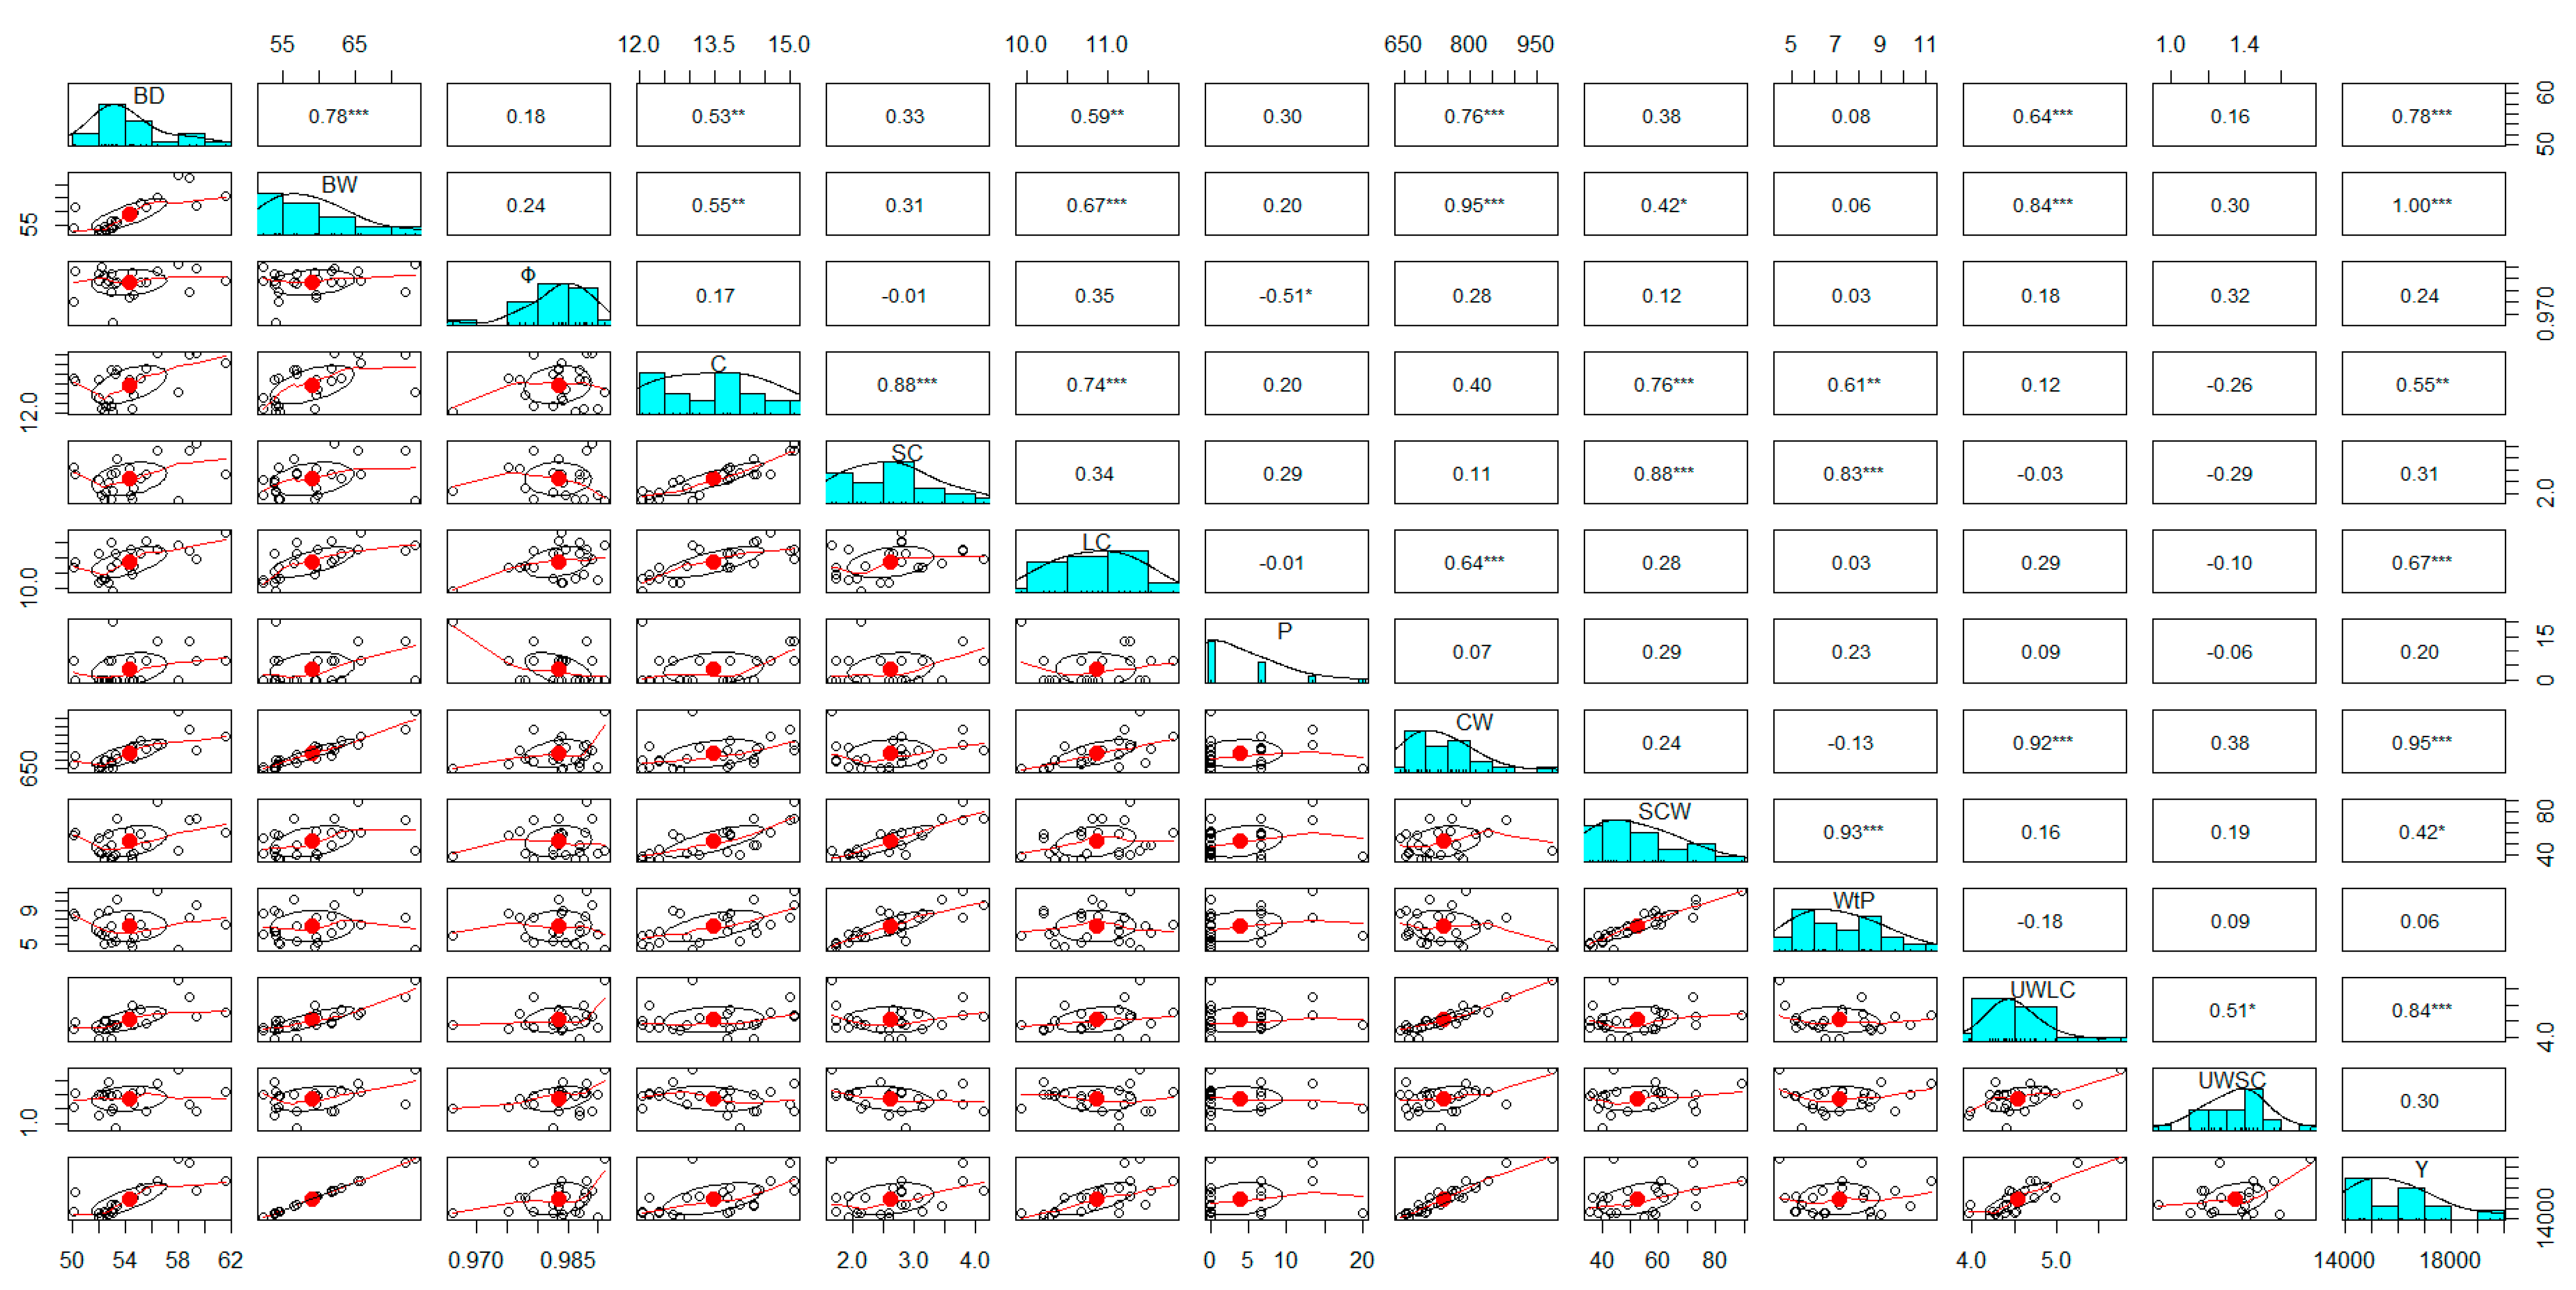
Figure 7.
Clustering of 23 families based on the Euclidean distance for 14 morphological and phenological traits. Second trial (season 2022-2023).
Figure 7.
Clustering of 23 families based on the Euclidean distance for 14 morphological and phenological traits. Second trial (season 2022-2023).
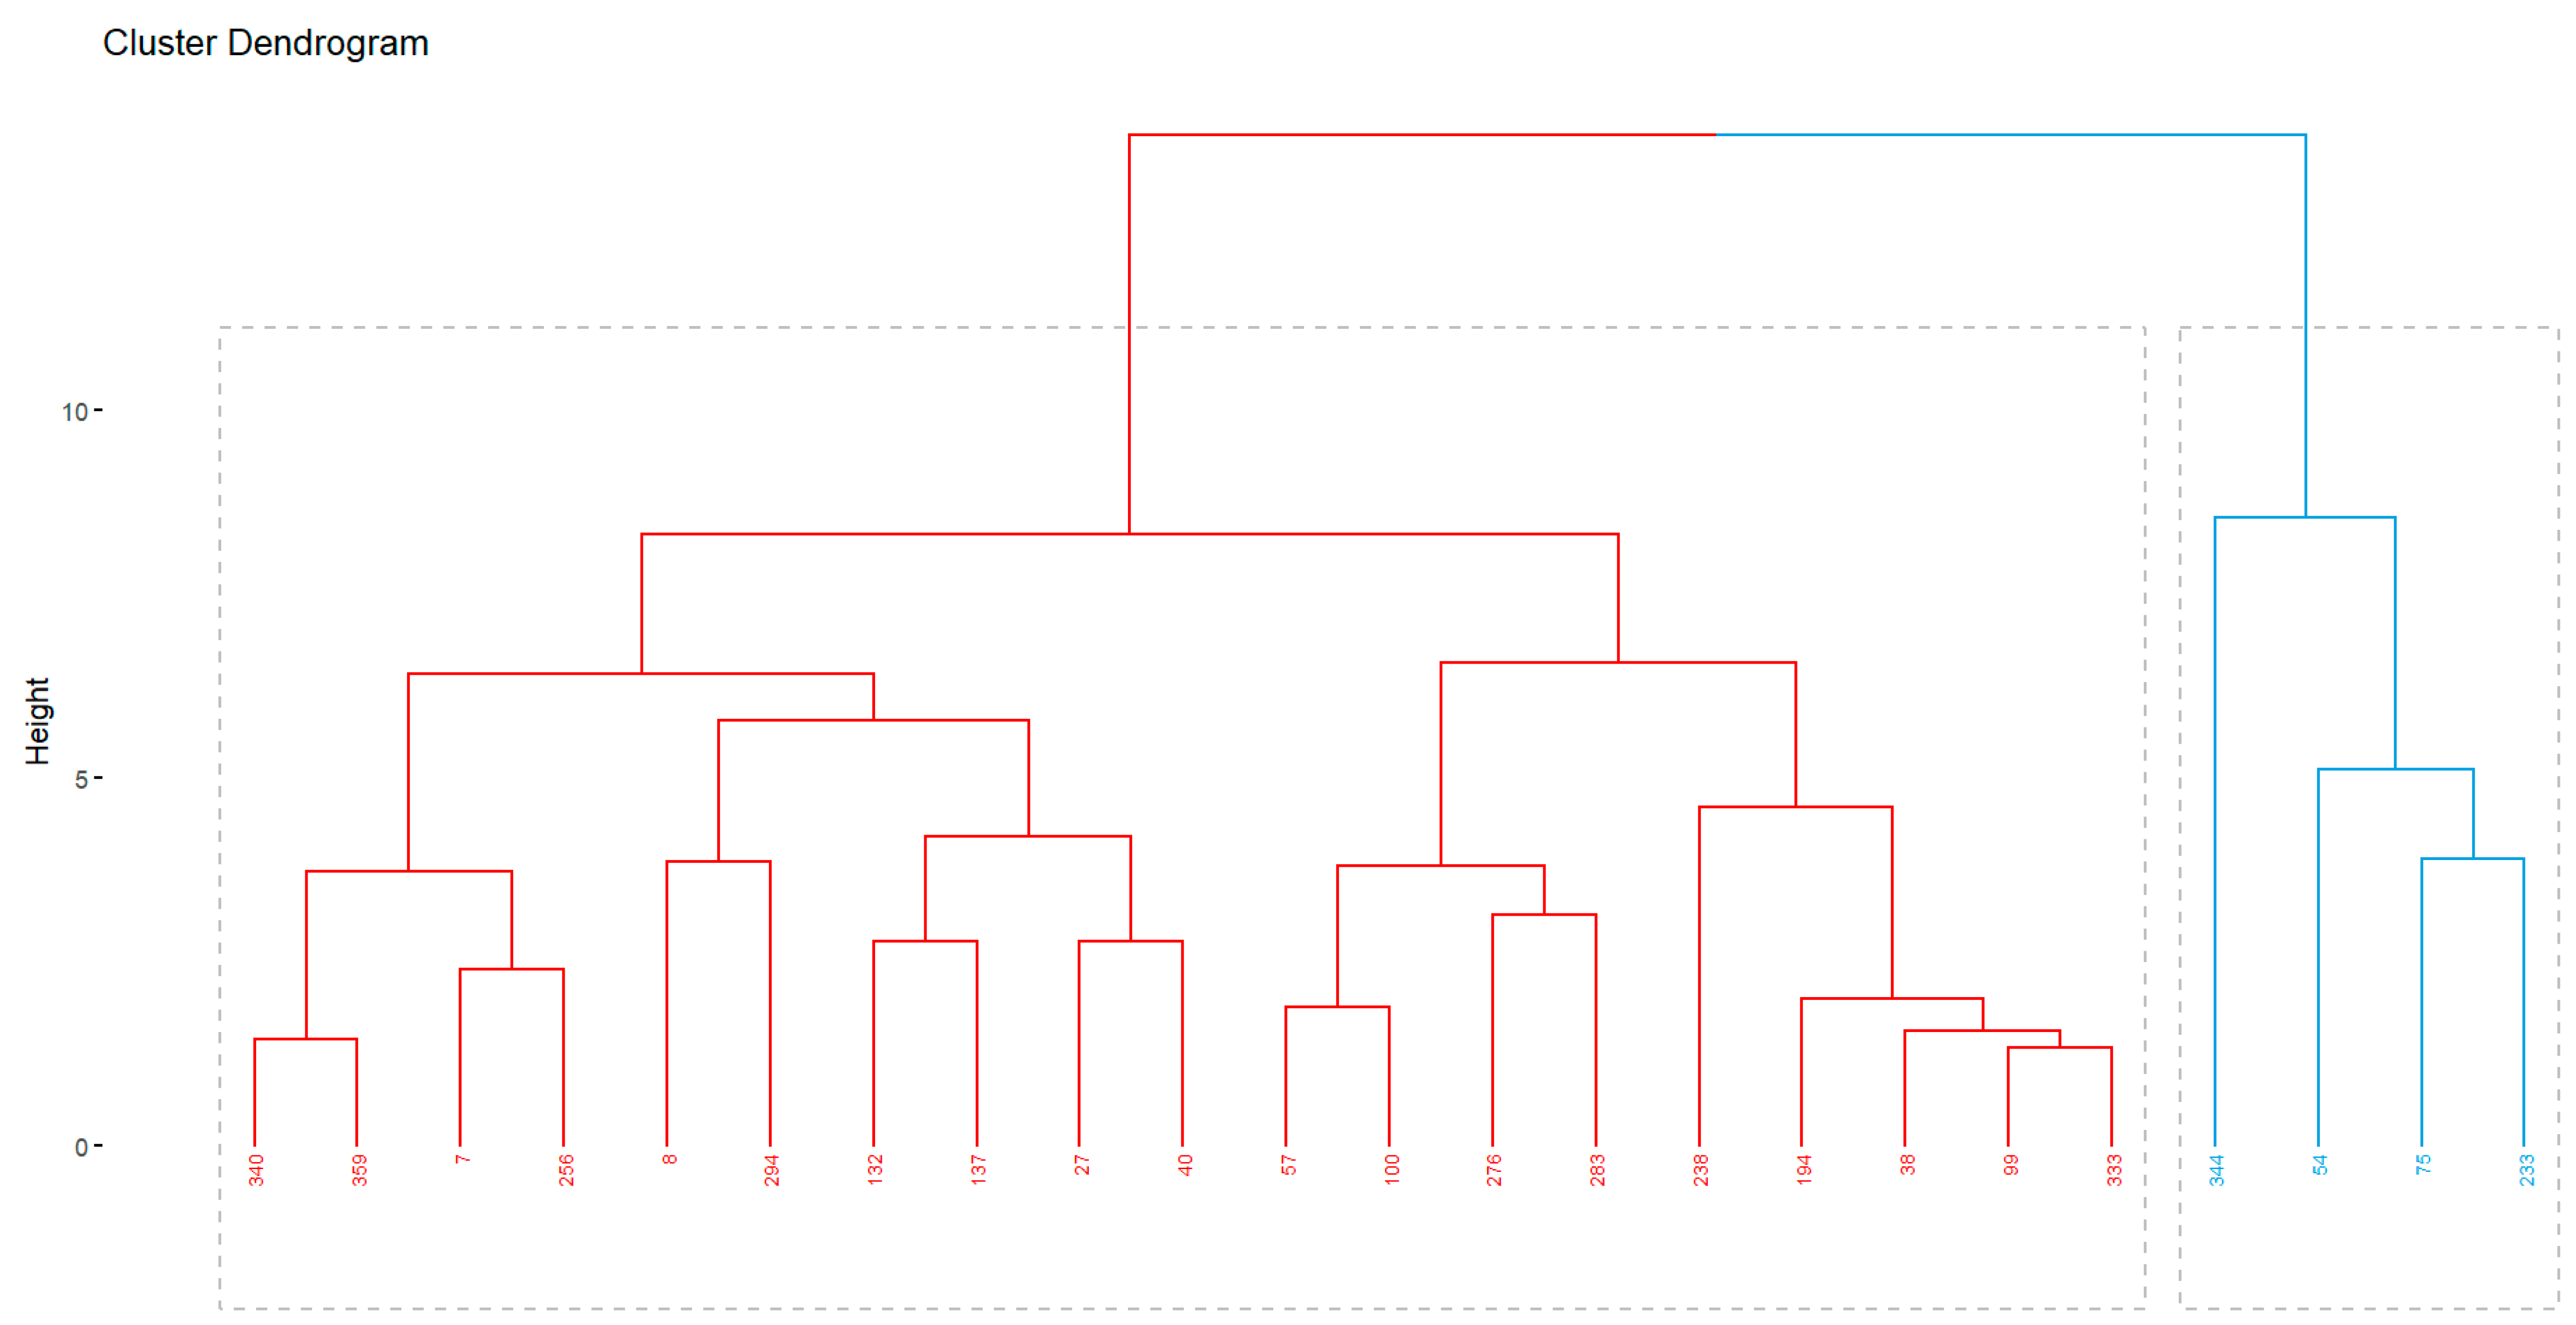

Table 1.
Results of ANOVA for 8 dependent variables, and the effect sizes of families on them. Resume of the first trial (2021-2022 season).
Table 1.
Results of ANOVA for 8 dependent variables, and the effect sizes of families on them. Resume of the first trial (2021-2022 season).
| Dependent Variables | F Value | df | Signif. (p) | ω2 | 95% IC ω2** | Interpretation of Effect Size |
| PSH | 6.631 | 102 | <0.001 | 0.54 | [0.41-1.00] | Medium |
| PSD | 8.216 | 102 | <0.001 | 0.60 | [0.50-1.00] | Medium |
| LN_26 | 5.030 | 102 | <0.001 | 0.45 | [0.29-1.00] | Small |
| PH | 7.843 | 102 | <0.001 | 0.58 | [0.48-1.00] | Medium |
| BD | 12.230 | 102 | <0.001 | 0.70 | [0.63-1.00] | Medium |
| Φ* | 148.100 | 102 | <0.01 | 0.27 | [0.36-0.48] | Small |
| BW | 12.540 | 102 | <0.001 | 0.70 | [0.64-1.00] | Medium |
| C | 6.296 | 102 | <0.001 | 0.52 | [0.39-1.00] | Medium |
* Result of Kruskal-Wallis test. The size effect was calculated for ε2. ** One-sided CIs: upper bound fixed at [1.00], except for Φ. Legend: PSH, pseudo-stem height; PSD, pseudo-stem diameter; LN-26, number of active leaves on the 26th week; PH, plant height; BD, bulb diameter; Φ, sphericity of bulb; BW, bulb weight; C, number of cloves.
Table 2.
Results of ANOVA for 6 dependent variables, and the effect sizes of families on them. Resume of the second trial (2022-2023 season).
Table 2.
Results of ANOVA for 6 dependent variables, and the effect sizes of families on them. Resume of the second trial (2022-2023 season).
| Dependent Variables | F Value | df | Signif. (p) | ω2 | 95% IC ω2* | Interpretation of Effect Size |
| BD | 8.254 | 23 | <0.001 | 0.32 | [0.22, 1.00] | Small |
| Φ | 2.326 | 23 | <0.001 | 0.08 | [0.00, 1.00] | Very Small |
| BW | 5.330 | 23 | <0.001 | 0.22 | [0.11, 1.00] | Small |
| C | 8.883 | 23 | <0.001 | 0.33 | [0.24, 1.00] | Small |
| SC | 8.018 | 23 | <0.001 | 0.31 | [0.21, 1.00] | Small |
| LC | 3.225 | 23 | <0.001 | 0.12 | [0.02, 1.00] | Small |
* One-sided CIs: upper bound fixed at [1.00]. Legend: BD, bulb diameter; Φ, sphericity of bulb; BW, bulb weight; C, number of cloves; SC, number of small cloves; LC, number of large cloves.
Table 3.
Grouping of families according to their potential yield, and distribution of percentages of the different commercial bulb size categories per family .
Table 3.
Grouping of families according to their potential yield, and distribution of percentages of the different commercial bulb size categories per family .
| Family | Yield (kg ha-1) | Grouping of Families by Yield | Bulb Size Category (%) | |||||
| F <37mm | E 37-45 mm |
D 45-50 mm |
C 50-55 mm |
B 55-60 mm |
A >60mm |
|||
| 38 | 14112 | I | 0.0 | 0.0 | 20.0 | 60.0 | 20.0 | 0.0 |
| 57 | 14490 | 0.0 | 0.0 | 20.0 | 53.3 | 26.7 | 0.0 | |
| 99 | 14724 | 0.0 | 6.7 | 13.3 | 66.7 | 13.3 | 0.0 | |
| 100 | 14112 | 0.0 | 13.3 | 26.7 | 26.7 | 26.7 | 6.7 | |
| 194 | 14652 | 0.0 | 0.0 | 13.3 | 73.3 | 6.7 | 6.7 | |
| 238 | 14562 | 0.0 | 0.0 | 26.7 | 53.3 | 13.3 | 6.7 | |
| 256 | 15372 | 0.0 | 0.0 | 20.0 | 46.7 | 33.3 | 0.0 | |
| 276 | 15228 | 0.0 | 0.0 | 6.7 | 60.0 | 33.3 | 0.0 | |
| 283 | 14670 | 0.0 | 6.7 | 53.3 | 26.7 | 13.3 | 0.0 | |
| 333 | 14544 | 0.0 | 0.0 | 6.7 | 73.3 | 20.0 | 0.0 | |
| 340 | 15336 | 0.0 | 0.0 | 13.3 | 46.7 | 40.0 | 0.0 | |
| 359 | 14508 | 0.0 | 6.7 | 13.3 | 66.7 | 13.3 | 0.0 | |
| 7 | 16668 | II | 0.0 | 0.0 | 20.0 | 20.0 | 53.3 | 6.7 |
| 8 | 16092 | 0.0 | 0.0 | 20.0 | 26.7 | 46.7 | 6.7 | |
| 27 | 16650 | 0.0 | 13.3 | 26.7 | 53.3 | 6.7 | 0.0 | |
| 40 | 17028 | 0.0 | 0.0 | 6.7 | 40.0 | 46.7 | 6.7 | |
| 132 | 16056 | 0.0 | 0.0 | 13.3 | 46.7 | 26.7 | 13.3 | |
| 137 | 16146 | 0.0 | 0.0 | 6.7 | 53.3 | 40.0 | 0.0 | |
| 233 | 16776 | 0.0 | 0.0 | 0.0 | 20.0 | 33.3 | 46.7 | |
| 294 | 16092 | 0.0 | 0.0 | 0.0 | 53.3 | 46.7 | 0.0 | |
| 54 | 17640 | III | 0.0 | 0.0 | 13.3 | 20.0 | 40.0 | 26.7 |
| 75 | 19458 | IV | 0.0 | 0.0 | 0.0 | 0.0 | 66.7 | 33.3 |
| 344 | 19800 | 0.0 | 0.0 | 0.0 | 20.0 | 66.7 | 13.3 | |
Table 4.
Results of 2-ways ANOVA for 4 dependent variables, and the effect sizes of families (F), location of trials (L), and the interaction between them on phenotype (F×L).
Table 4.
Results of 2-ways ANOVA for 4 dependent variables, and the effect sizes of families (F), location of trials (L), and the interaction between them on phenotype (F×L).
| Dependent Variable | Variation Factor | F Value | df | Signif. (p) | ω2 | 95% CI ω2 * | Interpretation of Effect Size |
| Bulb Diameter | |||||||
| F | 8.750 | 22 | <0.001 | 0.27 | [0.18, 1.00] | Small | |
| L | 824.089 | 1 | <0.001 | 0.64 | [0.60, 1.00] | Medium | |
| F×L | 9.725 | 22 | <0.001 | 0.30 | [0.21, 1.00] | Small | |
| Sphericity | |||||||
| F | 1.507 | 22 | n.s. | 0.02 | [0.00, 1.00] | Very small | |
| L | 69.445 | 1 | <0.001 | 0.13 | [0.08, 1.00] | Small | |
| F×L | 2.256 | 22 | <0.01 | 0.06 | [0.00, 1.00] | Very small | |
| Bulb Weight | |||||||
| F | 6.296 | 22 | <0.001 | 0.20 | [0.12, 1.00] | Small | |
| L | 429.649 | 1 | <0.001 | 0.49 | [0.43, 1.00] | Small | |
| F×L | 8.750 | 22 | <0.001 | 0.27 | [0.18, 1.00] | Small | |
| Number of Cloves | |||||||
| F | 7.859 | 22 | <0.001 | 0.25 | [0.16, 1.00] | Small | |
| L | 256.415 | 1 | <0.001 | 0.36 | [0.30, 1.00] | Small | |
| F×L | 5.255 | 22 | <0.001 | 0.17 | [0.08, 1.00] | Small | |
* One-sided CIs: upper bound fixed at [1.00]. n.s.: non significative. F, family; L, location of trial.
Disclaimer/Publisher’s Note: The statements, opinions and data contained in all publications are solely those of the individual author(s) and contributor(s) and not of MDPI and/or the editor(s). MDPI and/or the editor(s) disclaim responsibility for any injury to people or property resulting from any ideas, methods, instructions or products referred to in the content. |
© 2024 by the authors. Licensee MDPI, Basel, Switzerland. This article is an open access article distributed under the terms and conditions of the Creative Commons Attribution (CC BY) license (http://creativecommons.org/licenses/by/4.0/).
Copyright: This open access article is published under a Creative Commons CC BY 4.0 license, which permit the free download, distribution, and reuse, provided that the author and preprint are cited in any reuse.


