Submitted:
09 June 2024
Posted:
12 June 2024
Read the latest preprint version here
Abstract
There have been multiple technological advancements that promise to gradually enable devices to measure and record signals with high resolution and accuracy in the domain of Brain Computer Interfaces (BCI). This review paper provides a comprehensive overview of fNIRS, EEG, and fMRI, including their principles, advantages, limitations, and integration with other modalities for advanced BCIs. The paper highlights the advantages of integrating multiple modalities, such as increased accuracy and reliability, and discusses the challenges and limitations of multimodal integration. Applications of advanced BCIs in clinical, assistive, gaming, and entertainment domains are also discussed. Furthermore, we explain the data acquisition approaches for each of these modalities. We also demonstrate various software programs that help in extracting, cleaning, and refining the data. We conclude this paper with discussion on the available literature on data acquisition approaches and a comparison of the ease of use for each of the modalities.
Keywords:
Brain Computer Interface
; data acquisition modalities
; functional near-infrared spectroscopy
; electroencephalography
; functional magnetic resonance imaging
; multimodal integration
; signal processing.
1. Introduction
The Brain Computer Interfaces (BCIs) have emerged as transformative systems that establish a direct communication link between the human brain and external devices, such as computers or prosthetic limbs. By harnessing the power of neural activity, BCIs empower users to control these devices through their cognitive intentions, obviating the necessity for conventional input devices like keyboards and mice. [1] This innovation holds the promise to revolutionize the interface between humans and machines, particularly for individuals whose mobility or speech has been impaired due to injuries or disabilities.
The functioning of BCIs hinges upon the ability to capture and interpret the brain's intricate electrical signals. These signals arise from the brain's dynamic activity and serve as a reflection of its cognitive processes. [2] Several methodologies have been employed to measure and decode these signals, including electroencephalography (EEG), which records electrical activity from the scalp, and functional magnetic resonance imaging (fMRI), which captures changes in cerebral blood flow. Additionally, BCIs can harness other modalities such as functional near-infrared spectroscopy (fNIRS) and intracortical recordings, each contributing unique insights into neural activity.
The applications enable a wide spectrum, ranging from assisting individuals afflicted with paralysis or locked-in syndrome to regain communication and control over their surroundings, to enabling users to manipulate intricate machinery or engage in video games using cognitive intent. However, despite their immense potential, BCIs remain in the nascent stages of development, beset by numerous technical and ethical challenges that demand careful scrutiny and resolution before widespread integration.
This review explores the swiftly evolving landscape of BCIs, delving into their diverse modalities and the burgeoning possibilities they offer. While each modality boasts distinct advantages, they also bear inherent limitations. The fusion of multiple modalities presents a solution to surmount these limitations, rendering BCIs more precise, dependable, and robust. For instance, EEG excels with high temporal resolution and non-invasiveness, albeit at the cost of spatial resolution, whereas fMRI affords superior spatial resolution but struggles with temporal precision. Integrating both modalities can bridge these gaps, harnessing their individual strengths synergistically.
The overarching objective of this review is to provide an extensive exploration of the integration of functional near-infrared spectroscopy (fNIRS), electroencephalography (EEG), and functional magnetic resonance imaging (fMRI) modalities within the realm of BCIs. This exploration will encompass an evaluation of the strengths and limitations of each modality in isolation, [3] while delving into the transformative potential unlocked by their multimodal fusion. The review aims to illuminate the trajectory of research in this domain, delineating the challenges and opportunities, and thereby contributing to the ongoing advancement of BCIs. Through an in-depth analysis of modalities, their integration, and their applications, this review endeavors to provide a comprehensive insight into the present and future landscape of advanced BCIs.
2. BCI Modalities under Consideration
There have been multiple technological advancements that promise to gradually enable devices to measure and record signals with high resolution and accuracy in the domain of Brain Computer Interfaces (BCI), which were then utilized for building working models that can be used in various functionalities. Such utilities are as varied as academic endeavors to commercial memory storage devices currently initiated by Neuralink [4] to understand and abet in curing diseases and disabilities of the brain. We provide a review of various BCI modalities that provide an understanding of their working mechanisms. Subsequently, we embark upon exploring the data acquisition techniques for each of those modalities.
2.1. Electroencephalography (EEG)
Electroencephalography (EEG) stands as a prominent non-invasive brain imaging modality, characterized by an array of electrodes adorning the scalp, diligently capturing potential differences across distinct neuronal enclaves. Within the realm of Brain Computer Interfaces (BCIs), EEG assumes a pivotal role, with its operational architecture often tailored to specific frequency bands.
In the conventional BCI configuration, subjects are presented with stimuli at precise intervals. These stimuli elicit potentials within targeted cerebral regions, constituting the renowned event-related potentials (ERPs). The deliberate repetition of these ERPs enhances the signal-to-noise ratio, attenuating extraneous interference. Noise, discerned as spurious signals originating from artifacts such as cardiac activity, cranial structures, and respiratory processes, is systematically minimized. Recently, biometric authentication systems have been also explored with EEG modality banking on unique behavioral patterns to identify the user. [5]
The versatile applications of EEG-based BCI systems traverse a myriad of domains, ranging from prosthetic innovations to immersive video game experiences. This owes much to the modality's non-invasiveness, rendering it conducive to widespread use. With streamlined setup procedures and the absence of surgical prerequisites, EEG modalities emerge as the vanguard for forthcoming BCI explorations across multifarious scenarios. Also, EEG has been implemented in automated driving setups that check for driver drowsiness. [6] Within the realm of neuroimaging techniques, Electroencephalography (EEG) stands as a beacon of distinct advantages, setting it apart from its counterparts. A cascade of benefits distinguishes EEG, rendering it a quintessential tool for deciphering the intricacies of brain function.
Foremost is the unparalleled temporal resolution that EEG confers. This modality operates on a millisecond timescale, unrivalled by other neuroimaging techniques such as fMRI. This temporal acuity empowers EEG to unravel the chronology and dynamics of neural processes with exquisite precision. It excels in capturing the intricate temporal orchestration of cognitive phenomena and the precise timing of sensory perceptions. EEG's low cost and portability amplify its prowess. In the financial realm, EEG equipment remains economical, facilitating its widespread adoption across research settings. The added dimension of portability imbues EEG with remarkable flexibility, allowing seamless transitions between disparate locations. From hospital wards to research laboratories, and even field studies, EEG offers a versatile lens through which to examine brain function in diverse contexts. Furthermore, machine learning algorithms have found quantitative applications [7] for outcome predictions in traumatic brain injury, [8], [9] eating disorder [10] and autism spectrum disorder [11] cases.
Safety emerges as a concern in neuroimaging, and EEG's non-invasiveness and radiation-free nature allay these apprehensions. Its innocuous profile renders it suitable for an extensive spectrum of subjects, including children and expectant mothers. This safety assurance complements EEG's unobtrusiveness, fostering an environment conducive to exploring neural dynamics. A hallmark attribute of EEG lies in its capability to discern neural responses to specific stimuli or events. This attribute is pivotal in dissecting cognitive processes like attention, memory, and language. By mapping brain activity onto cognitive functions, EEG empowers researchers to unveil the intricate interplay between neural patterns and cognitive operations. EEG shines as a formidable neuroimaging tool, armed with an arsenal of advantages that demarcate its uniqueness. Its temporal acumen, portability, and responsiveness to stimuli-driven dynamics set the stage for insightful inquiries into brain function. Amid the intricate landscape of neuroimaging modalities, EEG holds a distinctive position, offering a vantage point to decode the symphony of neural activity.
Among the software options available, we have found python and R to be rich in libraries that aid in data filtering and analysis in the course of this review, such as MNE-Python [12] and nin-Py [13] modules with a multitude of functionalities. Figure 1 shows calibration of EEG readings in R workspace.
Data Acquisition Approaches and Limitations with a Standalone Setup
EEG-based Brain Computer Interfaces (BCIs) epitomize a revolutionary paradigm, channeling EEG signals to govern external devices such as computers or prosthetic counterparts. This dynamic symbiosis hinges upon the discernment of distinct brain activity patterns aligned with specific commands. While EEG-based BCIs yield manifold advantages, their evolution is also marked by intrinsic constraints warranting scrutiny. Non-invasiveness and high temporal resolution stand as hallmarks of EEG-based BCIs. These attributes empower seamless interaction with the brain's cognitive canvas. However, a caveat arises in the form of spatial resolution. EEG's measurement of electrical activity on the scalp distills activity remote from the neural core. The resultant signals traverse a labyrinth of influences, from skull thickness to scalp conductivity, subtly tinging measurement accuracy.
Figure 2 shows a raw EEG data profile as available from Brain Compute Software. For the sake of consistency, we have retraced their steps with EEG signal data as they did with fNIRS data. We observed that a dedicated library such as eegUtils might also have been used to attain similar results. It must be noted that such dedicated libraries are also capable of providing additional topologies as regards the dataset versus its mapping in the brain. However, such niche results come at the cost of specialising the framework for a specific methodology and leads to loss of general capabilities in the BCI system.
Susceptibility to artifacts emerges as a thorny challenge in EEG-based BCIs. The susceptibility to contamination by diverse noise sources – be it motion artifacts, eye blinks, or muscular contractions – complicates the demarcation between genuine brain signals and confounding interference. This reality introduces an intricacy that demands judicious signal processing.
Effective command control in EEG-based BCIs hinges upon rigorous user training. Mastering the generation of specific neural patterns linked to designated commands, be it cursor movement or prosthetic limb control, demands substantial effort and time investment. This learning curve underscores the cognitive effort required to harmonize intent with action. A critical limitation lies in EEG-based BCIs' reduced information content compared to counterparts like fMRI. While fMRI unveils brain region localization and activation specifics, EEG captures merely scalp-level electrical dynamics. This restricted information domain can hinder the decipherment of intricate cognitive processes or precise identification of implicated brain regions.
An ICA Model has been considered for the purposes of this review with source signals designated by columns of S, the mixing matrix is denoted by columns of M, and the noise signals are represented by E whereas zero mean columns are denoted by X. Its aim is to usually compute the unmixing matrix W in a manner that tcrossprod(X, W) denoted by Column S are as independent from other columns as possible. The goal is to find the orthogonal rotation matrix R such that the source signal is able to estimate S (= Y %*% R) [14] and are as independent as possible. [15] Additionally, the Infomax approach is able to calculate the orthogonal rotation matrix R that nearly maximizes the joint entropy of a nonlinear function. Also, the orthogonal rotation matrix R is computed using FastICA algorithm that again nearly maximizes the negentropy of the estimated source signals. Figure 3 displays brain maps after signal analysis and noise filtering activities.
In summation, EEG-based BCIs marshal a transformative narrative by harmonizing brain and machine. Nonetheless, their trajectory is shadowed by limitations. The challenge of spatial precision, the battle against artifacts, the exigent training requirements, and the information ceiling – these facets underscore the need for a judicious balance between potential and constraints. Despite these limitations, EEG-based BCIs hold their ground as potent tools across diverse domains, propelling scientific inquiry in medicine, neuroscience, and human-computer interaction. The pursuit of innovation in this intersection remains unwavering, as researchers strive to chart new vistas and conquer existing limitations in the landscape of EEG-based BCIs.
2.2. Functional-Magnetic Resonance Imaging (fMRI)
Functional Magnetic Resonance Imaging (fMRI) stands as a preeminent neuroimaging methodology, unravelling the intricate tapestry of brain activity through the lens of hemodynamic response. This technique capitalizes on the interplay between neural excitation and metabolic demands, offering insights into the neural symphony underpinning cognitive and motor functions. At its core, fMRI captures the dance of blood flow changes within the brain, reflective of underlying neural activity. The catalyst is the heightened metabolic requirements of activated neurons, prompting a surge in oxygen and nutrient delivery. This metabolic upsurge translates to an augmentation in blood flow, an effect termed the hemodynamic response.
In practice, fMRI unfolds as a collaborative endeavour between the subject and the scanner. The subject engages in tasks while the scanner, fortified by a potent magnetic field and radio waves, tracks blood flow oscillations. These oscillations metamorphose into vivid images of neural engagement, portraying the choreography of brain activity. This visual revelation lays bare the precise regions orchestrating a given task and unfurls the intricate interplay between these enclaves. Moreover, to counter the slow speed of the readings, acceleration techniques are applied on shallow learning, [16] deep learning [17] and ensemble learning [18,19,20] setups. A prominent asset of fMRI lies in its exquisite spatial resolution, a hallmark trait that unfurls the neural canvas in high definition. With spatial precision bordering on a few millimeters, fMRI excels in cartography of brain regions. This capability assumes particular importance in decoding neural circuits engaged in cognitive and motor tasks. Insights gleaned from fMRI have been pivotal in deciphering neural circuitry in various contexts, be it cognition, motion, or the perturbations induced by afflictions.
The non-invasive nature of fMRI emerges as another gem in its crown, rendering it a widely embraced and secure tool for probing the human brain. Unlike invasive techniques, fMRI circumvents surgical interventions, cementing its status as a low-risk procedure. This attribute equips researchers to navigate the neural landscapes of healthy individuals and patients grappling with neurological or psychiatric maladies. In concert with its spatial precision and safety, fMRI unfolds its versatility by embracing real-time exploration of brain function across a diverse spectrum of cognitive and motor activities. This expansive reach empowers fMRI to stand as a versatile sentinel, casting light upon the neural substrates of behavior and cognition.
More recently, EEG [21] and MEG [22] are also being analyzed together with fMRI to produce better temporal resolutions in results. A combination of results from all three is used in a study of memory processing wherein the details of localization, activation, and time course of a specific area of activation could be determined accurately. A software implementation for data classification of fMRI has been attempted within Grid Workflow environment. [23] In this paper, we attempt to review a modality encompassing grid workflow setup that can be easily adapted and scaled with any modality added with AI/ML capabilities. In essence, fMRI wields its magnetism to chart the ebbs and flows of neural choreography, revealing the hidden symphony of brain activity. Its spatial precision, non-invasiveness, and versatility weave a tapestry of insights that illuminate the contours of health and ailment within the human brain. As the human saga unfolds, fMRI remains a cornerstone, offering a non-invasive glimpse into the intricate drama of neural performance.
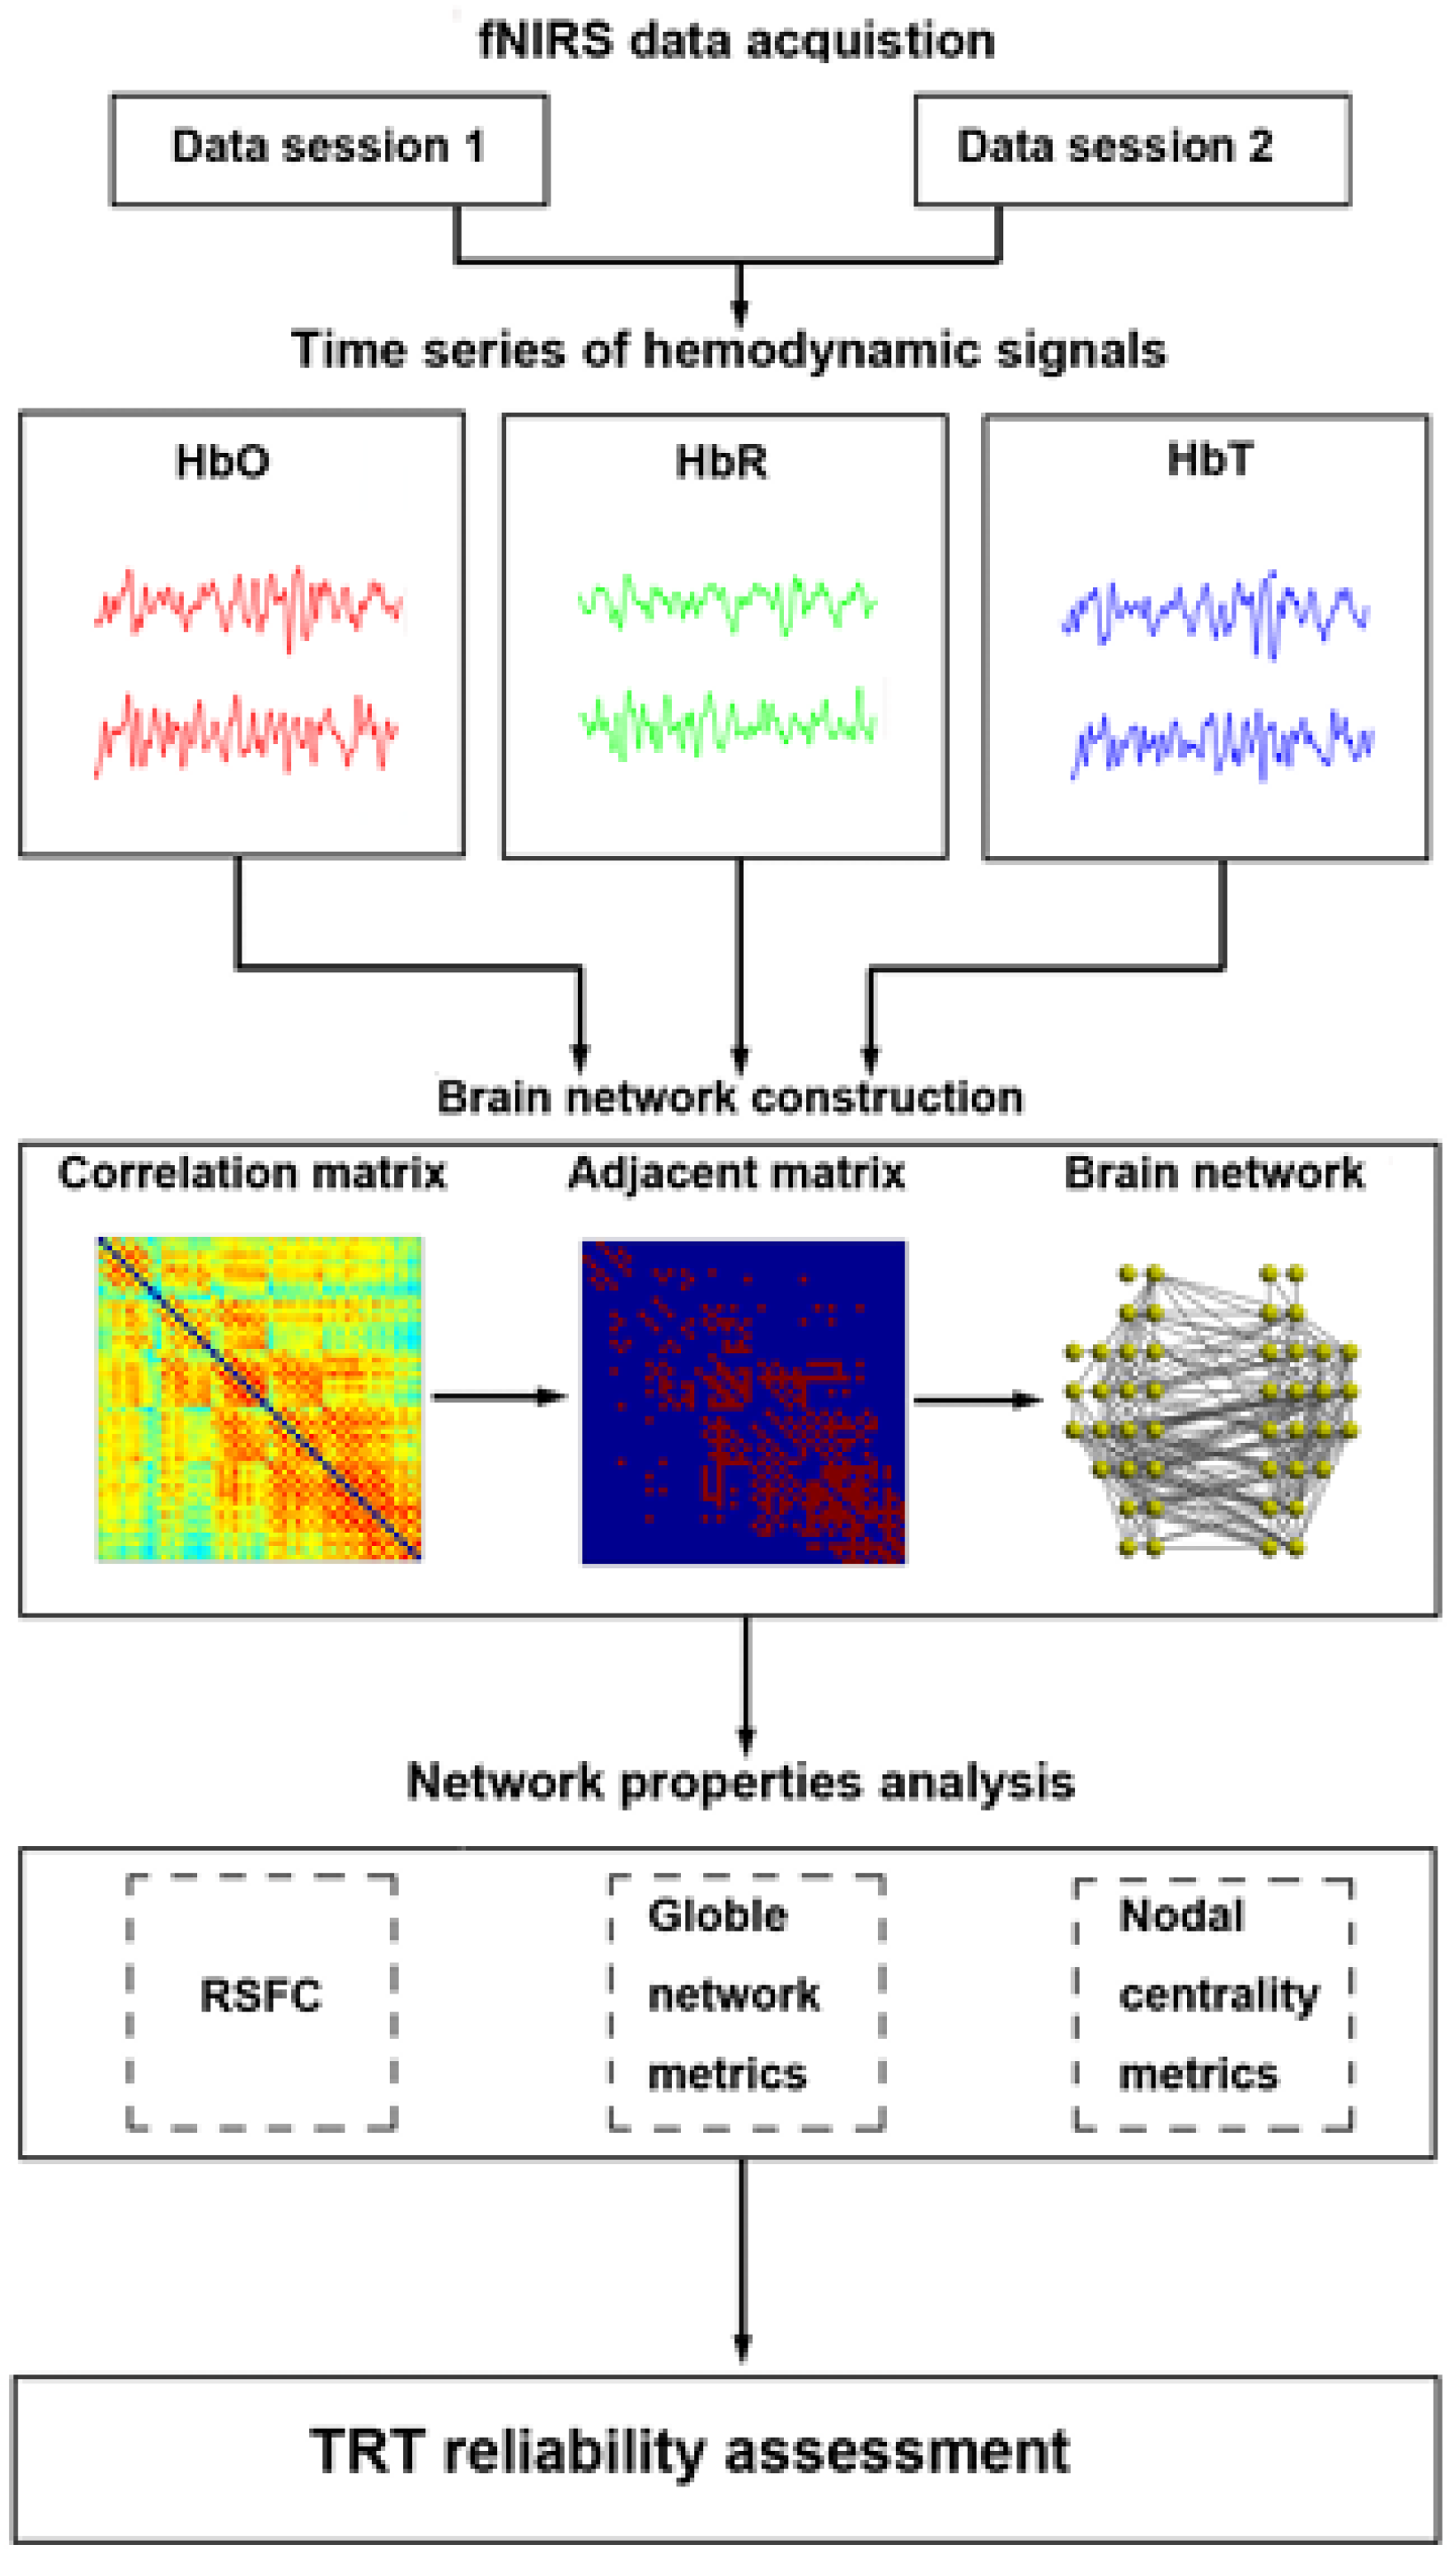
Figure 4.
Conventional fMRI analysis: BOLD response to target stimuli. (a) healthy controls (Talairach coordinates x=5, y=36, z=13). (b) subjects at clinical high risk for psychosis (Talairach coordinates x=5, y=36, z=10). Random effects analysis, P < .001 (Bonferroni corrected for multiple comparisons). SAG: sagittal; COR: coronary; TRA: transversal; A: anterior; P: posterior; R: right; L: left. [Source: Reproduced under terms of the CC-BY license. [24] Copyright 2016, Authors.].
Data Acquisition Approaches and Limitations with a Standalone Setup
Functional magnetic resonance imaging (fMRI) stands as a pioneering tool in forging brain-computer interfaces (BCIs) that bridge the chasm between mental states and external device control. While fMRI based BCIs unveil a constellation of strengths, they also tread a path punctuated by nuanced limitations. The fusion of fMRI with BCIs heralds a realm of promise, underscored by remarkable advantages. Paramount among these is fMRI's exceptional spatial resolution, unveiling neural orchestrations with exquisite detail. [25] Additionally, fMRI's unique prowess in peering into the depths of intricate brain structures enriches our understanding beyond the purview of alternative techniques.
However, this is accompanied by constraints warranting judicious contemplation. The temporal resolution of fMRI emerges as a limitation, capturing neural dynamics at a deliberate pace spanning seconds. Consequently, rapid mental state transitions, such as those underpinning motor control or language processing, prove challenging for fMRI based BCIs. Further, fMRI's susceptibility to motion artifacts introduces a layer of complexity that perturbs certain BCI applications. The landscape of fMRI based BCIs is further shaped by the complexity and costs they entail. The procurement and upkeep of fMRI scanners entail substantial financial investments, alongside the need for specialized personnel to navigate their operation. This amalgam renders the translation of fMRI based BCIs into everyday environments, like homes or workplaces, an intricate endeavor.
Ethical considerations add a profound layer of discourse. The ability of fMRI to divulge an individual's mental state raises ethical dilemmas about privacy and consent. The potential misuse of this sensitive information poses concerns of unwarranted inference into personal thoughts or intentions. This interplay of technological prowess and ethical stewardship underscores the need for a conscientious balance. [26] Amid these contours, fMRI based BCIs showcase encouraging strides in areas ranging from motor control to communication and cognitive enhancement. The trajectory of relentless research and development augurs a future where fMRI-based BCIs will seamlessly intertwine with clinical and research realms, enriching our understanding and shaping human-computer interaction.
The alliance between fMRI and BCIs offers an avenue of exploration, charting the fusion of neural states and external control. However, the expedition is not devoid of challenges. Careful calibration of potentials and limitations navigates a course toward a future where fMRI based BCIs coalesce with ethical diligence, technical ingenuity, and transformative application. As this journey unfolds, the horizon of fMRI based BCIs shines with the promise of shaping a dynamic nexus between human cognition and technological advancement.
There is a push towards development of non-invasive techniques for functional imaging of the brain. fMRI displays contrast differences in the Blood Oxygen Level Dependent (BOLD) signal wherein the differential contrast is observed due to variable blood flow in the grey and the white matter, where the latter receives greater blood flow. Figure 5 represents fMRI-readings from a 3D-image acquired for 152 time points.
2.3. Functional-Near Infrared Spectroscopy (fNIRS)
Functional Near-Infrared Spectroscopy (fNIRS) emerges as a pivotal non-invasive neuroimaging modality, sculpting insights through the dance of near-infrared light and cerebral blood flow. Rooted in the tenet that neural activity is entwined with hemodynamic shifts, fNIRS deciphers the neural script by monitoring the absorption of light within the brain. fNIRS is another non-invasive modality that is performed by imaging hemodynamic signals of brain tissues using near-infrared spectrum. It works by measuring haemoglobin concentration changes in the blood stream. [27] Distinct virtues mark fNIRS as a noteworthy contender in the neuroimaging arena. Its non-invasive nature, devoid of ionizing radiation, resonates as a harbinger of safety, making it universally palatable. The harmony between neural activity and hemodynamics finds resonance in fNIRS, forging a pathway to trace the ebb and flow of blood. This orchestration is unveiled by detecting fluctuations in the concentrations of oxygenated and deoxygenated hemoglobin, unraveling the neural narrative. Moreover, fNIRS is able to provide a better temporal resolution. [28], [29] Figure 6 shows various components of a fNIRS device.
The tapestry of fNIRS is embroidered with advantages that set it apart. Foremost is its temporal prowess, furnishing researchers with the ability to capture the nuances of brain activity in real-time. This dynamic window into neural choreography elucidates the symphony of cognition as it unfolds. The portability of fNIRS amplifies its utility, extending its reach from clinical domains to field studies, fostering flexibility in research endeavors. This modality is used in locomotory and ambulatory studies including yoga, [31] meditation, [32] robotic [33] and emotional [34] therapies. fNIRS is a virtuoso in unveiling the intricacies of deep brain structures that often evade other neuroimaging methodologies. The prefrontal cortex and the superior temporal gyrus, enclaves of cognitive richness, become accessible realms under fNIRS's gaze. Additionally, its robustness against movement artifacts renders it a preferred choice in studying infants and young children, circumventing the constraints that encumber EEG or fMRI. fNIRS stands out against fMRI in its portability and ability to filter out noise. Although, it provides a lower spatial resolution, fNIRS offers higher temporal resolutions and allows measurements of hemodynamic concentration changes with changing exertion of muscles. [35]
In concert, fNIRS emerges as a luminary, unraveling neural narratives in real-time with exquisite temporal fidelity and plunging into the enigmatic depths of the brain. Its non-invasive and transportable profile positions it as a versatile tool, finding its stride in clinical investigations, neurofeedback training, and sculpting the landscape of brain-computer interfaces. Amidst the symphony of neuroimaging methodologies, fNIRS's melodic notes resonate, tracing the cerebral rhythms that shape our cognitive tapestry. Each of these modalities have various stages of data acquisition, pre-processing and feature selection steps that allow the setup to filter and classify the input data from noise and amplify the same.
Figure 7 shows fNIRS workflow. The fNIRS workflow involves several key steps. First, researchers formulate their research question and design the study. Participants are then recruited and consented to that. In the pre-experiment phase, fNIRS probes are placed on the participant's scalp and calibrated if needed. During the experiment, data is collected while participants perform tasks or experience stimuli. Subsequently, collected fNIRS data is preprocessed to remove noise and transformed into hemoglobin concentration changes. Statistical analyses are applied to compare these changes between conditions. Interpreting the results involves relating hemodynamic patterns to the research question and existing literature. The implications and limitations of findings are discussed before drawing conclusions and considering future research directions.
Data Acquisition Approaches and Limitations with a Standalone Setup
Functional Near-Infrared Spectroscopy (fNIRS) emerges as a burgeoning modality in the realm of Brain-Computer Interfaces (BCIs), leveraging its hallmark attributes of exceptional temporal resolution and portability. In the harmonious interplay between fNIRS and BCIs, insights into neural dynamics are harnessed, propelling interactions between cognition and external devices.
fNIRS-based BCIs harness the dynamic landscape of blood oxygenation changes within the brain to decipher distinct mental states. This intimate connection between hemodynamics and cognition serves as the foundation for translating these changes into control signals, enabling users to seamlessly navigate computer interfaces and devices. The allure of fNIRS-based BCIs rests in their non-invasive nature, imbuing comfort and accessibility. Their portability further amplifies their utility, flexibly extending from clinical settings to diverse environments.
We have subsequently reviewed data processing by taking publicly loaded datasets against these action points and pushed that over R engine to visualize the datasets as shown in Figure 8. One of the limitations of this library is this package can only read raw csv files generated by Hitachi ETG-4000. [37] However, the package is under active development and further development for additional support of different file types that looks promising. Both R and python provide libraries with similar syntax that give almost equivalent output. However, python versions are more mature and are able to provide finer results as compared to its R counterpart. The performance of both the software packages is equivalent to each other without any notable difference. However, it should also be noted that for graphical user interfaces, R programs written in Shiny are much faster than the python graphical interface programs written in wx-widgets or tcl-Tk.
The data is subsequently segregated and normalized in the R-workbench. We have used SparklyR functions and fnirsr library designed by Eryk Walczak [37] to review BCI analytics workflow. However, alternate functions can also be used. The data is further subjected to cleaning and pre-processing to obtain noise-filtered clean channels as observed in Figure 9. fNIRS signal is likely to show a linear trend which can be removed. The linear trend can be removed from all channels (recommended) or from a single channel.
Additionally, the library also supports HOMER2 datasets that provide additional information that can help a researcher visualize the data in faceted time series plots. Using the functions, a graph can be denoised and merged to create a comparative study as shown in Figure 10. Profiling methods with publicly available EEG data are available just like it was performed for fNIRS dataset. [38] HOMER2 [39] and OptoNet II [40] provide MATLAB scripts used for analyzing fNIRS data. The libraries are able to provide estimates and maps of brain activation areas. The application has been in a constantly evolving state since the early 1990s. It started off as the Photon Migration Imaging toolbox, that was subsequently reshaped into HOMER1. The application has undergone considerable changes to be rebranded as HOMER2. The application has a GUI interface similar to its older version but with easier and better support for group analyses and re-configuration of the processing stream. Also, it allows users to integrate their custom algorithms into the processing stream.
The allure of fNIRS-based BCIs lies in their portability, non-invasiveness, and real-time insight into neural dynamics. However, the path forward is illuminated by the quest to augment specificity, accuracy, and resilience against noise. Future research endeavors must traverse the labyrinth of technological and methodological challenges, with the aim of unraveling the intricate symphony of cognition through fNIRS-based BCIs. In the evolving narrative of fNIRS-based BCIs, each limitation is a clarion call for innovation. As the precision of spatial localization and classification accuracy is refined, and as techniques to mitigate noise and artifacts advance, the symbiotic relationship between fNIRS and BCIs will burgeon, nurturing a landscape where thought meets action with unprecedented clarity and fidelity.
3. Integrated Setup for Advanced BCI
As the field of advanced BCIs continues to evolve, we can expect to see exciting applications that not only enhance our understanding of the brain but also improve the lives of individuals with neurological conditions, create more immersive entertainment experiences, and revolutionize human-computer interaction. The future of BCIs is filled with promise, and ongoing research and development will play a critical role in unlocking their full potential. Creating an integrated setup for advanced BCIs that combines fNIRS, EEG, and fMRI involves careful planning, specialized equipment, and robust synchronization methods. Neurovascular coupling is the phenomenon of a rise in cortical blood flow. It is a multi-step activity that encompasses all actions from stimulation of neurons to release transmitters that finally leads to vasoconstriction/dilation. Although associated to the same activity, EEG and fNIRS cover separate events in this cascade. The collaboration of these two methods offers a unique chance to examine cortical activity in an elaborate manner. EEG and fNIRS have very different but complementary temporal and spatial resolution. On one hand, cortical responses having high temporal resolution are detected by Evoked Potentials to a given stimulus, on the other hand fNIRS depends on that localization of changes in metabolism of hemoglobin with oxygen post activation. The combination of EEG and fNIRS is extremely symbiotic in nature as they add to each other’s information content. Moreover, both of these easy to setup and execute. fNIRS is also easy to combine with EEG given optical signal properties with the modalities not interfering with one another. Portability and robustness also play a big role in the symbiotic relationship of the two modalities. Placement sensors can be achieved in different manners. The first method is called adjacent positioning whereas the second method is called co-located measures. This method is limited to ring electrodes and requires transparent gel, which usually are non-conductive. As fNIRS and EEG measurements are recorded independently, it is important for simultaneous trigger synchronization with both data streams. [41] Below is an outline of the key components and considerations for such a setup.
3.1. EEG-fMRI Integration
An exact synchronous action is attained with the NIRx Parallel Port Replicator, that is used to stimulate the incoming signal via USB ports and splits a single DB-25 (parallel port) input to four or more outputs. A general setup is represented in Figure 11.
eegkit [43] is an R library that is powerful and provides precise results similar to its Python counterpart. It is a toolkit for Electroencephalography Data and uses a fast-discrete Fourier transform (eegfft) to calculate the power spectral density of EEG data and generates a plot of the power estimate using the plot (single channel) or image bar (multi-channel) function. The function employs stratigraphic series for bandpass filtering. Generally, the first column is designated as the location (e.g., depth), whereas the second column ought to be data value. Additionally, there is a plethora of other functions that perform multiple functionalities. Padfac function is used to Pad a specific column with zeros to (padfac x npts) points, where npts is the original number of data points. Flow gives the lowest frequency to bandpass, and fhigh provides the highest frequency to bandpass. win designates the Window type for bandpass filter: 0 translates to rectangular, 1 as Gaussian and 2 as Cosine-tapered window or otherwise known as the Tukey window. Similarly, alpha that translates as inverse of standard deviation and acts as a measure of the width of the Dirichlet kernel, gives the Gaussian window parameter. [44] Also, p provides the Cosine-tapered (Tukey) window parameter, where p is the percent of the data series tapered parameter. The demean function is used to remove mean from data series whereas detrend function removes linear trend from data series. Similarly, addmean function is used to add mean value to bandpass result and the output function is used to show the output for either filtered series or bandpass filter window. The smallest frequency for plotting id determined using xmin function whereas xmax function gives the opposite, that is the largest frequency for plotting. A summary of plots can be visualized using the genplot function. Figure 12 displays band pass filtered and normalized EEG data in R.
While fNIRS-based BCIs unveil a promising horizon, they are not devoid of limitations. One pivotal constraint lies in the modest spatial resolution of fNIRS, rendering the precise localization of neural activity a challenge, in contrast to more robust techniques like fMRI. This intricacy poses a hurdle in the endeavor to attain specificity within BCIs.
Classification accuracy emerges as another arena of contention. While fNIRS-based BCIs have demonstrated potential in detecting mental states like concentration and relaxation, achieving high accuracy for intricate tasks such as speech recognition or motor control remains elusive. The interplay of individual neural variations constrained spatial and temporal resolution, and task complexity collectively contribute to this challenge. Noise and artifacts cast a further veil of complexity. Motion artifacts and physiological noise introduce potential distortions that can erode the accuracy and reliability of fNIRS signals. Although signal processing and machine learning techniques offer mitigation strategies, the intrinsic vulnerability persists, necessitating ongoing vigilance.
3.2. EEG-fNIRS Integration
EEG records brain activity via external electrodes placed on the scalp whereas fnirs measures chngs in hemoglobin concentrations using light sensors albeit placed at similar location on the scalp. EEG signals are filtered to remove electrical noise mostly using high and low pass filters. On the other hand, fNIRS filters correct for motion artifacts and physiological noise such as cardiac and respiratory rhythms. During the feature extraction step, EEG extracts feature like spectral power, event-related potentials (ERPs), or connectivity measures whereas fNIRS extracts features such as changes in oxygenated and deoxygenated hemoglobin levels. All these show that combining EEG and fNIRS does not lead to any conflicts however can help alleviate shortcomings of both. EEG and fNIRS can be combined to capture complementary information about neural and hemodynamic activity. Fusion techniques can also be applied that include concatenation, weighted averaging, or using them as inputs to a machine learning model. A combined schematic has been represented in Figure 13.
Classification models can be trained sing the integrated EEG-fNIRS features using labelled data from cognitive tasks to classify brain states or conditions. Similarly, characterization of brain activity can be done by obtaining spatial information from EEG about localized neural activity. Then fNIRS can be used to capture changes in oxygenation, indicating increase or decrease in brain activity. This combined data can provide a more comprehensive view of cognitive processes.
3.3. fMRI-fNIRS Integration
The integration of fMRI and fNIRS data culminates in a detailed comprehension of brain function, harmonizing profound insights into neural dynamics furnished by fMRI with hemodynamic revelations from fNIRS. This union finds applications in cognitive exploration, clinical diagnostics, and propelling our insights into the symbiosis of brain and behavior. A synergy in signal acquisition can be achieved as fMRI captures neural activity with the aid of powerful magnetic fields whereas fNIRS quantifies hemoglobin concentrations by leveraging near-infrared light sensors. The alignment of fMRI and fNIRS data in spatial dimensions ensures their correspondence within specific brain regions. Co-registering these data enhances the fidelity of interpreting combined observations.
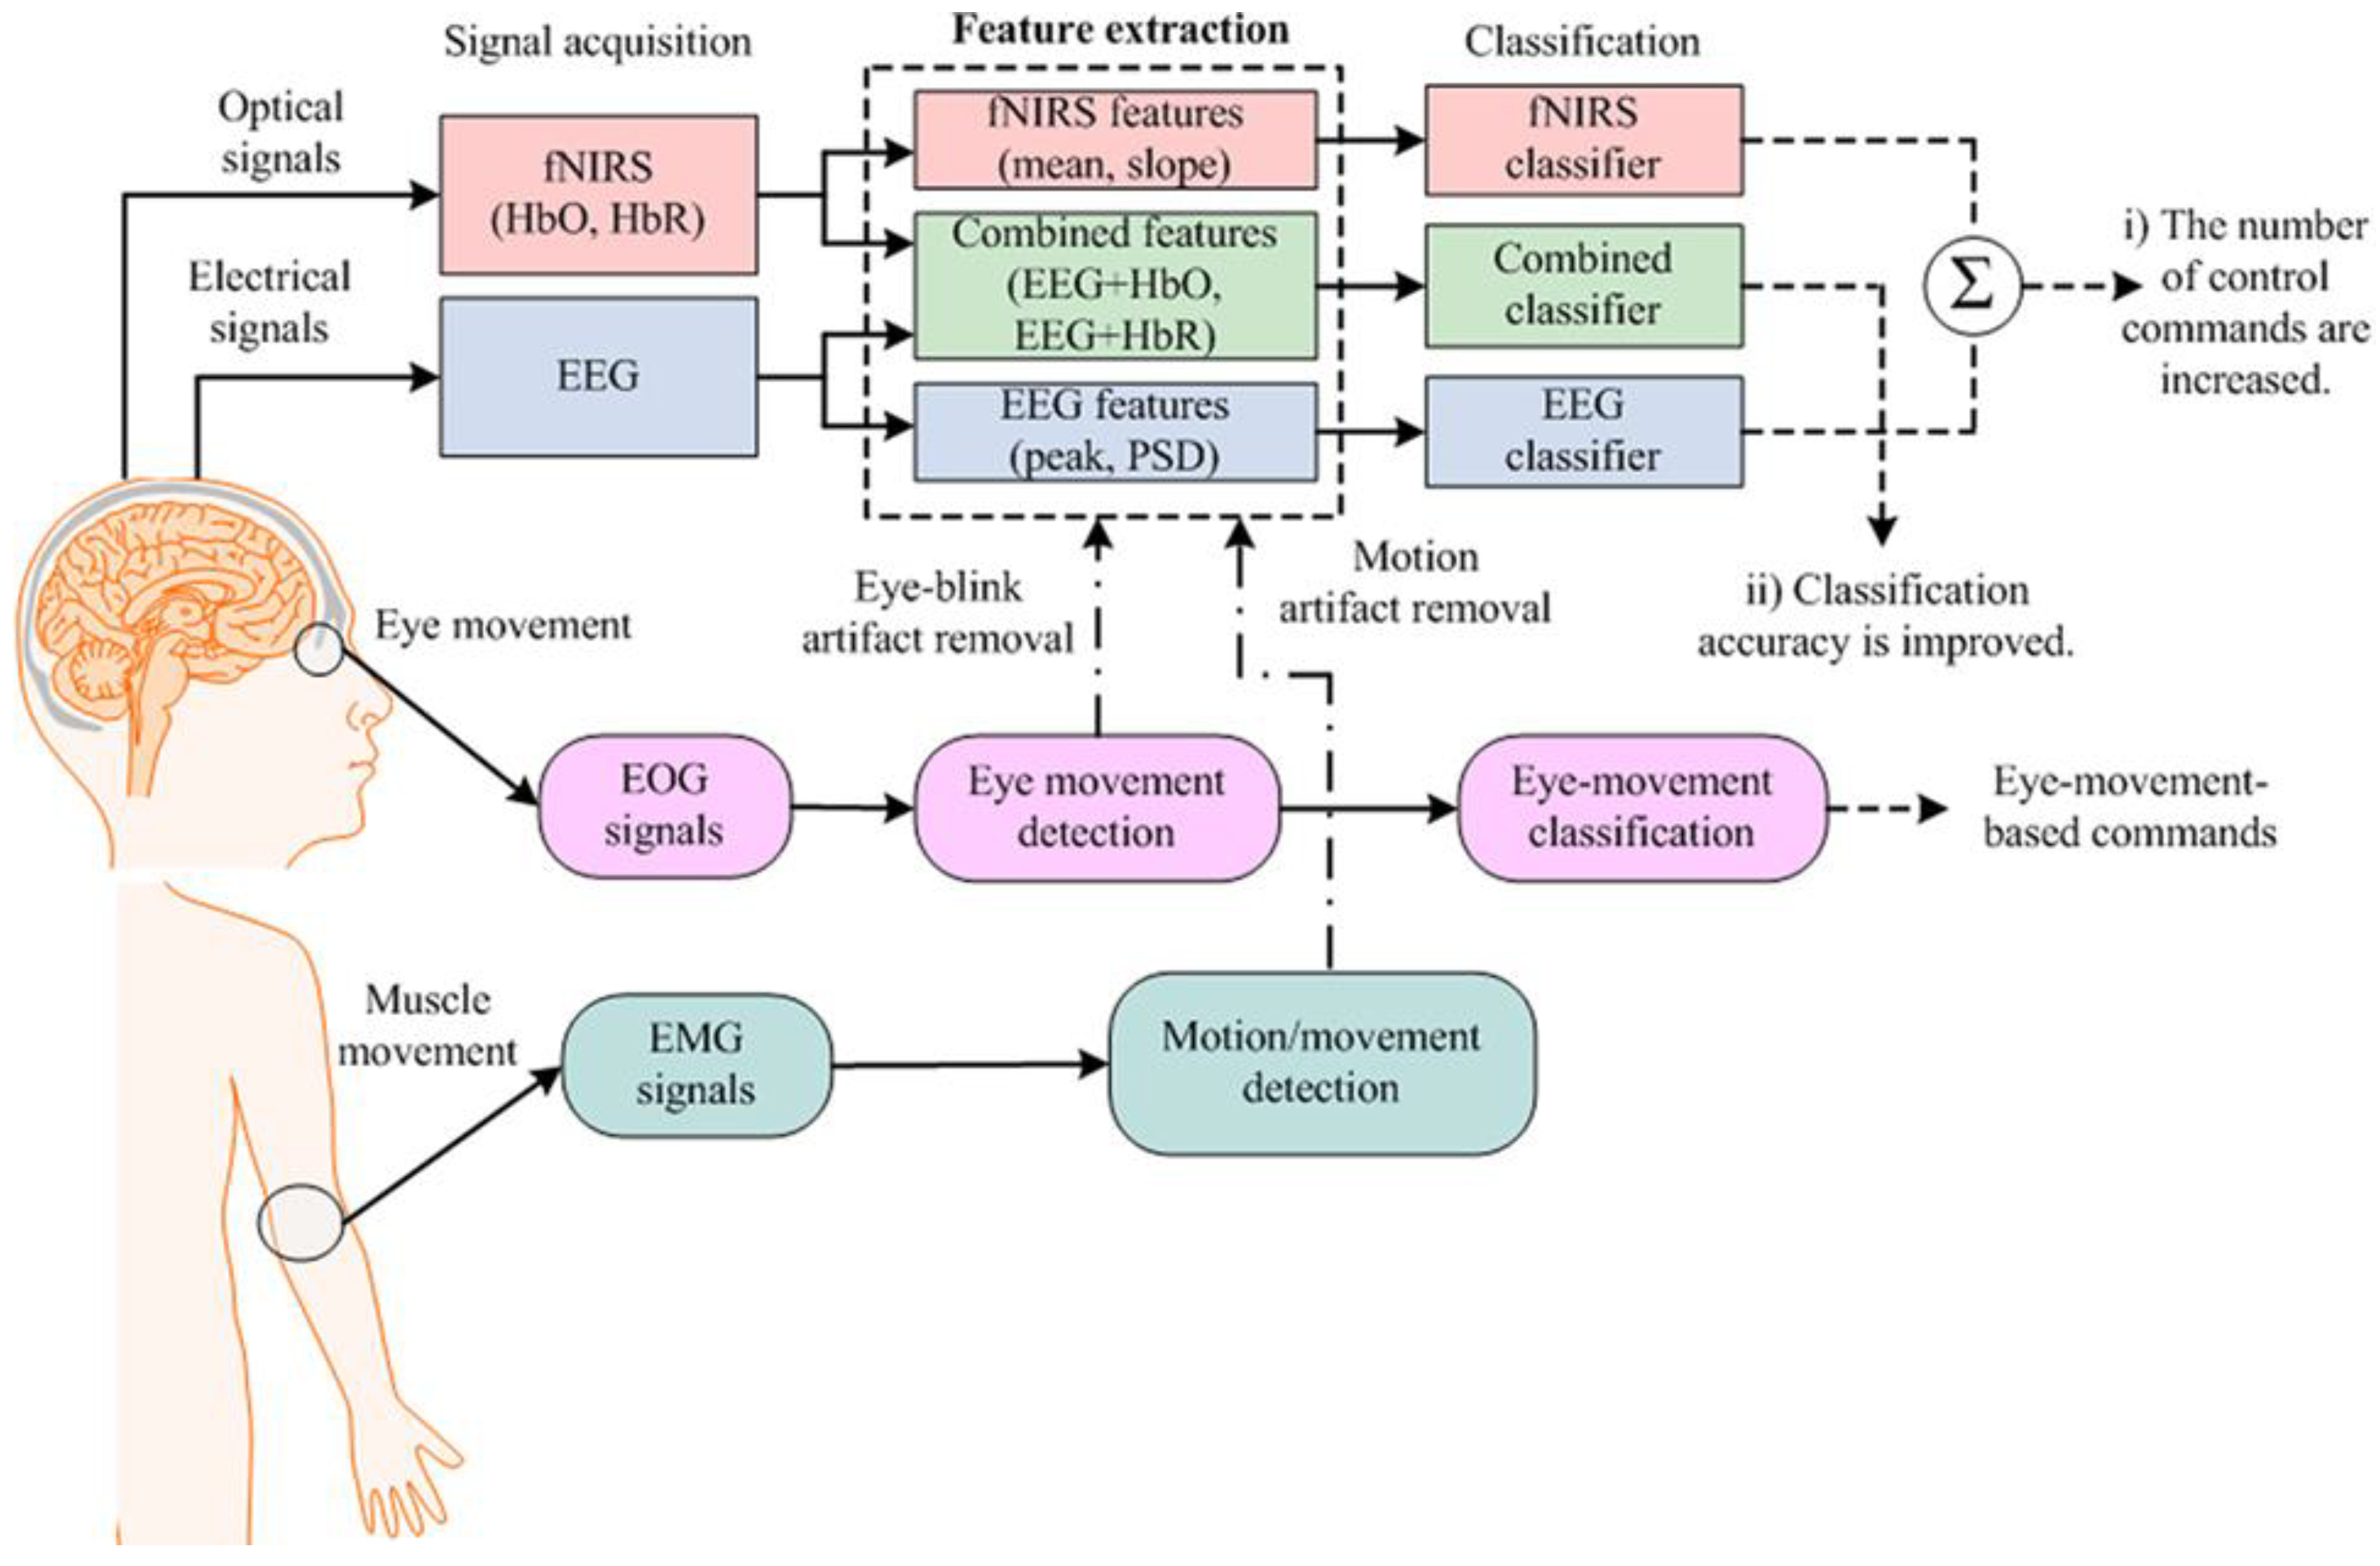
Achieving temporal synchrony between fMRI and fNIRS data is crucial to accurately timestamp events. The amalgamation of fMRI attributes (e.g., BOLD activation maps) and fNIRS traits (e.g., oxygenation dynamics) generates a more nuanced perspective during the Feature Extraction phase. Employing advanced analytical techniques uncovers correlations and interplays between fMRI and fNIRS signals. Interpreting the unified dataset yields insights into the interplay between neural dynamics and hemodynamic alterations. Integrative fMRI-fNIRS configurations enable real-time neurofeedback, Brain-Computer Interfaces (BCIs), and examination of cerebral states during tasks. This also helps to address disparities in the spatial and temporal resolutions inherent in fMRI and fNIRS methodologies. Figure 14 displays a workflow of the hybrid fMRI-fNIRS setup.
4. Discussion
Integration of multiple modalities, such as fNIRS, EEG, and fMRI amelirorate the limitations that the individual modalities suffer from as well as improve the combined benefits. Different modalities (e.g., fNIRS, EEG, and fMRI) have different strengths and weaknesses in measuring brain activity. [47] Integrating multiple modalities can improve the accuracy and precision of BCI performance. Such as, fNIRS and EEG can be used together to provide both spatial and temporal information about brain activity. [48] Whereas fNIRS has high temporal resolution (in the order of milliseconds) and can be used to measure brain activity in real time. [49] However, fNIRS has limited spatial resolution, and it is susceptible to motion artifacts and noise from systemic physiological activity. While fMRI has high spatial resolution but limited temporal resolution.
5. Conclusions
The canvas of BCI applications extends far and wide, encompassing clinical interventions, assistive technologies, and immersive gaming and entertainment domains. These applications epitomize the versatility of BCIs, from restoring motor function in paralysis patients to augmenting cognitive abilities in the neurotypical populace. BCIs also stand poised to revolutionize interactive experiences in the realm of gaming and entertainment. Each modality has a different spatial and temporal resolution, which can be combined to provide a more comprehensive picture of brain activity. [50] We have explored various hybrid modalities in their earlier studies [52,53,54,55,56,57] out of which EEG-fNIRS stands out [51,58,59,60]. This review has outlined the myriad merits stemming from multimodal integration, encompassing heightened spatial and temporal resolution, diminished susceptibility to noise and artifacts, and augmented precision. In essence, this comprehensive review has traversed the contours of fNIRS, EEG, and fMRI modalities, elucidating their principles, potential, and integration possibilities in advanced BCIs. By unveiling the benefits and complexities of multimodal fusion and illustrating diverse application scenarios, this paper contributes to the nascent narrative of BCIs. As the trajectory of BCIs continues to evolve, future research endeavors should pivot towards refining multimodal integration methods and exploring new horizons for advanced BCIs across diverse domains.
Author Contributions
S.G.: Content planning and writing of the manuscript. P.S.P., A.M., S.P.S.: Formal analysis. D.M. and B.G: Review and validation. P.P.: Planning and supervision. All authors have read and agreed to the published version of the manuscript.
Funding
This research received no external funding.
Institutional Review Board Statement
Not applicable.
Informed Consent Statement
Not applicable.
Data Availability Statement
Not applicable.
Acknowledgments
DM acknowledges the support from Department of Biophysics and Radiation Biology at Semmelweis University. P.P. and B.G. acknowledge the support from Lee Kong Chian School of Medicine and Data Science and the AI Research (DSAIR) Centre of NTU and the support from the Cognitive Neuro Imaging Centre (CONIC) at NTU.
Conflicts of Interest
The authors declare no conflicts of interest.
References
- D. Y. Lee, J. H. Jeong, K. H. Shim, and D. J. Kim, “Classification of Upper Limb Movements Using Convolutional Neural Network with 3D Inception Block,” 8th Int. Winter Conf. Brain-Computer Interface, BCI 2020, 2020. [CrossRef]
- C. Guger, B. Allison, and E. C. Leuthardt, Brain-Computer Interface A State-of-the-Art Summary 2. 2015. [CrossRef]
- H. Il Suk, S. Fazli, J. Mehnert, K. R. Müller, and S. W. Lee, “Predicting BCI subject performance using probabilistic spatio-temporal filters,” PLoS One, vol. 9, no. 2, 2014. [CrossRef]
- E. Musk and Neuralink, “An integrated brain-machine interface platform with thousands of channels,” bioRxiv, p. 703801, 2019. [CrossRef]
- A. Rahman et al., “Multimodal EEG and Keystroke Dynamics Based Biometric System Using Machine Learning Algorithms,” IEEE Access, 2021. [CrossRef]
- Y. Cui and D. Wu, “EEG-Based Driver Drowsiness Estimation Using Convolutional Neural Networks,” Lect. Notes Comput. Sci. (including Subser. Lect. Notes Artif. Intell. Lect. Notes Bioinformatics), vol. 10635 LNCS, pp. 822–832, 2017. [CrossRef]
- S. Zolfaghari, T. Yousefi Rezaii, S. Meshgini, A. Farzamnia, and L. Chung Fan, “Speed Classification of Upper Limb Movements Through EEG Signal for BCI Application,” IEEE Access, 2021. [CrossRef]
- N. S. E. M. Noor and H. Ibrahim, “Machine Learning Algorithms and Quantitative Electroencephalography Predictors for Outcome Prediction in Traumatic Brain Injury: A Systematic Review,” IEEE Access, vol. 8, pp. 102075–102092, 2020. [CrossRef]
- S. Casarotto et al., “The rt-TEP tool: real-time visualization of TMS-evoked potentials to maximize cortical activation and minimize artifacts,” 2021. [CrossRef]
- S. Baines, I. S. Hensels, and D. Talmi, “An EEG study on the effect of being overweight on anticipatory and consummatory reward in response to pleasant taste stimuli,” 2021. [CrossRef]
- A. Sundaresan, B. Penchina, S. Cheong, V. Grace, A. Valero-Cabré, and A. Martel, “Evaluating deep learning EEG-based mental stress classification in adolescents with autism for breathing entrainment BCI,” Brain Informatics, 2021. [CrossRef]
- C. Gramfort et al., “MEG and EEG data analysis with MNE-Python,” Front. Neurosci., vol. 7, no. 1, p. 267, 2013. [CrossRef]
- G. E. Strangman, Q. Zhang, and T. Zeffiro, “Near-infrared neuroimaging with NinPy,” Front. Neuroinform., vol. 3, no. MAY, 2009. [CrossRef]
- D. Langlois, S. Chartier, and D. Gosselin, “An Introduction to Independent Component Analysis: InfoMax and FastICA algorithms,” Tutor. Quant. Methods Psychol., 2010. [CrossRef]
- Daubechies et al., “Independent component analysis for brain fMRI does not select for independence,” Proc. Natl. Acad. Sci. U. S. A., 2009. [CrossRef]
- R. Islam et al., “Emotion Recognition From EEG Signal Focusing on Deep Learning and Shallow Learning Techniques,” IEEE Access, 2021. [CrossRef]
- S. Xiong et al., “MRI-based brain tumor segmentation using FPGA-accelerated neural network,” BMC Bioinformatics, 2021. [CrossRef]
- Y. Zhu, Y. Li, J. Lu, and P. Li, “EEGNet With Ensemble Learning to Improve the Cross-Session Classification of SSVEP Based BCI From Ear-EEG,” IEEE Access, 2021. [CrossRef]
- M. Sharma, J. Tiwari, V. Patel, and U. R. Acharya, “Automated Identification of Sleep Disorder Types Using Triplet Half-Band Filter and Ensemble Machine Learning Techniques with EEG Signals,” Electronics, 2021. [CrossRef]
- B. H. Lee, J. H. Jeong, and S. W. Lee, “SessionNet: Feature Similarity-Based Weighted Ensemble Learning for Motor Imagery Classification,” IEEE Access, vol. 8, pp. 134524–134535, 2020. [CrossRef]
- R. Scheeringa, M. Bonnefond, T. Van Mourik, O. Jensen, D. G. Norris, and P. J. Koopmans, “Relating neural oscillations to laminar fMRI connectivity,” bioRxiv, p. 2020.09.18.303263, 2020, [Online]. Available: https://doi.org/10.1101/2020.09.18.303263. [CrossRef]
- O. Hiwaki, “Novel Technique for Noninvasive Detection of Localized Dynamic Brain Signals by Using Transcranial Static Magnetic Fields,” IEEE J. Transl. Eng. Heal. Med., 2020. [CrossRef]
- S. Pandey, W. Voorsluys, M. Rahman, R. Buyya, J. Dobson, and K. Chiu, “CONCURRENCY AND COMPUTATION: PRACTICE AND EXPERIENCE A Grid Workflow Environment for Brain Imaging Analysis on Distributed Systems,” 2009.
- G. Leicht et al., “EEG-Informed fMRI Reveals a Disturbed Gamma-Band-Specific Network in Subjects at High Risk for Psychosis,” Schizophr. Bull., vol. 42, no. 1, pp. 239–249, 2016. [CrossRef]
- D. Scheinost et al., “Ten simple rules for predictive modeling of individual differences in neuroimaging,” NeuroImage. 2019. [CrossRef]
- Martisius, Data Acquisition and Signal Processing Methods for Brain – Computer Interfaces. 2016.
- F. Irani, S. M. Platek, S. Bunce, A. C. Ruocco, and D. Chute, “Functional near infrared spectroscopy (fNIRS): An emerging neuroimaging technology with important applications for the study of brain disorders,” Clin. Neuropsychol., vol. 21, no. 1, pp. 9–37, 2007. [CrossRef]
- M. Grohol, “What is Functional Near-Infrared Spectroscopy?,” pp. 1–3, 2017.
- V. Belluscio et al., “Modifications in Prefrontal Cortex Oxygenation in Linear and Curvilinear Dual Task Walking: A Combined fNIRS and IMUs Study,” 2021. [CrossRef]
- S. Deepeshwar, S. A. Vinchurkar, N. K. Visweswaraiah, and H. R. Nagendra, “Hemodynamic responses on prefrontal cortex related to meditation and attentional task,” Front. Syst. Neurosci., vol. 8, no. FEB, 2015. [CrossRef]
- D. Jiang, Z. Liu, and G. Sun, “The Effect of Yoga Meditation Practice on Young Adults’ Inhibitory Control: An fNIRS Study,” Front. Hum. Neurosci., 2021. [CrossRef]
- Annen et al., “Mapping the functional brain state of a world champion freediver in static dry apnea,” Brain Struct. Funct., pp. 1–24, 2021. [CrossRef]
- D. H. Kim and K. Lee, “Increasing Motor Cortex Activation During Grasping Via Novel Robotic Mirror Hand Therapy: A Pilot fNIRS Study,” 2021.
- T. Boon Tang, J. Sheng Chong, M. Kiguchi, T. Funane, and C.-K. Lu, “Detection of Emotional Sensitivity Using fNIRS Based Dynamic Functional Connectivity,” IEEE Trans. Neural Syst. Rehabil. Eng., 2021. [CrossRef]
- A. Yücel, J. J. Selb, T. J. Huppert, M. A. Franceschini, and D. A. Boas, “Functional Near Infrared Spectroscopy: Enabling routine functional brain imaging,” Curr. Opin. Biomed. Eng., vol. 4, pp. 78–86, 2017. [CrossRef]
- H. Niu et al., “Test-Retest Reliability of Graph Metrics in Functional Brain Networks: A Resting-State fNIRS Study,” PLoS One, vol. 8, no. 9, 2013. [CrossRef]
- E. Walczak, “Removing triggers from Hitachi ETG-4000 fNIRS recordings,” https://walczak.org/2018/04/removing-triggers-from-hitachi-etg-4000-fnirs-recordings/, 2019. https://walczak.org/.
- Khalili Ardali, A. Rana, M. Purmohammad, N. Birbaumer, and U. Chaudhary, “Semantic and BCI-performance in completely paralyzed patients: Possibility of language attrition in completely locked in syndrome,” Brain Lang., vol. 194, no. May, pp. 93–97, 2019. [CrossRef]
- D. Homer, Users ’ s Guide. 2012. https://homer-fnirs.org/documentation/.
- Gihyoun Lee; Ji-Su Park; Jungsoo Lee; Jinuk Kim; Young-Jin Jung; Yun-Hee Kim, “OptoNet II: An Advanced MATLAB-Based Toolbox for Functional Cortical Connectivity Analysis With Surrogate Tests Using fNIRS,” IEEE Access, 2020. [CrossRef]
- P. Padmanabhan, A. M. Nedumaran, S. Mishra, G. Pandarinathan, G. Archunan, and B. Gulyás, “The Advents of Hybrid Imaging Modalities: A New Era in Neuroimaging Applications,” Adv. Biosyst., vol. 1, no. 8, pp. 1–17, 2017. [CrossRef]
- G. Lioi et al., “Simultaneous EEG-fMRI during a neurofeedback task, a brain imaging dataset for multimodal data integration,” Sci. Data, vol. 7, no. 1, pp. 1–15, 2020. [CrossRef]
- E. Helwig and <helwig@umn Edu> Maintainer, “Package ‘eegkit’ Title Toolkit for Electroencephalography Data,” R Packag. version, 2015.
- R. A. Haddad and A. N. Akansu, “A Class of Fast Gaussian Binomial Filters for Speech and Image Processing,” IEEE Trans. Signal Process., 1991. [CrossRef]
- M. Chincarini et al., “Reliability of fNIRS for noninvasive monitoring of brain function and emotion in sheep,” Nanosci. Technol. [CrossRef]
- S. Hong and M. J. Khan, “Hybrid brain-computer interface techniques for improved classification accuracy and increased number of commands: A review,” Front. Neurorobot., vol. 11, no. JUL, 2017. [CrossRef]
- A. Kübler, V. K. Mushahwar, L. R. Hochberg, and J. P. Donoghue, “BCI Meeting 2005 - Workshop on clinical issues and applications,” 2006. [CrossRef]
- P. Buccino, H. O. Keles, and A. Omurtag, “Hybrid EEG-fNIRS asynchronous brain-computer interface for multiple motor tasks,” PLoS One, vol. 11, no. 1, 2016. [CrossRef]
- W. Yoon, S. J. Roberts, M. Dyson, and J. Q. Gan, “2009 Special Issue Adaptive classification for Brain Computer Interface systems using Sequential Monte Carlo sampling,” Neural Networks, vol. 22, pp. 1286–1294, 2009. [CrossRef]
- N. Belkacem, N. Jamil, J. A. Palmer, S. Ouhbi, and C. Chen, “Brain Computer Interfaces for Improving the Quality of Life of Older Adults and Elderly Patients,” Front. Neurosci. [CrossRef]
- Ortega and A. A. Faisal, “Deep learning multimodal fNIRS and EEG signals for bimanual grip force decoding,” J. Neural Eng., vol. 18, no. 4, p. 0460e6, 2021. [CrossRef]
- Alhudhaif, “An effective classification framework for brain-computer interface system design based on combining of fNIRS and EEG signals,” PeerJ Comput. Sci., vol. 7, pp. 1–24, 2021. [CrossRef]
- S. Amiri, R. Fazel-Rezai, and V. Asadpour, “A review of hybrid brain-computer interface systems,” Adv. Human-Computer Interact., vol. 2013, 2013. [CrossRef]
- G. Pandarinathan, S. Mishra, A. Nedumaran, P. Padmanabhan, and B. Gulyás, “The Potential of Cognitive Neuroimaging: A Way Forward to the Mind-Machine Interface,” J. Imaging, 2018. [CrossRef]
- V. Rawji, I. Kaczmarczyk, L. Rocchi, P. Y. Fong, J. C. Rothwell, and N. Sharma, “Preconditioning stimulus intensity alters paired-pulse tms evoked potentials,” Brain Sci., vol. 11, no. 3, pp. 1–13, 2021. [CrossRef]
- A. Y. Revell et al., “White Matter Signals Reflect Information Transmission Between Brain Regions During Seizures,” 2021. [CrossRef]
- R. Mareček et al., “Automated fusion of multimodal imaging data for identifying epileptogenic lesions in patients with inconclusive magnetic resonance imaging,” Hum. Brain Mapp., vol. 42, no. 9, pp. 2921–2930, 2021. [CrossRef]
- J. Uchitel, E. E. Vidal-Rosas, R. Cooper J., and H. Zhao, “Wearable, Integrated EEG–fNIRS Technologies: A Review,” Sensors, 2021. [CrossRef]
- N. Hollenstein et al., “Decoding EEG Brain Activity for Multi-Modal Natural Language Processing,” Front. Hum. Neurosci., 2021. [CrossRef]
- Taikyeong Jeong, “Time-Series Data Classification and Analysis Associated With Machine Learning Algorithms for Cognitive Perception and Phenomenon,” IEEE Access, 2020. [CrossRef]
Figure 1.
EEG action potential readings in R. [Source: Self drawn with R-server hosted at http://sayantan.xyz:7779/].
Figure 1.
EEG action potential readings in R. [Source: Self drawn with R-server hosted at http://sayantan.xyz:7779/].
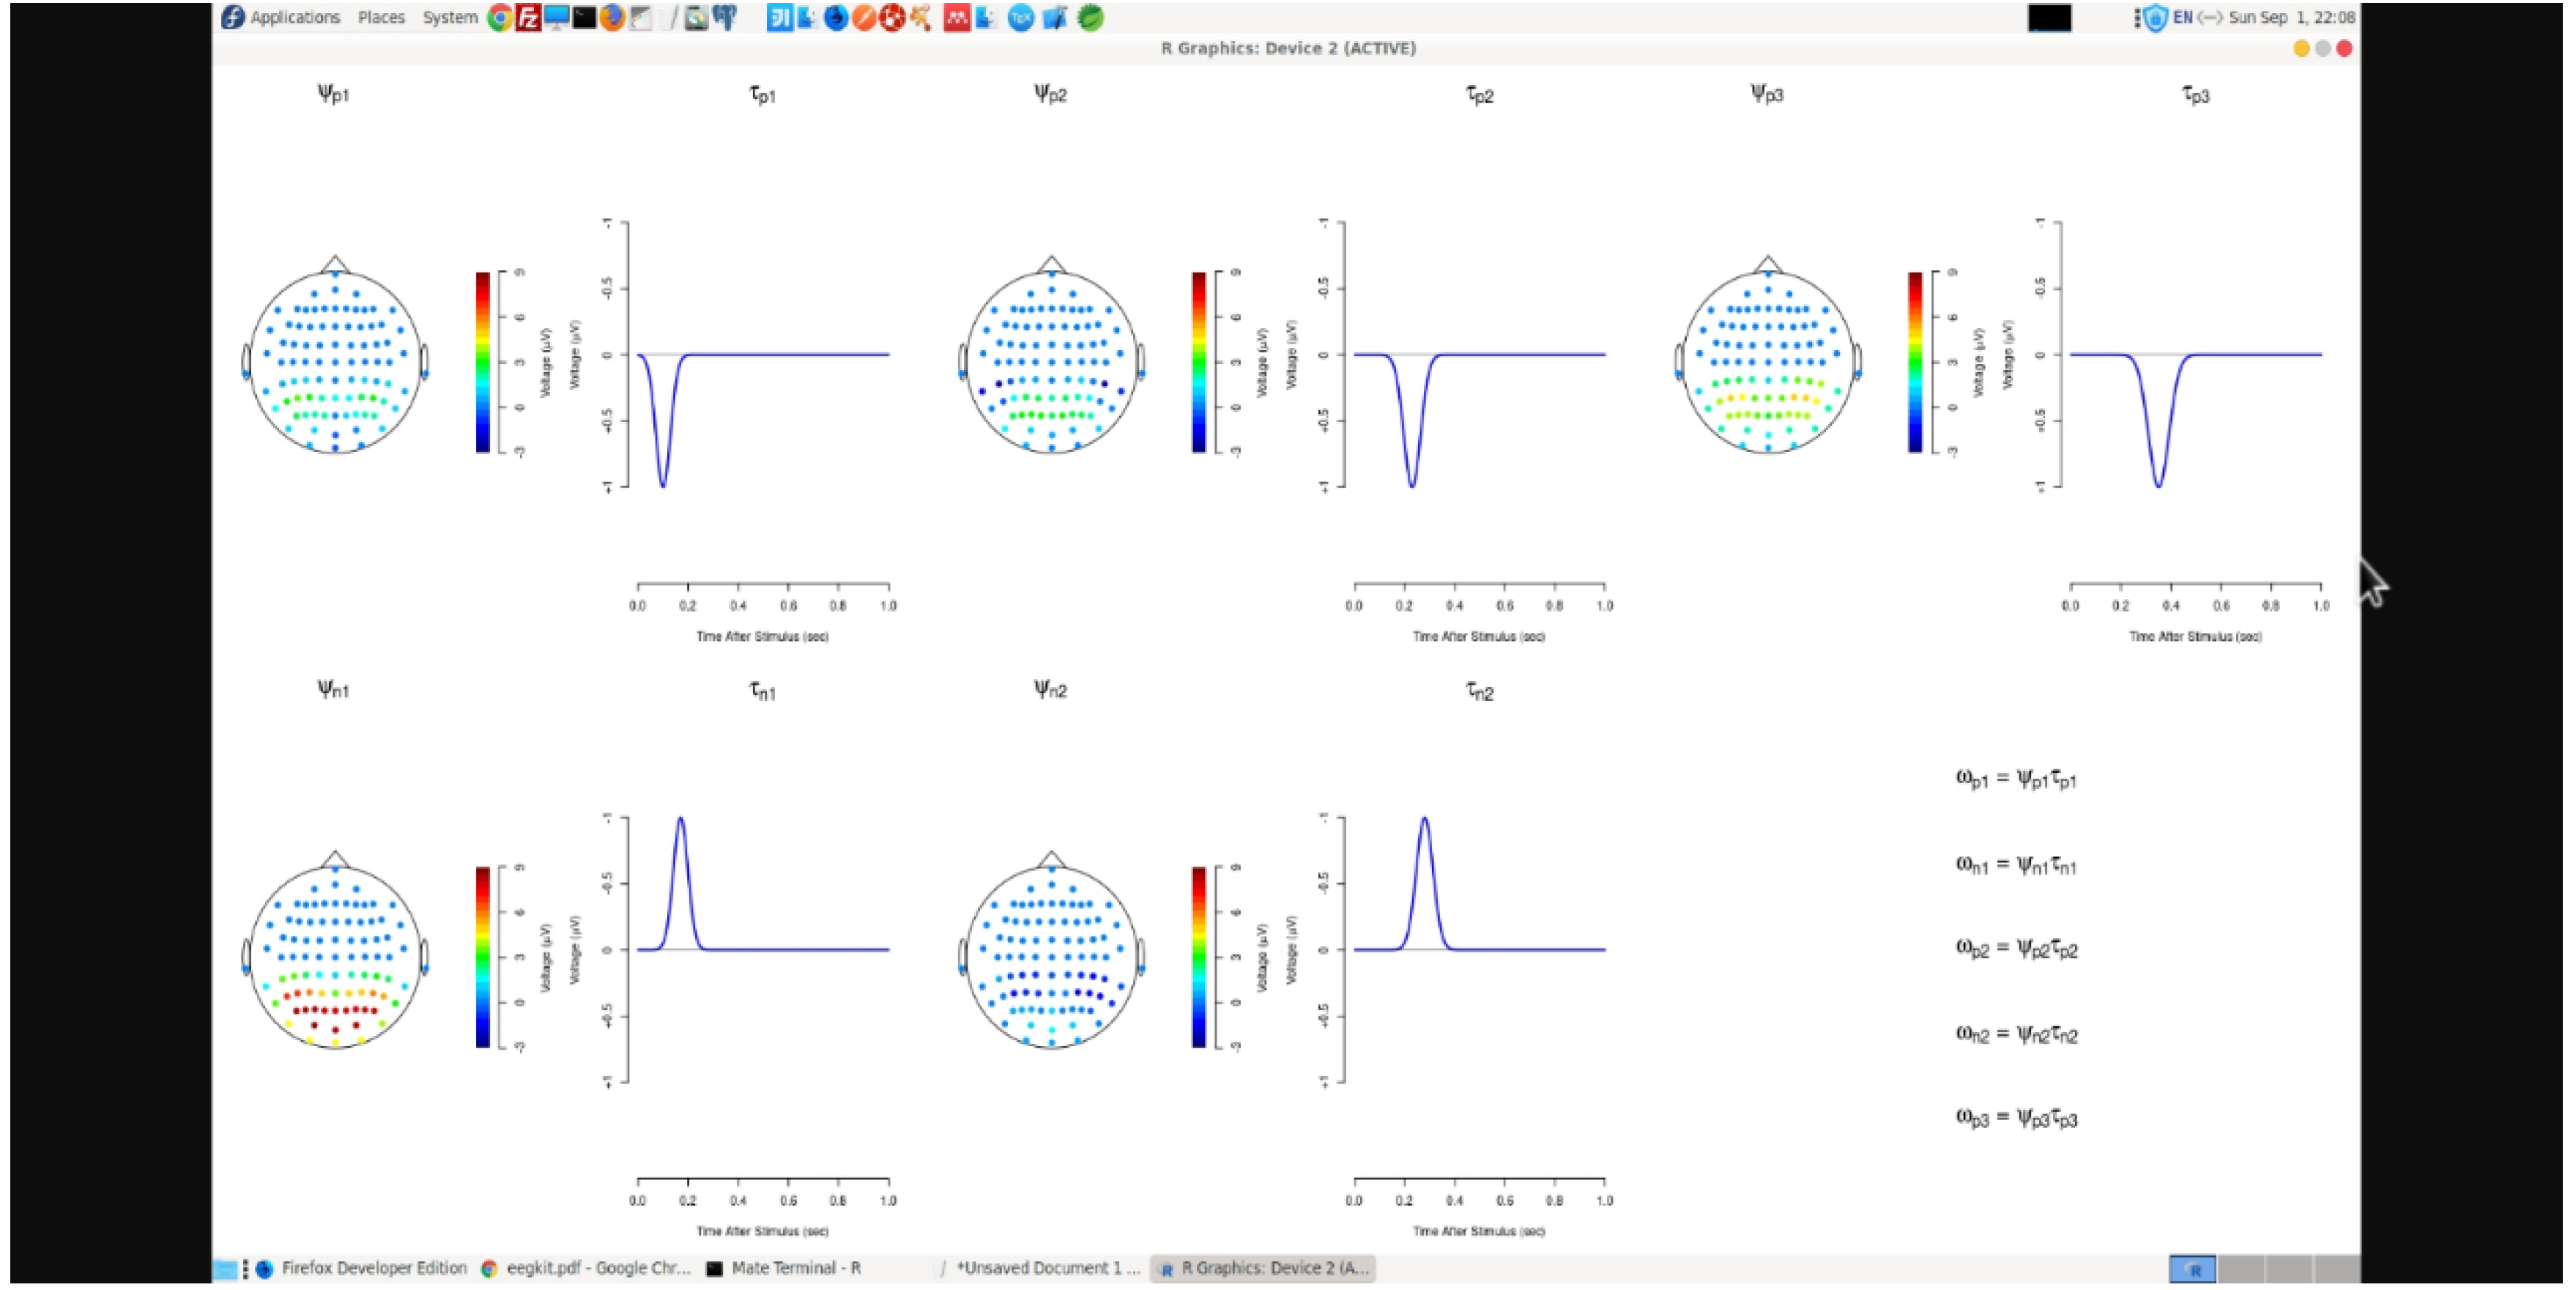
Figure 2.
EEG raw data profile. [Source: Self drawn with R-server hosted at http://sayantan.xyz:7779/].
Figure 2.
EEG raw data profile. [Source: Self drawn with R-server hosted at http://sayantan.xyz:7779/].
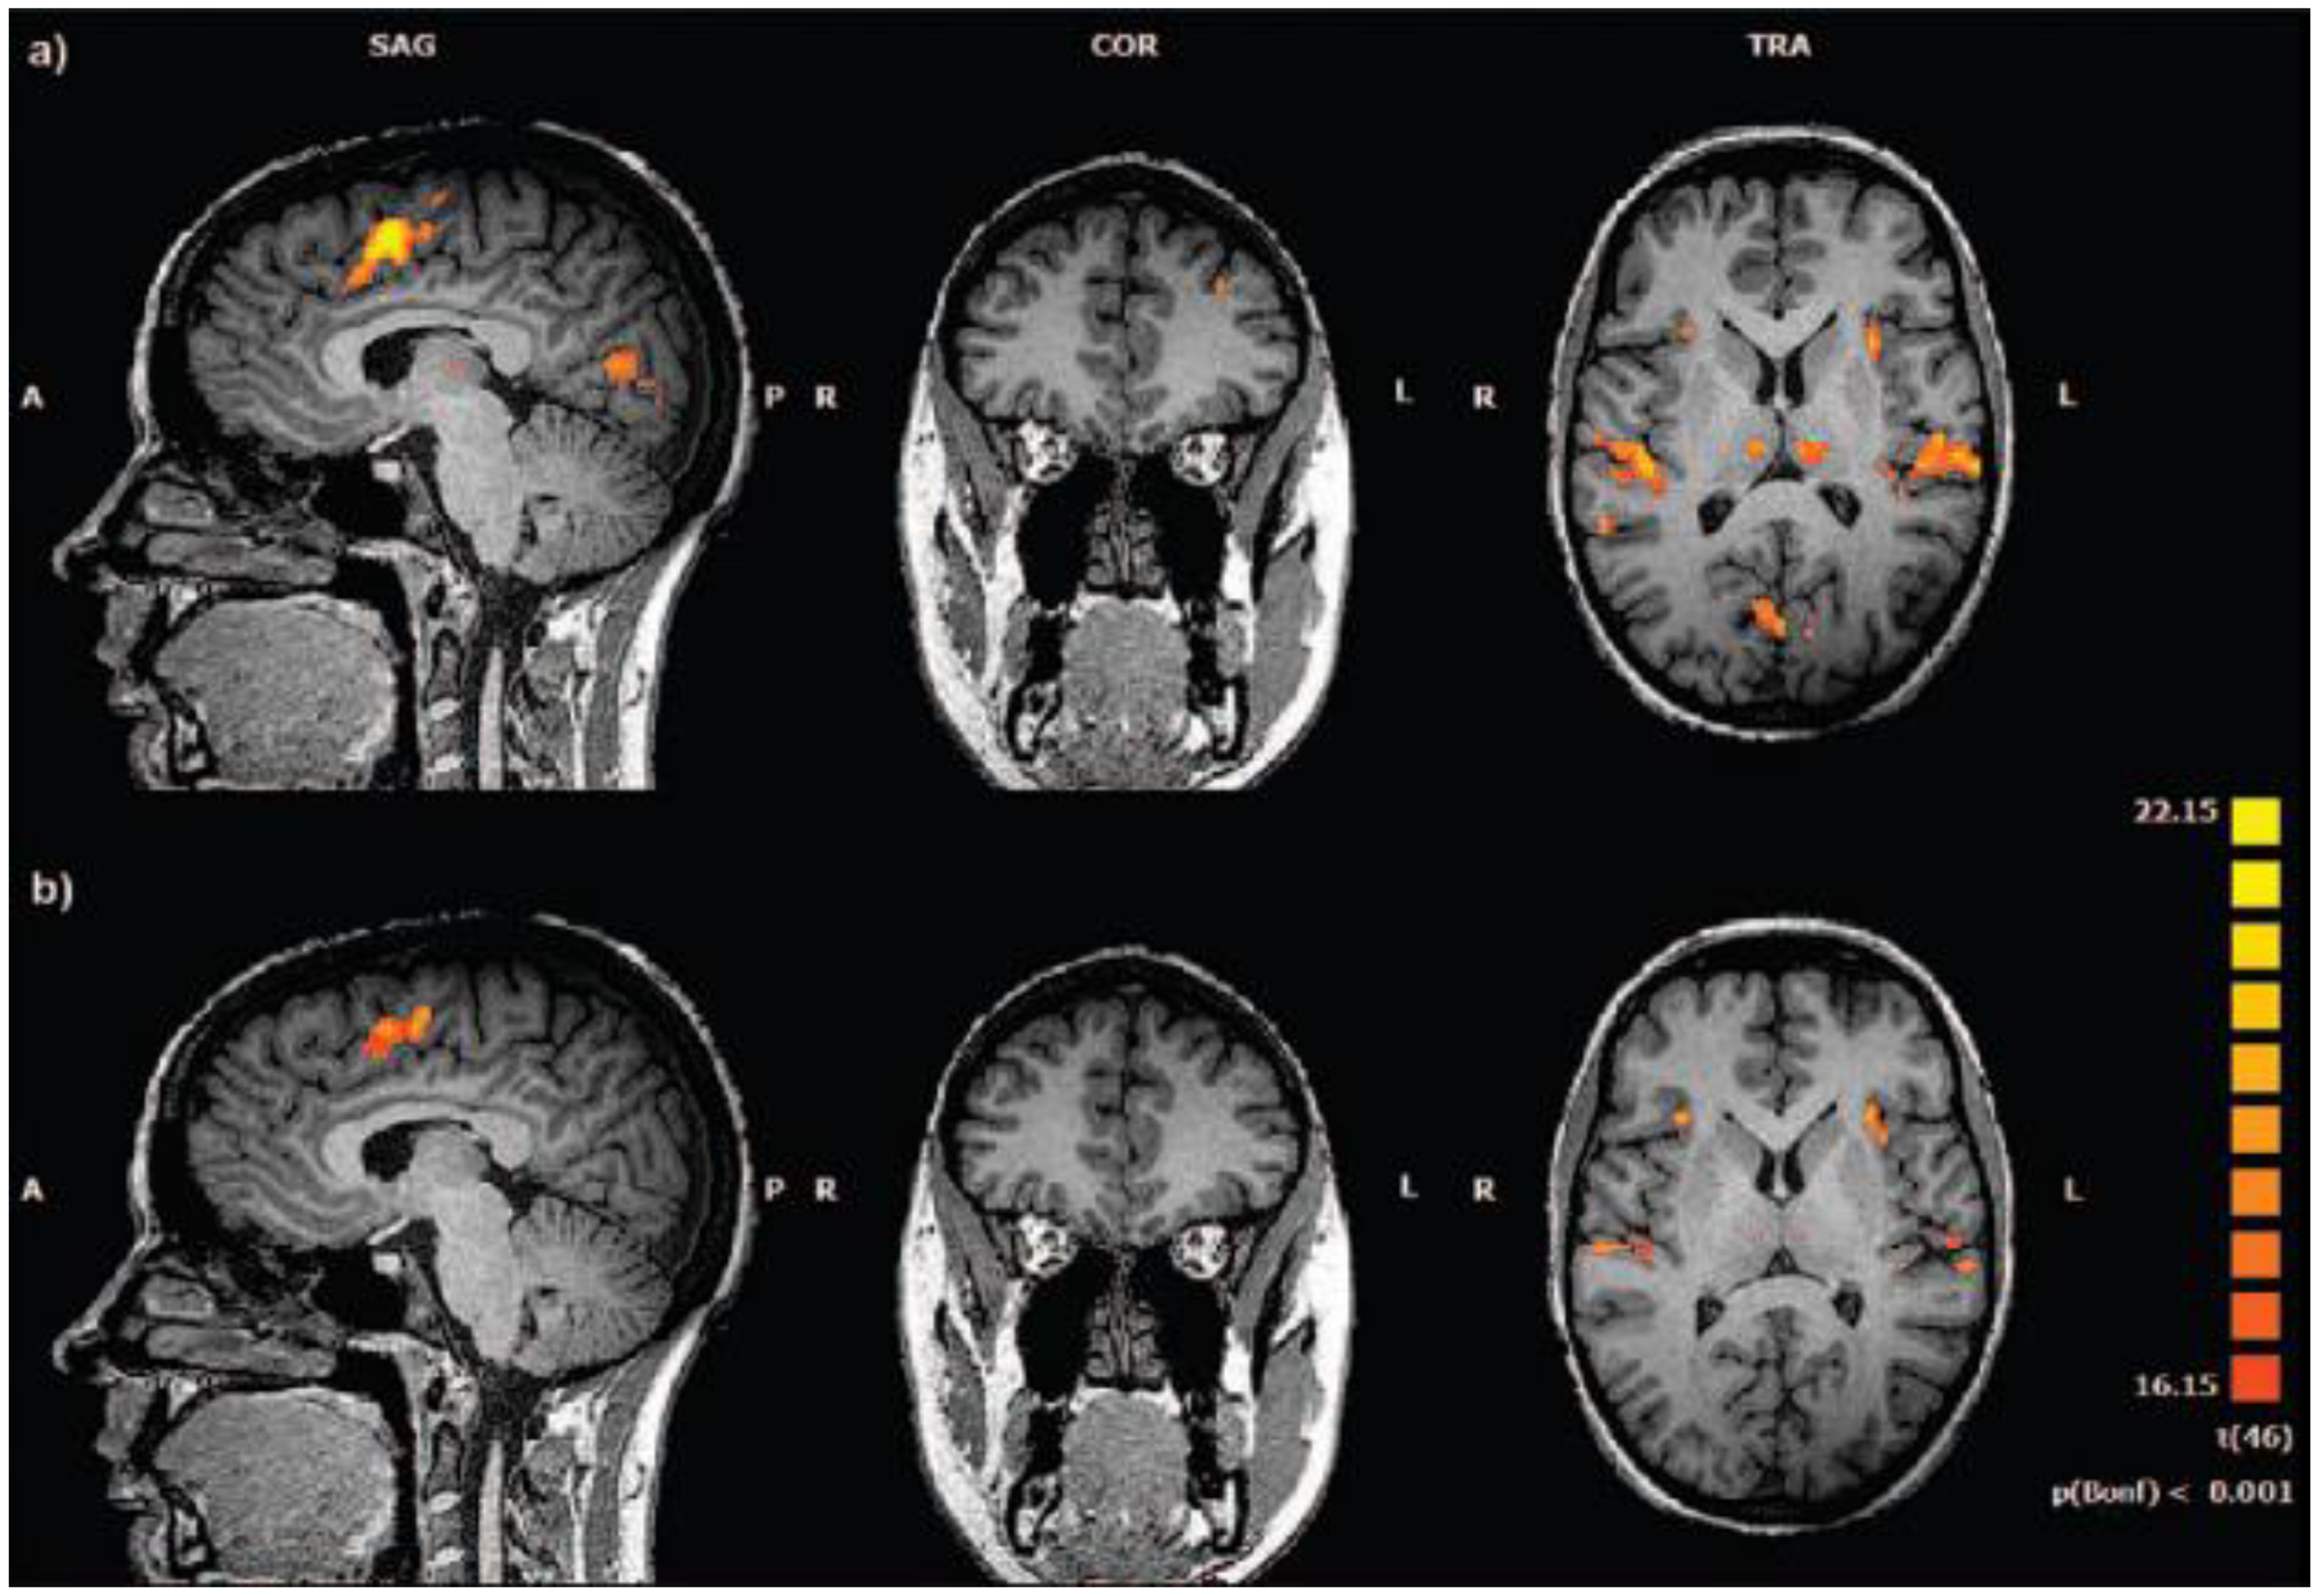
Figure 3.
EEG signal analysis and noise filtering in R. [Source: Self drawn with R-server hosted at http://sayantan.xyz:7779/].
Figure 3.
EEG signal analysis and noise filtering in R. [Source: Self drawn with R-server hosted at http://sayantan.xyz:7779/].
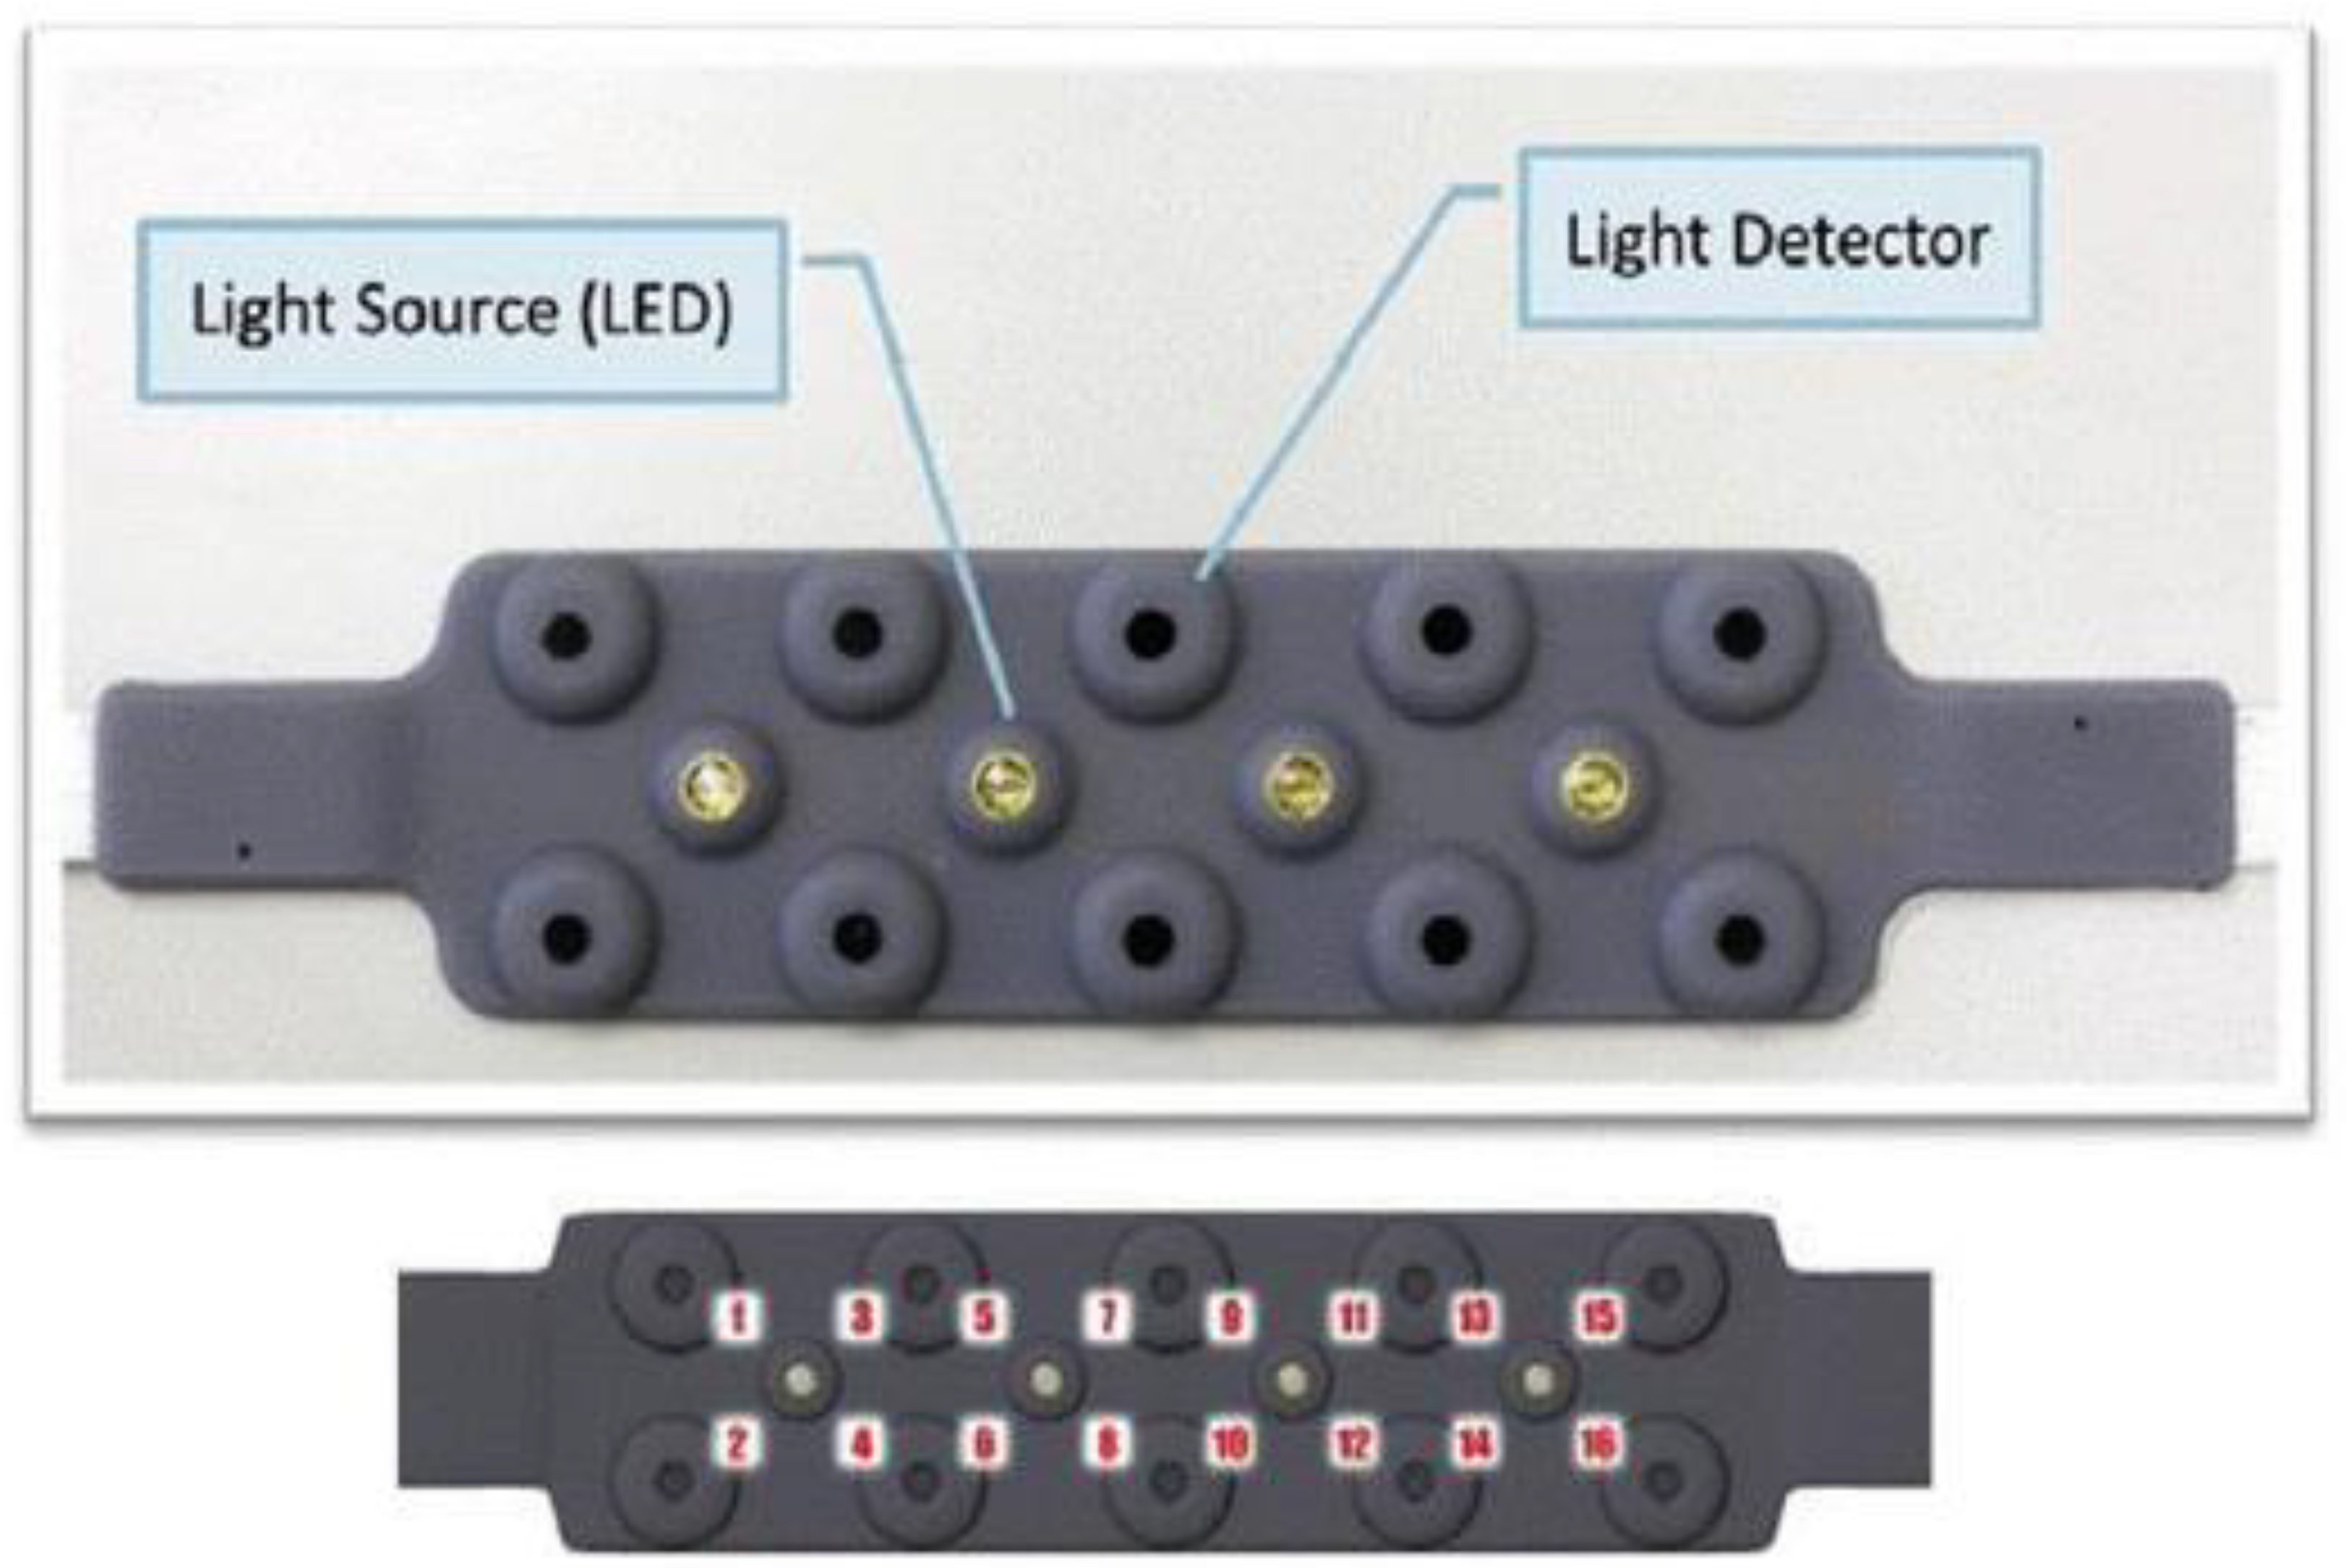
Figure 5.
fMRI signal analysis in R. [Source: Self drawn with R-server hosted at http://sayantan.xyz:7779/].
Figure 5.
fMRI signal analysis in R. [Source: Self drawn with R-server hosted at http://sayantan.xyz:7779/].
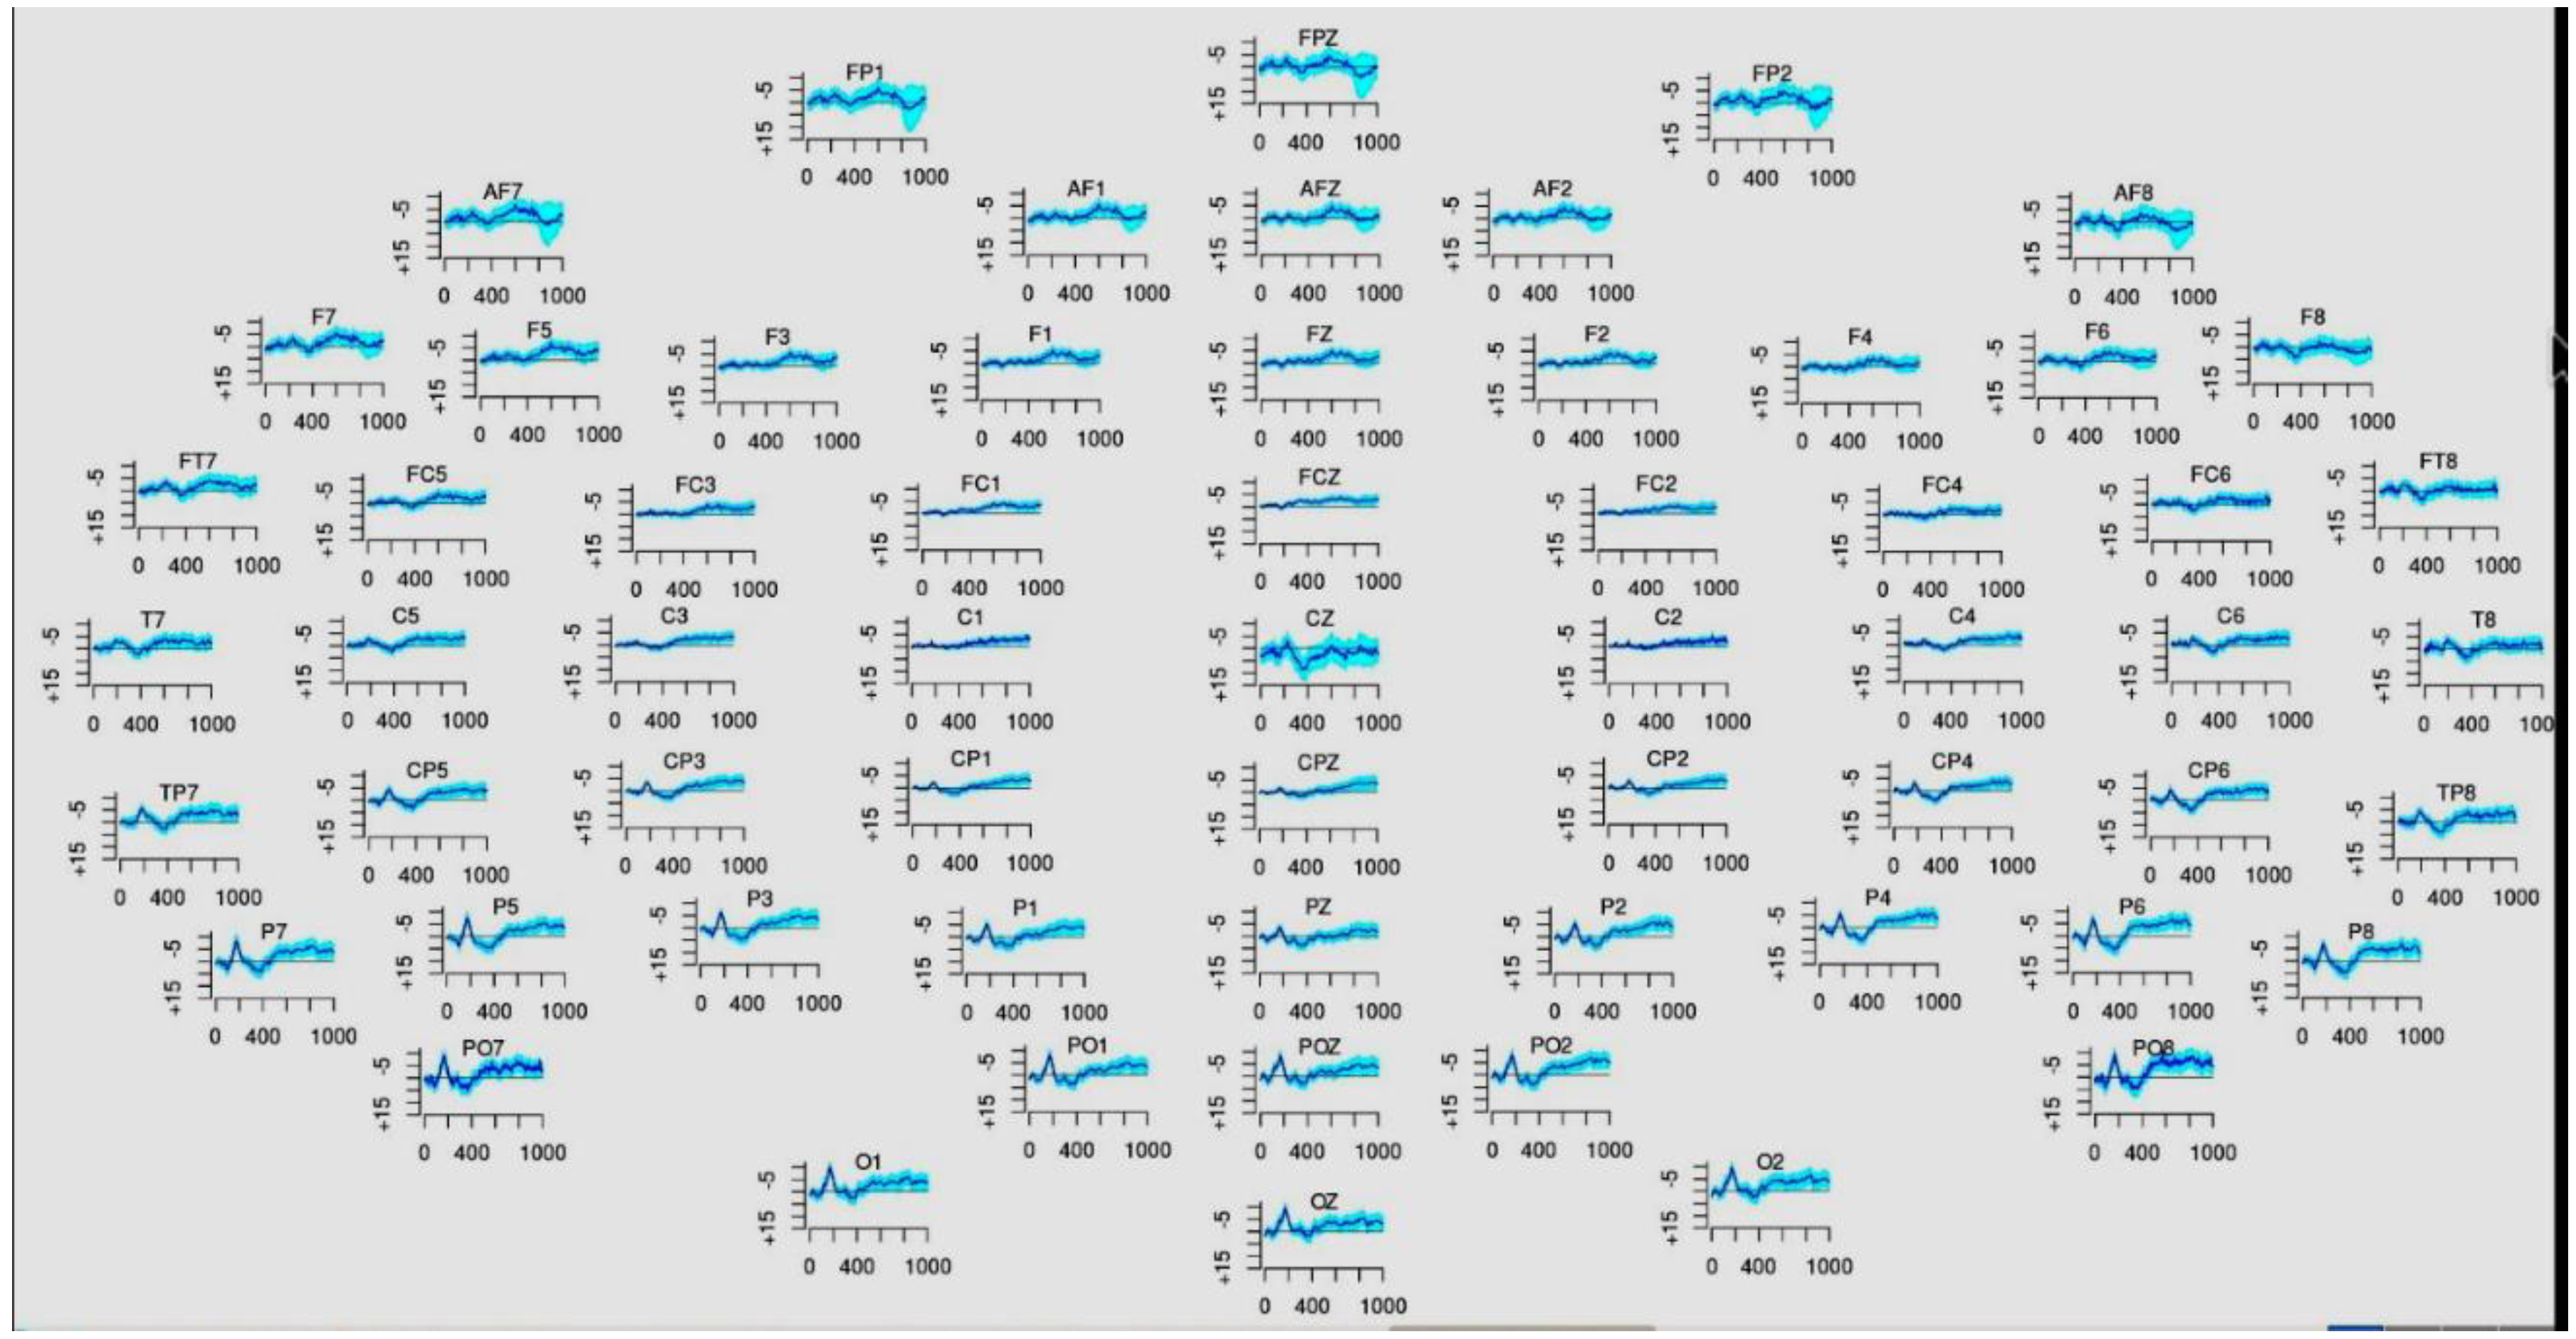
Figure 6.
fNIRS device with light sources, detectors and (optode) channel measurement locations. [Source: Reproduced under terms of the CC-BY license. [30] Copyright 2015, Authors.].
Figure 6.
fNIRS device with light sources, detectors and (optode) channel measurement locations. [Source: Reproduced under terms of the CC-BY license. [30] Copyright 2015, Authors.].
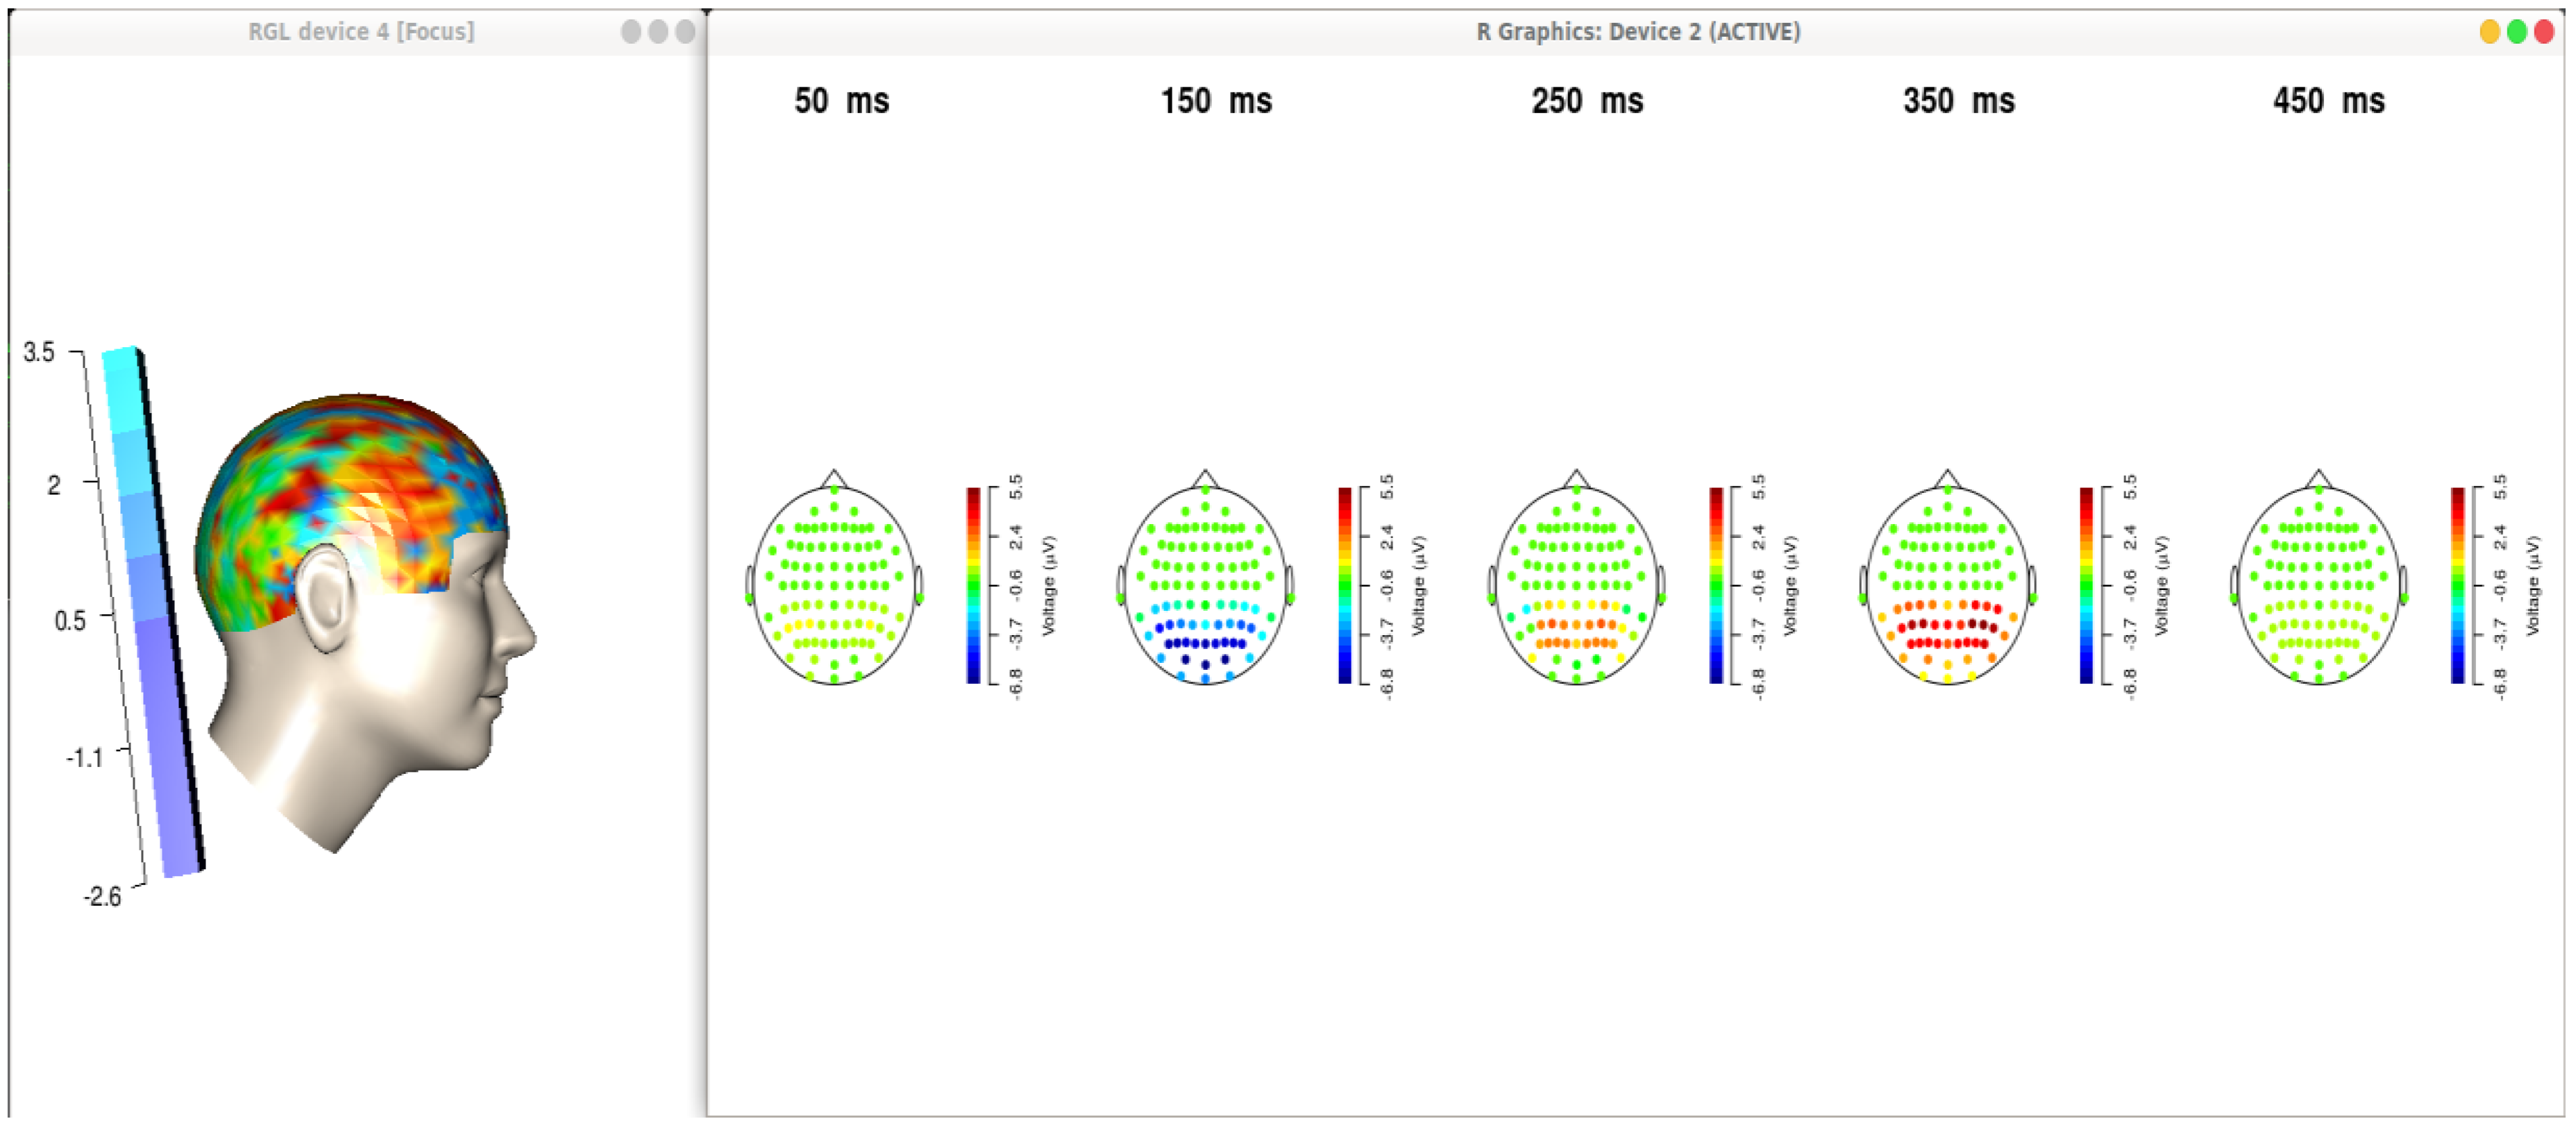
Figure 7.
Schematic diagram showing fNIRS workflow. [Source: Reproduced under terms of the CC-BY license. [36] Copyright 2013, Authors.].
Figure 7.
Schematic diagram showing fNIRS workflow. [Source: Reproduced under terms of the CC-BY license. [36] Copyright 2013, Authors.].
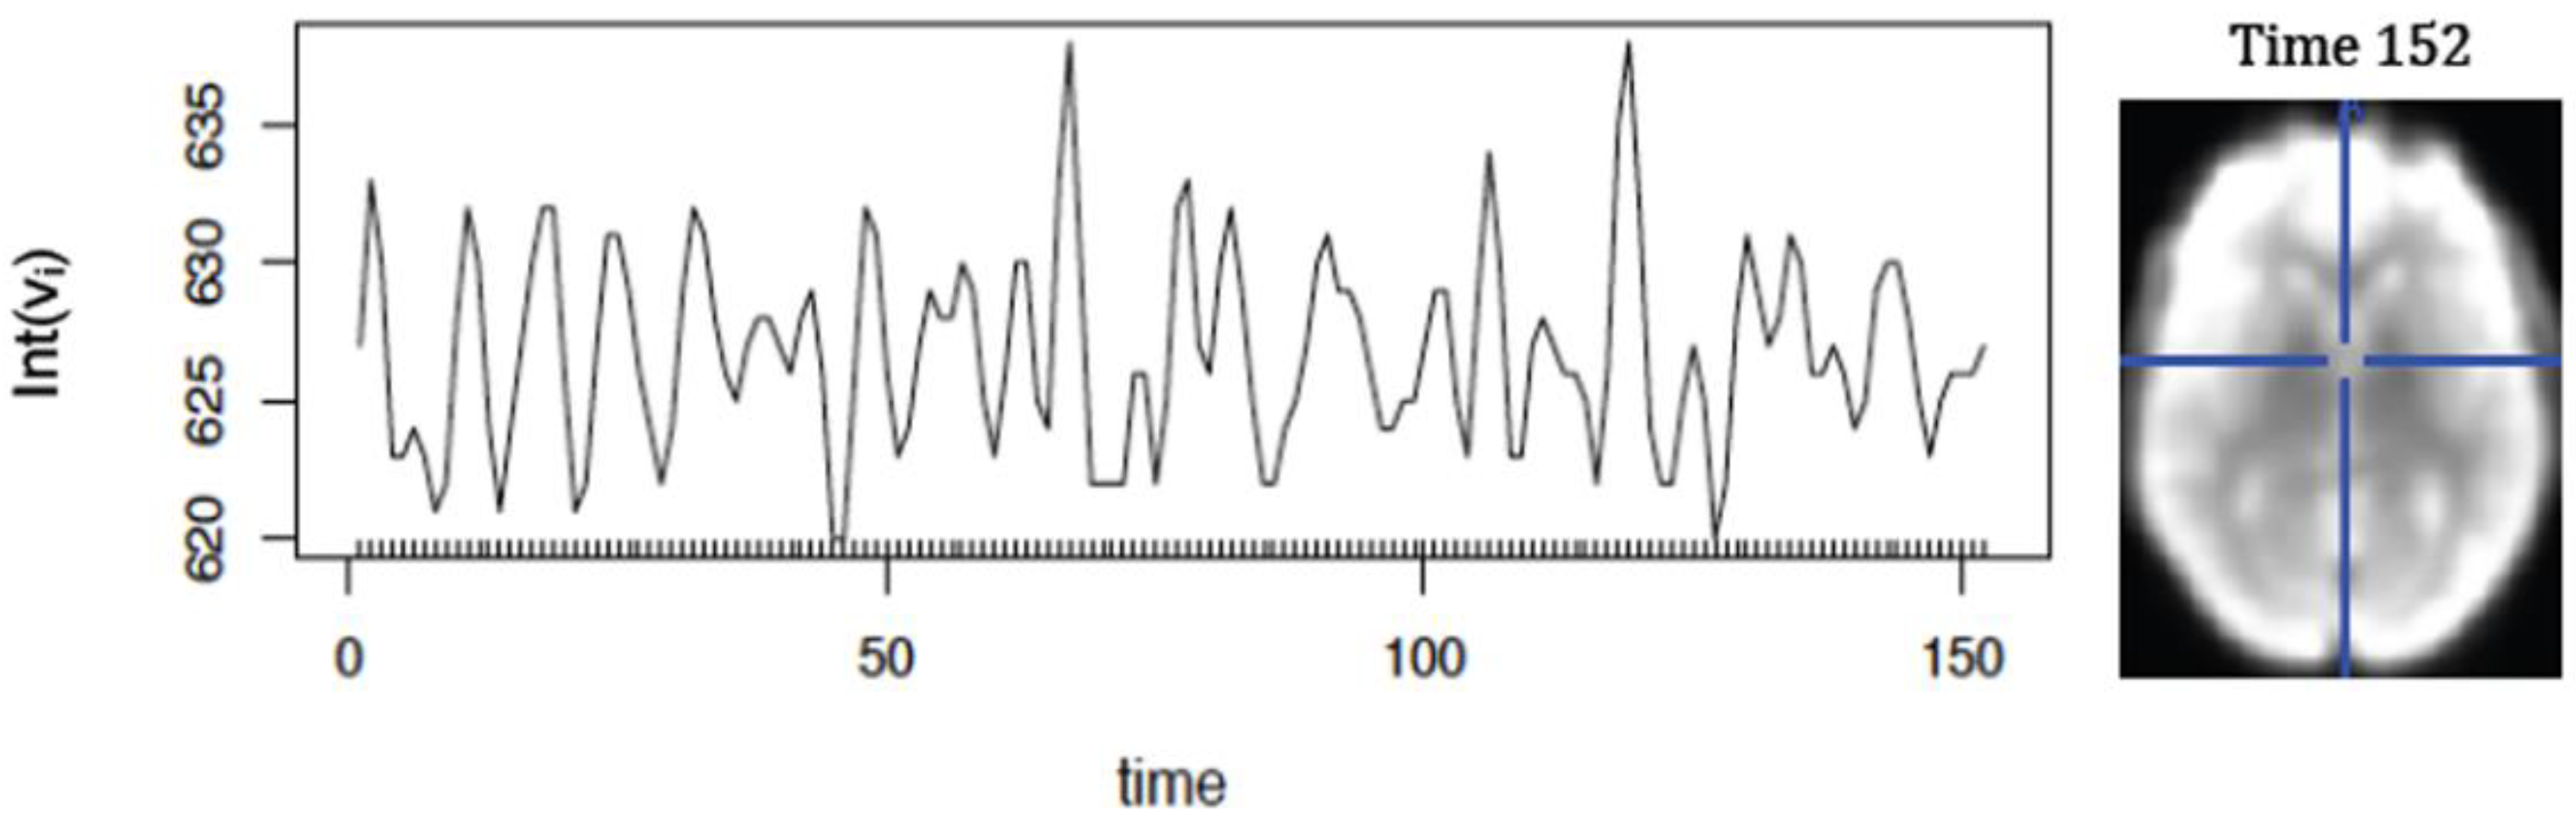
Figure 8.
Raw fNIRS data. [Source: Self drawn with R-server hosted at http://sayantan.xyz:7779/].
Figure 8.
Raw fNIRS data. [Source: Self drawn with R-server hosted at http://sayantan.xyz:7779/].
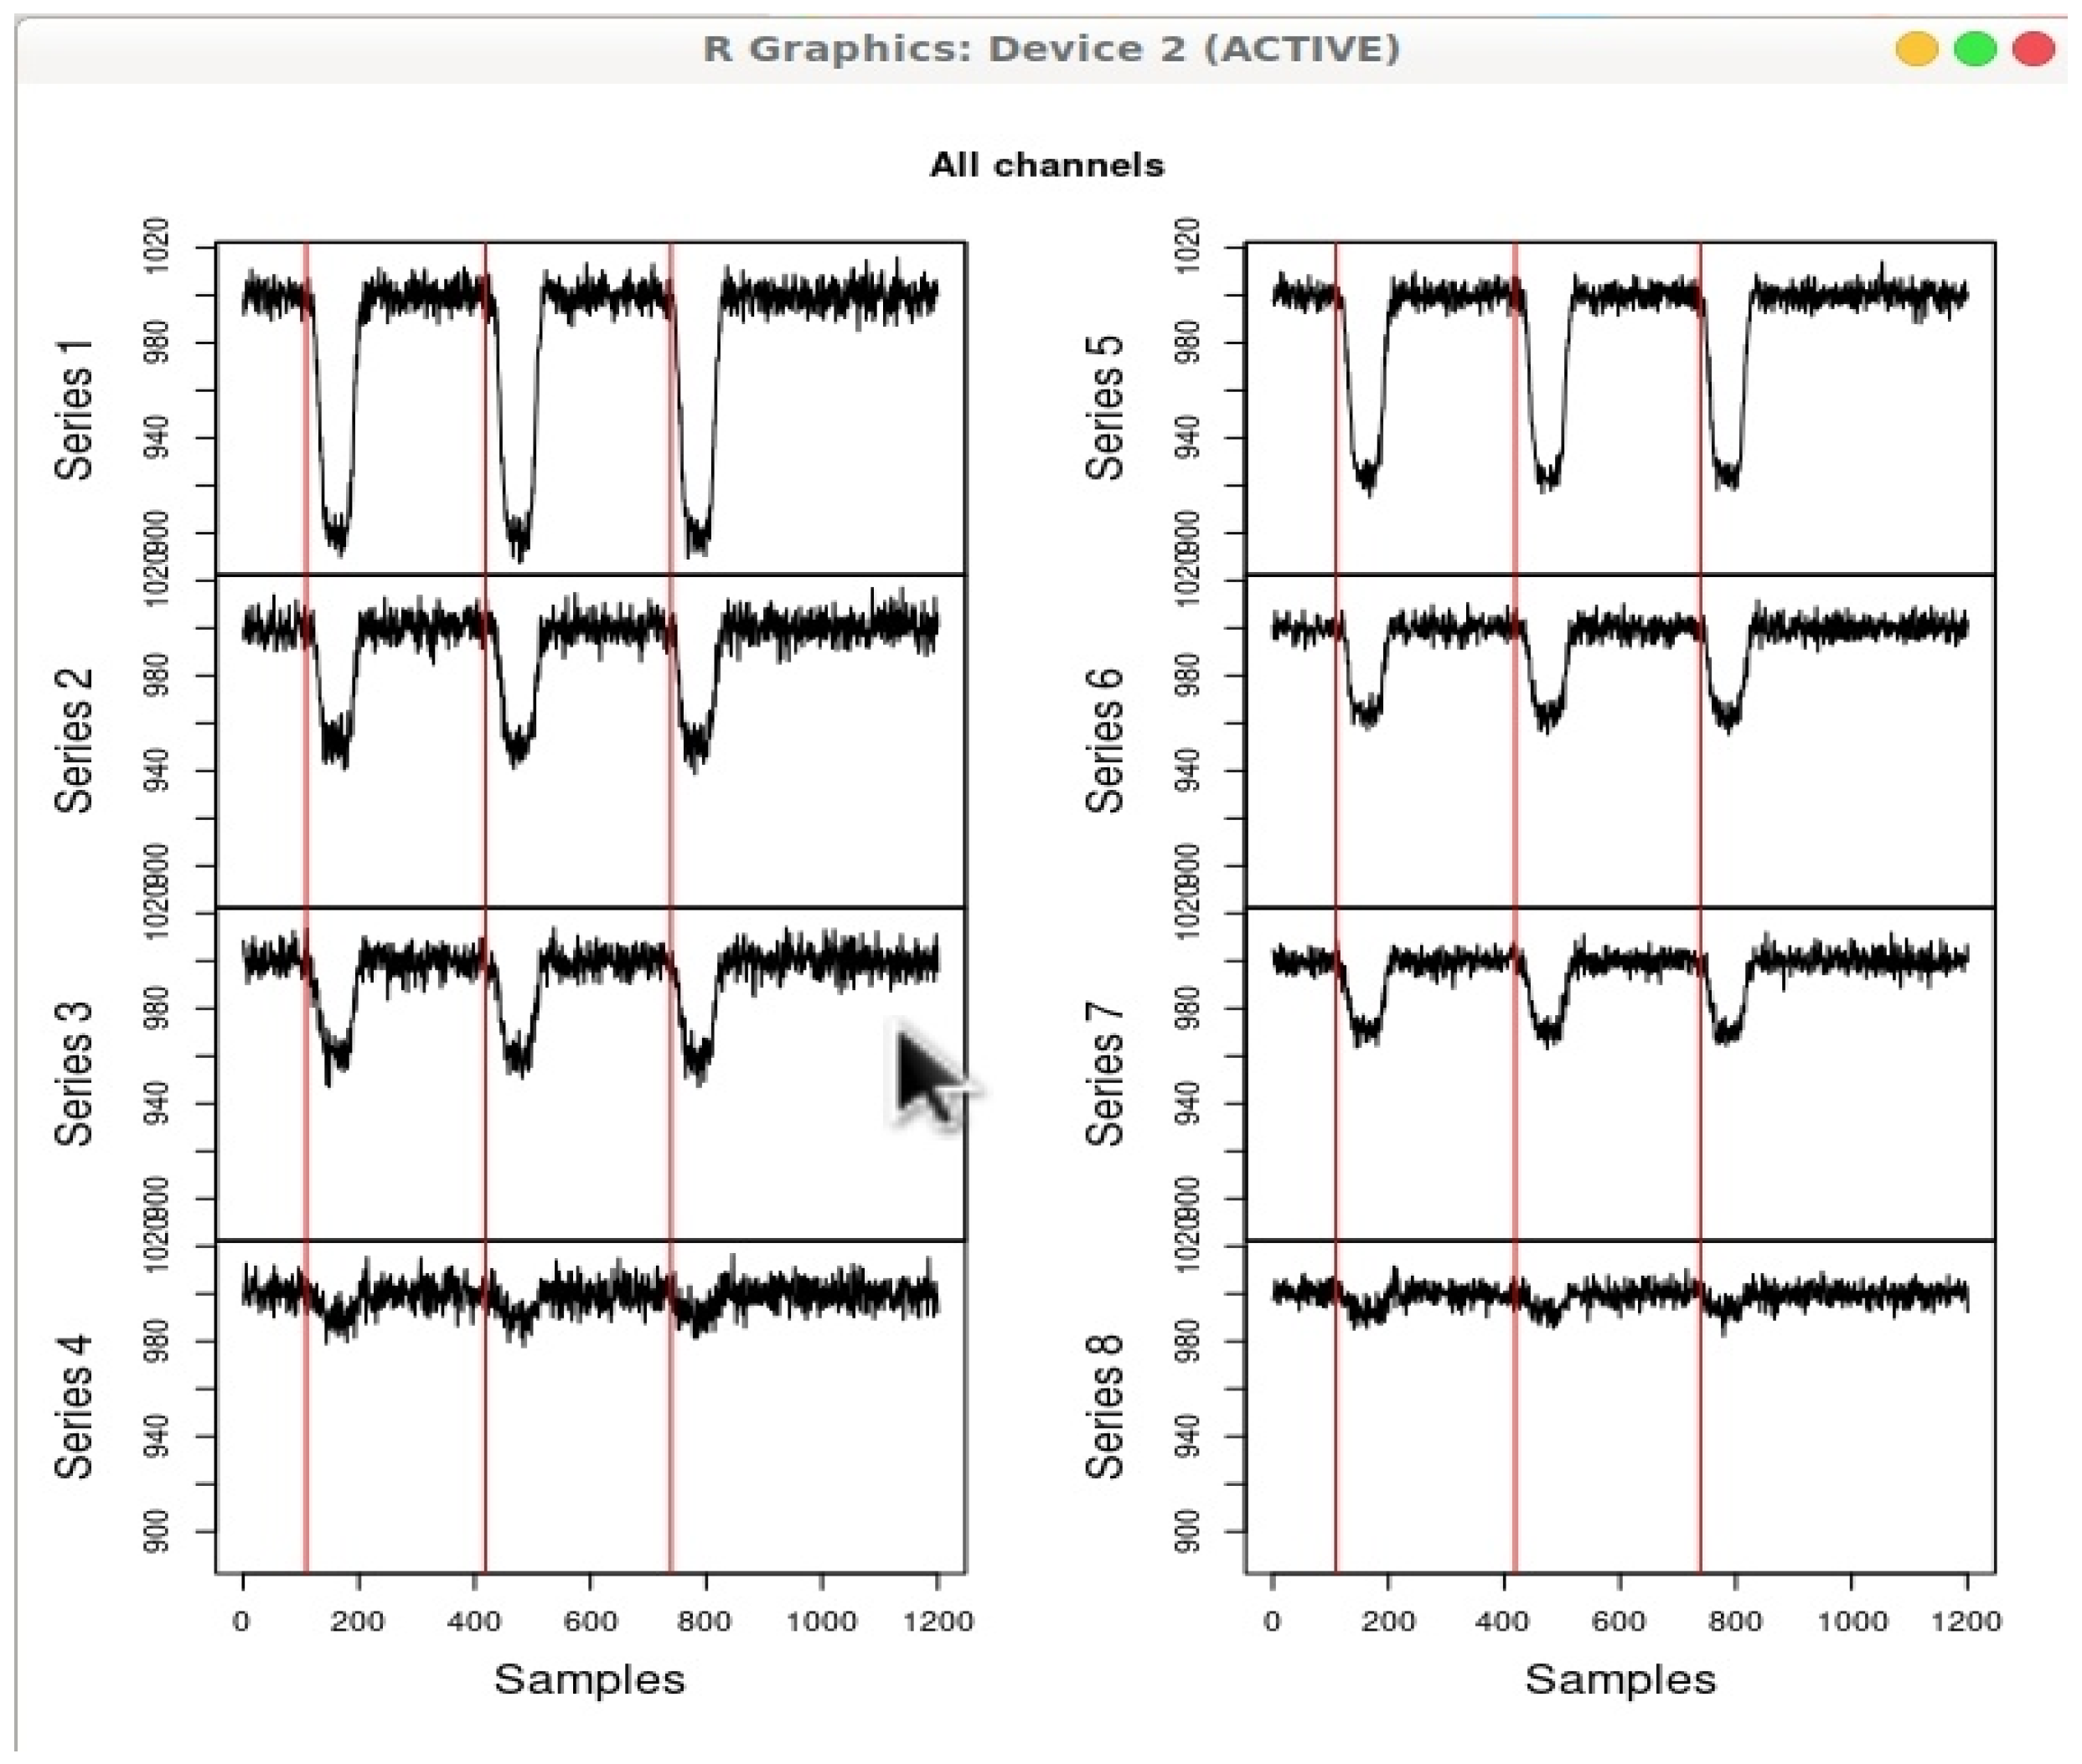
Figure 9.
Segregated and normalised but noisy fNIRS data. [Source: Self drawn with R-server hosted at http://sayantan.xyz:7779/].
Figure 9.
Segregated and normalised but noisy fNIRS data. [Source: Self drawn with R-server hosted at http://sayantan.xyz:7779/].
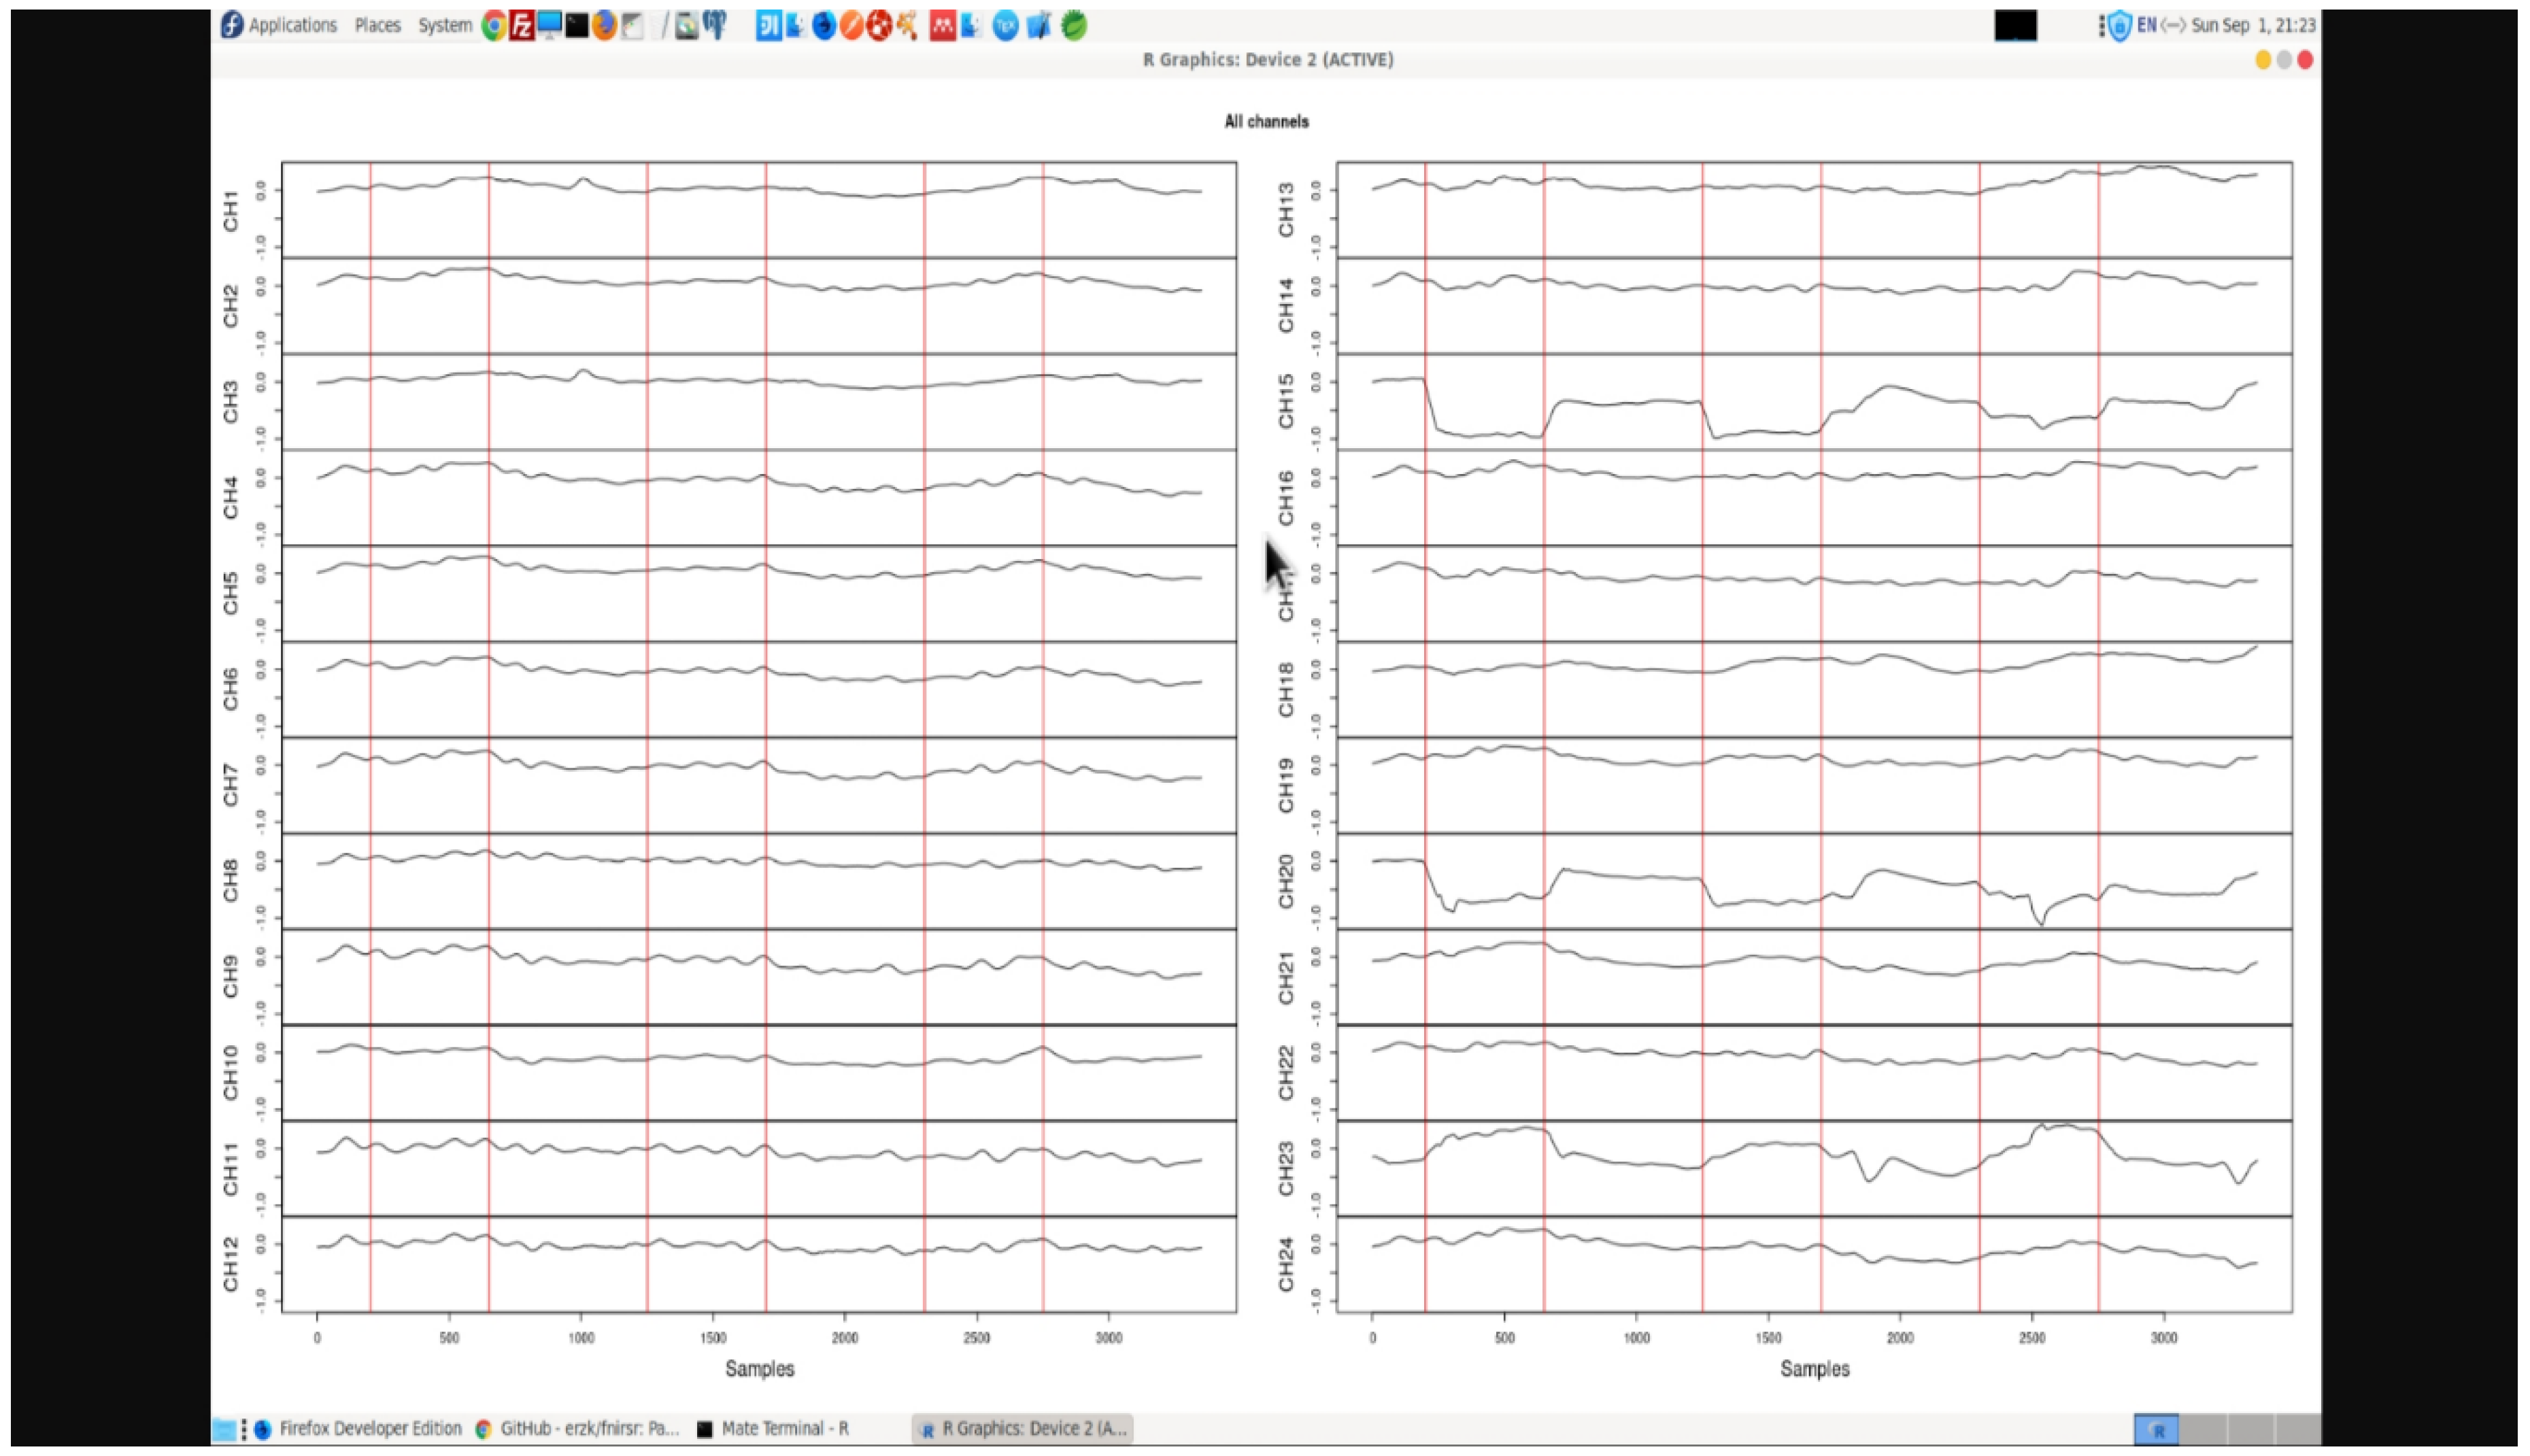
Figure 10.
fNIRS noise filtered clean and merged. [Source: Self drawn with R-server hosted at http://sayantan.xyz:7779/]
Figure 10.
fNIRS noise filtered clean and merged. [Source: Self drawn with R-server hosted at http://sayantan.xyz:7779/]
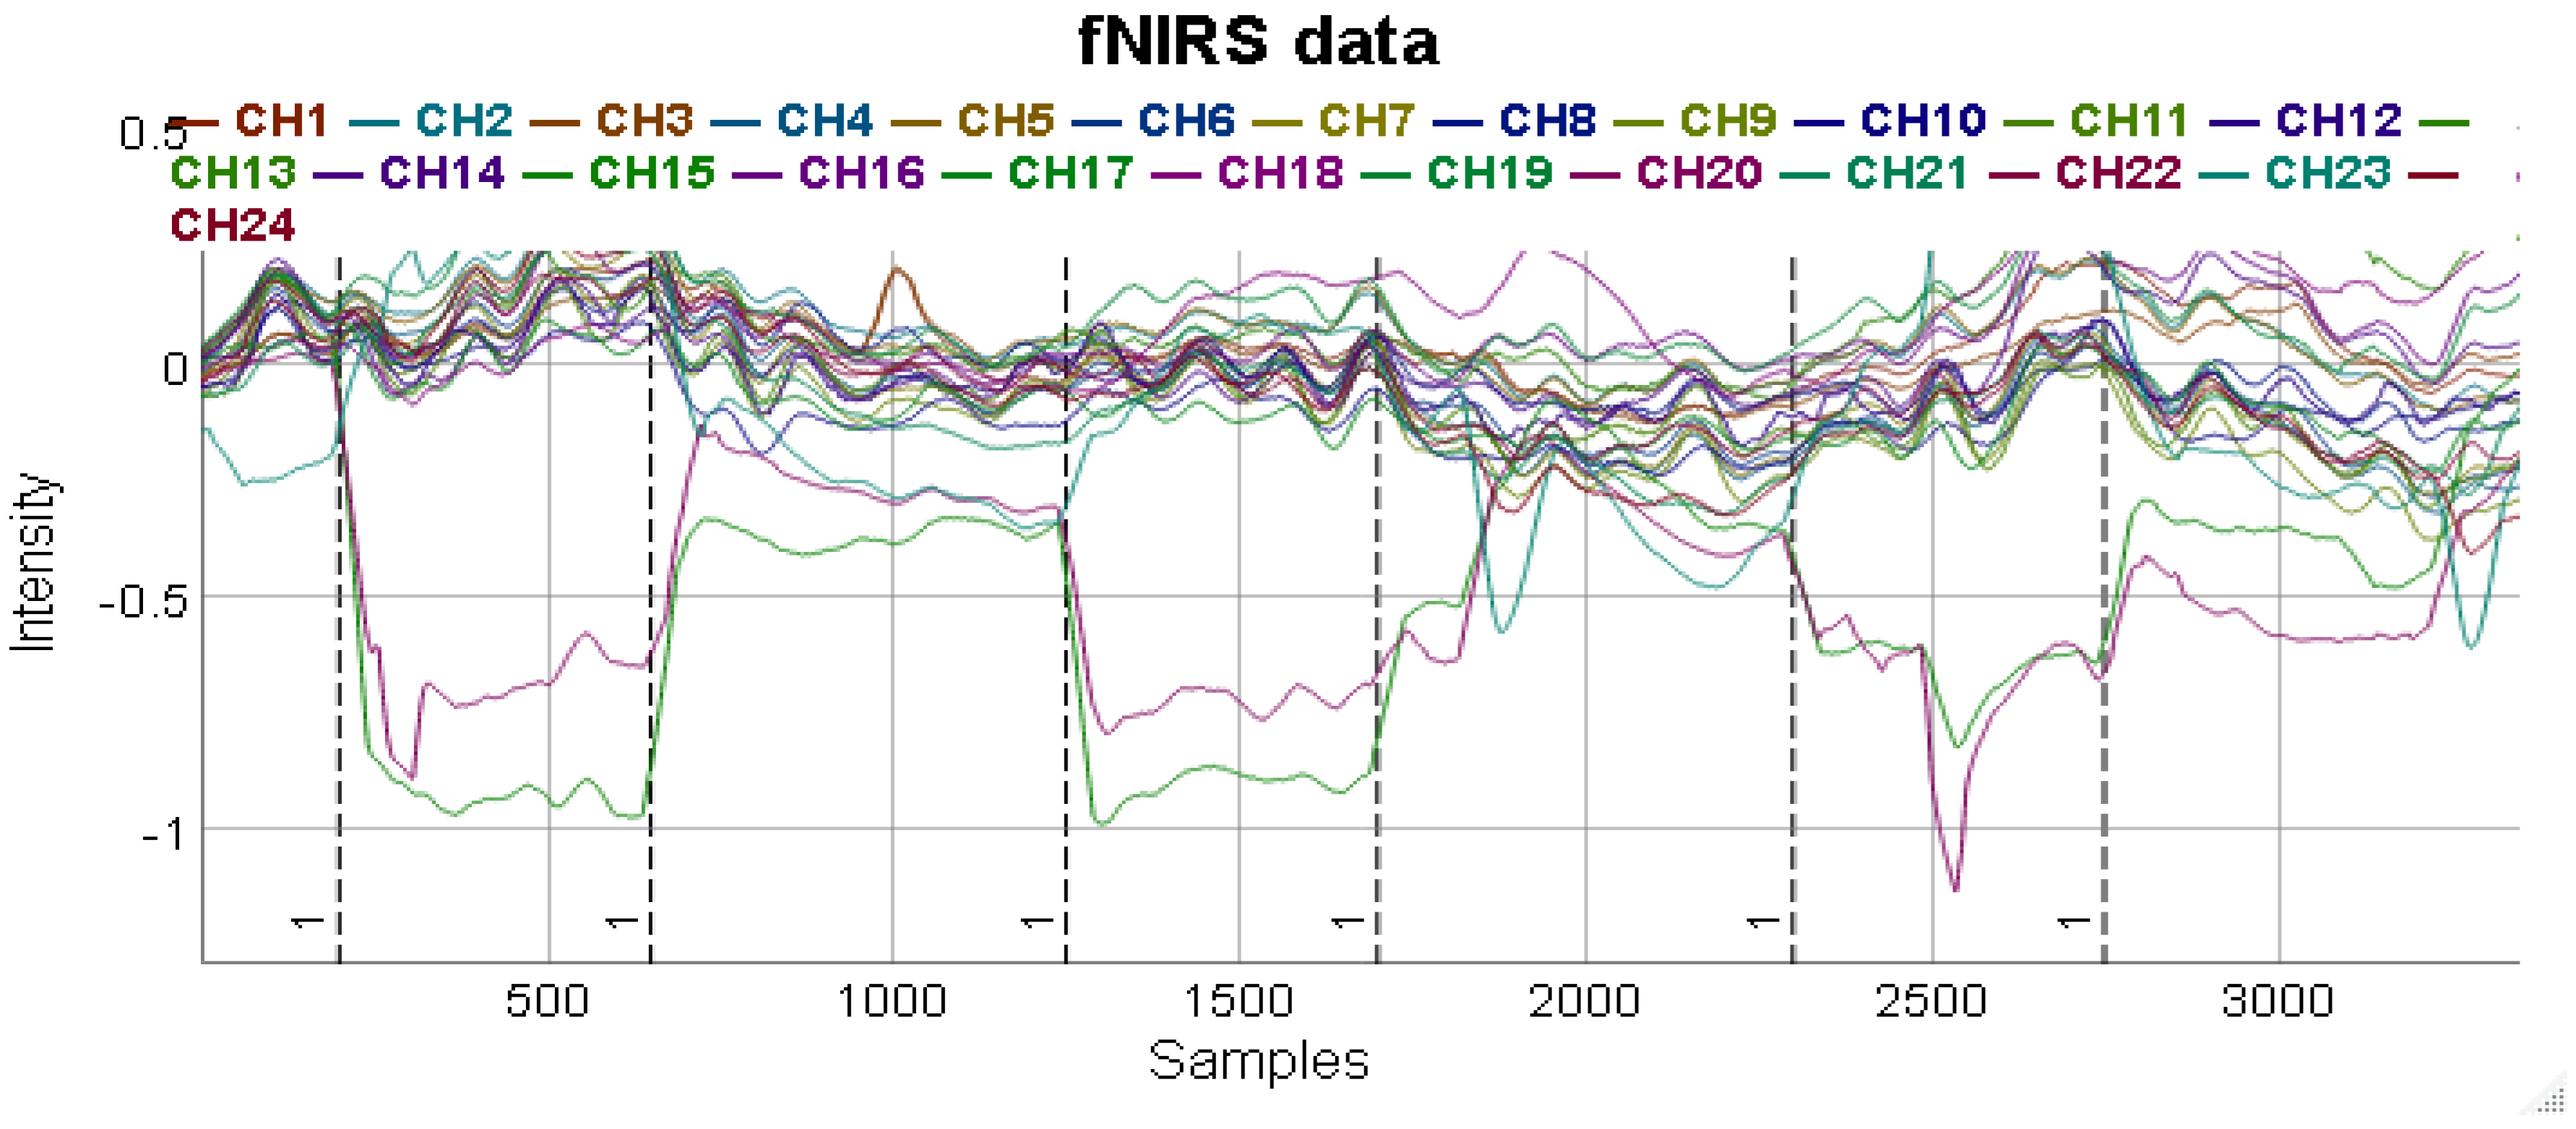
Figure 11.
Schematic visualisation of the bimodal EEG-fMRI neurofeedback platform. [Source: Reproduced under terms of the CC-BY license. [42] Copyright 2020, Authors.
Figure 11.
Schematic visualisation of the bimodal EEG-fMRI neurofeedback platform. [Source: Reproduced under terms of the CC-BY license. [42] Copyright 2020, Authors.
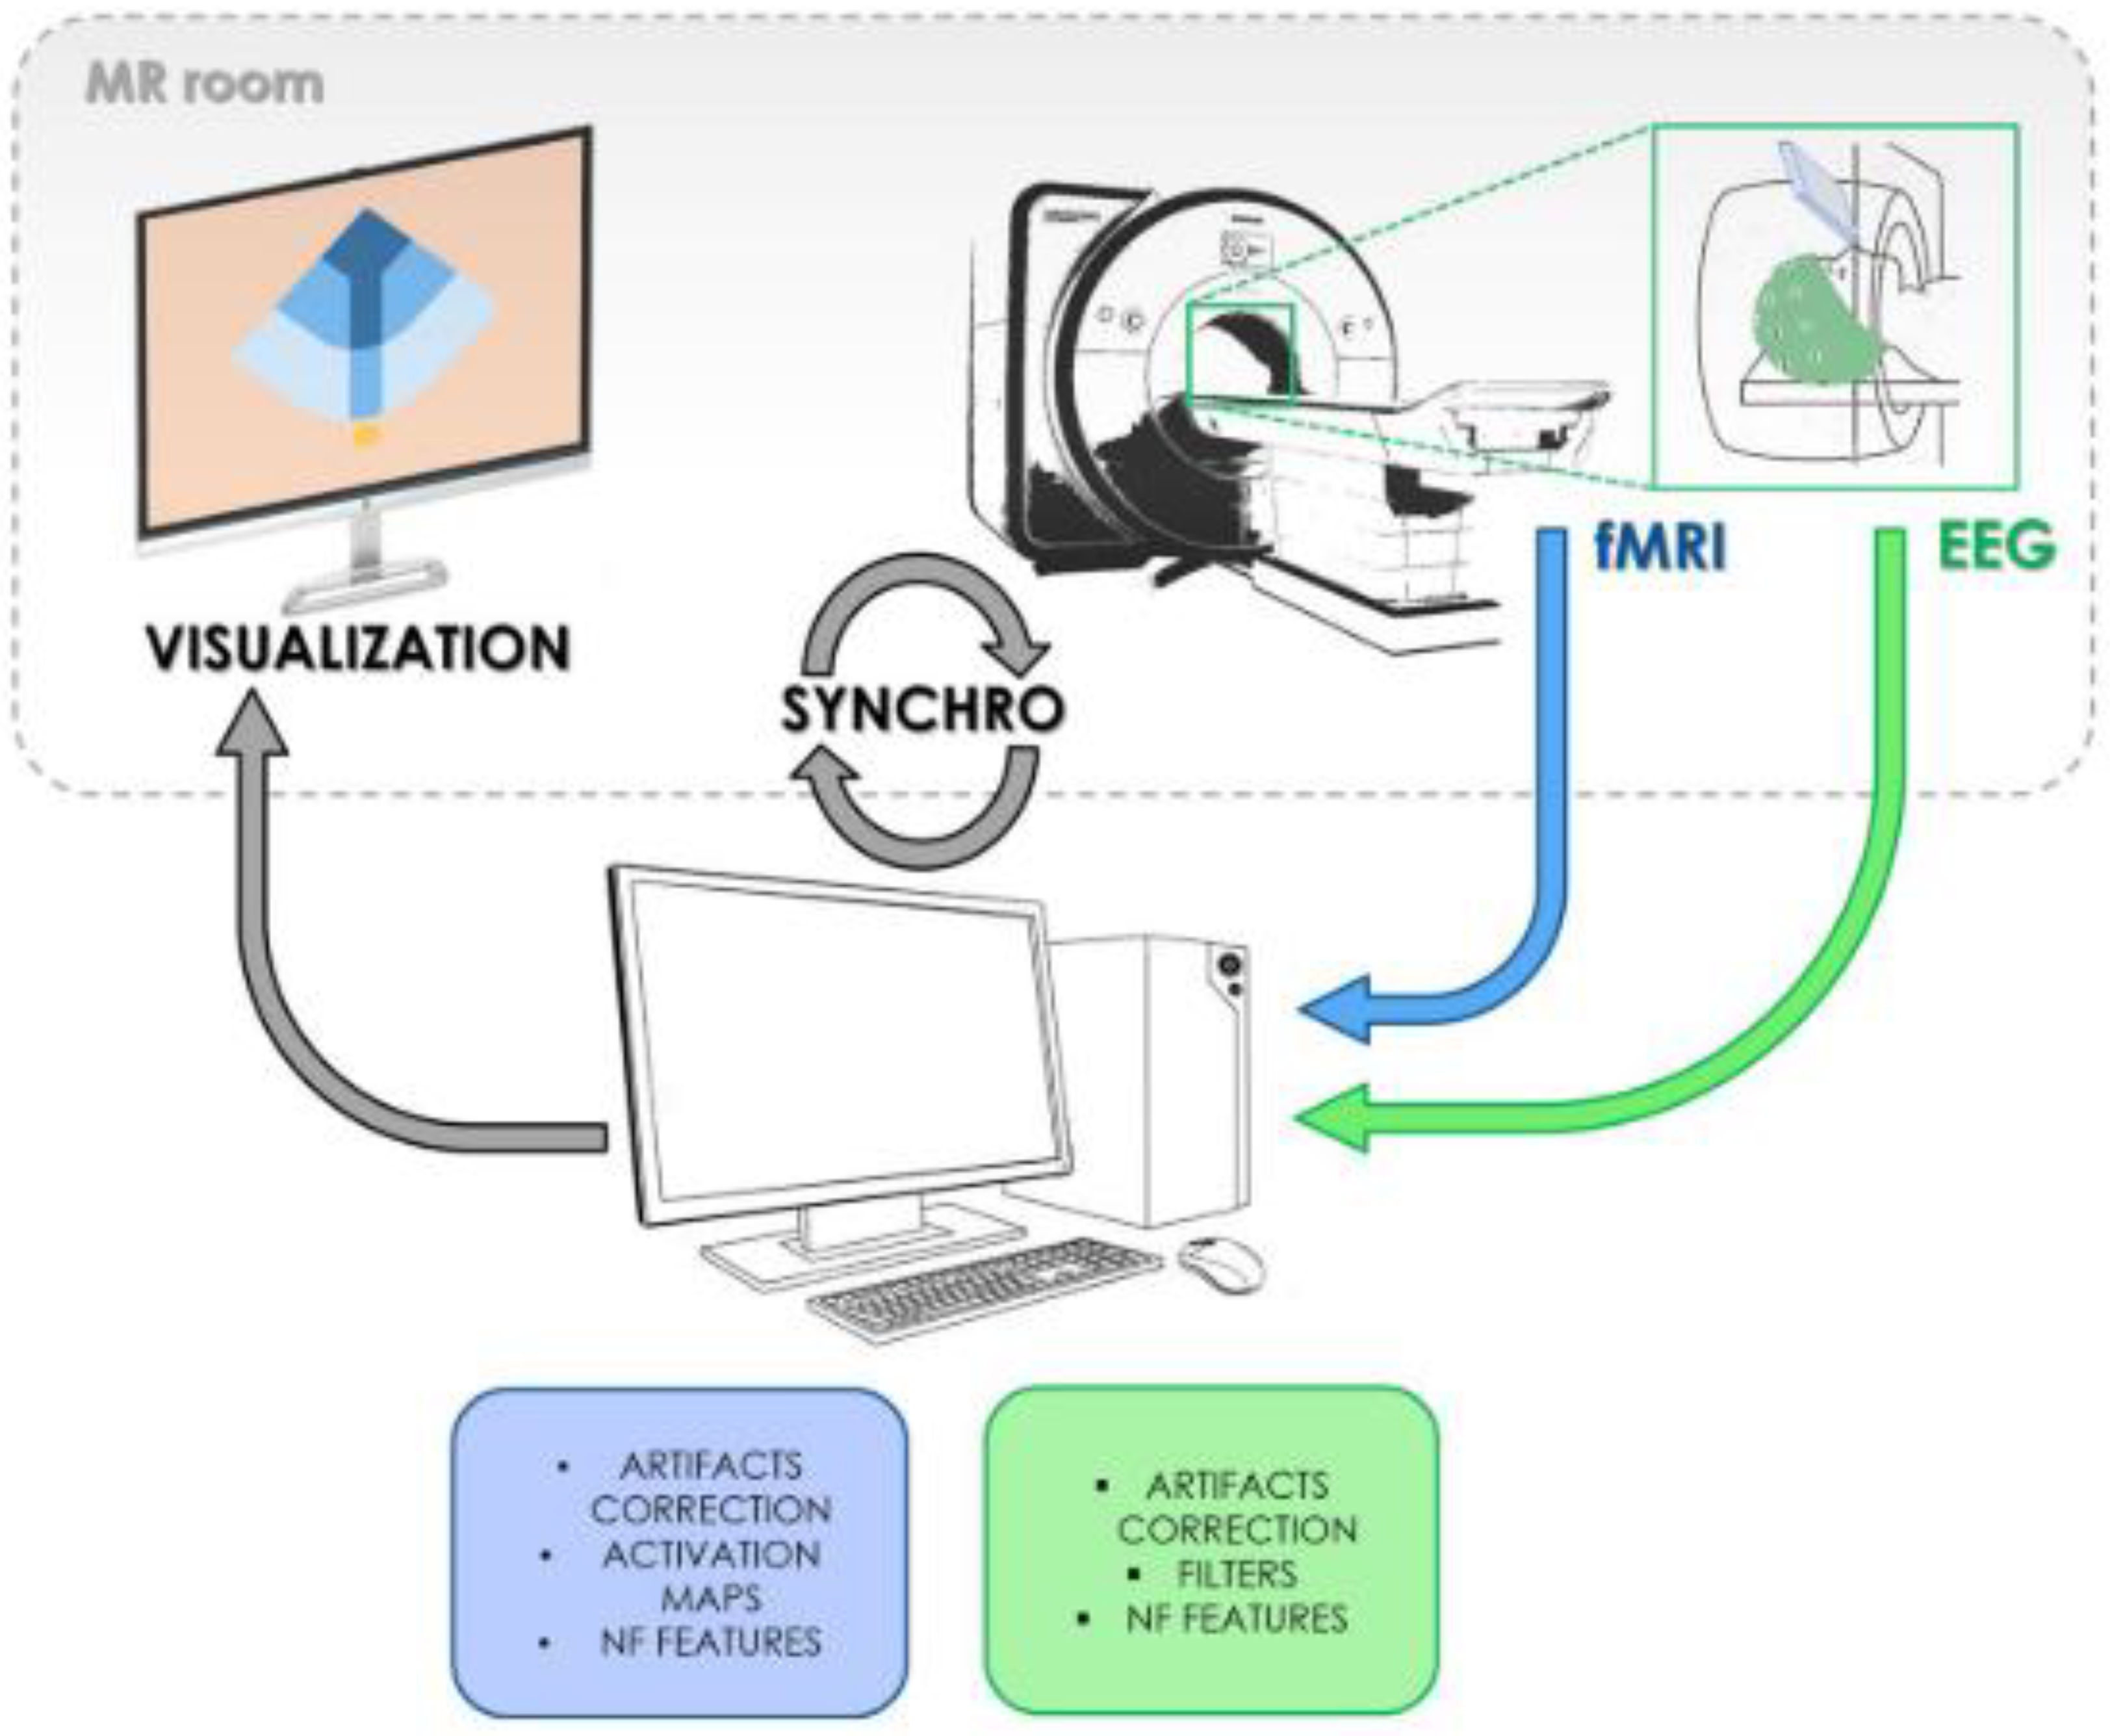
Figure 12.
Band pass filtered and normalized EEG data in R. [Source: Self drawn with R-server hosted at http://sayantan.xyz:7779/].
Figure 12.
Band pass filtered and normalized EEG data in R. [Source: Self drawn with R-server hosted at http://sayantan.xyz:7779/].
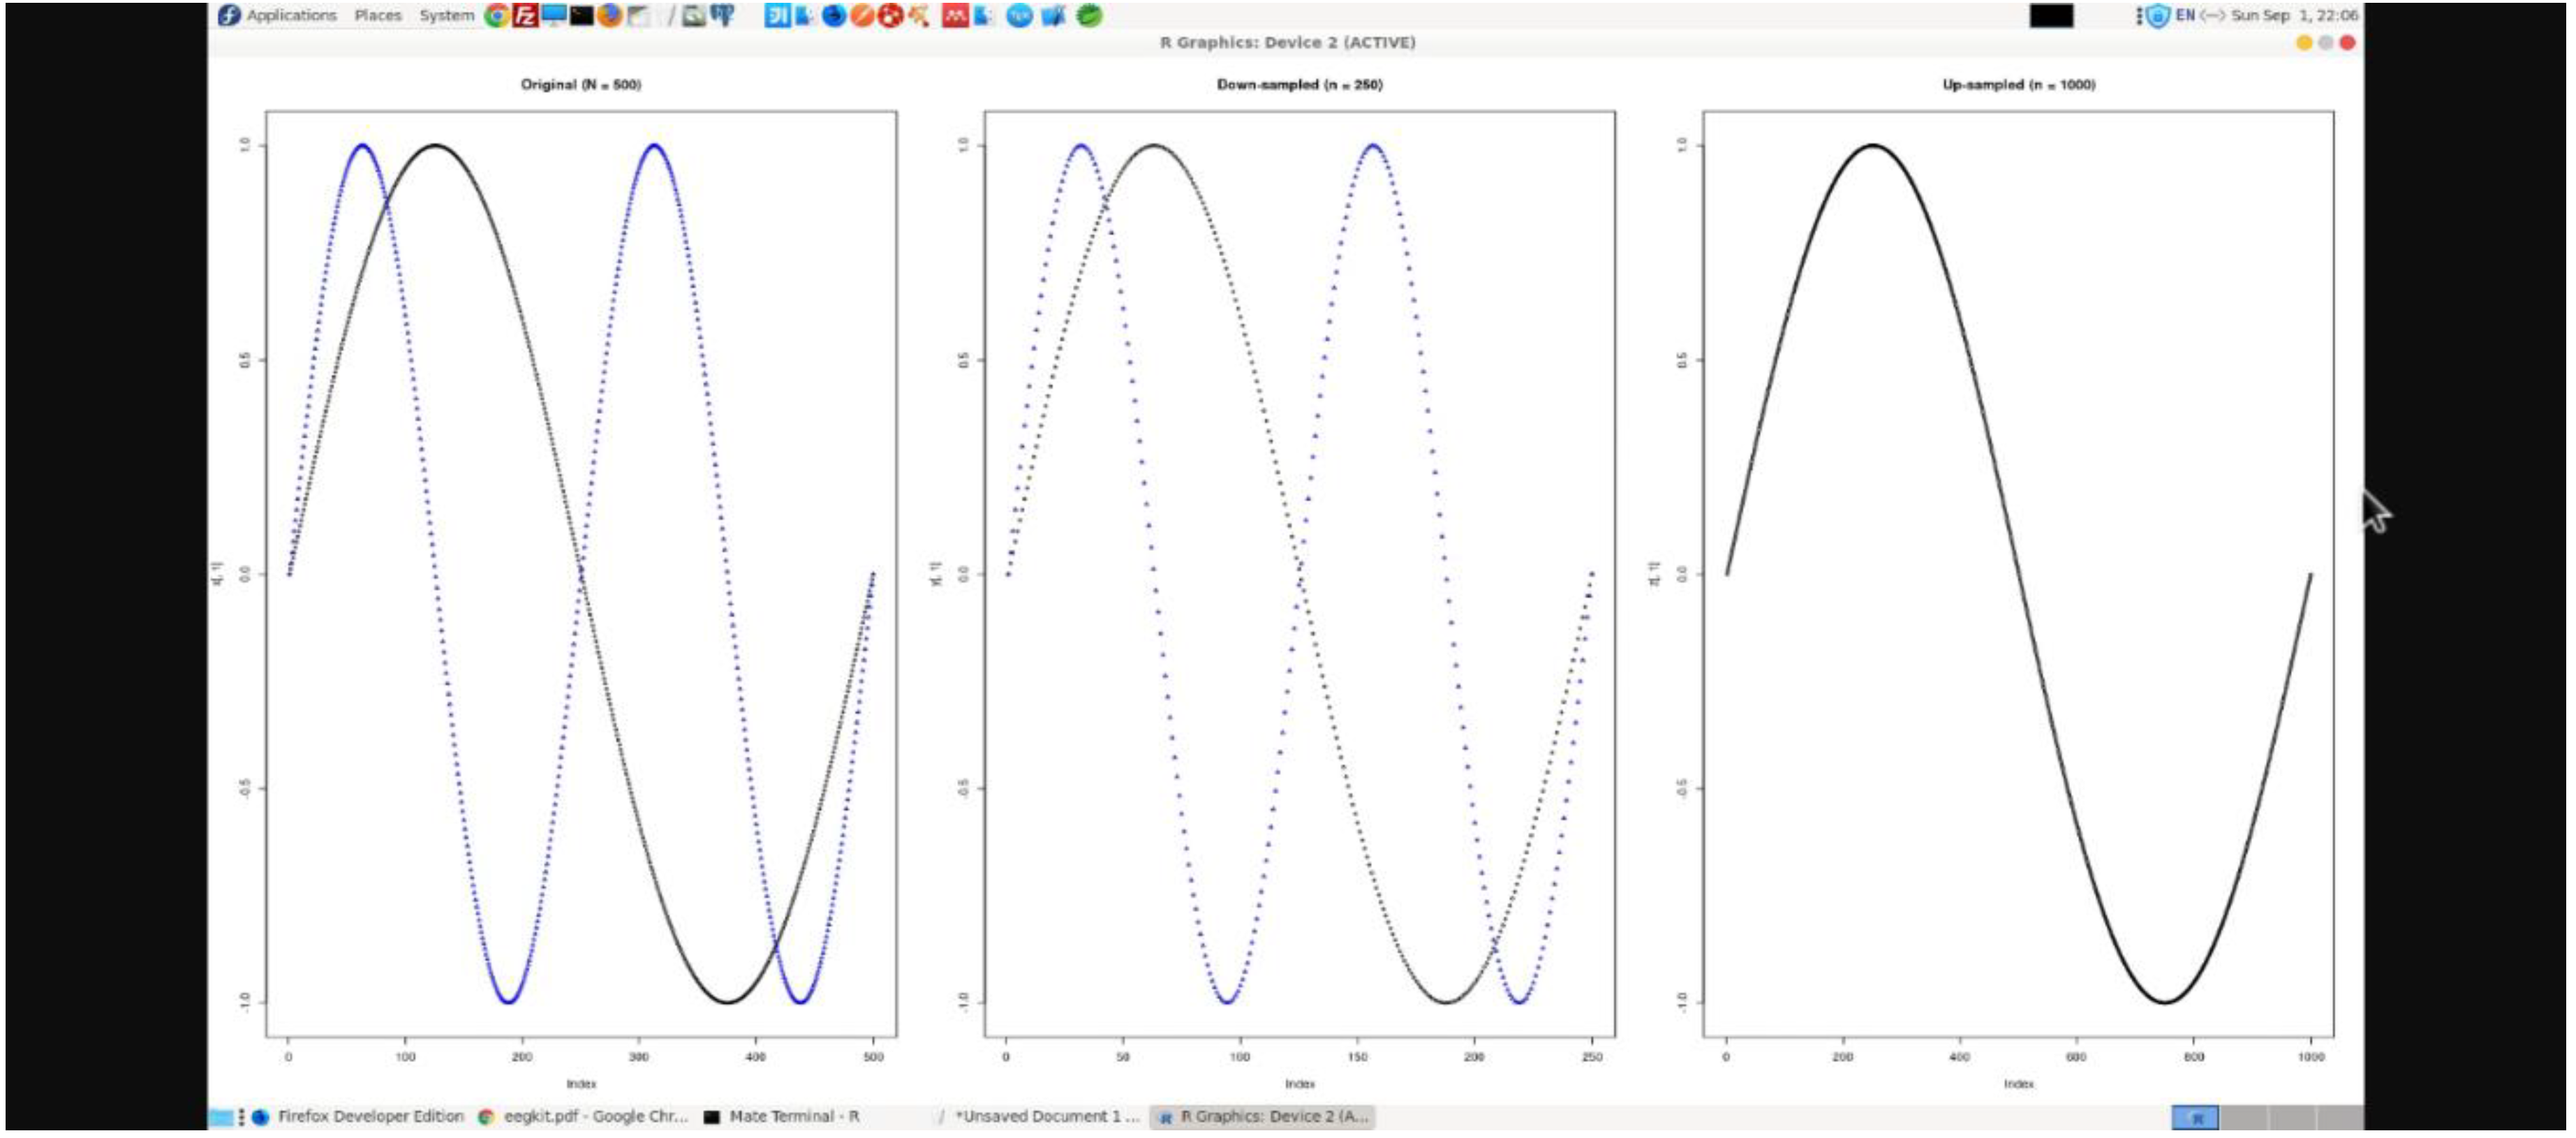
Figure 13.
EEG-fNIRS hybrid setup. [Source: Reproduced under terms of the CC-BY license. [45] Copyright 2022, Authors.].
Figure 13.
EEG-fNIRS hybrid setup. [Source: Reproduced under terms of the CC-BY license. [45] Copyright 2022, Authors.].
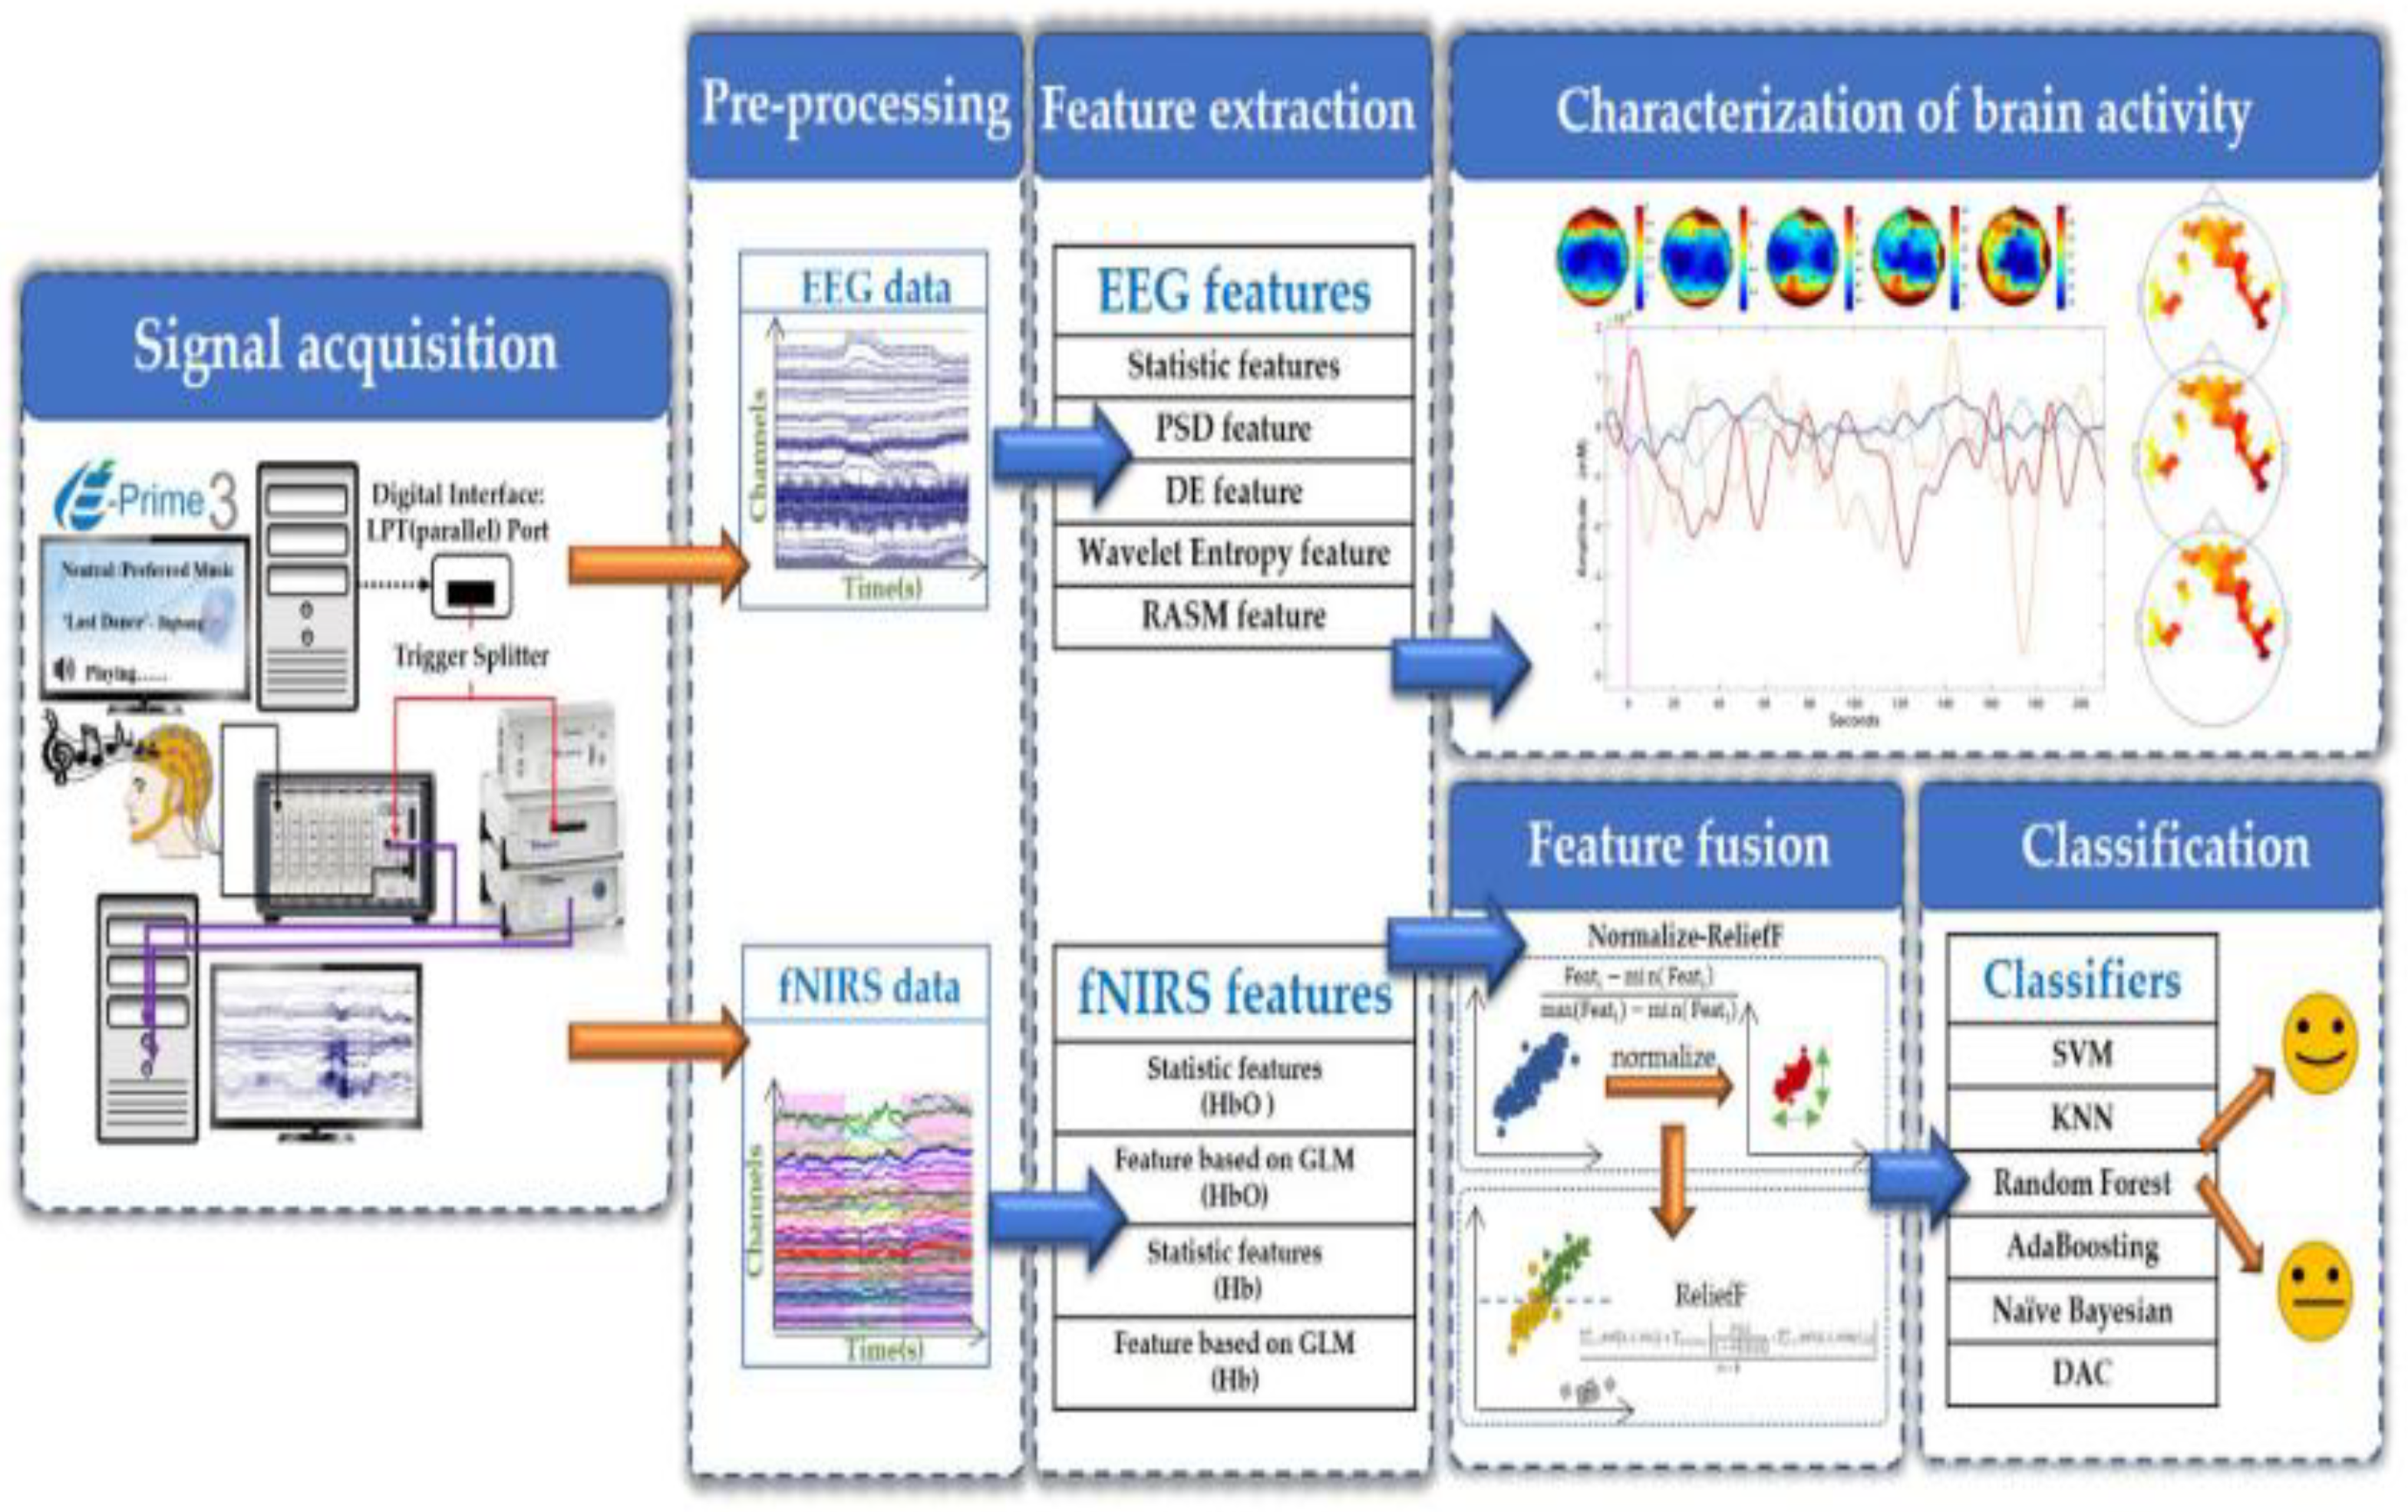
Figure 14.
Schematic diagram of fMRI-fNIRS hybrid setup. [Source: Reproduced under terms of the CC-BY license. [46] Copyright 2017, Authors.].
Figure 14.
Schematic diagram of fMRI-fNIRS hybrid setup. [Source: Reproduced under terms of the CC-BY license. [46] Copyright 2017, Authors.].
Disclaimer/Publisher’s Note: The statements, opinions and data contained in all publications are solely those of the individual author(s) and contributor(s) and not of MDPI and/or the editor(s). MDPI and/or the editor(s) disclaim responsibility for any injury to people or property resulting from any ideas, methods, instructions or products referred to in the content. |
© 2024 by the authors. Licensee MDPI, Basel, Switzerland. This article is an open access article distributed under the terms and conditions of the Creative Commons Attribution (CC BY) license (http://creativecommons.org/licenses/by/4.0/).
Copyright: This open access article is published under a Creative Commons CC BY 4.0 license, which permit the free download, distribution, and reuse, provided that the author and preprint are cited in any reuse.


