
Submitted:
11 June 2024
Posted:
11 June 2024
You are already at the latest version
Abstract
To guide the design and optimization of King Grass (KG) harvesting machinery, this paper studied the cutting characteristics of KG stalks under different physical properties and mechanical parameters. A cutting device that can achieve different parameter adjustments was designed, and indoor cutting experiments were conducted. The results of the single factor experiment show that with the increase of moisture content and stalk height, the ultimate shear stress (USS) and unit-area cutting energy consumption (UCEC) gradually decrease. The optimal range of blade clearance for cutting KG stalks is 2.0-4.0 mm. The optimal value range for oblique cutting angle is 10 ° -40 °. The reasonable range of skew cutting angle is 10 °-20 °. The optimal range for sliding cutting angle is 20 ° - 40 °. The response surface methodology was used to conduct parameter optimization experiments. The regression models were established for various factors and the USS, as well as the UCEC. The optimal combination of cutting parameters has been determined. Under this parameter setting, the USS is 0.4 MPa and UCEC is 3.5 mJ/mm2. The average relative errors between the predicted and experimental values of USS and UCEC were 6.34% and 4.71%, respectively. This indicates that the model can correct reflect the mathematical relationship between various factors and USS and UCEC. This study provides theoretical support for the design of KG harvesting machinery.
Keywords:
King Grass
; cutting characteristics
; experimental device
; parameter optimization
1. Introduction
King Grass (Pennisetum purpureum × P. Americanum, KG) is a perennial forage grass. The annual yield per hectare can reach 200-400 tons, making it a high-yielding and high-quality forage [1,2]. KG is similar to silage corn, sugarcane, etc., with tall and sturdy stalks. Artificial harvesting of KG has low efficiency and high labor costs. To promote the development of the KG industry, it is necessary to develop mechanical equipment suitable for harvesting KG. Cutting is an important part of mechanized harvesting of KG, and the cutting device is the core working component of harvester. The existing KG cutting devices often refer to silage corn harvesters, which causes problems such as high cutting force and high power consumption [3]. Therefore, it is necessary to study the mechanical cutting characteristics of KG under different physical properties and mechanical parameters, to reduce cutting power consumption and improve mechanical reliability.
The cutting process of stalks is closely related to their biological characteristics, physical properties, and cutting component structure, directly affecting their cutting mechanical properties [4]. Scholars have studied the cutting characteristics of stalks in crops such as corn [5,6,7,8], sunflowers [9,10], cotton [11], rice [12], and citrus [13]. The main research focuses on experimental factors such as moisture content, stalk cutting position, and cutting angle to determine the optimal cutting form, thereby reducing cutting energy consumption and cutting stress [14]. Liao et al. [15] studied the mechanical and physical properties of the bottom stalk of Arundo. The distribution of stress and strain during stalk cutting can provide theoretical basis and basic technical parameters for the design of cutting tools and cutting methods. Zhang et al. [4] designed a stalk reciprocating cutting test bench and studied the cutting mechanical characteristics of millet stalks through single-factor experiments and response surface experiments. Kovacs et al. [16] established a complex measurement method that involves in-situ observations and laboratorial experiments after taking into consideration the process of maize harvesting, and analyzed the mechanical behavior of the maize stalk through dynamic cutting experiments. Shi et al. [17] obtained the shear stress-deformation curve of Artemisia selengensis stalk through shear test and conducted the regression fitting of the section area, peak shearing stress and shearing work.
The above research provides a methodological reference for the study of the cutting characteristics of KG stalks. But compared to the crops studied above, the KG stalk has higher hardness and moisture content [18]. And exhibiting more complex mechanical cutting characteristics. There is relatively little research on the mechanical characteristics of cutting KG stalks. Hou et al. [19] measured the stalk shear force, diameter, and linear density. The results showed that the above indicators were positively correlated with the growth height of KG. Considering the mechanical properties and nutritional content, it is believed that the optimal cutting period for KG should be when the plant height is less than 180 cm. Wang et al. [20] conducted experiments on the mechanical properties of KG during the harvest period, and the study found that root diameter, length, and roundness had no significant impact on strength. The structure and moisture content of stalk tissue have a significant impact on stalk strength. The bending and compression characteristics test also shows this influence pattern [21]. Rong [22] conducted tensile, compressive, and pure shear tests using an INSTRON testing machine, and the results showed that the stalks of KG belong to anisotropic materials.
The existing research mainly focuses on the tensile, compressive, and bending characteristics of KG, as well as the construction of stalk mechanical models, lacking research on the mechanical characteristics of KG stalk cutting. The cutting characteristics of KG stalk are important references for the design of key devices such as cutting and crushing. Based on this, this article designed an indoor cutting device to conduct cutting experiments. Furthermore, studying the cutting characteristics of KG stalks under different physical properties and mechanical parameters to reduce cutting stress and energy loss during KG harvesting, and providing theoretical support for the design of KG harvesting machinery.
Specifically, the following were the novel contributions of this study.
(1) Based on the lack of experimental device suitable for cutting KG stalk, this study designed a cutting device that can achieve non-interference adjustment of cutting parameters such as cutting heights, blade clearances, oblique cutting angles (OCA), skew cutting angles (SKCA), and sliding cutting angles (SCA). The above factors will be detailly explained in section 2.2.
(2) This study conducted single-factor cutting experiments on KG stalks under different biological characteristics and mechanical parameters. Specifically, the variation patterns of the ultimate shear stress (USS) and unit-area cutting energy consumption (UCEC) of KG stalks were studied under the effects of different moisture contents, cutting heights, blade clearances, OCA, SKCA, and SCA.
(3) When designing the KG harvester, OCA, blade clearance, and SCA are important parameters for the header structure design. Therefore, based on single-factor experiments, this study further established regression models for the above three factors with USS and UCEC through response surface methodology (RSM). Each combination experiment was repeated 3 times, and the average values of USS and UCEC were calculated. The optimal parameter combination for the cutting device design was experimentally determined.
2. Materials and Methods
2.1. Experimental materials
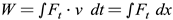
The KG stalks were collected from the planting experimental field of China Agricultural University (38.15 ° N, 114.82 ° E), randomly select stalks without lodging or pests and diseases. The experimental KG is planted asexually with a growth cycle of 100 days. The average height of the KG during the harvest period measured in the field is 216 cm, and the average diameter of a single stalk is 20.36 mm. As the KG is a tillering plant, it is uniformly cut at a distance of 5 centimeters from the ground surface. After retrieving the KG, the diameter and internodes were segmented according to the requirements of the experimental plan, as shown in Figure 1(b). The experimental stalks are stored in sealed bags and stored in a constant temperature box at a temperature of 4.2 °C during the experiment. To ensure the accuracy of the stalk cutting experiment, the experiment should be completed within 24 hours after the stalk was harvested.
2.2. Experimental factors
The factors that affect the cutting characteristics of KG stalk include the biophysical properties of the stalk itself and mechanical cutting parameters. Physical properties include stalk moisture content and cutting height. Mechanical cutting parameters include clearance between moving and fixed blades, OCA, SKCA and SCA. In order to better study the effects of various factors on the cutting characteristics of KG stalks and conduct cutting experiments, screening and analysis of various factors are carried out.
(1) Preliminary analysis of moisture content
Different harvest periods correspond to different moisture content, and the moisture content of KG stalks decreases with the extension of the growth cycle. Studying the cutting characteristics under different moisture contents can provide reference for the selection of suitable harvesting periods for KG [23].
(2) Preliminary analysis of cutting height
Different cutting heights correspond to differences in the internal mechanical tissue of the stalk, exhibiting different mechanical properties. The stalk of KG is composed of stalk nodes and internodes. The stalk nodes and internodes were numbered from the base (Figure 2). Studying the cutting characteristics of different cutting height can provide reference for the design of cutting devices.
(3) Preliminary analysis of blade clearance
The clearance between the moving and fixed blades has a significant impact on the cutting quality of KG, as well as on the fatigue wear the blades. Excessive clearance can cause the stalk to cut continuously, accelerate the speed of fixed blade wear, and increase power consumption. If the clearance is too small, it will increase the difficulty of adjusting the cutter. At the same time, it is easy to cause collision with the cutter, resulting in damage to the cutting blade. Referring to existing research on cutters, the selection range for the blade clearance is 1.35–4.50mm [24,25].
(4) Preliminary analysis of OCA
Oblique cutting refers to a cutting method where the cutting surface is offset from the axis of the stalk, but the cutting direction is perpendicular to the axis of the stalk. The OCA is the design basis for the inclination angle of the harvester header. According to the actual cutting operation requirements, the OCA was selected as 0°–60° [26,27].
(5) Preliminary analysis of SKCA
Skew cutting is the form that the direction of cutting blade speed and the cutting surface are both at a certain angle to the stalk. The SKCA refers to the angle between the cutting blade speed direction and the normal direction of plant fibers, generally selected in the range of 0 ° to 40 ° [28,29].
(6) Preliminary analysis of SCA
Sliding cutting refers to the inclination of the cutting direction with the cutting edge. During sliding cutting, the blade speed can be decomposed into the tangential speed along the cutting edge (sliding cutting speed) and the speed perpendicular to the cutting edge (tangential speed). The SCA refers to the inclination angle of the cutting edge, which is numerically equal to the angle between the tangential speed and the blade speed. The SCA is an important reference for the design of cutting edge lines. Referring to relevant literature [30,31,32], select a sliding angle of 0 °–40 °.
2.3. Design of cutting experimental device
The designed cutting characteristic experimental device is shown in Figure 3, mainly including a moving blade, a fixed blade, two holders, two brackets, a stalk support block, and a stalk bracket. The cutting characteristic experimental device was installed on a universal material testing machine (INSTRON-3367, 30 kN, USA). The top movable blade holder was connected to the high-precision sensor joint of the crossbeam in the testing machine through a pin hole. The bottom fixed blade holder was connected to the horizontal loading platform through a bow shaped spiral clamp. Based on previous research [33], the cutting edge angles for both moving and fixed blades were designed to be 15 °. Meanwhile, the thickness of the blades was designed to be 4 mm. The material of the blades was selected as high-speed steel. The subsequent cutting experiments conducted in this study were all based on the parameters of this cutting blade. The cutting action was completed by driving the moving blade to generate relative motion through the movement of the middle crossbeam. The cutting speed and displacement were controlled by a computer, and the changes in stalk cutting force during the cutting process were recorded.
The cutting characteristic experimental device can achieve the adjustment of parameters such as blade clearance, OCA, SKCA, SCA, etc. As shown in Figure 4, by adjusting the relative position between the fixed blade holder and the universal experimental airborne stage, the cutting clearance between the moving and fixed blades can be adjusted by making the plane of the moving and fixed blades parallel but not overlapping. The measurement and adjustment of blade clearance require the use of a feeler gauge to adjust different cutting clearance according to the experimental plan. As shown in Figure 5 (a), the rotation of the movable and fixed blade holder around the cutting direction of the blade can be achieved through the arc-shaped groove hole on the movable and fixed blade holder. This creates an angle between the cutting plane of the blade and the normal plane of the stalk, achieving the adjustment of the OCA. As shown in Figure 5 (b), the inclination of the stalk axis can be achieved through the slots on the stalk bracket and fixed blade bracket. This creates an angle between the cutting direction of the blade and the normal plane of the stalk, enabling adjustment of the SKCA. As shown in Figure 5 (c), the selection of the direction of the moving blade edge line around the stalk axis can be achieved through the moving blade bracket and the slot holes on the moving blade. This creates an angle between the tangent speed and the cutting direction of the blade, which enables the adjustment of the SCA. The adjustment of three cutting angles can be done independently or simultaneously without conflicting with each other.
2.4. Cutting experiment method
Before the experiment, check whether the connections of each component, data acquisition system, and communication system are normal. Before the experiment, the pre load of the universal material testing machine was set to 10 N and the loading speed was set to 0.8 mm/s. Fix the experimental device for cutting characteristics of KG stems on the workbench of the universal testing machine, and install the moving knife under the lifting connection head of the universal testing machine. The cutting experiment involves continuous cutting of a single stalk. Before the experiment, the external dimension parameters (long axis length and short axis length) of the stalk cutting point are measured, and the stalk is fixed on the cutting fixture (long axis horizontal placement). The cutting speed, sliding angle, oblique angle, cutting inclination angle, and blade inclination angle are adjusted. After the parameter settings are completed, the computer controls the downward movement of the moving knife to cut the stalk and records the changes in cutting force. To reduce experimental errors, each experiment is repeated 3 times. After the experiment is completed, data is recorded and an experimental report is generated.
Using the USS and the UCEC as evaluation indicators, the calculation of indicators is shown in equation 1–4.


Where Fmax is the maximum cutting force of stalk, S is the cross-section area of stalk cutting site, A is the long diameter of stalk, B is the short diameter of stalk, W is the cutting energy consumption, Ft is the cutting force of stalk, v is the cutting speed, x is the cutting displacement.
3. Results and Discussion
3.1. Analysis of the cutting process of stalk nodes and internodes
The transverse section of the stalk of KG is similar to an oval shape. The stalk mainly includes stalk nodes and internodes, which are arranged alternately. The cutting sections of stalk nodes and internodes are shown in Figure 6. The stalk nodes are mainly composed of a thinner outer layer of phloem and an internal fiber bundle. The fiber bundle is evenly distributed and has a high density. The internodes are mainly composed of the phloem, xylem, and core from the outside to the inside. Due to the thin thickness of the phloem, the internodes are divided into two parts during analysis: the scarfskin (phloem + xylem) and the fiber core. Analyze the cutting process of stalk nodes and internodes separately based on the cutting displacement - load curve.
The displacement-load curve during stalk node cutting is shown in Figure 7 (a). From the graph, it can be seen that the cutting load of the stalk node shows a stable increase to the maximum value with the increase of cutting displacement, and then gradually decreases. The rate of load change is relatively stable. This indicates that the internal tissue of the stalk nodes is relatively uniform, which is consistent with the observation of the cutting section (Figure 6a).
The displacement-load curve during the process of internode cutting is shown in Figure 7 (b), from which it can be seen that internode cutting can be divided into:
I. The upper scarfskin compression-cutting stage. The stalk is first squeezed and undergoes plastic deformation under the action of the cutting blade, and then the cutting blade cuts into the upper layer outer skin. The cutting load changes linearly with the increase of cutting displacement, reaching the first peak.
II. Core cutting stage. When the upper outer skin is cut off, the core is mainly cut. The strength of the core is smaller than that of the outer skin, and the cutting load slightly decreases before remaining stable.
III. Lower scarfskin cutting stage. After the core is cut, the lower skin begins to be cut, and the cutting load begins to rise to the second peak.
IV. The stalk is completely cut off: The cutting load is reduced to zero.
Based on the above analysis, the cutting process of stalk nodes and internodes corresponds to their internal tissue structure. The average cutting force of internodes is lower than that of stalk nodes, and the cutting process is more complex. The variation of cutting load with cutting displacement is similar to that of stalk cutting in sugarcane [34], cassava [35], and oil sunflower [36].
3.2. Single-factor experimental analysis
3.2.1. Analysis of moisture content experiment
After collecting KG in the field, the initial moisture content of KG stalks was measured to be 82.25%. The stalks were treated with drying method. Set 30 minutes as the drying time gradient to obtain 7 groups different moisture contents. The moisture content of the other 6 groups were 79.51%, 76.37%, 72.89%, 70.10%, 68.62%, and 66.01%, respectively. Cutting experiments were conducted on the stalks with different moisture contents, and the experimental results are shown in Figure 8.
Figure 8 (a) shows the variation of USS of stalks under different moisture contents. At the initial moisture content (82.25%), the USS at the stalk nodes and internodes is the smallest, at 1.23 MPa and 0.79 MPa, respectively. When the moisture content drops to 66.01%, the USS at the stalk nodes and internodes is 3.74 MPa and 2.65 MPa, respectively. Figure 8 (b) shows the variation of UCEC of stalk under different moisture contents. At the initial moisture content (82.25%), the UCEC of stalk nodes and internodes is the smallest, at 10.74 mJ/mm2 and 5.35 mJ/mm2, respectively. When the moisture content drops to 66.01%, the UCEC of stalk nodes and internodes is the highest, divided into 21.36 mJ/mm2 and 16.7 mJ/mm2. As shown in the figure, with the increase of moisture content, the USS and UCEC of stalk nodes and internodes gradually decrease. The reason is that as the moisture content increases, the dry matter content in the stalk decreases relatively, the cutting resistance decreases, and the difficulty of cutting and destroying decreases. This leads to a corresponding decrease in USS and UCEC [4]. At the same time, under different moisture contents, the USS and UCEC of stalk nodes are higher than those of internodes. This is because at the internodes, the strength of the fibrous tissue near the core is not as high as that near the surface. The stalk nodes are generally dense fiber bundles. Therefore, compared to others, the stalk nodes are more difficult to destroy. When selecting the cutting height, the distribution of internodes should be taken into consideration, and the stalk nodes should be avoided as much as possible to reduce cutting stress. After drying, there were slight differences in the moisture content changes between the inner and outer parts of different stalk segments, resulting in fluctuations in the error band of the experimental results. But the changing trend of USS and UCEC could still be observed.
3.2.2. Analysis of cutting height experiment
Cutting experiments were conducted on stalk nodes and internodes of different heights. Due to the low mechanical strength of the top of the KG, 7 segments of the stalk from the bottom were selected for cutting experiments at different heights. The stalk nodes and internodes within this range are numbered 1-7, respectively. The effects of different cutting heights on stalk cutting characteristics were obtained as shown in Figure 9. Figure 9 (a) shows the variation of USS at different heights of numbered stalk nodes and internodes. Figure 9(b) shows the changes in UCEC of stalk nodes and internodes with different height codes. Due to significant changes in the mechanical properties of the KG stalks in the root area, there were also differences between different stalks in the stalk nodes and internodes numbered 1-2. This caused fluctuations in the error band of USS and UCEC in numbers 1-2. Overall, as shown in the figure, with the number of stalk nodes (internodes) increases, that is, as the height of the stalk increases, the USS and UCEC of stalk nodes and internodes gradually decrease. The reason is that the higher part of the stalk has a lower degree of lignification compared to the lower part, and the mechanical tissue strength is lower. The cutting force and power consumption required for cutting are correspondingly reduced. When considering reducing power consumption and cutting force, a higher cutting height can be chosen, but this can also lead to a decrease in the yield of KG harvest. Meanwhile, the USS and UCEC of the stalk nodes are both larger than those of the internodes, which is similar to the experimental results of studying the effect of water content on cutting characteristics. But as the cutting height increases, the difference between stalk nodes and internodes in the USS and UCEC indicators gradually decreases. This indicates that as the stalk height increases, the influence of fiber bundle tubes on stalk nodes and internodes gradually decreases.
3.2.3. Analysis of blade clearance experiment
This section performs cutting experiments by changing the clearance between the moving and stationary blades. Through the analysis of the blade clearance in section 2.2, the blade clearances were set as 1.35 mm, 1.80 mm, 2.25 mm, 2.70 mm, 3.15 mm, 3.60 mm, 4.05 mm, 4.50 mm for stalk cutting experiments. The influence of different blade clearances on KG stalks is shown in Figure 10. Figure 10 (a) shows the changes in the USS of the KG stalk under different blade clearances, and Figure 10 (b) shows the changes in stalk UCEC under different blade clearances. As shown in the figure, with the increase of blade clearance, the USS and UCEC of stalk nodes and internodes first decrease and then increase. The reason for the analysis is that when the clearance between the cutting blades is small, due to the existence of the cutting blade slope, the stalk will exert a force on the cutting blade slope during the cutting process, causing the moving and fixed cutting blade to stick tightly. This leads to an increase in friction between the moving and stationary blades, with both USS and UCEC being relatively large. As the clearance between the blades increases, the frictional force between the moving and stationary blades decreases, resulting in a decrease in USS and UCEC. When the cutting gap further increases, the moving blade and fixed blade is misaligned during the cutting process. The form of stalk compression and damage changes, and the stalk between the two cutting blades will cause significant compression on the cutting blade during the cutting process, resulting in an increase in friction between the blade and the stalk section, which in turn leads to an increase in USS and UCEC. Meanwhile, both the USS and UCEC of the stalk nodes are larger than those of the internodes. Through comprehensive analysis, the optimal range of blade clearance is 2.0 mm to 4.0 mm.
3.2.4. Analysis of OCA experiment
In this section, an oblique cutting experiment was conducted by changing the angle between the axis of the KG stalk and the blade line, as shown in Figure 11. According to the analysis in section 2.2, the experimental factors OCA were set to 0 °, 10 °, 20 °, 30 °, 40 °, 50 °, and 60 °, respectively. The blade clearance was set to 2 mm, and the SKCA and SCA were set to 0 °. The influence of different OCAs on the cutting characteristics of KG stalks is shown in Figure 12. As shown in the Figure 12, with the increase of OCA, both the USS and UCEC show a trend of first decreasing and then increasing. When the OCA is 0 ° or smaller, the cutting blade needs to overcome a larger axial tensile strength of the stalk during the cutting process, resulting in a larger USS and UCEC. Meanwhile, as the stalk is a viscoelastic material, the ultimate shear stress is related to its normal stress and cohesion. Cohesion is the mutual attraction between stem fibers, which is a manifestation of molecular forces between material molecules. As the OCA increases, the axial tensile strength that needs to be overcome during cutting decreases, making it easy for the fiber tube to tear during cutting, resulting in a decrease in USS and UCEC [4]. When the OCA angle further increases, the equivalent cross-sectional area of the cutting increases, and the length of the cutting edge where the blade participates in work increases, resulting in an increase in USS and UCEC. Through comprehensive analysis of the changes in stalk USS and UCEC, the reasonable range of OCA is determined to be 10°–40°.
3.2.5. Analysis of SKCA experiment
The cutting experiment was conducted by changing the angle between the axis of the KG stalk and the direction of the cutting blade, as shown in Figure 13. According to the analysis in section 2.2, the experimental factors SKCA were set to 0°, 5°, 10°, 15°, 20°, 25°, 30°, 35°, and 40°, respectively. The blade clearance was set to 2 mm, and the OCA and SCA were set to 0°. Set the blade clearance to 2 mm, and set the OCA and SCA to 0 °. The influence of different SKCAs on the cutting characteristics of KG stalks is shown in Figure 14. As shown in the Figure 14, both the USS and UCEC show a trend of rapid decrease followed by slow increase with the increase of SKCA. This is because when the SKCA is 0 ° or smaller, the tool needs to overcome a larger axial tensile strength of the stalk during the cutting process, resulting in a larger USS and UCEC. As the cutting angle gradually increases, the USS and UCEC decrease. This is because the axial tensile strength that the blade needs to overcome decreases. The angle between the cutting speed direction of the blade and the axial direction of the stalk decreases, and the normal force that needs to be overcome to cut the axial fibers decreases [36]; The wedge angle of the cutting blade decreases in disguise and becomes sharper. When the SKCA is between 10 ° and 20 °, USS and UCEC are the smallest. As the SKCA further increases, USS and UCEC continue to increase. This is because when the wedge angle of the cutting blade is too small, it can cause a sharp increase in the normal force required to cut the stalk fibers, which can easily lead to blade damage. The effect of increasing the cutting cross-sectional area exceeds the impact of increasing the SKCA. By comprehensively analyzing the changes of stalk USS and UCEC, the reasonable range of SKCA is determined to be 10 °–20 °.
3.2.6. Analysis of SCA experiment
Sliding cutting experiment was performed by changing the angle between the cutting direction and the blade edge. According to the analysis in section 2.2, the experimental factors SCA were set to 0°, 10°, 20°, 30°, 40° and 50°, respectively. The blade clearance was set to 2 mm, and the OCA and SKCA were set to 0°. Set the blade clearance to 2 mm, and set the OCA and SKCA to 0 °. The influence of different SCAs on the cutting characteristics of KG stalks is shown in Figure 15. As shown in the figure, the USS gradually decreases with the increase of SCA. When the SCA increases to 30 °, the change in USS is relatively small. The UCEC shows a trend of first decreasing and then increasing with the increase of SCA. As the SCA increases initially, the actual wedge angle of the blade cutting into the stalk decreases, the required normal force decreases, and the USS and UCEC decrease. In addition, the cutting edge of the blade exhibits a small serrated shape at the microscopic level, and there is also sawing phenomenon during the cutting process, resulting in more energy-efficient cutting. As the SCA further increases, the cutting displacement of the blade increases. The increase in friction energy consumption during the sliding process has a greater impact than the decrease in energy consumption caused by the increase in sliding displacement, resulting in an increase in USS and UCEC. The above results also correspond to the Goryachkin’s mechanical tests [37]. Through comprehensive analysis of the changes in stalk USS and UCEC, the reasonable range of SCA is determined to be 20 °–40 °.
4. Response surface experiment
4.1. Experimental design
When designing the KG harvester, the cutting characteristics of the KG stalk at different OCAs, blade clearances, and SCAs have a significant impact on the structural design of the cutting devices. Therefore, based on the single-factor experiment, the response surface method (RSM) was adopted to further study the impact of the interaction between the three factors of OCA, blade clearances, and SCA on the cutting performance of KG stalk. Select Box-Behnken experimental design to determine the optimal combination of cutting parameters [38]. Using the USS (Y1) and UCEC (Y2) as experimental indicators, the calculation method is shown in equations 1-4. According to the single-factor experiment in Section 3.2, the reasonable range of values for the OCA is 10 °–40 °. The optimal range for the blade clearance is 2.0–4.0 mm. The reasonable range for determining the SCA is 20 °–40 °. The cutting height chosen is 10–15cm, which is commonly used for harvesting KG, with the cutting position at the second internode. Considering the conventional design of the KG harvester, the SKCA is set to 0 °. The coding values of the experimental factors are shown in Table 1. The length and short diameters of the cut stalk were measured before each experiment, and the cross-sectional area was calculated. Each experimental combination was repeated three times and the average values of Y1 and Y2 were calculated. The test plan and results are shown in Table 2.
4.2. Results and discussion of RSM experimental
4.2.1. Analysis of the USS
Design Expert 12.0 was used to design the Box-Behnken test. The experimental data was processed and obtain the regression equations for the USS and various factors as follows:
Analysis of variance (ANOVA) was used to measure the equation's fit and evaluate the significance of the model (Equation 5). The results of the ANOVA are shown in Table 3. According to Table 3, the Model F-value of 17.92 implies the model is significant. There is only a 0.05% chance that an F-value this large could occur due to noise. The Lack of Fit F-value of 3.10 implies the Lack of Fit is not significant relative to the pure error. The P-value of the OCA , the blade clearance , the square term of OCA, the square term of blade clearance and the square term of SCA are all less than 0.01, indicating that the above items have a very significant impact on ultimate shear stress. The P-value of the SCA , the interaction between the OCA and the blade clearance are less than 0.05, indicating that the two items have a significant impact on USS.
The insignificant factors were removed, and the optimized regression equation was obtained as follows:
Figure 16 shows a diagnostic plot of the residuals from the quadratic model. Figure 16 (a) presents a normal plot of residuals, which are close to a straight line, again illustrating the adequacy of the model in describing the relationship between the factors and the USS. Figure 16 (b) is a plot of the residuals against the predicted values of the Eq.6. The residuals are randomly scattered, with the more scattered and irregular indication of the better prediction of the Equation [39]. Figure 16 (c) displays a comparison of the predicted and tested values of the USS. The linear distribution reflects a good model fit, allowing for the analysis and prediction of USS based on variable values.
The effect of the interaction between the OCA and the blade clearance on the USS is shown in Figure 17. The contours corresponding to the OCA are denser indicating that its influence on the USS is relatively significant. When the blade clearance is constant, the USS shows a slow decrease firstly and then a rapid increase trend with the increase of the OCA. When the OCA is in the range of 16°–28°, the USS is lesser. When the OCA is constant, the USS shows a decrease firstly and then a increase trend with the increase of the blade clearance. When the blade clearance is in the range of 2.5–3.5 mm, the USS is lesser. Due to the interaction, when the OCA is different, the influence trend of the blade clearance on the USS is different. Similarly, when the blade clearance is different, the influence trend of the OCA on the USS is also different.
4.2.2. Analysis of the results of the UCEC
The experimental data was processed and obtain the regression equations for the UCEC () and various factors as follows:
The results of the ANOVA of Equation 6 are shown in Table 4. The fit of the model (Equation 6) is extremely significant (P<0.01). The Lack of Fit F-value of 5.56 implies the Lack of Fit is not significant relative to the pure error. The P-value of the and are less than 0.05, indicating that the blade clearance and the sliding cut angle have a significant impact on UCEC. The P-value of are all less than 0.01, indicating that the above items have a very significant impact on UCEC. The insignificant factors were removed, and the optimized regression equation was obtained as follows:
Figure 18 shows a diagnostic plot of the residuals from the quadratic model. This demonstrates the adequacy of the model in describing the relationship between factors and UCEC. According to Eq.8, reasonable prediction and analysis of mixing energy consumption can be achieved.
Response surface analysis was performed on the regression model to obtain the interaction effect of factors on UCEC, as shown in Figure 19. Figure 19 (a) shows the impact of the interaction between and on UCEC. The contour lines of are denser than those of , indicating that has a more significant impact on UCEC. When is a constant value, UCEC shows a trend of first decreasing and then increasing with the increase of . When the is in the range of 2.5 ~ 3.5 mm, the UCEC is lesser. When is a constant value, there is no significant fluctuation in the variation of UCEC with , indicating that has no key effect on UCEC. Figure 19 (b) shows the impact of the interaction between and on UCEC. The contour lines of are denser than those of , indicating that has a more significant impact on UCEC. When is a constant value, with the increase of , UCEC shows a trend of first rapidly decreasing and then rapidly increasing. When is a constant value, with the increase of , UCEC shows a trend of first slowly increasing and then slowly decreasing. When the is in the range of 25°-35°, the UCEC is lesser. Figure 19 (c) shows the impact of the interaction between and on UCEC. As shown in the figure, the contour lines exhibit an elliptical shape with a large curvature, indicating that the interaction between and has a significant impact on UCEC. When is a constant value, UCEC shows a trend of first rapidly decreasing and then rapidly increasing with the increase of . When is a constant value, UCEC shows a trend of first rapidly decreasing and then rapidly increasing with the increase of .
4.3. Parameter optimization and discussion
To determine the optimal combination of cutting parameters for KG stalk, the minimum values of USS and UCEC were taken as optimization objectives, and the optimization factors of OCA, blade clearances, and SCA were analyzed. The objective and constraint equation system are as follows.
Using the parameter optimization module of Design Expert software, with the minimum values of USS and UCEC as the optimization objective, the optimal values for each factor are ultimately obtained as follows: is 16.9°, is 3.1 mm, is 30.2°. Substitute the optimized factor values into the regression model (equations 6 and 8), and the predicted values for USS and UCEC were 0.4 MPa and 3.5 mJ/mm2 , respectively.
To further verify the accuracy of the model, actual experiments were conducted on a universal material testing machine using the determined parameter values. The OCA was set to 16.9 °, the Blade clearance was set to 3.1 mm, and the SCA was set to 30.2 °. The experiments were repeated three times, and the experimental data was recorded as shown in Table 5.
As shown in Table 5, By substituting the optimized factor values into the regression model, the predicted value of USS is 0.42 MPa. The USS value for three actual cutting experiments were 0.45 MPa, 0.44 MPa and 0.39 MPa, respectively. The average relative error between predicted and actual values was 6.34%. Meanwhile, the predicted value of UCEC is 3.47, and the value of UCEC in the three actual cutting experiments is 3.62 mJ/mm2, 3.79 mJ/mm2 and 3.45 mJ/mm2, respectively. The average relative error of UCEC between predicted and actual values was 4.71%. The above results indicate that the models (Equation 6 and 8) can better reflect the mathematical relationship between various factors and USS and UCEC. Based on this model, the calculated optimal parameter combination is credible. Accordingly, the optimal cutting parameter combination for the KG stalk was ultimately determined as OCA is 16.9 °, Blade clearance is 3.1 mm, and SCA is 30.2 °.
5. Discussion
At present, KG mostly uses a universal grass harvester for harvesting. But KG has the characteristics of high biomass and high stalk strength. The existing machines have problems such as broken cutting blades and high power consumption when harvesting KG. Existing research on the mechanical properties of KG stalks mainly involves experiments such as tension, compression, and bending [19,20,21,22]. These studies can provide reference for KG simulation models and conveying device design. But when designing the KG harvester, it is necessary to first study the cutting characteristics of the KG stalks. This study focused on the unclear effects of different biological and physical parameters on the cutting characteristics of KG stalks in the design of KG harvesters, and conducted experimental research on the cutting characteristics of KG. Providing parameter references for the design of the KG harvester. The cutting characteristics of KG stalk are influenced by multiple factors such as cutting position, blade clearance, and cutting angle (OCA, SKCA, and SCA). Meanwhile, the interaction of different factors may also have an impact on cutting characteristics. The existing device for mechanical testing of KG can only achieve single functions such as fixation and clamping [21,22]. In response to this issue, this study designed a cutting device that can achieve non-interference adjustment of cutting parameters such as cutting heights, blade clearances, OCA, SKCA, and SCA. The reliability of the cutting device was verified in the single factor experiment and response surface experiment of this study.
In the single factor experiment section, this article conducted stalk cutting experiments under different moisture contents, cutting heights, blade clearances, OCA, SKCA, and SCA. The experimental results indicated that the USS of internodes is lower than that of stalk nodes, and the cutting process is more complex. This corresponds to the biological tissue composition of the two parts. The results of stalk cutting experiments on sugarcane [34], millet [4], and sunflower [36] were similar to those of this study. As the height of the stalk increases, the USS and UCEC of the stalk nodes and internodes gradually decrease. The main reason is that as the height increases, the moisture content of the stalk continuously increases, and the mechanical properties of the stalk decrease. This conclusion is similar to the research results of Wang et al. on Citrus fluid stacks [13]. Through experiments at different cutting angles, it was found that as the angle increases, both USS and UCEC exhibit a pattern of first decreasing and then increasing. This is related to the internal fiber arrangement of the stalk and the interaction between the stalk and the cutting blade [41]. Through the analysis of single factor experiments, the optimal range of blade clearance for cutting KG stalks was defined as 2.0–4.0 mm. The reasonable range of OCA was defined as 10 °–40 °. The reasonable range of SRCA was defined as 10 °–20 °. The reasonable range of SCA was defined as 20 °–40 °.
When designing the header of the KG harvester, OCA, blade clearance and SCA are important parameters in structural design. In the structural parameters of the KG harvester, the OCA generally corresponds to the overall inclination angle of the cutting table, that is, the angle between the cutting blade and the horizontal plane. The blade clearance corresponds to the distance between the fixed and moving blades in the cutter. The SCA is a direct reference for the design of the cutting edge curve, and a reasonable design of the cutting edge line can reduce power consumption and blade damage. Meanwhile, it is generally believed that the interaction of these three factors will also have an impact on the cutting performance of the harvester. Therefore, further research is needed on the values and optimal combinations of the above three factors.
This study used RSM for orthogonal optimization experiments. A quadratic polynomial regression model was established for OCA, blade clearance and SCA regarding USS. The significance analysis showed that both OCA, blade clearance and SCA have a significant impact on USS. This was similar to Ma's research conclusion on lettuce roots [26]. Zhang et al.'s study on the cutting of millet stalks also showed the effect of OCA and SCA on cutting force [4]. Meanwhile, the interaction of OCA and blade clearance also had a significant impact on USS. It is necessary to determine the optimal parameter combination through optimization experiments. In addition, regression models of OCA, blade clearance and SCA for UCEC had also been established. The significance analysis indicated that changes in blade clearance and SCA will have a significant impact on UCEC. The OCA did not have a significant impact on UCEC, but the interaction between OCA and blade clearance and SCA had a significant impact on UCEC. Therefore, when designing the inclination of the cutting table, it is necessary to comprehensively consider the clearance between the moving and fixed blades and the SCA. Based on the above analysis, we used above two regression models to optimize the design of factors. Using Design Expert professional software, optimize each factor with the goal of minimizing the values of USS and UCEC. The final optimal value for OCA was 16.9 °. Existing research on different crops [10,26] shows that the value range of OCA is 7 °–20 °. The value of OCA in this study is also within this range. Due to the insignificant individual impact of OCA on UCEC, more attention should be paid to the impact of OCA on USS in order to improve the structural reliability of harvesting machinery. The blade clearance was determined to be 3.1 mm. This value is larger than the optimal 1.66 mm for hydroponic lettuce [26]. This may be related to the fact that the stalk of the KG has a harder outer skin. The outer skin of KG contains fibers with high tensile strength, and a small clearance can cause significant cutting resistance between the moving and fixed blades. Therefore, when designing the cutting device of the KG harvester, a larger blade clearance can be appropriately selected. The existing research [31,32] results on SCA indicate that the range of slip cutting angle is generally between 20 ° -35 °. Increasing the SCA appropriately can reduce the theoretical blade angle and produce a sawing effect. This will reduce the cutting force. But if the SCA is too large and the cutting displacement increases, it will also increase the cutting power consumption. In this study, SCA was ultimately determined to be 30.2 °. This result can provide reference for the cutting edge lines of the KG harvester.
The validation experiment was conducted additionally, and the results showed that the average relative errors between the predicted and experimental values of USS and UCEC were 6.34% and 4.71%, respectively. This indicated that the model in this study can correct reflect the mathematical relationship between various factors and USS and UCEC.
In addition, this study investigated the cutting characteristics of KG stalks under different physical and mechanical cutting parameters through indoor static experiments. Due to the complexity of actual agricultural operations, the obtained cutting parameters need to be applied in the design of future KG harvesters. Further field experiments are necessary to verify the reliability of the experimental results in improving the quality of KG harvest.
6. Conclusions
(1) A cutting characteristic experimental device was designed for indoor cutting experiments of KG stalks based on their physical characteristics and cutting experimental requirements. The experimental device, combined with a universal experimental machine, can achieve non-interference adjustment of cutting parameters such as cutting position, cutting clearance, and cutting angle (OCA, SKCA, and SCA).
(2) Using USS and UCEC as experimental indicators, the single-factor cutting experiments were conducted under different biological characteristics and mechanical parameters. The experimental results indicate that the USS of internodes is lower than that of stalk nodes, and the cutting process is more complex. As the moisture content increases, the USS and UCEC of stalk nodes and internodes gradually decrease. As the height of the stalk increases, the USS and UCEC of the stalk nodes and internodes gradually decrease. The optimal range of blade clearance for cutting KG stalks is 2.0–4.0 mm. The reasonable range of OCA is 10 °-40 °. The reasonable range of SRCA is 10 °–20 °. The reasonable range of SCA is 20 °–40 °.
(3) Based on the RSM, parameter optimization experiments were conducted, and the regression models were established for the experimental factors (OCA, blade clearance, SCA) and indicators (USS and UCEC). The optimal parameter combination for determining the parameters of the cutting device design as: OCA is 16.9 °, blade clearance is 3.1 mm, and SCA is 30.2 °. Under this parameter setting, the USS is 0.4 MPa and the UCEC is 3.5 mJ/mm2. Through verification experiments, it was found that the average relative errors between the predicted and experimental values of USS and UCEC were 6.34% and 4.71%, respectively. This indicates that the model can correct reflect the mathematical relationship between various factors and USS and UCEC. The above conclusion can provide parameter support for the design of the KG harvester. That is, the optimal value for the incidence angle of the KG harvester's cutting table is 16.9 °. The optimal distance between the moving and fixed blades of the cutter is 3.1 mm. The optimal angle of the cutting edge of the cutter is 30.2 °.
Author Contributions
Methodology, X.L. and S.B.; investigation, X.L.; data curation, S.B.; writing—original draft preparation, X.L. and S.B.; writing—review and editing, H.Y.; project administration, D.C. and Y. All authors have read and agreed to the published version of the manuscript.
Funding
This research was supported by the earmarked fund for China Agriculture Research System, grant number CARS-34, the National Natural Science Foundation of China, grant number 32301715, the China Postdoctoral Science Foundation, grant number 2022M722819 and the Science Foundation of Zhejiang Sci-Tech University, grant number 22242259-Y. Thanks for all your support.
Institutional Review Board Statement
Not applicable.
Data Availability Statement
The data presented in this study are available on demand from the corresponding author or first author.
Acknowledgments
We thank the anonymous reviewers for providing comments and suggestions that improved the manuscript.
Conflicts of Interest
The authors declare no conflicts of interest.
References
- Zhao, J.; Xia, B.; Meng, Y.; Yang, Z.; Pan, L.; Zhou, M. Transcriptome Analysis to Shed Light on the Molecular Mechanisms of Early Responses to Cadmium in Roots and Leaves of KG (Pennisetum americanum × P. purpureum). International Journal of Molecular Sciences. 20(10) (2019) 2532. [CrossRef]
- Li, M.; Zi, X.; Tang, J.; Zhou, H.; Cai, Y. Silage fermentation, chemical composition and ruminal degradation of KG, cassava foliage and their mixture. Grassland Science, 65(4) (2019) 210-215. [CrossRef]
- Huan, X.; Wang, D.; You, Y.; Ma, W.; Zhu, L.; Li, S. Establishment and calibration of discrete element model of KG stalk based on throwing test. INMATEH-Agricultural Engineering. 66 (01) (2022) 19-30. [CrossRef]
- Zhang, Y.Q.; Cui, Q.L.; Guo, Y.M.; Li, H.B. Experiment and Analysis of Cutting Mechanical Properties of Millet Stem. Transactions of the Chinese Society for Agricultural Machinery. 2019, 50 (04): 146-155+162. [CrossRef]
- Dong, R. Simulation and Experimental Study on Cutting Process of Silage Corn Harvesting Header. Master’s Thesis, Jilin University, Changchun, 2020. [Google Scholar] [CrossRef]
- Chen, Z.G.; Qu, G. Shearing Characteristics of Corn Stalk Pith for Separation. Bioresources, 2017,12(2)2296-2309.
- Igathinathane, C.; Womac, A.R.; Sokhansanj, S. Corn stalk orientation effect on mechanical cutting. Biosystems Engineering, 2010, 107(2):97-106. [CrossRef]
- Xia, Y.D.; Klinger, J.; Bhattacharjee, T.; Thompson, V. The elastoplastic flexural behaviour of corn stalks. Biosystems Engineering, 2022, 216: 218-228. [CrossRef]
- Jin, W.; Ding, Y.C.; Bai, S.H.; Zhang, X.J.; Yan, J.S.; Zhou, X.C. Design and experiments of the reel board header device for an oil sunflower harvester. Transactions of the Chinese Society of Agricultural Engineering, 2021, 37(3): 27-36. [CrossRef]
- Liu, Y.; Huang, X.M.; Ma, L.; Zong, W.Y.; Zhan, G.C.; Lin, Z.X. Design and Test of Static Sliding Cut Angle Constant Cutting Machine for Chain Oil Sunflower Harvester Header. Transactions of the Chinese Society for Agricultural Machinery. 2021, 52 (01): 99-108. [CrossRef]
- Song, Z.H.; Song, H.L.; Geng, A.J.; Li, Y.D.; Yan, Y.F.; Li, F.D. Experiment on cutting characteristics of cotton stalk with double supports. Transactions of the Chinese Society of Agricultural Engineering, 2015, 31(16): 37-45. [CrossRef]
- Huang, M.S.; Li, Y.M.; Chen, A.Y.; Xu, L.Z. Design and Test of Double-cutterbar structure on wide header for main crop rice harvesting. Applied Sciences, 2020, 10(13): 4432. [CrossRef]
- Wang, Y.; Yang, Y.; Zhao, H.M.; Liu, B.; Ma, J.T.; He, Y.; Zhang, Y.T.; Xu, H.B. Effects of cutting parameters on cutting of citrus fruit stems. Biosystems Engineering, 2020, (193): 1-11.
- Luo, H.F.; Guo, S.J.; Zhi, Z.K.; Kan, J.M. Sliding Cutting and Cutting Parameters of Concentric Curvilineal Edge Sliding Cutter for Caragana korshinskii (CK) Branches. FORESTS. 2023, 14(12), 2379. [Google Scholar] [CrossRef]
- Liao, Y.Y.; Liao, Q.X.; Tian, B.P.; Shu, C.X.; Wang, J.; Ma, A.L. Experimental research on the mechanical physical parameters of bottom stalk of the A rundo donax L. in harvesting period. Transactions of the CSAE, 2007, 23(4), 124-129.
- Kovacs, A.; Kerenyi, G. Physical characteristics and mechanical behaviour of maize stalks for machine development. International Agrophysics, 2019, 33(4). 427-436. [CrossRef]
- Shi, Y.Y.; Chen, M.; Wang, X.C.; Zhang, Y.N.; Odhiambo, M.O. Experiment and analysis on mechanical properties of artemisia selengensis stalk[J]. International journal of agricultural and biological engineering, 2017, 10(2), 16-25. [CrossRef]
- Ye, B.N. Experimental Study on Key Technologies and Devices for Harvesting KG. Ph.D. Thesis, China Agricultural University, Beijing, 2020. [Google Scholar]
- Hou, G.Y.; Li, M.; Zi, X.J.; Zhou, H.L.; Liu, G.D. Correlations of Physical Properties and Feeding Value of KG Stem. Acta Ecologiae Animalis Domastici. 2016,37(11):68-73.
- Wang, S.; Du, J.H.; Zhao, L.; Jiao, J.; Li, Z.X.; Xue, Z. Tensile and Shearing Strength Properties of the Stems of KG (Pennisetum sinese Roxb). Chinese Journal of Tropical Crops. 2019,40(06):1188-1194. [CrossRef]
- Wang, S.; Du, J.H.; Zhao, L.; Li, Z.X.; Jiao, J.; Xue, Z.; Sun, Q.F. Strength characteristics of bending and compression of KG stem. Jiangsu Agricultural Sciences. 2019,47(22):264-268. [CrossRef]
- Rong, X. Optimization of cutting process for KG stalk with rolling cutter. Master’ Thesis, China Agricultural University, Beijing, 2017. [Google Scholar]
- Zhang, Y.; Zhou, H.L.; Liu, G.D.; Wang, J. Effect of Moisture Content on the Quality of KG Silage at Different Growing Stages. Journal of Domestic Animal Ecology. 2013,34(07):39-43.
- Zhao, X.L. Design and Research for the Stalk Chopping and Recovery Device of Corn Combine Reaping Both Stalk and Spike. master’ Thesis, China Academy of Agricultural Mechanization Sciences, Beijing, 2014.
- Bie, Z.J. Finite Element Simulation Analysis of the Cutting Process of Chaff Cutter and Experimental Study on the Performance of the Cutter. master’ Thesis, Inner Mongolia Agricultural University, Hohhot,2019. [CrossRef]
- Ma, Y.D. Devices and Key Technologies for Whole Hydroponic Lettuce Harvesting with Low Damage. Ph.D. Thesis, Northwest A&F University, Xianyang, 2019. [Google Scholar] [CrossRef]
- Wang, H.M. Experimental Study on the Factors Influencing the Cutting Performance of Sunflower Stalk. Master’ Thesis, Inner Mongolia Agricultural University, Hohhot, 2018. [Google Scholar]
- Li, Y.M.; Qin, T.D.; Chen, J.; Zhao, Z. Experimental study and analysis on mechanical property of corn stalk reciprocating cutting. Transactions of the CSAE, 2011, 27(1): 160-164. [CrossRef]
- Jiang, T.; Hou, J.L.; Li, T.H.; Shao, Y.Y.; Wang, Z.; Liu, L. Field Reciprocating Cutting Test Bench for Cron Stalks. Transactions of the Chinese Society for Agricultural Machinery. 2013,44(S2):32-36. [CrossRef]
- Yang, Z. Experimental Study on the Cutting Performance of Sunflower Stalk. Master’ Thesis, Inner Mongolia Agricultural University, Hohhot, 2019. [Google Scholar] [CrossRef]
- Yan, L.Y. An approach to the sliding cutting angle of the working parts of agricultural machinery. Acta Agricultural Universitatis Jiangxiensis. 1991, 13(1). [CrossRef]
- Xiang, J.W.; Yang, L.F.; Li, S.P. Experimental investigation of the basecutter for minitype sugarcane harvester. Transactions of the CSAE 2007, 23, 158–163. [Google Scholar]
- Gu, X.W. Design and Experiment Study on the Test Bench for Cutting King Grass. Master’ Thesis, China Agricultural University, Beijing, 2018. [Google Scholar]
- Xie, L.X.; Wang, J.; Cheng, S.M. Zeng, B.S.; Yang, Z.Z. Optimisation and finite element simulation of the chopping process for chopper sugarcane harvesting. Biosystems Engineering, 2018, 175: 16-26. [CrossRef]
- Xue, Z.; Zhang, J.; Zhang, Y.L.; Li, C.B.; Chen, S. Test and analysis on the mechanical properties of cassava stalks. Journal of Animal and Plant Sciences 2015, 25, 59–67. [Google Scholar]
- Jin, W.; Ding, Y.C.; Bai, S.H. , et al. Design and experiments of the reel board header device for an oil sunflower harvester. Transactions of the Chinese Society of Agricultural Engineering, 2021, 37(3): 27-36. [CrossRef]
- He, Z.T.; Ding, H.L.; Li, J.; Zhang, Y.Z. Review of Researches on Stalk Cutting. Machinery Design & Manufacture. 2023(08):277-284. [CrossRef]
- Awan, M.R.; Rojas, H.A.G.; Benavidas, J.I.P.; Hameed, S.; Hussain, A.; Egea, A.J.S. Specific energy modeling of abrasive cut off operation based on sliding, plowing and cutting[J].Journal of Materials Research and Technology, 2022. [CrossRef]
- Xie, L.X.; Wang, J.; Cheng, S.M.; Zeng, B.S. Yang, Z.Z. Optimization and dynamic simulation of a conveying and top breaking system for whole-stalk sugarcane harvesters. Biosystems Engineering. 197 (2020) 156-169. [CrossRef]
- Feng, X.; Gong, Z.; Wang, L.; Yu, Y.T.; Liu, T.H.; Song, L.L. Behavior of maize particle penetrating a sieve hole based on the particle centroid in an air-screen cleaning unit. Powder Technology. 2021(385) 501-516. [CrossRef]
- Galedar, M.N.; Jafari, A. Mohtasebia, S. S.; Tabatabaeefar, A.; Sharifi, A.; O'Dogherty, M. J.; Rafiee, S.; Richard, G. Effects of moisture content and level in the crop on the engineering properties of alfalfa stems. Biosystems Engineering.2008, 101(2): 199-208. [CrossRef]
Figure 1.
Experimental King grass (KG) stalks. a. Growth morphology of KG in the field b. Experimental use of KG stalk segments
Figure 1.
Experimental King grass (KG) stalks. a. Growth morphology of KG in the field b. Experimental use of KG stalk segments
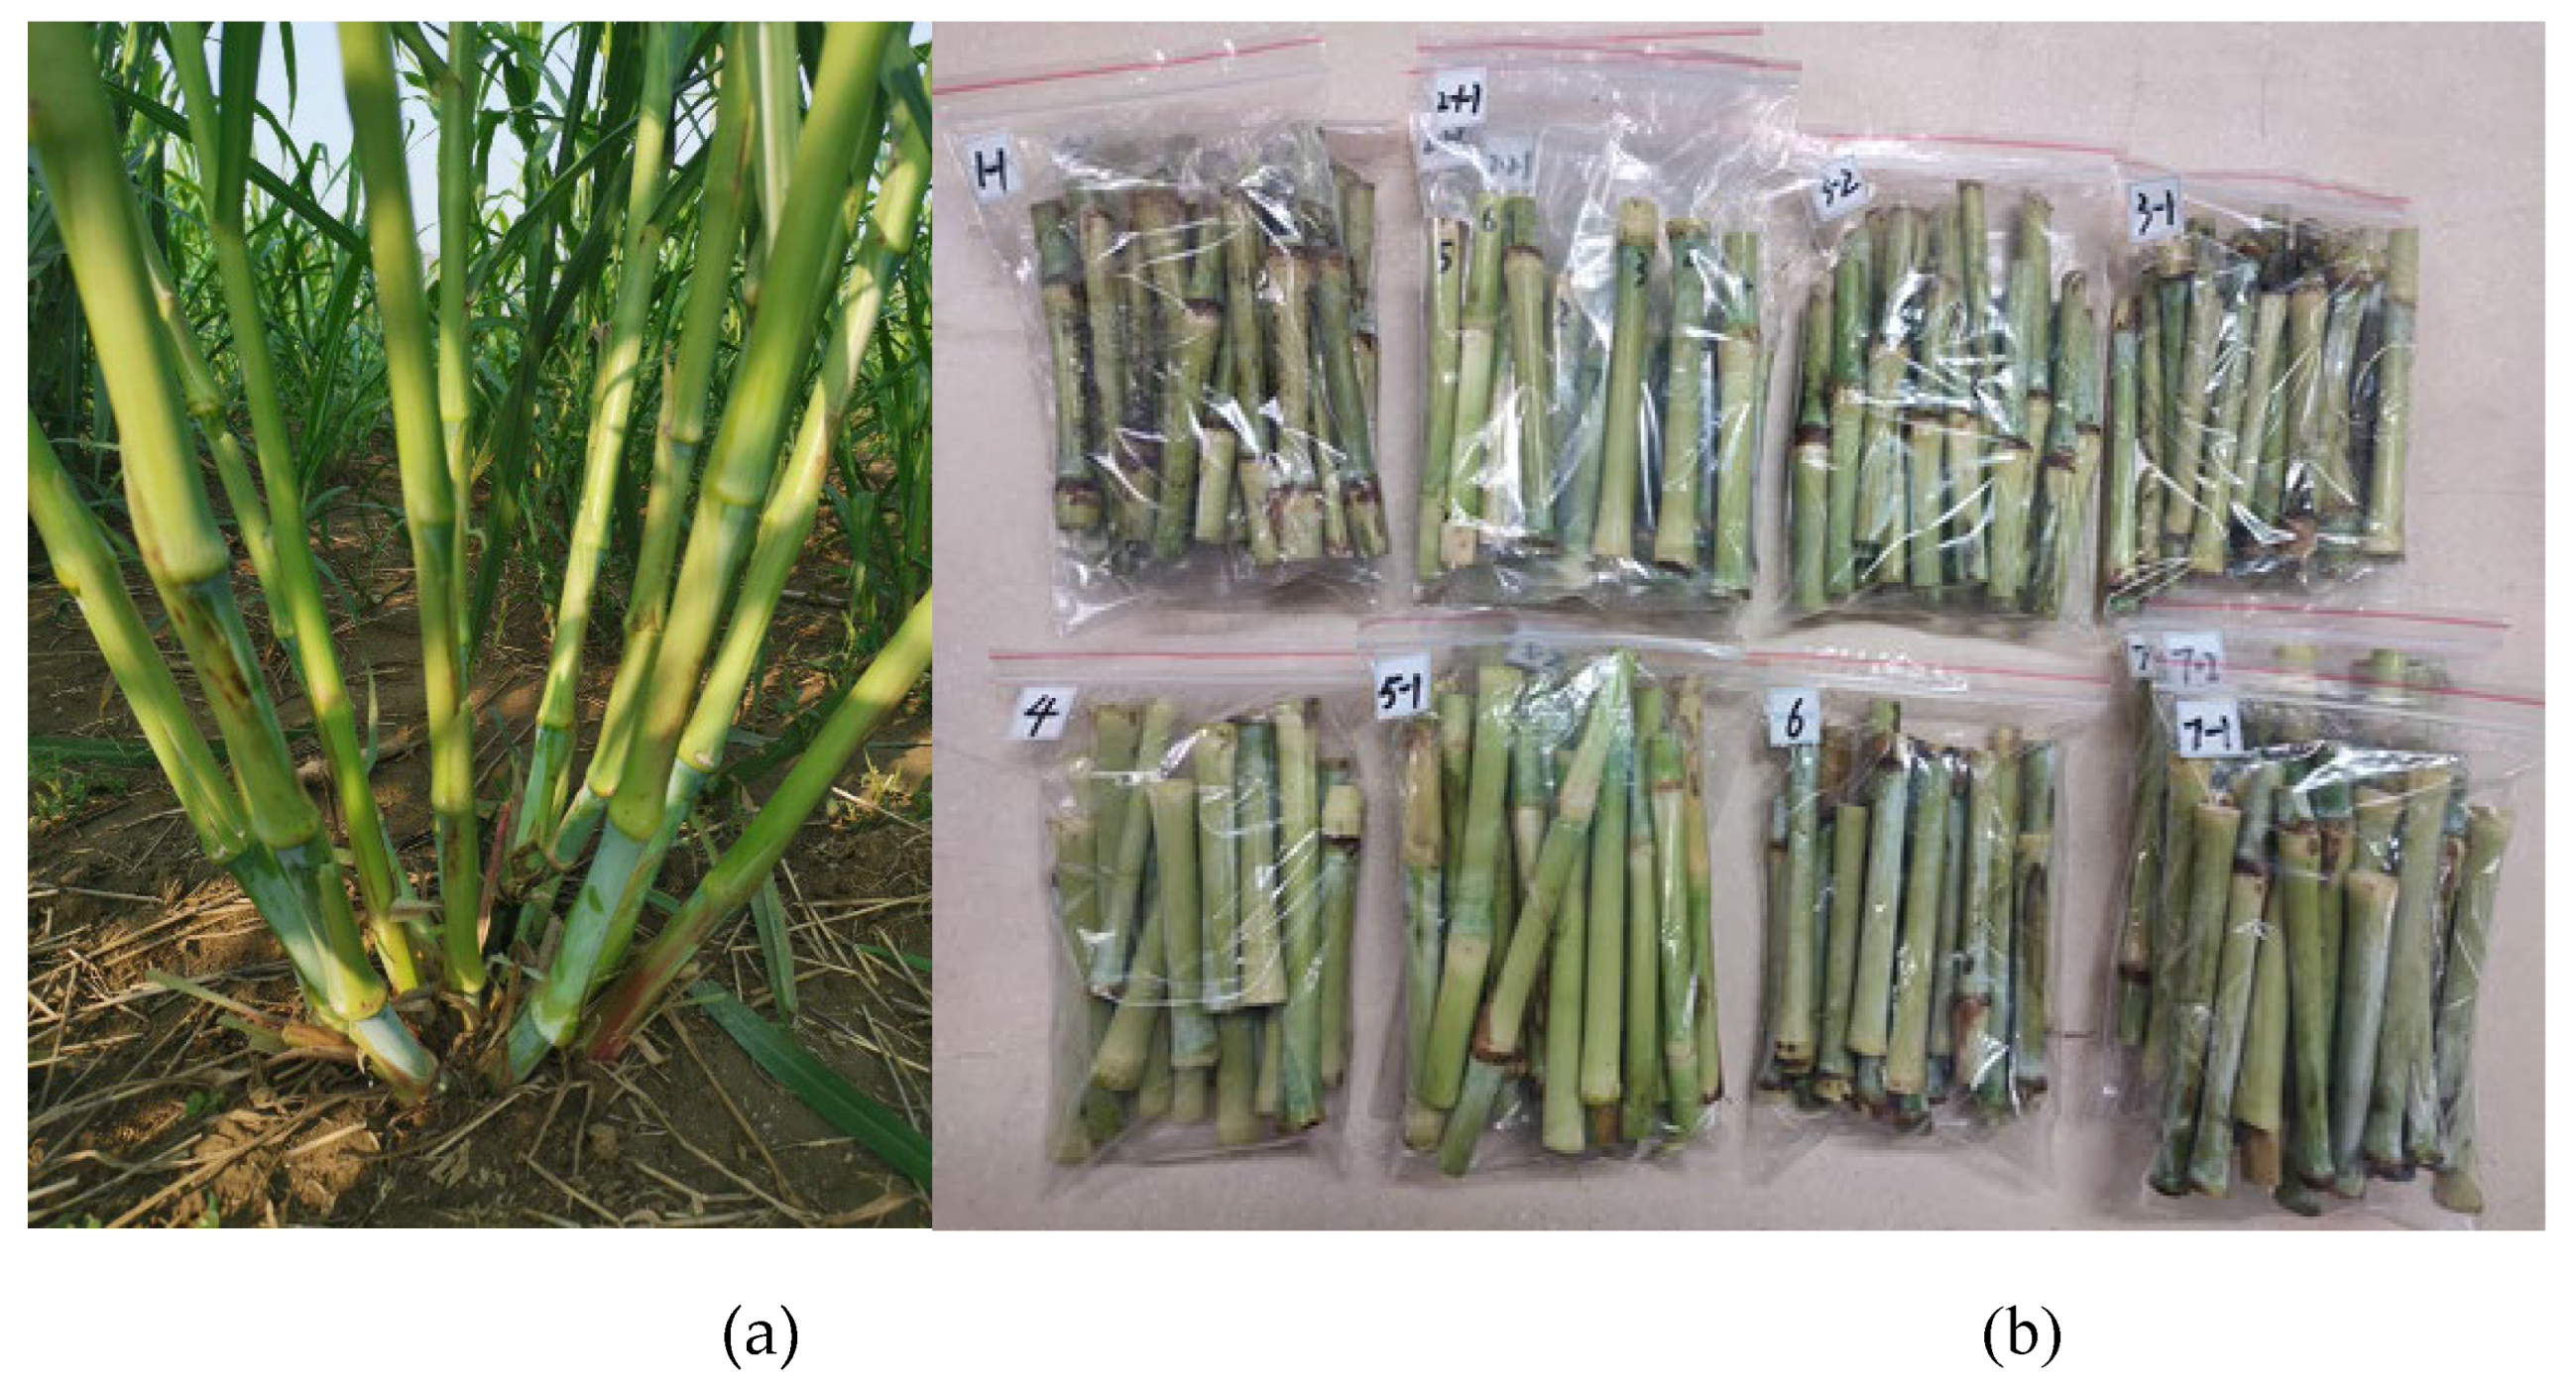
Figure 2.
Figure 2. Distribution of stalk nodes and internodes in KG stalks.
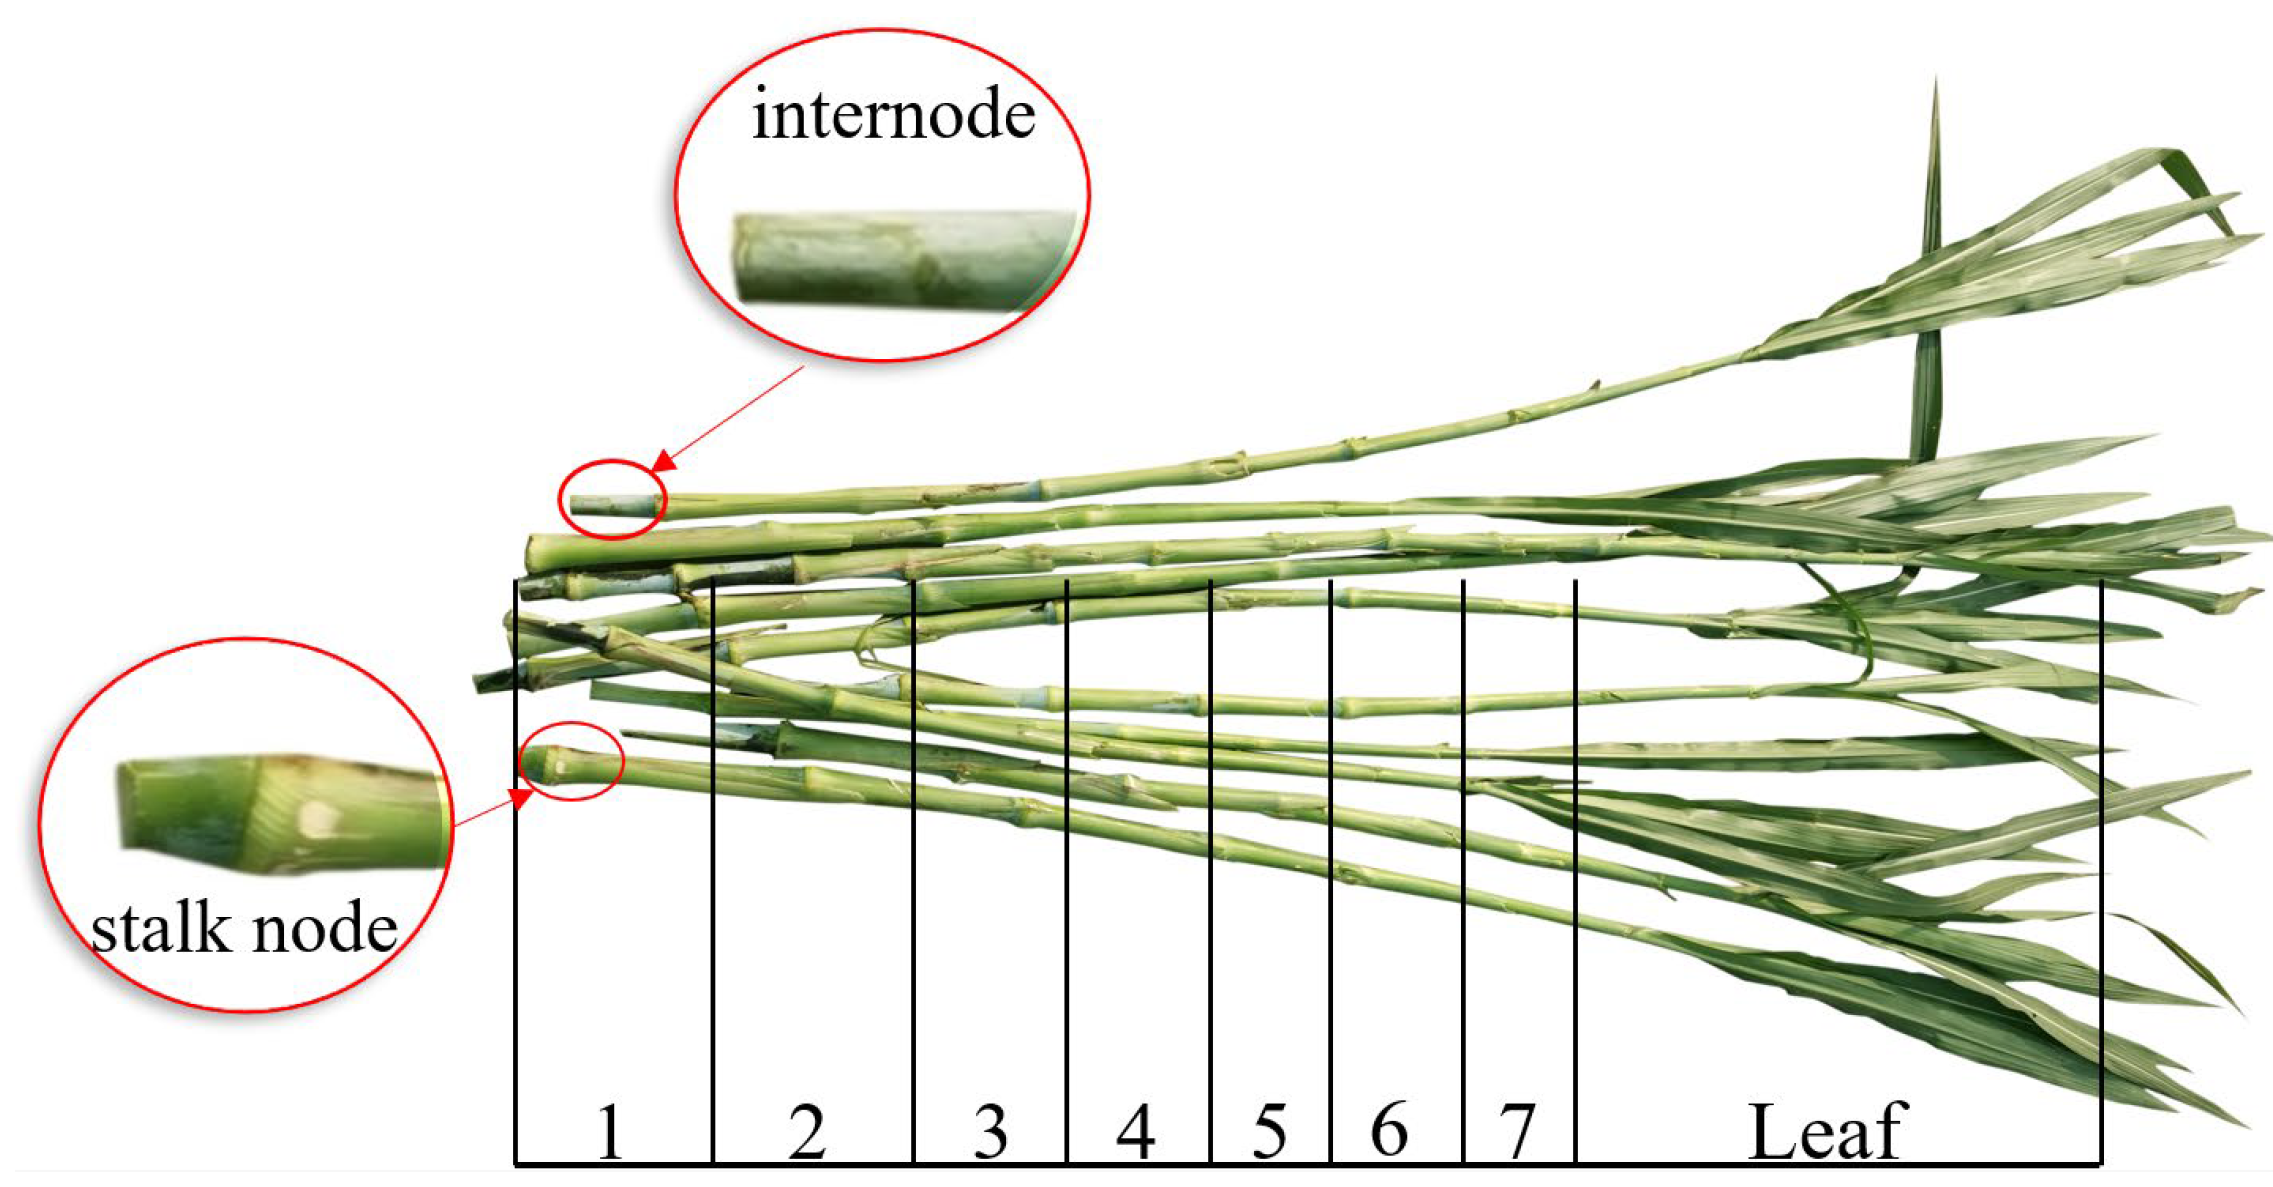
Figure 3.
This is a figure. Schemes follow the same formatting. (a) Cutting characteristic experimental device; (b) Installation position of experimental device. 1- Fixed blade holder 2- Fixed blade bracket 3- Fixed blade 4- Moving blade bracket 5- Moving blade holder 6- Moving blade 7- Stalk support block 8- Stalk bracket 9- Spiral clamp 10- Universal material testing machine 11- Computer.
Figure 4.
The adjustment of blade clearance.

Figure 5.
Adjustment method of cutting angles. (a) The adjustment of OCA, α; (b) The adjustment of SKCA, β; (c) The adjustment of SCA, γ.
Figure 5.
Adjustment method of cutting angles. (a) The adjustment of OCA, α; (b) The adjustment of SKCA, β; (c) The adjustment of SCA, γ.
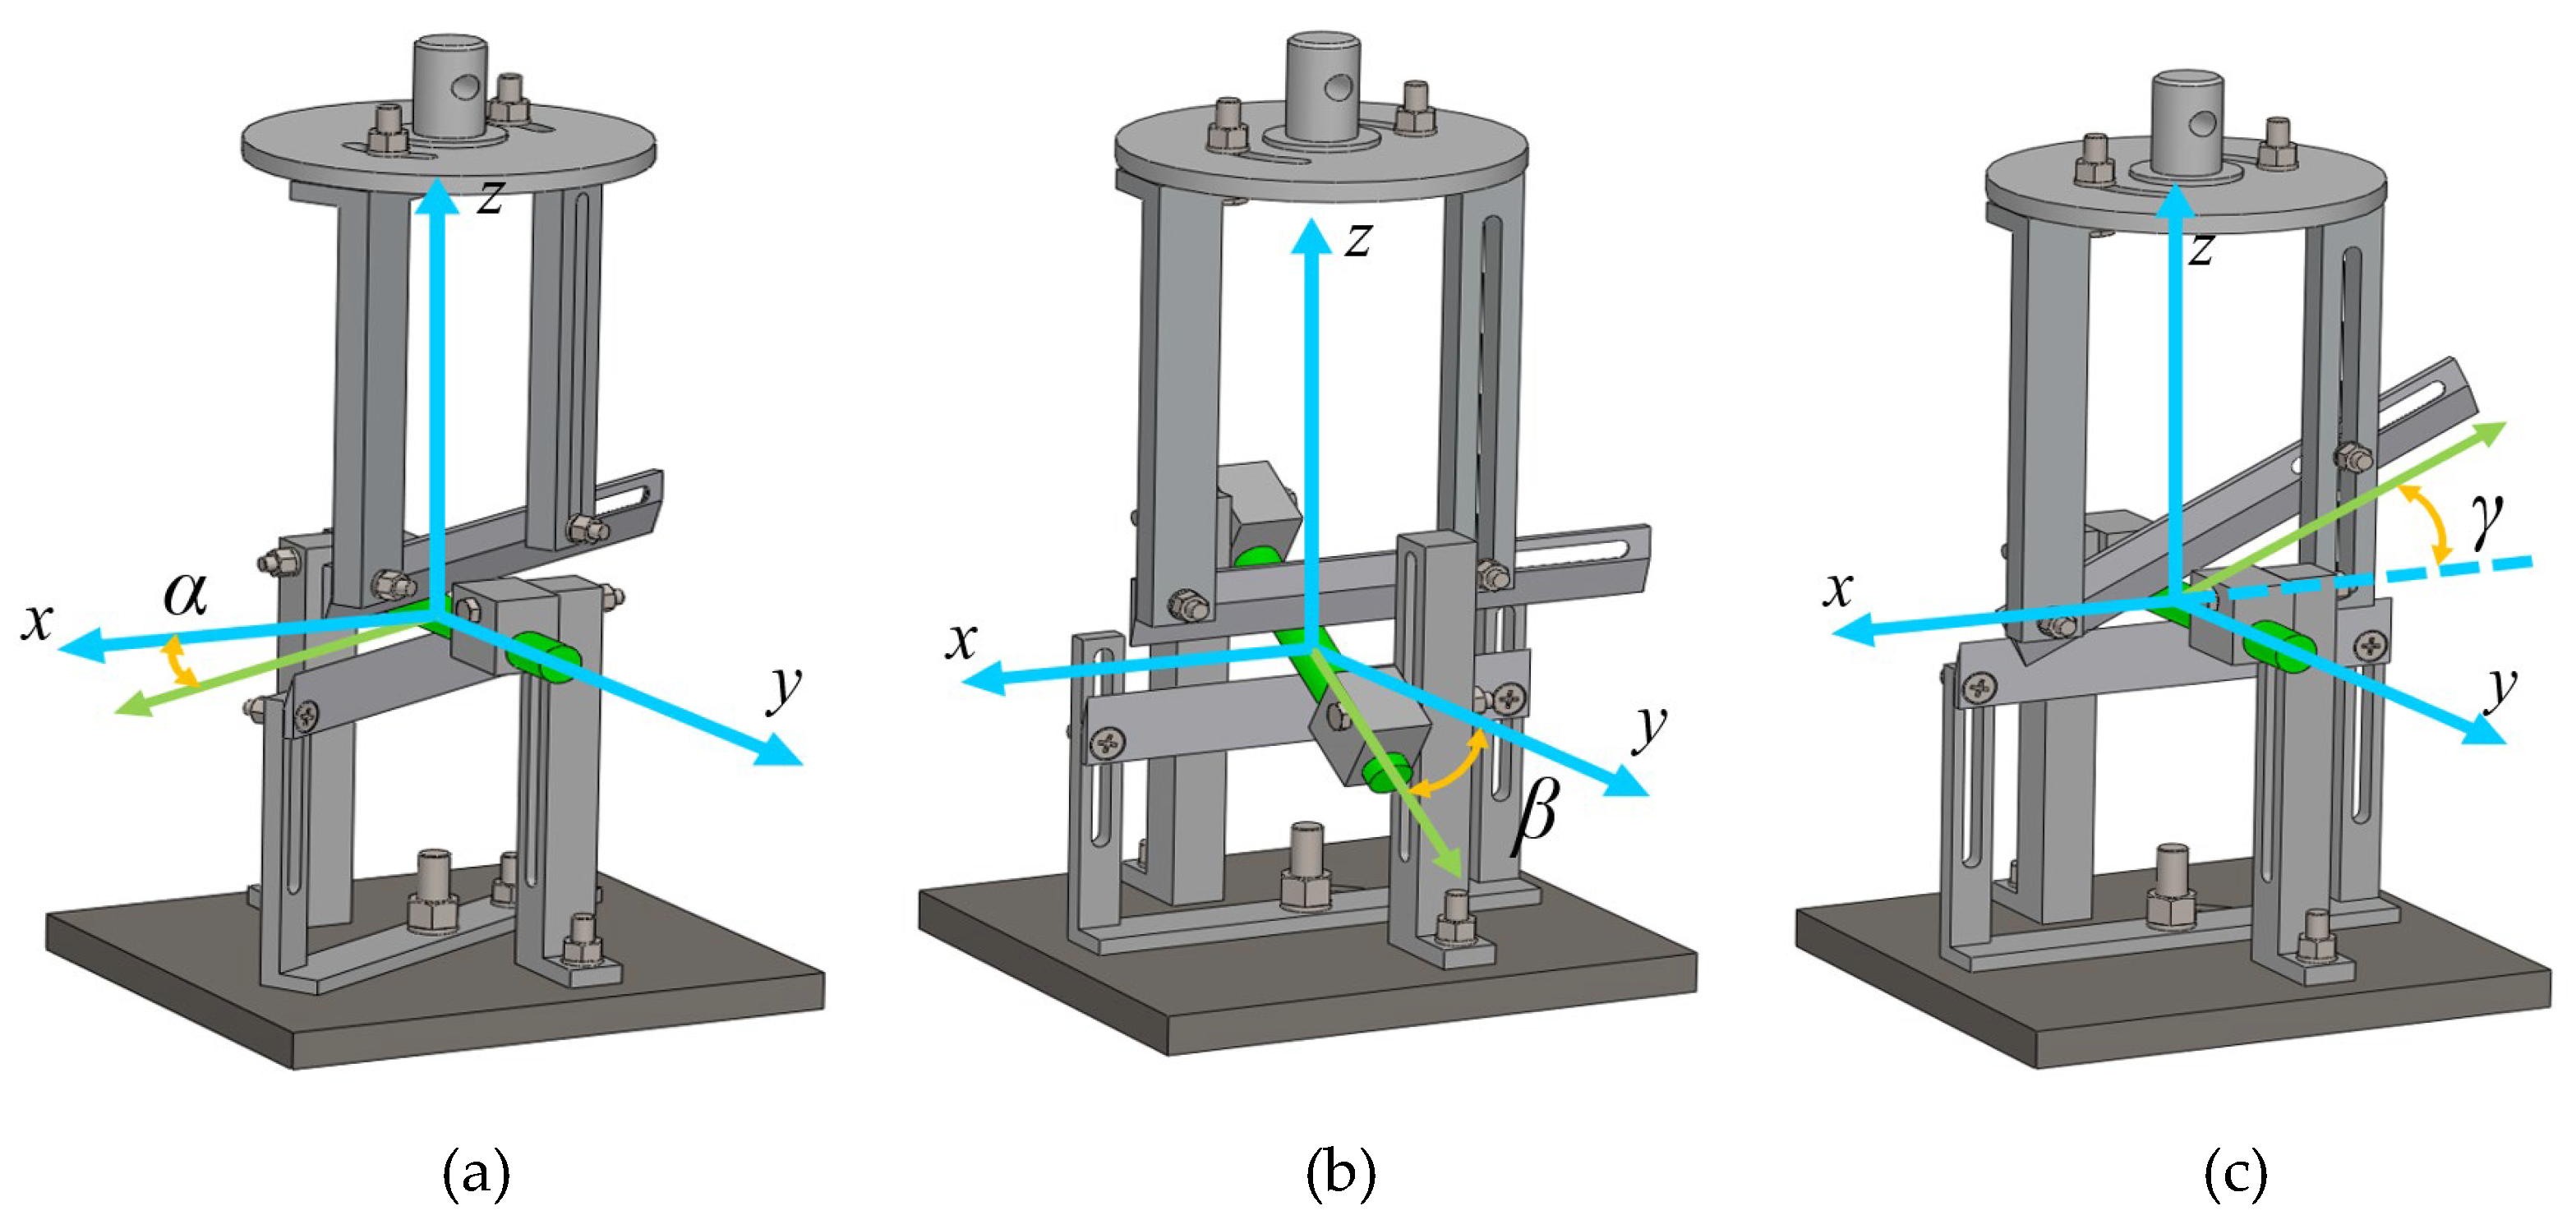
Figure 6.
Cross sectional view of different parts of the stalk; (a) stalk node; (b)internode.
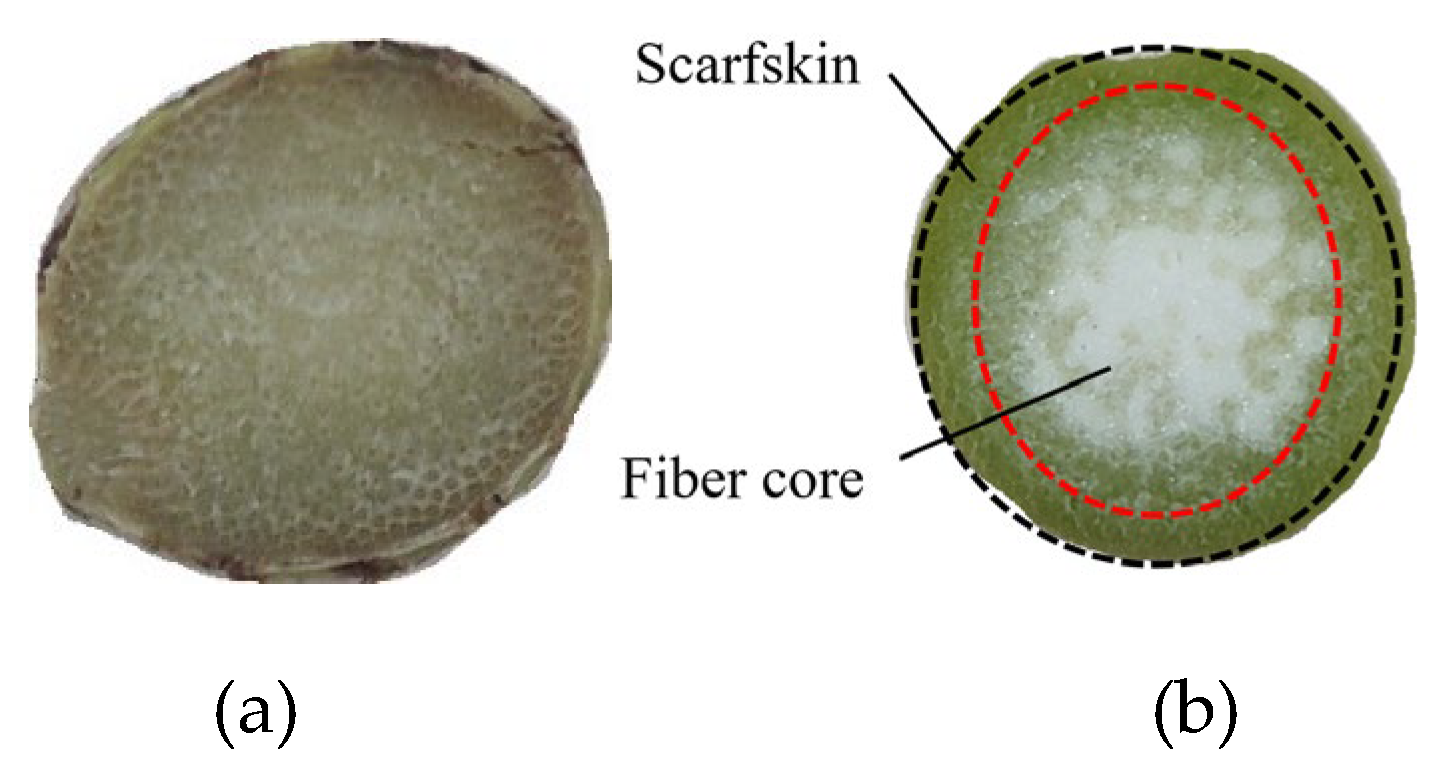
Figure 7.
Analysis of cutting process for different parts of stalk. (a) stalk node; (b)internode.
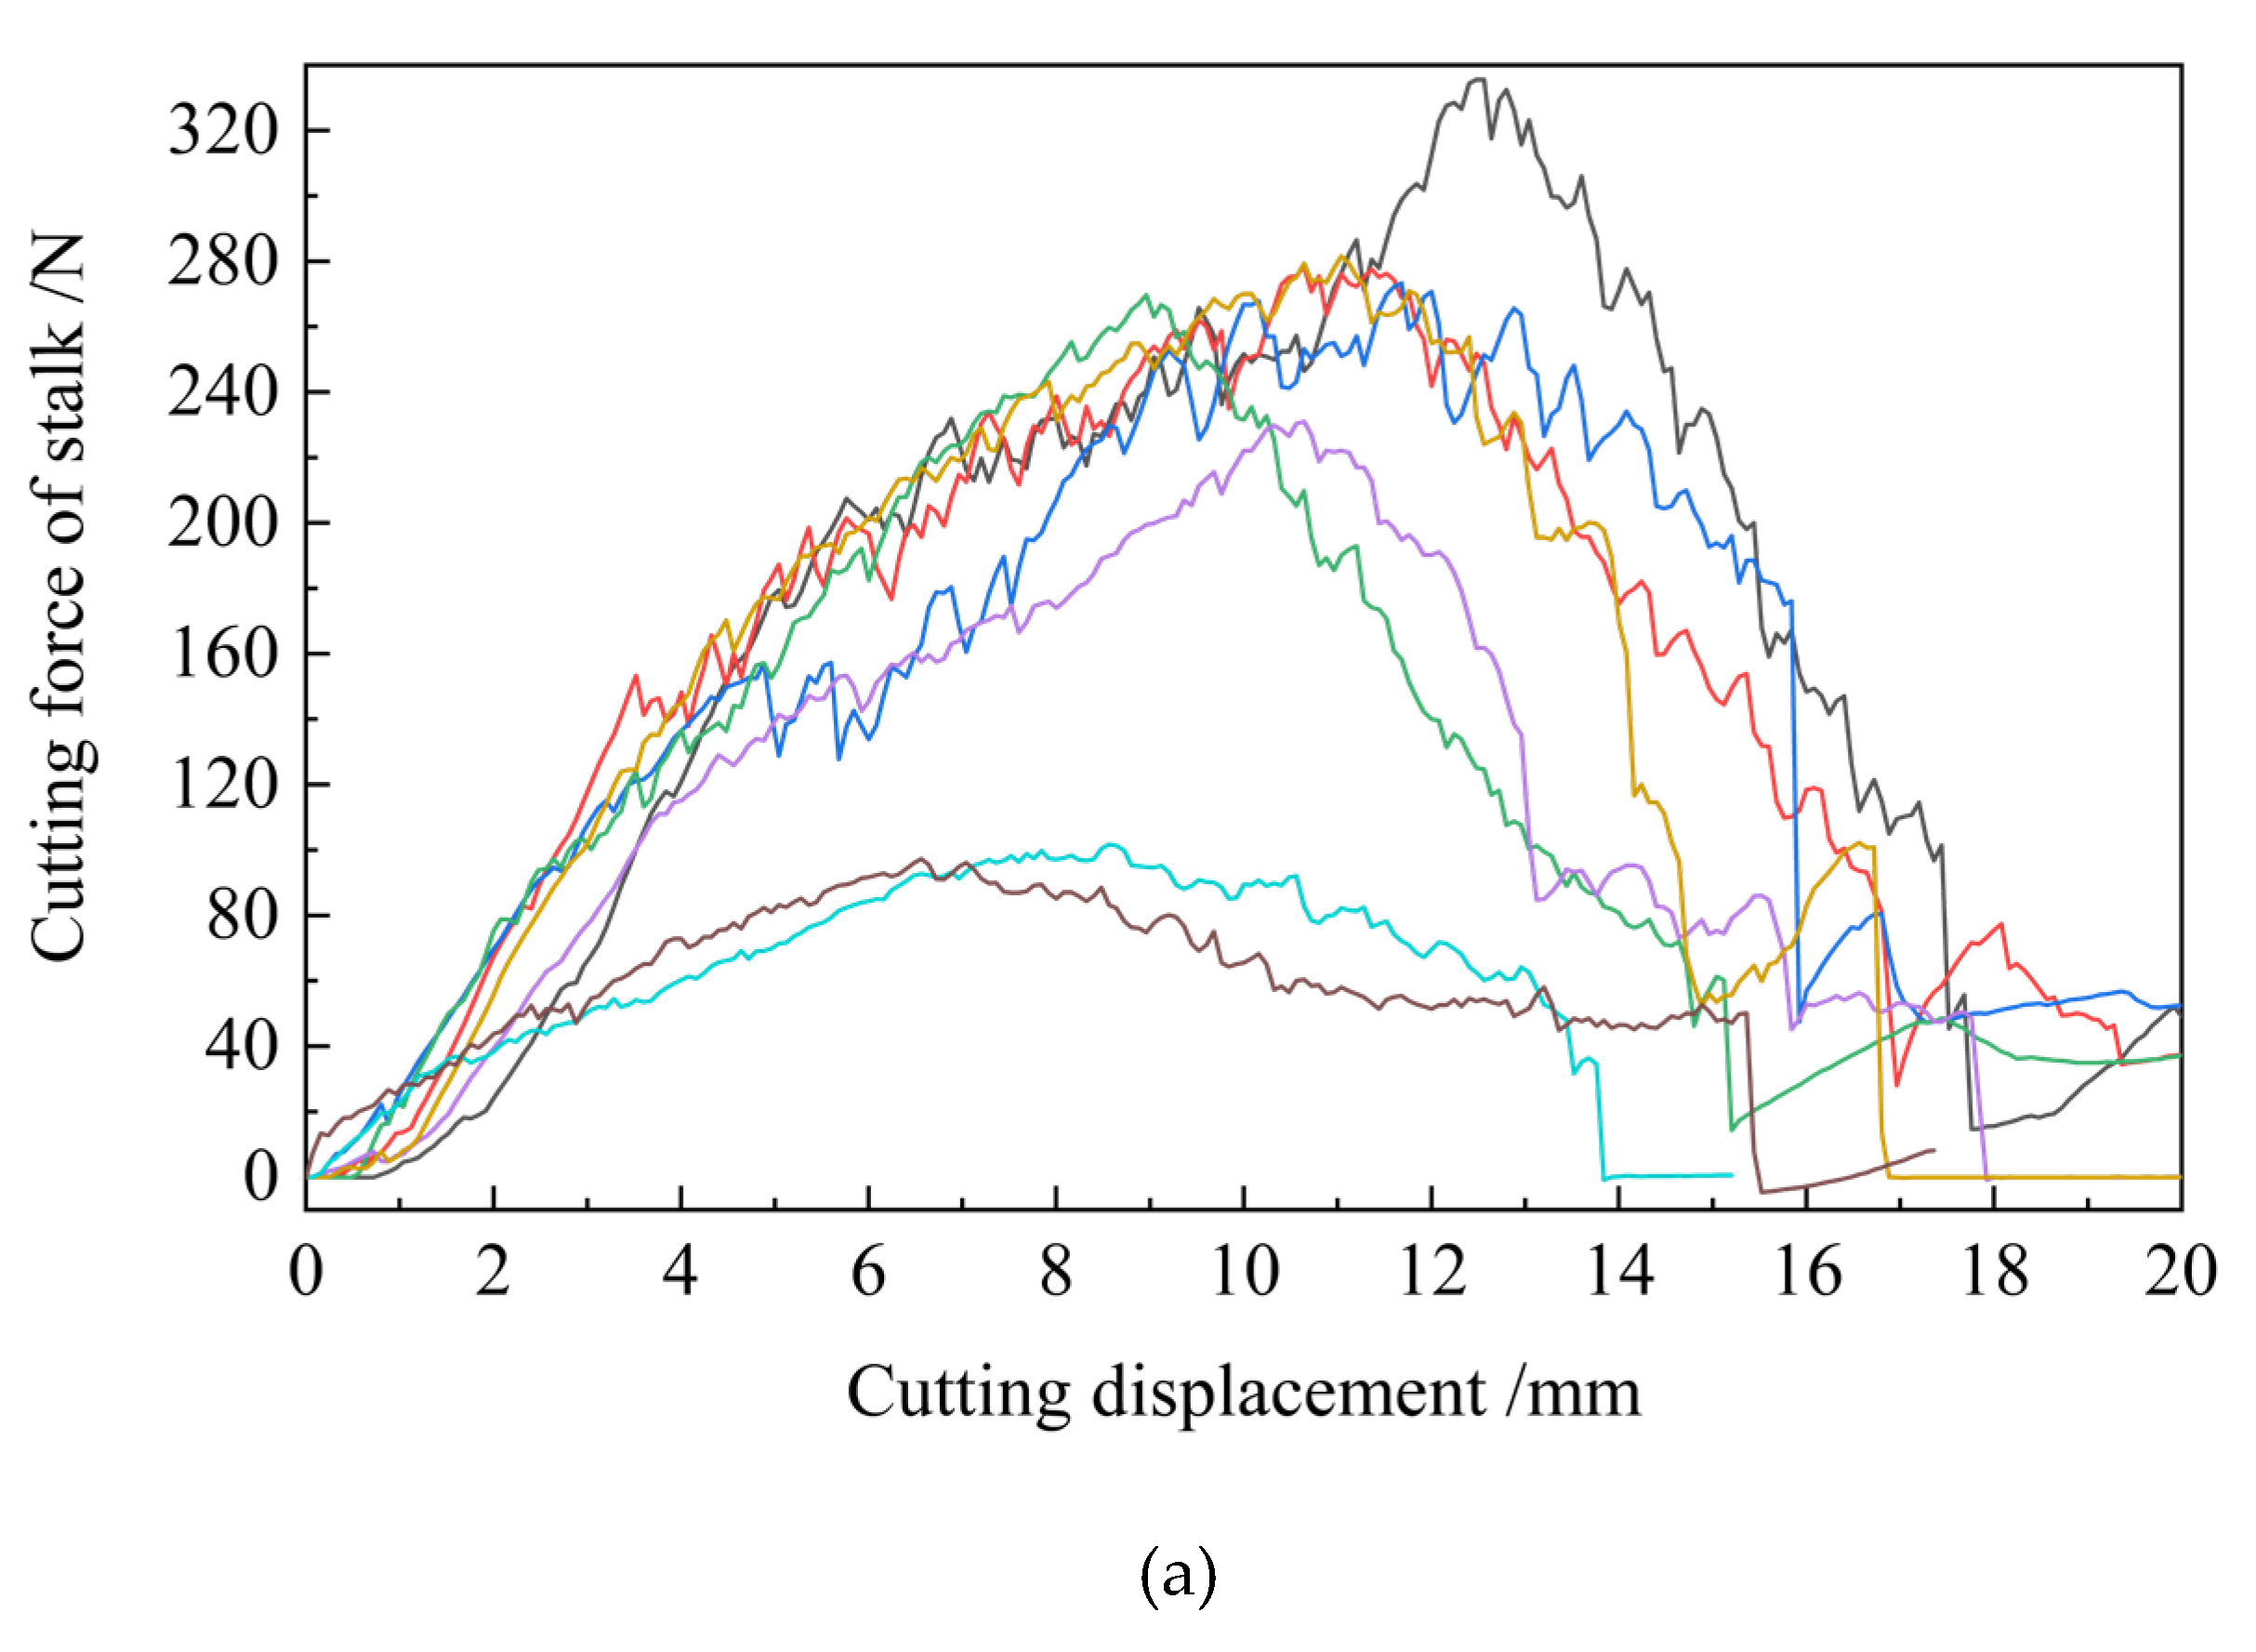
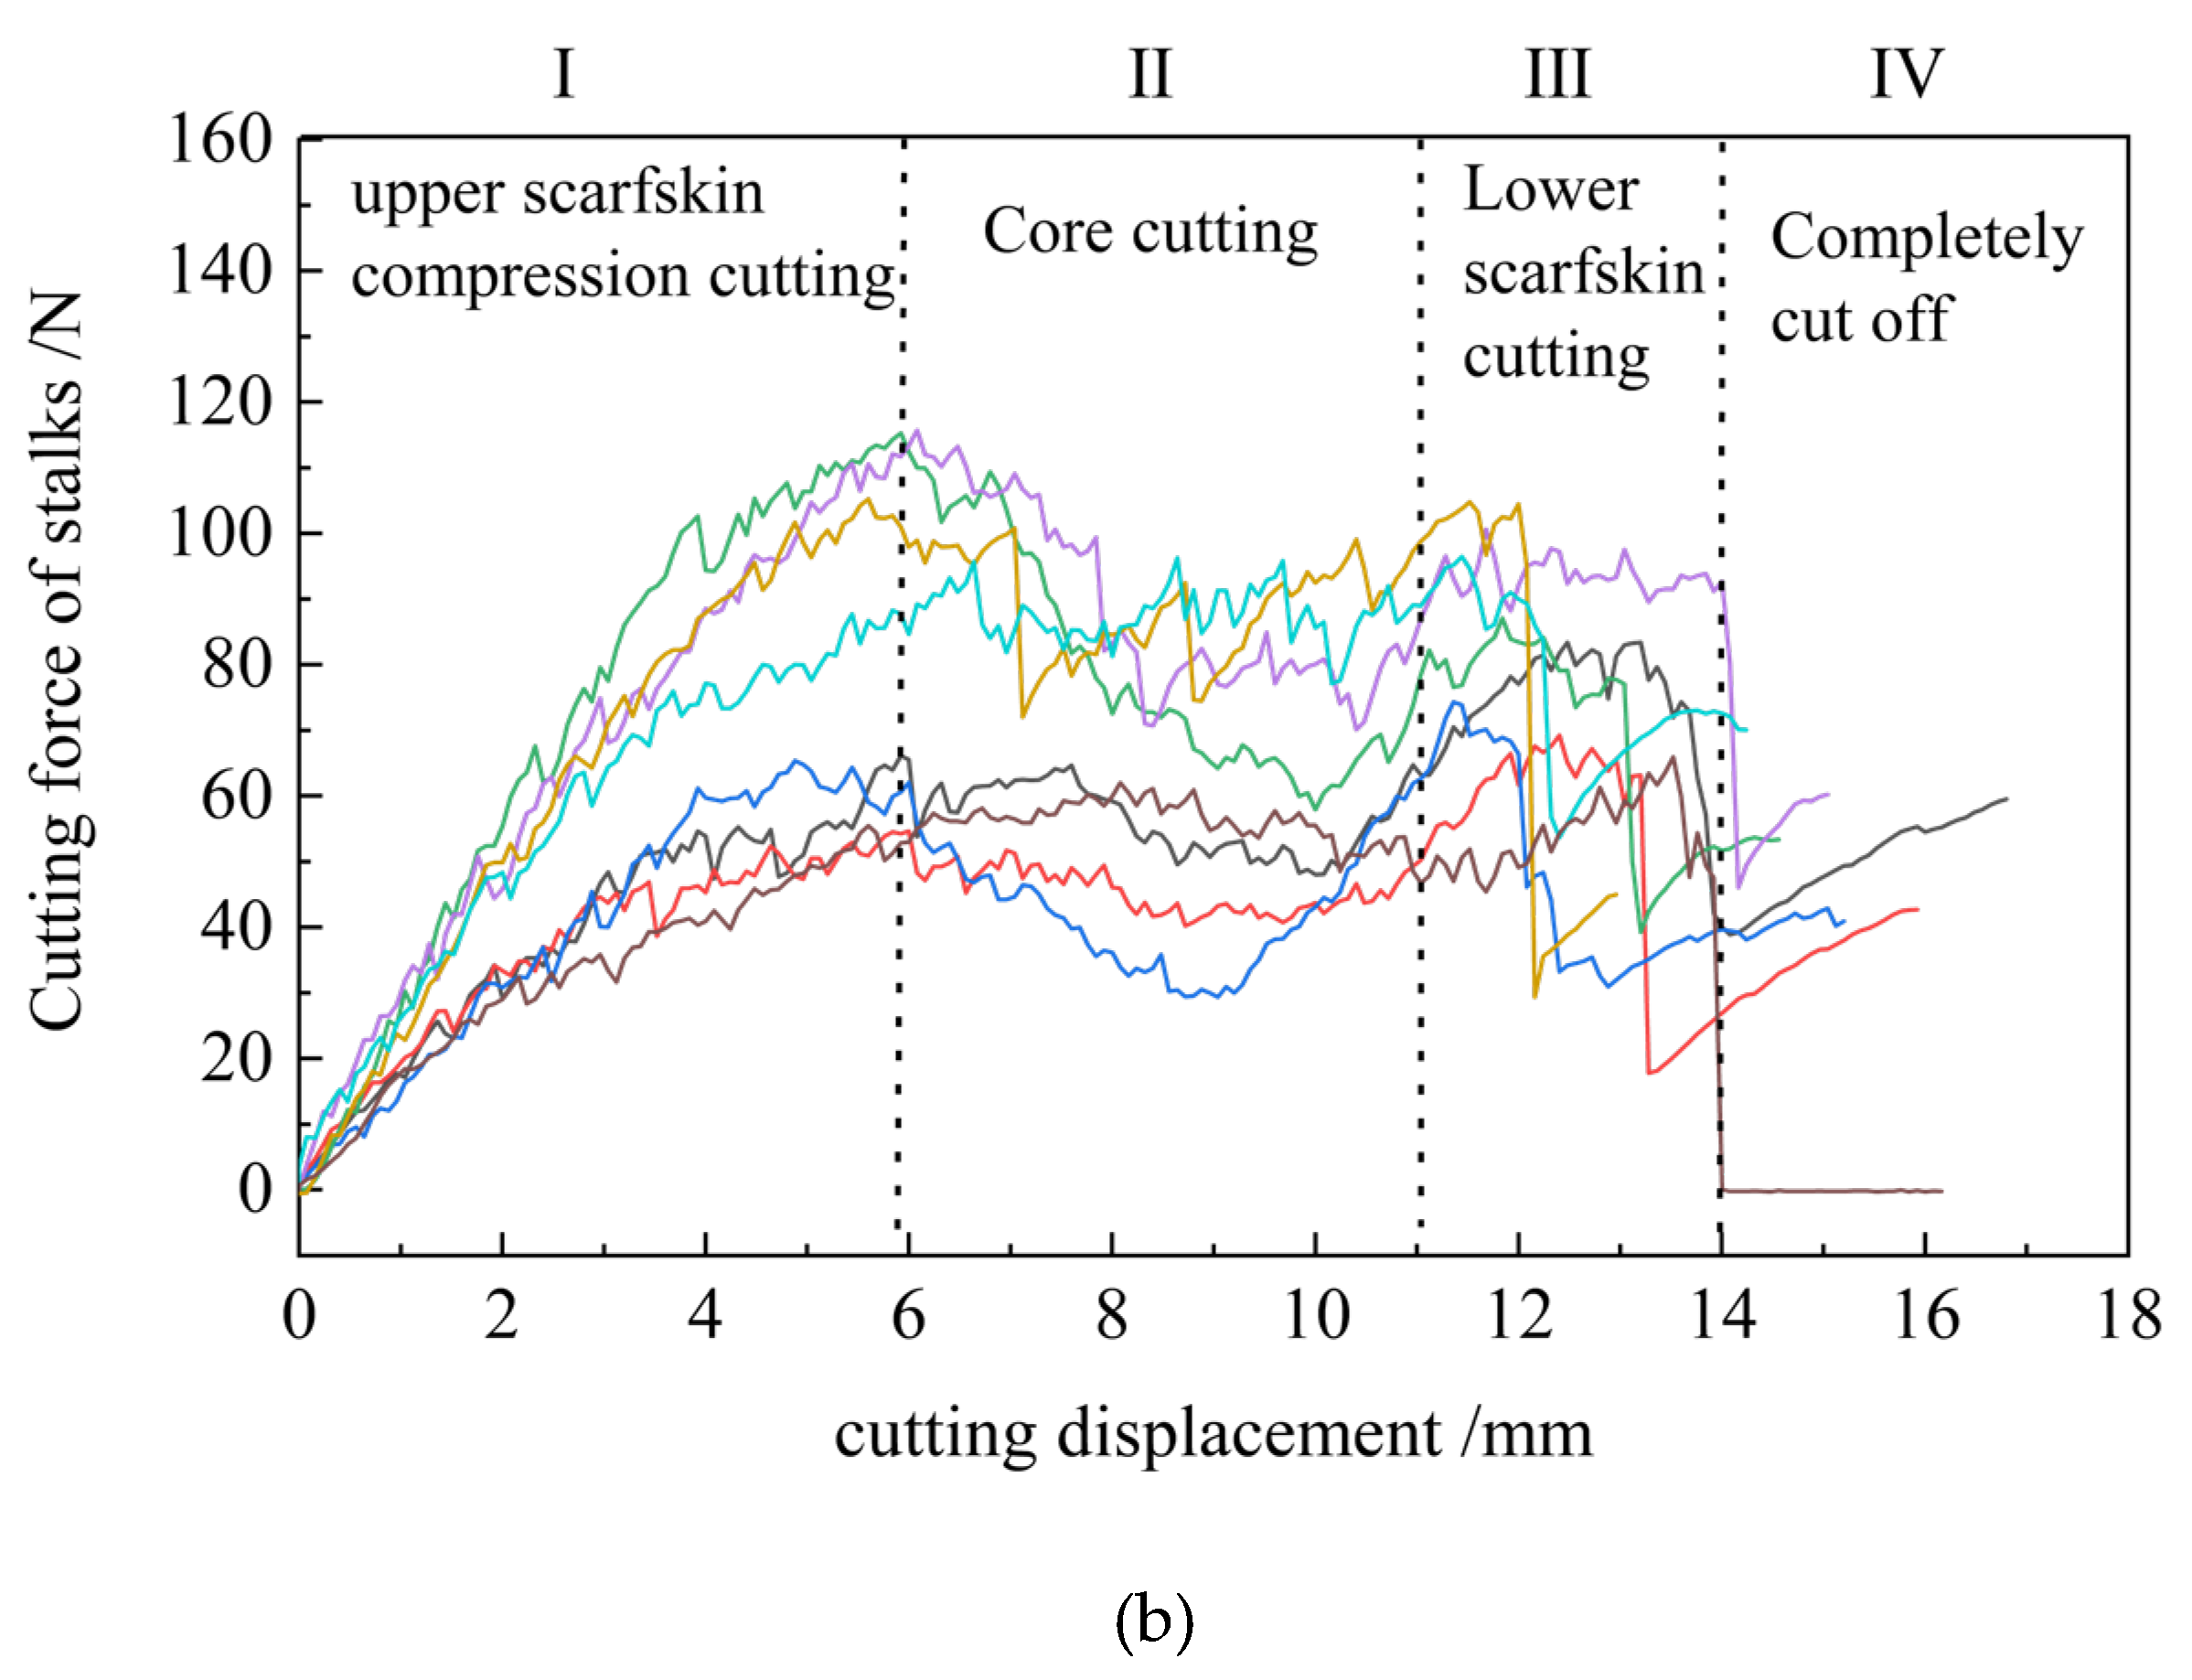
Figure 8.
The influence of different moisture contents on stalk cutting characteristics. (a) The influence of moisture content on USS; (b) The influence of moisture content on UCEC.
Figure 8.
The influence of different moisture contents on stalk cutting characteristics. (a) The influence of moisture content on USS; (b) The influence of moisture content on UCEC.
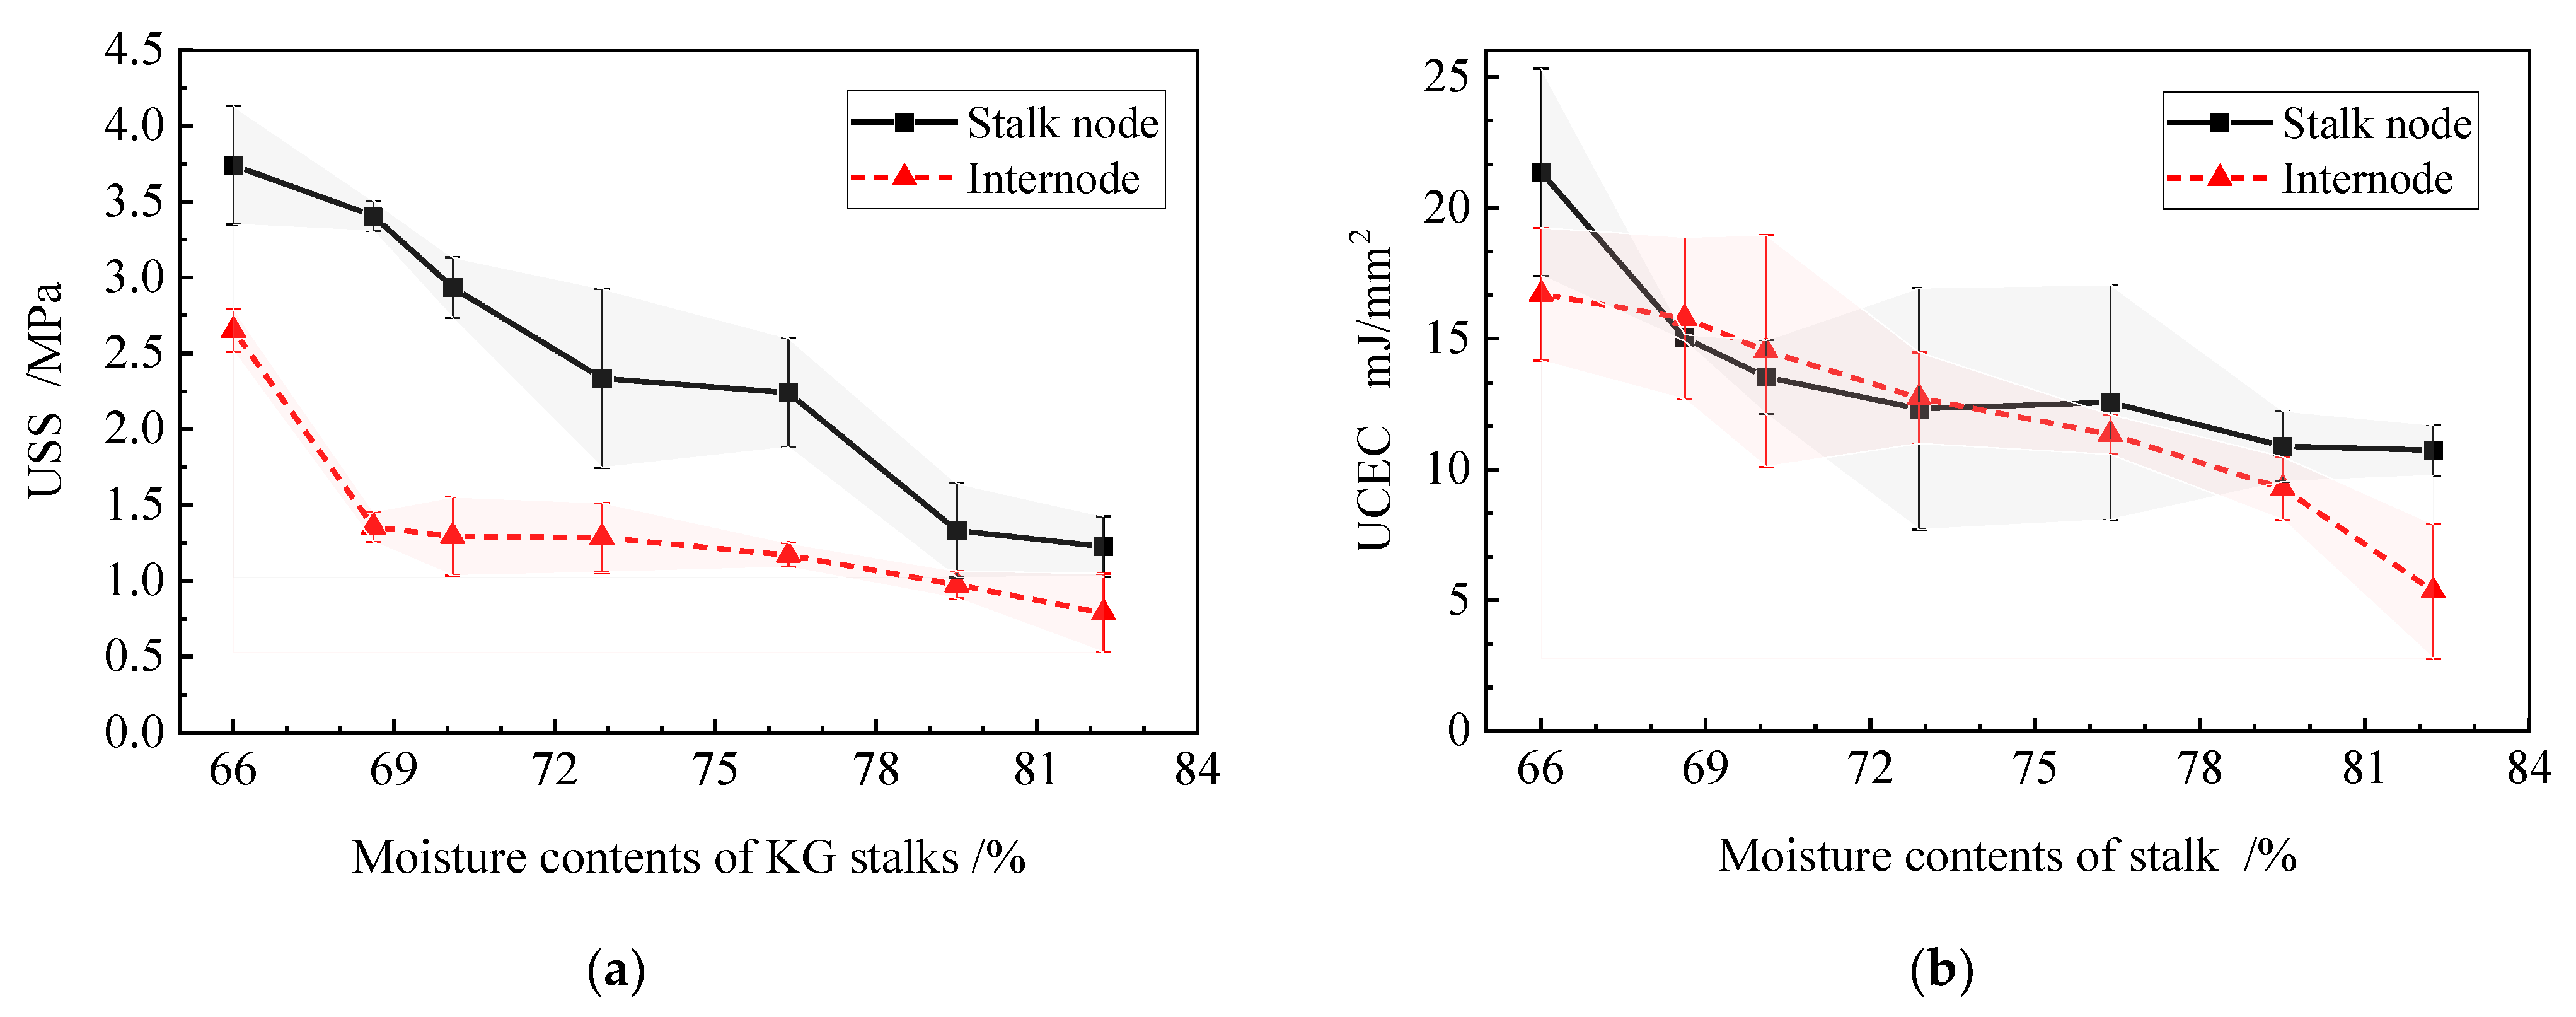
Figure 9.
The influence of cutting height on stalk cutting characteristics. (a) The impact of cutting height on USS; (b) The impact of cutting height on UCEC.
Figure 9.
The influence of cutting height on stalk cutting characteristics. (a) The impact of cutting height on USS; (b) The impact of cutting height on UCEC.
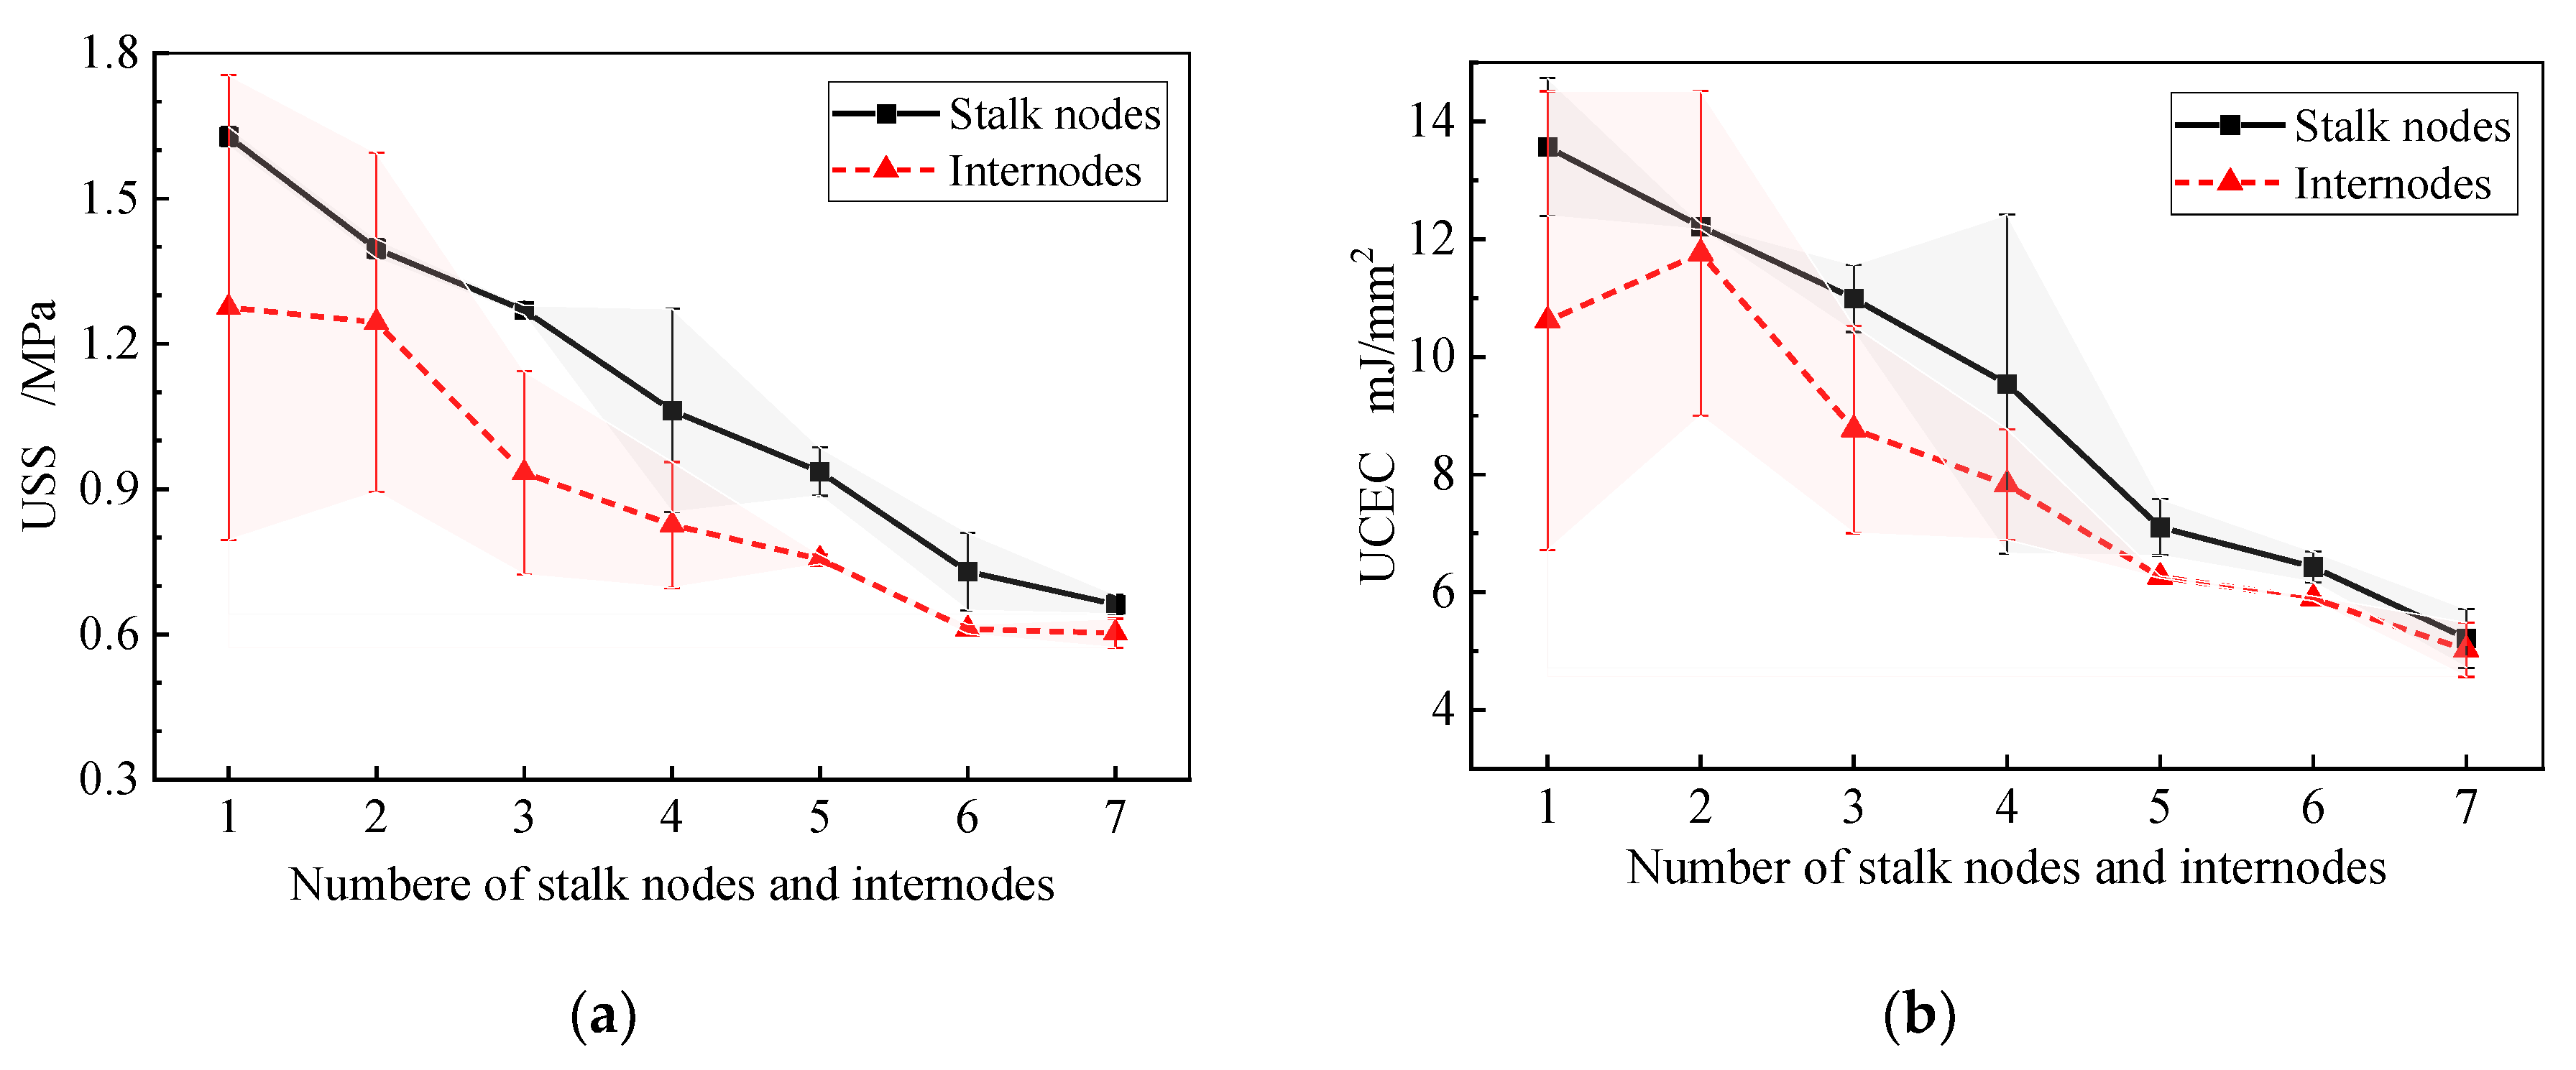
Figure 10.
The influence of the blade clearance on the cutting characteristics. (a) The influence on USS; (b) The influence on UCEC.
Figure 10.
The influence of the blade clearance on the cutting characteristics. (a) The influence on USS; (b) The influence on UCEC.
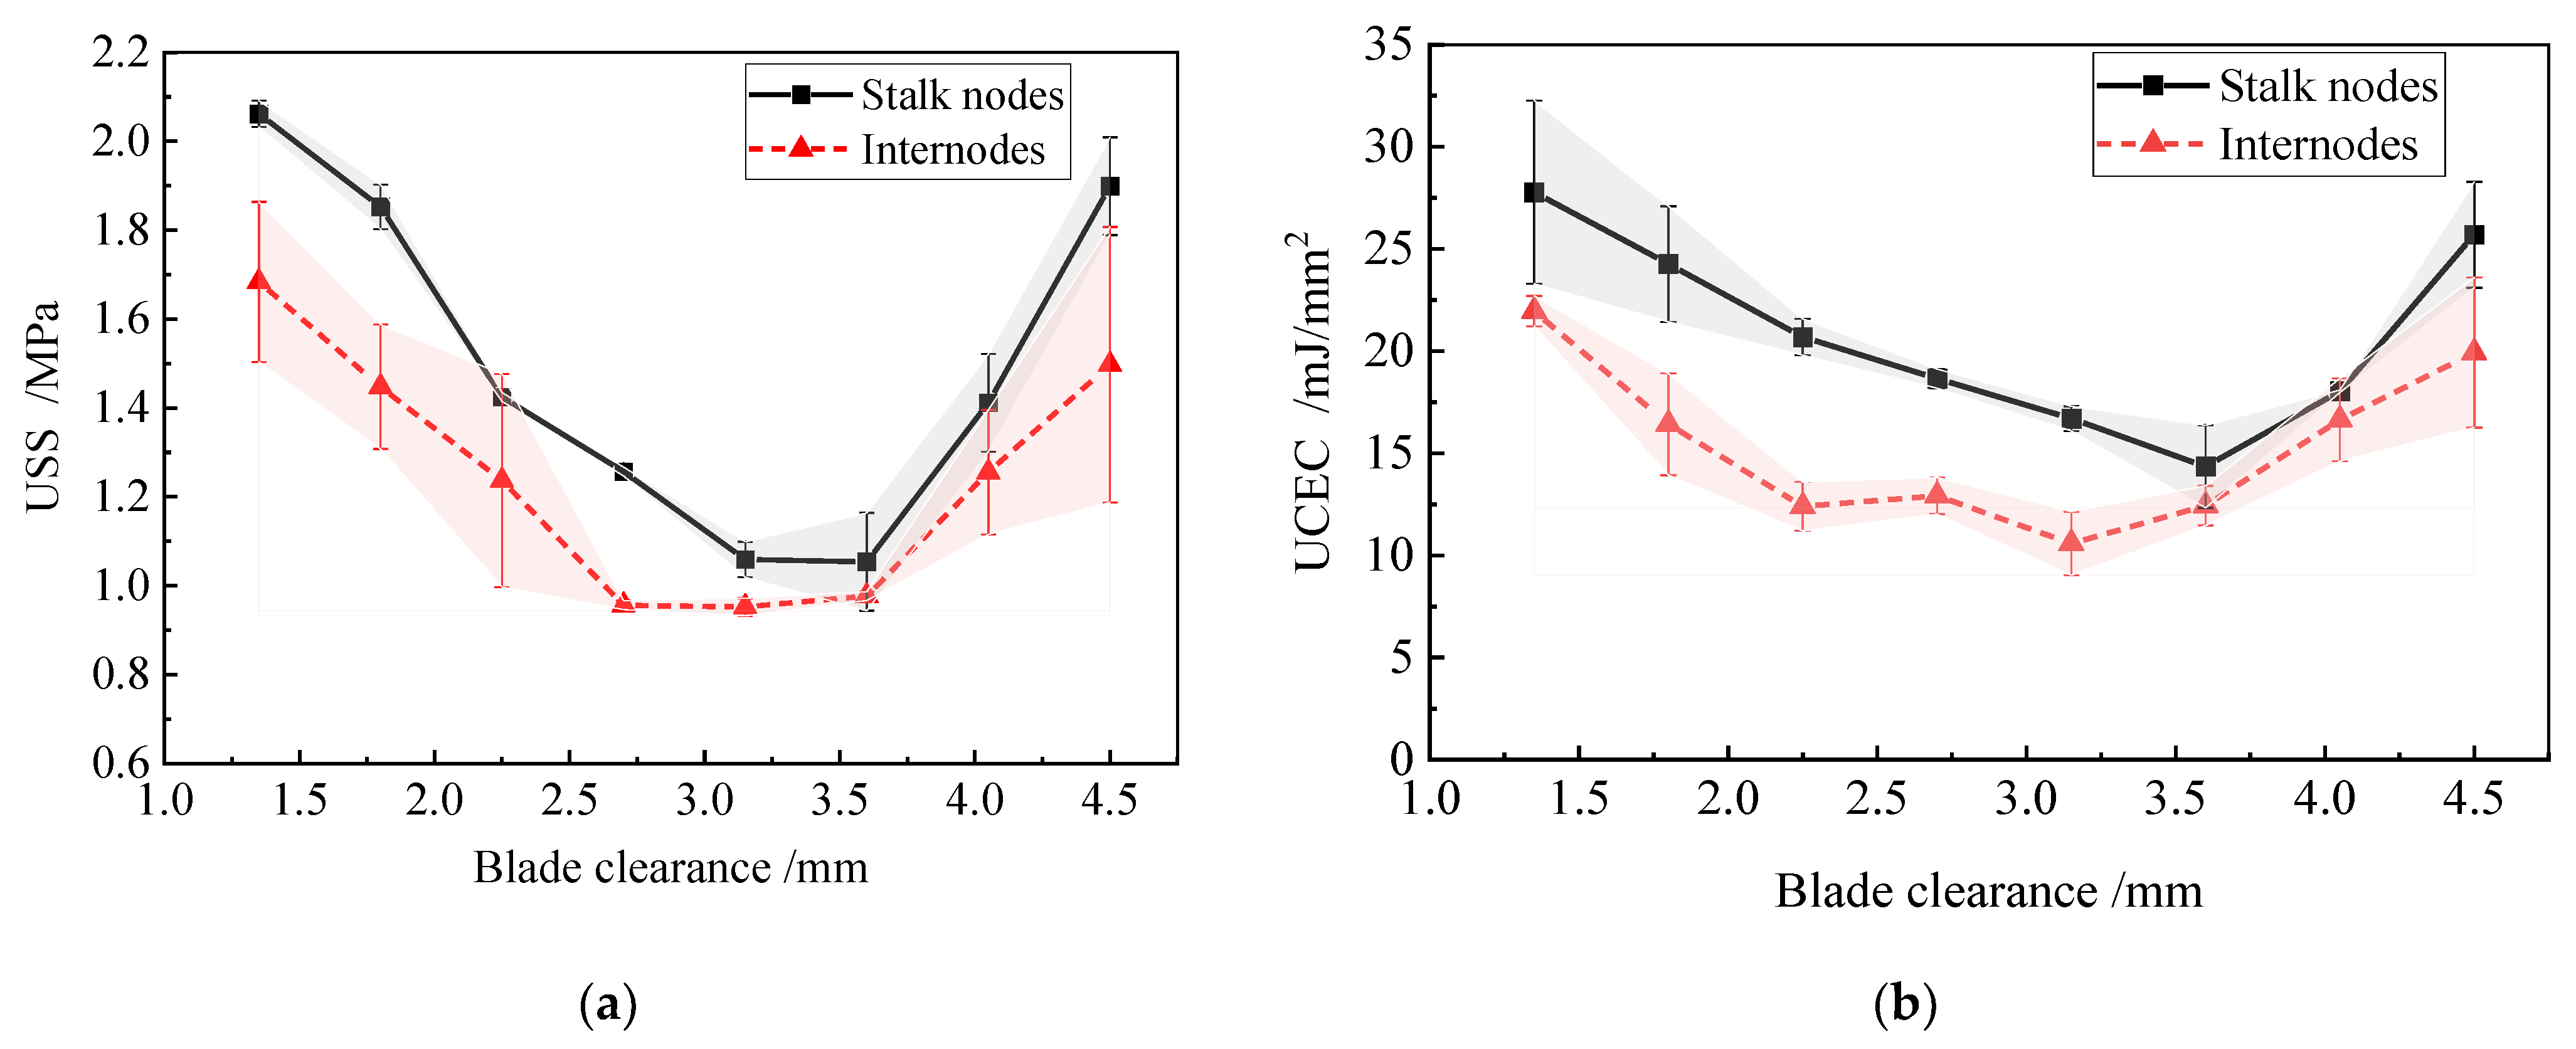
Figure 11.
Oblique cutting experiment. (a) Oblique cutting device; (b) Oblique cut stalk morphology.
Figure 11.
Oblique cutting experiment. (a) Oblique cutting device; (b) Oblique cut stalk morphology.
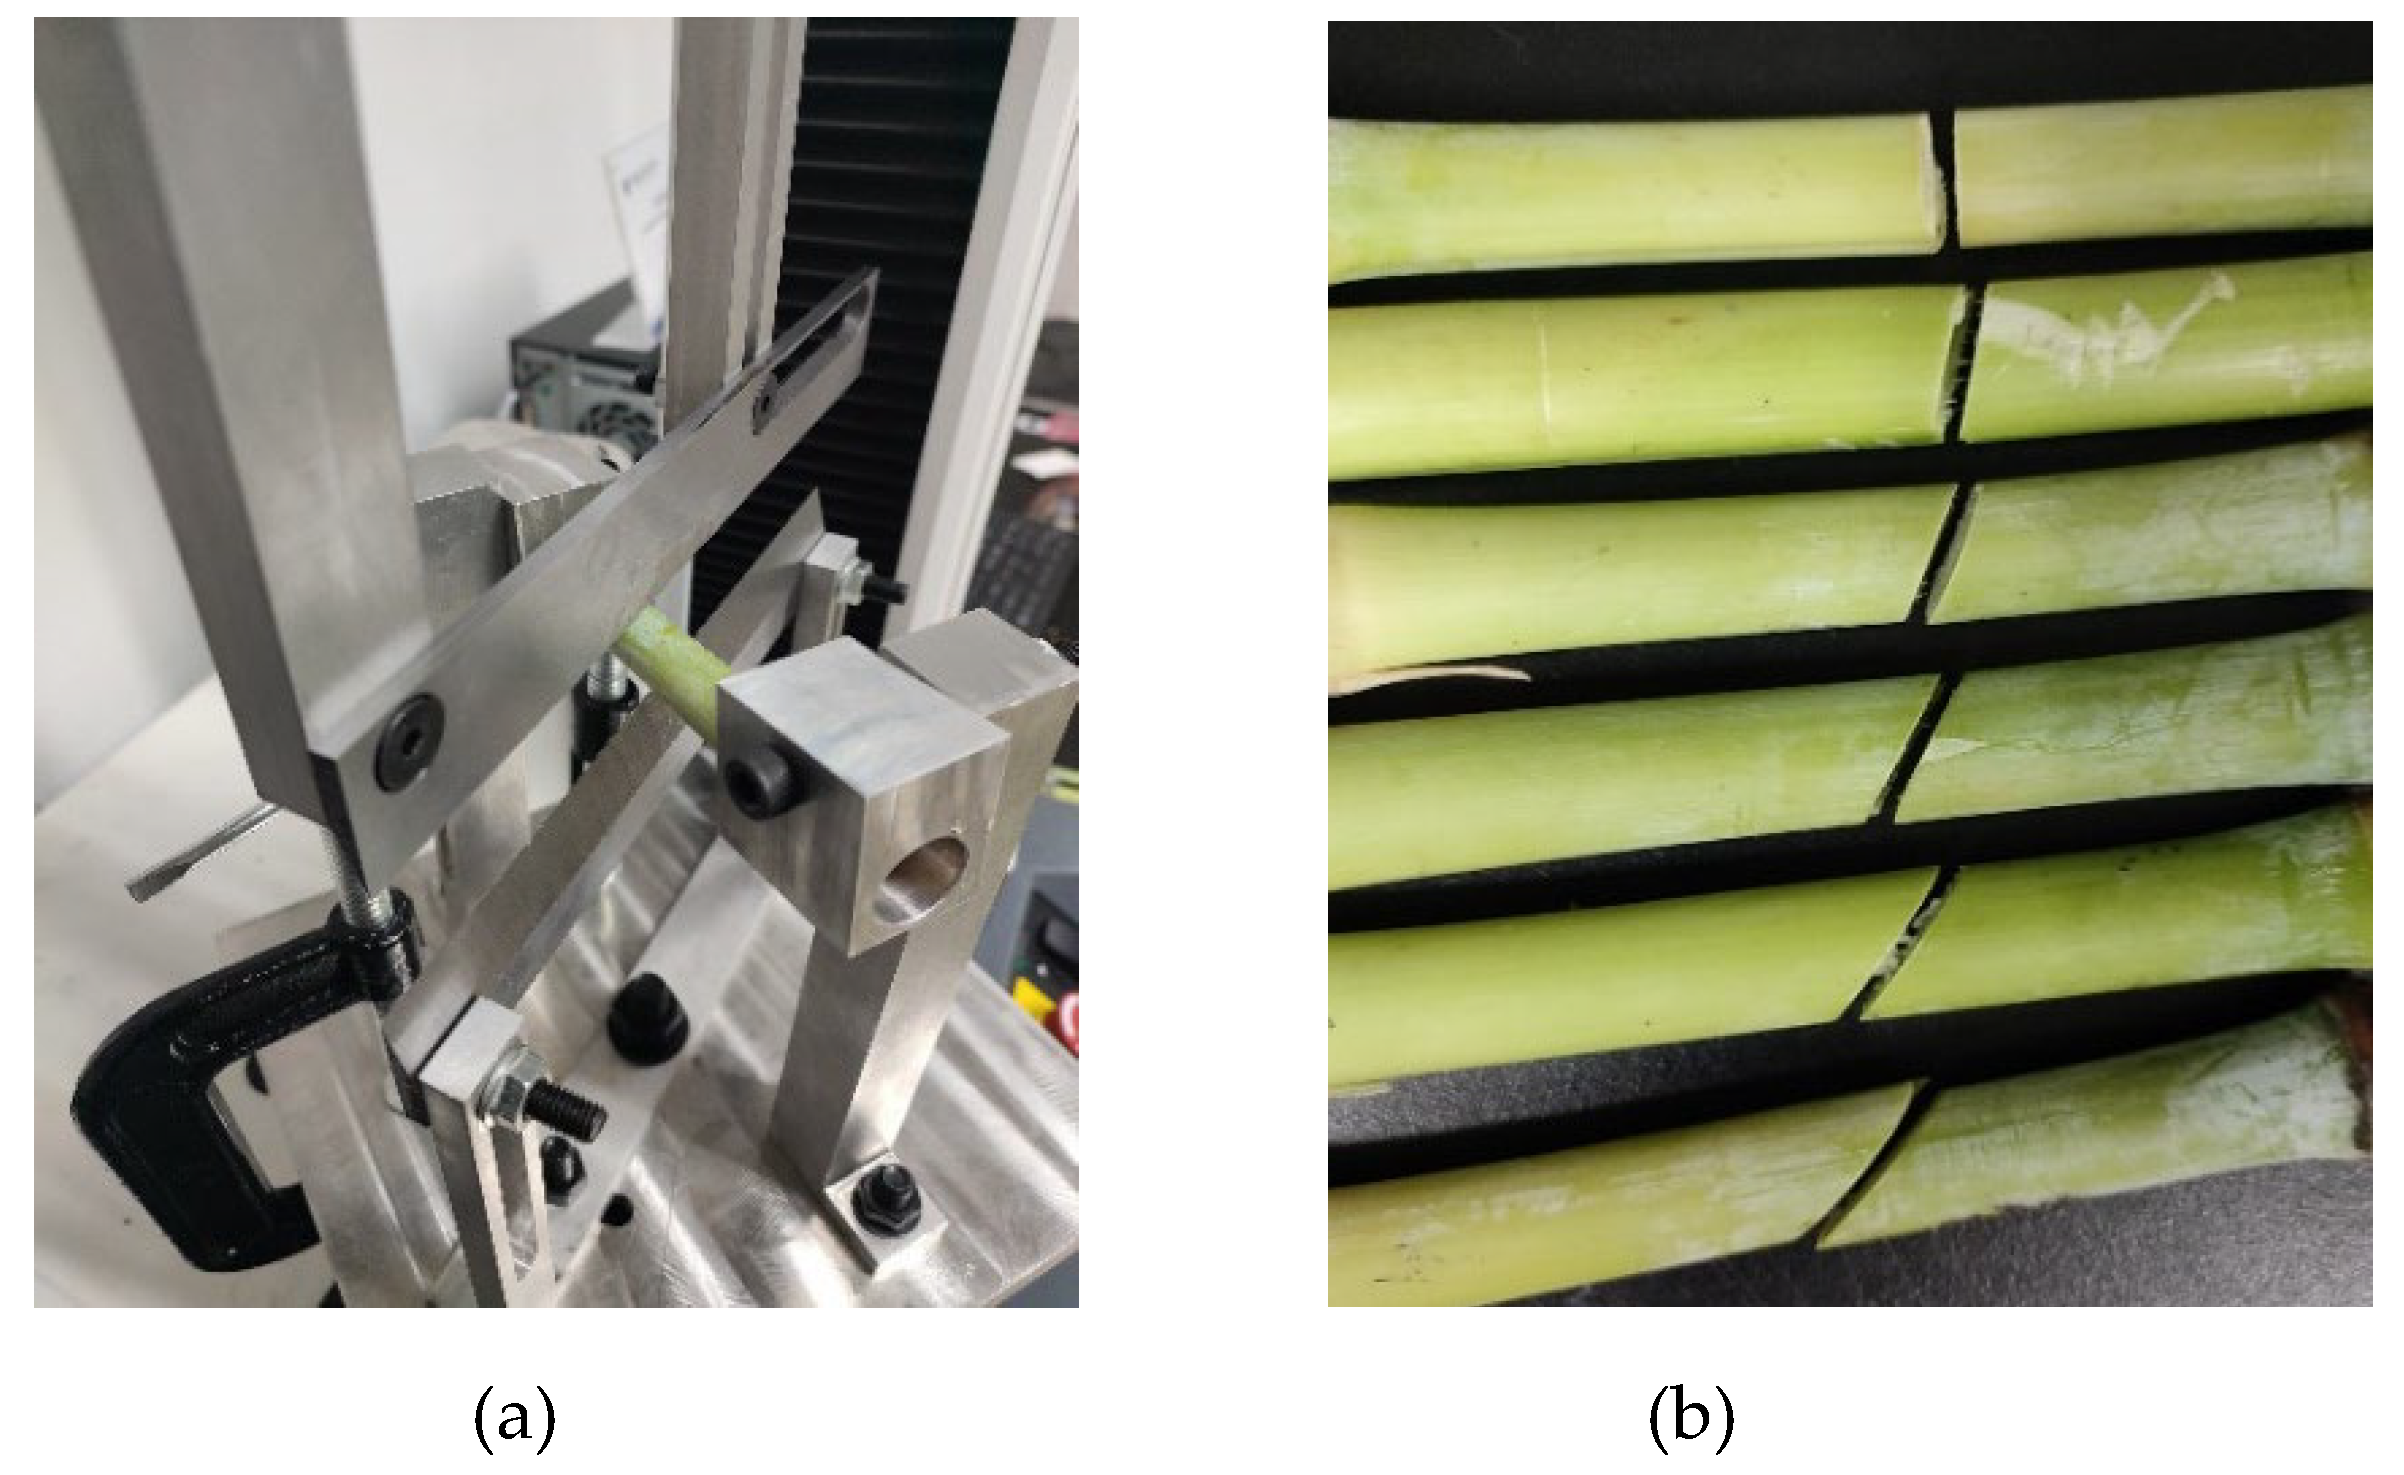
Figure 12.
The influence of OCA on stalk cutting characteristics.
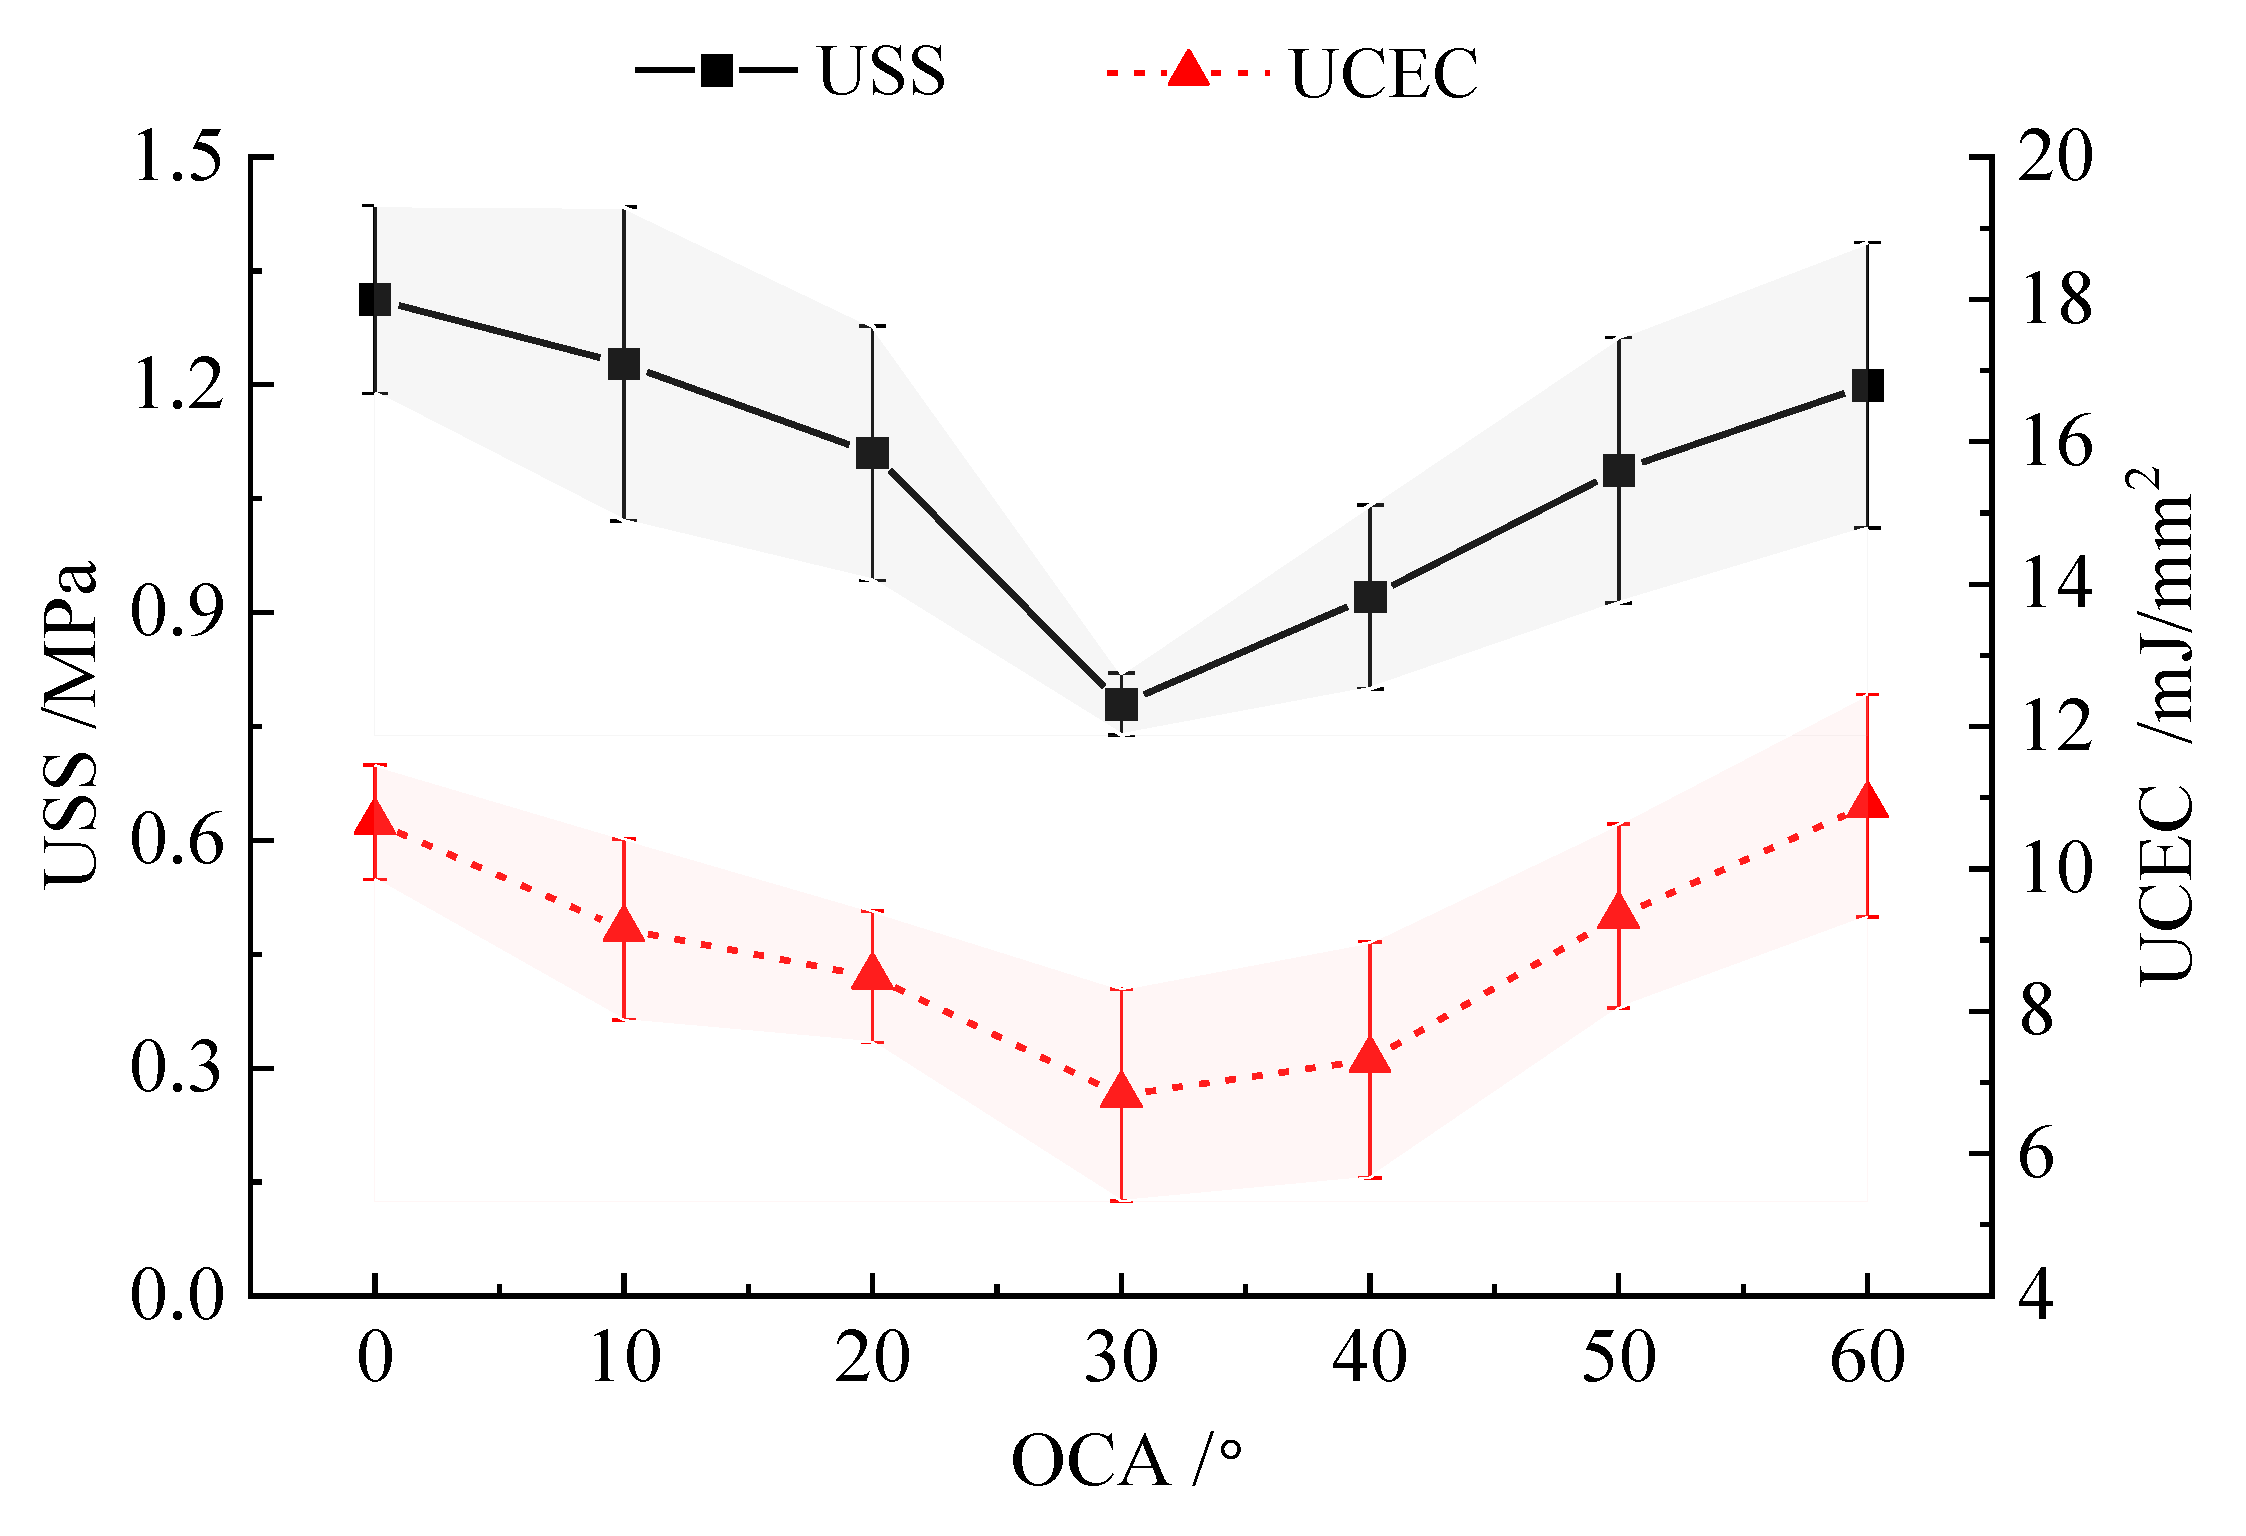
Figure 13.
Skew cutting experiment. (a) Skew cutting device; (b) Skew cut stalk morphology.
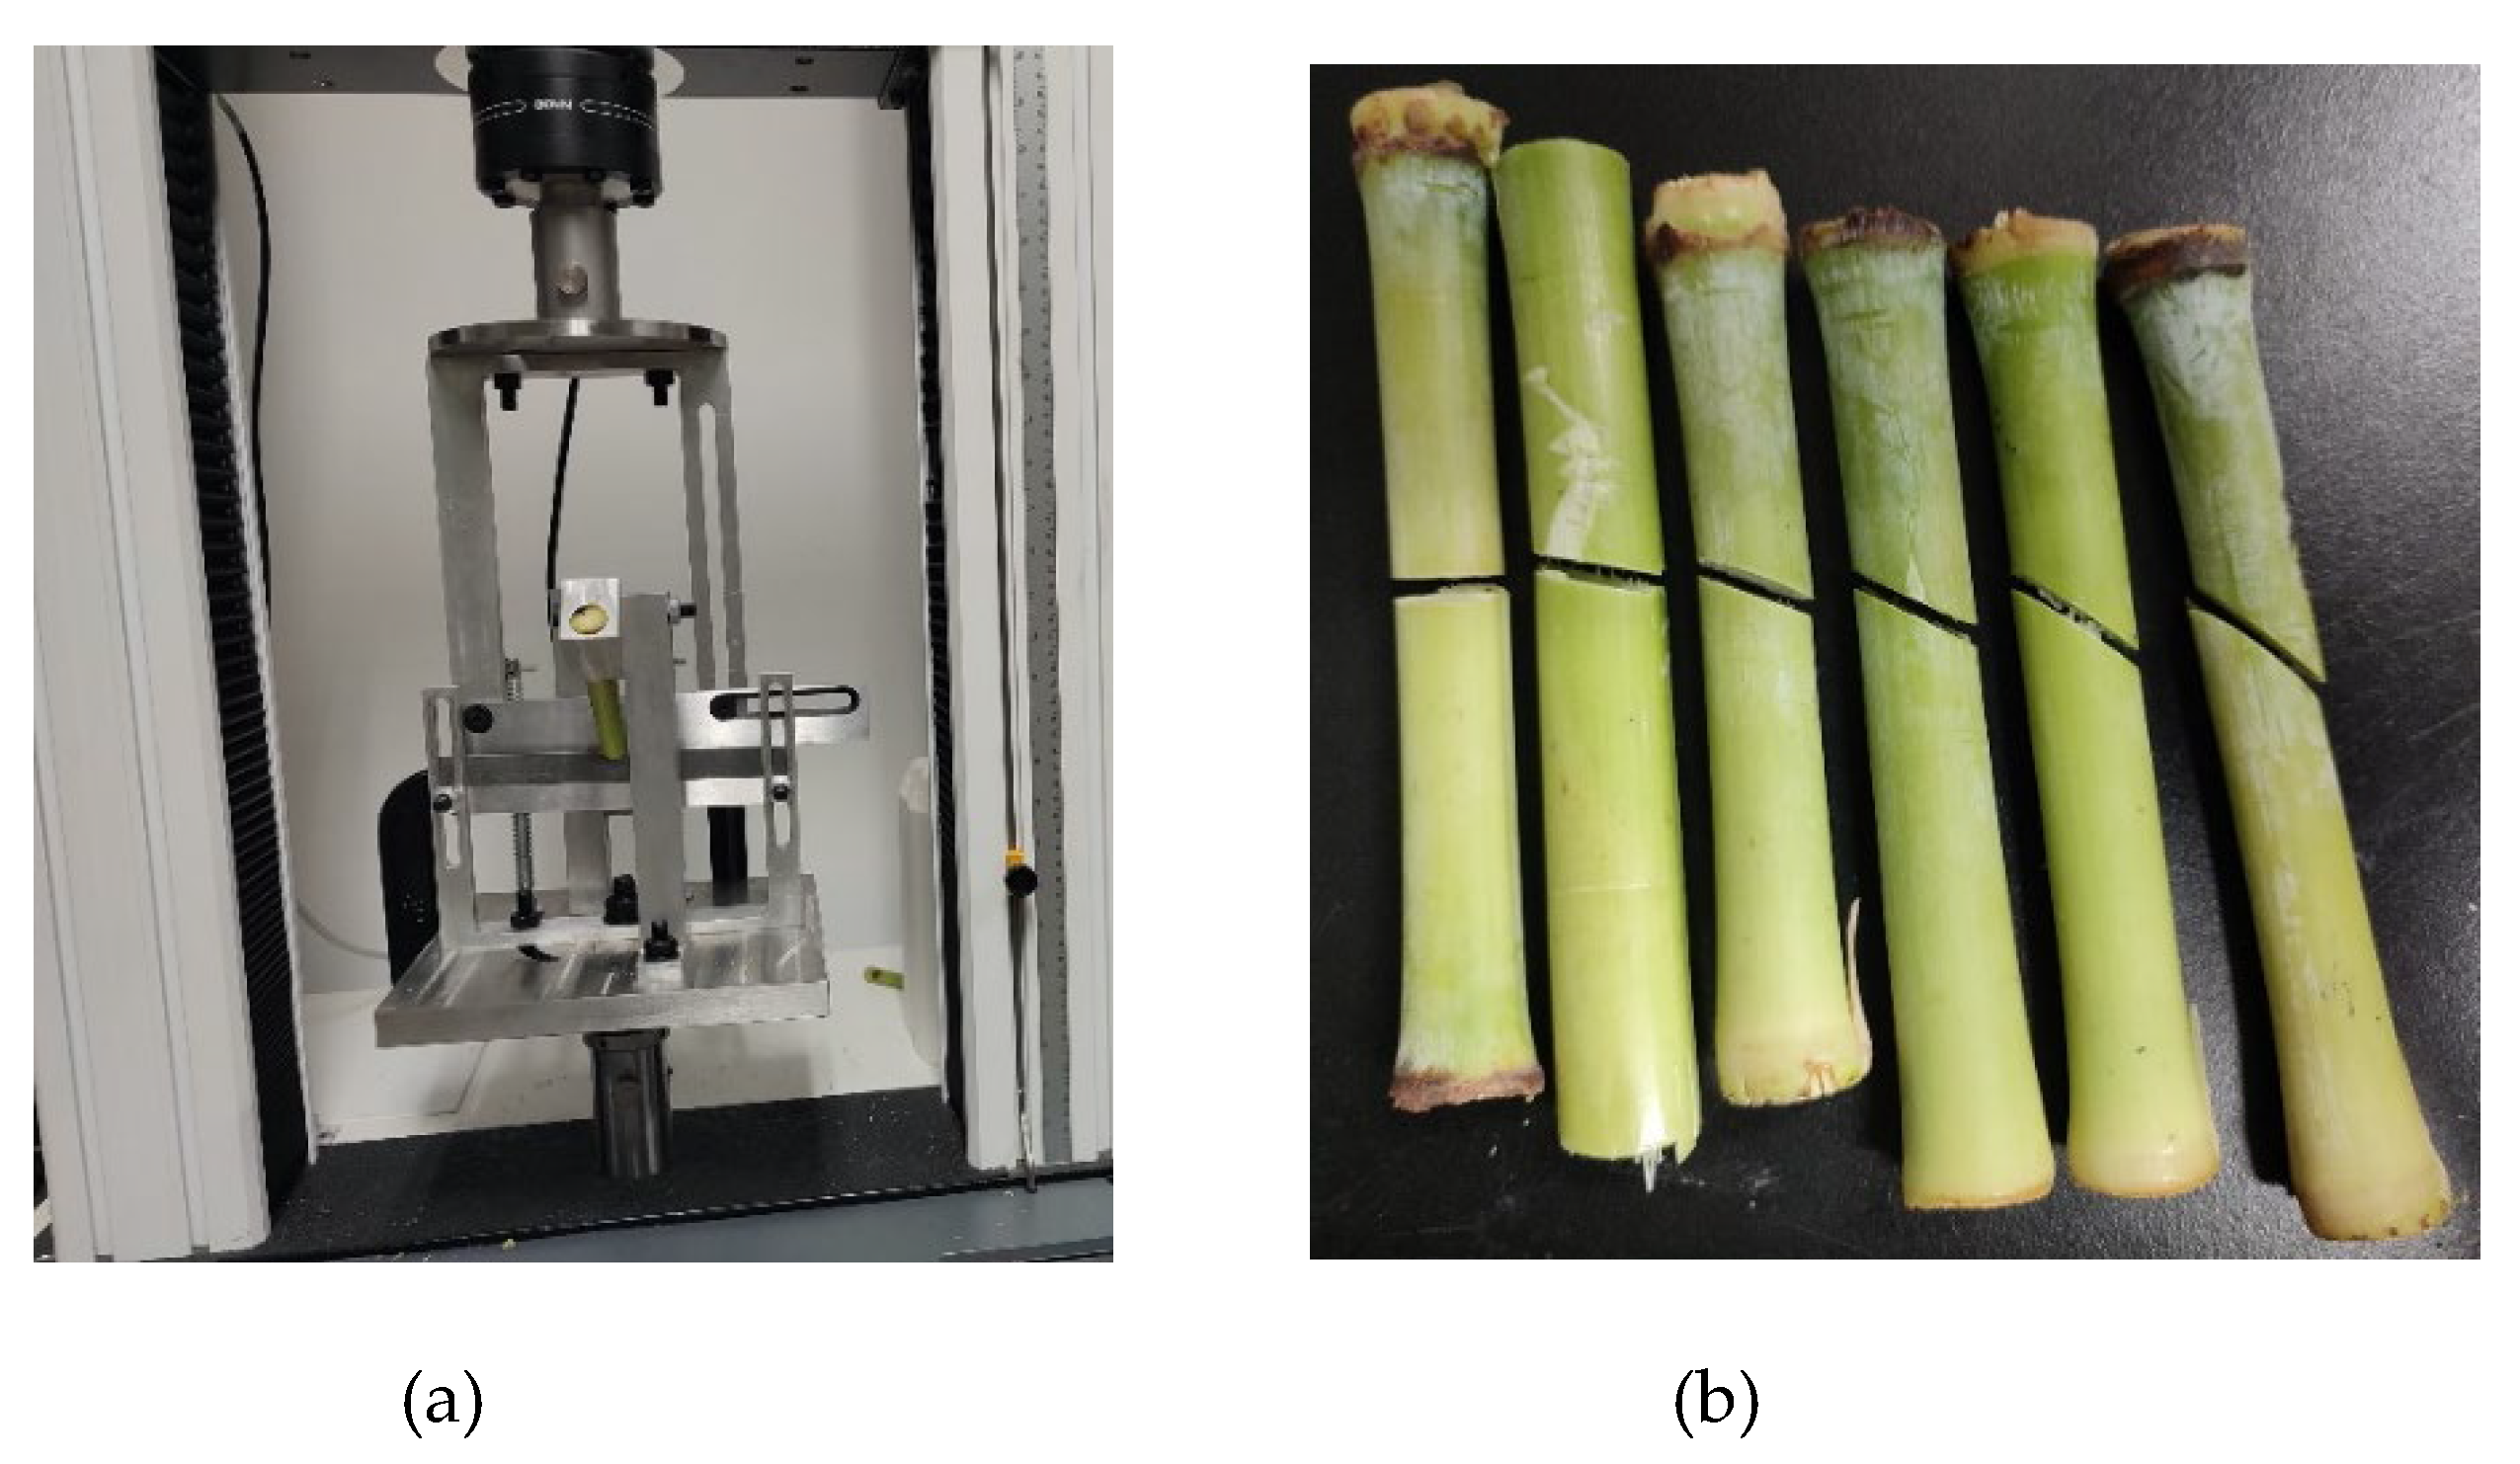
Figure 14.
The influence of SKCA on stalk cutting characteristics.
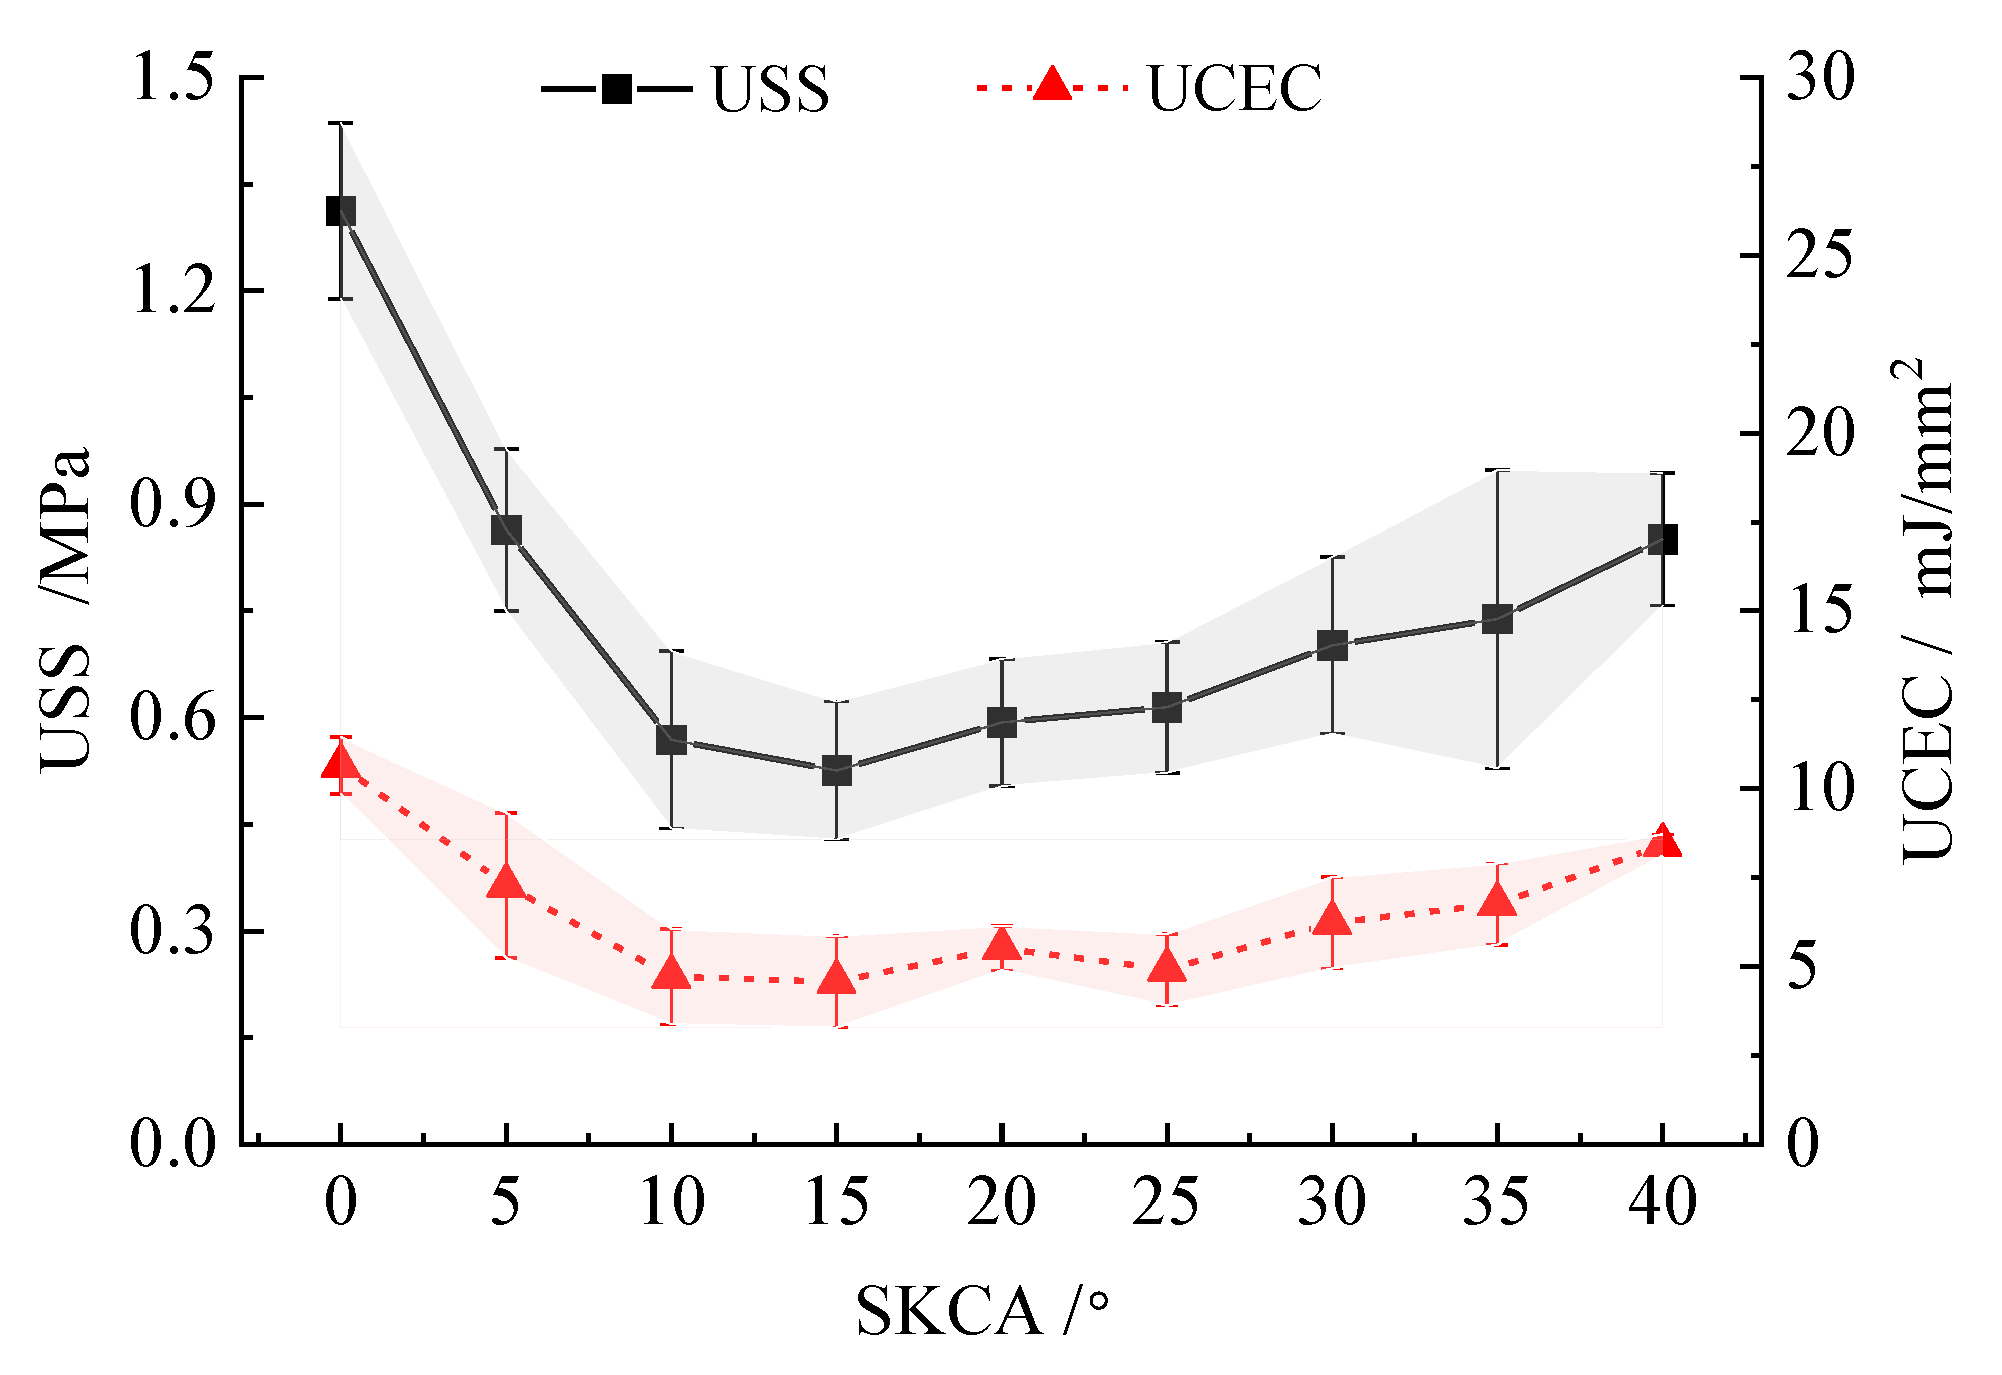
Figure 15.
The influence of SCA on stalk cutting characteristics.
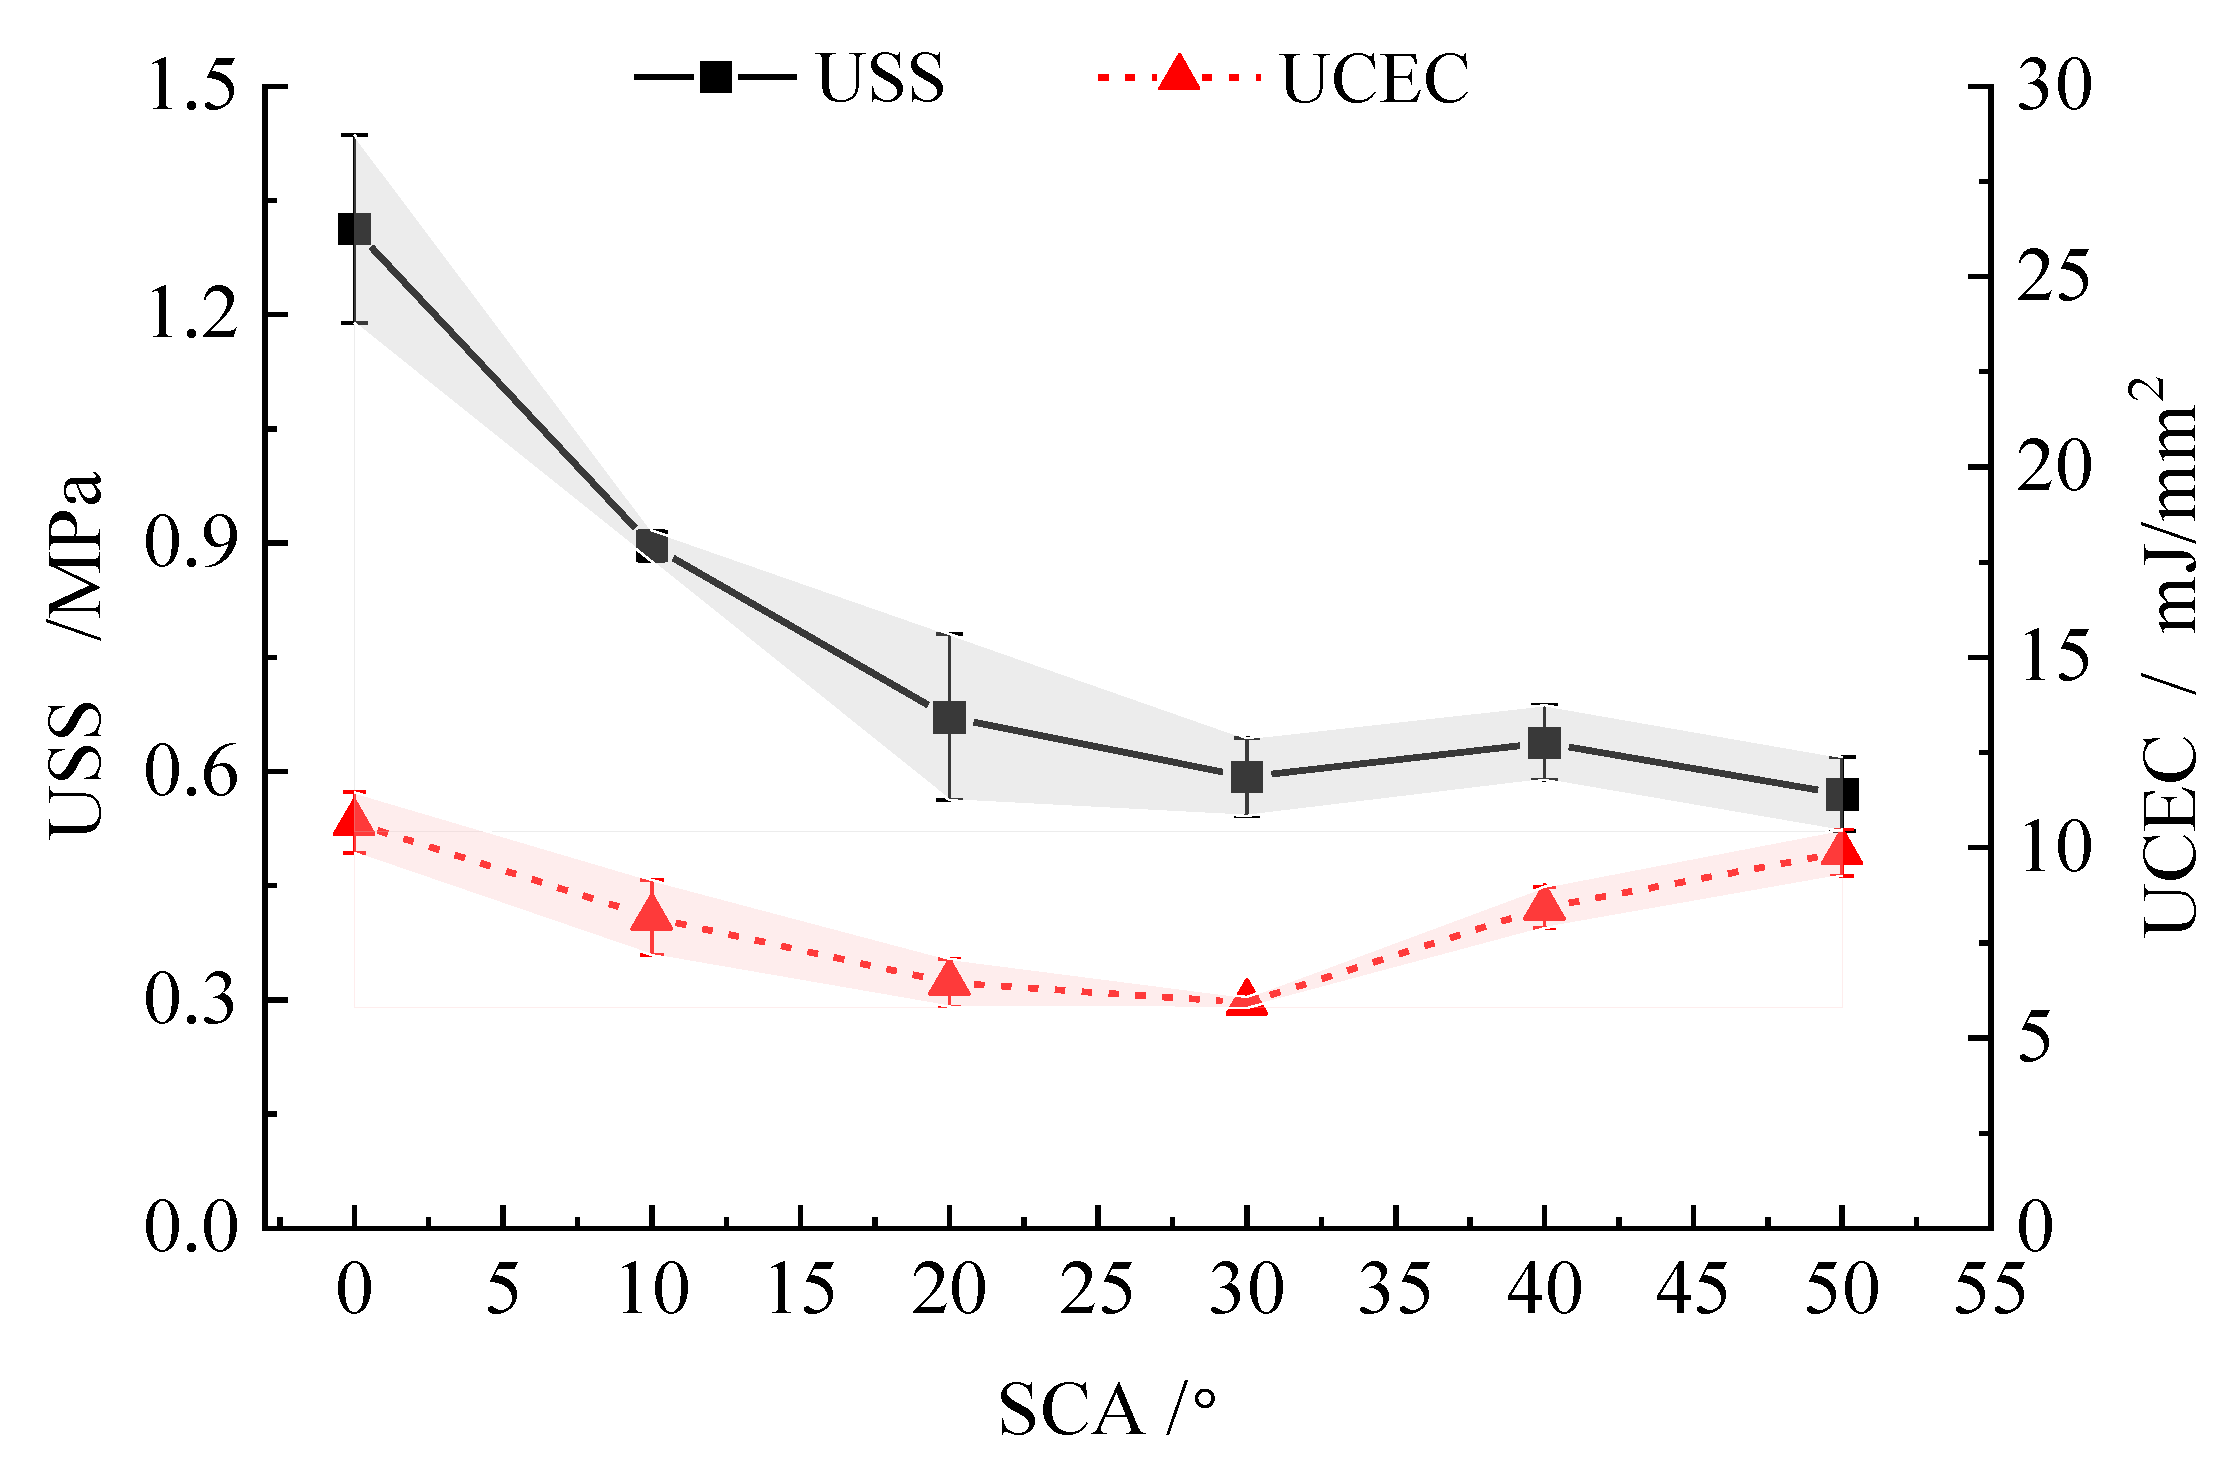
Figure 16.
Residual diagnostics of the Y1 quadratic model. (a)Normal plot of residuals; (b) Residuals vs. Predicted; (c) Predicted vs. Actual.
Figure 16.
Residual diagnostics of the Y1 quadratic model. (a)Normal plot of residuals; (b) Residuals vs. Predicted; (c) Predicted vs. Actual.
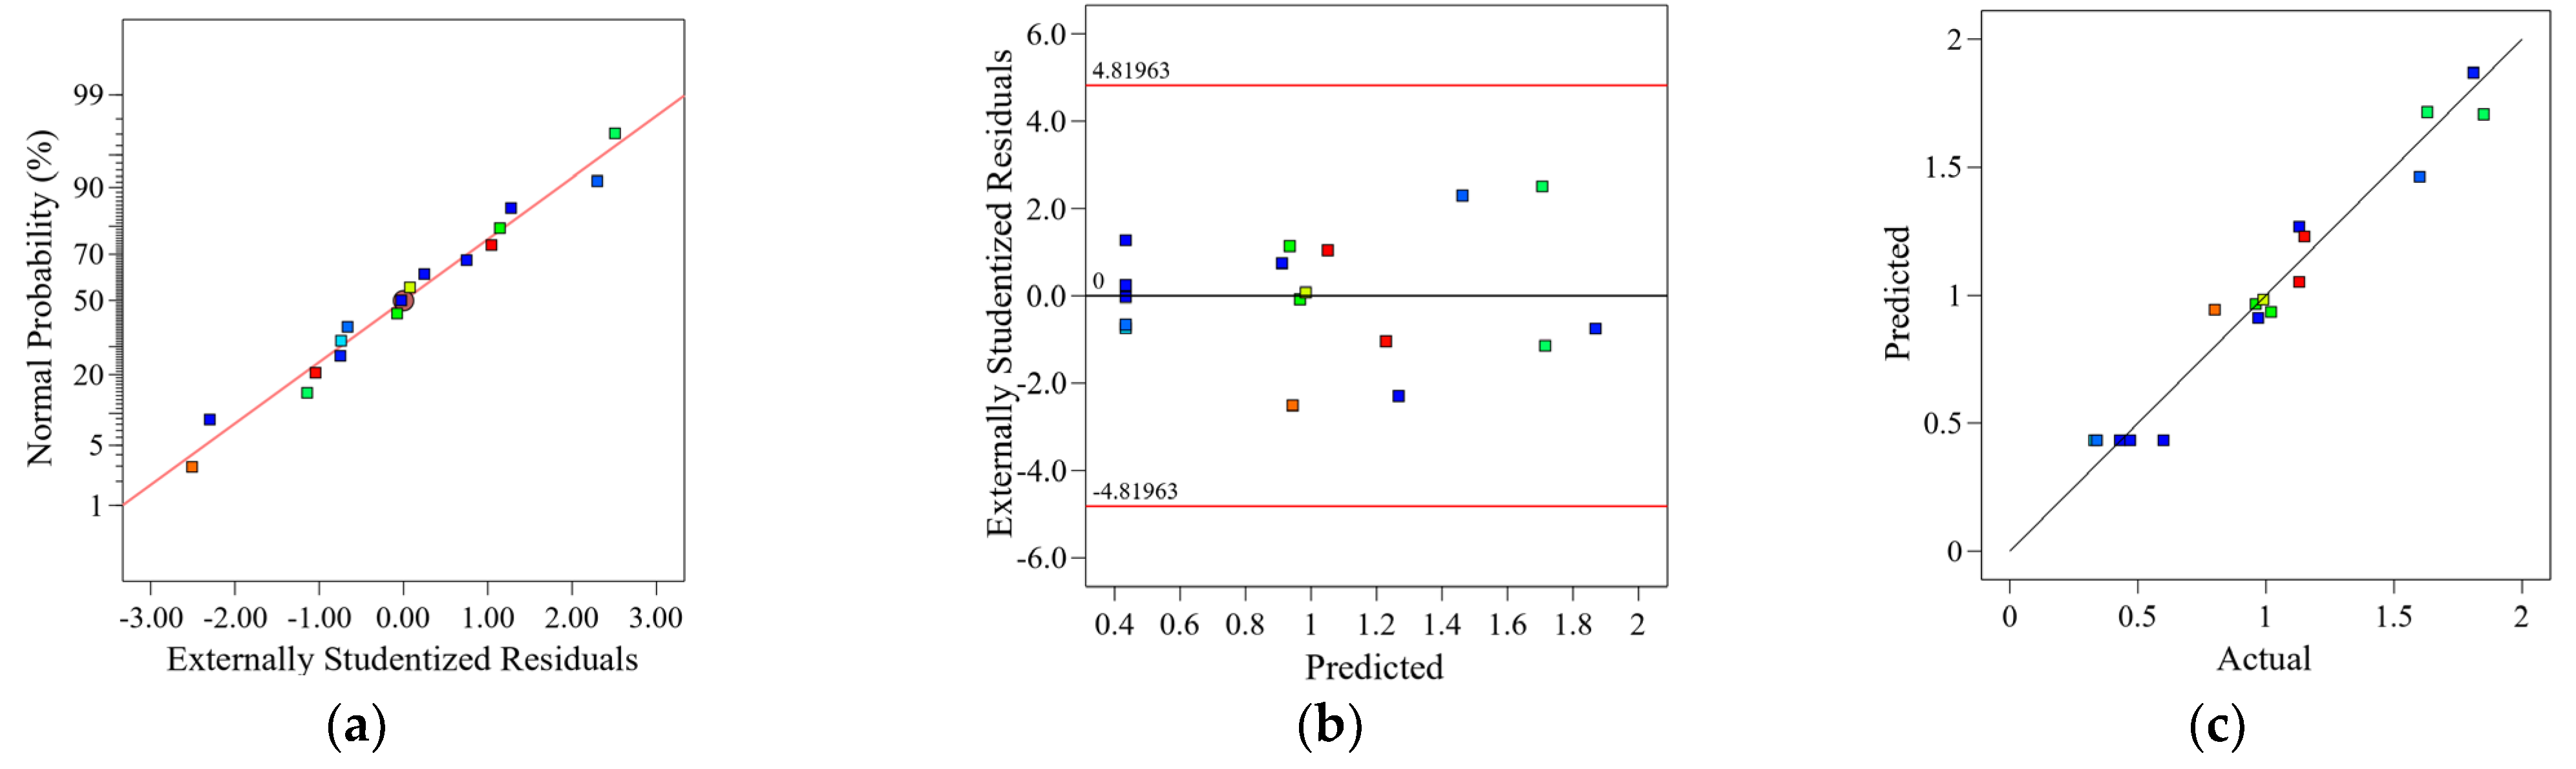
Figure 17.
Interaction between the OCA and the blade clearance on the USS Y1. (a) Response surface diagram; (b) Contour diagram.
Figure 17.
Interaction between the OCA and the blade clearance on the USS Y1. (a) Response surface diagram; (b) Contour diagram.
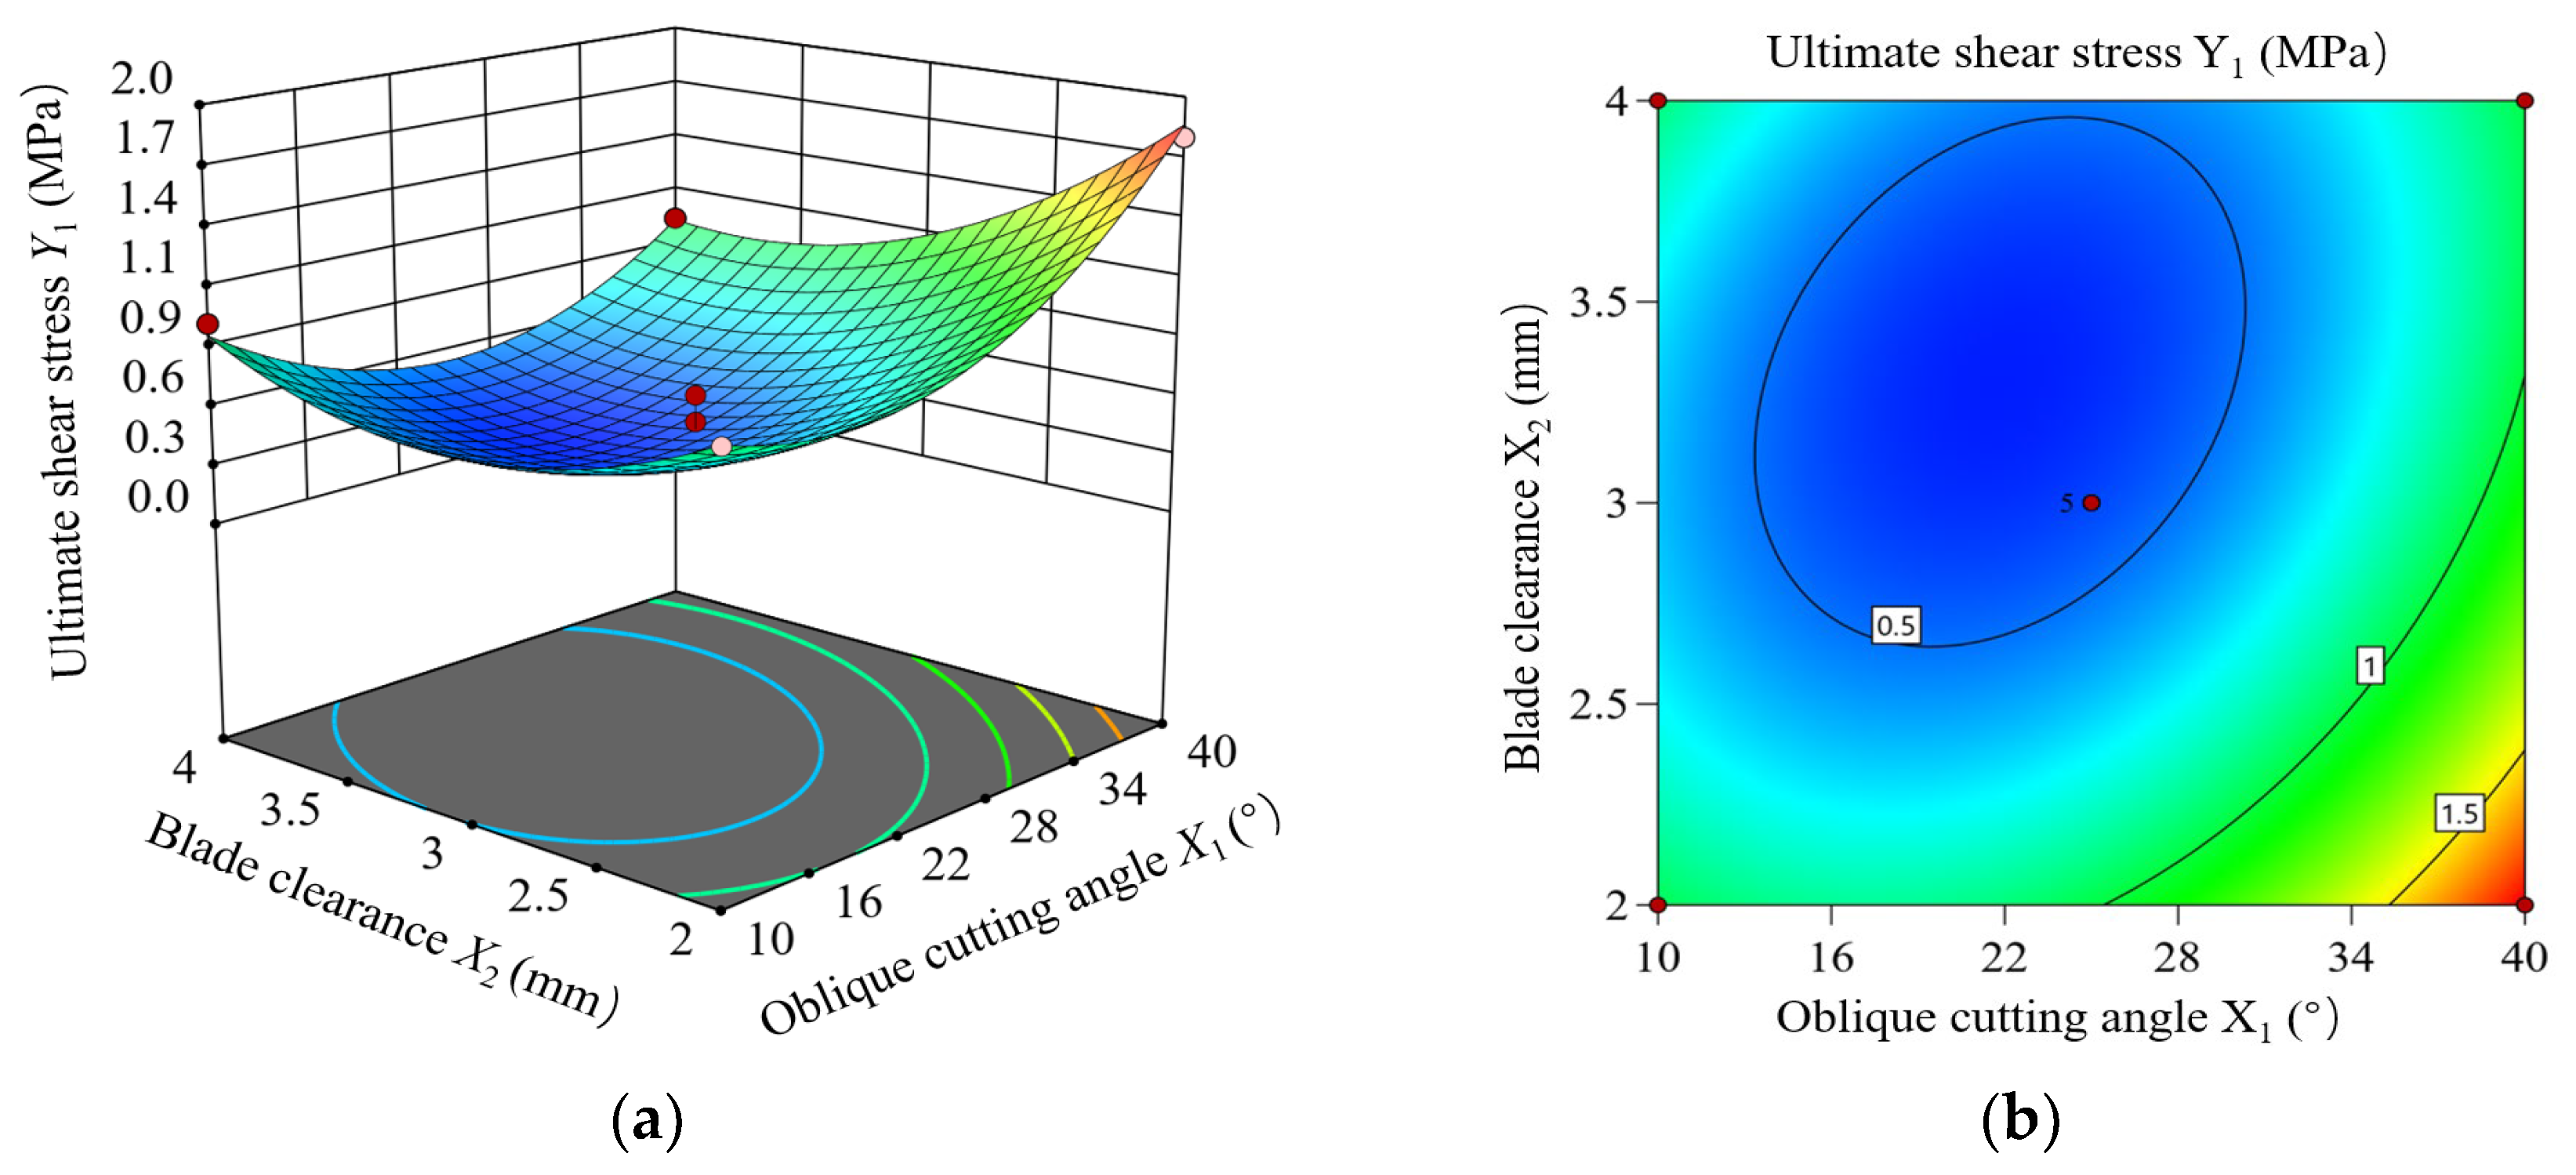
Figure 18.
Residual diagnostics of the Y2 quadratic model. (a)Normal plot of residuals; (b) Residuals vs. Predicted; (c) Predicted vs. Actual.
Figure 18.
Residual diagnostics of the Y2 quadratic model. (a)Normal plot of residuals; (b) Residuals vs. Predicted; (c) Predicted vs. Actual.
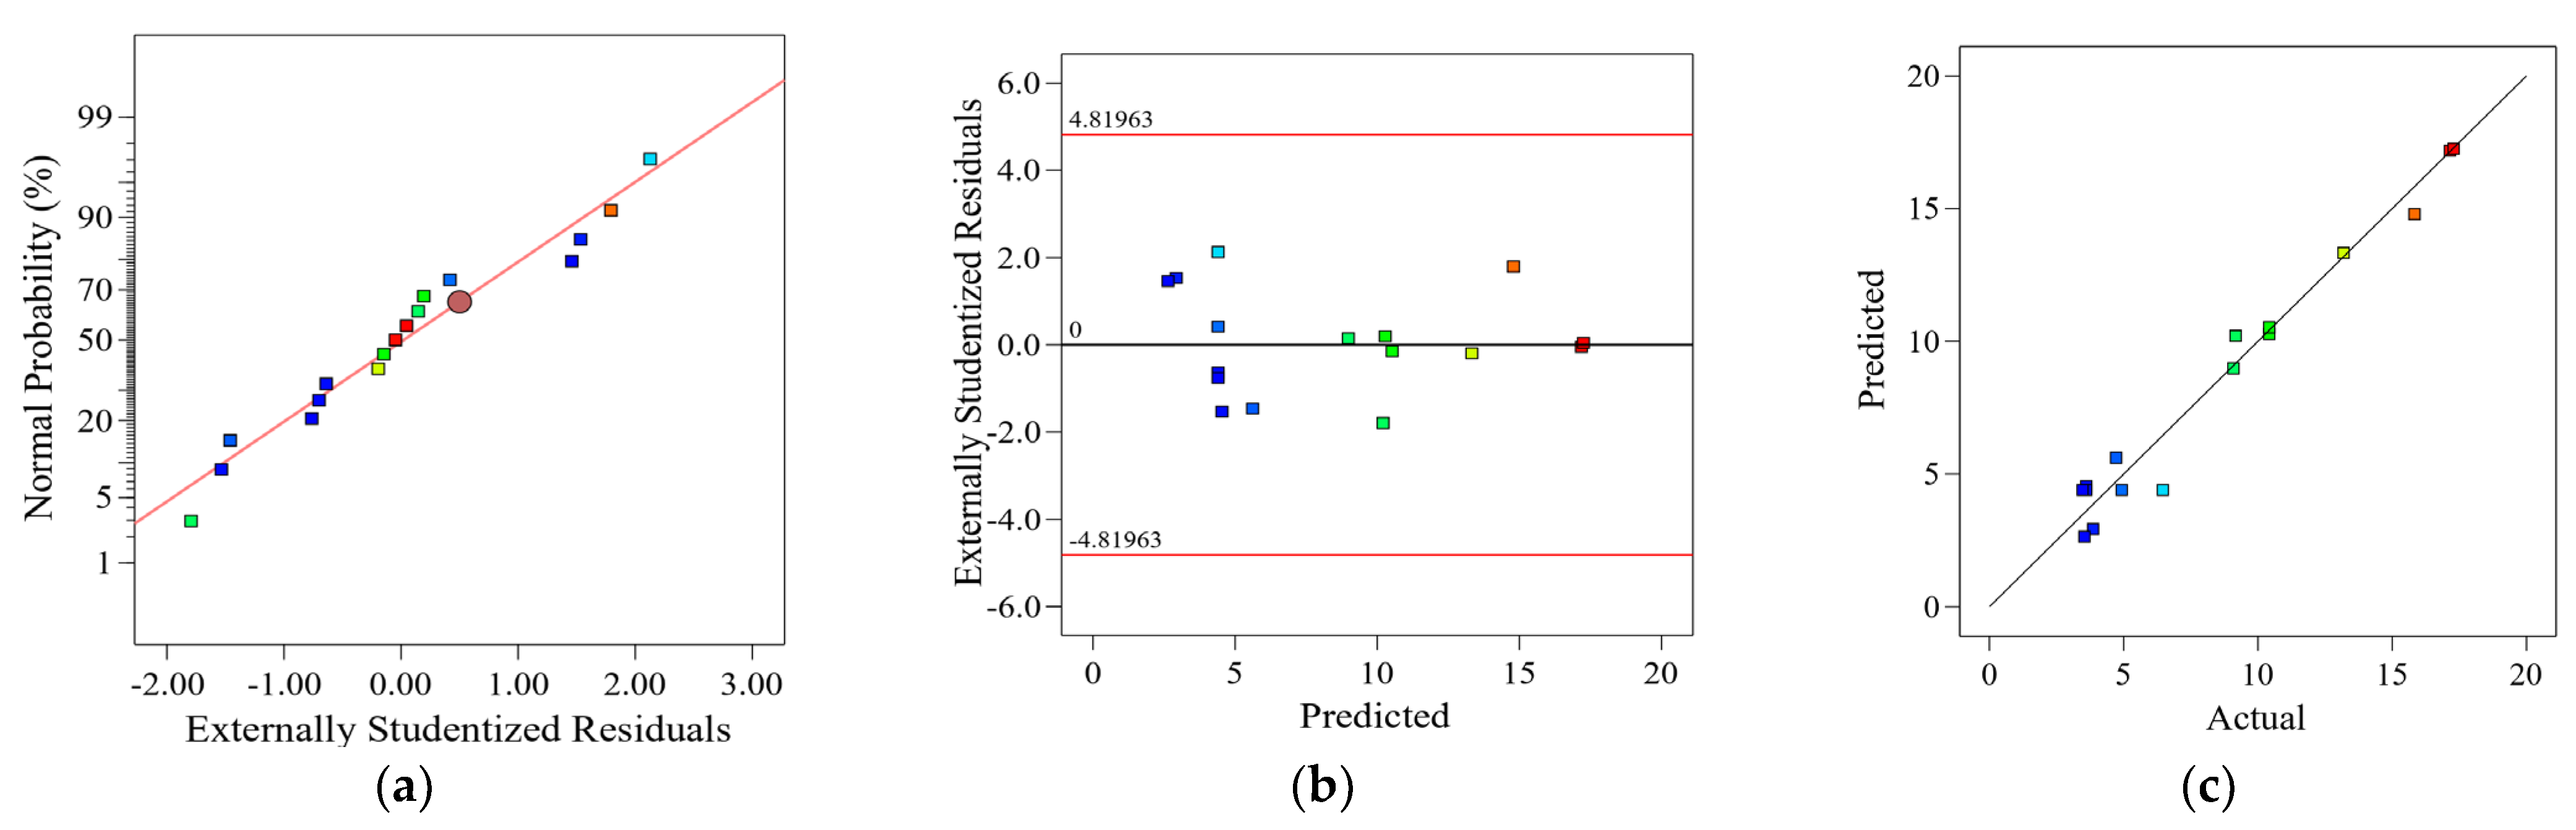
Figure 19.
Response surface diagram of UCEC. (a) Interaction between X1 and X2; (b) Interaction between X1 and X3; (c) Interaction between X2 and X3.
Figure 19.
Response surface diagram of UCEC. (a) Interaction between X1 and X2; (b) Interaction between X1 and X3; (c) Interaction between X2 and X3.
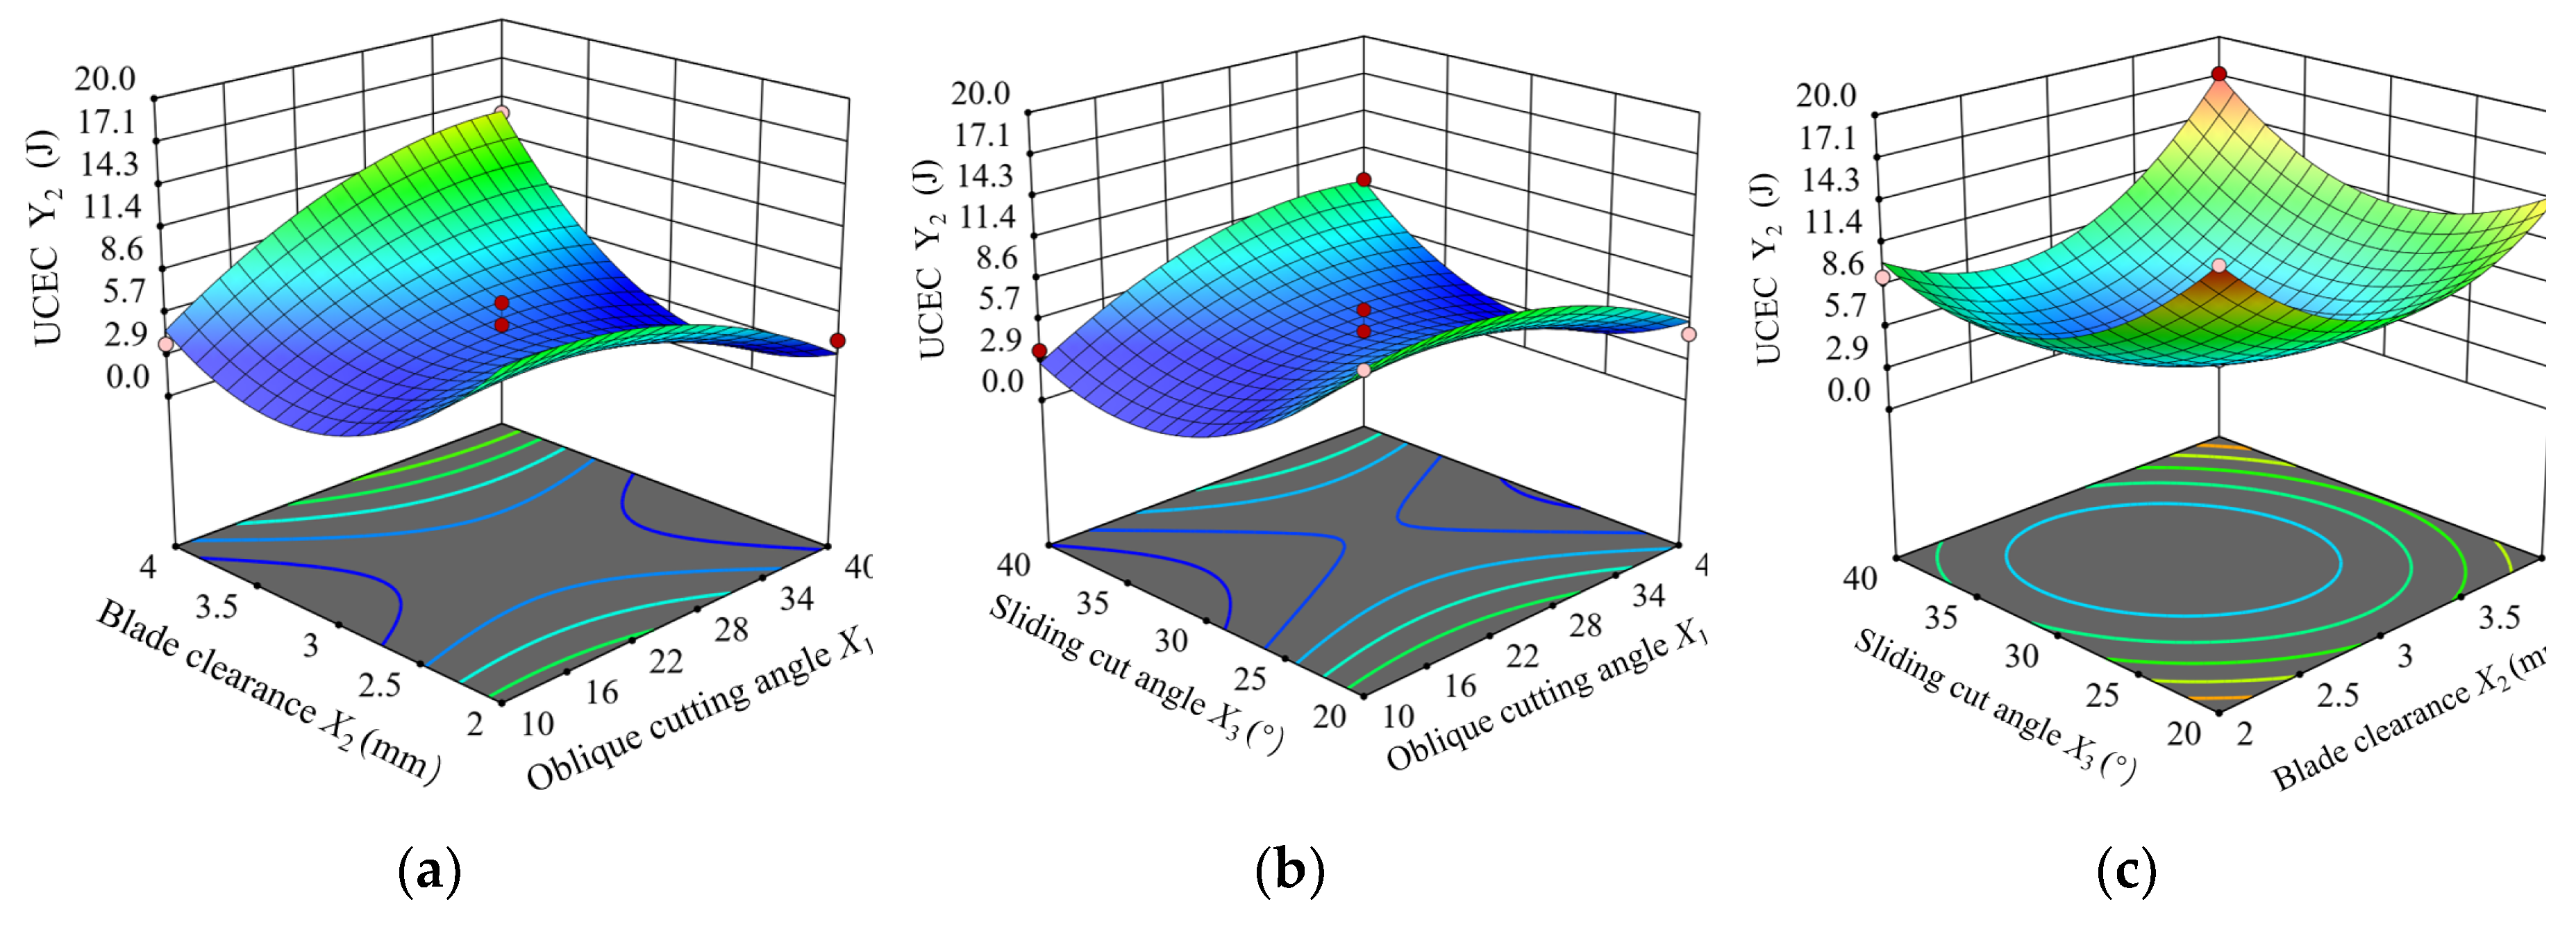

Table 1.
Code table of test factors.
| Code | Factor | ||
| OCA (°) |
Blade clearance (mm) |
SCA (°) |
|
| -1 | 10 | 2 | 20 |
| 0 | 25 | 3 | 30 |
| 1 | 40 | 4 | 40 |
Table 2.
Experimental plan and results on a universal testing machine.
| Test number | Factor level | Results of indicators | |||
| OCA (°) |
Blade clearance (mm) | SCA (°) |
USS (MPa) |
UCEC (mJ/mm2) |
|
| 1 | 10 | 2 | 30 | 0.96 | 10.42 |
| 2 | 40 | 2 | 30 | 1.81 | 3.86 |
| 3 | 10 | 4 | 30 | 0.97 | 3.61 |
| 4 | 40 | 4 | 30 | 0.99 | 13.19 |
| 5 | 10 | 3 | 20 | 1.02 | 10.42 |
| 6 | 40 | 3 | 20 | 1.60 | 4.72 |
| 7 | 10 | 3 | 40 | 1.13 | 3.54 |
| 8 | 40 | 3 | 40 | 1.63 | 9.09 |
| 9 | 25 | 2 | 20 | 1.15 | 17.15 |
| 10 | 25 | 4 | 20 | 0.80 | 15.83 |
| 11 | 25 | 2 | 40 | 1.85 | 9.17 |
| 12 | 25 | 4 | 40 | 1.13 | 17.29 |
| 13 | 25 | 3 | 30 | 0.43 | 3.54 |
| 14 | 25 | 3 | 30 | 0.33 | 6.46 |
| 15 | 25 | 3 | 30 | 0.47 | 3.61 |
| 16 | 25 | 3 | 30 | 0.60 | 3.47 |
| 17 | 25 | 3 | 30 | 0.34 | 4.93 |
Table 3.
The ANOVA of USS.
| Variance source | Sum of squares | Freedom | Mean Square | F value | Significant level P |
|---|---|---|---|---|---|
| Model | 3.72 | 9 | 0.4134 | 17.92 | 0.0005** |
| 0.4753 | 1 | 0.4753 | 20.60 | 0.0027** | |
| 0.4418 | 1 | 0.4418 | 19.15 | 0.0033** | |
| 0.1711 | 1 | 0.1711 | 7.42 | 0.0296* | |
| 0.1722 | 1 | 0.1722 | 7.47 | 0.0292* | |
| 0.0016 | 1 | 0.0016 | 0.0694 | 0.7999 | |
| 0.0342 | 1 | 0.0342 | 1.48 | 0.2627 | |
| 0.7803 | 1 | 0.7803 | 33.82 | 0.0007** | |
| 0.4258 | 1 | 0.4258 | 18.46 | 0.0036** | |
| 0.9721 | 1 | 0.9721 | 42.14 | 0.0003** | |
| Residual | 0.1615 | 7 | 0.0231 | ||
| Lack of Fit | 0.1130 | 3 | 0.0377 | 3.10 | 0.1512 |
| Pure Error | 0.0485 | 4 | 0.0121 | ||
| Cor Total | 3.88 | 16 | |||
| R-Squared | 0.9584 | C.V.% | 0.368 | ||
| Adj R-Squared | 0.9049 | Adeq Precision | 12.3160 | ||
Note: * indicates that this item has a significant impact on the result (P≤0.05), ** indicates that this item has a very significant impact on the result (P≤0.01).
Table 4.
The ANOVA of UCEC.
| Variance source | Sum of squares | Freedom | Mean Square | F value | Significant level P |
|---|---|---|---|---|---|
| Model | 397.69 | 9 | 44.19 | 25.13 | 0.0002** |
| 1.03 | 1 | 1.03 | 0.5855 | 0.4692 | |
| 10.86 | 1 | 10.86 | 6.17 | 0.0419* | |
| 10.19 | 1 | 10.19 | 5.80 | 0.0469* | |
| 65.12 | 1 | 65.12 | 37.04 | 0.0005** | |
| 31.64 | 1 | 31.64 | 17.99 | 0.0038** | |
| 22.28 | 1 | 22.28 | 12.67 | 0.0092** | |
| 21.79 | 1 | 21.79 | 12.39 | 0.0097** | |
| 134.07 | 1 | 134.07 | 76.24 | < 0.0001** | |
| 97.63 | 1 | 97.63 | 55.52 | 0.0001** | |
| Residual | 12.31 | 7 | 1.76 | ||
| Lack of Fit | 5.56 | 3 | 1.85 | 1.10 | 0.4472 |
| Pure Error | 6.75 | 4 | 1.69 | ||
| Cor Total | 410.00 | 16 | |||
| R-Squared | 0.9700 | C.V.% | 16.07 | ||
| Adj R-Squared | 0.9314 | Adeq Precision | 14.3689 | ||
Note: * indicates that this item has a significant impact on the result (P≤0.05), ** indicates that this item has a very significant impact on the result (P≤0.01).
Table 5.
Comparison of predictive and actual experimental value.
| Indicators | Predicted value | Actual experimental value | Relative error (%) |
Average relative error (%) |
|---|---|---|---|---|
| USS (MPa) | 0.42 | 0.45 | 7.14 | 6.34 |
| 0.44 | 4.76 | |||
| 0.39 | 7.14 | |||
| UCEC (mJ/mm2) | 3.47 | 3.62 | 4.32 | 4.71 |
| 3.79 | 9.22 | |||
| 3.45 | 0.58 |
Disclaimer/Publisher’s Note: The statements, opinions and data contained in all publications are solely those of the individual author(s) and contributor(s) and not of MDPI and/or the editor(s). MDPI and/or the editor(s) disclaim responsibility for any injury to people or property resulting from any ideas, methods, instructions or products referred to in the content. |
© 2024 by the authors. Licensee MDPI, Basel, Switzerland. This article is an open access article distributed under the terms and conditions of the Creative Commons Attribution (CC BY) license (http://creativecommons.org/licenses/by/4.0/).
Copyright: This open access article is published under a Creative Commons CC BY 4.0 license, which permit the free download, distribution, and reuse, provided that the author and preprint are cited in any reuse.


