Submitted:
07 June 2024
Posted:
07 June 2024
You are already at the latest version
Abstract
Background: The role of preoperative serum carcinoembryonic antigen (sCEA) and postopeative tissue CEA (tCEA ) were widely elaborated separately for colorectal cancer (CRC). But the role of the combined sCEA and tCEA was scarcely described by now. Methods: 1757 cases of 0~ⅣCRC from January 2006 to January 2016 in our institution were involved. Clinicopathological features and follow up data were collected. 0 stage was combined into 0&Ⅰ stages. SCEA was classified to normal and high(>10ng/ml) and tCEA were classified into three grades (+,++,+++). So combined groups were six (2ⅹ3). ANOVA and Crosstab were used to analyze continuous and counting data, Univariate and multivariate were analyzed by Cox regression. All data were analyzed by SPSS27 and survival curves with number at risk were visualized by R 4.3.1. Results: Gender, age, tumor location, tumor size, blood loss, T stage, differentiation, harvested lymph nodes, positive lymph nodes, chemotherapy, TNM stage and complication have difference between the combined CEA test (all P
Keywords:
CRC
; Prognosis
; sCEA
; tCEA
; combined CEA
; ROC
; AUC
; OS
1. Instruction
Colorectal cancer (CRC) is one of the most common cancers worldwide that is responsible for serious damage to human health, and a reduction in the survival of affected patients. Colorectal adenocarcinoma accounts for approximately three- quarters of colorectal cancer cases[1]. Despite decades of intense research into this disease, it still proves challenging to unravel the molecular mechanisms underlying it. However, a common consensus is that CRC is a genetic disease resulting from accumulated mutations in tumor suppressor genes and oncogenes, referred to as genomic instability [2]. Tumor markers can indicate the presence of cancer, more importantly, provide information about treatment response or progression[3]. Carcinoembryonic antigen (CEA) can be elevated in CRC patients and be associated with worse prognosis with CRC[4, 5]. Carcinoembryonic antigen (CEA) in serum ( sCEA) is widely used as a tumor marker in colorectal cancer (CRC)[6]. SCEA level was correlated with tumor stage and metastasis[7]and our previous study showed high level sCEA was associated with poor prognosis of CRC in Ⅲ stage[8]. Rulan Ma,et. al[9] showed sCEA≥5ng/ml was an factor with poor prognosis of CRC. The levels of sCEA was significantly increased in the gastrointestinal tumor group compared with the healthy group[7]. Elevated preoperative s-CEA concentration, defined as > 5 ng/ml or more than two-fold higher than the normal cut-off value, is significantly associated with poorer overall and higher cancer-specific mortality in CRC patients [10]. sCEA is a clinically-established serum biomarker for CRC diagnosis [11]. Preoperatively elevated levels of sCEA were reliable predictors of postoperative high-risk recurrence in CRC and combined with TNM stage precisely identify postoperative recurrence CRC patients in stage I-III and the benefit of adjuvant chemotherapy for patients with stage II CRC[12].The expression of tissue CEA (tCEA) can be immunohistochemically assessed in colorectal mucosa and tumor tissues. t-CEA is rarely expressed in normal colorectal mucosa but is consistently found in colorectal neoplasms, with different expression patterns and intensities[10, 13, 14]. Aldilaijan AF et.al[10] found that t-CEA expression intensity and pattern correlated significantly with preoperative s-CEA level. In their study of the 7412 patients included in the present study, only 100 (1.3%) showed inverse relationships between t-CEA expression intensities and preoperative sCEA levels. Low t-CEA expression intensity in patients with high preoperative s-CEA levels may be explained by factors unrelated to malignancy, including the wide range of normal preoperative sCEA concentrations among healthy people, the effects of age and benign conditions, the high variability of liver metabolic rates, and the long half-life of glycoproteins. Our previous literature showed higher level of tCEA was associated with worse prognosis of CRC in Ⅰ~Ⅲ stage[8].But the prognosis of tCEA for CRC was rarely reported and Polivka J,et al[15] suggested the best prognostic value could be reached by a combination of circulating cell-free tumor DNA ( ctDNA) and tumor marker CEA. The combination of CEA, carbohydrate antigen 19-9(CA19-9) and carbohydrate antigen 24-2( CA24-2 ) ranked the best sensitivity and specificity for colorectal cancer diagnosis[16]. Preoperative serum CA724 might serve as a potential prognostic factor for CRC patients with normal serum CEA levels[17]. But Kemper M et.al [18]pointed out only CEA was an independent prognostic factor for survival by multivariate Cox regression analysis. One other literature showed serum carbohydrate antigen 19–9 (CA19-9) with recurrence free survival (RFS) and overall survival (OS) were evaluated in patients with or without elevated sCEA[19]. So by far the value of only sCEA and tCEA have controversial issues for the prognosis of CRC. This is the aim of this study in which we assessed the prognostic values for CRC combining sCEA and tCEA. In this study we used the the factor of combined CEA to explore the prognostic values of CRC according to the different level of sCEA [normal(<10ng/ml),high(≥10ng/ml)] and different expression level of tCEA(+,++,+++) by the classification of our previous literature[8]. Therefor combined CEA has six grades (2ⅹ3). Before the study, we assessed the value of combined CEA using ROC (Receiver Operating Characteristic Curve) which showed that sCEA, tCEA and combined CEA have significant difference by 5 year overall survival (OS) with death as input variate (all P<0.05) in which AUC (Area Under Curve) of combined CEA was maximum, indicating that combined CEA as a variate has value and necessity compared with only sCEA and tCEA analysis for the prognostic role of CRC .
2. Materials and Methods
2.1. Patients
A total of 2,540 CRC patients were collected in the Colorectal Surgery Department of Huzhou Central Hospital, China from January 2006 to January 2016. 783 cases were deleted for kinds of reasons such as no surgery, clinicopathological data missing, follow up data missing and dying from no primary tumors. At last, 1757 cases were involved in this study. The Routine of collecting cases as our previous literature as using the same data[20]. The inclusion criteria were as follows: patients diagnosed with CRC through colonoscopy, computed tomography (CT), and pathological tests inside or outside our hospital; no preoperative adjuvant treatment; surgery in our department; normal lymph node dissection indicating that ≥12 lymph nodes were detected, although a small number of samples were included in this article, and only 10–11 lymph nodes were detected; CRC-related death as a termination event; postoperative routine immunohistochemical (IHC) analysis and pathological examination for tCEA and postoperative chemotherapy determined by the National Comprehensive Cancer Network (NCCN, version 2006) guidelines. Edition of the American Joint Committee on Cancer (AJCC-8) guidelines was used to determine the TNM stage after surgery. The exclusion criteria were as follows: CRC patients with serious heart, brain, liver, and lung diseases that did not tolerate surgery; non-CRC factors leading to patient death; and follow-up data missing and/or clinicopathological data missing. Patients undergoing preoperative neoadjuvant chemotherapy and radiotherapy were also excluded. According to previous literature,0 stage was combined in to Ⅰ stage using 0&Ⅰstage[21] in this study.
2.2. Follow Up
Patients were followed up once every 3 months in the first year after primary CRC surgery then every 6 months at second year, and 12 months at the remaining three years, till total 5 years. All follow up data came from our document acquired by phone and inpatient electronic medical record system (Haitai Software Version 3.0, Nanjing). Survival time was the month from primary surgery date to death date or the end of follow up time which was equal or more than 5 years. If survival time was more than 60 months it was defined as 60 months. Death from primary tumor or tumor-related disease was defined as positive event, others as censoring. So in this study only overall survival (OS) were analyzed.
2.3. Detection of Preoperative Serum CEA
For each of the involved patients, venous blood was drawn before surgery which was utilized by Shanghai Yu-ping biotechnology company kit (Shanghai, China), using double antibody one-step enzymelinked immunosorbent assay (ELISA). Experimenters added the sample, standard, and horseradish peroxidase (HRP)-labeled detection antibody, in that order, to microwells precoated with the CEA capture antibody. After an incubation period, the wells were washed. The absorbance (OD value) was measured using a microplate reader at a wavelength of 450 nm to calculate the sample concentration (the normal reference value is 0-10 ng/mL). An s-CEA level of >10 ng/mL is considered high, and ≤10 ng/mL is considered normal.
2.4. T-CEA Immunohistochemistry
Immunohistochemical t-CEA detection is used as a method to pathologically examine CRC in our hospital. Formalin fixed and paraffin-embedded tumor specimens were cut into 5-mm-thick slices, that were then subjected to methyl dewaxing and hydration. The two-step EnVision immunohistochemistry system was used: the original anti-CEA antibody (clone No. COL-1, zm-0061; Golden Bridge Company, Beijing, China) was used in a 1:50 dilution, incubated at 4°C; two anti pv8000; finally, an examination under a microscope was performed to determine the percentage of cells positively stained for CEA. All slides were independently analyzed by two regularly trained pathologists; the third pathologist was asked to confirm the assessment in case of disagreement. All slides were observed under 200× magnifications to determine the cell density (+,++, and +++) and the corresponding proportion (≤25%,> 25&≤50% and >50%) of stained cells in different regions. From the t-CEA images shown in Figure 1 (A,B,C), the 200× magnification image was used for good clarity( Figure 1 ,Left), 800× magnification image for better clarity by Photoshop ( Version 2020, Figure 1, Right).
2.5. Combined CEA Classification
According to previous sCEA and tCEA classification which have 2 grades and 3 grades especially , combined CEA was classified into 6 grades which were sCEA normal& tCEA+, sCEA normal& tCEA++, sCEA normal& tCEA+++, sCEA high& tCEA+, sCEA high& tCEA++, sCEA high& tCEA+++. So all data were divided into six groups for analysis by combined CEA classification.
2.6. Receiver Operating Characteristic Curve (ROC) Analysis
Receiver Operating Characteristic Curve (ROC) analysis was used for sCEA and tCEA and
Combined CEA using death event of 5 year OS as input parameter to determine whether Combined CEA classification has necessity and priority to perform this study. AUC (Area Under Curve) analysis confirmed the value of the study.
2.7. Statistical Analysis
All clinicopathological features were analyzed by SPSS 27. ANOVA and Crosstab methods were used to analyze continuous variates and counting variates especially. Comparisons between Combined CEA groups were performed by F and X2 test. Kaplan-Meier and Log rank test were used to perform survival analysis between sCEA and tCEA and combined CEA groups. Then Cox regression analysis were used for univariate and multivariate. 5 year OS survival curves with numbers at risk were drawn by R software (version 4.3.1) using “ggplot2”, “survival”,”survminer” packages.
3. Results
3.1. Clinicopathological Features by Combined CEA
The percentages of combined CEA are 21.2(372/1757) for sCEA normal&tCEA+, 19.5%(343/1757) for sCEA normal&tCEA++,7.7%(136/1757) for sCEA normal&tCEA+++,13.1%(230/1757) for sCEA high&tCEA+, 24.9%(438/1757) for sCEA high&tCEA++, and 13.5%(238/1757) for sCEA high&tCEA+++. Gender has difference between combined CEA, F=12.22, P=0.032; There is significant difference about age between the groups, x2=5.37, P<0.001; significant differences between combined CEA groups, F=202.11, P<0.001, F=452.82, P<0.001, F=22.25, P<0.001, F-22.25, P<0.001, F= 160.92, P<0.001, F=58.60, P<0.001. While continuous parameters shown as median and interquartile range (IQR) have significant differences between the groups, such as age (x2=5.37,P<0.001); tumor size (cm)(x2=18.60,P<0.001); blood loss (ml)(x2=3.51,P=0.004); harvested lymph nodes (no.) (x2=6.83,P<0.001);metastatic positive lymph nodes (no.) (x2=22.17,P<0.001). Counting data were shown as numbers and total percentage and continuous data were shown as median and IQR, details are shown in Table 1.
3.2. Receiver Operating Characteristic Curve (ROC) Analysis
Receiver Operating Characteristic Curve (ROC) analysis was used for sCEA and tCEA and combined CEA using death event of 5 year OS as input parameter. AUC (Area Under Curve) analysis confirmed the value of the study. AUC, 95% confidence interval (CI) and P values of sCEA and tCEA and combined CEA are as follows: ACU=0.539, CI=0.512~0.566,P=0.004; AUC=0.558,CI=0.531~0.584,P<0.001; AUC=0.566,CI=0.540~0.593,P<0.001. The outcomes show AUC of combined CEA is max in the three variates, indicating that combined CEA as an factor to study is valuable in this study (Figure 2A). In this analysis binary variate is death in 5 year OS and other variate is censoring. Mean survival time of 5 year OS in this study is 43.093 (months), SE =0.483 and 95%CI=42.146~44.040 (Figure 2B).
3.3. 5 Year OS Analysis by sCEA and tCEA and Combined CEA for 0&Ⅰ~Ⅳ CRC of AJCC-8
As Zhang G, et. al.’s study[21], in this study, we combined 0 stage (less data and data losing in some combined CEA) to Ⅰ stage and used 0&Ⅰstage.5 year OS and numbers at risk were carried out in any stage of AJCC-8. In 0&Ⅰstage , there are no significances in sCEA ,tCEA and combined CEA groups ( P=0.13,0.50,0.54 respectively, Figure 3); In Ⅱ stage there are no significances in sCEA ,tCEA and combined CEA groups (P=0.29,0.36,0.15 respectively, Figure 4); In Ⅲ stage there are all significant difference in the three classification methods.( all P<0.001, Figure 5); In Ⅳ stage sCEA and combined CEA have significant difference ( all P<0.001),but tCEA has no significant difference (P=0.24). In this stage, the group of sCEA normal&tCEA+++ is missing in Combined CEA (Figure 6).
3.4. Univariate Analysis by Cox Regression for Clinicopathological Features
In univariate analysis, there is no significant difference about age (P=0.926) and sCEA and complication have no significant difference (P=0.55, 0.85), indicating that age ,sCEA and complication are not prognostic factors for CRC in this study. While there are significant differences about tumor location, T stage ,differentiation, chemotherapy, TNM stages, tCEA and combined CEA ( tCEA a, P=0.002, all others P<0.001). Numbers, hazard ratio (HR), mean survival time and 95%CI, 5 year OS (%) and P value are all shown in Table 2.
3.5. Multivariate Analysis by Cox Regression for Clinicopathological Features
Seven parameters which have significant difference in univariate analysis were analyzed by multivariate analysis further. The outcomes showed that chemotherapy and tCEA have no significant difference (P=0.433,0.096),while the parameters of tumor location, T stage, differentiation, TNM stage, combined CEA have significant differences (all P<0.001). So this study documents that only combined CEA is independent prognostic factor for CRC while sCEA and tCEA are not. The details of analysis are shown in Table 3 which include comparison, ward and P value.
4. Discussion
sCEA is widely used before and after CRC operation[22]. CEA is a glycoprotein found by Gold and Freedman in colon cancer tissues, which was then applied as a CRC tumor marker[23]. sCEA expression was correlated with the CRC prognosis and was mainly used for disease follow-up and as a treatment response indicator[24]. Most patients (64.7%, 101/156) had increased sCEA levels in the serum[22].In the study, sCEA high level is only 51.6% (906/1757).The percentage of tCEA of (+,++,+++) is 34.2% (601/1757),44.6%(784/1757)and 21.2%(372/1757) respectively in this study. In CRC, CEA expressed following the disruption of normal tissue structure and the loss of polarization of neoplastic cells is secreted into the blood stream, eventually resulting in an increase in sCEA concentration[25].TCEA expression patterns have been described as apicoluminal (AL), diffuse-cytoplasmic (DC), or a combination of the two. The DC pattern and high levels of expression have been associated with tumor aggressiveness, including Lymphovascular invasion (LVI)[10, 26].Because s-CEA level is neither sufficiently sensitive nor specific as a screening tool for CRC[27],We performed this study. One recent study is similar to ours [10].We combined sCEA and tCEA to combined CEA as one new factor for further analysis.
In this paper, the percentages of sCEA normal&tCEA++, sCEA high&tCEA++ are higher than other groups in combined CEA classification as one new factor. Gender , tumor location, T stage, differentiation, chemotherapy, TNM stage, complication, age, tumor size, blood loss, harvested lymph nodes, metastatic positive lymph nodes are associated with the new factor indicating that there is value using the factor to analyze clinicopathological features. Although many previous studies have reported a lack of correlation between preoperative s-CEA levels and t-CEA expression[8, 28, 29], one literature confirmed the relationship[30].For these reasons , we used combined CEA as one new factor.
High preoperative s-CEA level is prognostic of poor survival in patients with CRC[31, 32]. High-intensity t-CEA expression was significantly associated with with higher tumor recurrence rates[33]. To analyze the 5 year OS furtherly, we performed ROC analysis for sCEA and tCEA and combined CEA. The outcome showed the AUC of combined CEA was bigger than only sCEA and tCEA , indicating that combined CEA as one new factor to analyze 5 year OS is valuable too. In this paper there are no significant differences of 5 year OS in 0&Ⅰ stage and Ⅱ stage for sCEA and tCEA which is not similar to our previous study[8]. The difference may be caused by recruited more patients in this study. There is also no difference of 5 year OS in 0&Ⅰ stage and Ⅱ stage for combined CEA. But in advanced CRC, such as Ⅲ stage and Ⅳ stage there are significant difference for the three factors except for tCEA in Ⅳ stage. The reason is unclear. But this can be considered that assessing the prognosis only using tCEA might have defects. The ability of tCEA expression intensity to predict recurrence was especially noticeable among patients with low preoperative sCEA levels, with patients having high-intensity t-CEA expression showing significantly higher rates of recurrence regardless of low preoperative s-CEA level[10]. When divided into four subgroups based on both preoperative s-CEA level and t-CEA expression intensity, DFS was worse in groups with high-intensity t-CEA expression regardless of preoperative s-CEA levels. Taken together, these findings suggest that t-CEA expression intensity plays a complementary role as an adjunctive measurement of preoperative s-CEA level[10]. In this paper ,tCEA normal &CEA+ has a better 5 year OS and ,tCEA high &CEA+++ has a worse 5 year OS in Ⅲ stage and Ⅳ stage compared with other groups in combined CEA.(Figure 5, Figure 6)
Our previous study showed sCEA is not independent factor while tCEA is for CRC ofⅠ~Ⅲ stage by multivariate analysis [8].Because the role of only preoperative serum for CRC has controversial issues, combined preoperative CEA and other tumor biomarkers are suggested[17, 19, 34-40]. In this study of more recruited patients in 0&Ⅰ~Ⅳ, sCEA and tCEA are prognostic factors but not independent factors in CRC of Ⅲ~Ⅳ stages while combined CEA is an independent factor in advanced CRC by univariate and multivariate analysis.
While our paper has some limitations such as no genetic analysis, data is old, the kits testing preoperative sCEA (ref. 0~10ng/ml) and tCEA were not the newest. And determination of t-CEA expression patterns is subjective, as these evaluations are related to the depth of CEA distribution. So now parts of pathologists in our hospital only describe whether tCEA is expressed in the process of tCEA immunohistochemistry.
5. Conclusion
SCEA, tCEA and combined CEA have prognostic role in Ⅲ~Ⅳ stages of CRC, but only combined CEA is an independent factor in Ⅲ~Ⅳ stages of CRC while they have no prognostic role in 0&Ⅰ~Ⅱstages .Combined CEA can be considered as one new factor to assess the prognosis for CRC. In future we can combined postoperative sCEA ,recurrence CEA (rCEA),facal CEA , Carbohydrate antigen199(CA199), Carbohydrate antigen724 (CA724) and other tumor biomarkers with tCEA or preoperative sCEA to explore the prognostic role of CRC to avoid the defects of single testing above biomarkers.
Funding
This study was supported by Project 2018C37090 awarded to Guojun Tong for data collection, follow-up, statistical analysis, expert communications, and native English editing.
Acknowledgments
The authors thank Professor Zhaozheng Zheng and Yan Chen (Colorectal department of Huzhou Central Hospital, China) for providing valuable clinic data on our manuscript. We thank the MedSci institution (Shanghai) for editing and improving our paper.
Authors’ contributions
G.T. and H.L. participated in conceptualization, formal analysis, investigation, methodology, supervision, writing of the original draft, and writing-review and editing. Y.S Z,Tand H.Q collaborated in conceptualization, methodology, and supervision. G.T. and H.Lperformed data curation and validation. All authors reviewed the manuscript.
Ethics statement
The current study was carried out according to the ethical guidelines of the 2013 Declaration of Helsinki and was approved by the ethics committee of Huzhou Central Hospital (No.*********). Written informed consent was obtained from every patient to use their tissue samples and medical records for research purposes.
Availability of data and materials
All data can be obtained from the first and corresponding authors upon reasonable request.
Consent for publiciation
Not applicable.
Conflicts of Interests
All authors declare no conflicts of interest.
References
- Wang L, Lin S, Yang C, Cai S, Li W: Effect of KRAS mutations and p53 expression on the postoperative prognosis of patients with colorectal cancer. Molecular genetics & genomic medicine 2022, 10(7):e1905.
- Bennedsen ALB, Furbo S, Bjarnsholt T, Raskov H, Gögenur I, Kvich L: The gut microbiota can orchestrate the signaling pathways in colorectal cancer. APMIS : acta pathologica, microbiologica, et immunologica Scandinavica 2022, 130(3):121-139.
- Ren G, Li R, Zheng G, Du K, Dan H, Wu H, Dou X, Duan L, Xie Z, Niu L et al: Prognostic value of normal levels of preoperative tumor markers in colorectal cancer. Scientific reports 2023, 13(1):22830.
- Goldstein MJ, Mitchell EP: Carcinoembryonic antigen in the staging and follow-up of patients with colorectal cancer. Cancer investigation 2005, 23(4):338-351.
- Li C, Zhang D, Pang X, Pu H, Lei M, Fan B, Lv J, You D, Li Z, Zhang T: Trajectories of Perioperative Serum Tumor Markers and Colorectal Cancer Outcomes: A Retrospective, Multicenter Longitudinal Cohort Study. EBioMedicine 2021, 74:103706.
- Li X, Stassen L, Schrotz-King P, Zhao Z, Cardoso R, Raut JR, Bhardwaj M, Brenner H: Potential of Fecal Carcinoembryonic Antigen for Noninvasive Detection of Colorectal Cancer: A Systematic Review. Cancers (Basel) 2023, 15(23).
- Cao H, Zhu L, Li L, Wang W, Niu X: Serum CA724 has no diagnostic value for gastrointestinal tumors. Clinical and experimental medicine 2023, 23(6):2433-2442.
- Tong G, Xu W, Zhang G, Liu J, Zheng Z, Chen Y, Niu P, Xu X: The role of tissue and serum carcinoembryonic antigen in stages I to III of colorectal cancer-A retrospective cohort study. Cancer medicine 2018, 7(11):5327-5338.
- Ma R, Gong M, Sun T, Su L, Li K: The prognostic role of γδ T cells in colorectal cancer based on nomogram. European journal of medical research 2023, 28(1):467.
- Aldilaijan AF, Kim YI, Kim CW, Yoon YS, Park IJ, Lim SB, Kim J, Ro JS, Kim JC: Clinical implication of tissue carcinoembryonic antigen expression in association with serum carcinoembryonic antigen in colorectal cancer. Scientific reports 2023, 13(1):7616.
- Zhang Z, Liu X, Yang X, Jiang Y, Li A, Cong J, Li Y, Xie Q, Xu C, Liu D: Identification of faecal extracellular vesicles as novel biomarkers for the non-invasive diagnosis and prognosis of colorectal cancer. Journal of extracellular vesicles 2023, 12(1):e12300.
- Ma L, Li W, Liu N, Ding Z, Cai J, Zhang Y: Prothrombin time (PT) and CEA as prognostic predictive biomarkers for postoperative recurrence after curative resection in patients with stage I-III colorectal cancer: a retrospective cohort study. Updates in surgery 2022, 74(3):999-1009.
- Tiernan JP, Perry SL, Verghese ET, West NP, Yeluri S, Jayne DG, Hughes TA: Carcinoembryonic antigen is the preferred biomarker for in vivo colorectal cancer targeting. Br J Cancer 2013, 108(3):662-667.
- Tormo BR, Gavilondo JV, Dominguez C, Freyre M, Rodriguez T, Biberfeld P: CEA in colonic adenocarcinomas and precancerous lesions. An immunohistochemical study with a novel monoclonal antibody. APMIS : acta pathologica, microbiologica, et immunologica Scandinavica 1989, 97(12):1073-1080.
- Polivka J, Windrichova J, Pesta M, Houfkova K, Rezackova H, Macanova T, Vycital O, Kucera R, Slouka D, Topolcan O: The Level of Preoperative Plasma KRAS Mutations and CEA Predict Survival of Patients Undergoing Surgery for Colorectal Cancer Liver Metastases. Cancers (Basel) 2020, 12(9).
- Rao H, Wu H, Huang Q, Yu Z, Zhong Z: Clinical Value of Serum CEA, CA24-2 and CA19-9 in Patients with Colorectal Cancer. Clinical laboratory 2021, 67(4).
- Kuang J, Gong Y, Xie H, Yan L, Huang S, Gao F, Tang S, Gan J: The prognostic value of preoperative serum CA724 for CEA-normal colorectal cancer patients. PeerJ 2020, 8:e8936.
- Kemper M, Hentschel W, Graß JK, Stüben BO, Konczalla L, Rawnaq T, Ghadban T, Izbicki JR, Reeh M: Serum Midkine is a clinical significant biomarker for colorectal cancer and associated with poor survival. Cancer Med 2020, 9(6):2010-2018.
- Li Z, Zhu H, Pang X, Mao Y, Yi X, Li C, Lei M, Cheng X, Liang L, Wu J et al: Preoperative serum CA19-9 should be routinely measured in the colorectal patients with preoperative normal serum CEA: a multicenter retrospective cohort study. BMC Cancer 2022, 22(1):962.
- Tong G, Zhang G, Hu Y, Xu X, Wang Y: Correlation between mismatch repair statuses and the prognosis of stage I–IV colorectal cancer. Frontiers in oncology 2024, 13.
- Zhang G, He F, Zhao G, Huang Z, Li X, Xia X, Guo Y, Xu W, Xiong S, Ma Y et al: Combining Serum DNA Methylation Biomarkers and Protein Tumor Markers Improved Clinical Sensitivity for Early Detection of Colorectal Cancer. International journal of genomics 2021, 2021:6613987.
- Huang SC, Chang SC, Liao TT, Yang MH: Detection and clinical significance of CEACAM5 methylation in colorectal cancer patients. Cancer Sci 2024, 115(1):270-282.
- Gold P, Freedman SO: DEMONSTRATION OF TUMOR-SPECIFIC ANTIGENS IN HUMAN COLONIC CARCINOMATA BY IMMUNOLOGICAL TOLERANCE AND ABSORPTION TECHNIQUES. The Journal of experimental medicine 1965, 121(3):439-462.
- Duffy MJ: Carcinoembryonic antigen as a marker for colorectal cancer: is it clinically useful? Clinical chemistry 2001, 47(4):624-630.
- Hammarström S: The carcinoembryonic antigen (CEA) family: structures, suggested functions and expression in normal and malignant tissues. Seminars in cancer biology 1999, 9(2):67-81.
- Kim JC, Roh SA, Lee KH, Namgung H, Kim JR, Kim JS: Genetic and pathologic changes associated with lymphovascular invasion of colorectal adenocarcinoma. Clinical & experimental metastasis 2005, 22(5):421-428.
- Hardiman KM, Felder SI, Friedman G, Migaly J, Paquette IM, Feingold DL: The American Society of Colon and Rectal Surgeons Clinical Practice Guidelines for the Surveillance and Survivorship Care of Patients After Curative Treatment of Colon and Rectal Cancer. Diseases of the colon and rectum 2021, 64(5):517-533.
- Nazato DM, Matos LL, Waisberg DR, Souza JR, Martins LC, Waisberg J: Prognostic value of carcinoembryonic antigen distribution in tumor tissue of colorectal carcinoma. Arquivos de gastroenterologia 2009, 46(1):26-31.
- Saito G, Sadahiro S, Okada K, Tanaka A, Suzuki T, Kamijo A: Relation between Carcinoembryonic Antigen Levels in Colon Cancer Tissue and Serum Carcinoembryonic Antigen Levels at Initial Surgery and Recurrence. Oncology 2016, 91(2):85-89.
- Park JW, Chang HJ, Kim BC, Yeo HY, Kim DY: Clinical validity of tissue carcinoembryonic antigen expression as ancillary to serum carcinoembryonic antigen concentration in patients curatively resected for colorectal cancer. Colorectal disease : the official journal of the Association of Coloproctology of Great Britain and Ireland 2013, 15(9):e503-511.
- Becerra AZ, Probst CP, Tejani MA, Aquina CT, González MG, Hensley BJ, Noyes K, Monson JR, Fleming FJ: Evaluating the Prognostic Role of Elevated Preoperative Carcinoembryonic Antigen Levels in Colon Cancer Patients: Results from the National Cancer Database. Ann Surg Oncol 2016, 23(5):1554-1561.
- Kim CW, Yoon YS, Park IJ, Lim SB, Yu CS, Kim JC: Elevation of preoperative s-CEA concentration in stage IIA colorectal cancer can also be a high risk factor for stage II patients. Ann Surg Oncol 2013, 20(9):2914-2920.
- Kankanala VL, Mukkamalla SKR: Carcinoembryonic Antigen. In: StatPearls. edn. Treasure Island (FL) ineligible companies. Disclosure: Shiva Kumar Mukkamalla declares no relevant financial relationships with ineligible companies.: StatPearls Publishing Copyright © 2024, StatPearls Publishing LLC.; 2024.
- Hou S, Jing J, Wang Y, Du L, Tian B, Xu X, Sun T, Shi Y: Evaluation of Clinical Diagnostic and Prognostic Value of Preoperative Serum Carcinoembryonic Antigen, CA19-9, and CA24-2 for Colorectal Cancer. Alternative therapies in health and medicine 2023, 29(6):192-197.
- Björkman K, Jalkanen S, Salmi M, Mustonen H, Kaprio T, Kekki H, Pettersson K, Böckelman C, Haglund C: A prognostic model for colorectal cancer based on CEA and a 48-multiplex serum biomarker panel. Scientific reports 2021, 11(1):4287.
- Luo H, Shen K, Sun H, Li R, Wang Z, Xie Z: Correlation study between serum neuro-specific enolase and gastric and colorectal cancers. Medicine (Baltimore) 2020, 99(16):e19796.
- You W, Sheng N, Yan L, Chen H, Gong J, He Z, Zheng K, Chen Z, Wang Y, Tan G et al: The difference in prognosis of stage II and III colorectal cancer based on preoperative serum tumor markers. J Cancer 2019, 10(16):3757-3766.
- Peng HX, Yang L, He BS, Pan YQ, Ying HQ, Sun HL, Lin K, Hu XX, Xu T, Wang SK: Combination of preoperative NLR, PLR and CEA could increase the diagnostic efficacy for I-III stage CRC. Journal of clinical laboratory analysis 2017, 31(5).
- Wang J, Wang X, Yu F, Chen J, Zhao S, Zhang D, Yu Y, Liu X, Tang H, Peng Z: Combined detection of preoperative serum CEA, CA19-9 and CA242 improve prognostic prediction of surgically treated colorectal cancer patients. International journal of clinical and experimental pathology 2015, 8(11):14853-14863.
- Chen L, Jiang B, Wang Z, Liu M, Yang H, Xing J, Zhang C, Yao Z, Zhang N, Cui M et al: Combined preoperative CEA and CD44v6 improves prognostic value in patients with stage I and stage II colorectal cancer. Clinical & translational oncology : official publication of the Federation of Spanish Oncology Societies and of the National Cancer Institute of Mexico 2014, 16(3):285-292.
Figure 1.
T-CEA immunohistochemistry. (A) Staining level is +; (B) Staining level is ++;(C) Staining level is +++. Left: ⅹ200 magnification under microscope(original images); Right: ⅹ800 magnification by Photoshop using the especial regions of original images.
Figure 1.
T-CEA immunohistochemistry. (A) Staining level is +; (B) Staining level is ++;(C) Staining level is +++. Left: ⅹ200 magnification under microscope(original images); Right: ⅹ800 magnification by Photoshop using the especial regions of original images.
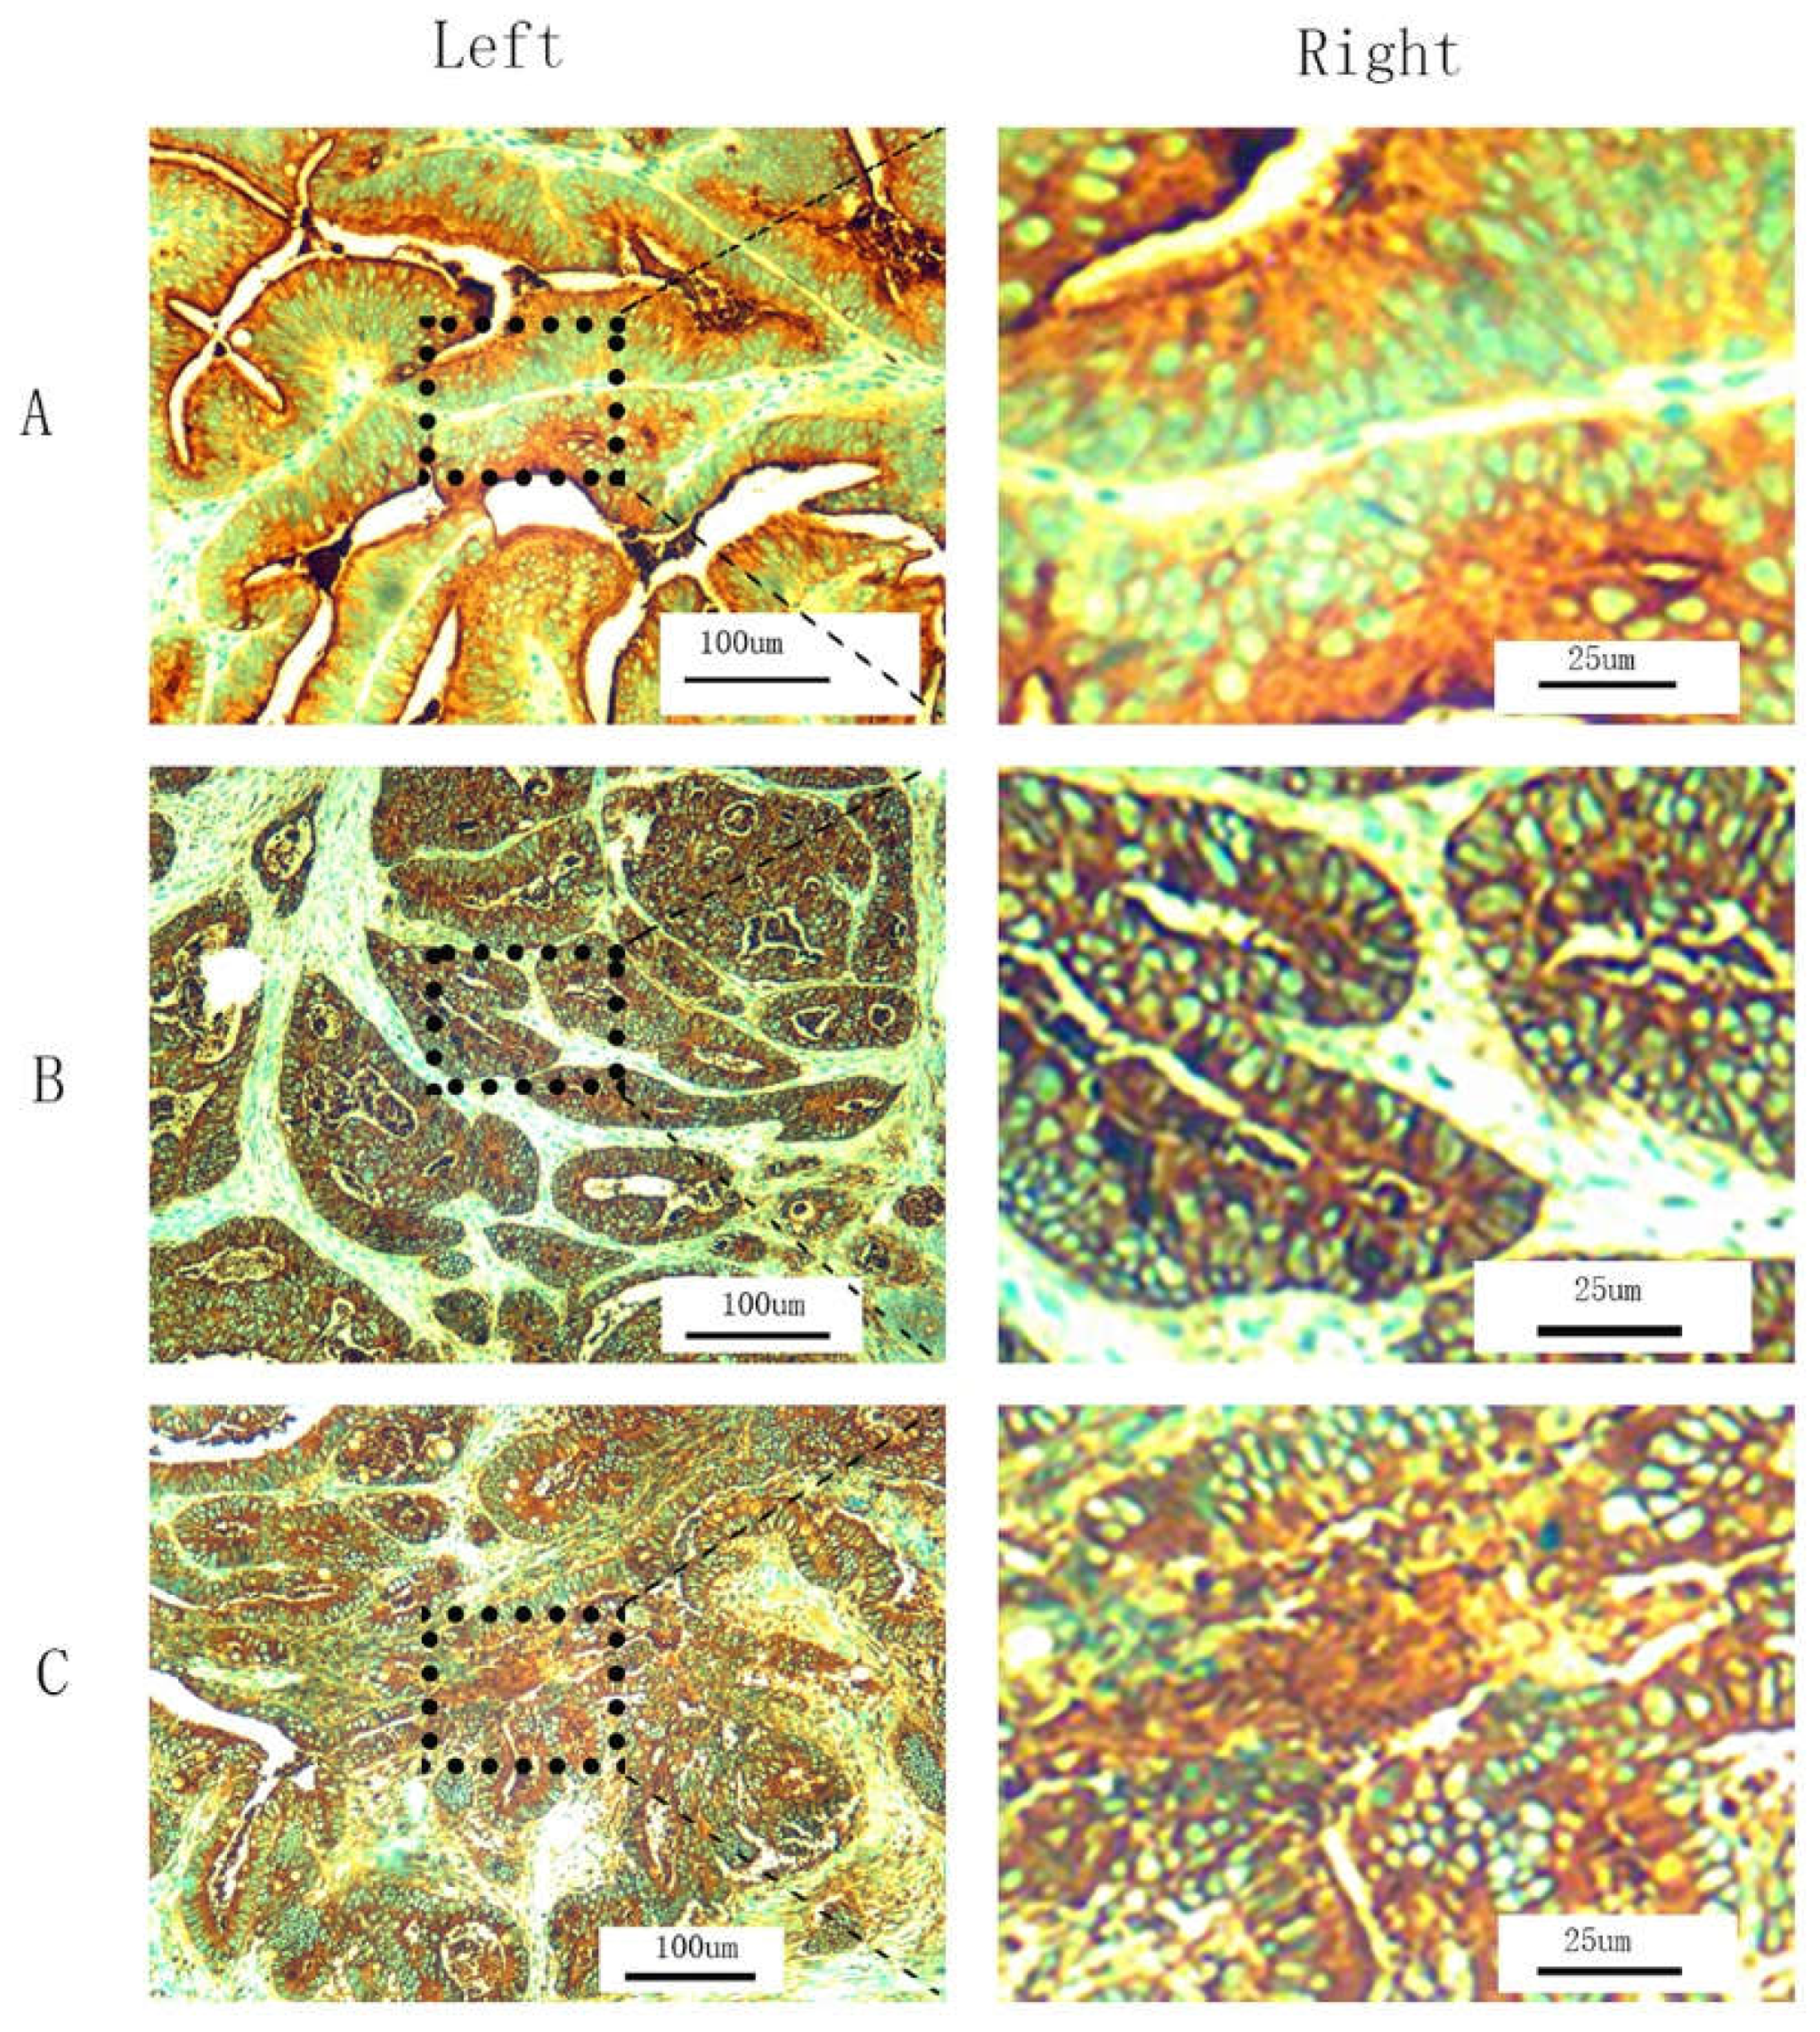
Figure 2.
Receiver Operating Characteristic Curve (ROC) and 5 year overall survival curve(OS). ROC analysis: sCEA and tCEA and combined CEA are as follows: ACU=0.539, CI=0.512~0.566,P=0.004; AUC=0.558,CI=0.531~0.584,P<0.001; AUC=0.566,CI=0.540~0.593,P<0.001. (B) 5 year OS: Mean survival time of 5 year OS in this study is 43.093 (months), SE =0.483 and 95%CI=42.146~44.040.
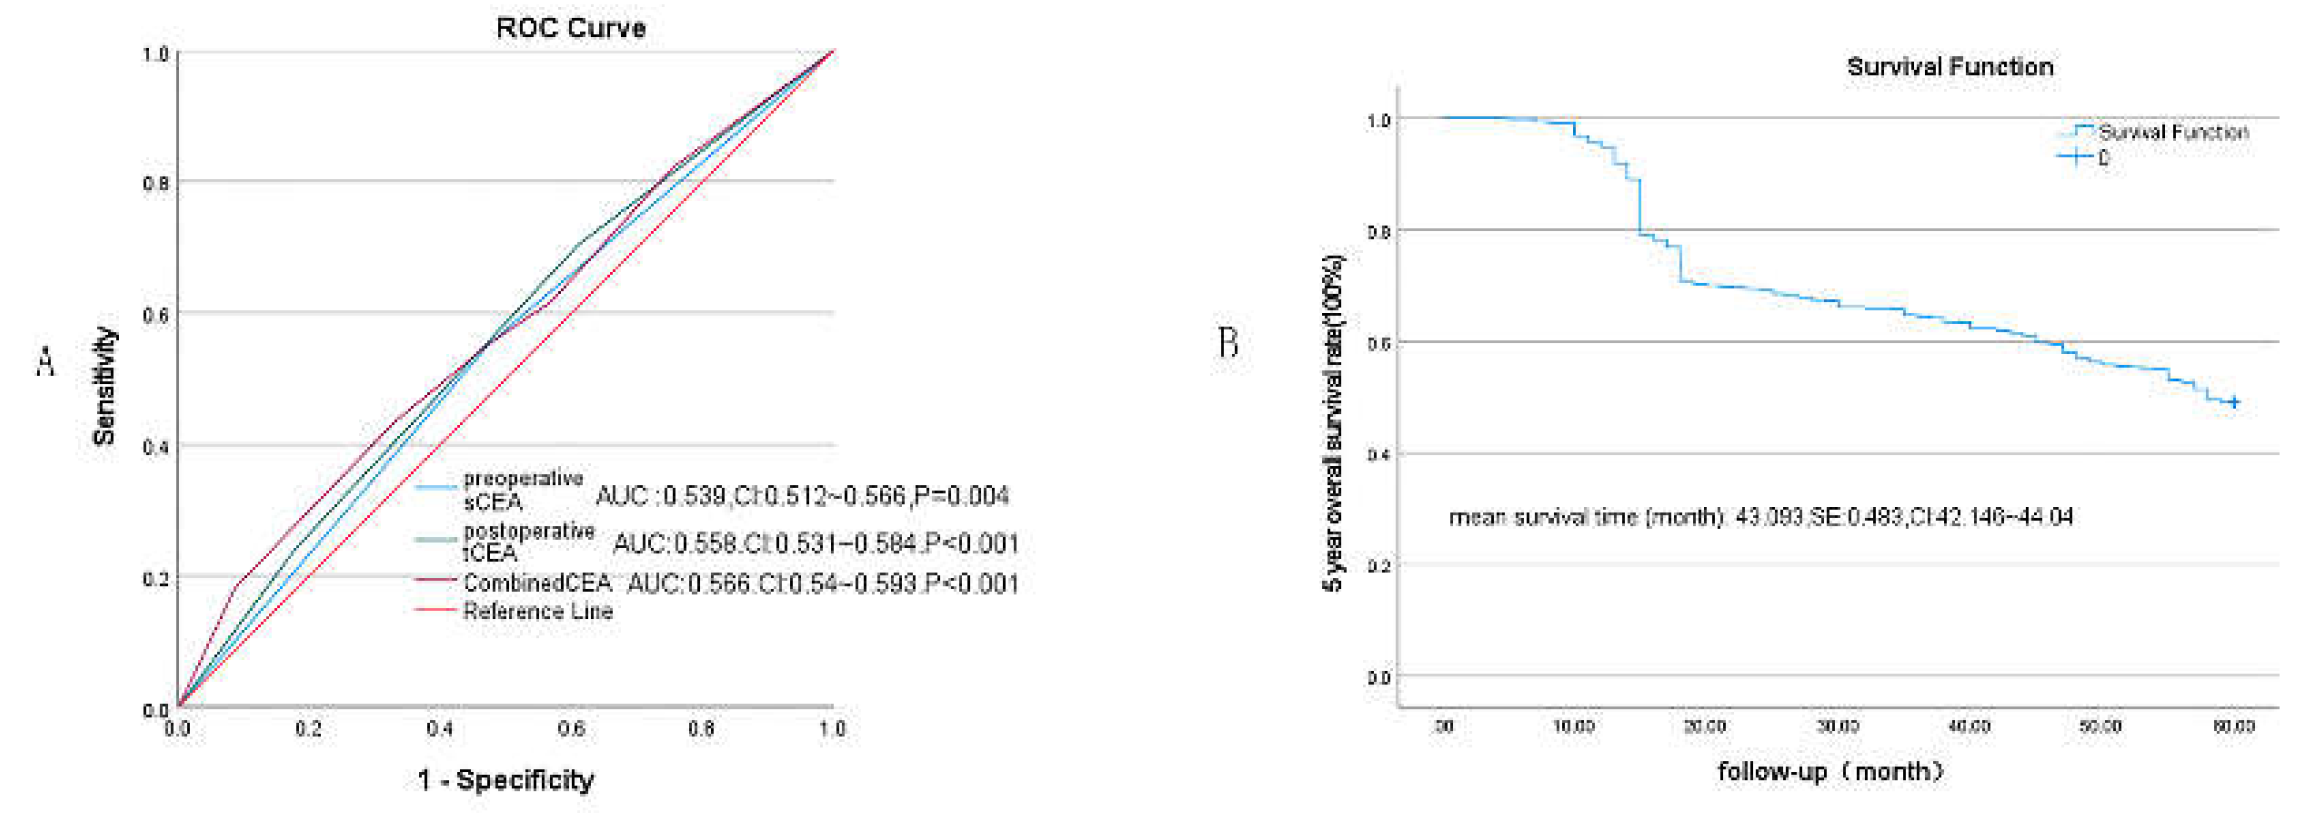
Figure 3.
Comparisons for subgroups of sCEA , tCEA and combined CEA in 0&Ⅰstage.(A) comparison for subgroups of sCEA (P=0.13);(B) comparison for subgroups of tCEA (P=0.5);(C) comparison for subgroups of combined CEA (P=0.54).
Figure 3.
Comparisons for subgroups of sCEA , tCEA and combined CEA in 0&Ⅰstage.(A) comparison for subgroups of sCEA (P=0.13);(B) comparison for subgroups of tCEA (P=0.5);(C) comparison for subgroups of combined CEA (P=0.54).
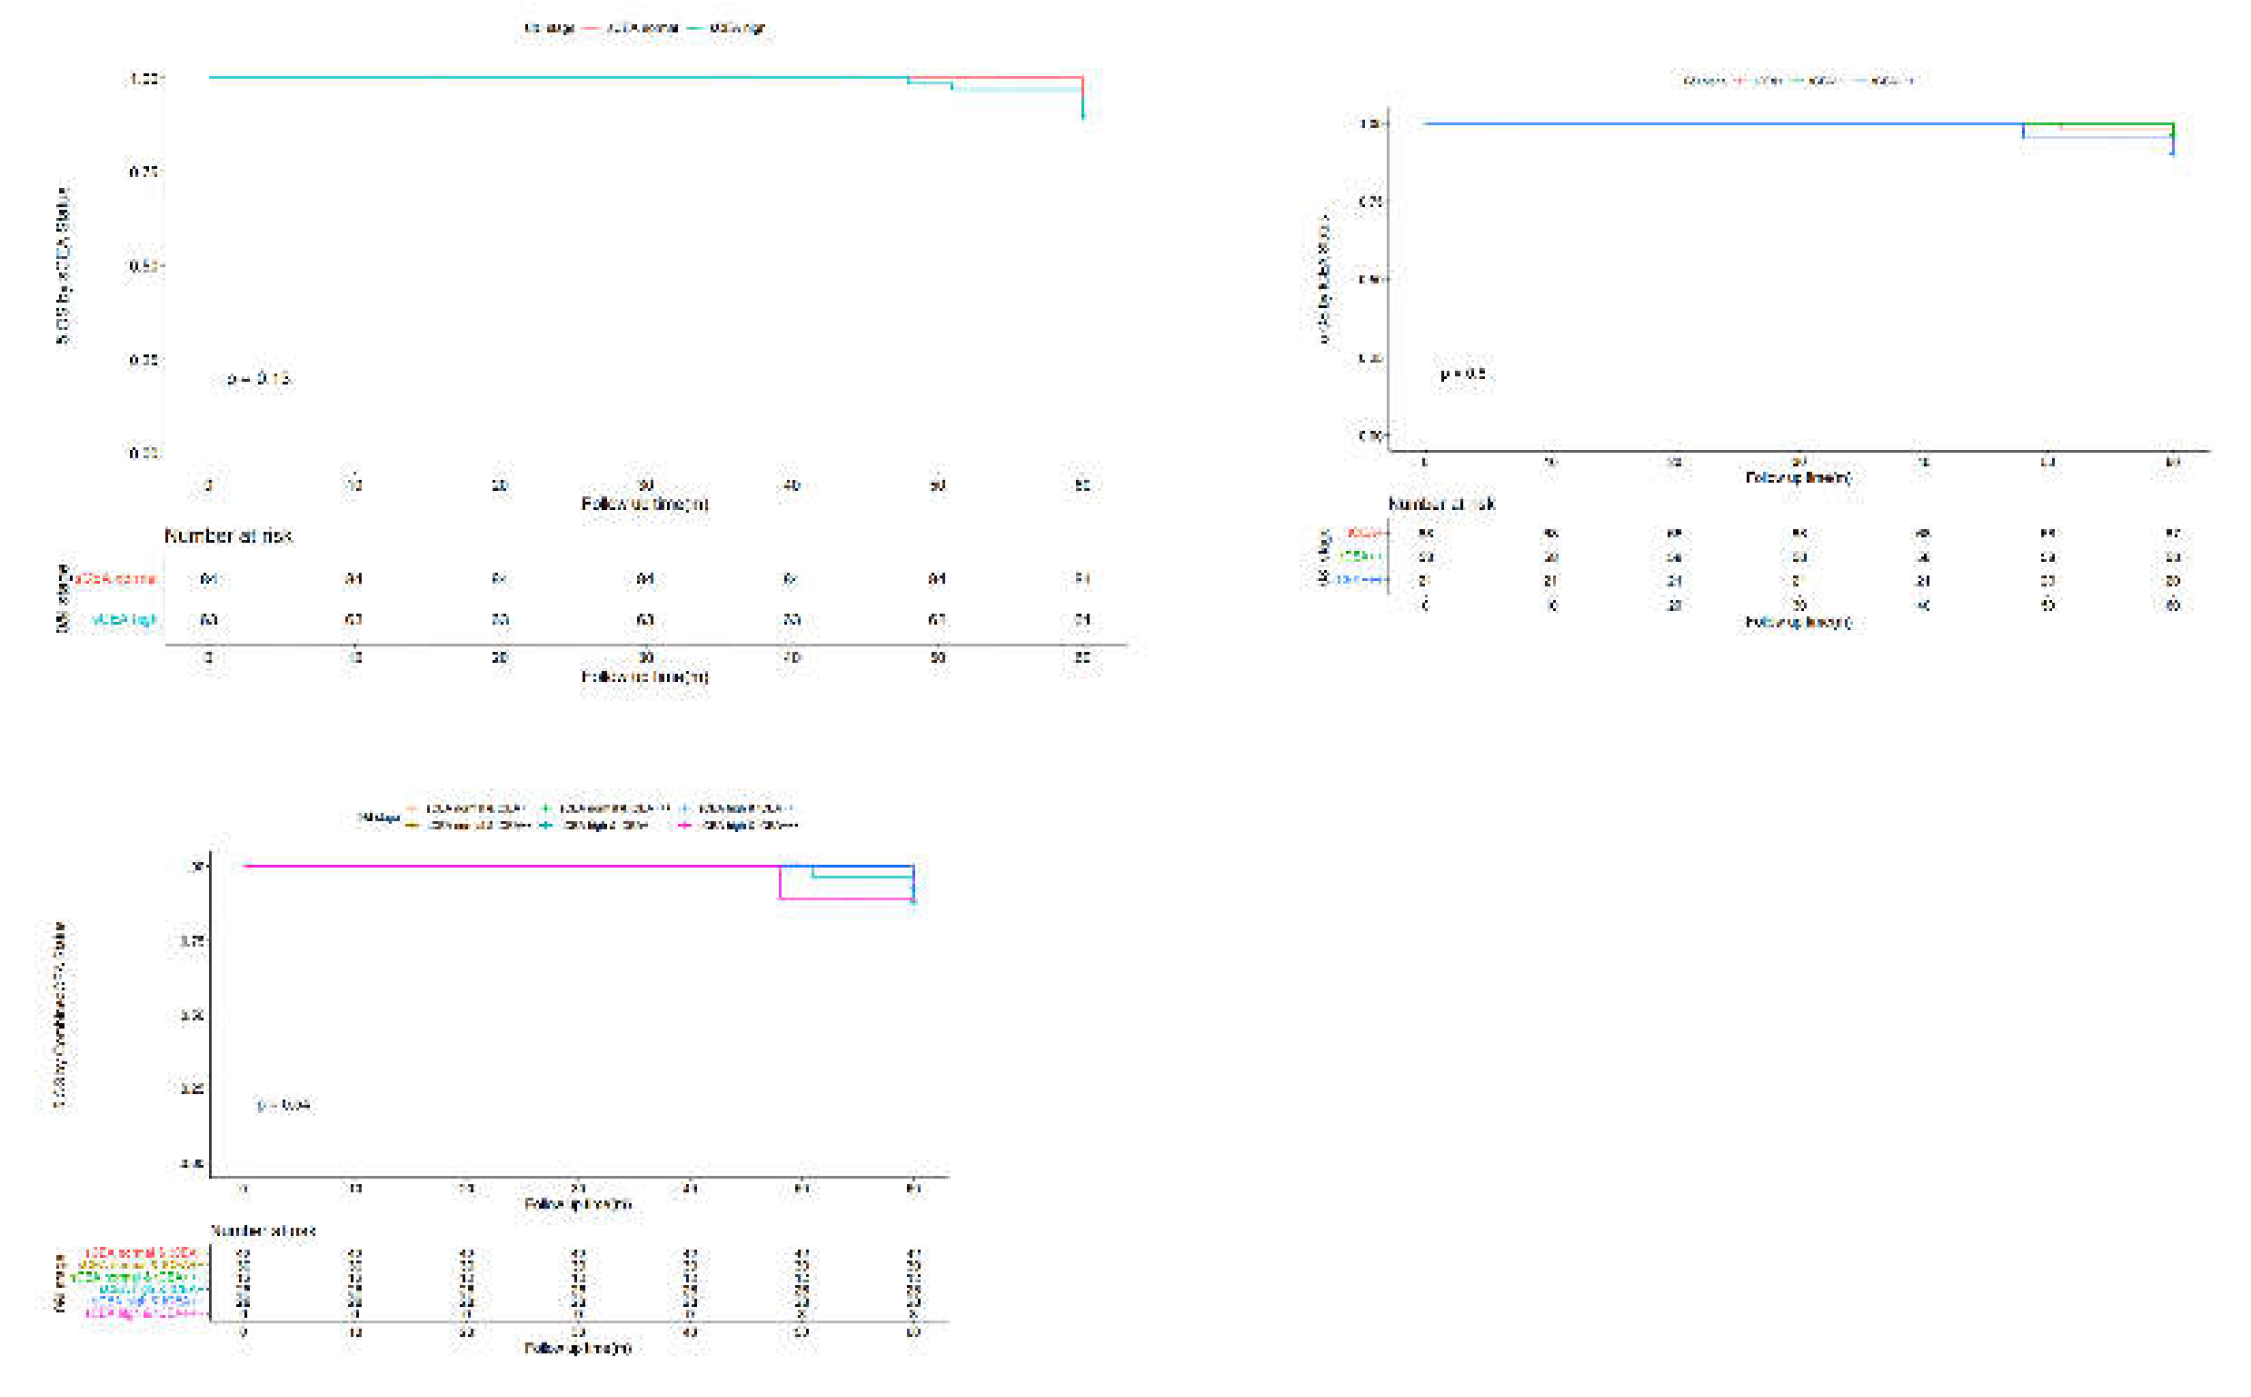
Figure 4.
Comparisons for subgroups of sCEA , tCEA and combined CEA in Ⅱstage.(A) comparison for subgroups of sCEA (P=0.29);(B) comparison for subgroups of tCEA (P=0.36);(C) comparison for subgroups of combined CEA (P=0.15).
Figure 4.
Comparisons for subgroups of sCEA , tCEA and combined CEA in Ⅱstage.(A) comparison for subgroups of sCEA (P=0.29);(B) comparison for subgroups of tCEA (P=0.36);(C) comparison for subgroups of combined CEA (P=0.15).
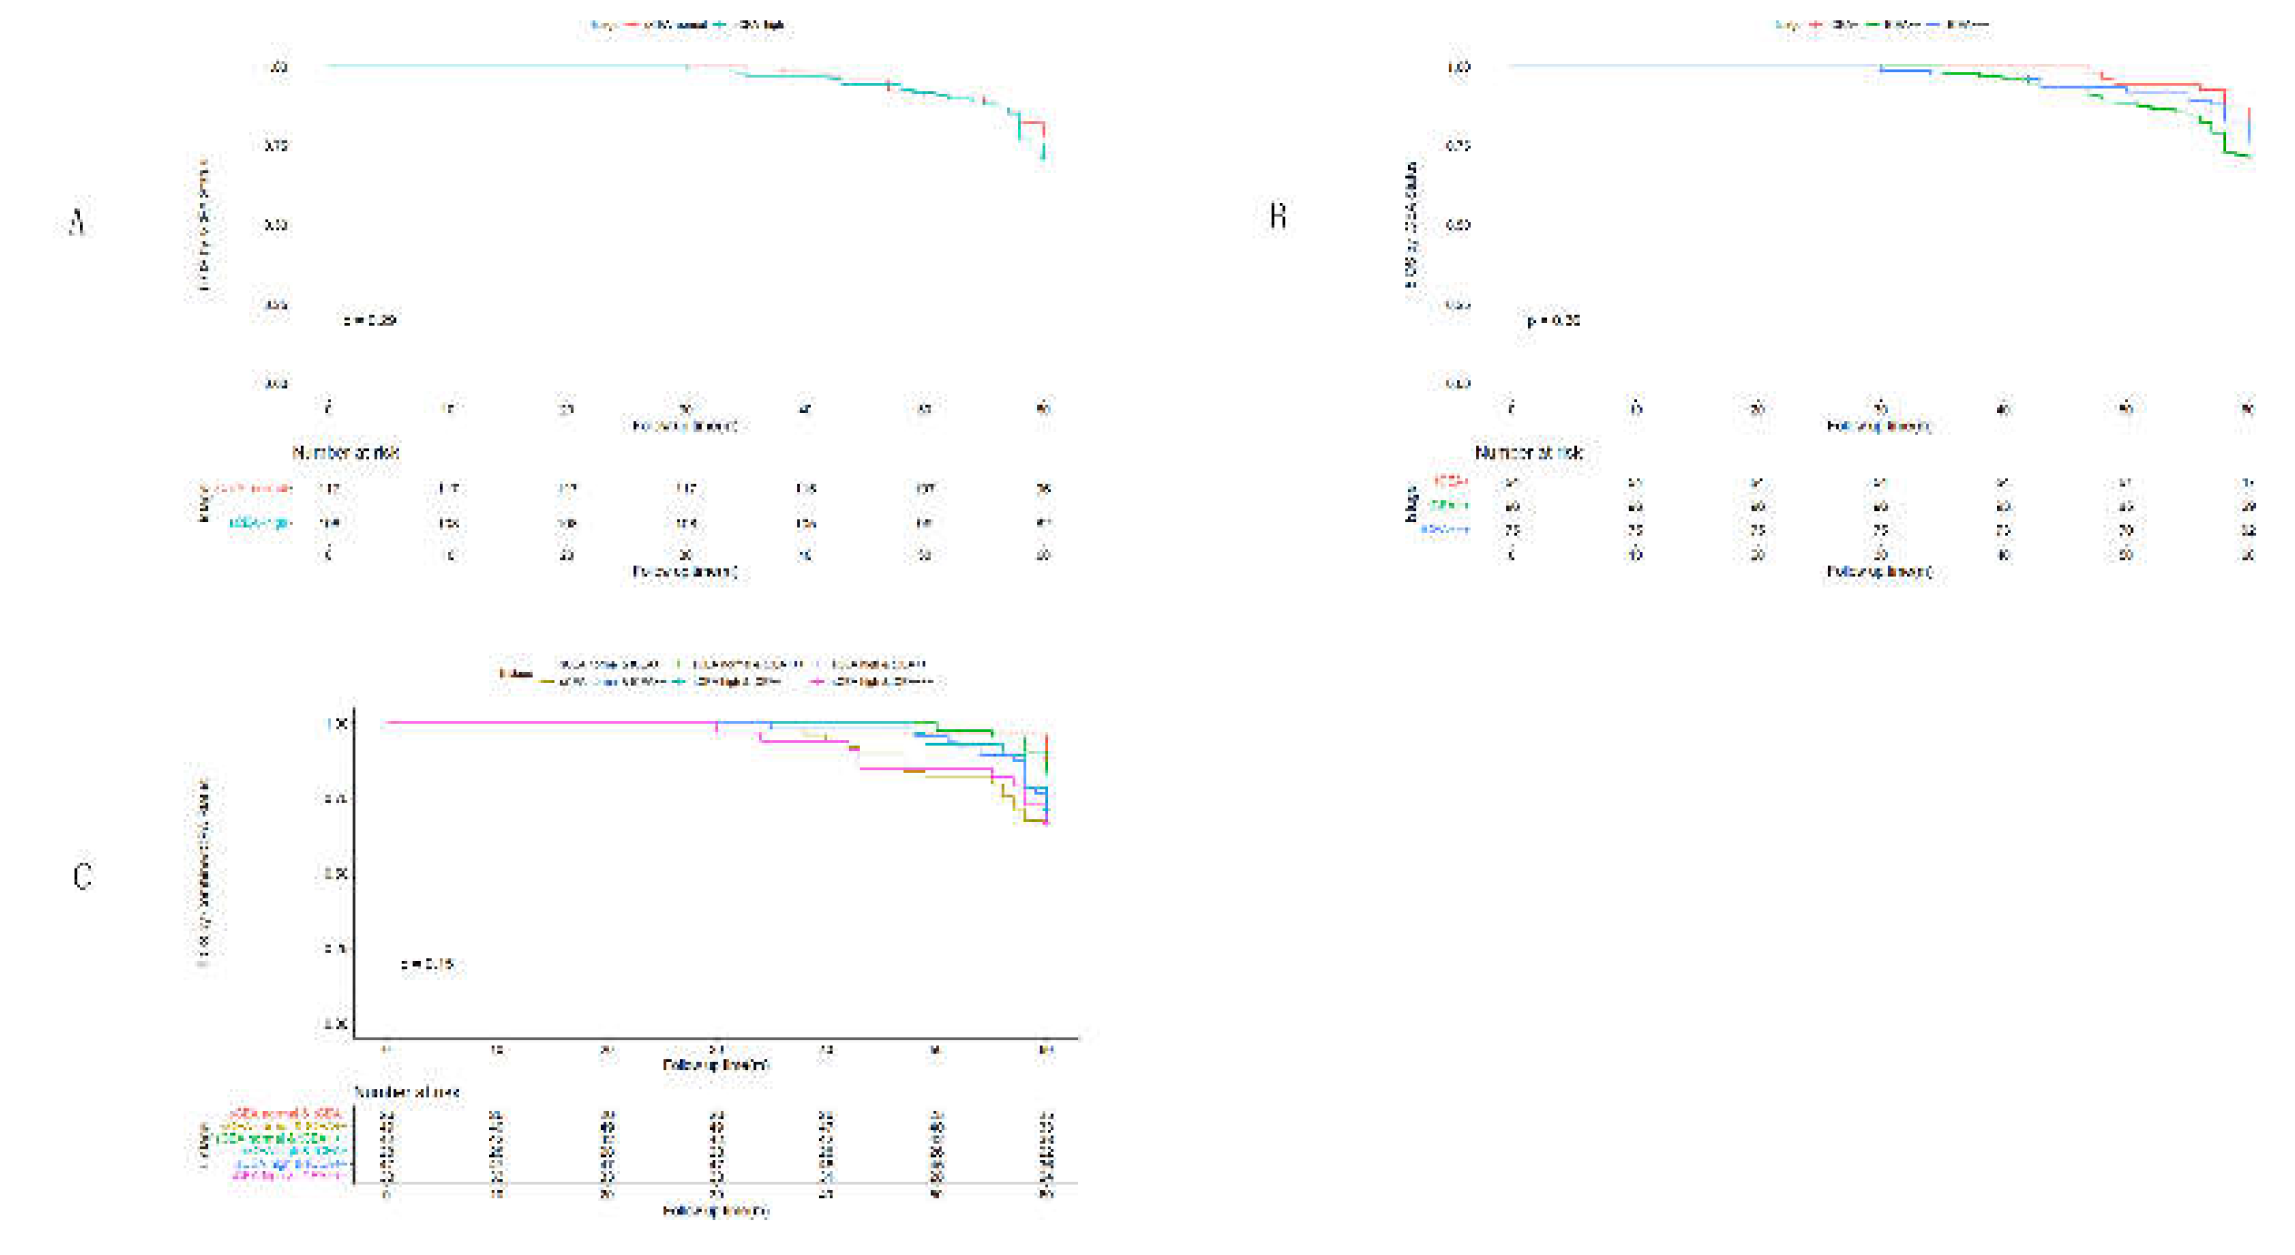
Figure 5.
Comparisons for subgroups of sCEA , tCEA and combined CEA in Ⅲ stage.(A) comparison for subgroups of sCEA (P<0.001);(B) comparison for subgroups of tCEA (P<0.001);(C) comparison for subgroups of combined CEA (P<0.001).
Figure 5.
Comparisons for subgroups of sCEA , tCEA and combined CEA in Ⅲ stage.(A) comparison for subgroups of sCEA (P<0.001);(B) comparison for subgroups of tCEA (P<0.001);(C) comparison for subgroups of combined CEA (P<0.001).
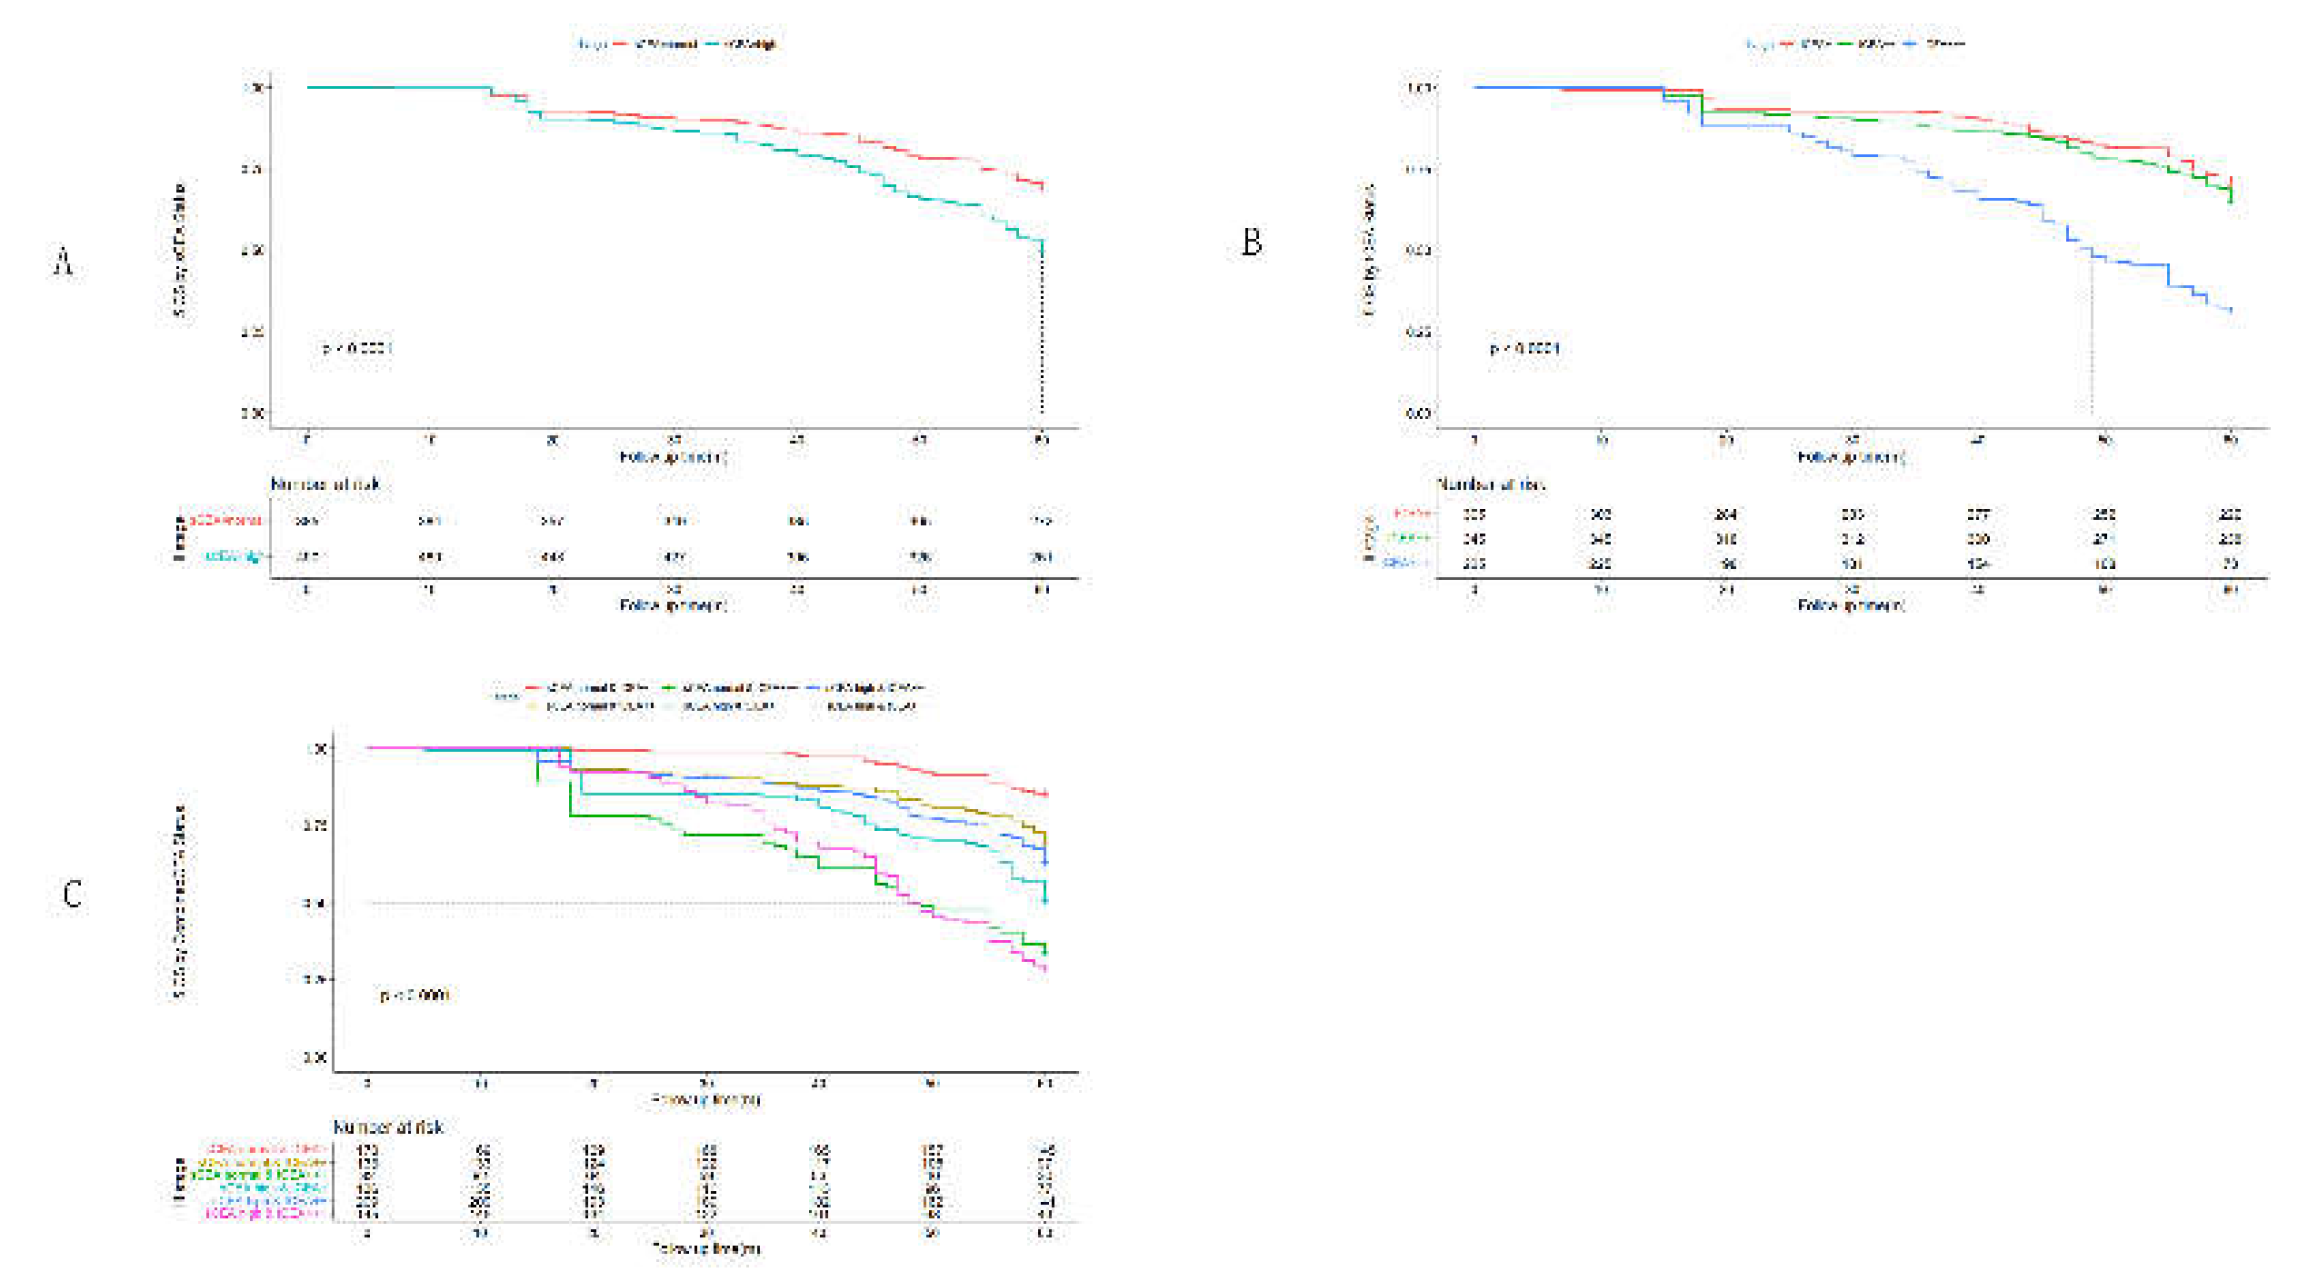
Figure 6.
Comparisons for subgroups of sCEA , tCEA and combined CEA in Ⅳ stage.(A) comparison for subgroups of sCEA (P<0.001);(B) comparison for subgroups of tCEA (P=0.24);(C) comparison for subgroups of combined CEA (P<0.001),in subgroup of sCEA normal& tCEA+++ has no survival data.
Figure 6.
Comparisons for subgroups of sCEA , tCEA and combined CEA in Ⅳ stage.(A) comparison for subgroups of sCEA (P<0.001);(B) comparison for subgroups of tCEA (P=0.24);(C) comparison for subgroups of combined CEA (P<0.001),in subgroup of sCEA normal& tCEA+++ has no survival data.
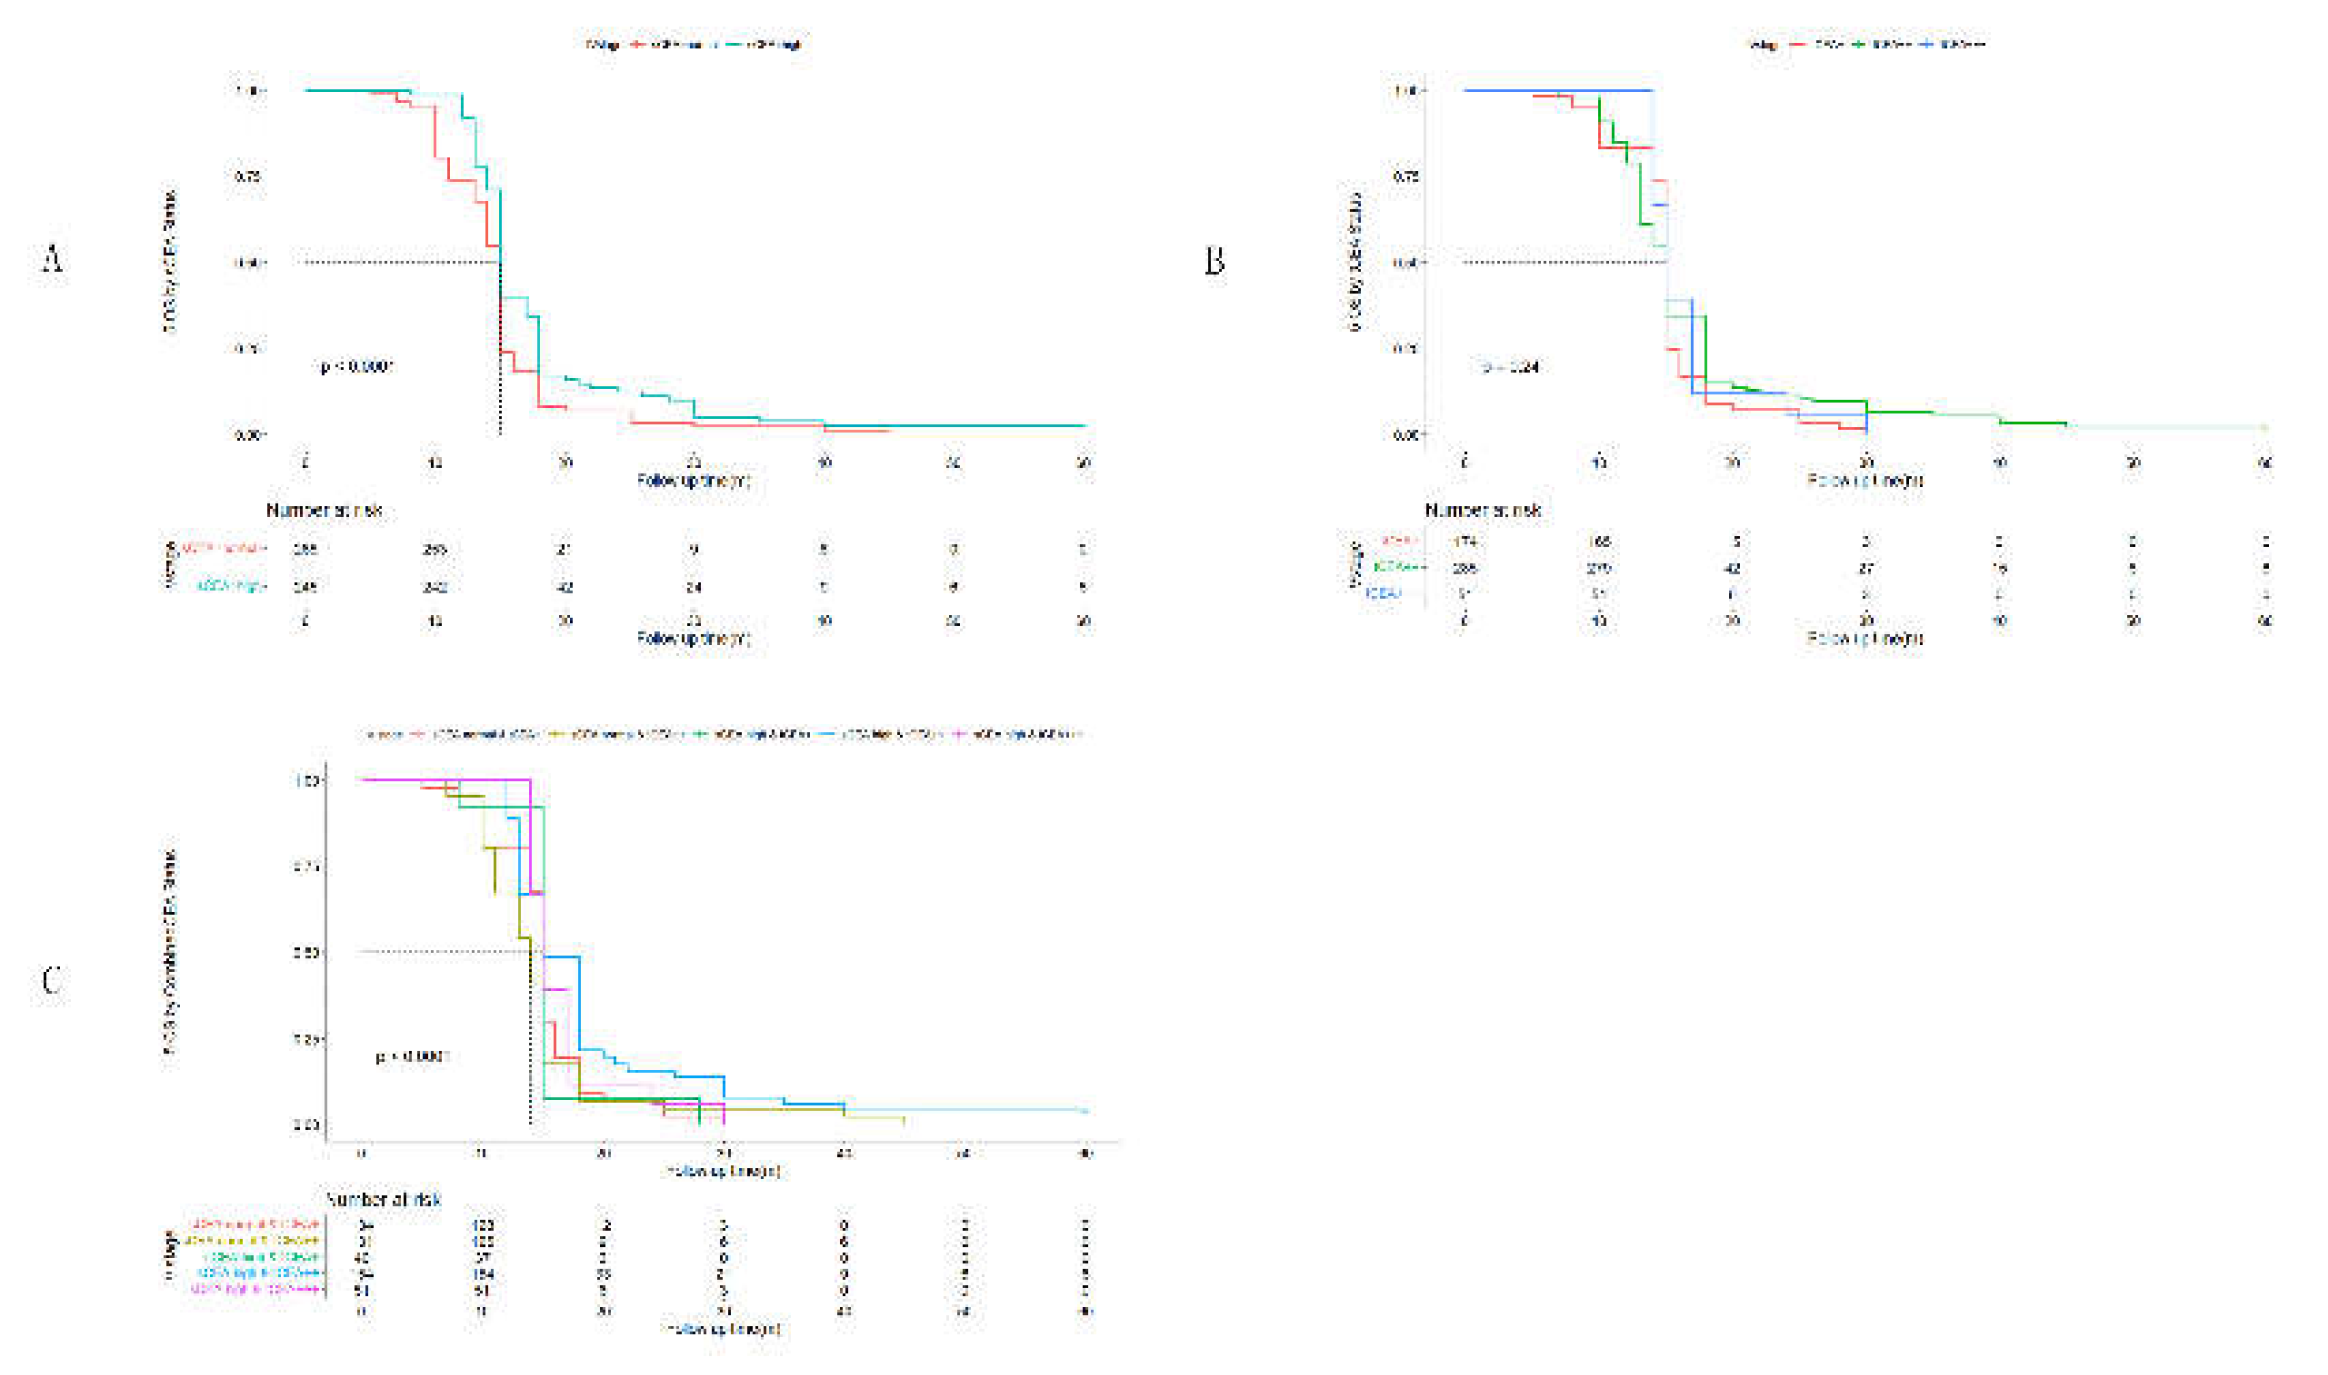

Table 1.
Clinicopathological features by Combined CEA(n, %; median, IQR).
| Variables | sCEA:normal & tCEA+ | sCEA:normal & tCEA++ | sCEA:normal & tCEA+++ | sCEA:high & tCEA+ | sCEA: high & tCEA++ | sCEA:high & tCEA+++ | F or x2 test | P |
| Gender | 12.22 | 0.032* | ||||||
| Male | 186(10.6) | 165(9.4) | 74(4.2) | 111(6.3) | 209(11.9) | 143(8.1) | ||
| Femail | 186(10.6) | 178(10.1) | 62(3.5) | 119(6.8) | 229(13.0) | 95(5.4) | ||
| Age(year) | 67(16) | 65(15) | 67(21.75) | 65(19.5) | 67(21) | 67(15) | 5.37 | <0.001*** |
| Location | 202.11 | <0.001*** | ||||||
| Ileocecum | 41(2.3) | 33(1.9) | 18(1.0) | 11(0.6) | 7(0.4) | 37(2.1) | ||
| Right colon | 30(1.7) | 76(4.3) | 8(0.5) | 12(0.7) | 38(2.2) | 8(0.5) | ||
| Transverse colon | 66(3.8) | 39(2.2) | 21(1.2) | 42(2.4) | 86(4.9) | 23(1.3) | ||
| Left colon | 84(4.8) | 32(1.8) | 36(2.0) | 38(2.2) | 87(5.0) | 47(2.7) | ||
| Sigmoid colon | 35(2.0) | 45(2.6) | 12(0.7) | 31(1.8) | 18(1.0) | 26(1.5) | ||
| Rectum | 116(6.6) | 118(6.7) | 41(2.3) | 96(5.5) | 202(11.5) | 97(5.5) | ||
| Tumor size(cm) | 3.7(1.1) | 4.1(1) | 3.6(1) | 3.5(1.2) | 3.5(0.9) | 4.1(1.33) | 18.60 | <0.001*** |
| Blood loss(ml) | 180(110) | 160(150) | 180(115) | 180(160) | 180(110) | 160(52.5) | 3.51 | 0.004** |
| T stage | 452.82 | <0.001a*** | ||||||
| Tis | 9(0.5) | 3(0.2) | 3(0.2) | 1(0.1) | 0(0) | 0(0) | ||
| T1 | 23(1.3) | 37(2.1) | 5(0.3) | 21(1.2) | 20(1.1) | 7(0.4) | ||
| T2 | 106(6.0) | 26(1.5) | 30(1.7) | 24(1.4) | 91(5.2) | 37(2.1) | ||
| T3 | 53(3.0) | 157(8.9) | 73(4.2) | 117(6.7) | 177(10.1) | 53(3.0) | ||
| T4a | 23(1.3) | 29(1.7) | 24(1.4) | 66(3.8) | 92(5.2) | 45(2.6) | ||
| T4b | 158(9.0) | 91(5.2) | 1(0.1) | 1(0.1) | 58(3.3) | 96(5.5) | ||
| Differentiation | 22.25 | <0.001*** | ||||||
| well | 26(1.5) | 66(3.8) | 19(1.1) | 31(1.8) | 59(3.4) | 24(1.4) | ||
| moderate | 234(13.3) | 251(14.3) | 75(4.3) | 136(7.7) | 350(19.9) | 90(5.1) | ||
| poor or undifferentiation | 112(6.4) | 26(1.5) | 42(2.4) | 63(3.6) | 29(1.7) | 124(7.1) | ||
| Harvested Lymph node(no.) | 14(3) | 13(3) | 14(3) | 14(2) | 14(2) | 14(3) | 6.83 | <0.001*** |
| Positive Lymph node(no.) | 2(2) | 2(6) | 0(2) | 2(6) | 3(5) | 2(5) | 22.17 | <0.001*** |
| Chemotherapy | 22.25 | <0.001*** | ||||||
| Yes | 319(18.2) | 295(16.8) | 117(6.7) | 200(11.4) | 402(22.9) | 227(12.9) | ||
| No | 53(3.0) | 48(2.7) | 19(1.1) | 30(1.7) | 36(2.0) | 11(0.6) | ||
| TNM stage | 160.92 | <0.001a*** | ||||||
| 0&Ⅰ | 42(2.4) | 30(1.7) | 12(0.7) | 26(1.5) | 28(1.6) | 9(0.5) | ||
| Ⅱ | 26(1.5) | 49(2.8) | 42(2.4) | 28(1.6) | 47(2.7) | 33(1.9) | ||
| Ⅲ | 170(9.7) | 133(7.6) | 82(4.7) | 136(7.7) | 209(11.9) | 145(8.3) | ||
| Ⅳ | 134(7.6) | 131(7.5) | 0(0) | 40(2.3) | 154(8.8) | 51(2.9) | ||
| Complication | 58.60 | <0.001*** | ||||||
| No | 357(20.3) | 284(16.2) | 121(6.9) | 214(12.2) | 421(12.2) | 215(12.2) | ||
| Yes | 15(0.9) | 59(3.4) | 15(0.9) | 16(0.9) | 17(1.0) | 23(1.3) |
a means respected values <5 and using exact test; no. means numbers; IQR: interquartile range; * indicates P<0.05;**indicates P<0.01;*** indicates P<0.001.
Table 2.
Univariate analysis of prognosis for colorectal cancer.
| Factor | N | Hazard Ratio(HR) | Mean and 95%CI for survival time(60months) | 5-year OS(%) | P value |
| Gender | 0.296 | ||||
| M | 888 | Ref. | 42.78(41.45~44.09) | 47.5 | |
| F | 869 | 1.072 | 43.42(42.06~44.78) | 50.5 | |
| Location | <0.001*** | ||||
| Ileocecum | 147 | Ref. | 36.93(33.42~40.49) | 38.1 | |
| Right colon | 172 | 1.488 | 35.63(32.42~38.85) | 37.8 | |
| Transverse colon | 277 | 1.521 | 47.40(45.24~49.56) | 57.0 | |
| Left colon | 324 | 0.777 | 43.28(41.13~45.44) | 48.5 | |
| Sigmoid colon | 167 | 1.019 | 45.99(42.95~49.03) | 57.5 | |
| Rectum | 670 | 0.815 | 43.77(42.27~45.27) | 49.1 | |
| T stage | <0.001*** | ||||
| Tis | 16 | Ref. | 60(60~60) | 93.8 | |
| T1 | 113 | 0.064 | 57.97(56.93~59.02) | 81.4 | |
| T2 | 314 | 0.197 | 42.29(40.04~44.53) | 46.8 | |
| T3 | 630 | 0.759 | 40.37(38.75~41.99) | 39.8 | |
| T4a | 279 | 0.911 | 52.96(51.37~54.54) | 69.9 | |
| T4b | 405 | 0.345 | 36.34(34.26~38.42) | 39.8 | |
| Differentiation | <0.001*** | ||||
| well | 225 | Ref. | 52.88(50.77~64.98) | 76.9 | |
| moderate | 1136 | 0.159 | 45.27(44.11~46.43) | 56.2 | |
| poor or undifferentiation | 396 | 0.355 | 31.30(29.53~33.08) | 12.6 | |
| Chemotherapy | <0.001*** | ||||
| Yes | 1560 | Ref. | 41.09(40.07~42.11) | 44.0 | |
| No | 197 | 6.78 | 58.98(58.46~59.50) | 88.3 | |
| TNM stage | <0.001*** | ||||
| 0&Ⅰ | 147 | Ref. | 59.86(59.61~60.00) | ||
| Ⅱ | 225 | 0.003 | 58.08(57.40~58.76) | ||
| Ⅲ | 875 | 0.027 | 51.98(51.08~52.88) | ||
| Ⅳ | 510 | 0.060 | 16.40(15.76~17.04) | ||
| Complication | 0.85 | ||||
| No | 1612 | Ref. | 42.95(41.96~43.94) | 49 | |
| Yes | 145 | 1.023 | 44.70(41.60~47.79) | 49 | |
| sCEA | 0.55 | ||||
| normal | 851 | Ref. | 42.91(41.49~44.33) | 53.0 | |
| high | 906 | 0.879 | 43.27(42.00~44.53) | 45.3 | |
| tCEA | 0.002** | ||||
| + | 601 | Ref. | 44.30(42.65~45.94) | ||
| ++ | 784 | 0.762 | 41.27(39.8~42.75) | ||
| +++ | 372 | 0.985 | 44.99(43.22~46.76) | ||
| CombinedCEA | <0.001*** | ||||
| sCEA:normal & tCEA+ | 372 | Ref. | 42.92(40.73~45.10) | 57.0 | |
| sCEA:normal & tCEA++ | 343 | 0.413 | 40.06(37.74~42.37) | 46.6 | |
| sCEA:normal & tCEA+++ | 136 | 0.833 | 50.07(47.43~52.72) | 58.1 | |
| sCEA:high & tCEA+ | 230 | 0.509 | 46.57(44.14~48.99) | 53.9 | |
| sCEA: high & tCEA++ | 438 | 0.599 | 42.30(40.40~44.21) | 48.2 | |
| sCEA:high & tCEA+++ | 238 | 0.742 | 41.85(39.60~44.11) | 31.5 |
Classified clinicopathological data were analyzed for univariate regression. Using Kaplan-Meier to analyze Number, mean ,95%CI survival time, and Cox regression(input) to analyze Harzard Ratio (HR), P value. *P<0.05,**P<0.01,***P<0.001.
Table 3.
Multivariate analysis of prognosis for colorectal cancer.
| Factor | HR | 95%CI for HR | Ward | P |
| Location | 29.05 | <0.001*** | ||
| Ileocecum | Ref. | |||
| Right colon | 0.850 | 0.623~1.159 | ||
| Transverse colon | 0.577 | 0.427~0.779 | ||
| Left colon | 0.722 | 0.547~0.954 | ||
| Sigmoid colon | 0.480 | 0.341~0.675 | ||
| Rectum | 0.821 | 0.636~1.061 | ||
| T stage | 95.93 | <0.001*** | ||
| Tis | Ref. | |||
| T1 | 0.174 | 0.015~1.986 | ||
| T2 | 0.280 | 0.025~3.118 | ||
| T3 | 0.565 | 0.050~6.399 | ||
| T4a | 0.306 | 0.027~4.472 | ||
| T4b | 0.220 | 0.020~2.470 | ||
| Differentiation | 190.18 | <0.001*** | ||
| well | Ref. | |||
| moderate | 2.142 | 1.572~2.917 | ||
| poor or undifferentiation | 6.794 | 4.806~9.605 | ||
| Chemotherapy | 0.61 | 0.433 | ||
| Yes | Ref. | |||
| No | 0.779 | 0.417~1.454 | ||
| TNM stage | 954.18 | <0.001*** | ||
| 0&Ⅰ | Ref. | |||
| Ⅱ | 4.789 | 1.062~21.604 | ||
| Ⅲ | 9.632 | 2.194~42.292 | ||
| Ⅳ | 267.44 | 60.944~1173.58 | ||
| tCEA | 4.68 | 0.096 | ||
| + | Ref. | |||
| ++ | 4.831 | 0.664~35.174 | ||
| +++ | 1.635 | 0.142~18.789 | ||
| CombinedCEA | 32.67 | <0.001*** | ||
| sCEA:normal & tCEA+ | Ref. | |||
| sCEA:normal & tCEA++ | 0.475 | 0.065~3.488 | ||
| sCEA:normal & tCEA+++ | 1.176 | 0.100~13.824 | ||
| sCEA:high & tCEA+ | 1.242 | 0.921~1.674 | ||
| sCEA: high & tCEA++ | 0.266 | 0.036~1.958 | ||
| sCEA:high & tCEA+++ | 1.275 | 0.111~14.606 |
Factors which have significance in univariate analysis were analyzed by multivariate regression analysis. Cox regression was used for multivariate analysis. *P<0.05,**P<0.01,***P<0.001.
Disclaimer/Publisher’s Note: The statements, opinions and data contained in all publications are solely those of the individual author(s) and contributor(s) and not of MDPI and/or the editor(s). MDPI and/or the editor(s) disclaim responsibility for any injury to people or property resulting from any ideas, methods, instructions or products referred to in the content. |
© 2024 by the authors. Licensee MDPI, Basel, Switzerland. This article is an open access article distributed under the terms and conditions of the Creative Commons Attribution (CC BY) license (http://creativecommons.org/licenses/by/4.0/).
Copyright: This open access article is published under a Creative Commons CC BY 4.0 license, which permit the free download, distribution, and reuse, provided that the author and preprint are cited in any reuse.


