
Submitted:
02 June 2024
Posted:
04 June 2024
You are already at the latest version
Abstract
The relationship between metabolic changes occurring in the developing internodes of sugarcane and the final yield and sugar characteristics is poorly understood. This is due to the lack of integration between phenotypic and metabolic data. To address this issue, a study was conducted where sugarcane metabolism was modelled based on the measurement of cellular components in the top internodes at two stages of crop development. The study also looked at the effects of Trinexapac-ethyl (Moddus®) on growth inhibition. The metabolome was measured using GC-analysis while LC-MS/MS was used to measure proteome changes in the developing internodes. The data was then integrated with the metabolic rates. The study revealed that the duration of internode growth is independent of the growth rate and is probably controlled by the accumulation of heat units (degree days). In contrast, sucrose and lignin accumulation is sensitive to the growth rate. Sucrose accumulation only occurs once the cell wall synthesis slow down. The data suggest that sucrose accumulation is controlled a reduction in sucrose breakdown for metabolic activity and a reduction in demand for carbon for cell wall polysaccharide synthesis. This study also found that nucleotide sugar metabolism appears to be a key regulator in regulating carbon flow during internode development.
Keywords:
Metabolic flux
; sucrose
; proteins
; lignocellulose
; metabolic control
1. Introduction
There is a growing interest in using C4 crops like Miscanthus, switchgrass, sorghum, and sugarcane as feedstock for biofuel production. These crops are grown to yield two primary products - soluble sugars and cell wall fractions. These fractions can be used as a source of feed or fuel [1].
There is a strong correlation between culm length, internode length, and above-ground biomass in all C4 grasses [1,2,3,4]. Therefore to maximize yields, it is crucial to cultivate crops with larger culm volumes that contain high sugar content and easily hydrolysable cell wall polymers.
In a grass like sugarcane culm is made up of multiple phytomeric units that consist of a node and an internode. The culm develops and elongates in an upward direction, while individual internodes develop and elongate in a downward direction with a sigmoidal elongation pattern [5]. The expansion zone includes cells actively expanding under turgor while synthesizing primary cell walls and membranes. As the cells mature, secondary cell wall deposition stops cell expansion, and the cells achieve their ability to import and store sugar.
Understanding the factors that regulate the development of stem sink tissues, including their cell wall composition and soluble sugar content, is critical for enhancing the quality and yields of forage and bioenergy crops [1]. However, there is still limiting information available on this topic. Setaria viridis has become a popular model species to further understanding of the control of sink growth and development [1,5], but validation across other grasses is still lacking.
There are three important aspects of biomass accumulation, or sink strength during growth. First, osmolytes in the vacuole must be accumulated to facilitate water uptake. Second, the synthesis of extra cell walls, cell membranes, and proteins to maintain cell functions. Third, there is the energy (respiratory) cost of the first two elements [6]. Gene expression changes associated with carbon partitioning was described in terms of three major carbon sinks namely sucrose storage, cell wall synthesis and respiratory metabolism [1].
UDP-Glucose is a central metabolite in the synthesis of both sucrose and most of the cell wall polysaccharides (including cellulose, hemicellulose and pectic polymers) [1,7,8]. Significant changes in the expression of UDP-glucose-associated proteins occur during internode development. Carbon partitioning in sugarcane is closely related to the transcription of genes associated with the UDP-glucose (UDP-glc) metabolism [1,7,8,9], sugar transporters [9,10,11,12] and various cellulose synthases.
Internode growth in sugarcane is characterised by an increase in cell size, but not in number. There is limited genetic variability for this trait, and internode elongation stops after 150°Cd (base temperature 18°C). Dry matter accumulation continues for up to 800°Cd, and after elongation stops, internodes continue to expand radially. Sucrose and total sugar levels start to increase before internode elongation stops, and water content decreases inversely to sucrose content. Internodes without leaves remain active sinks, and sucrose imports in mature internodes at least balance maintenance respiration and remobilisation to the rest of the plant.
Despite the progress the link between metabolic changes in the developing internodes in sugarcane and final yield and sugar characteristics is not well understood. This is primarily due to two factors. Firstly, studying mRNA levels only provides a partial picture of metabolic control. Interpretation of high throughput sequencing information needs to be integrated with protein levels and metabolic flux data. Many recent studies have revealed instances where mRNA abundance fails to correlate with protein abundance. This phenomenon challenges conventional understanding and necessitates a comprehensive exploration to understand the underlying mechanisms [13]. Secondly, most of the metabolic studies have not provided any insight into the phenotype of the sample tissue especially the growth rate of the tissue at the sampling times.
Here we report on the metabolic profile of internodes with varying growth rates and model the flux into key lignocellulosic and soluble metabolic fractions. The data confirms that the duration of internode elongation is controlled by thermal time. This study represents the first effort to integrate metabolome and transcriptome changes with metabolic rates at different stages of internode development. Cell wall polysaccharide synthesis, respiration and other biosynthetic processes are the major demand functions in the developing internodes. Sucrose storage only occurs when cell wall polysaccharide synthesis is completed.
2. Materials and Methods
2.1. Material
Research trials were conducted in field with sugarcane variety KQ228. The trial sites were at Sugar Research Australia’s Burdekin Station, QLD (19°34’0.80"S, 147°19’30.7"E) and . The trials were planted in a completely randomised design, including three replicate plots per treatment. Each replicate consists of 4 x 10 meters of cane. Billets obtained from disease-free stalks were used as planting material. Before stick planting in August the soil was nutrient tested and fertilised according to Six Easy Steps nutrient recommendations [14].
The sugarcane was furrow irrigated with a 7-day flood irrigation schedule throughout the cropping cycle. The trial was a completely randomised design, including two treatments with four replicate plots. Each replicate consisted of four 10m rows with a 1.5m spacing between rows.
MODDUS, an emulsifiable concentrate containing the active compound Trinexapac-ethyl at a concentration of 250g , was applied to the crop as a foliar spray at a dose of 50g active ingredient ha−1 (0.25 label rate) using an agricultural handheld knapsack sprayer [4]. The last application was 26 days before sample collection in March (crop age six months).
2.2. Non-destructive measurements
Six primary shoots in each plot were tagged for easy identification. Stalk elongation and phyllochron development were non-destructively measured in-field. This was done to ensure minimal disruption to canopy development by not changing shoot and leaf numbers, leaf production rates, and numbers of senescing leaves. Measurements were done throughout the first nine months of crop development.
2.2.1. Modelling Growth
The growth of the culm was modelled by applying a logistic growth function
where ∫(length) is the change in the phenotype parameter (length, diameter or volume) and (t) represents time or thermal time. The parameters to be fitted are maximum size (max) and the time where half of the maximum size (length, diameter or volume) was reached. The steepness of the growth curve is represented by k. The rate at each time point was determined with
2.3. Destructive Sampling
Six culm samples were collected from the field plots at two different time points, approximately 6 and 10 months after planting. These samples were analyzed using a modified method by Berding [15]. The culm samples were disintegrated using either a garden mulcher or Dedini laboratory disintegrator at room temperature. The mulched material was then weighed to determine the fresh weight (FW) and transferred to a paper bag to be dried at 70°C until a constant dry weight (DW) was reached (usually 6 to 7 days).
2.4. Biomass composition
All the analyses were conducted at Celignis Analytical ( (Celignis) using the analytical package P19 (Deluxe lignocellulose: Sugars, Lignin, Extractives, and Ash, protein-corrected lignin, water-soluble sugars, uronic acids, acetyl content and starch).
2.4.1. Extraction of biomass component
All extractions were carried out with a Dionex Accelerated Solvent Extractor (ASE) 200 [16] . The extractions were carried out according to the National Renewable Energy Laboratory (NREL) standard operating procedure for determining extractives in biomass [17]. Ash content was determined using a Nabertherm L-240H1SN furnace, according to the NREL operating procedure for the determination of ash in biomass [17].
2.4.2. Cell Wall Constituents
Hydrolysis of the dry extractives-free samples was performed according to a modification of the NREL standard operating procedure for the determination of structural carbohydrates and lignin in biomass [18]. The procedure was divided into two main steps: a two-stage acid hydrolysis of the samples and the gravimetric filtration of the hydrolysate to separate it from the acid-insoluble residue (AIR) [19]. Klason lignin was calculated by determining the weight difference between the AIR and its ash content. Acid-soluble lignin was measured by determining the absorbance of an aliquot of the hydrolysate at 240 nm using an Agilent 8452 UV–vis spectrophotometer. The results are then converted to ASL based on Beer’s law [20]. The lignocellulosic sugars resulting from hydrolysis were determined by ion-chromatography techniques adapted from [18]. The method consisted of diluting the hydrolysate samples 20× with a deionised water solution containing known amounts of melibiose as an internal standard [16]. The diluted hydrolysates were filtered and then analysed with HPLC and fitted with an electrochemical detector (PAD).
2.4.3. Water Solubles
The sugars in the water-soluble fraction Section 2.4.1 were analysed using ion–chromatography [16].
2.5. Extaction of Metabolites and Proteins
Internodes 2,4 and 6 were removed from the stalk, and a 30mm long section was cut from the bottom of the internode. Approximately 8mm diameter cylindrical cores were bored off-centre (avoiding the pith) and vertically down using a 12mm cordless drill and Diamond Drill Bit. The cylindrical samples were placed in a labelled 2mL screw cap tube and snap frozen in liquid nitrogen and stored at ∘C. The drill bit borer was sprayed with 70% (v/v) ethanol and wiped between samples.
2.6. Metabolome
The protocol followed was described in [21]. Briefly, 30 mg of homogenised leaf was added to 500 L 100% (v/v) methanol in a cryomill tube containing internal standards 13-Sorbitol, and 13-15-ValineL), 2-aminoanthracene (0.25 mg/mL) and pentafluorobenzoic acid (0.25 mg/mL). Samples were derivatized through trimethylsilylation for GC–MS analysis. [22]. Metabolome data was analysed using MetaboAnalyst [23] and Mapman [24].
2.7. Proteome Data Collection and Processing
A portion of the liquid nitrogen frozen samples were lyophilised and used for protein extraction to generate proteome data [25]. Each sample (100 g) was taken for digestion and analysis with a 1D and 2D IDA nanoLC (Ultra nanoLC system, Eksigent) system. The IDA LC–MS/MS data were searched using ProteinPilot v5 (Sciex) in thorough mode. The top 6 most intense fragments of each peptide were extracted from the SWATH data sets (75 ppm mass tolerance, 10 min retention time window). Shared and modified peptides were excluded. After data processing, peptides with confidence ≥99% and FDR ≤1% (based on chromatographic feature after fragment extraction) were used for quantitation. Protein differential abundance was determined using unnormalised protein quantification values as input for package DESeq2 v1.18.1 (Love, 2014).
The Mercator annotation tool (Mercator 4.0) [26] was used to assign the MapMan "bins" to differentially expressed proteins. The Mercator output file was then used as a mapping file to assign functional categorizations to differential expressed proteins (DEPs) on MapMan. An enrichment analysis with PageMan [24] was carried out with the same list of DEPs.
2.8. Statistical Analysis
Statistical analyses were performed in R (RStudio 2023.06.0 Build 421 for Windows) using the package Agricolae [27]. One-way ANOVA tests were used to make multiple comparisons followed by a Least Significant Difference Test (LSD) [28]. The TukeyHSD post hoc tests were used to compare the group means. All graphs in the boxplot format were prepared in R using the package MultiCompview. Protein differential abundance was determined using unnormalised protein quantification values as input for package DESeq2 v1.18.1 [29].
3. Results
3.1. Crop Growth
Stalk elongation was measured throughout the first nine months of crop development for both the plant and first ratoon crop. Sugarcane height and biomass do not increase linearly. Instead, growth could be best modelled by applying equation 1 (Fig. Figure 1A).
From the stalk length data, the growth rate was calculated by applying equation 2. Maximum growth was achieved at 1130 (Figure 1B).
An ANOVA analysis showed no significant difference between the two crop classes over the entire cropping cycle. However, there was a significant difference in growth between the two crop classes over the first 360 (). The ratoon crop outperformed the plant crop initially (Figure 1A), but the peak growth rate and maximum growth rates between the two crop classes were not significantly different.
3.2. Biomass Accumulation
The top internodes were harvested at peak growth (approximately 1100 ) in the presence and absence of MODDUS and at a late stage in the cropping cycle (approximately 1900 ). For this paper, these different rates of growth were defined as the "fast-growth","slow-growth" and "MODDUS" phenotypes (Figure 2).
3.3. Biomass Composition
Table 1 shows the biomass composition as a portion of total biomass at the different stages of growth and in the presence or absence of MODDUS. For comparison, the biomass composition of internodes 4 (peak biomass accumulation), 8 (late accumulation), and 12 (completed biomass accumulation) were compared (Figure 2).
According to the data, the significant differences among the various phenotypes were associated with the water-soluble components such as sucrose and hexoses, rather than the lignocellulosic components (Figure 1). There were no differences found in the content of glucan (cellulose), pentan (xylan, arabinan) and lignin among internodes 4, 8 and 12 of the three phenotypes (Figure 1). However, the sucrose content of the slow-growth and MODDUS phenotypes was significantly different from that of the fast-growing phenotype. Even in internode 12, where there was no further gain in biomass, the sucrose content was lower than that of the slow-growing internodes.
In all three stages of internode development, the hexose content was significantly higher in the fast-growing phenotype than in the slow growing phenotypes (Figure 1).
3.4. Biomass Accumulation Rates
The total mass of each component per internode was calculated from the data in Table S1 and the total internode dry weight. The thermal time for developing a new phytomer in KQ228 is 30DD18[4]. Therefore, the internode number was multiplied by 30 to calculate rates as mg. DD18−1. The logistic function (1 and 2) was used to model the accumulation patterns of the different biomass components (Figure 2).
The maximum rate of biomass accumulation was evident in internodes 3 to 4 (Figure 3A.). Although the maximum rate differed significantly between the three phenotypes, there were no differences in the stage of internode development where this was achieved (Table 1). Maximum rates of cellulose and hemicellulose accumulation coincided with maximum biomass accumulation (Figure 3B, C). The stage of internode development where maximum biomass, cellulose and hemicellulose accumulation occurred was independent of the growth rate per se (Table 1 and Figure 3A, B, C).
The maximum rates of sucrose and lignin accumulation occurred between internodes 6 and 7 in the fast-growing cane (Figure 3D). There was a significant difference in the maximum rates of lignin and sucrose accumulation between the fast-growing and slow-growing cane (Table 1). Unlike cellulose and hemicellulose accumulation, growth rate also influenced the stage of internode development where maximum accumulation rates of sucrose (Figure 3D) and lignin (Figure 3E) were achieved (Table 1). Both sucrose and lignin peak accumulation occurred significantly earlier in internode development in slow-growing sugarcane.
The transition from early growth to sucrose accumulation during internode development is best illustrated by crossover plots (Figure 4). These plots highlight the point in internode development where the internode development transitions from growth to sucrose storage.
In the fast-growing sugarcane, the portion of sucrose in total biomass accumulation was low in the first 5 internodes (Figure 4A). In the internodes older than internode 6 sucrose was the main contributor to biomass accumulation. Interestingly, the rate of sucrose accumulation in the older internodes exceed the rate of total biomass gain (Figure 4A,C,E).
The crossover point between sucrose and biomass accumulation occurred significantly earlier in the slow-growing and MODDUS phenotypes. The same was observed in the crossover point between cell wall sugars and sucrose accumulation (Figure 4B,D,F).
3.5. Metabolome
A total of 78 metabolites were identified in the metabolome analysis. A one-way ANOVA analysis revealed that 65 metabolites differed significantly () between genotypes at different stages of development.
Various measures have been used in the past for the expression of metabolic data in sugarcane, namely dry weight, fresh weight and protein content, and on a whole-internode basis (for review see [30] , which have produced conflicting results. In this study, metabolite data was normalised to reflect the total water-soluble content of the internodes (Figure 4).
The whole metabolome data set was subjected to a principal component and hierarchical cluster analysis, to assess the general effect of the stage of internode development at early season and late season growth. The scores plot of PLS-DA (Figure 4) displays distinct separation between the internodes at peak biomass and sucrose accumulation during both fast (1100 ) and slow growth (1800 ) stages. The first (Component 1) and second (Component 2) latent variables indicate that the model has effectively identified a pattern that distinguishes between the groups. Samples from the internode at low biomass but high sucrose accumulation (at both growth stages) cluster on the negative side of component 1.
This separation of metabolic expression during the stage of internode development and time in the cropping cycle was also evident by the two-factor heatmap of normalised relative concentrations. Hierarchical clustering, on the left of the heatmap, showed that metabolites belonging to particular metabolic pathways were mainly clustered together (Figure 5).
Similarly, there was a clear separation between the internodes at both growth stages in the presence and absence of MODDUS (Figure ). Samples from the young (internode 4) in the presence and absence of MODDUS clustered on the negative side of component 1 and the older internodes on the positive side. The MODDUS treatment resulted in a metabolic pattern indicative of slow growth. This metabolic process clustering was also evident in the two-factor heatmap of normalised relative concentrations in the presence and absence of MODDUS (Figure 6).
A mapping file was constructed for all the metabolites identified in this project (Table 2) for use in Mapman [24].
The difference between internodes at peak biomass or sucrose accumulation was the down-regulation of metabolite concentrations (Figure 5 and Figure 6) in the transition to sucrose accumulation.
At mid-season with high growth rates, 41 metabolites were significantly decreased in the transition from peak biomass accumulation to peak sucrose accumulation, while only five were up-regulated (Table 2 and Figure 5A). A similar pattern was evident in the MODDUS treatment between these two stages of internode development (Table 2 and Figure 5C).
3.6. Protein Levels
Protein levels are controlled by protein expression and degradation. These two processes are interconnected and tightly regulated and play crucial roles in maintaining cellular homeostasis and responding to various internal and external stimuli. This paper only consider the cellular protein homeostasis during the different growth and development phases of the internodes.
Protein analyses was restricted to material from mid-season (fast) growth. The MODDUS-treated cane was used to represent slow growth. This was done to avoid other environmental influences that would be presented by collecting material at different times during the year. A total of 7332 protein sequences were submitted to Mercator for annotation. Proteins assigned to bin 35 (not assigned annotated) and bin 50 (Enzyme classification) were excluded from further analyses. The remainder of the dataset (5117 sequences) were analysed for differential expression using a FDR criteria [31] of . Based on this criteria a total of 928 proteins were differentially expressed across the different treatments.
A principal component analysis and hierarchical cluster analysis showed a clear visual separation between the different stages of development (peak biomass accumulation and peak sucrose accumulation, Figure 4) and between the control (fast growth) and MODDUS treatment (slow-growth) (Figure 7).
It was found that the most abundant differentially expressed proteins (DEPs) were associated with vesicle trafficking, carbohydrate metabolism, protein homeostasis, C4 photosynthesis and cell wall organisation (Figure 6). Noteworthy is that the category of C4 photosynthesis was dominated by catalytic activities associated with PEP carboxylase and glyceraldehyde 3-phosphate dehydrogenase (GAPDH) activities.
The expression of 301 proteins are higher (FDR )in the internodes at peak biomass accumulation, and 252 higher during peak sucrose accumulation during normal growth (Figure 7A). A similar pattern of protein expression is evident in the internodes with very significant reduction in growth and total biomass due to the presence of MODDUS (Figure 7B).
Only 240 proteins are deferentially expressed between the internodes at peak sucrose accumulation (Figure 7C).
3.6.1. Carbohydrate Metabolism and Glycolysis
A very similar pattern of differential gene expression between internodes at peak biomass and peak sucrose accumulation was evident in large internodes (control) versus smaller internodes (MODDUS treatment) (Figure 8 and Figure 7). Proteins involved in sucrose breakdown, oxidative pentose phosphate pathway, nucleotide sugar and pentose metabolism were significantly higher in the internodes at peak biomass accumulation. In contrast, the proteins involved in hexose-P metabolism, oligosaccharide synthesis, and fermentation were more abundant in the internodes with peak sucrose accumulation.
Pyrophosphate-dependent phosphofructokinase, pyruvate kinase, and enolase were significantly reduced during the transition from rapid growth to sucrose accumulation. Sucrose synthase (SuSy) activity exhibited a complex pattern of change, with SuSy 2 reduced and SuSy 1 and 4 increased during the transition from growth to sucrose accumulation.
Vacuolar and cell wall invertases were more abundant during peak growth and both were absent during peak sucrose accumulation (Figure 8).
During peak sucrose accumulation in the presence and absence of MODDUS proteins involved in cellulose, hemicellulose (Figure 8 and Figure 9), and vesicle trafficking(Figure 10) were significantly reduced.
The data clearly demonstrate that both cellulose and hemicellulose synthesis were largely under coarse control with a significant reduction in the levels of key enzymes in the two pathways (Figure 8A,B).
3.6.2. Cell Wall Sugars
Key enzymes of cellulose synthesis such as cellulose synthase (CesA) and endo-1,4-beta-glucanase (EG), and hemicellulose synthesis such as xylan O-acetyltransferase (XOAT), xylosyltransferase (XT) and xylan alpha-1,3-arabinosyltransferase (XAT) were significantly reduced in the older internodes which were accumulating sucrose.
One of the major metabolic changes during the transition from growth to sucrose accumulation reside in the pathway of nucleotide sugar production (Figure 8A,B and Figure 10). UDP-glucose dehydrogenase (UGD), UDP-glucose decarboxylase (AXS),UDP xylose synthethase (UXS), rhamnose synthase(RhaS), xylose 4 epimerase (UXE), arabinose mutase (AraM) levels were all significantly decreased in the transition to sucrose accumulation.
3.6.3. Lignin
Evidently, there were two types of changes in the proteins that are associated with lignin metabolism (Figure 9)). During rapid internode expansion and biomass accumulation phase lignin peroxidases were more abundant than during the sucrose accumulation phase. In contrast, proteins associated with monolignol biosynthesis such as caffeoyl-CoA 3-O-methyltransferase (CCoA-OMT), caffeoyl-CoA 3-O-methyltransferase (CCoA-OMT),cinnamoyl-CoA reductase (CCR) and p-coumaroyl-CoA: monolignol transferase (PMT) levels were significantly higher during the sucrose and lignin accumulation phase than during rapid growth.
3.6.4. Vesicle Trafficking
More than 460 protein identified in this study were associated with vesicle trafficking. The expression of 78 of these proteins differed significantly (p<0.05) during internode development. ECHIDNA (ECH) and the YPT/RAB guanosine triphosphatase (GTPase) interacting proteins are some of the major proteins that decrease after maximum internode elongation. RAB GTPases and retrograde trafficking, mainly mediated by Coat Protein I (COPI), and SNARE membrane fusion complexes were dominating the vesicle trafficking category.
3.6.5. Vacuolar Metabolism
There were 203 tonoplast associated proteins among the identified proteins in the sugarcane internodes. Most of these were constitutively present. Twenty three proteins were differentially expressed between maximum growth and sucrose accumulation. A monosaccharide transporter and several tonoplast sucrose transporters (SUT and TST) were higher expressed in the sucrose accumulation phase . Anion- and cation transporters, pyrophosphate- and ATP proton translocators were higher expressed in the rapid growth phase (Figure 12)).
4. Discussion
In the sugarcane culm, the top internodes represent a range of development stages [4,32,33]. Internode 1 is starting to elongate, internode 3 attains maxim elongation and by internode 5 elongation is completed. As an internode develops, the size of individual cells, but not the number increases [12]. Internode elongation is completed after approximately 150°Cd (base temperature 18°C) [4,32,34].
4.0.6. Sink Strength
Most of the reduced carbon required to support culm development and growth in sugarcane is derived from sucrose that is imported symplastically (for review [35].
Sink strength, is reflected by the increase in biomass, of the internodes [4,6]. It is important to note that biomass accumulation is an underestimation of carbon input into the tissue. Biomass accumulation is highly energy-dependent and more than 50% of incoming sugars might be burned for energy production to support growth [36].
Maximum sink strength is around internode 4 to 5. However, biomass accumulation continue up to internode 10 to 12. Sink strength (rate of biomass accumulation) changes throughout the season and is determined by the size or volume of the tissue.
Internode growth requires two processes: cell wall synthesis and cell expansion. Cell wall synthesis demands a lot of energy and resources, while cell expansion involves the uptake of water through osmotic potential and controlled changes in the cell wall’s extensibility (Botha). Initially, cell wall synthesis is the most significant demand for carbon in young internodes. As internodes mature, the biggest demand for carbon shifts to sucrose accumulation. The point at which the demand for carbon shifts from cell wall synthesis to sucrose accumulation depends on the growth rate. When the growth rate slows down towards the end of the growth season or with the application of MODDUS, the crossover happens earlier in internode development. It is important to note that the demand for carbon from the other metabolic pools diminishes rapidly as internode elongation slows down. In the late stages of development, especially in the fast-growing culm, sucrose accumulation exceeds total biomass gain. This can only imply that other cellular constituents are converted to sucrose at this stage.
There has been a significant increase in the amount of knowledge available about changes in metabolite [37,38,39] and gene expression profiles [9,38,40,41] due to modern high throughput platforms. However, the connection between metabolic changes in the developing internodes in sugarcane and the final yield and sugar characteristics is not well understood. This is mainly due to a failure to demonstrate the relationship between mRNA and protein levels, or a lack of description of the development stage and phenotype.
The metabolome and proteome data that are presented in this manuscript provide significant insight into some of the potential metabolic control points in the culm sink strength.
4.0.7. Sucrose Breakdown
Because the import of sucrose into the culm parenchyma is symplastic, sucrose importation into the internodes is dependent on maintaining a low sucrose concentration in the cytosol [35,42,43]. Maintaining a low sucrose concentration in the cytosol of the parenchyma cells would be dependent on sucrose breakdown to provide carbon skeletons for biosynthesis and energy provision, and loading of sucrose into the vacuole [1,4,5].
Intracellular sucrose catabolism is via SuSy or cytosolic and vacuolar invertases [44].
Susy directly produces UDP-glucose, which is the substrate for other nucleotide sugars needed for cell wall biosynthesis [7]. It is therefore not surprising that much research on the role of sucrose synthase (SuSy) in the accumulation of sucrose in sugarcane have been done [32,45,46].
The changes in the levels of SuSy proteins reflect significant complexity during internode development. Although SuSy 2 levels decrease significantly during the transition from rapid growth to sucrose accumulation, SuSy 1 and Susy 4 increase. It is known that these two forms of SuSy are specifically induced by stress and hypoxia ([44,47]. Both the cell wall and vacuolar invertases decrease rapidly during internode development and are absent at the stage where the internode development switches to sucrose accumulation. This was previously shown to be the case during the culm development of sugarcane[48,49].Cytosolic invertase also decrease during internode development but is still abundant in the mature internodes.
Modeling of internode metabolism based on the metabolism of 14 sugars showed that more than 90% of free glucose and fructose reside in the vacuole. Hydrolysis of sucrose in the vacuole has the advantage of lowering the osmotic potential in the vacuole and facilitating cell expansion through more water uptake into the vacuole.
4.0.8. Carbon Availability for Cell Wall Synthesis
The data presented here suggest that it is unlikely that UDP-glucose availability plays a significant role in determining the rate of cell wall synthesis.
Early studies suggested that SuSy plays a role in the production of UDP-Glc, which is used in cellulose biosynthesis [52]. However, recent genetic analysis in Arabidopsis and aspen plants has shown that mutations or downregulation of SuSy genes have little effect on cellulose synthesis and plant growth [53]. This suggests that SuSy is unlikely to play a significant role in supplying UDP-Glc for cellulose synthesis. In contrast, mutations of two Arabidopsis cytosolic invertase genes cause severe growth defects, indicating that the invertase-mediated pathway is the main route for supplying UDP-Glc for cellulose biosynthesis [53]. Further analysis has shown that downregulation of a wood-associated cytosolic invertase gene in aspen reduces the amount of crystalline cellulose and UDP-Glc in the plant’s wood. Therefore, the available evidence suggests that the invertase-mediated pathway is the predominant route for supplying UDP-Glc for cellulose biosynthesis. The data presented in this study shows that neutral invertase activity is high during maximum growth and remains present even at very late stages of sucrose accumulation. Previously, we have also shown that downregulation of neutral invertase in sugarcane results in significant suppression of growth [54].
4.0.9. Regulation of Cell Wall Synthesis
The composition of the cell wall does not significantly vary during different times of the season and growth rates. This indicates that the synthesis of various components of the cell wall is closely regulated and coordinated with the growth of cells and organs. During extension growth, it is necessary to synchronize the synthesis of all the cell wall components with changes in the extensibility of the matrix component, osmolality, and the uptake of water [44].
The most striking change observed in protein levels during the transition from rapid growth to sucrose accumulation is the widespread decrease in many proteins in the nucleotide sugar synthesis pathway. This data is consistent with the rate cell wall synthesis being controlled by prevailing enzyme levels (coarse control) rather than through the availability of UDP-glucose.
The genes responsible for the synthesis of primary and secondary cell walls are expressed in a coordinated manner [9,55,56,57]. However, the transcriptional program that regulates this process is not well understood and appears to involve developmental gradients and brassinosteroids [44]. The abundance of proteins is also regulated at the level of translation [58] and turnover [59]. In Arabidopsis, it has been found that several proteins involved in nucleotide-sugar metabolism are subject to relatively rapid degradation [60]. The regulation of cellulose synthesis is also influenced by protein phosphorylation [54].
4.0.10. Vesicle Trafficking
The construction of a cell wall is a complex process that relies on the interaction between vesicles and the cytoskeleton network. Vesicles are generally produced in the Golgi and transported on the cytoskeleton, often through the trans Golgi network (TGN), to and from the plasma membrane. Actin plays an important role in cell elongation and vesicle transport.
During the transition to sucrose storage in sugarcane internodes, many components of this cytoskeleton and vesicle network decrease. The most significant change in protein levels in developing sugarcane internodes is related to vesicle transport.
Cellulose and secretion, two critical components of cell wall construction, are influenced by various factors, including endomembrane pH, ion activity, changes in osmotic pressure, and cell sugar status. Once the matrix polysaccharides (hemicellulose) have reached the desired length, they are secreted into the apoplast. The majority of this secretion takes place via the conventional TGN pathway. The initial steps of this process seem to be controlled by a protein complex that is composed of ECHIDNA (ECH) and the YPT/RAB guanosine triphosphatase (GTPase) interacting proteins. Both of these components peak during maximum internode elongation.
4.0.11. Sucrose Accumulation
Sucrose accumulation initially occurs in the symplastic compartment, possibly by loading the sucrose into the vacuole. However, as sucrose accumulation progresses, especially after internode length expansion ceases, sucrose also leaks into the apoplastic space, which can take up as much as 20% of the total internode volume. The fact that the sucrose concentration in the apoplast is the same as that in the symplast supports the suggestion that it comes primarily from the storage of parenchyma cells [61].
Rapid cell elongation would require not only rapid cell wall synthesis but new membrane material, protein and other building blocks. Rapid cell enlargement is also highly energy-dependent and more than 50% of incoming sugars might be burned for energy production to support growth [36].
The importance of these processes is demonstrated by the fact that the major protein changes are associated with vesicle trafficing, cell wall organisation, respiration, redox homeostasis and cytoskeleton organisation.
It’s not surprising that a significant number of proteins that are differentially expressed (DEPs) in internodes are associated with vesicle trafficking. Transport systems that involve exocytosis and endocytosis are crucial in carrying cell wall precursors produced in the Golgi apparatus to the cell surface. Vesicles carrying polysaccharides such as cellulose, hemicellulose, and pectin, as well as cell wall proteins, are targeted at specific areas of the plasma membrane. These vesicles release their contents, which help in cell wall expansion and remodeling. The pathways of vesicle trafficking regulate the spatial and temporal distribution of cell wall components, coordinating their deposition and organization during cell growth and development. Vesicle transport is vital to maintain cell wall integrity, ensuring proper cell shape and function.
The cytoskeleton is comprised of three main components: microtubules (MT), microfilaments (MF), and intermediate filaments (IF). The cytoskeleton plays a crucial role in the process of cell wall formation and remodeling throughout the growth and development of cells . The regulation of protein compartmentalization and abundance within cells is predominantly governed by the process of vesicle/membrane transport, which plays a crucial role in several signaling cascades. The regulation of membrane transport in eukaryotic cells is governed by a diverse array of proteins [62,63,64].
Although it is not yet fully understood, there is growing support for the idea that vacuolar expansion follows cell wall loosening, which marks the onset of cell expansion [65,66]. (Cui). Vacuole enlargement provides continuous rigid support and economic cellular space occupation for subsequent cell size increase. Rapid cell elongation occurs only when both processes work together, leading to fast plant growth rates. In Arabidopsis mutants defective in vacuole biogenesis, cell enlargement is compromised, indicating that without the support of large central vacuoles, water uptake cannot continuously occur, and cell growth is inhibited [67].
5. Conclusions
This study confirms that the duration of internode elongation is independent of the crop’s growth rate. Instead, it is controlled by thermal time. Complex genetic processes underpin the control of plant phenology [68].
The cell wall chemical composition of sugarcane appears to be independent of the growth rate or time of the season. This suggests that harvesting time would have little impact on the quality of the lignocellulosic fraction and should ease the development of processing technologies.
In contrast, the timing and level of sucrose accumulation is directly related to the initial growth rate of the crop. It is important that this is recognised and reported during sugarcane analysis, and interpretaion of moelcular and physiolgical data.
Many of the proteins involved in cellulose and hemicellulose are reduced during the transition from rapid growth to sucrose accumulation. Genetic manipulation of the duration of sugarcane cell wall synthesis will, therefore, pose significant challenges, and it might be better to focus attention on the molecular basis of thermal time control of the process.
References
- Martin, A.; Palmer, W.; Brown, C.; Abel, C.; Lunn, J.; Furbank, R.; Grof, C.P.L. A developing Setaria viridis internode: an experimental system for the study of biomass generation in a C4 model species. Biotechnology Biofuels 2016, 9, 45–45. [Google Scholar] [CrossRef] [PubMed]
- Kebrom, T.H.; McKinley, B.; Mullet, J.E. Dynamics of gene expression during development and expansion of vegetative stem internodes of bioenergy sorghum. Biotechnology for Biofuels 2017, 10, 159. [Google Scholar] [CrossRef] [PubMed]
- Lingle, S.E. Seasonal Internode Development and Sugar Metabolism in Sugarcane. Crop Science 1997, 37, 1222–1227. [Google Scholar] [CrossRef]
- Botha, F.C.; Scalia, G.; Marquardt, A.; Wathen-Dunn, K. Sink Strength During Sugarcane Culm Growth: Size Matters. Sugar Tech 2023. [Google Scholar] [CrossRef]
- Martin, A.P.; Brown, C.W.; Nguyen, D.Q.; Palmer, W.M.; Furbank, R.T.; Byrt, C.S.; Lambrides, C.J.; Grof, C.P.L. Cell Wall Development in an Elongating Internode of Setaria. In Genetics and Genomics of Setaria; Doust, A., Diao, X., Eds.; Springer International Publishing: Cham, 2017; pp. 211–238. [Google Scholar] [CrossRef]
- Botha, F. Advances in understanding of sugarcane plant growth and physiology. In Achieving sustainable cultivation of sugarcane; Rott, P., Ed.; Burleigh Dodds Science Publishing: Sawston, United Kingdom, 2018; Volume 2. [Google Scholar]
- Mason, P.J.; Hoang, N.V.; Botha, F.C.; Furtado, A.; Marquardt, A.; Henry, R.J. Organ-specific expression of genes associated with the UDP-glucose metabolism in sugarcane (Saccharum spp. hybrids). BMC genomics 2023, 24, 1–23. [Google Scholar] [CrossRef] [PubMed]
- Wai, C.M.; Zhang, J.; Jones, T.C.; Nagai, C.; Ming, R. Cell wall metabolism and hexose allocation contribute to biomass accumulation in high yielding extreme segregants of a Saccharum interspecific F2 population. BMC Genomics 2017, 18, 773. [Google Scholar] [CrossRef] [PubMed]
- Casu, R.E.; Rae, A.L.; Nielsen, J.M.; Perroux, J.M.; Bonnett, G.D.; Manners, J.M. Tissue-specific transcriptome analysis within the maturing sugarcane stalk reveals spatial regulation in the expression of cellulose synthase and sucrose transporter gene families. Plant Molecular Biology 2015, 89, 607–628. [Google Scholar] [CrossRef] [PubMed]
- Casu, R.; Grof, C.; Rae, A.L.; McIntyre, C.L.; Dimmock, C.M.; Manners, J.M. Identification of a novel sugar transporter homologue strongly expressed in maturing stem vascular tissues of sugarcane by expressed sequence tag and microarray analysis. Plant molecular biology 2003, 52, 371–386. [Google Scholar] [CrossRef] [PubMed]
- Dhungana, S.R.; Braun, D.M. Genomic Analyses of SUT and TST Sugar Transporter Families in Low and High Sugar Accumulating Sugarcane Species (Saccharum spontaneum and Saccharum officinarum). Tropical Plant Biology 2022, 15, 181–196. [Google Scholar] [CrossRef]
- Rae, A.L.; Grof, C.P.; Casu, R.E.; Bonnett, G.D. Sucrose accumulation in the sugarcane stem: pathways and control points for transport and compartmentation. Field Crops Research 2005, 92, 159–168. [Google Scholar] [CrossRef]
- Liu, Y.; Beyer, A.; Aebersold, R. On the dependency of cellular protein levels on mRNA abundance. Cell 2016, 165, 535–550. [Google Scholar] [CrossRef] [PubMed]
- Schroeder, B.L. .; Hurney, A.P..; Wood, A.W..; Moody, P.W..; Allsopp, P.G.. Concepts and value of the nitrogen guidelines contained in the Australian sugar industry’s “six easy steps” nutrient management program. Proceeding of the International Society of Sugar Cane Technologist 2010, 27, 1–13. [Google Scholar]
- Berding, N.; Marston, D.H. Operational validation of the efficacy of spectracanetm, a high-speed analytical system for sugarcane quality components. Proceedings of the 2010 Conference of the Australian Society of Sugar Cane Technologists held at Bundaberg, Queensland, Australia, 11-14 May 2010, Australian Society of Sugar Cane Technologists; 445–459.
- Pisanó, I.; Gottumukkala, L.; Hayes, D.J.; Leahy, J.J. Characterisation of Italian and Dutch forestry and agricultural residues for the applicability in the bio-based sector. Industrial Crops and Products 2021, 171, 113857. [Google Scholar] [CrossRef]
- Sluiter, A.; Sluiter, J. Determination of Starch in Solid Biomass Samples by HPLC: Laboratory Analytical Procedure (LAP): Issue Date, 07/17/2005; National Renewable Energy Laboratory, 2008.
- Hayes, D.J. Development of near infrared spectroscopy models for the quantitative prediction of the lignocellulosic components of wet Miscanthus samples. Bioresource Technology 2012, 119, 393–405. [Google Scholar] [CrossRef] [PubMed]
- Sluiter, A.; Hames, B.; Ruiz, R.; Scarlata, C.; Sluiter, J.; Templeton, D.; Crocker, D. Determination of structural carbohydrates and lignin in biomass. Laboratory analytical procedure 2008, 1617, 1–16. [Google Scholar]
- Bhagia, S.; Nunez, A.; Wyman, C.E.; Kumar, R. Robustness of two-step acid hydrolysis procedure for composition analysis of poplar. Bioresource technology 2016, 216, 1077–1082. [Google Scholar] [CrossRef]
- Marquardt, A.; Scalia, G.; Wathen-Dunn, K.; Botha, F. Yellow canopy syndrome (YCS) in sugarcane is associated with altered carbon partitioning in the leaf. An International Journal of Sugar Crops and Related Industries 2017, 19, 647–655. [Google Scholar] [CrossRef]
- Hill, C.B.; Taylor, J.D.; Edwards, J.; Mather, D.; Bacic, A.; Langridge, P.; Roessner, U. Whole-genome mapping of agronomic and metabolic traits to identify novel quantitative trait loci in bread wheat grown in a water-limited environment. Plant Physiology 2013, 162, 1266–1281. [Google Scholar] [CrossRef]
- Chong, J.; Xia, J. MetaboAnalystR: an R package for flexible and reproducible analysis of metabolomics data. Bioinformatics 2018, 34, 4313–4314. [Google Scholar] [CrossRef]
- USADEL, B.; POREE, F.; NAGEL, A.; LOHSE, M.; CZEDIK-EYSENBERG, A.; STITT, M. A guide to using MapMan to visualize and compare Omics data in plants: a case study in the crop species, Maize. Plant, Cell & Environment 2009, 32, 1211–1229. [Google Scholar] [CrossRef]
- Marquardt, A.; Henry, R.J.; Botha, F.C. Effect of sugar feedback regulation on major genes and proteins of photosynthesis in sugarcane leaves. Plant Physiology and Biochemistry 2021, 158, 321–333. [Google Scholar] [CrossRef]
- Schwacke, R.; Ponce-Soto, G.Y.; Krause, K.; Bolger, A.M.; Arsova, B.; Hallab, A.; Gruden, K.; Stitt, M.; Bolger, M.E.; Usadel, B. MapMan4: a refined protein classification and annotation framework applicable to multi-omics data analysis. Molecular plant 2019, 12, 879–892. [Google Scholar] [CrossRef]
- De Mendiburu, F.; Reinhard, S. Agricolae - ten years of an open source statistical tool for experiments in breeding, agriculture and biology. PeerJ PrePrints, 2015. [Google Scholar]
- Steel, R.; Torrie, J.; Dickey, D. Principles and procedures of statistics: A biometrical approach; McGraw-Hill, 1997. Type: Book.
- Love, M.I.; Huber, W.; Anders, S. Moderated estimation of fold change and dispersion for RNA-seq data with DESeq2. Genome biology 2014, 15, 1–21. [Google Scholar] [CrossRef] [PubMed]
- Bindon, K.; Botha, F. Tissue discs as an experimental system for metabolic flux analysis in the. South African Journal of Botany, 2004. [Google Scholar]
- Benjamini, Y.; Hochberg, Y. On the adaptive control of the false discovery rate in multiple testing with independent statistics. Journal of educational and Behavioral Statistics 2000, 25, 60–83. [Google Scholar] [CrossRef]
- Lingle, S. Sugar metabolism during growth and development in sugarcane internodes. Crop Science 1999, 39, 480–486. [Google Scholar] [CrossRef]
- Lingle, S.E.; Thomson, J.L. Sugarcane Internode Composition During Crop Development. BioEnergy Research 2012, 5, 168–178. [Google Scholar] [CrossRef]
- Bonnett, G.D. Developmental Stages (Phenology). In Sugarcane: Physiology, Biochemistry, and Functional Biology; Moore, P.H., Botha, F., Eds.; John Wiley & Sons Ltd: New York, 2013; pp. 35–53. [Google Scholar] [CrossRef]
- Julius, B.T.; Leach, K.A.; Tran, T.M.; Mertz, R.A.; Braun, D.M. Sugar Transporters in Plants: New Insights and Discoveries. Plant and Cell Physiology 2017, 58, 1442–1460. [Google Scholar] [CrossRef] [PubMed]
- Shameer, S.; Vallarino, J.; Fernie, A.; Ratcliffe, R.G.; Sweetlove, L. Flux balance analysis of metabolism during growth by osmotic cell expansion and its application to tomato fruits. The Plant Journal 2020, 103, 68–82. [Google Scholar] [CrossRef] [PubMed]
- Perlo, V.; Botha, F.C.; Furtado, A.; Hodgson-Kratky, K.; Henry, R.J. Metabolic changes in the developing sugarcane culm associated with high yield and early high sugar content. Plant direct 2020, 4, e00276. [Google Scholar] [CrossRef]
- Yuan, Z.; Dong, F.; Pang, Z.; Fallah, N.; Zhou, Y.; Li, Z.; Hu, C. Integrated metabolomics and transcriptome analyses unveil pathways involved in sugar content and rind color of two sugarcane varieties. Frontiers in Plant Science 2022, 13, 921536. [Google Scholar] [CrossRef]
- Glassop, D.; Roessner, U.; Bacic, A.; Bonnett, G.D. Changes in the sugarcane metabolome with stem development. Are they related to sucrose accumulation? Plant and Cell Physiology, 2007; Oxford University Press. [Google Scholar]
- Perlo, V.; Furtado, A.; Botha, F.C.; Margarido, G.R.; Hodgson-Kratky, K.; Choudhary, H.; Gladden, J.; Simmons, B.; Henry, R.J. Transcriptome and metabolome integration in sugarcane through culm development. Food and Energy Security 2022, 11, e421. [Google Scholar] [CrossRef]
- Casu, R.E.; Jarmey, J.M.; Bonnett, G.D.; Manners, J.M. Identification of transcripts associated with cell wall metabolism and development in the stem of sugarcane by Affymetrix GeneChip Sugarcane Genome Array expression profiling. Functional and Integrative Genomics 2007, 7, 153–67. [Google Scholar] [CrossRef] [PubMed]
- Wang, J.; Nayak, S.; Koch, K.; Ming, R. Carbon partitioning in sugarcane (Saccharum species). Frontiers in Plant Science 2013, 4. [Google Scholar] [CrossRef] [PubMed]
- Braun, D.M. Phloem loading and unloading of sucrose: what a long, strange trip from source to sink. Annual Review of Plant Biology 2022, 73, 553–584. [Google Scholar] [CrossRef]
- Verbančič, J.; Lunn, J.E.; Stitt, M.; Persson, S. Carbon Supply and the Regulation of Cell Wall Synthesis. Molecular Plant 2018, 11, 75–94. [Google Scholar] [CrossRef]
- Schäfer, W.E.; Rohwer, J.M.; Botha, F.C. Protein-level expression and localization of sucrose synthase in the sugarcane culm. Physiologia Plantarum 2004, 121, 187–195. [Google Scholar] [CrossRef] [PubMed]
- Thirugnanasambandam, P.P.; Mason, P.J.; Hoang, N.V.; Furtado, A.; Botha, F.C.; Henry, R.J. Analysis of the diversity and tissue specificity of sucrose synthase genes in the long read transcriptome of sugarcane. BMC plant biology 2019, 19, 1–14. [Google Scholar] [CrossRef]
- Bieniawska, Z.; Paul Barratt, D.; Garlick, A.P.; Thole, V.; Kruger, N.J.; Martin, C.; Zrenner, R.; Smith, A.M. Analysis of the sucrose synthase gene family in Arabidopsis. The Plant Journal 2007, 49, 810–828. [Google Scholar] [CrossRef]
- Lingle, S.E.; Smith, R.C. Sucrose Metabolism Related to Growth and Ripening in Sugarcane Internodes. Crop Science 1991, 31, cropsci1991–0011183X003100010039x. [Google Scholar] [CrossRef]
- Vorster, D.J.; Botha, F.C. Partial Purification and Characterisation of Sugarcane Neutral Invertase. Phytochemistry 1998, 49, 651–655. [Google Scholar] [CrossRef]
- Whittaker, A.; Botha, F. Carbon partitioning during sucrose accumulation in sugarcane internodal tissue. Plant Physiology 1997, 115, 1651–1659. [Google Scholar] [CrossRef] [PubMed]
- Bindon, K.A.; Botha, F.C. Carbon allocation to the insoluble fraction, respiration and triose-phosphate cycling in the sugarcane culm. Physiologia Plantarum 2002, 116, 12–19. [Google Scholar] [CrossRef] [PubMed]
- Haigler, C.H.; Ivanova-Datcheva, M.; Hogan, P.S.; Salnikov, V.V.; Hwang, S.; Martin, K.; Delmer, D.P. Carbon partitioning to cellulose synthesis. Plant cell walls, 2001, pp. 29–51. Publisher: Springer.
- Barratt, D.P.; Barber, L.; Kruger, N.J.; Smith, A.M.; Wang, T.L.; Martin, C. Multiple, distinct isoforms of sucrose synthase in pea. Plant Physiology 2001, 127, 655–664. [Google Scholar] [CrossRef] [PubMed]
- Rossouw, D.; Kossmann, J.; Botha, F.; Groenewald, J.H. Reduced neutral invertase activity in the culm tissues of transgenic sugarcane plants results in a decrease in respiration and sucrose cycling and an increase in the sucrose to hexose ratio. Functional Plant Biology 2010, 37, 22–31. [Google Scholar] [CrossRef]
- Ruprecht, C.; Mendrinna, A.; Tohge, T.; Sampathkumar, A.; Klie, S.; Fernie, A.R.; Nikoloski, Z.; Persson, S.; Mutwil, M. FamNet: a framework to identify multiplied modules driving pathway expansion in plants. Plant physiology 2016, 170, 1878–1894. [Google Scholar] [CrossRef]
- Roach, M.; Arrivault, S.; Mahboubi, A.; Krohn, N.; Sulpice, R.; Stitt, M.; Niittylä, T. Spatially resolved metabolic analysis reveals a central role for transcriptional control in carbon allocation to wood. Journal of Experimental Botany 2017, 68, 3529–3539. [Google Scholar] [CrossRef]
- McKinley, B.; Rooney, W.; Wilkerson, C.; Mullet, J. Dynamics of biomass partitioning, stem gene expression, cell wall biosynthesis, and sucrose accumulation during development of Sorghum bicolor. The Plant Journal 2016, 88, 662–680. [Google Scholar] [CrossRef]
- Piques, M.; Schulze, W.X.; Höhne, M.; Usadel, B.; Gibon, Y.; Rohwer, J.; Stitt, M. Ribosome and transcript copy numbers, polysome occupancy and enzyme dynamics in Arabidopsis. Molecular systems biology 2009, 5, 314. [Google Scholar] [CrossRef]
- Stitt, M.; Gibon, Y. Why measure enzyme activities in the era of systems biology? Trends in Plant Science 2014, 19, 256–265. [Google Scholar] [CrossRef]
- Li, L.; Nelson, C.J.; Trösch, J.; Castleden, I.; Huang, S.; Millar, A.H. Protein degradation rate in Arabidopsis thaliana leaf growth and development. The plant cell 2017, 29, 207–228. [Google Scholar] [CrossRef]
- Moore, P.H. Temporal and spatial regulation of sucrose accumulation in the sugarcane stem. Functional Plant Biology 1995, 22, 661–679. [Google Scholar] [CrossRef]
- Gu, Y.; Rasmussen, C.G. Cell biology of primary cell wall synthesis in plants. The Plant Cell 2022, 34, 103–128. [Google Scholar] [CrossRef] [PubMed]
- Hoffmann, N.; King, S.; Samuels, A.L.; McFarlane, H.E. Subcellular coordination of plant cell wall synthesis. Developmental Cell 2021, 56, 933–948. [Google Scholar] [CrossRef] [PubMed]
- Khoso, M.A.; Zhang, H.; Khoso, M.H.; Poude, T.R.; Wagan, S.; Papiashvili, T.; Saha, S.; Ali, A.; Murtaza, G.; Manghwar, H. Synergism of vesicle trafficking and cytoskeleton during regulation of plant growth and development: A mechanistic outlook. Heliyon, 2023; Elsevier. [Google Scholar]
- Kaiser, S.; Scheuring, D. To Lead or to Follow: Contribution of the Plant Vacuole to Cell Growth. Frontiers in Plant Science 2020, 11. [Google Scholar] [CrossRef] [PubMed]
- Cui, Y.; Zhao, Q.; Hu, S.; Jiang, L. Vacuole Biogenesis in Plants: How Many Vacuoles, How Many Models? Trends in Plant Science 2020, 25, 538–548. [Google Scholar] [CrossRef]
- Cui, Y.; Cao, W.; He, Y.; Zhao, Q.; Wakazaki, M.; Zhuang, X.; Gao, J.; Zeng, Y.; Gao, C.; Ding, Y. A whole-cell electron tomography model of vacuole biogenesis in Arabidopsis root cells. Nature plants 2019, 5, 95–105. [Google Scholar] [CrossRef]
- Satake, A.; Nagahama, A.; Sasaki, E. A cross-scale approach to unravel the molecular basis of plant phenology in temperate and tropical climates. New Phytologist 2022, 233, 2340–2353. [Google Scholar] [CrossRef]
Figure 1.
Culm length of KQ228 during the cropping cycle. A logistic function best describes the growth pattern (A). The logistic growth model was used to calculate the growth rate at each time in the growth cycle (B). The blue arrows indicate the time points in the growth cycle where destructive sampling occurred for metabolome and proteome analysis.
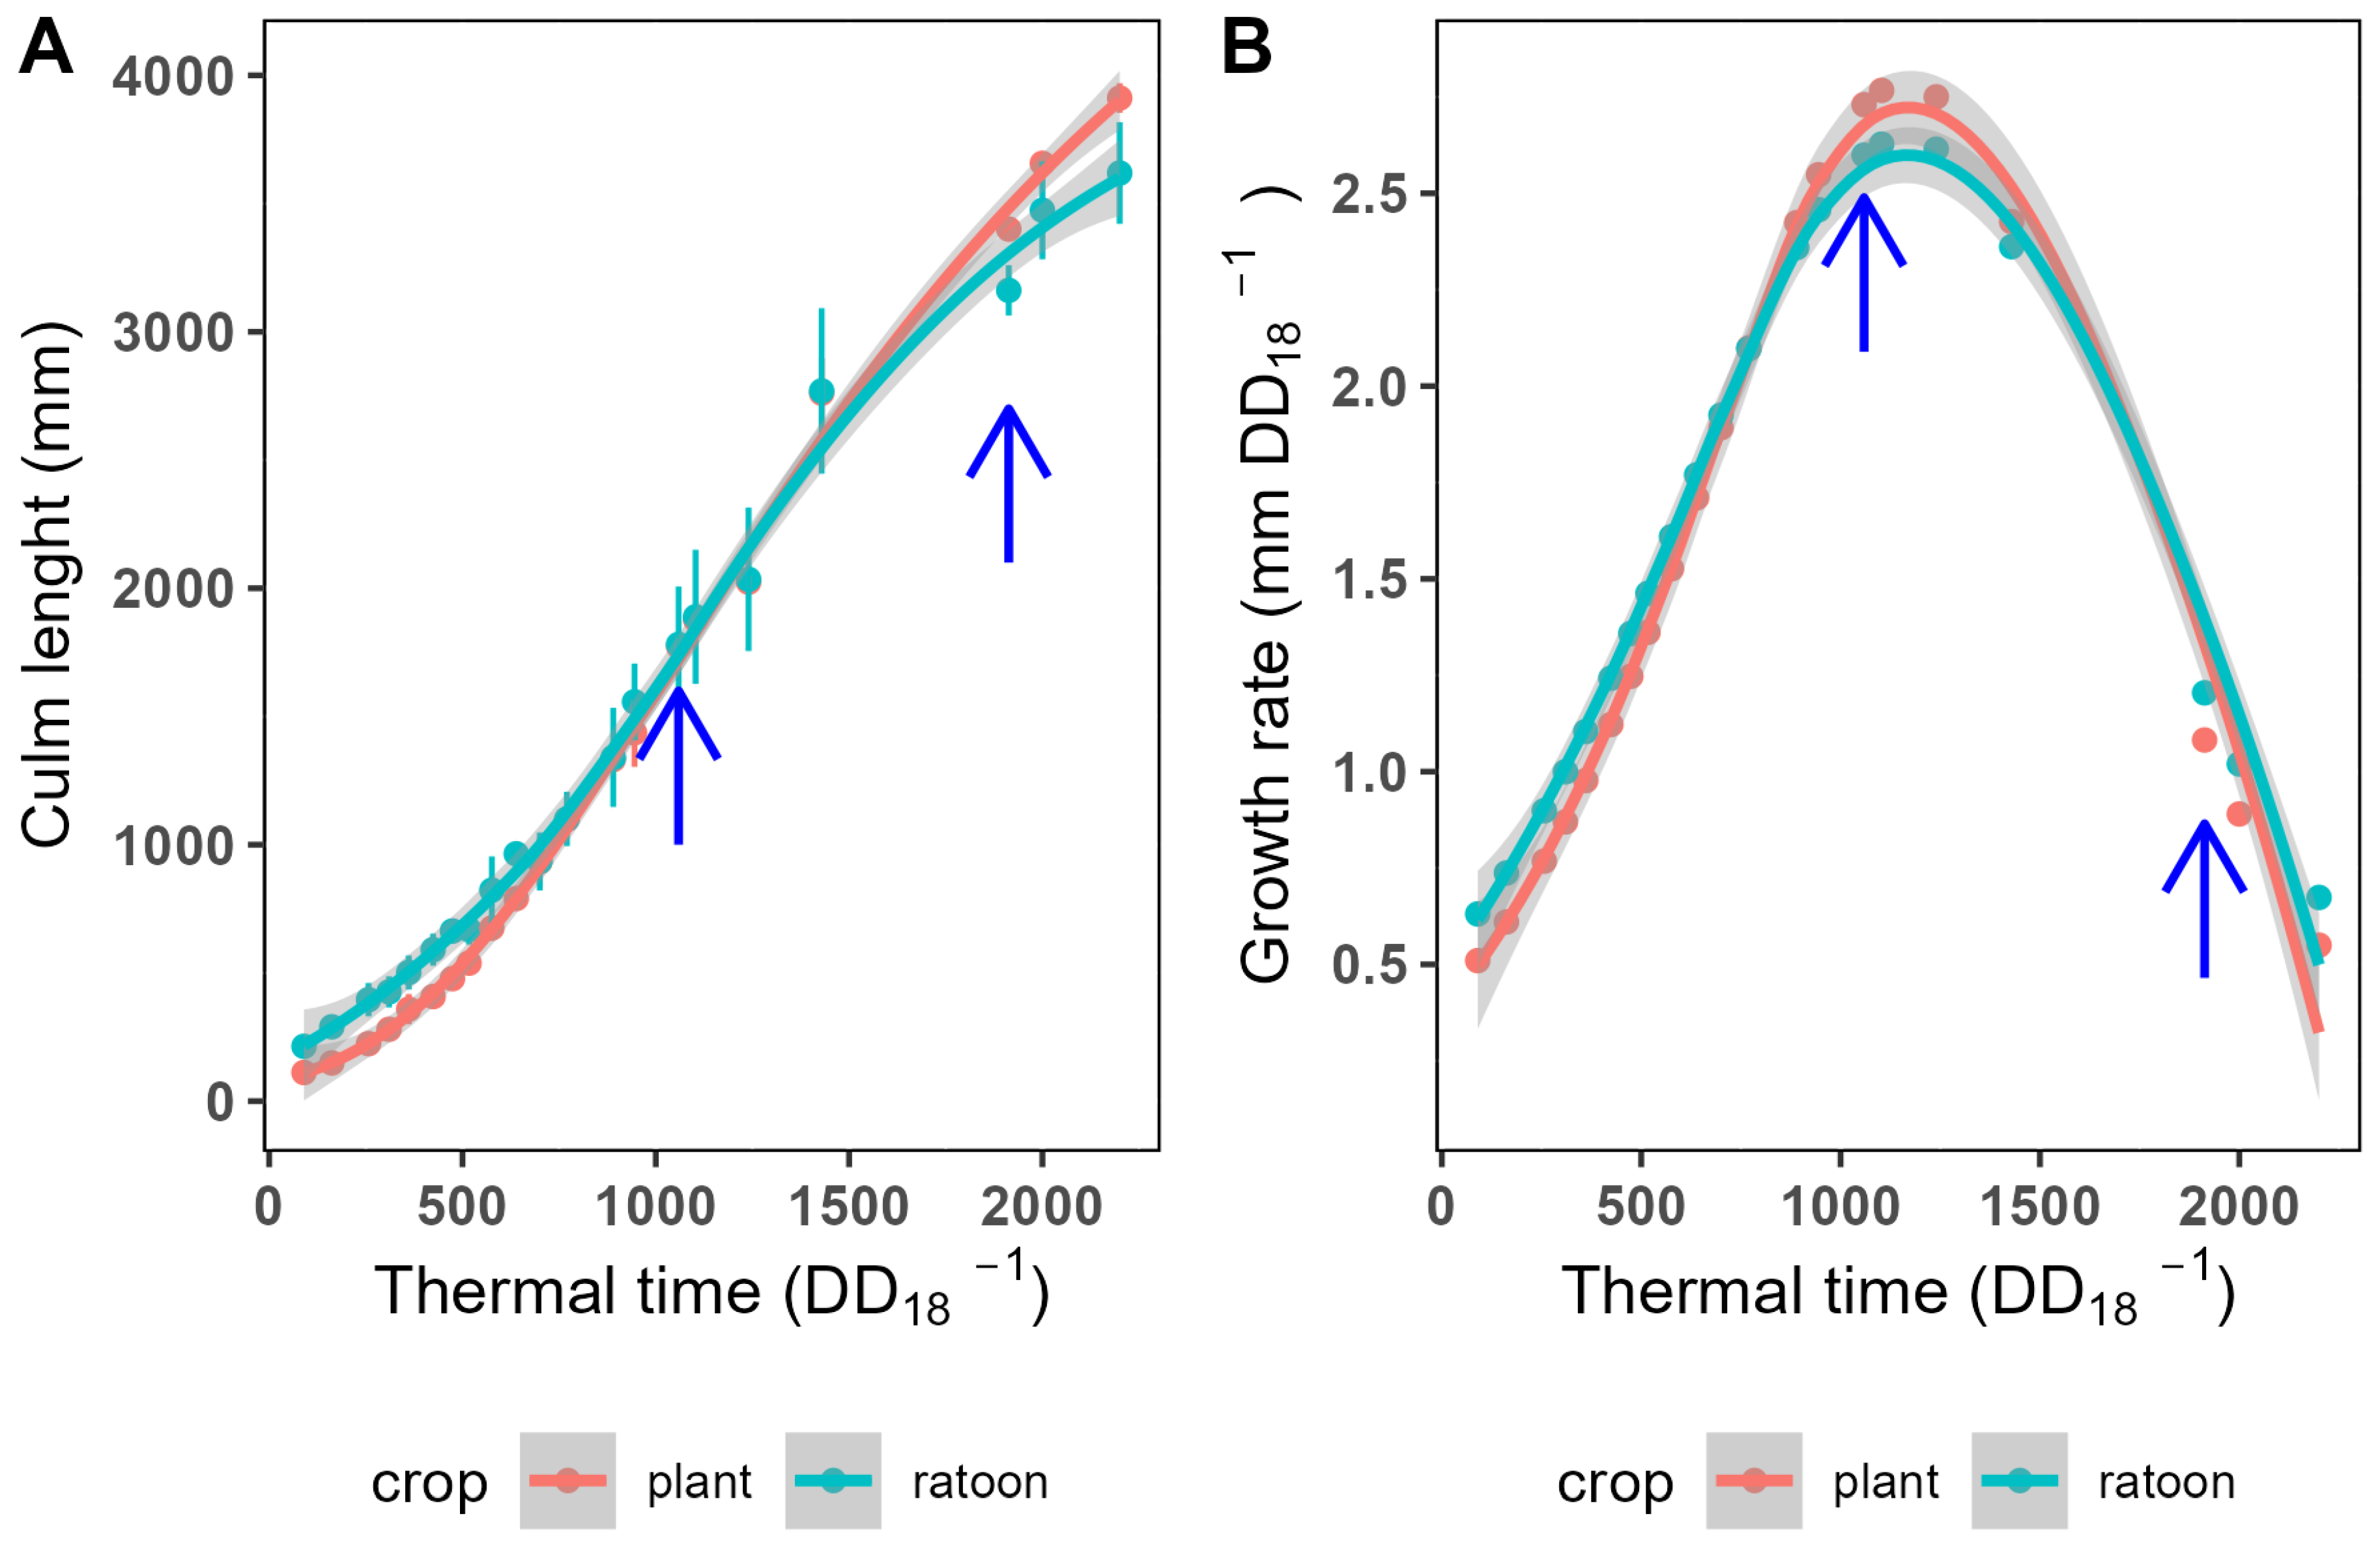
Figure 2.
Internode dry mass accumulation rates at during fast and slow growth during the cropping cycle, and at the peak growth time in the presence of MODDUS (A). The kinetic parameters determined by fitting a logistic function is presented in the table (B). TukeyHSD (p 0.05).
Figure 2.
Internode dry mass accumulation rates at during fast and slow growth during the cropping cycle, and at the peak growth time in the presence of MODDUS (A). The kinetic parameters determined by fitting a logistic function is presented in the table (B). TukeyHSD (p 0.05).
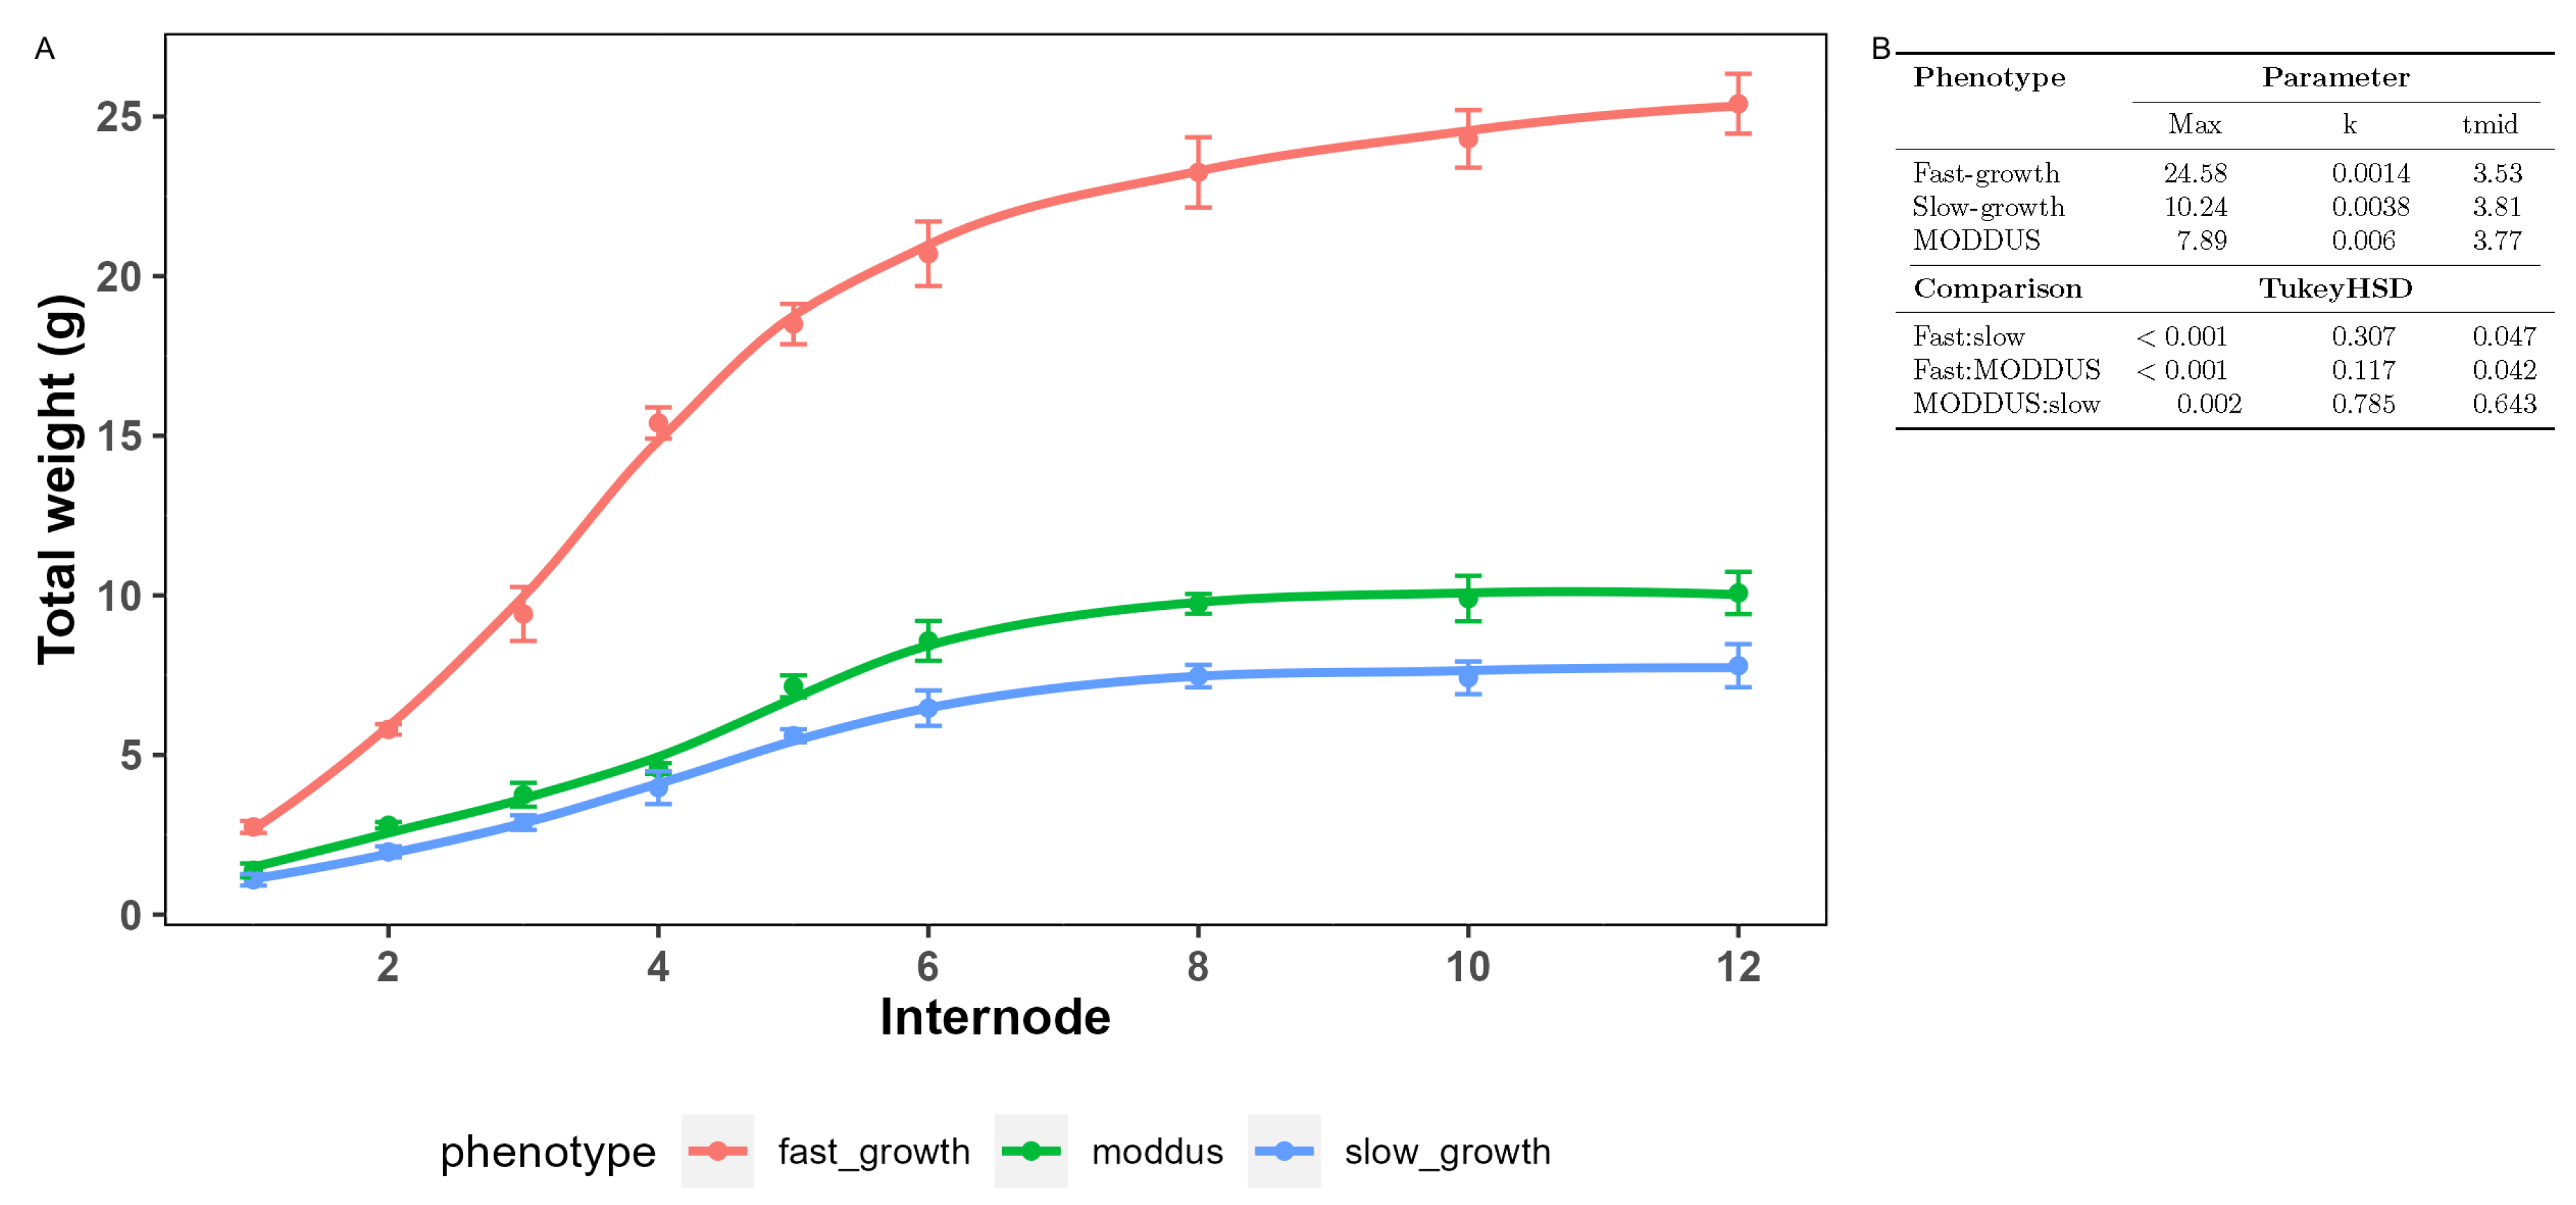
Figure 3.
Biomass accumulation rate in the top internodes of KQ228 during the early season, late season and in the presence of MODDUS. Total biomass(A), cellulose (B), hemicellulose (C), lignin(D) and sucrose (E).
Figure 3.
Biomass accumulation rate in the top internodes of KQ228 during the early season, late season and in the presence of MODDUS. Total biomass(A), cellulose (B), hemicellulose (C), lignin(D) and sucrose (E).
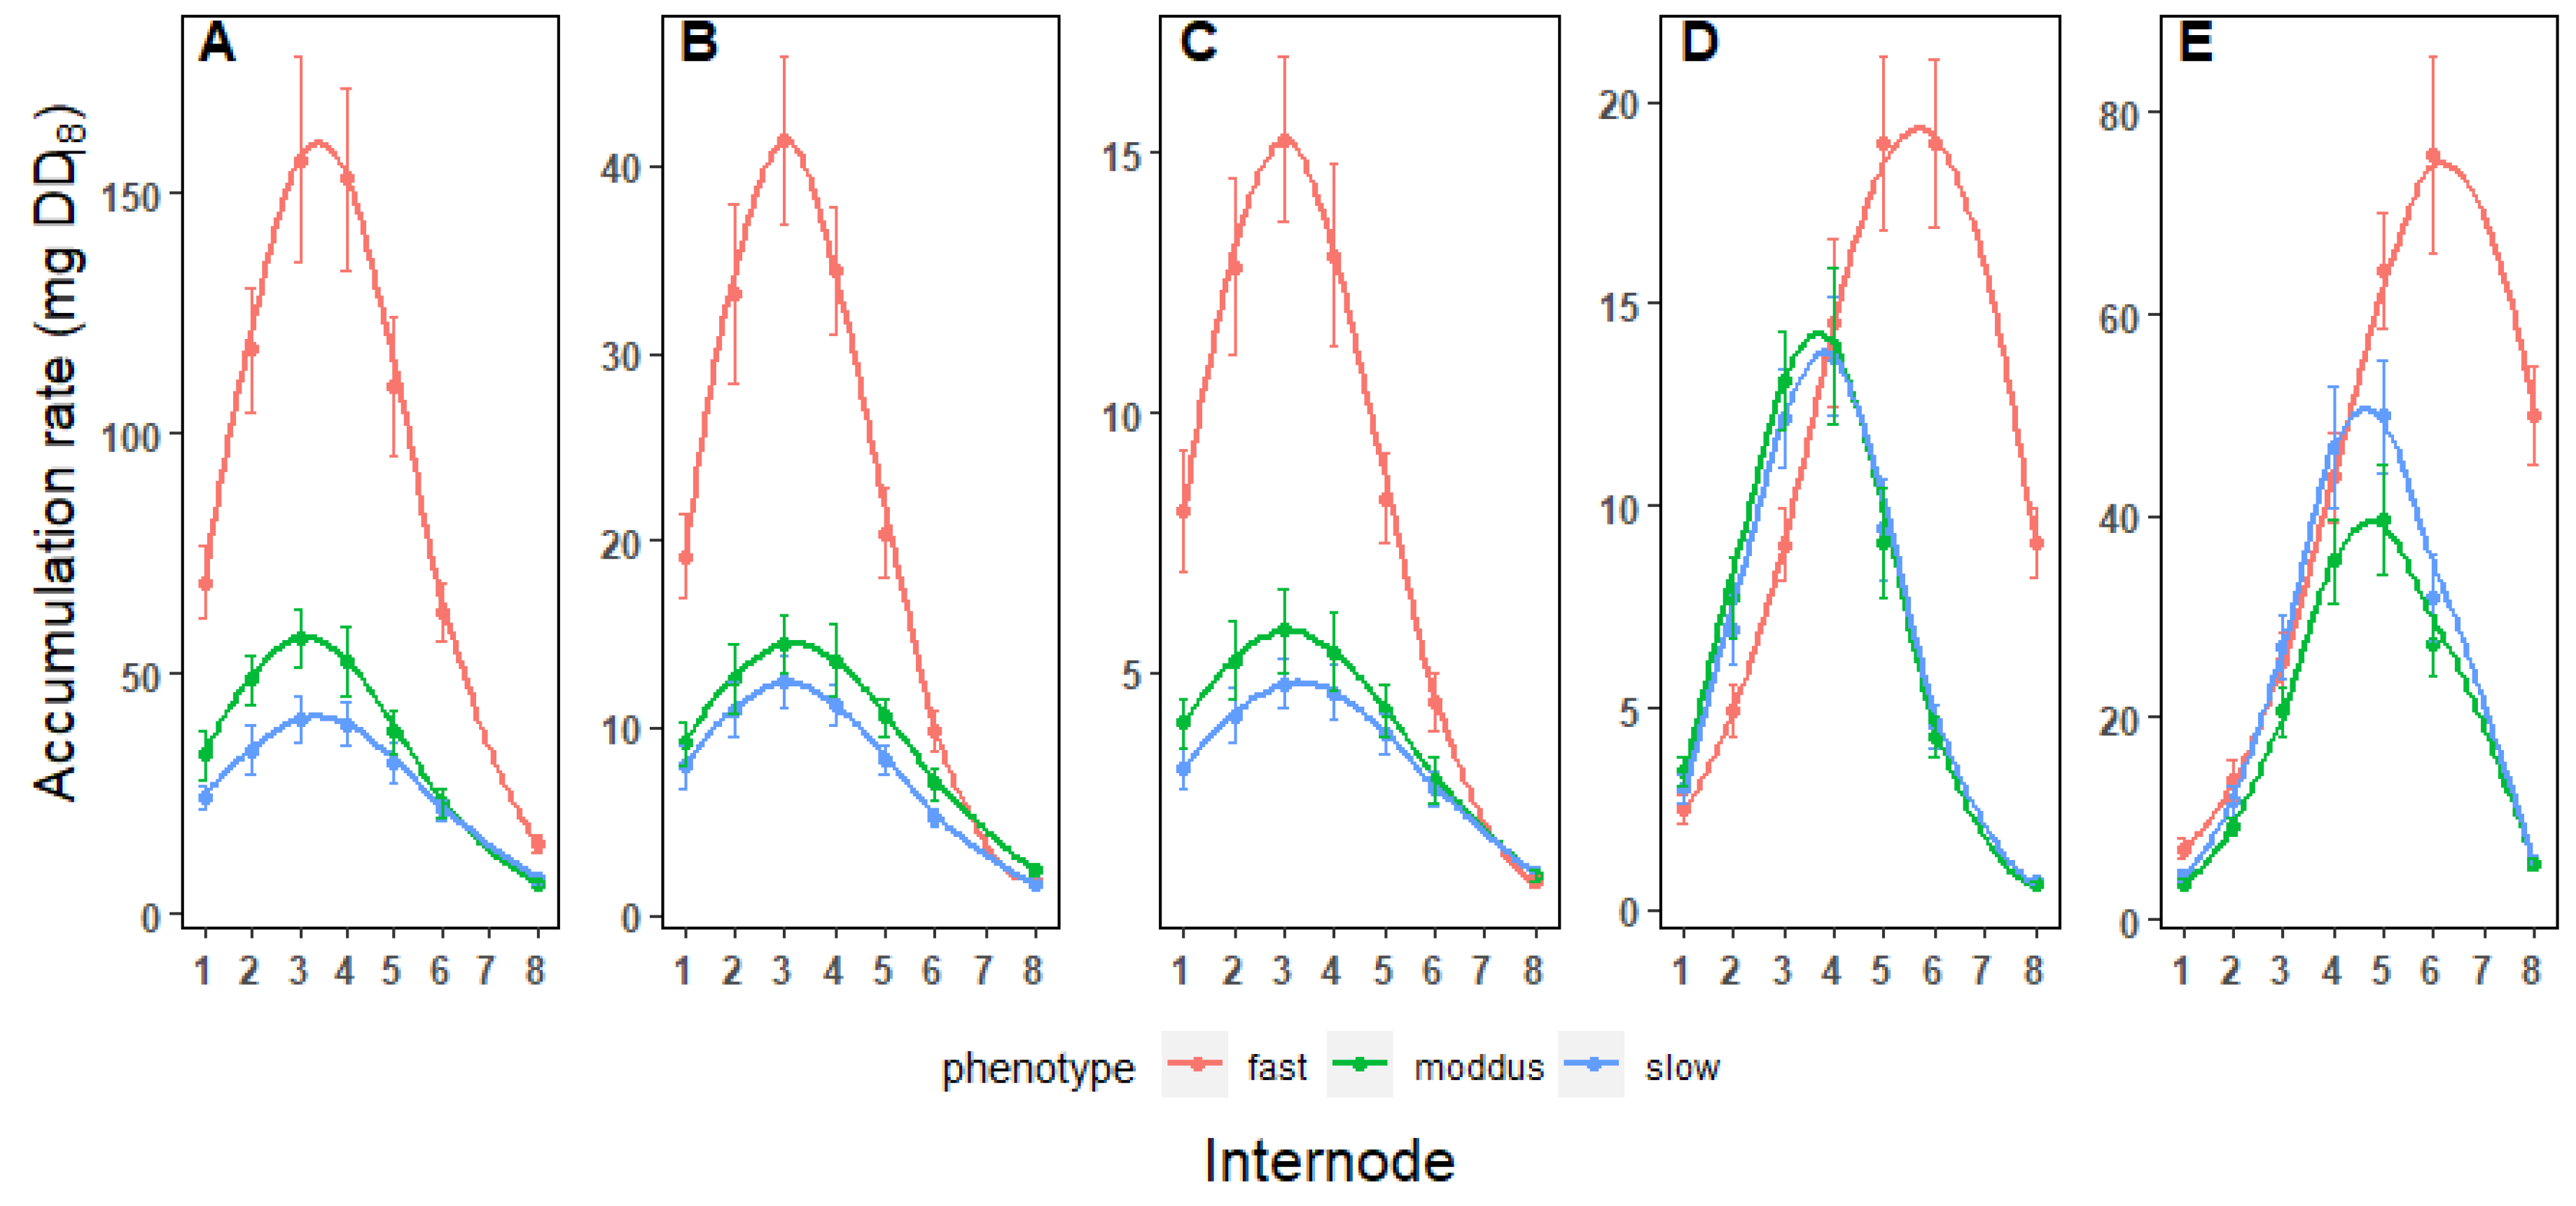
Figure 4.
Comparison of the fluxes into the different biomass components in the top 10 internodes in fast growing (A,B), slow growing (C,D) and in the presence of MODDUS (E,F). Crossover plots of biomass and sucrose accumulation rates (A,C,E) and sucrose and cell wall sugars (hexans and pentans) (B,D,F).
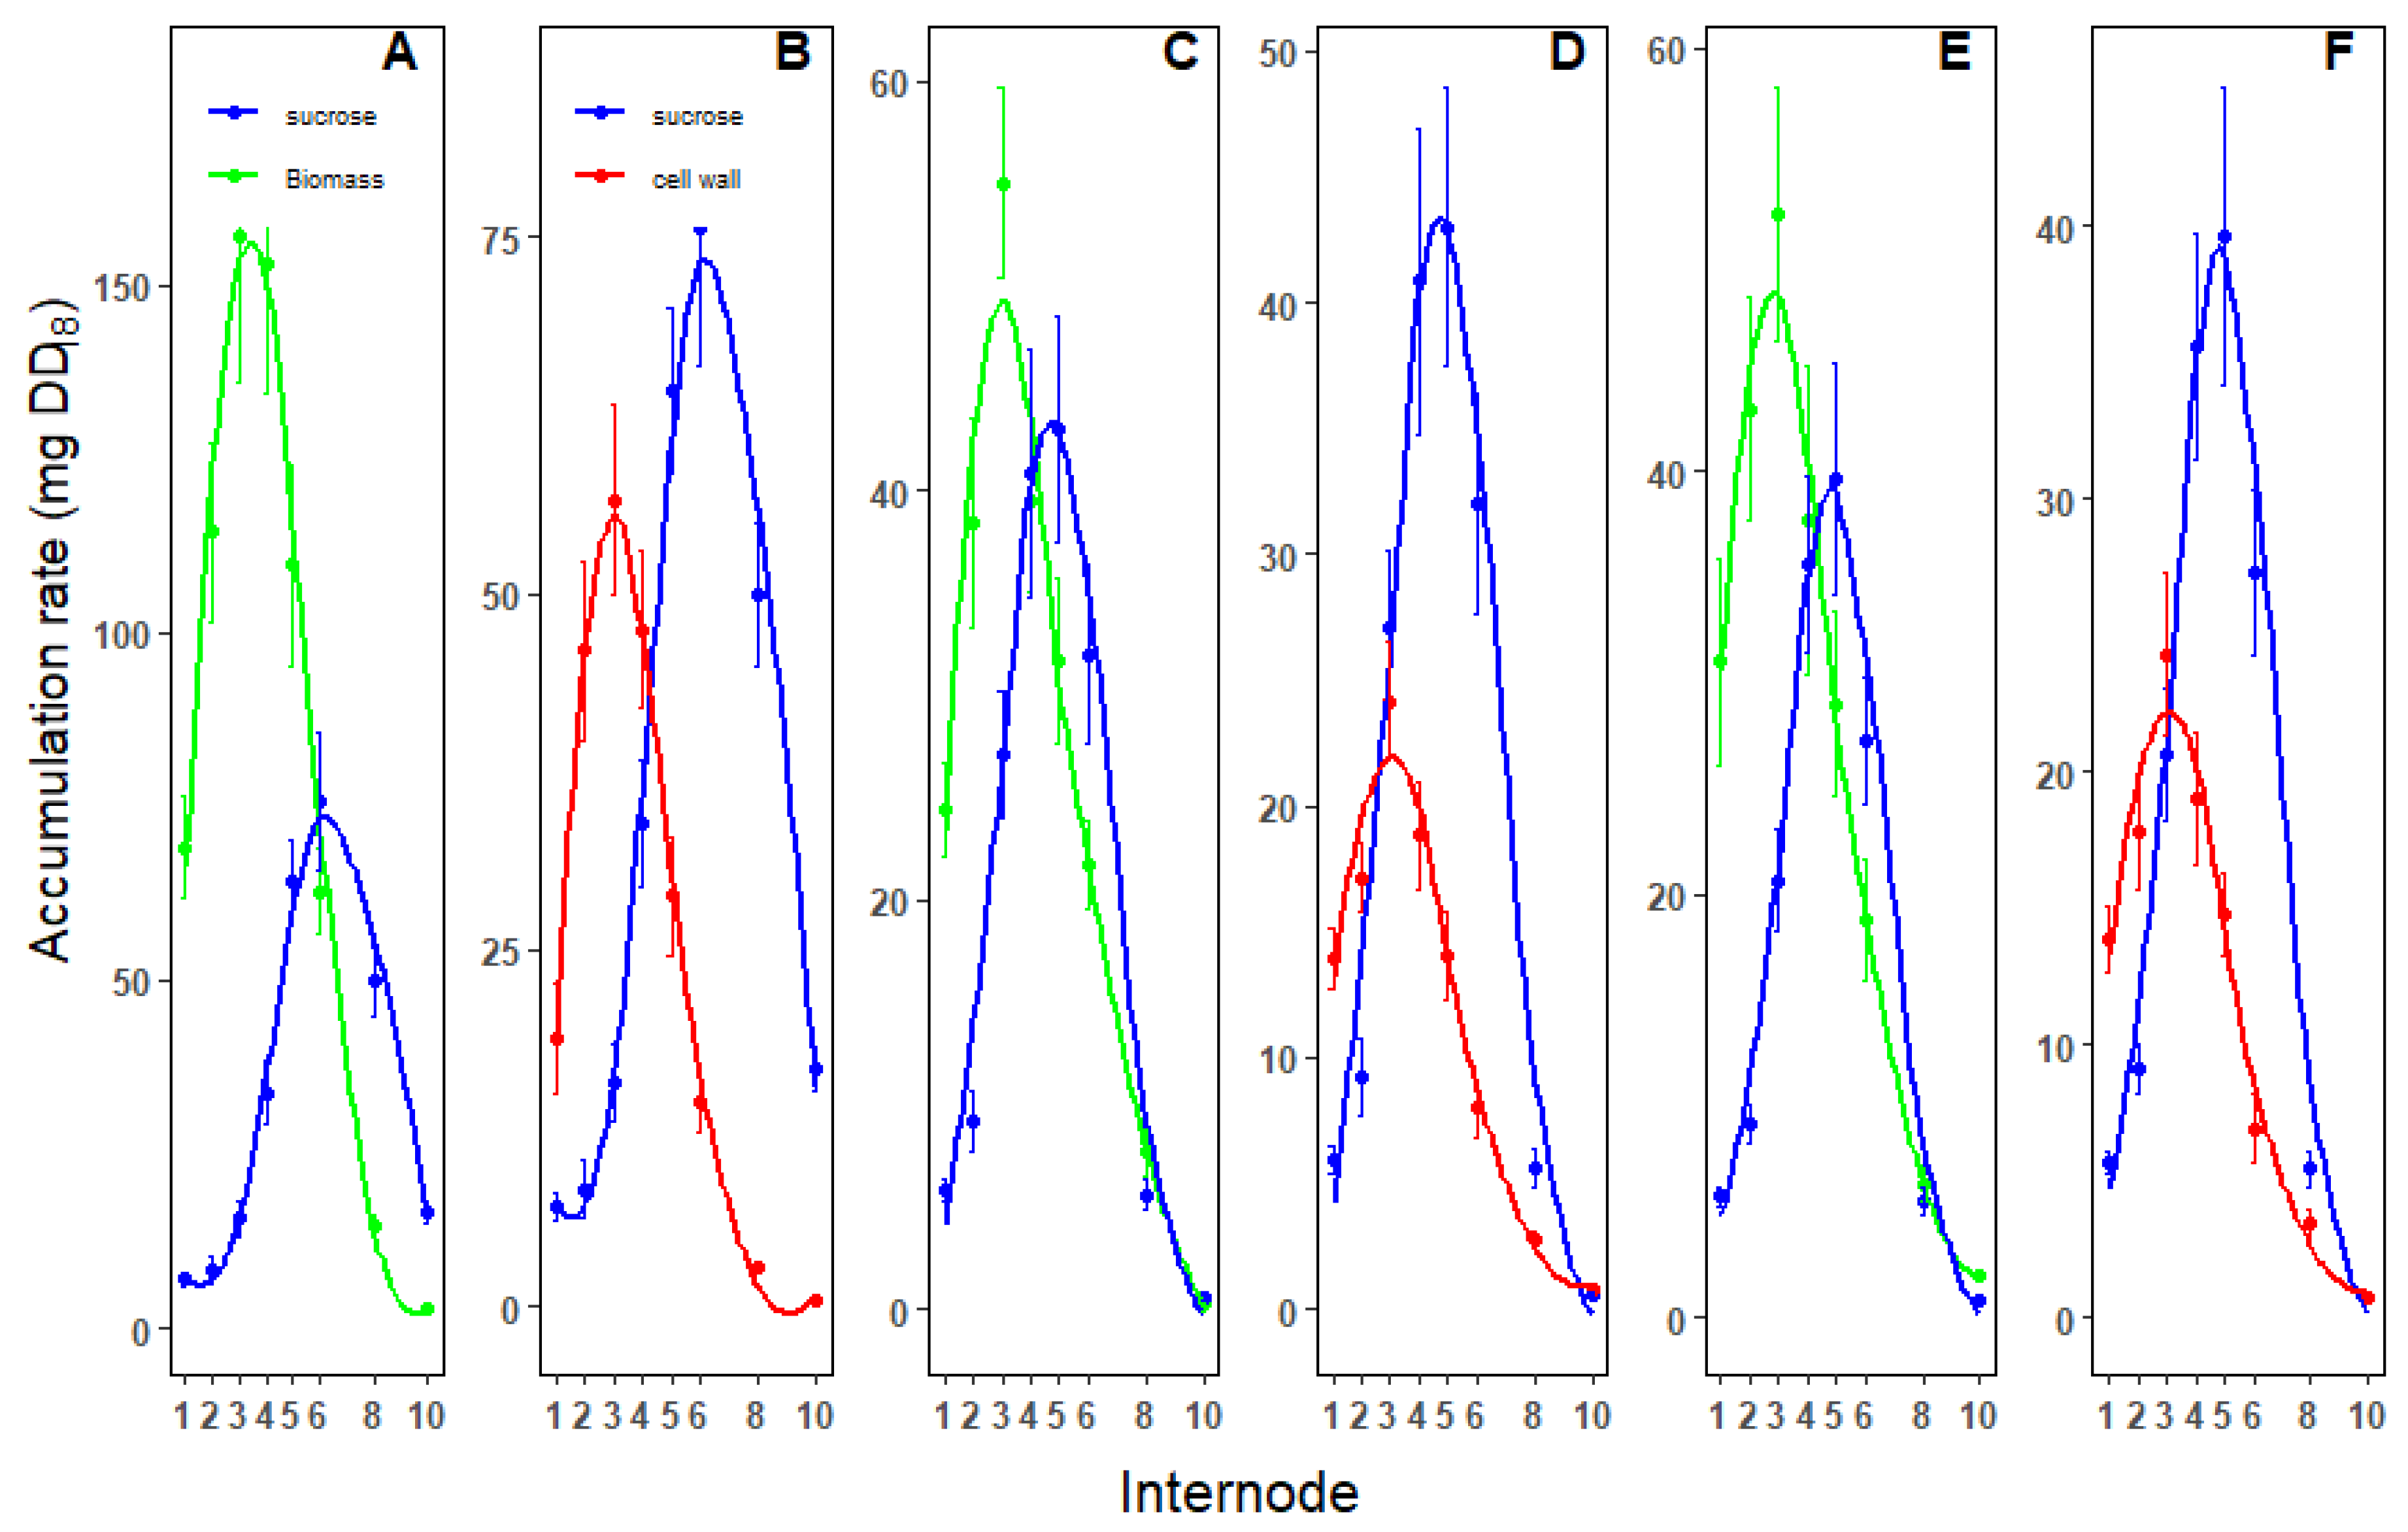
Figure 5.
The metabolome changes in internodes at peak biomass and sucrose accumulation early and late season and in the presence and absence of MODDUS. The log2 fold changes in metabolite content in each metabolic bin were averaged and p-values were adjusted according to Benjamini and Hochberg [31]. Differential abundance of metabolites during early season (fast) growth in internodes at peak biomass accumulation versus peak sucrose accumulation (A), internodes at peak biomass accumulation early and late season (B) and internodes at peak sucrose accumulation in control and MODDUS treated sugarcane (C). The input arrow represents the fold change in total internode biomass.
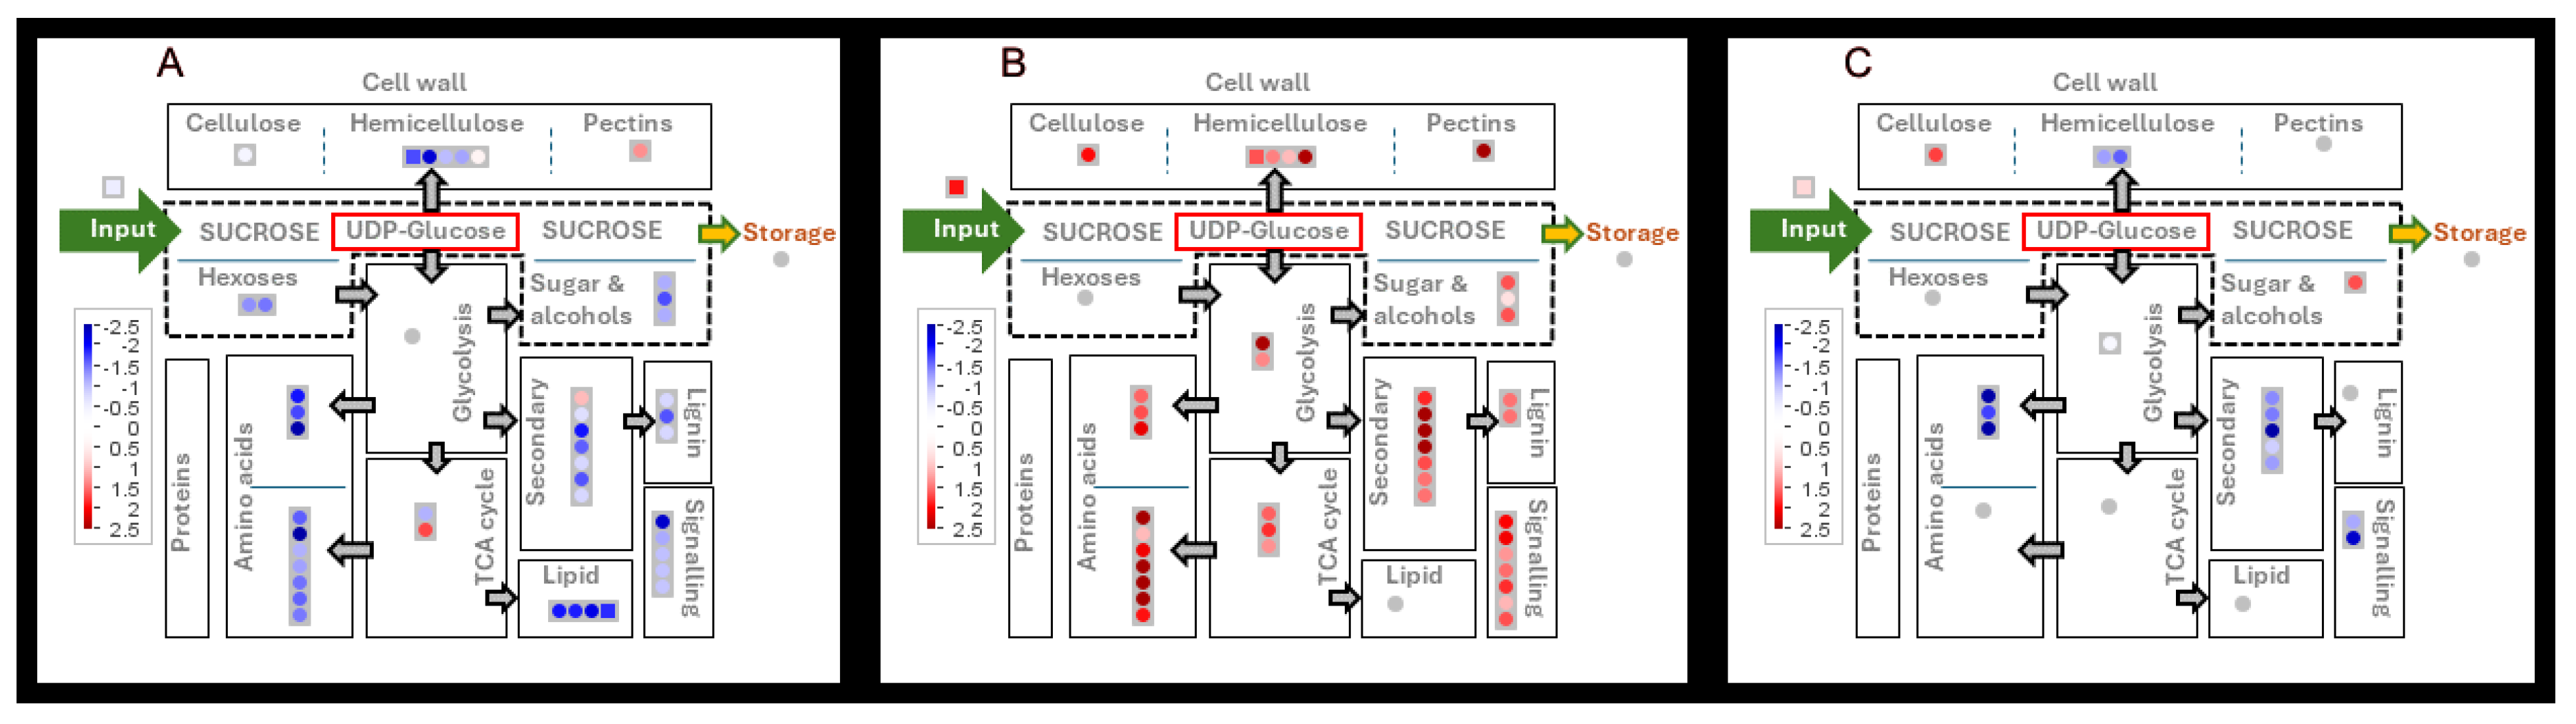
Figure 6.
Allocation of differentially expressed proteins (DEPs) to functional metabolic processes. Only proteins that are significantly differentially expressed at an FDR are represented. The log2 fold changes in protein content in each metabolic bin were averaged and p-values were FDR adjusted.
Figure 6.
Allocation of differentially expressed proteins (DEPs) to functional metabolic processes. Only proteins that are significantly differentially expressed at an FDR are represented. The log2 fold changes in protein content in each metabolic bin were averaged and p-values were FDR adjusted.
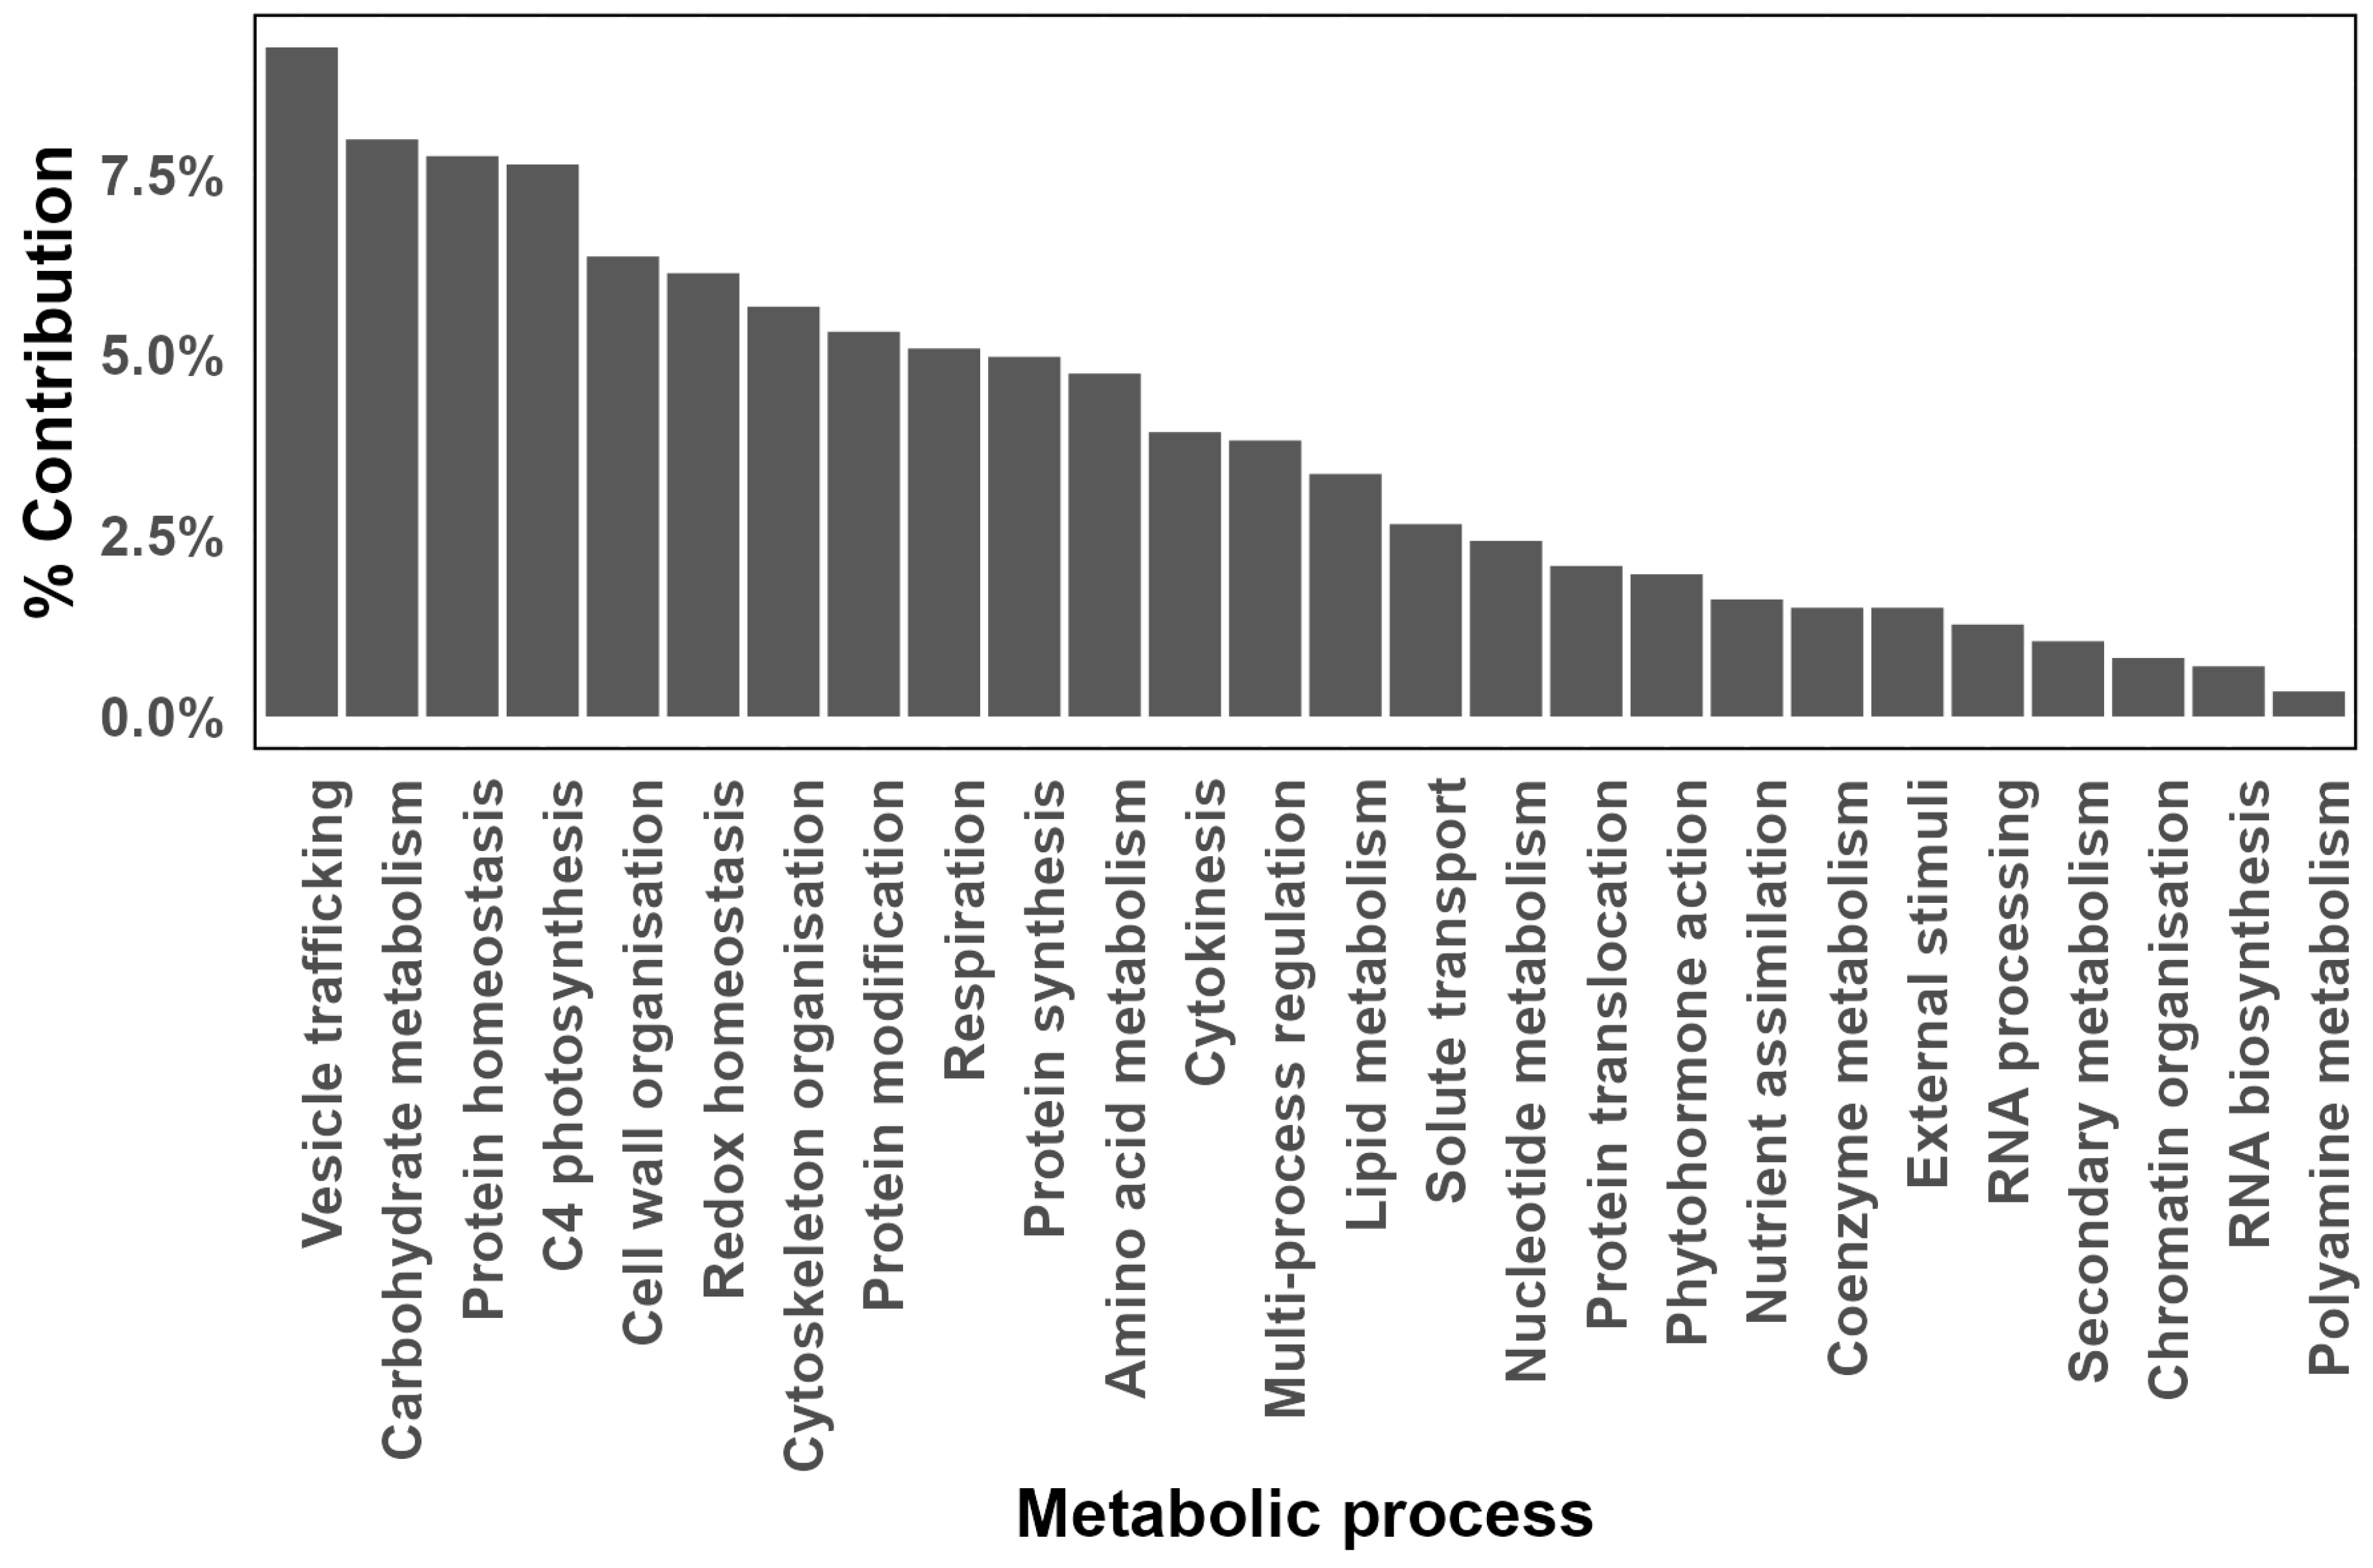
Figure 7.
Volcano plots illustrating the differential protein expression during internode development in the presence and absence of MODDUS. The x-axis represents the statistical differences (-log10(p-value), and the y-axis the log 2 fold change. The dotted horizontal lines indicate the fold threshold. Comparison of the differential protein expression between internodes at peak rate of biomass and sucrose accumulation under normal growth (A), in the presence of MODDUS (B), and between peak sucrose accumulation in the presence and absence of MODDUS (C).
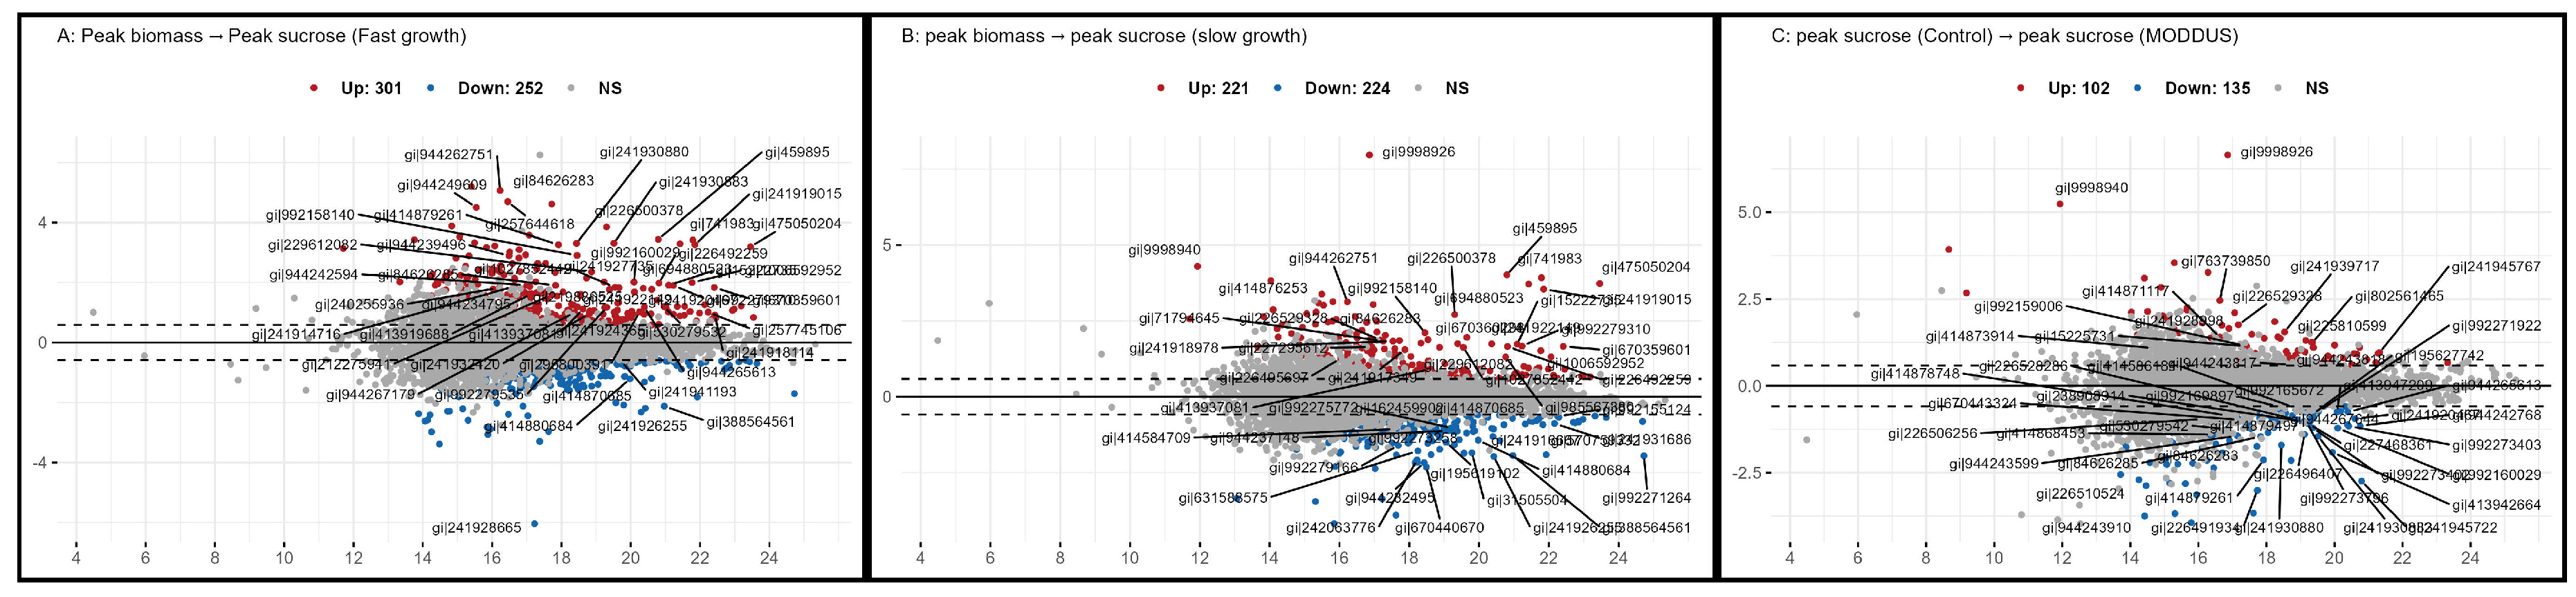
Figure 8.
The proteome changes in internodes at peak biomass and sucrose accumulation in the presence and absence of MODDUS. The log2 fold changes in protein content in each metabolic bin were averaged and p-values were adjusted according to Benjamini and Hochberg [31]. Differential abundance of proteins in internodes at peak biomass accumulation versus peak sucrose accumulation in the absence of MODDUS (A), and in the presence of MODDUS (B).
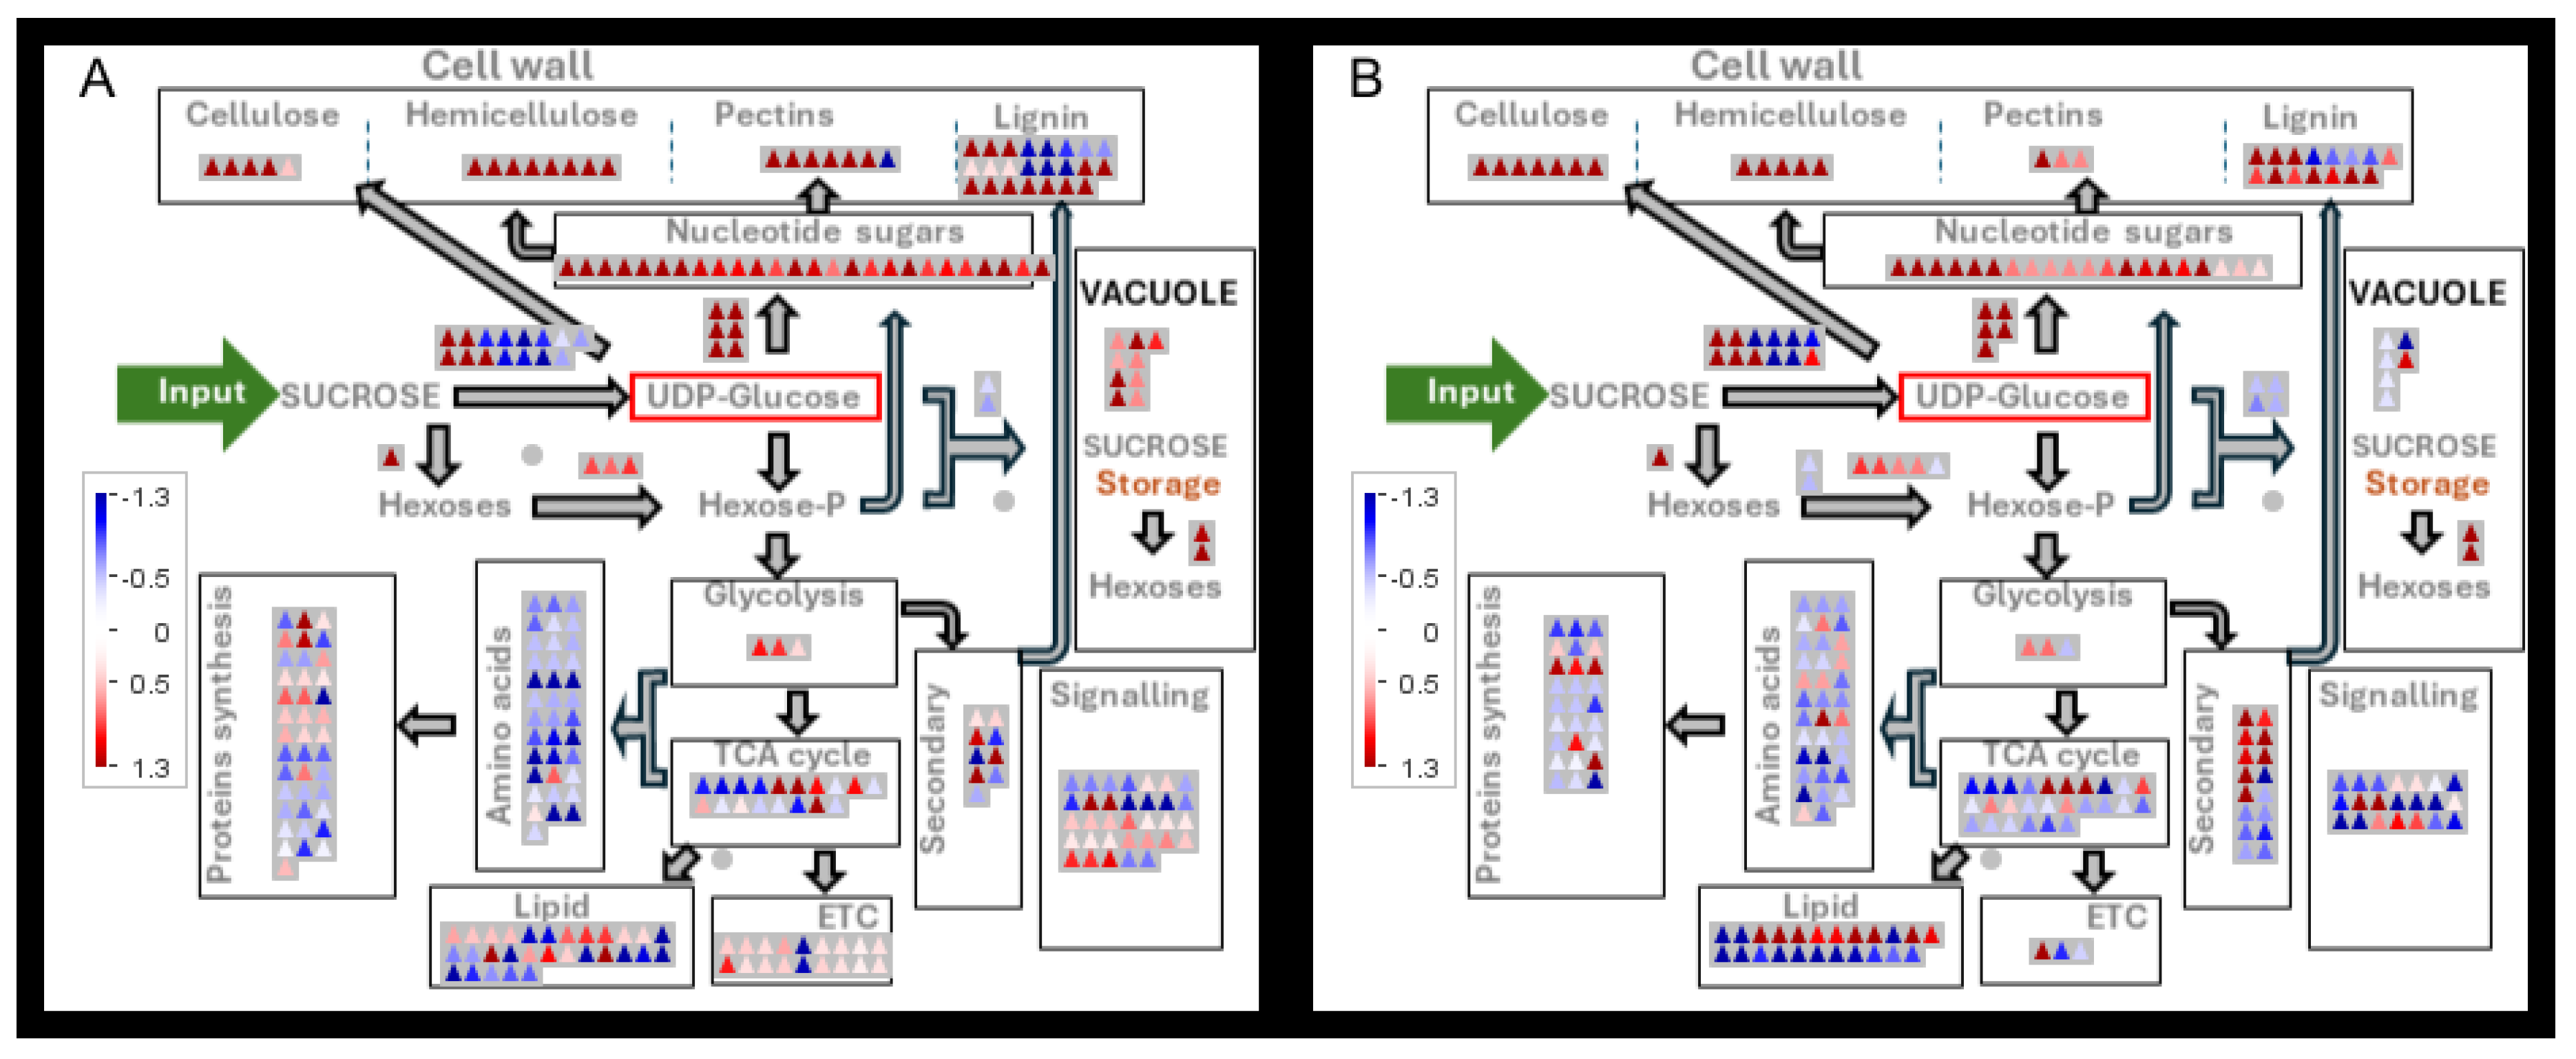

Table 1.
The composition of sugarcane KQ228 internodes during different stages of development and in the presence of MODDUS. sd=standard deviation, nd = not determined
Table 1.
The composition of sugarcane KQ228 internodes during different stages of development and in the presence of MODDUS. sd=standard deviation, nd = not determined
| Component | Phenotype | Parameter 1 | ||
|---|---|---|---|---|
| Max | k | tmid2 | ||
| dry weight | fast_growth | 24.58 a | 0.03a | 3.42a |
| dry weight | moddus | 10.25b | 0.02b | 3.14a |
| dry weight | slow_growth | 7.89c | 0.02b | 3.39a |
| cellulose | fast_growth | 5.44a | 0.03a | 3.05a |
| cellulose | moddus | 2.71b | 0.02b | 3.21b |
| cellulose | slow_growth | 2.22c | 0.02c | 3.06b |
| hemicellulose | fast_growth | 2.36a | 0.03a | 3.03a |
| hemicellulose | moddus | 1.21b | 0.02b | 3.13a |
| hemicellulose | slow_growth | 0.91c | 0.02b | 3.32a |
| lignin | fast_growth | 3.12a | 0.02a | 5.51a |
| lignin | moddus | 1.62b | 0.01b | 3.63b |
| lignin | slow_growth | 1.51b | 0.02b | 3.73b |
| lignocellulose | fast_growth | 10.80a | 0.02a | 3.67a |
| lignocellulose | moddus | 5.98b | 0.03a | 5.42a |
| lignocellulose | slow_growth | 5.06b | 0.03a | 5.65a |
| sucrose | fast_growth | 12.63a | 0.02a | 6.14a |
| sucrose | moddus | 4.82b | 0.03b | 4.71b |
| sucrose | slow_growth | 5.84c | 0.04b | 4.62b |
1 Means in a row without a common superscript letter differ (P=0.05) as analysed by one-way ANOVA and the TUKEYHSD test. Statistical analysis between the phenotypes for each component.
Table 2.
Changes in metabolite profiles between internodes at different stages of development during peak growth (early season) and slow growth (late season).
Table 2.
Changes in metabolite profiles between internodes at different stages of development during peak growth (early season) and slow growth (late season).
| Phenotype 1 | Change 1 | |||
|---|---|---|---|---|
| Stage | Comparison | Up | Down | insignificant |
| Mid season | peak biomass:peak sucrose | 5 | 41 | 28 |
| Mid season:late season | peak biomass:peak biomass | 41 | 2 | 31 |
| Mid season:late season | peak sucrose:peak sucrose | 38 | 2 | 34 |
| Late season | peak sucrose:peak sucrose | 1 | 32 | 41 |
| Peak season MODDUS | peak biomass:peak biomass | 8 | 19 | 24 |
| Peak season MODDUS | peak sucrose:peak sucrose | 3 | 17 | 31 |
1 • A cut-off of 1.2 fold and a FDR (Benjani and Hochberg) of was applied.
Disclaimer/Publisher’s Note: The statements, opinions and data contained in all publications are solely those of the individual author(s) and contributor(s) and not of MDPI and/or the editor(s). MDPI and/or the editor(s) disclaim responsibility for any injury to people or property resulting from any ideas, methods, instructions or products referred to in the content. |
© 2024 by the authors. Licensee MDPI, Basel, Switzerland. This article is an open access article distributed under the terms and conditions of the Creative Commons Attribution (CC BY) license (https://creativecommons.org/licenses/by/4.0/).
Copyright: This open access article is published under a Creative Commons CC BY 4.0 license, which permit the free download, distribution, and reuse, provided that the author and preprint are cited in any reuse.


