
Submitted:
30 May 2024
Posted:
31 May 2024
You are already at the latest version
Abstract
A 2-month incubation study was carried out using two soil types to determine nitrogen mineralization of different inorganic-organic amendments. The following seven treatments (T) were established; T1 = control, T2 = 5 g of dry algae per kg of soil (100%DA), T3 = 136g of agri-mat per kg of soil (100%GA), T4 = 61 g of ground grass per kg of soil (100%GG), T5 = 2.5 g of dry algae + 2.5 g of nitrogen fertilizer (NF) per kg of soil (50%DA50NF), T6 = 50%GA50NF, T7 = 50%GG50NF. Three samples per treatment were drawn at 0, 3, 7, 15, 30, 45, and 60 days for mineral-N determination. A 2-month glasshouse experiment was established afterwards with the following five treatments: T1 = Control, T2 = 50%DA, T3 = 50%GA, T4 = 50%GG, and T5 = 100NF. The results indicated that nitrogen mineralization was significantly higher in organic-inorganic amendments compared to sole organic amendments. The percentage differences ranged from 157% to 195%. The 50%DA treatment increased spinach yield by 20.6% in sandy loam and 36.5% in loam soil. It is difficult to fully recommend the 50%DA treatment without field-scale evaluation, but it is a promising option to be considered.
Keywords:
Integrated Nutrient Management
; Soil Texture
; Incubation study
; Glasshouse experiment
; Spinach yield
1. Introduction
Chemical fertilizers improve soil fertility and crop yields, but their excessive use can lead to global warming, decline in soil organic matter and soil quality, eutrophication in estuaries and contamination of other water bodies through leaching and runoff [1,2,3]. Unlike chemical fertilizers, organic amendments may offer other benefits including improved soil fertility by stimulating nutrient cycle mechanisms through mineralization of nitrogen and phosphorus [4,5,6]. In addition, organic amendments can help in the formation and stabilization of soil aggregates, carbon sequestration, improved microbial population, enzyme activity and improved functioning of the agroecosystem [6,7,8]. These benefits enable longer-term soil health and sustainable agricultural practices, which in turn support increased soil fertility and improved crop yields [6]. According to Diacono and Montemurro [9], soil fertility may be defined as the capacity of the soil to provide physical, chemical, and biological needs for the growth of plants for productivity, reproduction, and quality, which depends on the plant and soil type, land use and climatic conditions.
Nitrogen mineralization is a process that involves transformation (organic matter breakdown by microorganisms) of organic nitrogen into inorganic forms (ammonium (NH4+) and nitrate (NO3-) ions) that are easily absorbed by plants and is therefore essential for soil fertility and plant growth [10,11]. The transformation or breakdown of organic nitrogen compounds such as amino acids and proteins into NH4+ is called ammonification - the first step of the N mineralization process. The second step is called nitrification - a process where NH4+ is oxidized to nitrite (NO2-) by Nitrosomonas bacteria, and then further oxidized to NO3- by Nitrobacter bacteria [10]. The quality and quantity of organic residues (especially their carbon-to-nitrogen ratio) retained or applied in the field as mulch [12] determines the N mineralization rate of any given soil [10,13]. Generally, the rate of nitrogen mineralization for any organic material is governed by many soil factors such as moisture [10,14,15], texture and structure [10], microbial activity [16,17], soil temperature [1,14], soil pH [10], C-to-N ratio [10,17,18], lignin-to-N ratio and Polyphenols-to-N ratio [10,18].
The examination of nitrogen (N) release capacity from organic materials is of utmost importance in the quantification of N supply capacity and fertilizer values of organic amendments [8]. The use of algae biomass as a biofertilizer has been recommended as an efficient technique to increase crop growth parameters and total yields of many plants due to its high nutrient content, especially N [19,20]. Algae biomass is a nutrient-dense soil conditioner that has the potential to increase soil microbial population and enzyme activity, which elevates inorganic forms of nitrogen levels in the soil such as ammonium and nitrate through mineralization [21]. Mgolozeli et al [22], reported that algae residues have the capacity to increase water absorption and water-holding capacity while improving nutrient status and electrical conductivity of agri-mats, making them more beneficial not only as the runoff combating technology but as a soil conditioner. Agri-mats are novel and innovative mulching materials that can increase soil organic matter content [23] and improve crop biomass yields [24]. Agri-mats are solid organic mulch mats derived from agricultural waste other organic waste materials such as grass, weed biomass, municipal sewage sludge, algae residues, bagasse, and forestry waste, created by hot or cold pressing biomass into soil mats. These environmentally friendly mulches serve as effective ground cover while releasing nutrients into the soil. Agri-mats provide remarkable benefits including conserving soil and moisture, regulating temperature, improving soil structure and microbial activity, enhancing fertility, and increasing crop productivity - especially in drier regions. They suppress weeds, reducing herbicide needs and costs. As biodegradable materials, agri-mats decompose over time into a valuable soil organic matter source without hazardous residues, and can eliminate or significantly cut costs for weeding compared to compost. Their utilization recycles agricultural and forestry wastes, aligning with conservation agriculture and land rehabilitation principles [22,23,24].
Although the mineralization rate of algae and many other organic residues have been studies by several authors [4,8,19,20], research on nitrogen mineralization rate of agri-mats is scanty. Moreover, in South Africa and the world at large, there is a paucity of information on the combined effects of agri-mats and inorganic nitrogen fertilizer on soil fertility and crop growth under different soil textural classes.
Soil texture and particle size of organic amendments have direct influence on N mineralization, with finer organic particle sizes resulting in more rapid N release than the larger or coarser particles [10,18]. On the other hand, N mineralization rates are often lower in fine textured (clay) soils compared to coarse-textured soils [25,26]. Generally, soil particle size (texture) has a major influence on soil carbon and nitrogen dynamics [27]. The practice of applying organic amendments such as grass, algal biomass, crop and/or forestry residues etc. in soil could play a significant role in improving not only soil fertility but overall soil health and crop productivity [10,18,19,28,29]. According to Shahid and Al-Shankiti [19], organic amendments increase the efficiency of inorganic fertilizers through positive interactions on soil biological, chemical, and physical properties. The objectives of current study were, i) To investigate nitrogen mineralization rate of selected organic residues (ground agri-mats, dry micro-algal residues, and grass mulch) and their combined effects with lime-ammonium nitrate, 2) To investigate the combined effect of selected organic residues with lime-ammonium nitrate on growth and biomass yield of spinach (Spinacia oleracea L.) in loamy sand and loam soils. Spinach was chosen as a test crop because it is a staple food in South Africa along with maize and is more suitable for pot experiments than maize.
2. Results
2.1. Incubation Study
2.1.1. Sandy Loam Soil from Pretoria
The results from the current incubation study indicates that, the ammonium content was significantly (p < 0.05) higher in the combined treatments (half organic and half inorganic fertilizers) than 100% organic amendment treatments throughout the incubation period (Figure 1). The combined dry algae and chemical nitrogen treatment resulted in significantly (p < 0.05) higher level of nitrogen mineralization (507.9 mgN·kg-1) on day 15. The initial value of 130.08 mg·kg-1 recorded under the same treatment was significantly (p < 0.05) lower compared to other treatment combinations. The amount of ammonium, which was released from all organic amendment treatments without a nitrogen fertilizer remained constant throughout the incubation study, except for the 100% dry algae (Figure 1). Thereafter, it decreased in mineralization rate at day 7 and continued to drop until day 30. The lowest significant (p < 0.05) value of ammonium was recorded under the control treatment at all sampling days.
Similarly with ammonium, the highest significant (p < 0.05) amount of nitrate (619 mg.kg-1) was recorded under the 50% dry algae (DA) and 50% nitrogen fertilizer treatment on day 15 (Figure 2). For the first seven days, all the three combined organic-inorganic treatments (50% DA50NF; 50% GA50NF and 50% GG50NF) remained constant with an average value of 100 mg·kg-1 (Figure 2). Similarly, the other three organic amendments without an inorganic fertilizer remained constant with an average value of 11 mg·kg-1 for the first seven days. The dynamics of nitrate remained the same for all treatments from day seven until the final day of the incubation. Generally, the lowest significant (p < 0.05) nitrate values were recorded under the control treatment while the highest values were recorded in the 50% DA50NF treatment combination (Figure 2).
2.1.2. Loam Soil from Pretoria
The results showed that the organic amendment had a significant (p < 0.05) influence on nitrogen mineralization on loam soil for the first three days of the incubation study (Figure 3). The highest significant (p < 0.05) value of ammonium 237.53 mg·kg-1 was recorded under the 50% DA treatment combination at day 0 but dropped sharply after two days to 122.65 mg·kg-1 and dropped further to about 9.88 mg·kg-1. The combined organic and inorganic fertilizer treatments produced significantly (p < 0.05) higher ammonium value than singular organic fertilizer treatments in day 0 and day 3. From day seven until the day 60, there were no significant (p < 0.05) differences among any of the treatments including the control (Figure 3).
Similarly with the ammonium, the results showed that nitrate content was significantly (p < 0.05) higher in the combined treatments (half-organic and half-inorganic fertilizers) than in the 100% organic amendments treatments throughout the incubation period (Figure 4). The highest significant (p < 0.05) value of nitrate (511 mg·kg-1) was recorded under the 50% DA50NF treatment combination during the final day of the incubation study. On the other hand, the lowest significant (p < 0.05) nitrate value of 41.4 mg·kg-1 on the last day was recorded under the control treatment. Significant nitrate addition to the soil due to the mineralization process was only observed in the combined organic amendment treatments (Figure 4).
The results from the incubation study show that at the peak of nitrogen mineralization (day 15 in Figure 1), the amount of ammonium ions released under the 50% DA50NF in the sandy loam soil was 178% higher compared to the 100% DA treatment. For the 50% GG50NF and 50% AG50NF treatment combinations, the percentage difference in ammonium ions was 192% and 184% respectively. On the other hand, the amount of nitrate ions released at the peak (day 15 in Figure 2) under the 50% DA50NF was 159% higher compared to the 100% DA treatment. For the 50% GG50NF and 50% AG50NF treatment combination, the percentage difference in nitrate amount was 175% and 189% respectively, compared to their sole organic amendments’ counterparts. In the loam soil, the peak of nitrogen mineralization occurred at day zero (Figure 3) for ammonium and day 60 for nitrate (Figure 4). The amount of ammonium that was released under the 50% DA50NF was 186% higher compared to the 100% DA treatment. Meanwhile for the 50% GG50NF and 50% AG50NF treatment combination, the difference in nitrate ions was 184% and 157% respectively, compared to their sole organic amendments’ counterparts. On the other hand, the amount of nitrate that was released at the peak under the 50% DA50NF was 161% higher compared to 100% DA treatment. For the 50% GG50NF and 50% AG50NF treatment combination, the percentage difference in nitrate ions was 167% and 153%, respectively. The percentage increase of ammonium and nitrate ions above was calculated using equation (1):
Where is the value of ammonium or nitrate ions produced under organic-inorganic amendments (50% DA50NF, 50% GG50NF and 50% AG50NF) during peak nitrogen mineralization. While is the value of ammonium or nitrate ions released under sole organic amendments (100% DA, 100% GG and 100% GA).
2.2. Glasshouse Experiment
The combination of organic-inorganic amendments and sole application of inorganic fertilizer had a significant (p < 0.05) effect on all measured spinach crop growth parameters in both soil types. Figure 5 show spinach growth during the third week after planting, with higher biomass on the right (plants on loam soil) and lower biomass on the left (on sandy loam soil). The lowest plant height values were recorded during the second week after planting (2WAP) in both soil types (6.3 cm for sandy loam and 17.7 cm for loam soil) under the control treatment (Figure 6). On the hand, the tallest plants were recorded under combined treatment of nitrogen fertilizer and dry algae (50% DA) treatment during the eighth week after planting (8WAP), with plant height values of 34.3 cm and 41.3 cm in sandy loam and loam soil respectively. In sandy loam soil (Figure 6a), 50% DA treatment consistently produced significantly (p < 0.05) taller plants compared to other treatments at all measuring times, except during the eighth week after planting (8WAP). The difference between 50% DA and 150kgN·ha-1 (100NF) treatment at 8WAP was insignificant, with the former producing 2 cm taller plants compared to the latter (Figure 6a). The control treatment produced significantly (p < 0.05) lower plant height values in both sandy loam and loam soils at all four (2, 4, 6 and 8WAP) measuring times (Figure 6).
Organic-inorganic amendments and inorganic fertilizer alone had a more pronounced effect on spinach growth in the last month (6WAP and 8WAP) in both soil types. Spinach leaves were significantly (p < 0.05) longer in pots with loam soil than in pots with sandy loam soil (Figure 7). In sandy loam soil, the control treatment produced significantly (p < 0.05) lower leaf length values at 6WAP (8 cm) and 8WAP (10.2 cm), compared to all other treatments. The highest significant values of spinach leaf length were observed under the 50% DA treatment at 6WAP (18 cm) and 8WAP (25 cm). There were no significant differences between 50% GG (13 cm), 50% GA (13 cm) and 100NF (13.2 cm) treatments at 6WAP (Figure 7).
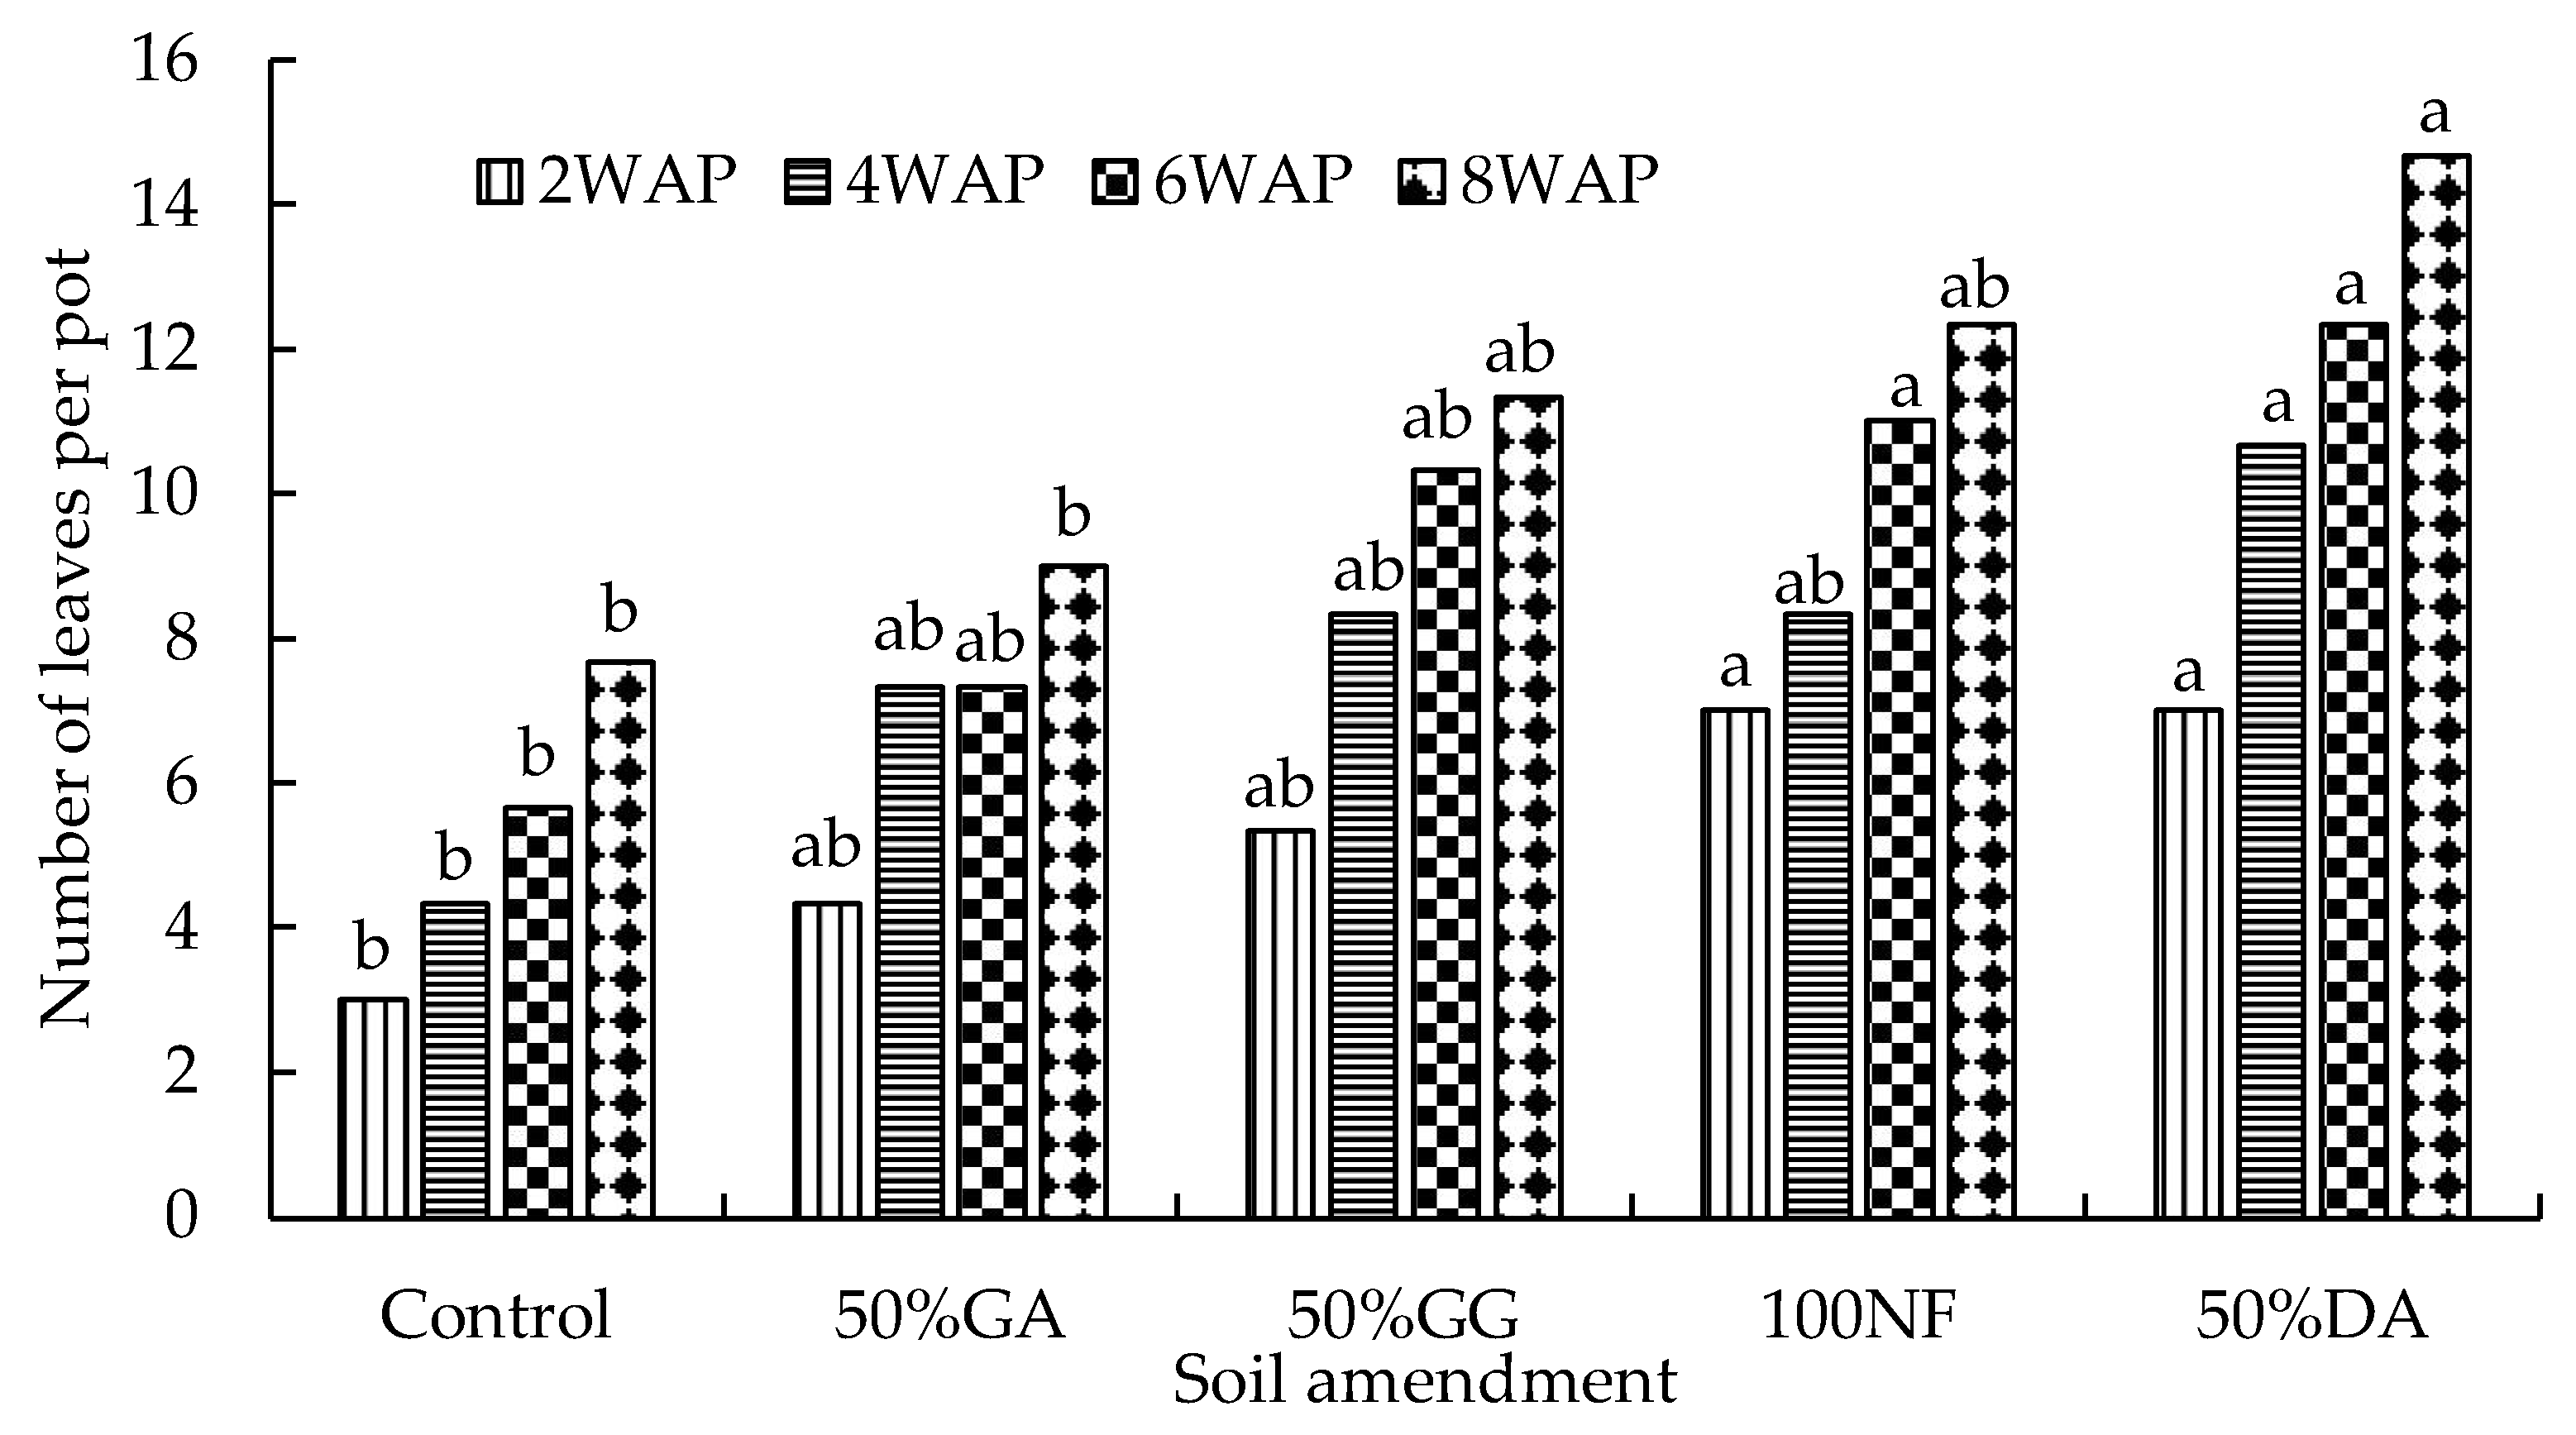
The differences between the three treatments were again not significant at 8WAP. The leaf length values for the 50% GG, 50% AG, and 100NF treatments were 16.7 cm, 17.3 cm and 21.2 cm, respectively. Similarly with leaf length, the number of spinach leaves in the sandy loam soil was significantly (p < 0.05) influenced by organic-inorganic amendments (Figure 8). Although the number of leaves were generally higher in the 50% GG and 50% GA treatments than in the control, the differences were not statistically significant between the two treatments combinations at 2, 4 and 6WAP. The number of leaves recorded in the 50% DA treatments was 50% higher than the number of leaves recorded under the control (Figure 8).
Similarly with all measured plant growth parameters, the inorganic-organic amendments and sole compound fertilizer had a significant (p < 0.05) effect on spinach biomass yield in both loam soil and sandy loam soil (Figure 9). Spinach biomass yield was generally higher in pots filled with loam soils than in pots with sandy loam soils (Figure 9). Both soil types had the lowest significant (p < 0.05) values under the control treatment, 22.4 grams per pot for sandy loam and 70.3 grams per pot for loam soil. Spinach yield in loam soil was more than three times higher than in sandy loam soil under the control treatment. The highest performing (50% DA) treatment produced significantly (p < 0.05) higher yield in both soil types i.e. 72.2 grams per pot for the sandy loam and 202.1 grams per pot for the loam soil. The biomass yield of spinach was 129.9 grams per pot higher in loam soil than in the sandy loam soil. No significant differences were observed between the 50% GA (136.2 grams per pot), 50% GG (136.6 grams per pot), and 100NF (139.7 grams per pot) treatments in loam soil. However, there were significant (p < 0.05) differences between 50% GA (22.9 grams per pot) and 100NF (58.7 grams per pot) in sandy loam soil (Figure 9). The results from the current study suggest that the 50% DA is the best performing treatment for producing higher biomass yield since it consistently outperformed the other treatments even in terms of plant height, leaf length and number of leaves regardless of soil type.
3. Discussion
3.1. Nitrogen Mineralization of Organic-Inorganic Amendments
The current incubation study aimed to investigate nitrogen mineralization of two contrasting soil types over a period of two months. Although the loam soil was more fertile compared with the sandy loam soil (Table 2), the incubation study results show that the nitrogen (N) mineralization rate (both ammonium and nitrate) was higher in a sandy loam soil (Figure 1, Figure 2, Figure 3 and Figure 4). The higher mineralization rate in sandy loam is mostly ascribed to the differences observed in clay content (9.3% vs 24.3%), and least to the differences in C:N ratio (9.22 vs 11.50) compared to the loam soil (Table 2). The results from the current study are in line with the findings of Hassink et al [26] and Bechtold and Naiman [25] who reported that N mineralization rates are often lower in fine textured (clay) soils compared to coarse-textured soils. Moreover, according to Qiu et al [30], organic matter of a clay soil is more resistant to decomposition than that of a sandy soil. The higher clay content in loam soil has many micropores, which may limit access and movement of microorganisms to organic residues for nitrogen mineralization [2,26,27,30]. Singh et al [31] assessed three different soil clay fractions (SCFs) on the decomposition of wheat residues at 22 °C over a 36-day incubation period. The authors found that allophanic SCFs had the least microbial activity due to higher proportion of micropores (75%).
The C:N ratio of both soil types was generally considered low since it was below 20 [32]. Soils with low C:N ratio could accelerate the process of microbial decomposition of organic matter and nitrogen mineralization, which may not be conducive for carbon sequestration [33]. On the other hand, combining organic residues with low C:N ratio and those with high C:N ratio could create a conducive environment for carbon sequestration [6,9,33]. Bengtsson et al [17], reiterated that soils with a high C:N ratio are characterized by rapid immobilization of nitrogen while soils with low C:N ratio are characterized by slower immobilization and a surplus of available ammonium. The gradual decline in the ammonium mineralization observed between day 0 and day 7 in the loam soil (Figure 3) could be attributed to nitrogen immobilization [34]. Immobilization is the opposite of mineralization and the difference between the two is referred to as net mineralization [2,34]. Apart from clay percentage and C:N ratio, there are various factors which could have contributed to the differences in mineral N dynamics between the two soil types and overall fertility status. According to Malobane [34], soil fertility is a complex term that is influenced by a combination of factors such as soil texture, soil reaction, soil depth, nutrient content, soil microbial activity, organic matter content and composition, and availability of potentially toxic substances.
The biochemical composition and physical structure of organic residues may also influence overall soil fertility and crop productivity [35]. The C:N ratio of organic amendments play a significant role in the mineralization process as observed in the current study [10,18]. Dried algae had a significantly (p < 0.05) higher mineralization rate possibly due to its lower C:N ratio (6.6) as seen in Table 3, compared to ground agri-mat (184.0) and ground grass (75.7). These findings concur with the results by Masungu et al [36], who reported that soil treated with fresh white clover had a significantly higher mineralization rate due to its significantly low C:N ratio of 6.3 (0.03) compared to other organic amendments they studied such as polar tree compost, vegetable, fruit and yard manure waste and fresh dairy cattle manure, which had C:N ratios of 11.4 (0.18), 9.1 (0.52) and 12.3 (0.64), respectively. Low C:N ratio is an indicator of high-quality organic matter, which supports and sustains microorganisms for N mineralization and other microbial activities that promote plant growth [36]. Organic amendments with high N content and low C:N ratios, like algae and farmyard manure, can mineralize sufficient N to satisfy the growth demands of plants [6].
Among the three selected organic amendments (dried algae, ground agri-mat and ground grass), ground agri-mat had the lowest nitrogen mineralization rate (Figure 1 and Figure 2) possibly due to higher C:N ratio (Table 3). The low N mineralization of agri-mats could also be attributed to high lignin content since they were manufactured from forestry residues (18, 24]. However, Mgolozeli et al [22], concluded that incorporation of algae into the agri-mat technology could improve the functionality and value of agri-mats for agricultural purposes. The findings of the current study (Figure 1 and Figure 2) validate this suggestion mainly due to high nutrient content and low C:N ratio of algae residues (Table 3). The combination of organic amendments with different C:N ratios can help synchronize N mineralization with plant N demands [6]. Moreover, the incorporation of both algae and guinea grass during agri-mat fabrication process may improve the C:N ratio of agri-mat, including nitrogen, phosphorus content, and many other essential elements for plant growth. The ground grass was generally the second performing organic amendment which had significantly higher ammonium and nitrate content in most days when measurements were made (Figure 1 and Figure 4). Table 3 shows that ground grass has double the amount of nitrogen and phosphorus compared with ground agri-mat. Moreover, the ground grass had higher content of aluminum and iron than dried algae (Table 3). In both soil types, when organic and inorganic fertilizer were applied together, the mineralization rate was significantly higher compared to treatments where organic amendments were solely applied. This was observed in similar studies conducted by Abbasi and Khaliq [8] and Ogundijo et al [37]. The findings of this study suggested that inorganic amendments increase the efficiency of organic fertilizers and vice versa [2,29], through positive interactions on soil nitrogen mineralization [38].
4.2. The Effect of the Organic-Inorganic Amendment on Plant Growth
The effect of organic-inorganic soil amendments on spinach growth and biomass yield was evaluated on two contrasting soil types for eight weeks. The treatment combination of 2.5 grams of dried algae and 2.5 grams of N per kilogram of soil (50% DA50NF) consistently outperformed all other organic-inorganic amendments in both soil types. This includes significantly (p < 0.05) higher values in plant height (Figure 6), leaf length (Figure 7), number of leaves (Figure 8) and biomass yield (Figure 9). Generally, loam soil produced better plant growth parameters and biomass yield compared to the sandy loam soil (Figure 5, Figure 6, Figure 7, Figure 8 and Figure 9). Figure 5 is a visual demonstration of the differences in vegetative growth of spinach during the third week after planting. The spinach with higher biomass on the right was planted on loam soil and the one with lower biomass on the left was planted on sandy loam soil (Figure 5). The observed and measured higher biomass yield under the loam soil is mainly attributed to better soil fertility compared to the sandy loam soil (Table 2). For example, total nitrogen and potassium was about three higher in the loam soil compared to the sandy loam soil. In addition, total carbon and phosphorus content was approximately four-times and six-times higher in the loam soil respectively, than in the sandy loam soil (Table 2). Moreover, the cation exchange capacity (CEC) of the loam soil was about four times higher in the loam soil, with approximately double the amount of calcium and magnesium compared to the sandy loam soil (Table 2). The higher cation exchange capacity of the loam soil could be attributed to the higher clay content, which was more than two-times higher compared to that of the sandy loam soil. The high negative charge of clay surfaces and organic matter improves CEC, which is important for retaining and making nutrients available to plants [9].
In addition to the differences in the chemical and physical properties between the two soil types, the three organic amendments varied significantly in elemental composition (Table 3). This may have influenced overall soil fertility and crop productivity [35], hence the 50% DA50NF treatment combination produced significantly (p < 0.05) higher biomass yield in both soil types compared ground grass and ground agri-mat treatments (Figure 9). Due to low elemental composition, agri-mat residues were outperformed by the other two organic amendments in terms of nitrogen mineralization (Figure 1, Figure 2, Figure 3 and Figure 4) and spinach plant growth (Figure 6, Figure 7, Figure 8 and Figure 9). However, agri-mat can be favored under field conditions (especially as a mulching material) because they can produce better biomass yield than grass material. Mgolozeli et al [24] conducted field experiments to investigate agri-mat and grass mulch effect on spinach biomass yield in two different locations (one with sandy loam and another with loam soil type) for two consecutive winter seasons. The findings from the study indicated that full agri-mat (100% AG) mulch treatment produced 33% more spinach biomass yield than the full grass mulch during the first season under the loam soil, with no percentage differences during the second season. For the sandy loam soil, the authors reported that agri-mat produced spinach biomass yield that was 20% and 32% higher during the first and second season respectively, compared to the grass mulch cover [24]. Agri-mats are innovative pro-smallholder farmers’ permanent mulch that promote better soil quality and food security under conservation agriculture [23]. The current study corroborates the findings by Mgolozeli et al [22] who concluded that incorporation of algae into the agri-mat mulching technology could improve the functionality and value of agri-mats for agricultural purposes. This is based on the higher elemental composition (Table 3) and better nitrogen mineralization of algae residues observed in the current study compared to other selected organic residues (Figure 1, Figure 2, Figure 3 and Figure 4).
Agri-mats were initially designed, tested, and proved to be effective mulching materials that conserve soil moisture and prevents soil loss through erosion [39,40]. Further research and innovations on agri-mat mulching technology indicated that agri-mats functionality, durability, and agricultural value can be improved by incorporating agro-chemicals (chemical fertilizers, herbicides, and pesticides) during the fabrication process [22,40]. Therefore, agri-mat can suppress weed growth, reduce pest and insect infestation while combating soil erosion and conserving soil moisture [22,40]. Moreover, the incorporation of agro-chemicals and different organic residues which vary in C:N ratios (i.e algae, manures, and grasses) may promote sustainable environment and combat climate change [6,9,22]. This is because of the synergistic relationship between organic amendments and chemical fertilizers [2,29], through positive interactions on soil nitrogen mineralization and carbon sequestration [6,33,38]. Chemical fertilizers and other agro-chemicals get lost easily through leaching in coarse-textured soil under field conditions [29]. Since the current results were obtained in a pot experiment with monitored irrigation, the net loss of N through leaching was minimized even under the sandy loam soil. However, further incubation studies, glasshouse (pot) experiments, and field experiments are needed to determine the point at which all organic N is mineralized from different organic residues over longer periods. This will help to predict when to apply inorganic amendments to the soil under field conditions before planting. Moreover, this may also assist to quantify the correct amounts of agro-chemicals and appropriate organic amendments quantities during the agri-mat mulch fabrication process.
4. Materials and Methods
4.1. Incubation Study
A 2-month incubation study was conducted to investigate nitrogen mineralization of organic-inorganic and organic amendments alone under two contrasting soil types, in a laboratory at Agricultural Research Council – Natural Resources & Engineering campus in Pretoria, Gauteng, South Africa. The current study adopted and modified the methods described by Abbasi and Khaliq [8] and Shahbaz et al [35]. Briefly, soil samples were collected from two different agro-ecological zones (Durban, which represents Humid and Pretoria, which represents Semi-arid region) in November 2018 at a depth of 0 – 0.15 m, using a spade. The detailed textural analyses and physico-chemical properties of the soils from each site are shown in Table 1 and Table 2, respectively. The soils were air-dried by spreading samples on the floor of a well-ventilated room for a week to minimize changes caused by microbial and chemical reactions [11,41] and passed through a 2-mm sieve. A 100 g sample of soil was transferred into 250 mL transparent plastic containers with perforated lids (to allow gaseous exchange) and treated with required quantities of dry algae (DA), ground agri-mat (GA), ground grass (GG), and combined with LAN as a nitrogen fertilizer (NF). The scientific name of the grass used is Megathyrus maximus, commonly known as Guinea grass. The algae residue used was green algae (Chlorophyta) which was collected from a wastewater treatment plant in Durban after oil extraction.

Table 1.
Soil textural analyses of the sandy loam and loam soils.
| Sand | Silt | Clay | ||||||
|---|---|---|---|---|---|---|---|---|
| Sampling site | Very Coarse (mm) 2–1 |
Coarse (mm) 1–0.5 |
Medium (mm) 0.5–0.25 |
Fine (mm) 0.25–0.1 |
Very fine (mm) 0.1–0.05 |
Coarse (mm) 0.05–0.02 |
Fine (mm) 0.02–0.002 |
Clay (mm) < 0.002 |
| Sandy loam | 4.00% | 2.00% | 17.20% | 37.50% | 15.60% | 5.60% | 8.70% | 9.40% |
| Loam | 3.90% | 3.00% | 9.70% | 10.20% | 11.00% | 12.00% | 25.90% | 24.30% |
Table 2.
Physico-chemical properties of loam and sandy loam soil sampled at the top 15 cm depth.
| Soil Properties | Pretoria | Durban |
|---|---|---|
| Physical characterization | ||
| Textural class | Sandy loam | Loam |
| Clay % | 9.30% | 24.30% |
| Chemical characterization | ||
| pH in H20 (1:2.5) | 6.20 | 6.50 |
| Available P (mg/kg) | 3.11 | 19.97 |
| Total N (%) | 0.064 | 0.20 |
| Total C (%) | 0.59 | 2.30 |
| C:N ratio | 9.22 | 11.50 |
| Exchangeable bases | ||
| Ca (meq/100 g) | 220.00 | 436.00 |
| Mg (meq/100 g) | 156.70 | 301.00 |
| K (meq/100 g) | 73.40 | 212.70 |
| Na (meq/100 g) | 74.00 | 84.40 |
| CEC (meq/100 g) | 12.00 | 46.00 |
The application rates were calculated to provide an estimated amount of 150 kgN·ha-1. For example, assuming a bulk density of 1200 kg·m-3 for both soil types and using a soil sampling depth of 0.15 m, the 5 grams of algae (with 6.8%N) was equivalent to applying 340 mg of nitrogen per kilogram of soil. Similarly, the ground grass (with 0.56%N) and ground agri-mat (0.25%N) were calculated accordingly to achieve the 340 mg of nitrogen per kilogram soil or 150kgN·ha-1. Thus, 2.5 grams of dried algae, 61 grams of ground grass and 136 grams of ground agri-mat were applied per kilogram of soil to achieve 150 kgN·ha-1, respectively. Finally, the 50% treatment was calculated by dividing each organic material or compound fertilizer by two. Thus, the following treatment were achieved.
- T1 = control, (no amendments)
- T2 = 5 g of dry algae per kg of soil (100% DA),
- T3 = 136 g of ground agri-mat per kg of soil (100% GA),
- T4 = 61 g of ground grass per kg of soil (100% GG),
- T5 = 2.5 g of N using Lime Ammonium Nitrate (LAN) + 2.5 g of dry algae per kg of soil (50% DA50NF),
- T6 = 50% GA50NF
- T7 = 50% GG50NF
Phosphorus and potassium were applied to the treatments at a rate of 90 mg P2O5 kg−1 and 45 mg KCL kg-1 soil in the form of superphosphate and potash, respectively. After treatment application, the soil in all the units was irrigated with deionized water to 80% field capacity instantly, and every third day thereafter. Three samples were drawn per treatment at 0, 3, 7, 15, 30, 45, and 60 days for mineral N (nitrate and ammonium) content determination. Therefore, the incubation study consisted of seven treatments, seven sampling dates (at day 0, 3, 7, 15, 30, 45, and 60), and three replications per sampling date, to make 147 experimental units (250 mL plastic containers) per sampling site at the beginning of the experiment.
The experiment was laid out in a complete randomized design in an incubator set at 25 °C for 60 days (8 weeks). Soil water content was monitored throughout the incubation days according to Abbasi and Khaliq (2016) as follows; every second day the soil moisture content was checked and was adjusted back to 80% field capacity by weighing the mass of each plastic container when the water loss was greater than 0.05 g. The deficit was added using deionized water to maintain the initial soil moisture content. During this process, precautionary measures were taken to avoid soil disturbance, through either stirring or shaking. Nitrate and ammonium were determined using a method described by Mulbry et al [15]. Briefly, a 10 g sample was extracted with 100 mL 2 M KCL on a rotary shaker for 30 minutes. Extracts were filtered using a 0.45 µm membrane and the pH of the filtrates was adjusted to 3-5 with H2SO4 as needed for preservation. Filtrates were stored frozen until further analysis. Ammonium and nitrate were determined calorimetrically by flow injection analysis (Lachat Instruments, Milwaukee, WI).
4.2. Glasshouse Experiment
The glasshouse experiment was conducted for two months (8 weeks) at Agricultural Research Council – Vegetable and Ornamental Plants Institute in Roodeplaat, 35 km North-East of Central Pretoria, to determine the effect of organic-inorganic amendments on spinach growth and biomass yield. Soil was collected from each site, during the same time as incubation study and transferred into plastic pots. The length of the glasshouse experiment was informed by the results obtained in the incubation study as well as the test crop (spinach grown in pots). The pots had a height of 25 cm, top diameter and bottom diameter of 20 cm and 15 cm, respectively. Each pot was treated with required quantities of dried algae (DA), ground agri-mat (GA), ground grass (GG), and nitrogen fertilizer (NF) using the following treatments for each soil type;
- T1 = control,
- T2 = 2.5 g of dry algae (DA) per kg of soil + 75 kgN·ha-1 using LAN (50% DA),
- T3 = 68 g of ground agri-mat (GA) per kg of soil + 75 kgN·ha-1 using LAN (50% GA),
- T4 = 30.5 g of ground grass (GG) per kilogram of soil + 75 kgN·ha-1 using LAN (50% GG),
- T5 = 150 kgN·ha-1 using LAN (100NF).
The five treatments shown above were selected based on the results observed in the incubation study, which indicated that the combination of organic and inorganic amendments may lead to the release of ammonium and nitrate. The sole application treatment of organic materials did not lead to mineralization after two months of incubation (Figure 1, Figure 2, Figure 3 and Figure 4), hence the singular treatments of organic amendments were omitted for the 2-month glasshouse experiment. Each treatment was replicated three times in a complete randomized design. Therefore, 15 pots per site (soil type) were established to make a total of 30 experimental units (pots). Table 2. shows the initial characterization of the three organic materials used.
Spinach (Spinacia oleracea L.) (cultivar - Fordhook Giant) was used instead of maize as the test crop for the glasshouse experiment due to the limited space for root growth in pot experiments. Three spinach seeds were planted per pot and all the pots were irrigated immediately after planting and soil moisture was monitored afterwards. The pots were weighed to determine the deficit and distilled water was used irrigate the soil to 80% of field capacity every third day. In each case, seedlings were thinned to one seedling per pot two weeks after sowing. Weeds were removed manually every other week while pesticides were not applied due to no signs of pests and diseases throughout the experiment. The temperature in the glasshouse was regulated between 28 and 25 °C for day and night, respectively. Growth parameters (plant height, leaf length and number of leaves) were measured and recorded at every two weeks until harvest on the eighth week.
4.3. Statistical Analysis
Analysis of variance (ANOVA) was carried out to test the effects of spinach development and yield parameters using JMP 14.0 statistical software (SAS Institute, Inc., Cary, NC, USA). The mean comparison was performed using the least significant difference test (LSD) at α = 0.05.
5. Conclusions
The results from the incubation study indicate that at the peak of nitrogen mineralization, the amount of ammonium that was released from organic-inorganic amendments under sandy loam soil ranged from 178% to 195% higher than that released from their singular organic amendments. For nitrate ions, the amounts that was released ranged from 159% to 189% at the peak of N mineralization. On the other hand, the amount of ammonium and nitrate ions released under the loam soil ranged from 157–186% and 153–167% respectively. The injection of agrochemicals, addition of grass and algal biomass into agri-mats during their fabrication process may improve their C:N ratio and nitrogen mineralization rate. This practice will help reducing environmental pollution through efficient use of agrochemicals. Furthermore, it may help to reduce the impact of climate change through improved carbon sequestration in the soil. The glasshouse experiment showed that the 50% DA50NF treatment increased spinach yield by 20.6% in sandy soil and 36.5% in loam soil, compared to the second-best treatment (100NF). This suggests that algae-injected agri-mats containing about half the recommended amount of chemical nitrogen fertilizer can partially substitute for the fully recommended chemical nitrogen fertilizer without affecting the yield and quality of Spinach. However, field trials are needed to corroborate these findings, as the current experiment was conducted in a glasshouse using pot experiments.
Author Contributions
Conceptualization, S.M., A.N. and I.W.; methodology, S.M., A.N. and I.W.; software, S.M.; validation, A.N. and I.W.; formal analysis, A.N., F.M. and I.W.; investigation, S.M., A.N. and I.W.; resources, F.M., A.N. and I.W.; data curation, S.M., A.N. and I.W.; writing—original draft preparation, S.N.; writing—review and editing, S.M., A.N. and I.W.; visualization, A.N.; supervision, S.M., A.N. and I.W.; project administration, F.N.; funding acquisition, F.M., A.N. and I.W. All authors have read and agreed to the published version of the manuscript.
Funding
This research was funded by the Department of Science and Innovation in South Africa (Grant #UID23456)
Data Availability Statement
The data that support the findings of this study are available upon request from the corresponding author. It is not publicly available due to privacy restrictions.
Acknowledgments
The authors acknowledge Prof. Siawo Onwonga-Agyeman Tokyo University of Agriculture and Technology for shipping agri-mats to South African for this project through the collaborations with Japan Science and Technology and the Japan International Cooperation Agency.
Conflicts of Interest
The authors declare no conflicts of interest.
References
- Mahorana, P.C.; Biswas, D.R.; Datta, S.C. Mineralization of Nitrogen, Phosphorus and Sulphur in soil as influenced by rock phosphate enriched compost and chemical fertilizers. J. Indian Soc. Soil Scie. 2015, 6, 283–293. [Google Scholar] [CrossRef]
- Soinne, H.; Keskinen, R.; Raty, M.; Kanerva, S.; Turtola, E.; Kaseva, J.; Nuutinen, V.; Simojoki, A.; Salo, T. Soil organic carbon and clay content as deciding factors for net nitrogen mineralization and cereal yields in boreal mineral soils. Euro J. Soil Scie 2020, 72, 1479–1512. [Google Scholar] [CrossRef]
- Hossain, M.Z.; Bahar, M.M.; Sarkar, B.; Bolan, N.; Donne, S. Fertilizer Value of Nutrient-Enriched Biochar and Response of Canola Crop. J. Soil Scie Plant Nutri 2024, 1–15. [Google Scholar] [CrossRef]
- Shaaban, M.M. Nutrient status and growth of Maize plants as affected by green microalgae as soil additives. J. Biolog Scie 2001, 6, 475–479. [Google Scholar] [CrossRef]
- Marti, E.; Caliz, J.; Montserrat, G.; Garau, M.A.; Cruanas, R.; Vila, X.; Sierra, J. Air-drying, cooling and freezing for soil sample storage affects the activity and the microbial communities from Mediterranean soils. Geomicrobiol J 2012, 29, 151–160. [Google Scholar] [CrossRef]
- Luo, G.; Li, L.; Friman, V.P.; Guo, J.; Guo, S.; Shen, Q.; Ling, N. Organic amendments increase crop yields by improving microbe-mediated soil functioning of agroecosystems: A meta-analysis. Soil Bio. Biochem 2018, 124, 105–115. [Google Scholar] [CrossRef]
- Bird, M.I.; Wurster, C.M.; de Paula Silva, P.H.; Bass, A.M.; de Nys, R. Algal biochar–Production and properties. Biores Techno 2010, 102, 1886–1891. [Google Scholar] [CrossRef] [PubMed]
- Abbasi, M.K.; Khaliq, A. Nitrogen mineralization of a loam soil supplemented with organic-inorganic amendments under laboratory incubation. Front. Plant Scie 2016, 7, 1–8. [Google Scholar] [CrossRef]
- Diacono, M.; Montemurro, F. Long-term effects of organic amendments on soil fertility. Sustain Agric 2011, 2, 761–786. [Google Scholar]
- Jeffery, S.; Verheijen, F.G.; van der Velde, M.; Bastos, A.C. A quantitative review of the effects of biochar application to soils on crop productivity using meta-analysis. Agric. Ecosyst & Environ 2011, 144, 175–187. [Google Scholar]
- Souri, M.K. Effectiveness of chloride compared to 3,4 dimethylpyrazole phosphate on nitrification inhibition in soil. Comm. Soil Scie & Plant Anal 2010, 41, 1769–1778. [Google Scholar]
- Pansu, M.; Thuries, L.; Larre-Larrouy, M.C.; Bottner, P. Predicting N transformations from organic inputs in soil in relation to incubation time and biochemical composition. Soil Biol & Biochem 2003, 35, 353–363. [Google Scholar]
- Chivenge, P.; Vanlauwe, B.; Six, J. Does the combined application of organic mineral nutrient sources influence maize productivity? A meta-analysis. Plant Soil 2011, 342, 1–30. [Google Scholar] [CrossRef]
- Hu, R.; Wang, X.; Pan, Y.; Zhang, Y.; Zhang, H. The response mechanisms of soil N moralization under biological soil crusts to temperature and moisture in temperate desert regions. Euro. J. Soil Biol 2014, 62, 66–73. [Google Scholar] [CrossRef]
- Mulbry, W.; Westhead, E.K.; Pizarro, C.; Sikora, L. Recycling of manure nutrients: use of algal biomass from dairy manure treatment as a slow-release fertilizer. Biores Technol. 2005, 96, 451–458. [Google Scholar] [CrossRef] [PubMed]
- Munoz, A.; Lopez-Pineiro, A.; Ramirez, M. Soil quality attributes of conservation management regimes in a semi-arid region of western Spain. Soil and Till Res 2007, 95, 255–265. [Google Scholar] [CrossRef]
- Bengtsson, G.; Bengtson, P.; Månsson, K.F. Gross nitrogen mineralization-, immobilization-, and nitrification rates as a function of soil C/N ratio and microbial activity. Soil Biol & Biochem 2003, 35, 143–154. [Google Scholar]
- Abbasi, M.M.; Hina, M.; Khalique, A.; Khan, S.R. Mineralization of three organic manures used as nitrogen source in all soil incubated under laboratory conditions. Commun. Soil Scie & Plant Anal 2007, 38, 1691–1711. [Google Scholar]
- Prakash, S.; Nikhil, K. Algae as a soil conditioner. Int J. Eng & Technical Res 2014, 2, 68–70. [Google Scholar]
- Maurya, R.; Chokshi, K.; Ghosh, T.; Trivedi, K.; Pancha, I.; Kubavat, D.; Mishra, S.; Ghosh, A. Lipid extracted microalgae biomass residue as a fertilizer substitute for Zea Mays L. Front. Plant Scie 2016, 6, 1–10. [Google Scholar]
- El-Gamal, M.A.H. Impact of algal addition to manure compost as affected by different moisture levels. Austral J. Basic & Applied Scie 2011, 5, 729–737. [Google Scholar]
- Mgolozeli, S.; Nciizah, A.D.; Wakindiki, I.I.; Mudau, F.N.; Onwona-Agyeman, S. Investigation of Infiltration and Runoff Rate on Agri-Mats Using a Laboratory Rainfall Simulation Study. Commun. Soil Scie & Plant Anal 2023, 54, 1005–1014. [Google Scholar]
- Mgolozeli, S.; Nciizah, A.D.; Wakindiki, I.I.C.; Mudau, F.N. Innovative pro-smallholder farmers’ permanent mulch for better soil quality and food security under conservation agriculture. Agron 2020, 10, 1–16. [Google Scholar]
- Mgolozeli, S.; Nciizah, A.D.; Wakindiki, I.I.; Onwona-Agyeman, S. Agri-mat and grass mulch effect on crop biomass yield in sandy loam and loam soils. Land Degr & Dev. 2024, 35, 2884–2896. [Google Scholar]
- Bechtold, J.S.; Naiman, R.J. Soil texture and nitrogen mineralization potential across a riparian toposequence in a semi-arid savana. Soil Biol & Biochem 2006, 38, 1325–1333. [Google Scholar]
- Hassink, J.; Bouwman, L.A.; Zwart, K.B.; Brussard, L. Relationships between habitable pore space, soil biota and mineralization rates in grassland soils. Soil Biol & Biochem 1993, 25, 47–55. [Google Scholar]
- Matus, F.J.; Lusk, C.H.; Maire, C.R. Effects of soil texture, Carbon inputs rates, and litter quality on free organic matter and nitrogen mineralization in Chilean Rain Forest and Agricultural soils. Commun. Soil Scie & Plant Anal 2007, 39, 187–201. [Google Scholar]
- Marti, E.; Caliz, J.; Montserrat, G.; Garau, M.A.; Cruanas, R.; Vila, X.; Sierra, J. Air-drying, cooling and freezing for soil sample storage affects the activity and the microbial communities from Mediterranean soils. Geomicrobiol. J 2012, 29, 151–160. [Google Scholar] [CrossRef]
- Ndung’u, M.; Ngatia, L.W.; Onwonga, R.N.; Mucheru-Muna, M.W.; Fu, R.; Moriasi, D.N.; Ngetich, K.F. The influence of organic and inorganic nutrients inputs on soil organic carbon functional groups content and maize yields. Heliy 2021, 7, 1–10. [Google Scholar] [CrossRef]
- Qiu, Q.; Li, M.; Mgelwa, A.S.; Hu, Y. Divergent mineralization of exogenous organic substrates and their priming effects depending on soil types. Biol & Fertil. Soils 2023, 59, 87–101. [Google Scholar]
- Singh, M.; Sarkar, B.; Bolan, N.S.; Ok, Y.S.; Churchman, G.J. Decomposition of soil organic matter as affected by clay types, pedogenic oxides and plant residue addition rates. J. Hazard Mat 2019, 374, 11–19. [Google Scholar] [CrossRef] [PubMed]
- Probert, M.E.; Delve, R.J.; Kimani, S.K.; Dimes, J.P. Modelling nitrogen mineralization from manures: representing quality aspects by varying C: N ratio of sub-pools. Soil Biol & Biochem 2005, 37, 279–287. [Google Scholar]
- Ge, S.; Xu, H.; Ji, M.; Jiang, Y. Characteristics of soil organic carbon, total nitrogen, and C/N ratio in Chinese apple orchards. 2013, 3, 1–5. [Google Scholar] [CrossRef]
- Malobane, M.E. Using the organic carbon fractions of the van soest method to determine compounds responsible for C and N mineralization from sludge amended soils. MSc Dissertation, University of Pretoria, South Africa, 2015. [Google Scholar]
- Shahbaz, M.; Kuzyakov, Y.; Heitkamp, F. Decrease of soil organic stabilization with increasing inputs: Mechanisms and controls. Geoderma 2017, 304, 76–82. [Google Scholar] [CrossRef]
- Masunga, R.H.; Uzokwe, V.N.; Mlay, P.D.; Odeh, I.; Singh, A.; Buchan, D.; De Neve, S. Nitrogen mineralization dynamics of different valuable organic amendments commonly used in agriculture. Appl. Soil Ecol 2016, 101, 185–193. [Google Scholar] [CrossRef]
- Ogundijo, D.S.; Adetunji, M.T.; Azeez, J.O.; Arowolo, T.A. Effect of organic and inorganic fertilizers on soil organic carbon, Ph, Ammonium-nitrogen, Nitrate-nitrogen and some exchangeable cations. Int. J Environ Scie 2014, 3, 243–249. [Google Scholar]
- Shahid, S.; Al-Shankiti, A. Sustainable food production in marginal lands–Case of GDLA member countries. Int. Soil & Water Conserv Res 2013, 1, 24–38. [Google Scholar]
- Onwona-Agyeman, S.; Fuke, M.; Kabawata, Y.; Yamada, M.; Tanahashi, M. Compressed biomass as mulching in No-till farming. J. Arid Land Stud. 2015, 25, 253–256. [Google Scholar]
- Onwona-Agyeman, S.; Nakamura, S.; Kabawata, Y.; Yamad, M.; Sabi, E.B.; Tanahashi, M. Utilization of forestry residues in erosion control and soil moisture conservation. J. Arid Land Stud. 2012, 2, 279–282. [Google Scholar]
- Obalum, S.E.; Chibuike, G.U. Air drying effect on soil reaction and phosphorus extractability from upland-lowland tropical soils as related to other colloidal stability. Appl. Ecol and Environ Res. 2016, 15, 525–540. [Google Scholar] [CrossRef]
Figure 1.
Ammonium dynamics in a sandy loam soil from Pretoria, Gauteng. Means with the same letter within the same day indicates there were no significant (P < 0.05) differences between treatment means. The statistical differences were detected using LSD test at 0.05 confidence level, n = 42.
Figure 1.
Ammonium dynamics in a sandy loam soil from Pretoria, Gauteng. Means with the same letter within the same day indicates there were no significant (P < 0.05) differences between treatment means. The statistical differences were detected using LSD test at 0.05 confidence level, n = 42.
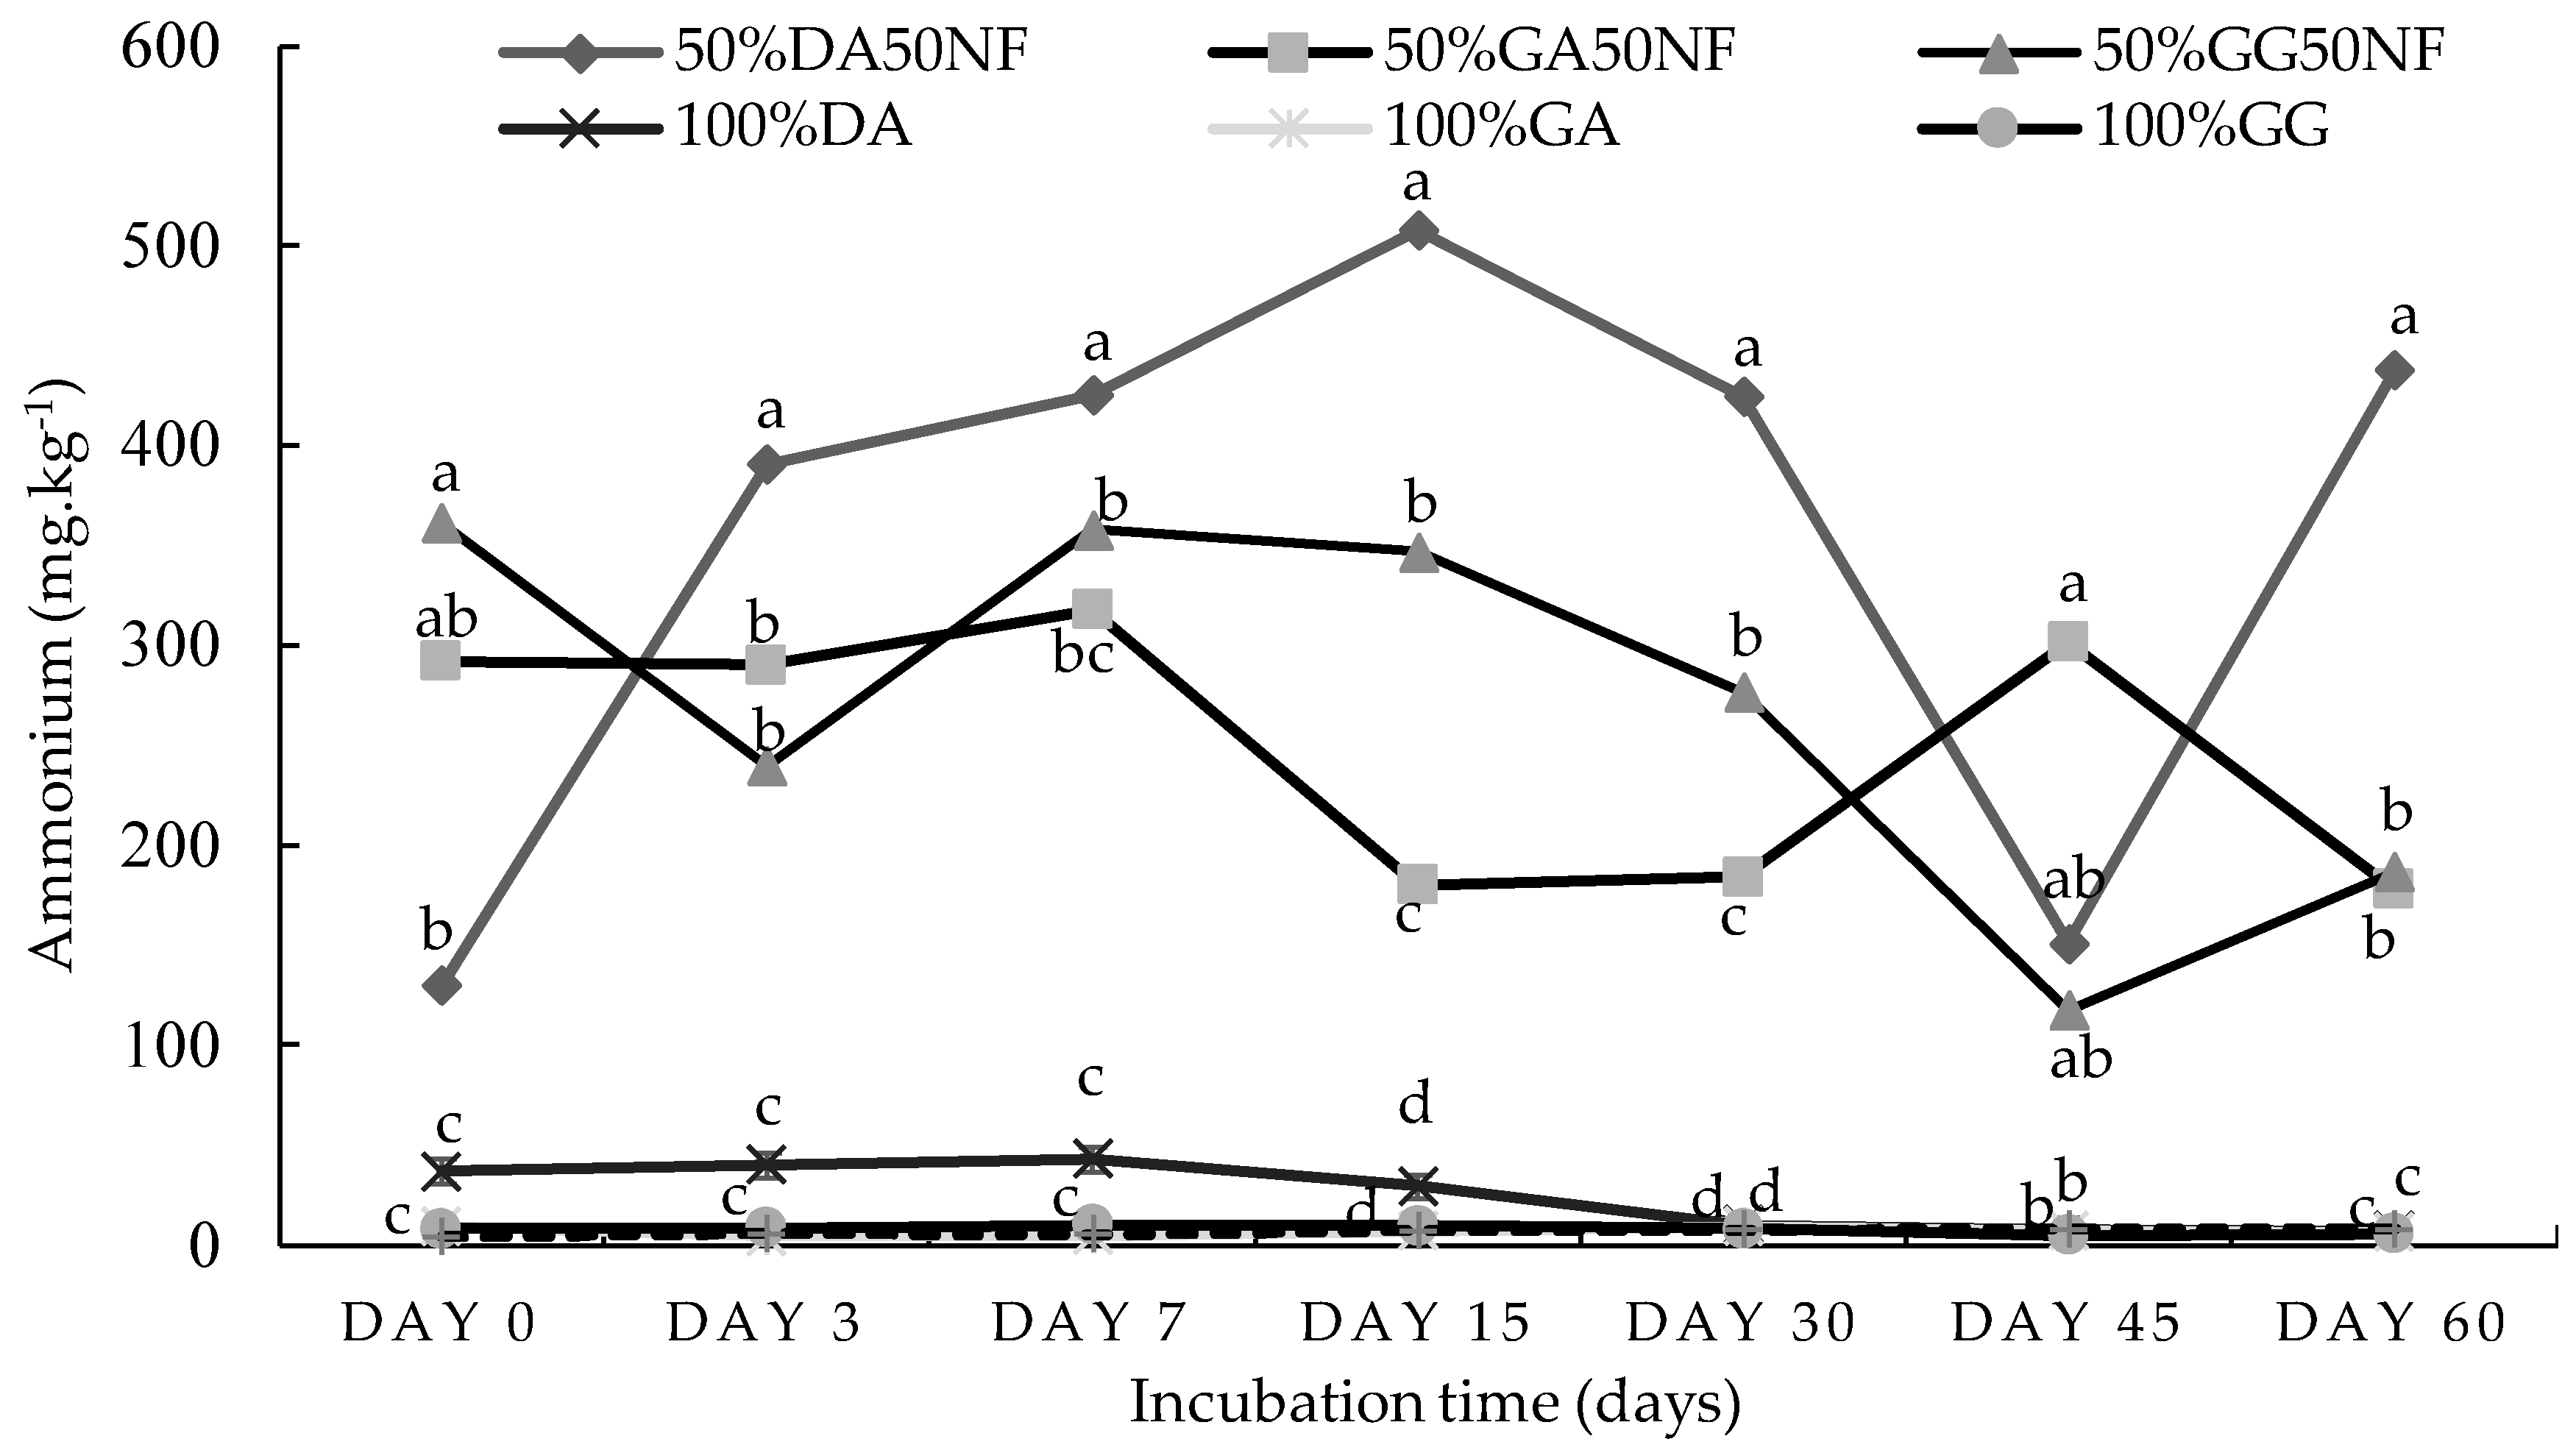
Figure 2.
Nitrate dynamics in a sandy loam soil from Pretoria, Gauteng. Means with the same letter within the same day indicates there were no significant (P < 0.05) differences between treatment means. The statistical differences were detected using LSD test at 0.05 confidence level, n = 42.
Figure 2.
Nitrate dynamics in a sandy loam soil from Pretoria, Gauteng. Means with the same letter within the same day indicates there were no significant (P < 0.05) differences between treatment means. The statistical differences were detected using LSD test at 0.05 confidence level, n = 42.
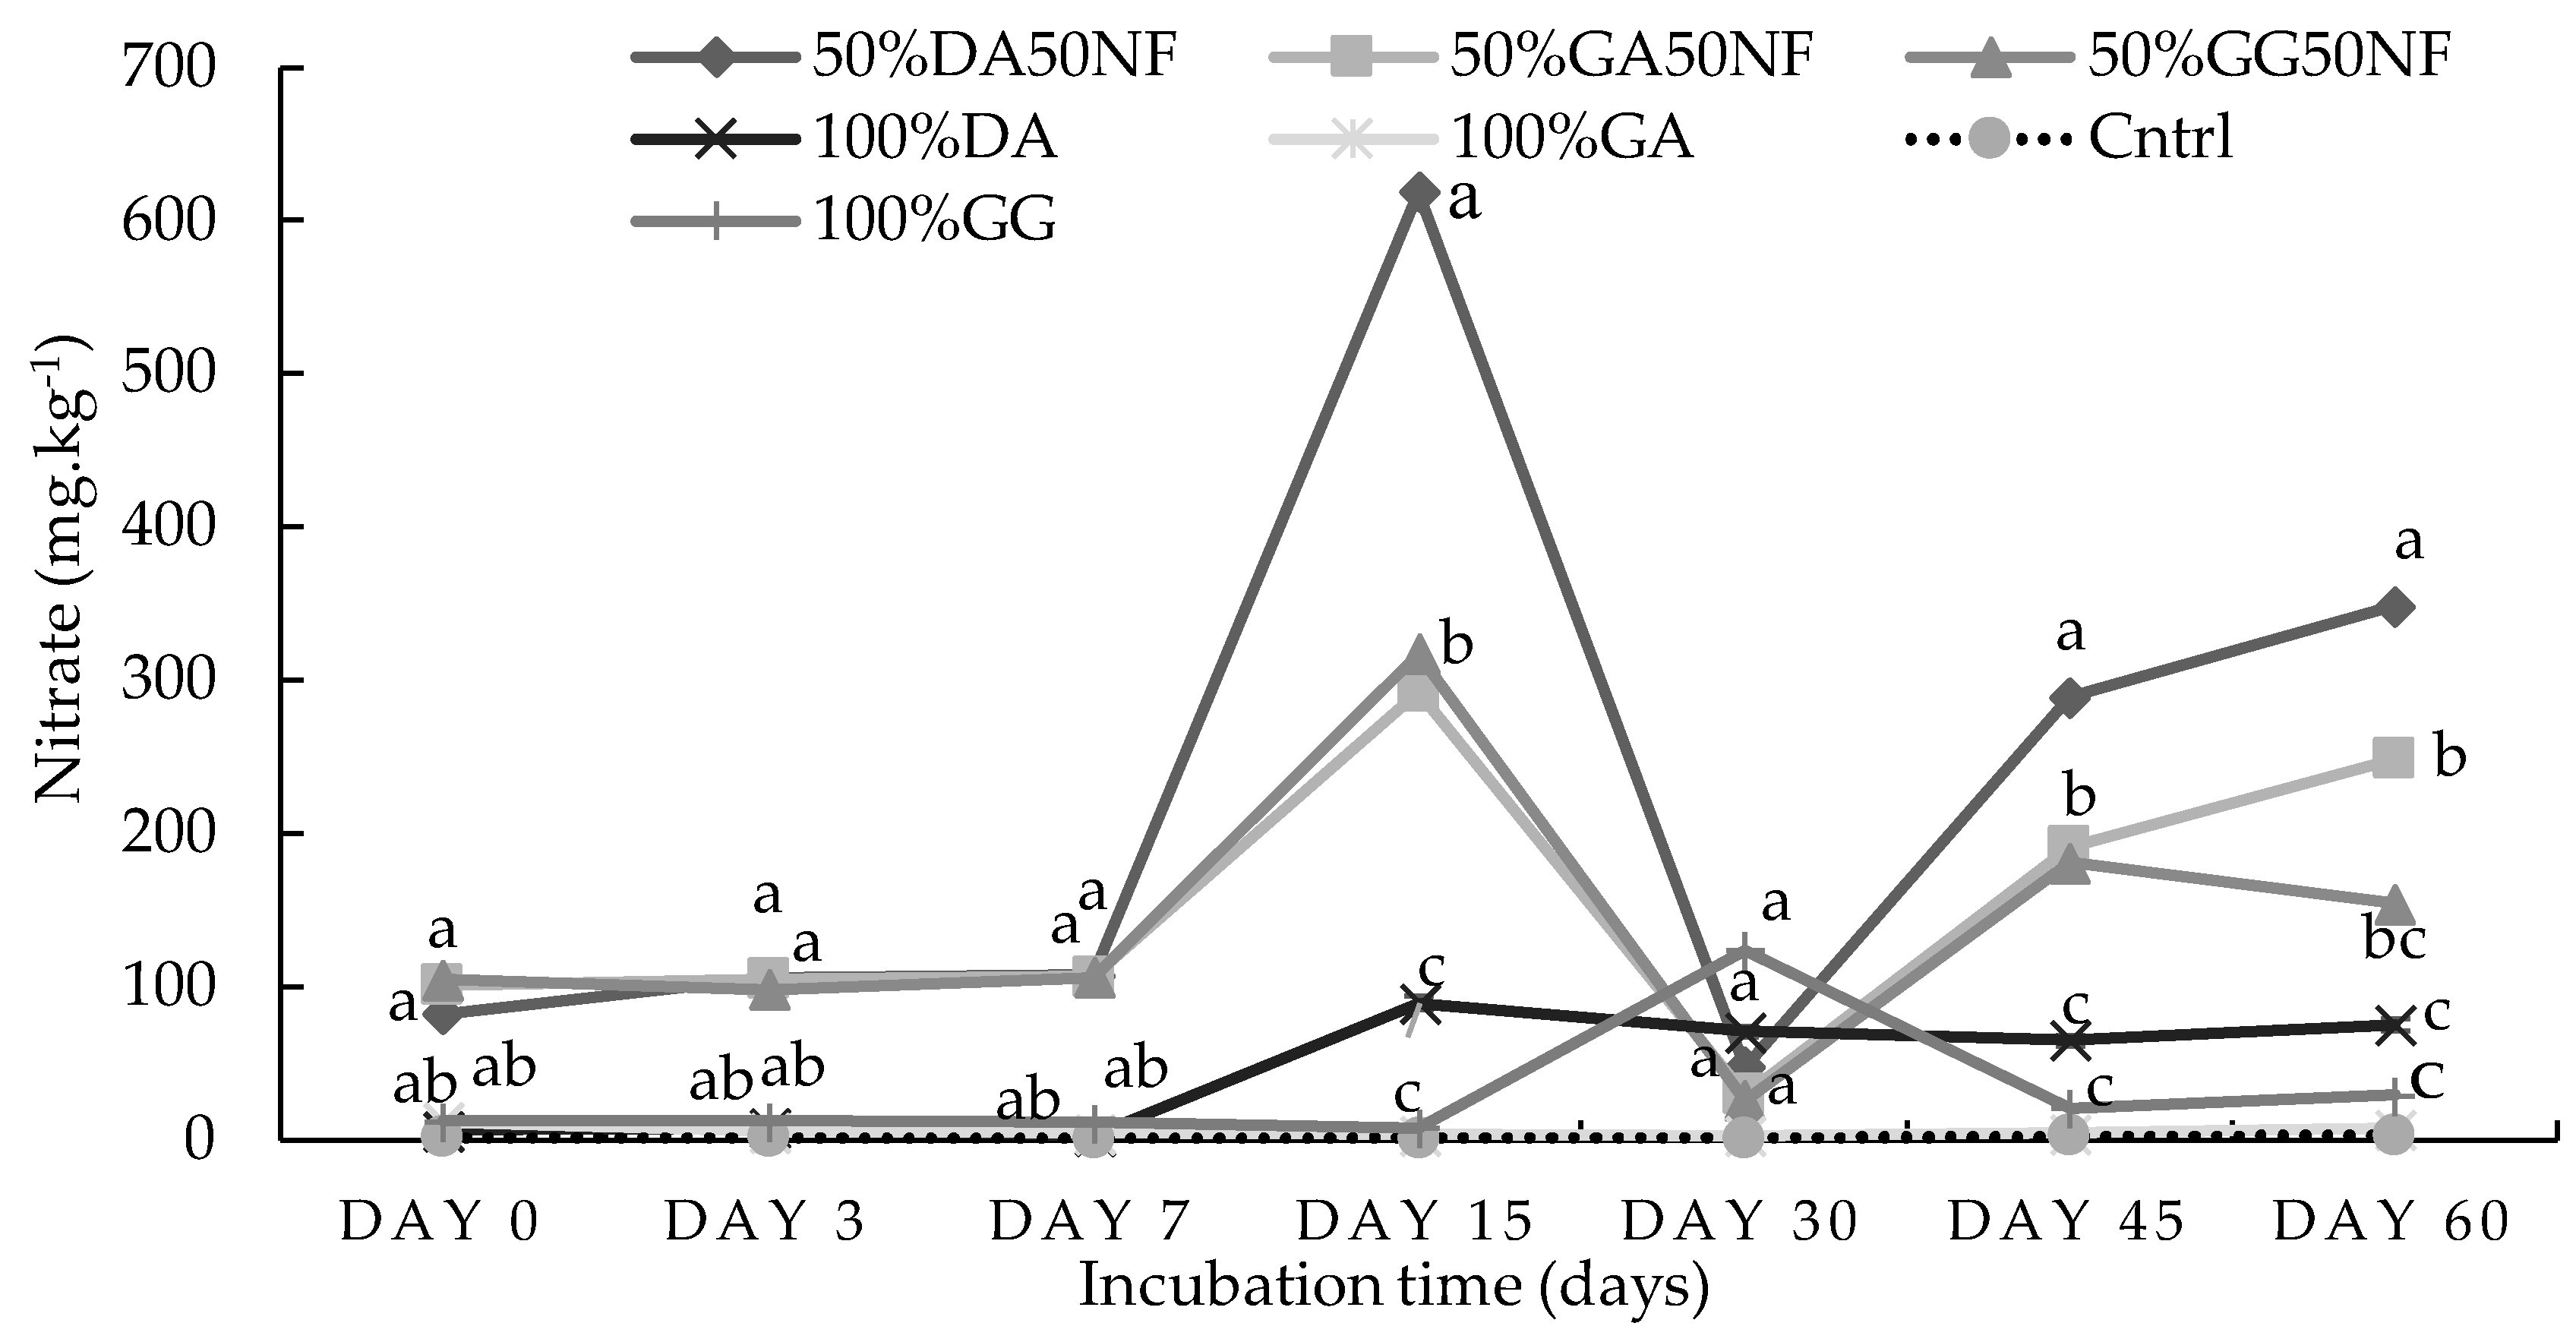
Figure 3.
Ammonium dynamics in a loam soil from Durban, Kwa-Zulu Natal. Means with the same letter within the same day indicates there were no significant (P < 0.05) differences between treatment means. The statistical differences were detected using LSD test at 0.05 confidence level, n = 42.
Figure 3.
Ammonium dynamics in a loam soil from Durban, Kwa-Zulu Natal. Means with the same letter within the same day indicates there were no significant (P < 0.05) differences between treatment means. The statistical differences were detected using LSD test at 0.05 confidence level, n = 42.
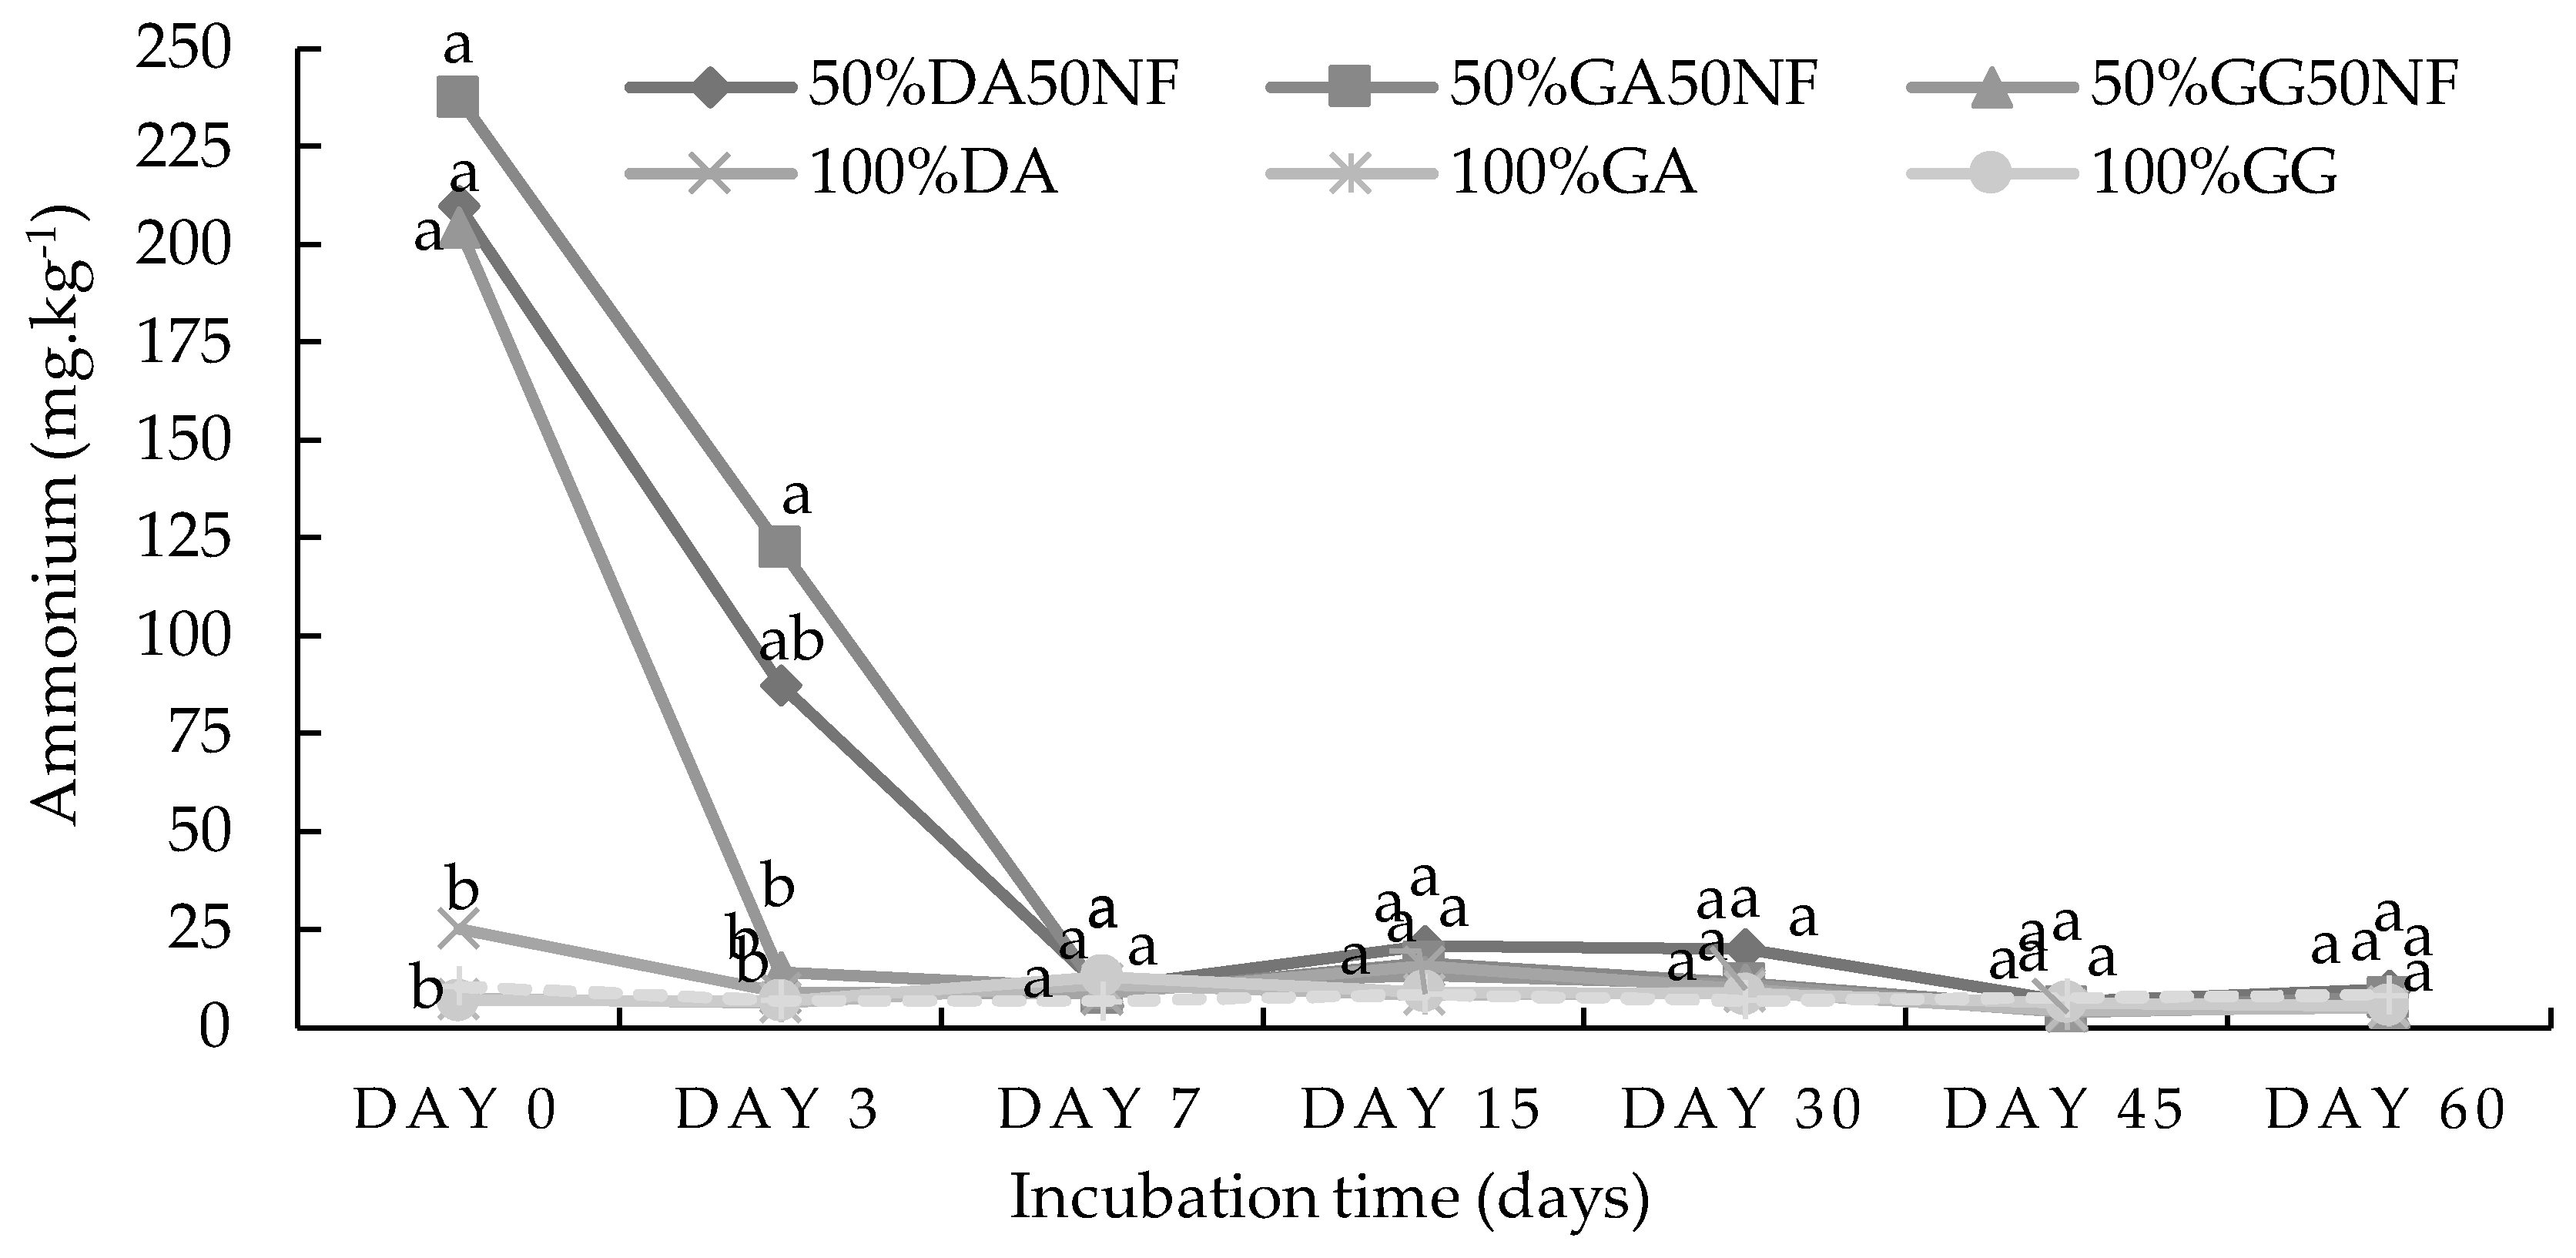
Figure 4.
Nitrate dynamics in a loam soil from Durban, Kwa-Zulu Natal. Means with the same letter within the same day indicates there were no significant (P < 0.05) differences between treatment means. The statistical differences were detected using LSD test at 0.05 confidence level, n = 42.
Figure 4.
Nitrate dynamics in a loam soil from Durban, Kwa-Zulu Natal. Means with the same letter within the same day indicates there were no significant (P < 0.05) differences between treatment means. The statistical differences were detected using LSD test at 0.05 confidence level, n = 42.
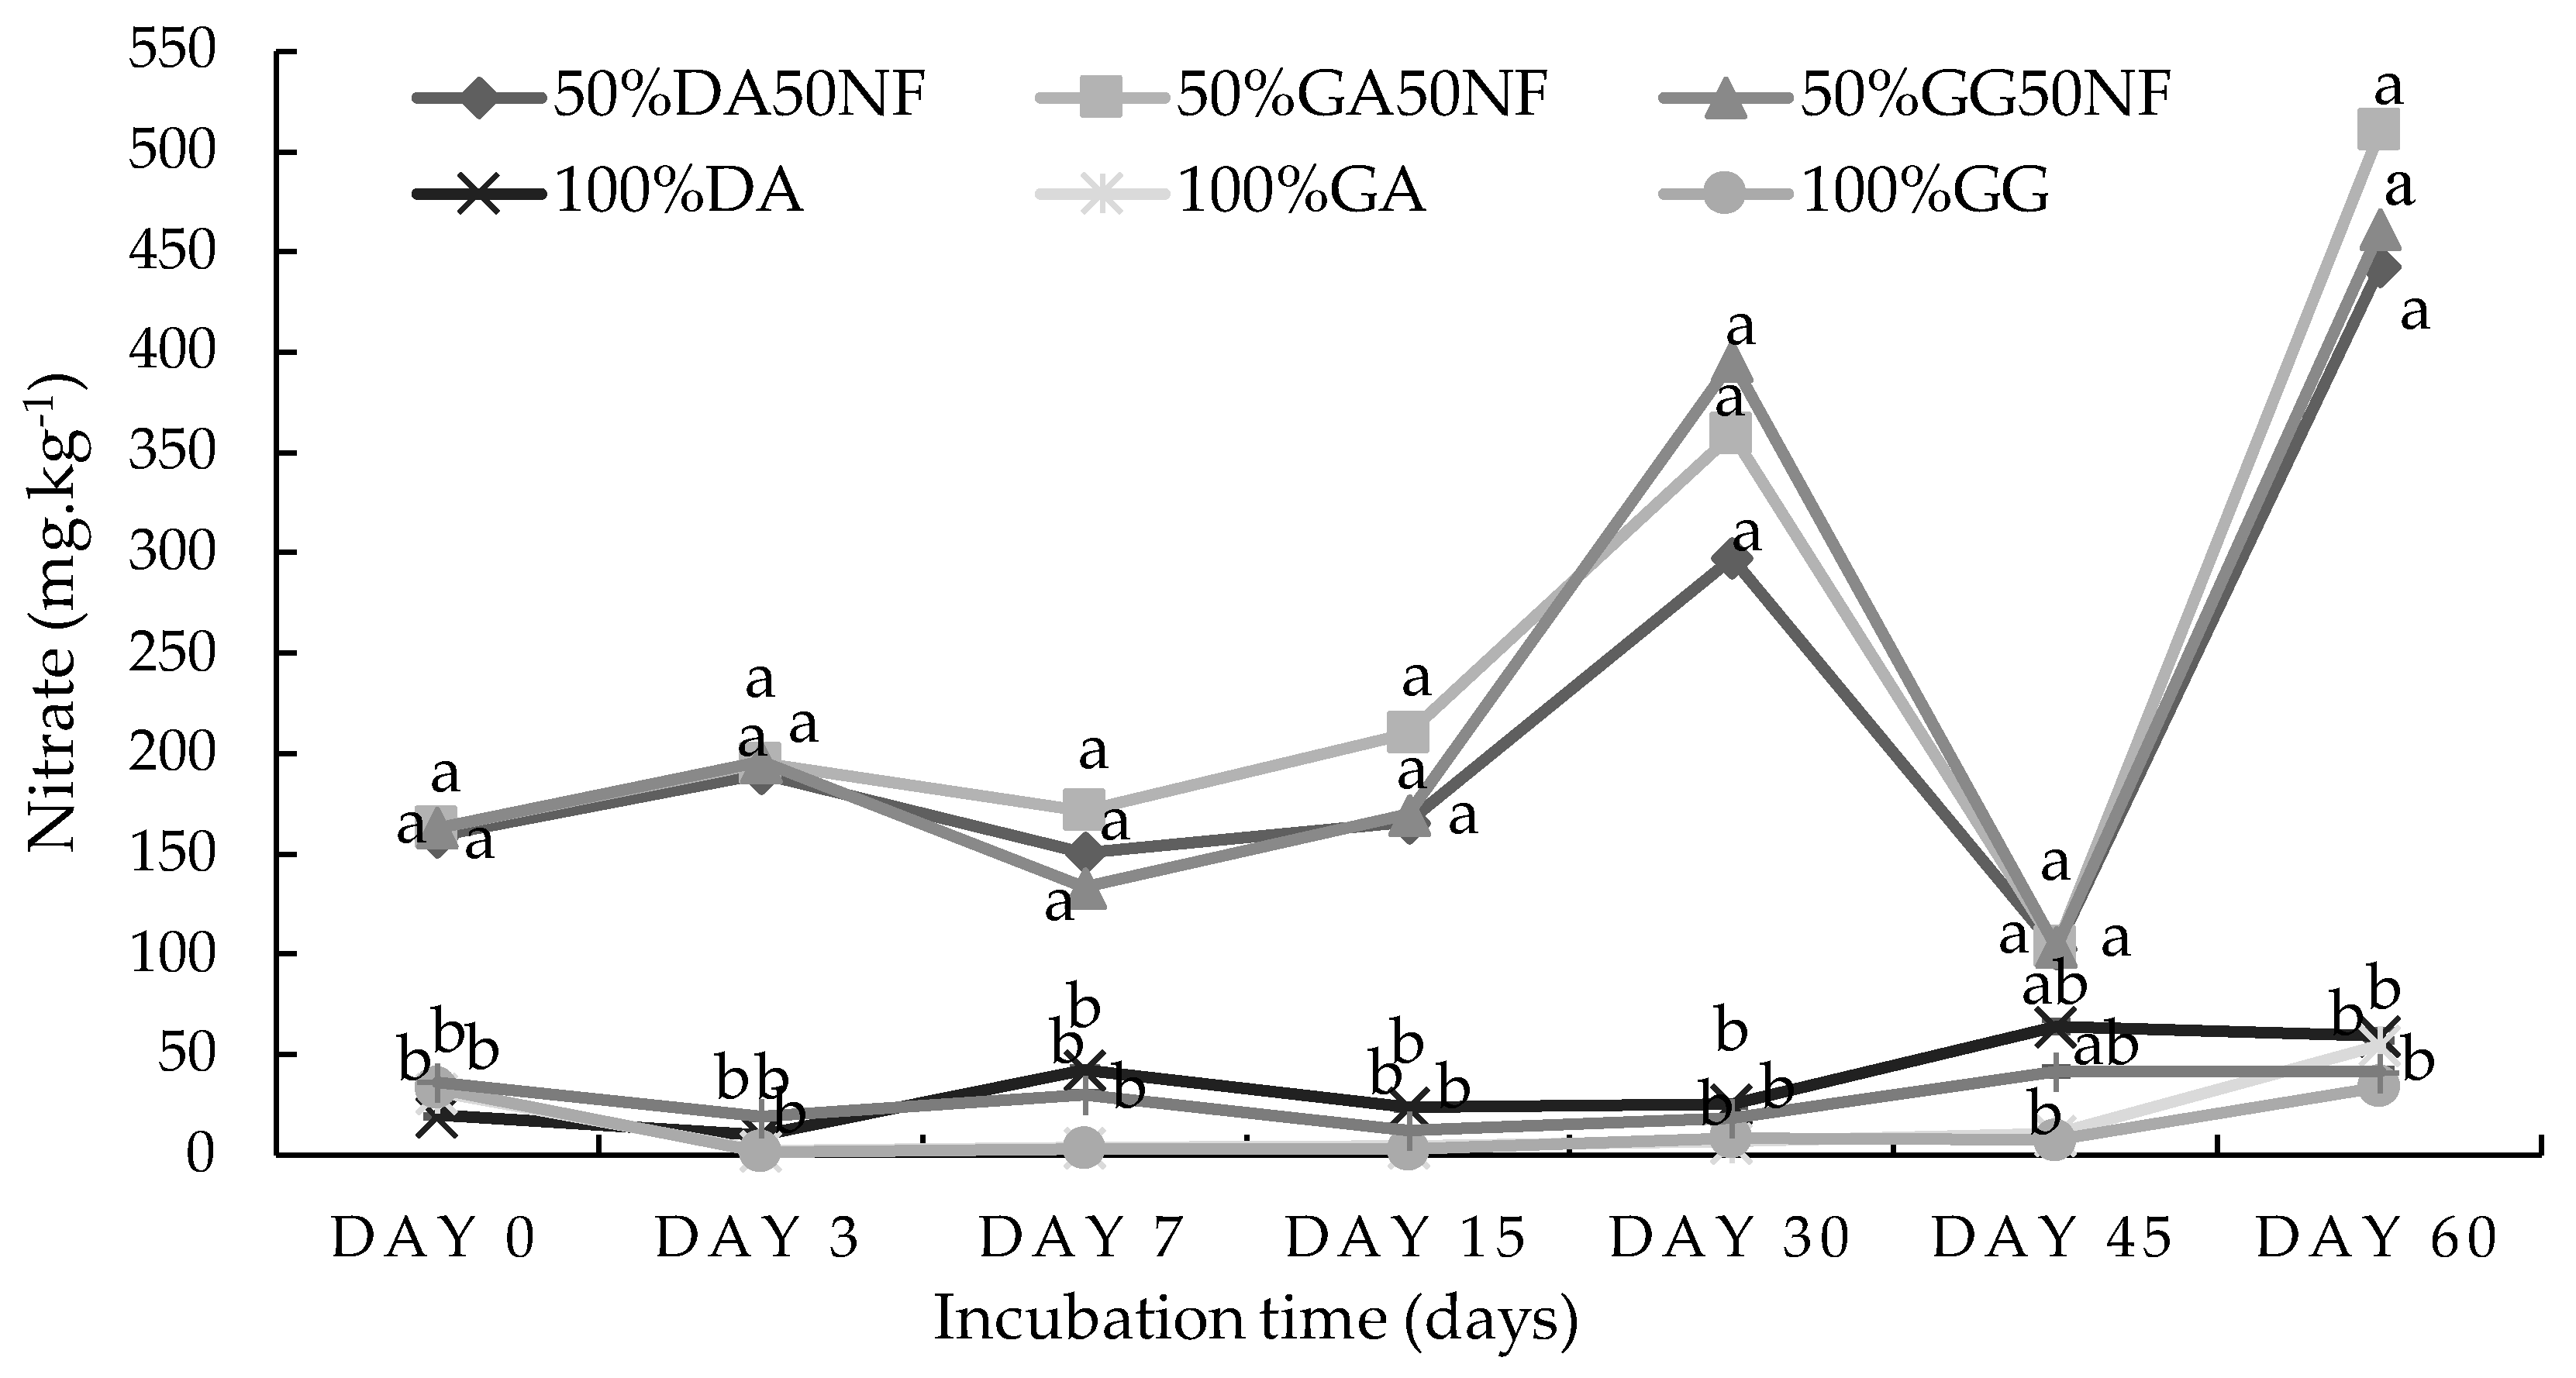
Figure 5.
Effect of various integrated nutrient management in spinach growth planted in loam and sandy loam soil.
Figure 5.
Effect of various integrated nutrient management in spinach growth planted in loam and sandy loam soil.
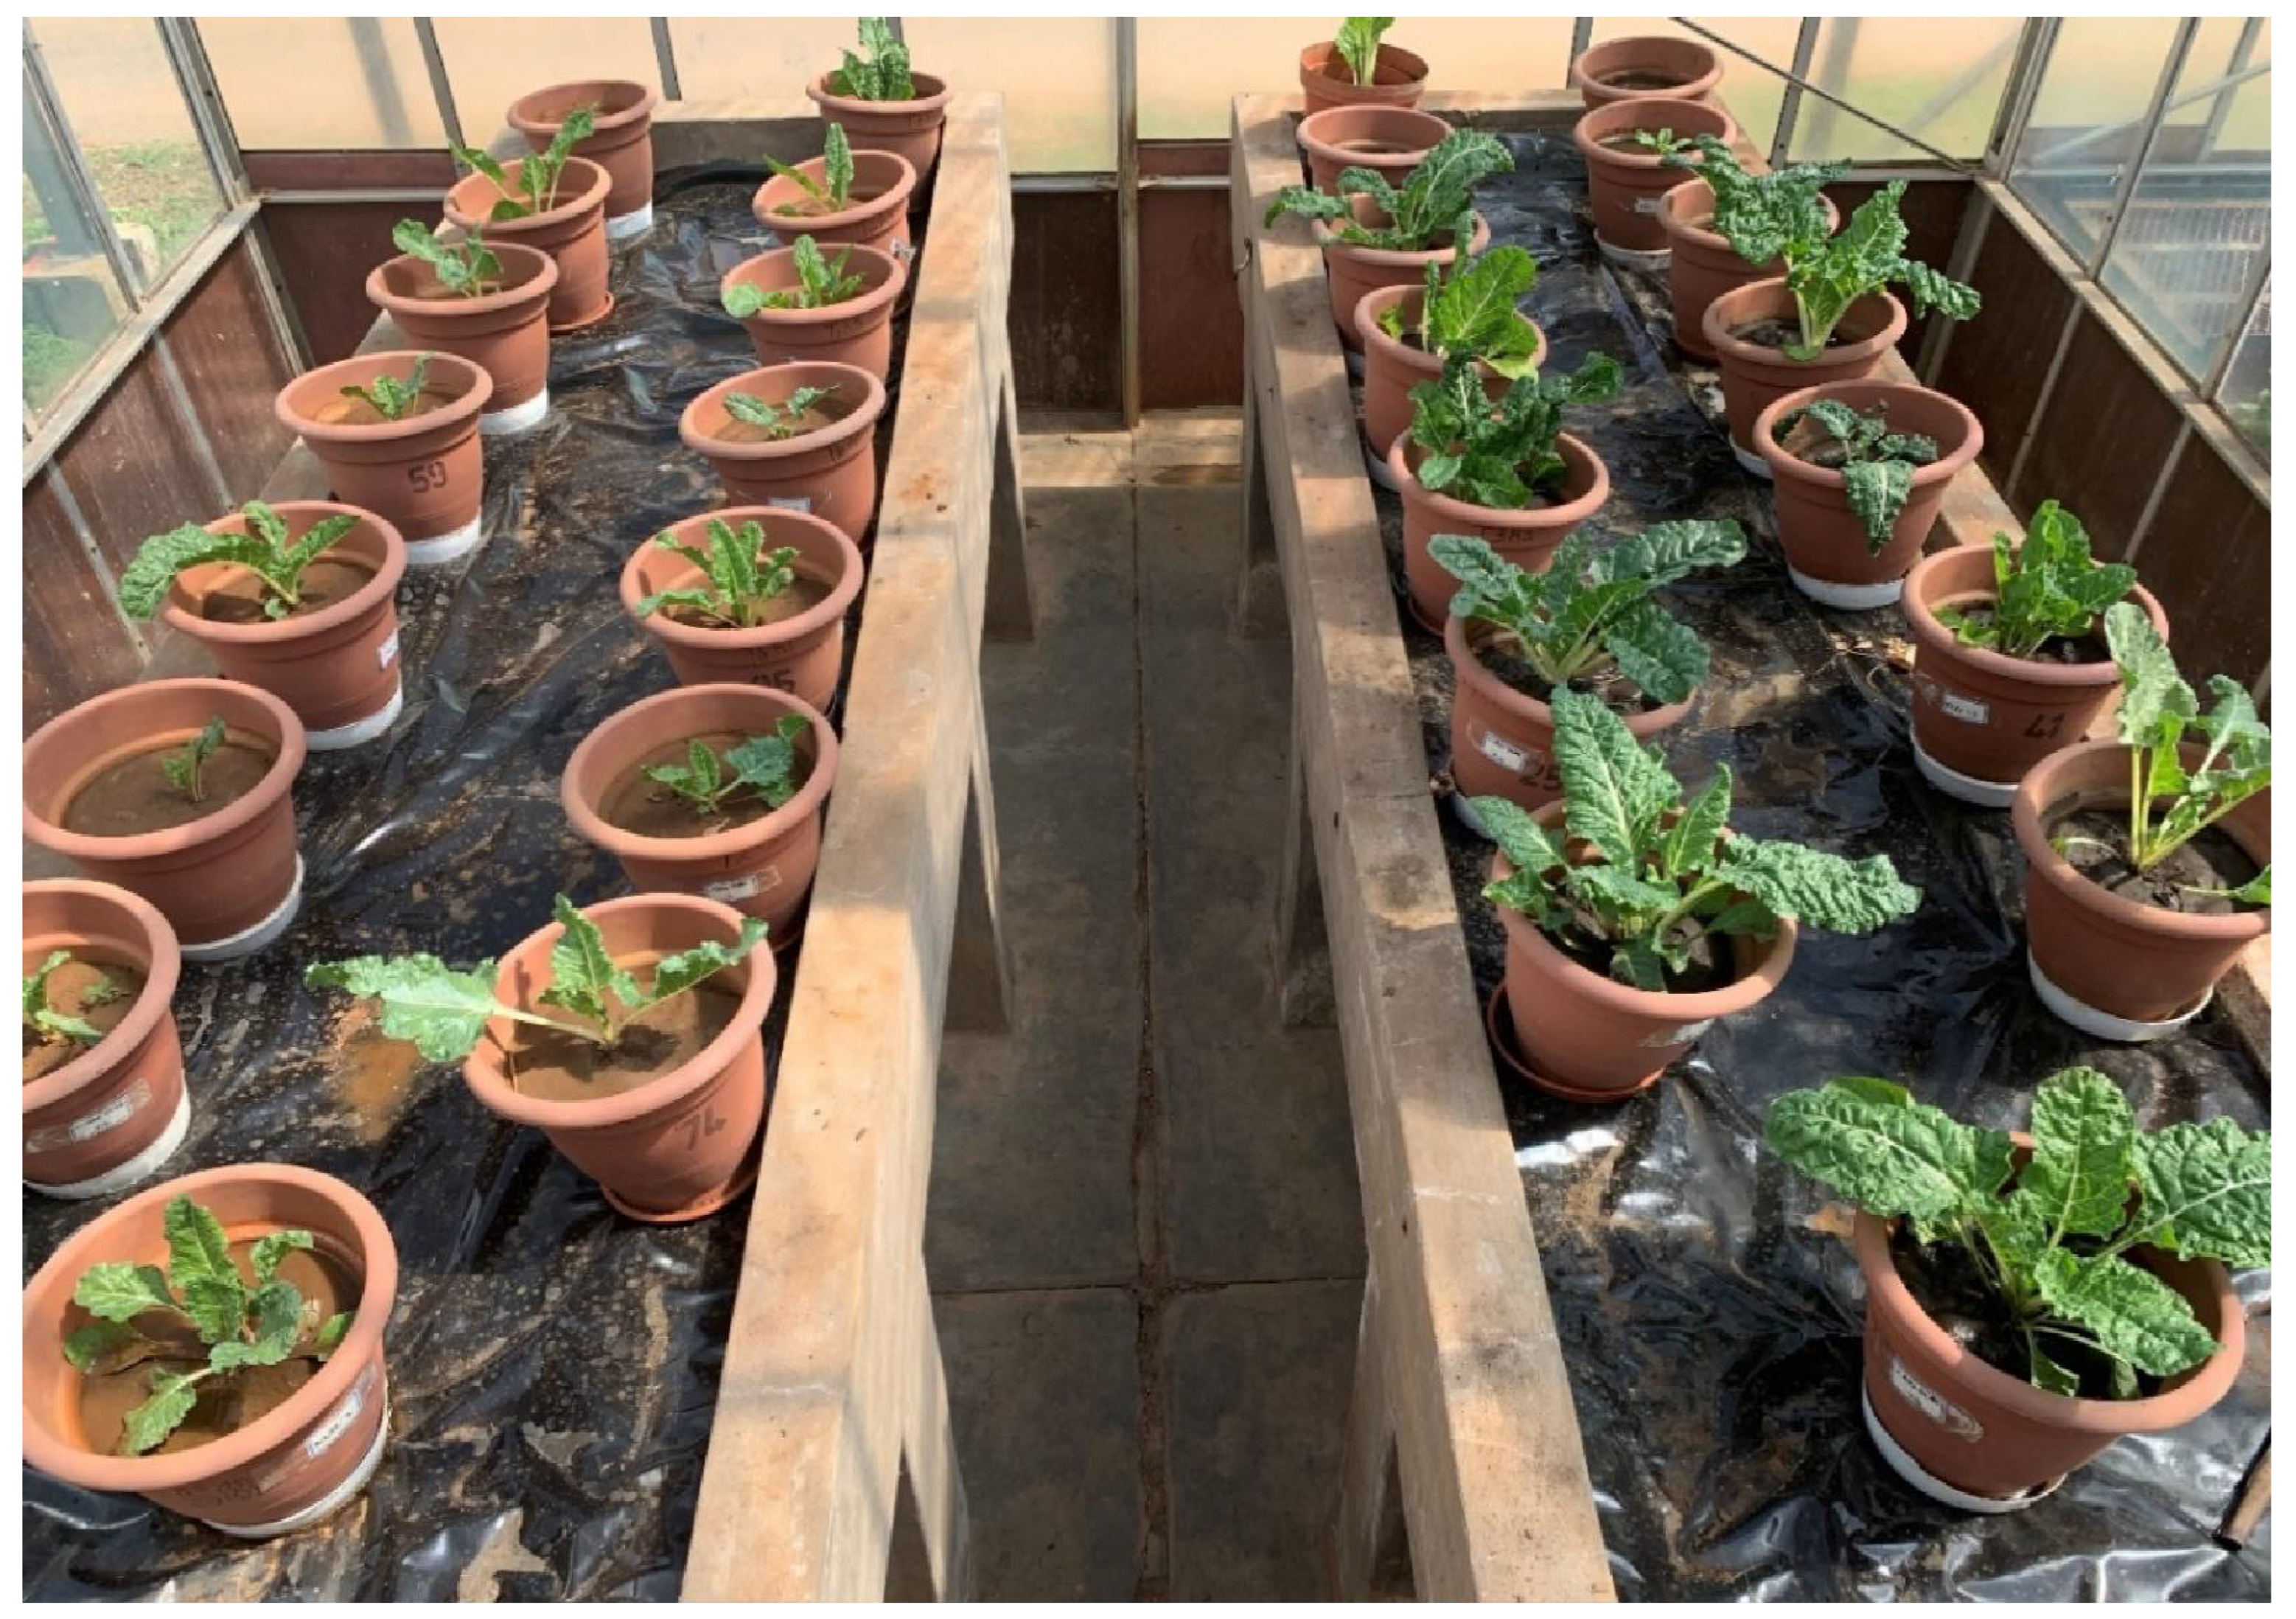
Figure 6.
Effect of organic-inorganic amendments on sandy loam (a) and loam soil (b) on spinach height. WAP = weeks after planting. Means with the same letter within the same measuring period are not significantly (P < 0.05) different from each other. The statistical differences were detected using LSD test at 0.05 confidence level, n = 30.
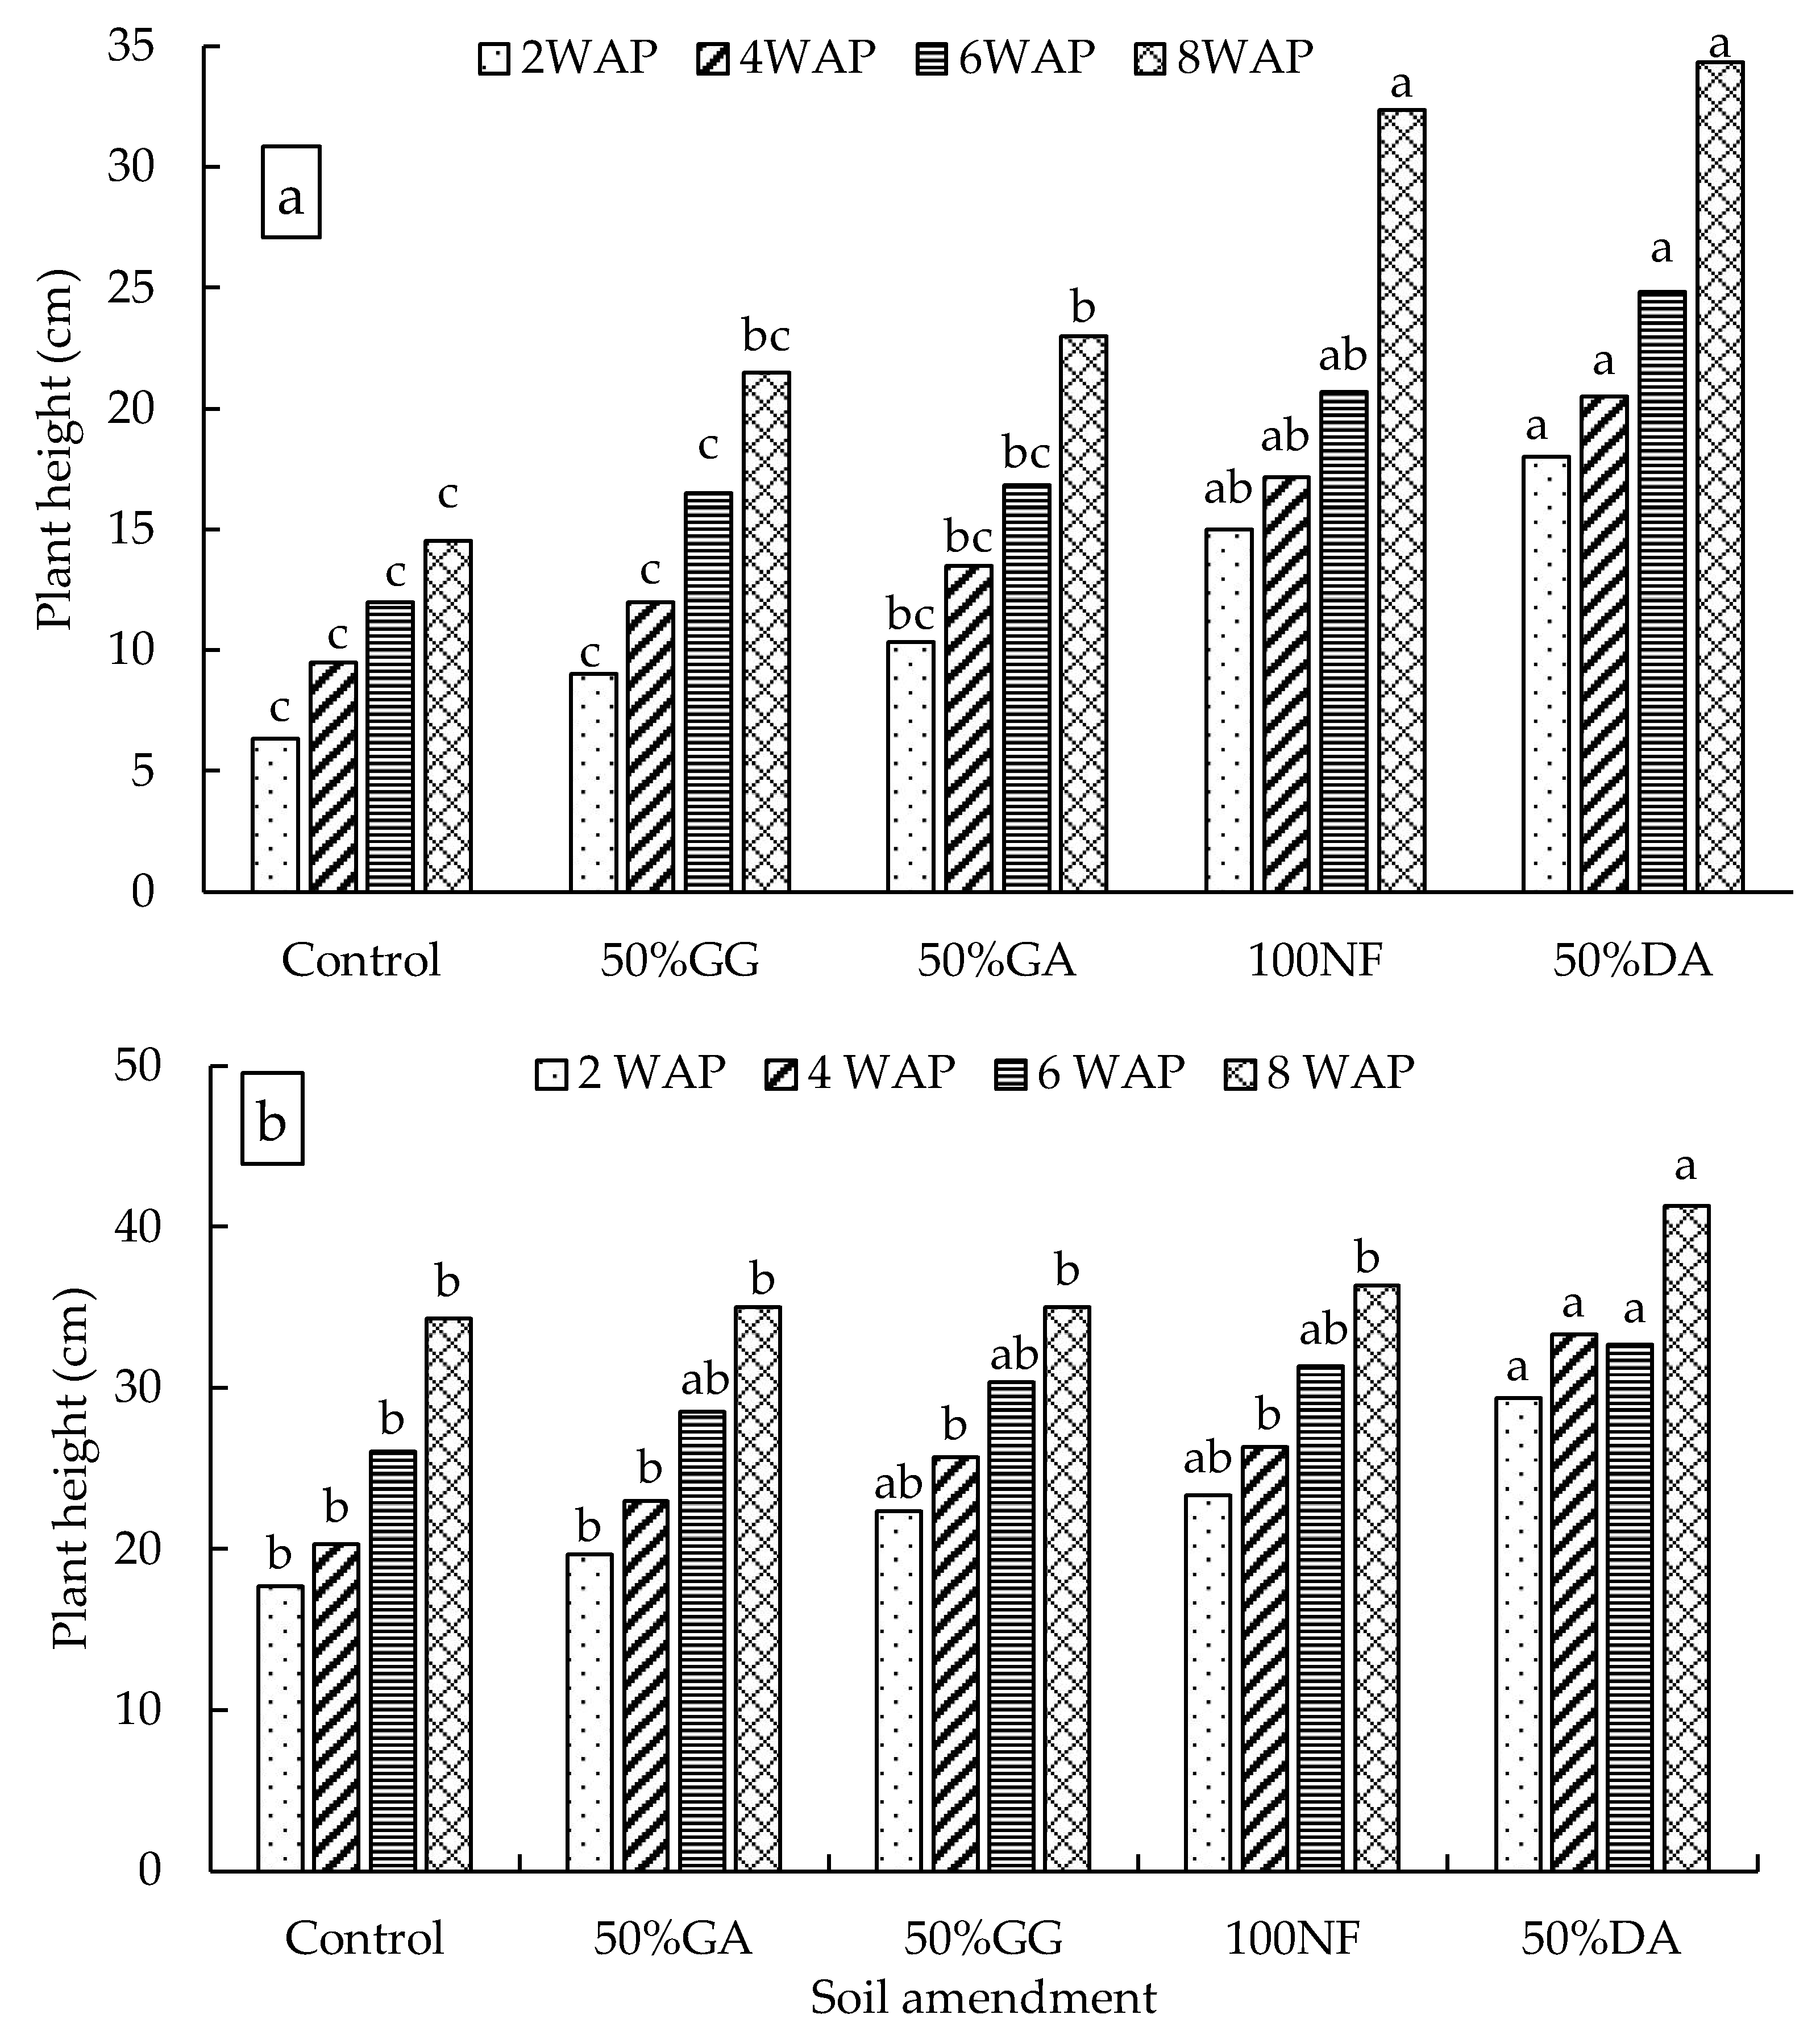
Figure 7.
Effect of organic-inorganic amendments on spinach leaf length planted under sandy loam and loam soil. WAP = weeks after planting, Pta = Pretoria sandy loam soil, Dbn = Durban loam soil. Means with the same letter within the same measuring time are not significantly (P < 0.05) different from each other. The statistical differences were detected using LSD test at 0.05 confidence level, n = 30.
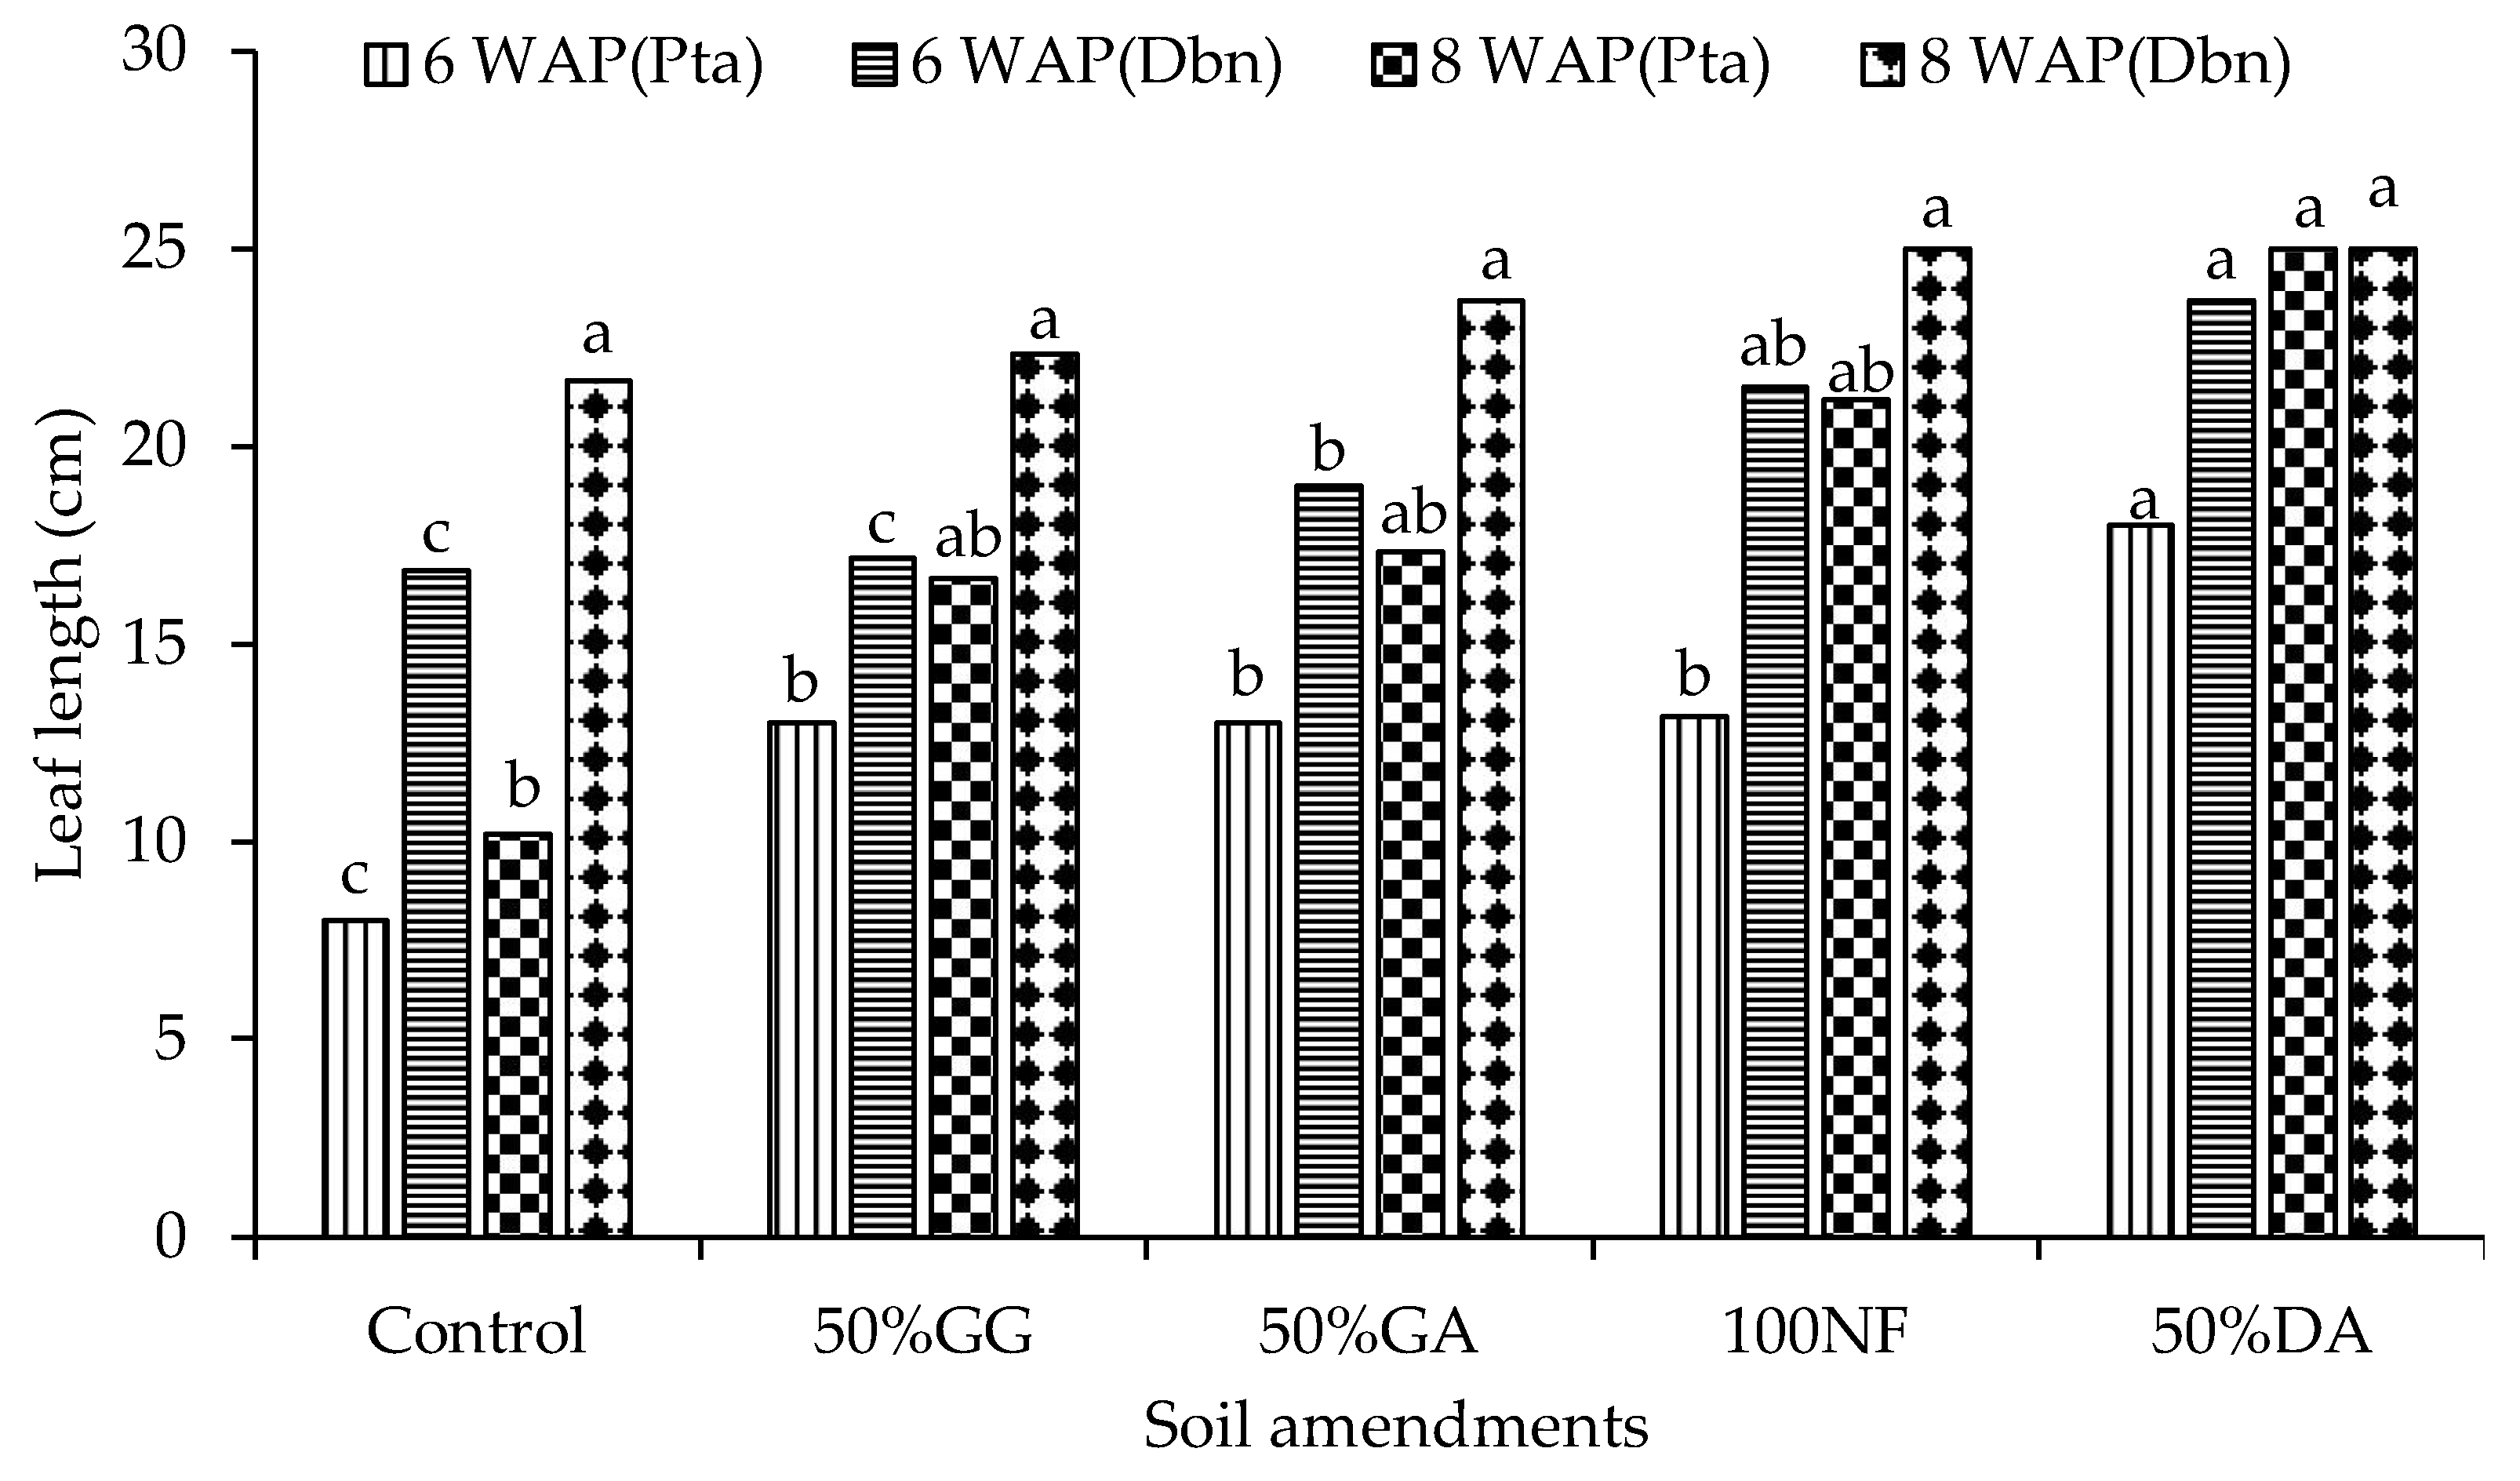
Figure 8.
Effect of organic-inorganic amendments on the number of leaves for Spinach planted under sandy loam soil. WAP = weeks after planting Means with the same letter within the same measuring time are not significantly (P < 0.05) different from each other. The statistical differences were detected using LSD test at 0.05 confidence level, n = 30.
Disclaimer/Publisher’s Note: The statements, opinions and data contained in all publications are solely those of the individual author(s) and contributor(s) and not of MDPI and/or the editor(s). MDPI and/or the editor(s) disclaim responsibility for any injury to people or property resulting from any ideas, methods, instructions or products referred to in the content. |
© 2024 by the authors. Licensee MDPI, Basel, Switzerland. This article is an open access article distributed under the terms and conditions of the Creative Commons Attribution (CC BY) license (http://creativecommons.org/licenses/by/4.0/).
Copyright: This open access article is published under a Creative Commons CC BY 4.0 license, which permit the free download, distribution, and reuse, provided that the author and preprint are cited in any reuse.


