Submitted:
22 May 2024
Posted:
23 May 2024
You are already at the latest version
Abstract
We have investigated the influence of the relative proportions of glass formers in a series of lithium alumino-borosilicate glasses with respect to electrical conductivity () and glass transition temperature (Tg) as functions of glass structure, as determined by Raman spectroscopy. The ternary lithium alumino-borate glass exhibits the highest and lowest Tg among all the compositions of the glass series, 30Li2O•3Al2O3• (67-x) B2O3•xSiO2. However, as B2O3 is replaced by SiO2, a shallow minimum in as well as a shallow maximum in Tg are observed near x = 27, where the Raman spectra indicate isolated diborate/tetraborate/orthoborate groups are being progressively replaced by danburite/reedmergnerite-like borosilicate network units. Overall, as the glasses become silica-rich, is minimized, while Tg is maximized. In general, these findings show correlations among Tg, (sensitive to network polymerization), (proportional to ionic mobility), and the different borate and silicate glass structural units as determined by Raman spectroscopy. X-ray diffraction analyses demonstrate the absence of appreciable crystallinity in the glasses investigated. However, scanning electron microscopy (SEM) images of HF-etched samples showed that glasses, and especially the borate-rich compositions comprise two distinct glassy phases. The isolated phase is 25-100 nm in diameter, dispersed evenly in a glassy matrix.
Keywords:
Mixed glass former effect
; Raman spectroscopy
; Glass transition temperature
; Electrical conductivity
; Van der Pauw Four Probe method
1. Introduction
Recent advancements in glass science have prompted extensive research efforts aimed at comprehending both the fundamental and applied aspects of non-crystalline electrolytes in all-solid-state batteries (ASSBs) [1,2]. Ionic glasses containing sulfide and oxide anions, with alkaline cations, are investigated to be used in ASSBs. The optimization of electrical conductivity in these ionic glasses has been attempted through the incorporation of halides or other salts into the glass structure [3]. However, this strategy often comes at the cost of decreased chemical durability and thermal stability [4].
To address these challenges, researchers have explored [5,6,7,8,9,10,11] the incorporation of multiple glass formers, such as P2O5, B2O3, and/or SiO2, into binary glass systems. This has proven to be an effective approach to optimize electrical conductivity while mitigating the adverse effects of added halide salts. Recent studies have been directed toward glasses containing at least two network formers [5]. A phenomenon known as the mixed glass former effect (MGFE) in binary glasses can vary electrical conductivity in non-linear ways by holding alkali content constant while changing the proportions of different glass formers [6].
The Lithium boro-phosphate (LBP) system [7] exemplifies the MGFE, where the conductivity of these ternary glasses can be two orders of magnitude greater than that for Lithium borate or Lithium phosphate binary glasses. Comparable changes in electrical conductivity between ternary and binary glasses demonstrating the MGFE can also be found for other systems including silver 1boro-phosphate, Lithium boro-tellurite [8], and Lithium seleno-borate glasses [9]. This intriguing behavior extends to glasses in the Li2O•B2O3•SiO2 system, known for their ability to incorporate significant amounts of Li2O while maintaining stability [10]. Maia et al. [11] found no signs of MGFE in a series of Lithium boro-silicate glasses with 40 mol. % of Li2O. However, Otto [12] reported MGFE in the Lithium boro-silicate glasses, with 20 to 30 mol. % Li2O. These compositional effects in glasses arise from structural modifications, resulting in the formation of different glass former species [13]. To better comprehend these effects, it is crucial to characterize the various network structural units in these ternary glasses. Raman spectroscopy has proven to be an effective technique to detect structural units [14] present in the glasses. This information aids in explaining the compositional dependence of activation energies that impede ion transport in glasses.
The ionic transport in glasses is governed by Arrhenius equation [15] for ionic conductivity as expressed in the equation (1).
where:
and N0 represents the total number of mobile ions, T is the absolute temperature, α is the degree, of freedom, Ze is electric charge of ions, λ is the distance covered by the ion in a single jump, v is the frequency of jump attempts the ion makes, Ea is the activation energy, the energy barrier an ion carrier has to overcome to move from one site to another to contribute to conduction, and k is the Boltzmann constant [16]. According to Anderson-Stuart model [17], the activation energy for ionic conduction in glass is given by,
where Eb is electrostatic bond energy and Es is network strain energy.
σ = σ0 exp (-Ea / kT)
σ0 = N0 α(Ze)2λ2v / T
Ea = Eb + Es
This study centers on a series of lithium borosilicate glasses with 30 mol% lithium oxide, denoted as 30Li2O•(67-x)B2O3•(x)SiO2•3Al2O3 (LABS glass), where x varies from 0 to 67. Aluminum oxide is incorporated to enhance the chemical stability of the glass. By varying B2O3 and SiO2 ratios we measure how electrical conductivity (σ), glass transition temperature (Tg), and Raman spectral features change across the glass series. One of the objectives was to investigate if the incorporation of a second network former could lower the net bond energy and/or the strain energy possibly increasing alkali ion mobility.
Another aspect of the research was to explore the possibility of inducing phase separation in the glass. It is commonly observed that alkali ions tend to segregate in one of the two phases of a glass containing two glass-forming oxides (as in Vycor glass). If such a glass composition decomposes spinodally then the high concentration of one of two phases may lead to high alkali ion mobility, desirable in a solid electrolyte of a battery.
For each glass, Van der Pauw’s four-probe method [18] was implemented to measure σ over a temperature range of 50 to 170 oC, which was then used to calculate the glass activation energy. Tg was determined for each glass from differential thermal analysis (DTA). Tg denotes a temperature range during which a super cooled liquid transform into a glassy state. Analyzing Tg provides valuable insights into both the structure and electrical conductivity of the glass. Polarized Raman spectra were gathered by using a single grating spectrograph-edge filter system (WITec alpha-300 RA+ micro-Raman system), where various spectral features were assigned to pertinent vibrational modes for borate, borosilicate, and silicate glasses and some crystalline phases presented in the literature.
2.1. Electrical Conductivity Literature
Research on lithium-conducting glasses has been ongoing for many decades, focusing on both fundamental understanding and practical applications as solid electrolytes in Li-ion batteries. To make such applications work, it is important to know how well these glasses conduct electricity. In earlier studies [19,20,21], electrical conductivity has been measured by two methods: direct current (DC) and alternating current (AC), often with two or four probes. In the DC method, we simply pass current through the sample and measure the voltage and current. For AC methods, like impedance spectroscopy, we use various alternating current frequencies and observe how the sample responds. Electrical resistance of a sample is determined from impedance spectroscopy [22]. The electrical conductivity is calculated by using the relationship σ = t/RA, where R is the electrical resistance, A is the cross-sectional area, and t is the thickness of the sample [22].
Electrical conductivity of a glass depends upon the total concentration of various charge carriers that is affected by composition. Bude et al. [19] showed that σ increases from 10-11 to 10-4 S/cm in a series of yLi2O•(1-y) B2O3 glasses, and from 10-11 S/cm to 10 -5 S/cm in a series of yLi2O•(1-y) SiO2 glasses, where y = 0.1 to 0.6. Montouillout et al. [20] investigated the xLi2O•(100 − x)B2O3 glass system over a wide range of compositions, where x = 0 to 50 mol.%, by characterizing local structure and electrical conductivity using solid state NMR (Nuclear Magnetic Resonance) and impedance spectroscopy, respectively. They reported that increases linearly as x increases up to 32 mol. %, where in the glass structure, NMR indicates BO4 populations increase at the expense of BO3. Kluvanek et al. [21] reported the absence of MGFE while studying (Li2O)0.4•(B2O3) (0.6x)•(Si2O4)0.6(1-x) glasses with x = 0 to 0.8, and found an increase in DC conductivity from silicate-rich to borate-rich glasses. Neyret et al. [23] studied the role of alkali on borosilicate glass structure and showed that ionic conductivity decreases as silica polymerization increases.
2.2. Glass Transition Temperature Literature
Techniques such as Differential Thermal Analysis (DTA) or Differential Scanning Calorimetry (DSC) are commonly used to measure Tg [13]. In general, borate glasses tend to have lower Tg, in contrast to higher Tg silicate glasses [24]. The introduction of alkali oxide, such as Li2O, into the glass composition can induce variations in Tg for borate, borosilicate, and silicate glasses. For instance, Kodama et al. [25] conducted a study on the xLi2O• (1–x) B2O3 glass series and measured changes in Tg from 245 to 490 °C, while varying x from 0 to 0.28. Avramov et al. [26] investigated binary xLi2O•(1–x)B2O3 and xLi2O•(1–x)SiO2 glasses, where x is varied from 0.01 to 0.6, and reported that Tg increases for borate compositions, reaching a maximum at x = 0.3, while for silicate compositions, Tg decreases linearly with increasing Li-content.
Boekenhauer et al. [27] explored the relationship between glass transition temperature and structure in a series of lithium borosilicate glasses taking the account the composition-related structural parameters R and K, where R and K as proposed by Yun and Bray [28], Yun et al. [29], and Dell et al. [30] in Na-borosilicate glass are given by:
where, M = Alkali atom
K = [SiO2] (mol. %) / [B2O3](mol.%)
and R = [M2O] (mol. %) / [B2O3](mol.%)
Boekenhauer et al. considered a wide range of Li2O to B2O3 ratios or R, where 2 ≤ R ≤ 10, for several fixed SiO2 to B2O3 ratios or K, where K = 0.5, 1, 2, or 3. The study discovered two maxima in Tg for each SiO2 to B2O3 ratio in the borosilicate glass series. The first maximum is associated with the largest tetrahedral BO4 population, while the second maximum is linked to the glass separating into Lithium borate and Lithium silicate domains. Neyret et al. [23] reported that Tg increases with increase in silicate polymerization in Lithium, Sodium, and Potassium borosilicate glasses.
2.3. Raman Spectroscopy Literature
2.3.1. Borate Glasses
The Raman spectra of borate glasses doped with alkali ions have been studied extensively, where various borate structural units have been assigned to specific spectral features [31,32,33,34,35,36]. Krogh-Moe’s work [37] indicates that vitreous B2O3 consists of a random network of linked boroxol ([B3O6]3-) rings and isolated BO3 triangles. In another study [33], a strongly polarized band near 806 cm-1 is attributed to the symmetric breathing in boroxol rings. In Kamitsos et al. [34], a weak, broad band near 1260 cm-1 is assigned to B-O stretch in BO3 triangles within both isolated rings and more polymerized borate networks. However, the introduction of alkali oxide, M2O (M = Li, Na, K, Rb, Cs), into the borate network generates diverse isolated poly-borate species. This structural transformation is confirmed in multiple studies [31,32,33,34,35] investigating alkali borate glasses spanning a range of M2O concentrations. Mozzi and Warren’s findings [38] establish that the addition of M2O disrupts boroxol rings, altering the coordination of some boron atoms from 3 to 4, that leads to the formation of planar rings containing linked BO3 and BO4 configurations (i.e., diborate, triborate, tetraborate, pentaborate, etc. [32]. This introduction of M2O gradually decreases the intensity of the 806 cm-1 band, and a new band emerges at 770 cm-1. For M2O concentrations exceeding 20 mol.%, the 806 cm-1 band disappears, while the 770 cm-1 band shifts to lower frequencies as the M2O content surpasses 30 mol.% [34]. According to Bril [39], the 770 cm-1 band is assigned to symmetric breathing vibrations of six membered rings (in an alternating arrangement of three boron atoms and three bridging oxygens (BOs)), each with one BO4 tetrahedron and two BO3 triangles (i.e., triborate, tetraborate, pentaborate). At higher alkali content, the 770 cm-1 band shifts to lower frequencies, and is attributed to six membered rings with two BO4 tetrahedra and one BO3 triangle (i.e., diborate, ditriborate, or dipentaborate).
An extensive Raman study of binary borate glasses across a wider range of alkali, M, concentrations [34] yielded comparable assignments for structural groups within the borate networks. For glasses with M2O compositions below 35 mol. % [40], the 770 cm-1 band corresponds to tetraborate, pentaborate, or triborate groups. In glasses with M2O concentrations ranging from 15% to 45 mol. %, the 1100 cm-1 band is attributed to diborate units [41,42]. For borate glasses with alkali contents exceeding 40 mol. %, isolated diborate groups are assigned to the 500 cm-1 band [42]. Similarly, in Kamitsos’ study [40] of magnesium sodium borate glasses, the presence of pyroborate (850 cm-1) and orthoborate (945 cm-1) are reported in accordance with the spectra of crystalline pyroborate and orthoborate compounds [31,43].
Dwivedi et al. [44] studied xLi2O•(1-x) B2O3 glasses, at 0.1<x<0.5, where 760-780 cm-1 features are assigned to breathing vibrations of six membered rings containing both BO3 triangles and BO4 tetrahedra (e.g., ditriborate and dipentaborate units). A band near 855 cm-1 is assigned to pyroborate units, where x > 0.25. A broad band near 500 cm-1 is also assigned to pentaborate, tetraborate and diborate units, which shifts to near 550 cm-1 as alkali content increases. In another study of Lithium borate glasses [32], the 550 cm-1 band is also assigned to diborate units at 50 mol. % Li2O.
Konijnendijk and Stevels [32] studied the Raman spectra of xM2O• (1-x) B2O3 glasses, where M = Na and K, and 0.05 < x < 0.35. They observed that the introduction of M2O up to 20 mol. % disrupts boroxol ring formation, resulting in the creation of tetraborate groups. As the M2O content increases, tetraborate groups (assigned to the 770 cm-1 band) transform into diborate groups, corresponding to the 755 cm-1 band. However, recent research on lithium diborate (Li2O•2B2O3) glasses [34] has questioned the 755 cm-1 diborate assignment, and instead, assigned internal diborate displacements to a band near 1100 cm-1. Additionally, various other structural units with non-bridging oxygens (NBOs), such as pyroborate (840 cm-1), orthoborate (940 cm-1), ring type metaborate (630 cm-1), and chain type metaborate (730 cm-1), are created where alkali content is greater than 30 mol. % [32,33,34]. In a study of Cs2O•B2O3 glasses, Kamitost et al. [35], similarly assign 725, 675, and 625 cm-1 bands to chain type metaborate groups, based on comparisons with the spectra of crystalline Li2O•B2O3, which contains these structural units.
The Raman scattering observed in the high-frequency region (1300 – 1500 cm⁻¹) corresponds to the B-O stretching vibrations. These vibrations specifically involve NBOs and are integral components of a connected borate network. The band centered around 1400 cm-1 is assigned to BO3 units bonding to BO4 units while the band at around 1480 cm-1 is assigned to BO3 units bonding to other BO3 triangles [30,31,32,33,45], which has also been used for borosilicate glasses [45,47].
2.3.2. Silicate Glasses
Silica glasses consist of a fully polymerized three-dimensional framework of SiO4 tetrahedra, and the addition of alkali oxide to the glass results in the depolymerization of the network and the creation of NBOs [13]. Larger NBO populations are linked with increasing alkali content. Alkali silicate glass consists of various species of silicate tetrahedra with different numbers of BOs and NBOs. The Raman spectra of alkali silicate glasses can be divided into two frequency ranges depending on the type of vibrational modes associated with the spectral features [47,48,49,50,51]. The highly polarized broad envelope below 650 cm-1 is due to longer-range displacements within the silicate tetrahedral network, such as Si-O-Si symmetric bend modes [47,48]. In contrast, the envelope between 850 to 1140 cm-1 is comprised of four to five component bands assigned to localized Q-species Si-O stretch modes within SiO4 tetrahedra linked to zero to four neighboring silicate tetrahedra (Q0 to Q4 units), respectively [51]. Components between 1040 and 1140 cm-1 have been assigned differently. McKeown et al. [50] reported a component at 1100 cm-1 is due Q3 species. On the other hand, Seuthe et al. [52] while studying xLi2O•yNa2O• (100-x-y) SiO2 glasses, where (x = 23, 12; y = 11, 22), suggests that Q3 modes are assigned to two bands near 1040 cm-1, and Q4 units are assigned to a component near 1140 cm-1. From fitting Gaussian components to this Q-species envelope, Zotov and Keppler [53,54] determined component peaks near 950, 1020, 1080, and 1140 cm-1 are due to Q2, Q3’, Q3’’, and Q4 Si-O stretch modes, respectively. A Q3’ tetrahedron is connected to several combinations of Q3 and Q4 tetrahedra, where at least one of the three nearby tetrahedra is Q3; on the other hand, Q3’’ units are connected to three Q4 tetrahedra [51].
2.3.3. Borosilicate Glasses
Regarding borosilicate glasses, the Raman spectra have vibrational components originating exclusively from the borate or silicate structural units, as well as from structural units containing linked borate and silicate polyhedra. Raman features within the 450–800 cm⁻¹ frequency range stem from longer-range bond bending vibrations occurring in various BO environments, including Si-O-Si [47], B-O-B [55], and B-O-Si [47,55]. The band near 550 cm⁻¹ is attributed to the Si-O-Si bending vibrations [47,48]. Manara et al. [45] observed a prominent band near 586 cm⁻¹ in the spectra of Na-borosilicate glasses and assigned this feature to a breathing mode within reedmergnerite rings, comprising of three SiO4 tetrahedra and one BO4 tetrahedron [55,56]; the mineral, reedmergnerite, has its most intense Raman peak at 586 cm⁻¹ [57]. Similarly, another borosilicate structure to consider is the danburite ring that has two SiO4 tetrahedra and two BO4 tetrahedra [56]. The mineral, danburite, has its most intense Raman peak at 614 cm⁻¹ [58,59]. As a result, Manara et al. [45] report a band near 630 cm⁻¹ for their Na-borosilicate glasses that may correspond to the breathing mode of danburite rings.
At higher frequencies two broad Raman envelopes are observed. In the silicate Q-species 850-1250 cm⁻1 frequency range, it is likely that some contributions come from Si-O and B-O stretch within mixed Q-species modes that include SiO4 and BO4 tetrahedra. In the 1300 – 1500 cm⁻¹ range, the band centered around 1380 cm⁻¹ is assigned to BO3 units bonded to BO4 units, while the band at around 1475 cm⁻¹ is assigned to BO3 units linked to BO3 units, as seen in alkali borate systems. Indeed, in the alkali borosilicate glass system, the glass network comprises of silicate or borosilicate Q-species units possibly linked to BO3 triangles in varying proportions determined by silica, borate, and alkali content [45,55,60].
2.4. Spinodal Decomposition in Glasses
Alkali silicate and borosilicate glasses have historically been known to exhibit phase separation [61]. During the cooling process, liquid silicate mixtures undergo phase separation into two distinct phases. This separation occurs as a kinetic process like to nucleation or spinodal decomposition. Nucleation predominates when the volume fraction of particles is small, whereas spinodal decomposition occurs when the volume fraction of the separating phases is nearly identical, resulting in an interconnected structure [13].
The occurrence of phase separation is guided by the Gibbs free energy of the potential phases. In regions of the phase diagram where the second derivative of the Gibbs free energy with respect to composition is negative, there exists no barrier to phase growth [62]. According to Cahn [62], this transformation proceeds through a continuous alteration in the composition of the growing phases while maintaining their extent unchanged. The composition shift occurs within a regular three-dimensional array and continues until the compositions of the two phases reach equilibrium values, forming an interconnected structure. The properties of glasses change phase separation. Notably, the electrical conductivity of a phase-separated glass increases, mainly if the phase with higher conductivity forms a continuous network.
3. Experimental
3.1. Glass synthesis
A glass series with the nominal composition 30Li2O•(67-x) •B2O3•(x)SiO2•3Al2O3, with x = 0, 7, 17, 27, 37, 47, 57, 67, was prepared by conventional melting and quenching methods. Reagent grade chemicals, Li2CO3 (Alfa Aesar), SiO2, B2O3 (Sigma Aldrich), and Al2O3 (Alfa Aesar), were mixed in various stoichiometric ratios. Each mixture was melted in an alumina crucible placed in a Deltech (DT29-BL56-E2404) furnace. The glass was formed by quenching the corresponding viscous melt between two copper plates. The series end-member glasses are named 67B and 67Si to signify lithium alumino-borate and lithium alumino-silicate glass, respectively. The other glasses are labeled as 67-xBxSi with the x values outlined above (Figure 1).
X-ray diffraction (XRD), X-ray Fluorescence Spectroscopy (XRF), and Differential Thermal Analysis (DTA) were all performed using glass powder produced after crushing and grinding a few pieces of each quenched glass. For Raman and electrical conductivity measurements, we used 1 mm uniform thickness 2000 grit polished glass fragments. XRD measurements from 10° to 80° 2Ɵ were performed using a Rigaku SmartLab-SE Ɵ-Ɵ diffractometer that verified the glass samples were amorphous. XRF analyses were run on each glass to determine chemical composition using a PANalytical Wavelength dispersive Axios max advanced system, with SuperQ analysis software. Lithium and Boron characteristic XRF lines are too low in energy to be routinely measured by the system; and as a result, Li2O and B2O3 target concentrations from each glass recipe are listed in Table 1.
For the SEM micrograph, a fragment of a glass was embedded in epoxy, ground, polished. The polished glass fragment was etched with 5 mol.% of Hydrogen Fluoride (HF) for 10 second expose. After thorough cleaning and drying, the HF etched glass was carbon coated. SEM of the carbon-coated samples was carried out with a JEOL JSM 6300 scanning electron microscope using 10 kV accelerating voltage. The SEM images of HF etched pieces of 50B17Si (Figure 2a) and 30B37Si (Figure 2b) glasses indicate the initiation of nano-scale phase separation.
Tg temperatures were measured using a Perlin Elmer DAT7 system at a heating rate of 10°C/min from 200°C to 1000 °C (Figure 3). DTA system calibration was done using quartz, alumina, and gold standards.
3.2. Electrical Conductivity Measurements
DC resistivity (ρ) was measured for each sample under ohmic conditions by using a MMR Technologies H50 Van der Pauw four-probe apparatus [63] that was scanned from 50 to 170 oC to an accuracy of 0.5 oC. Silver electrodes were attached to the top edges of each sample with Silver paste. Each sample was then mounted on the top of an Watlow ceramic heater with thermal grease. The current was varied from 10−6 to 10−11 A, as the apparatus temperature was scanned from 170 to 50 oC. All electrical measurements were performed in vacuum below 8 to 10 milli-Torr. The reciprocal of the resistivity obtained from the measurement provides the glass conductivity values with an estimated uncertainty of 5.5% (Figure 4).
3.2. Raman Spectroscopy
Raman spectra were gathered on polished glass pieces using a WITec alpha-300 RA+ micro-Raman system with a 532 nm solid-state DPSS laser. An 1800 gr/mm grating was used to disperse the Raman signal onto a 1024 x 128 element Peltier-cooled CCD camera (Andor Technology, Model DV401A-BVF-352). A 50x Zeiss objective used in the data collection that produced a ~1 µm diameter laser spot on the sample; laser power of 36 mW was measured at the sample position. An analyzer polarizer was inserted into the Raman scattered light path while the incident laser light polarization could be rotated to be parallel or perpendicular with respect to the scattered light polarization direction to collect parallel and cross polarized spectra, respectively. The spectra were the frequency calibrated to the Si 520 cm-1 mode. The parallel Raman spectrum for each glass was reduced and rescaled [64] for the purpose of comparison and analysis (Figure 7).
The reduced parallel polarized spectra were then fitted with Gaussian peak functions using program IGOR [65]. To interpret these spectra, we employed a fitting procedure involving 13 Gaussian components. Fitting of the 10 highest frequency Gaussian components to the experimental spectra allowed us to provide a vibrational assignment to each component as outlined in the literature [31,32,33,34,35,36,37,38,39,40,41,42,43,44,45,46,47,48,49,50,51,52,53,54,55]. We ignore spectral trends below 400 cm-1 due to the dominance of Rayleigh scattered intensity that contain little, if any, structural information. Initially, we focused on the two end members of the glass series. By determining the Gaussian peak parameters to the spectral features for these two glasses, we determined trends with respect to composition for the whole glass series. Subsequently, Gaussian component vibrational assignments were checked to ensure consistency with those from the literature for borate [31,32,33,34,35,36,37,38,39,40,41,42,43,44], silicate [47,48,49,50,51,52], and borosilicate [45,55,66,67] glasses (Figure 8a–d).
4. Results
4.1. Glass Transition Temperature (Tg)
Tg can be regarded as being proportional to bond strength and polymerization within glass structure [13]. In general, for the glass series studied here, Tg increases with silica content, indicating an overall increase in bond strength (Table 2, and Figure 3), which would be anticipated as more weakly bonded and isolated borate units being replaced by more polymerized silicate tetrahedra. However, Tg has a localized maximum at 40B27Si glass and then rises significantly to the silicate glass end-member. This non-linear behavior indicates that the structure is undergoing a secondary transition near this composition, which may indicate more subtle structural changes compared those occurring for the whole glass series.
4.2. Electrical Conductivity (σ)
Electrical conductivityσ relationships with temperature can be shown in the log σ versus 1000/T plots (Figure 4), which are based on the Arrhenius equation. The plotted data confirm that temperature plays an important role in facilitating the mobility of Li+ charge carriers, such that increasing temperature boosts electrical conductivity in these glasses.
We generally observe a decrease in σ from boron-rich (67B) to silica-rich (67Si) glass (Figure 4). 67B glass has the highest σ (1.41×10⁻⁷ S/cm at 50 °C) with the lowest Ea (0.50±0.02 eV), while 67Si exhibits the lowest σ (4.27 ×10⁻⁹ S/cm at 50 °C) with the highest Ea (0.68±0.02 eV) in the 50 to 170 °C temperature range. We also observe a shallow minimum in σ for 40B27Si glass throughout this temperature range that indicates some secondary structural adjustments are taking place compared with the overall structural changes across the glass series where B is replaced by Si. This minimum generally becomes more pronounced at lower temperatures. As expected, there is a consistent increase in activation energy (calculated from σ) from 67B to 67Si glass, with a shallow maximum for 40B27Si glass (Figure 6).
4.3. Raman Spectroscopy
Reduced parallel- and cross-polarized Raman spectra for the glass series provide a basis for our glass structure determinations and corresponding structural changes with respect to glass chemistry. The parallel polarized spectra have more information and show continuous changes (Figure 7) that have been quantified by Gaussian fitting, where Gaussian peak position and area results are presented in Table 3, Table 4 and Table 5. Comparing the general Raman spectral features and trends can be done by dividing the spectra into borate-dominated, borosilicate, and silicate-dominated glass groups. According to vibrational assignments presented in the literature, we can group these spectral trends into 450–800 cm-1, 850–1250 cm-1, and 1300–1500 cm-1 frequency ranges.
4.3.1. Borate Dominated 67B, 60B7Si, and 50B17Si Glasses
The low-frequency range can be described by four Gaussian bands, centered near 527, 612, 703, and 772 cm-1 (Table 3). We assign the band near 527 cm-1 for 67B glass to diborate units (Figure Figure 8a, Figure 9, and Figure 10) [29,41]. The minor peak near 610 cm-1 is assigned to ring type metaborate units while the band near 703 cm-1 is assigned to chain type metaborate (polymerized BO3) modes (Figure 8a) [39,40]. The prominent 772 cm-1 feature has been assigned to tetraborate, pentaborate, or triborate groups (Figure 8b) in the literature [31,38,40]. Since tetraborate groups contain pentaborate and triborate configurations, we simplify our assignment of this 772 cm-1 band to symmetric vibrations within the linked tetraborate rings (Figure 8b).
In the 850-1200 cm-1 frequency range, the small band at 857 cm-1 for 67B glass spectrum is assigned to pyroborate groups (Figure 8a) [35]. Based on Kamitsos’s study [42], we assign the band near 970 cm-1 to orthoborate units (Figure 8a) [32,43,65]. We assign more localized (possibly B-O (non-bridging) stretch) displacements in diborate units for the band near 1114 cm-1 (Table 3) from findings in the literature for alkali borate glasses [55,66,68]. The band near 1228 cm-1 for 67B glass is assigned to symmetric B-O stretch of planar BO3 units [32,46,55].
The 1300–1500 cm-1 envelope in the spectrum for 67B glass is fit with two Gaussian components. The 1380 cm-1 band is assigned to vibrations of BO3 units linked to BO4 tetrahedra, while the 1480 cm-1 band is assigned to BO3 linked to other BO3 triangles [31].
The 60B7Si spectrum is nearly identical to that of 67B glass (Figure 10). Diborate group vibrations are assigned to the band at 527 cm-1 that increases area and shifts to 543 cm-1 for 50B17Si glass (Table 3). Increasing SiO2 concentration in 50B17Si probably cause the further rupturing of the more complex triborate, tetraborate, and pentaborate groups (Figure 8b), while promoting the formation of the simpler diborate species. The band near 600 cm-1 assigned to ring type metaborate units loses area and disappears for 50B17Si glass. The area under the 700-735 cm-1 shoulders for 67B glass (assigned to chain type metaborate units) shifts to 690 cm-1 for 50B17Si glass. Similarly, the major band near 772 cm-1 steadily decreases area for 60B7Si and 50B17Si. There is no substantial alteration observed in the pyroborate band around 850 cm-1 and the orthoborate band near 950 cm-1 in the 67B, 60B7Si, and 50B17Si glass compositions. Diborate units persist in 60B7Si and 50B17Si glasses as shown by increasing area for the Gaussian component near 1110 cm -1. Areas for the 1380 cm-1 and 1480 cm-1 BO3-related bands decrease from 67B to 50B17Si glass showing fewer BO3-BO3 and BO3-BO4 linkages.
4.3.2. 40. B27Si and 30B37Si Borosilicate Glasses
The introduction of 27 mol. % silica to 40B27Si glass results in noticeable changes in the Raman spectra compared with the more borate-rich glasses (Figure 7). This silica increase appears to disrupt the six-membered borate rings, thereby facilitating the formation of borosilicate rings within these glasses. The Gaussian component, centered near 540 cm-1, can be attributed to B-O-B [55] and B-O-Si [48,55] bending modes (Table 4). A similar band is observed for 30B37Si glass (Figure 11, and Figure 12), where the area is smaller and can be assigned to B-O-B [55], B-O-Si [48,55], as well as Si-O-Si [47,48] motions. A Gaussian component at 681 cm-1 for 40B27Si is assigned to the chain type metaborate units.
Additionally, borate tetrahedra in mixed danburite-type four-membered rings (Figure 8d) may be forming [55]. For the SiO2 - Na2O - B2O3 glass system, Manara et al. [45] attributed the band at 630 cm-1 to danburite ring breathing modes; however, in 30B37Si glass, Li replaces Na with respect to the glasses studied by Manara et al., which has a smaller ionic radius and larger charge density that can shift this danburite ring feature to higher frequencies. Consequently, we assign the Gaussian component band at 664 cm-1 to danburite ring motions within 30B37Si glass ((Figure 11, Figure 12, and Table 4). Like in other alkali borate glasses [34,36], the Gaussian component band at 772 cm-1 is assigned to tetraborate displacements and decreases area as the glasses become more silica-rich, until this component disappears in the Gaussian fitting procedure for 20B47Si and the more silica-rich glasses.
In the silicate Q-species 850-1250 cm-1 frequency range, it is possible that some contributions come from Si-O and B-O stretch mixed Q-species modes, which can include silicate and borate tetrahedra (Figure 8d). The area under the orthosilicate-pyroborate Gaussian component near 850 cm⁻¹ remains relatively constant (Table 4). Areas decrease for the 950 and 1080 cm-1 bands, that can be assigned to Q2 and Q3’’ species Si-O stretch modes (Figure 8c), respectively [46,47,48,69,70], while Q3’ and Q4 species components (Figure 8c) at 1020 and 1140 cm-1, respectively, have increasing areas from 40B27Si to 30B37Si glass, indicating a more polymerized borosilicate network.
4.3.3. Silicate Dominated 20B47Si, 10B57Si, and 67Si Glasses
In the lower frequency region from 450 to 800 cm⁻¹ most mode assignments are associated with Si-O-(Si, B) displacements. We observe two major Gaussian components near 530 and 585 cm-1 (Table 5) that are associated with Si-O-Si symmetric bending motions [48,53]. The 530 cm-1 feature loses area and decreases frequency for the two more silica-rich glasses, suggesting BO4 tetrahedra and BO3 triangles are being replaced by the higher mass SiO4 tetrahedra in the network. For the more silica-rich 20B47Si glass, the Gaussian component at 641 cm-1, may be assigned to displacements within more silica-rich reedmergnerite rings (Figure 8d) [55]. A band near 601 cm-1 for 10B57Si glass is associated with Si-O-Si, Si-O-B, and B-O-B bending vibrations [53,67,69]. Moreover, a weak feature near 690, 673, and 685 cm-1 in the spectrum for 20B47Si, 10B57Si and 67Si glass ((Figure 7, Figure 13 and Figure 14), respectively, is assigned to stretching-bending motions in Si-O-Si bonds found for a calculated 654 cm-1 mode for Na-silicate glasses [48]. A weak Gaussian component within the 770 to 790 cm-1 range for 20B47Si and 10B57Si glasses may be due to remnant contributions from tetraborate units, while for 67Si glass this component becomes more prominent (Figure 7 and Figure 14) and may be equivalent to (Si, Al)O4 tetrahedral ‘cage’ vibrations in Na-aluminosilicate glasses [50], or Si-O-Si modes in (Na, Ca) aluminosilicate glasses [71].
The prominent Si-O stretch Q-species 850-1250 cm-1 envelope was fit with five Gaussian components for the 20B47Si, 10B57Si, and 67Si glasses. The band near 850 cm-1 was fit with the 890 to 870 cm-1 Gaussian component (Table 5) and is assigned Si-NBO stretch motions in orthosilicate or Q0 structural units [72]. The Gaussian component near 940 to 950 cm-1 is assigned to Q2 species modes [51,74]. Gaussian bands near 1015 cm-1 and 1080 cm-1 are assigned to Q3’ and Q3’’ species, respectively [49,50,51,73]; and these bands generally shift to slightly lower frequencies from 20B47Si to 67Si glass, possibly due to Si replacing B in the network (Table 5). The Gaussian component near 1150 cm-1 is assigned to Q4 species [74]. The Gaussian band areas at these frequencies generally increase as the boron content decreases. In the borate dominated glasses, a small Gaussian component near 1228 cm-1, assigned to B-O symmetric stretch within BO3 triangles [38,40], is observed for 20B47Si, and 10B57Si glasses, and absent in the 67Si glass spectrum (Table 5, Figure 7 and Figure 14).
Borosilicate glass Raman features from 1300 cm-1 to 1600 cm-1 are due to motions within BO3 triangles. As B content decreases, both the lower frequency BO2O-BO4 stretch Gaussian component near 1430 cm-1 and the BO2O-BO3 stretching component near 1490 cm-1 [31,55,60] decrease area, and are absent for 67Si glass (Figure 15).
5. Discussion
The Raman spectra of the glass series reveal distinct structural changes linked to composition. 67B glass clearly has isolated larger borate structural unit populations that include B and O six-membered rings in tetraborate and diborate units, as well as isolated smaller borate structural units that include orthoborate and pyroborate. However, as silica replaces borate, significant alterations are observed for bands associated with the lower frequency borate species, including metaborate, tetraborate, and pyroborate, as well as the higher frequency borate species including BO3-BO3 and BO3-BO4. These changes indicate borate units become less polymerized and fewer in number, as silica content increases (Figure 15). Additionally, in the 850-1200 cm-1 frequency range that are assigned to more localized atomic displacements, the borosilicate glass spectra show likely superpositions of ortho- and pyro-borate modes with silicate tetrahedra Q-species modes within the borosilicate networks.
Substantial changes in the Raman spectra are observed between 40B27Si and 30B37Si glasses, particularly from 500 cm-1 and 1200 cm-1. These changes likely indicate the formation of Si-O-B and Si-O-Si linkages in 4-membered borosilicate rings, such as those in the danburite and reedmergnerite crystal structures [56,57].
Yun and Bray [28] used ratios R and K to describe mechanisms of B/Si mixing and NBO creation in simplified ternary Na-borosilicate glasses with K < 8, based on experimental 11B, 17O, 23Na, and 29Si NMR analyses, as well as Raman spectroscopy. According to them, where R < 0.5, M2O-B2O3- SiO2 glass has structural units like M2O-B2O3 glass, and where R > 0.5, borate groups start to mix with silicate groups. Moreover, considering the role of K in the formation of borosilicate units, Dell et al. [30] proposed the critical composition R*, where:
R* = 0.5 + 0.0625K
When R < R*, Na+ interacts as a charge compensator for borate tetrahedra in the domain R < 0.5. For R > R*, as Na-borate glass is diluted by silica, NBOs start to form on the silicate tetrahedra [58]. For the glass series studied here, K ranges from 0 (67B) to 5.7 (60B7Si), where Li+ interacts as a charge compensator for BO4-, when R < 0.5 (Figure 1, and Table 2). Moreover, NBOs start to form on silicate tetrahedra in 40B27Si glass, where K = 0.68 and R = 0.75, that results in R* = 0.54, or R > R*. It is important to note that for R > 0.5, mixed borosilicate units are formed, as we see evidence of danburite-like and possibly, reedmergnerite-like 4-membered borosilicate rings in the Raman spectrum of 30B37Si glass (R = 1) (Table 2).
The fluctuation in Ea corresponds with changes in Tg (Figure 16). According to the Anderson-Stuart model [75] (Equation 3), the Ea for glasses is dependent on Eb between an anion site and a neighboring alkali cation, along with Es needed to deform the glass network. Larger Tg values are linked to more strongly bonded networks, requiring increased Es to deform the network. This, in turn, leads to elevated Ea and impeded ion mobility. From borate-rich to silicate-rich glasses studied here, increase in Tg infers increase in the glass network connectivity which hampers Li+ mobility, that results in decreased σ and increased Ea (Table 2, and Figure 16).
An interesting trend was observed in the electrical conductivity of the glass series. Generally, from borate-rich to silica-rich compositions, there is an overall decrease in electrical conductivity. However, there is a localized minimum for this trend at 40 mol. % B2O3, where conductivity increases from 40B27Si to 20B47Si (Figure 5). The binary 67B glass is the most conductive glass in the series, suggesting no mixed glass former effects (MGFE) across the glass series. Tatsumisago et al. [76] observed MGFE in rapidly quenched borosilicate glasses with larger alkali-oxide concentrations (Li2O > 60 mol. %) than those for the LABS glasses studied here.
Mai et al. [11] explored a broader spectrum of K and R ratios, spanning from 0.22 to 18 and 0.67 to 6.17, respectively, resulting in critical R* values ranging from 0.51 to 1.63, in their study of glass series 0.40Li2O•0.60xB2O3•1.2(1-x) SiO2, where x = 0 to 1, prepared by annealing the melt. Our study covers K and R ratios ranging from 0.12 to 5.70 and 0.45 to 3.00, respectively, produces R* values within the 0.51 to 0.86 range. However, the observed trend of decreasing electrical conductivity from boron-rich to silica-rich glasses, as reported in their study, aligns with our findings. Their reported Ea of 0.65 eV for the most conductive borate-rich glass and 0.80 eV for the least conductive silica-rich glass are slightly higher than the values in our study, which are 0.50 eV for the most conductive 67B glass and 0.68 eV for the least conductive 67Si glass (Figure 6). Our glasses obtained from quenching the melt, contain small amounts of Al2O3 (Table 1), which likely enhance ionic conduction, potentially resulting in lower Ea values for 67B and 67Si glasses. Furthermore, the Li2O/SiO2 ratio in the silica-rich glass studied by Mai et al. (0.33) is lower than that for 67Si (0.45), which might contribute to the higher Ea observed in their silica-rich glass.
Furthermore, Montouillout et al. [20] reported in their study on the correlation between the ionic conductivity of lithium borate glass, xLi2O-(1-x) B2O3 with x ranging from 0 to 50, and its local structure (studied by solid-state NMR), that from x ≈ 30, the formation of NBOs sites accompanied other structural changes, which aligns with the presence of pyroborate and orthoborate species in our 67B glass (Figure 9 and Figure 10). The presence of more BO4 sites with ionic bonding to Li+, along with some NBOs, results in the highest conductivity of the 67B glass among the series [77]. As silica content increases in the glass composition, borate polyhedra intermix with silicate tetrahedra, resulting in more polymerized borosilicate units such as danburite-like rings, which contribute to the slight increase in conductivity, especially for 30B37Si and 20B47Si glasses. As boron content continues to decrease and mixed borosilicate populations continue to diminish, conductivity decreases slightly as the glass becomes more silica-rich (Figure 5 and Figure 17).
The glasses studied here were prepared by conventional melting and quenching. We expect to obtain clear phase separation in the glass composition with a proper heat treatment, which we plan to explore in the subsequent studies of Lithium borosilicate glass. Two phases, both amorphous, have emerged from the careful selection of the relative amounts of SiO2 and B2O3. Both or one of these phases may be continuous in three dimensions. In a Lithium borosilicate glass, it occurs so that one of the phases—the B2O3-rich phase—contains the majority of the alkali ions, while the SiO2-rich phase is nearly empty of Li+ ions. Such a composition can be thought of as having glassy SiO2 phase insulating Li+ ion-rich channels in a spinodal degraded glass slab. As a part of further research, the objective is to achieve spinodal decomposition by heat treating these glasses at temperatures below the spinodal dome (Figure 18) [78].
6. Conclusions
In summary, this study has revealed the relationships between glass composition, structural changes determined from Raman spectroscopy, σ and Tg. In 67B glass, isolated diborate, tetraborate, and orthoborate groups are prominent. However, substitution of boron with silicon leads to dissociation of linked borate polyhedra, resulting in the formation of borosilicate units as well as larger populations of isolated and linked silicate tetrahedra (Figure 17). 30B37Si and 20B47Si glass structures can be characterized by containing borosilicate rings, similar to those found in danburite and reedmergnerite, along with tetraborate, BO3-BO4, and BO3-BO3 units. As boron content continues to decrease, increasing numbers of silicate tetrahedra become more polymerized. The effect of such structural alterations is indicated by the relationships of σ and Tg with respect to glass composition. From 67B to 40B27Si glass, σ steadily decreases, while Tg steadily increases, until the trends reverse slightly for 30B37Si and 20B47Si glasses. This reversal in σ can be attributed to the presence danburite-like rings, which contain BO4- tetrahedra that act as local charge compensators for Li+. At the same time, the reversal in Tg may be caused by the increasing numbers of more weakly bonded borosilicate units compared to the polymerized silicate network units. However, the BO breathing mode for Si3O9 planar 3-membered rings is assigned at 608 cm-1 for silica glass [79], the trends in σ and Tg supports the danburite assignments with localized charge imbalances in the borosilicate network. Subsequent reduction in B2O3 content leads to fewer BO4- local charge compensators and more polymerized SiO4 tetrahedra that increasingly hinder Li+ mobility that results in decreasing σ. In this case, charge neutrality results when a SiO4 tetrahedron glass former links with four other SiO4 tetrahedra to create localized SiO40 in a silicate dominated glass, as well as a BO30 triangle would be formed if it is linked to three SiO4 tetrahedra. As more strongly bonded SiO4 tetrahedra replace more weakly bonded BO4 and BO3 units, stiffening of the borosilicate and silicate networks likely cause a further increase in Tg.
The understanding of the mixed glass former effect and phase separation induced by spinodal decomposition in lithium borosilicate glasses holds potentially important implications for the development of glass compositions for optimized electrical conductivity. Such optimizations can improve performance of glasses as solid-state electrolytes in Li+-batteries. These observations and resulting insights offer a foundation for further research and innovation in the field of glass science and materials engineering, ultimately driving the development of novel materials to meet evolving demands of technology and industry.
Author Contributions
Conceptualization, Amrit Kafle and Biprodas Dutta; methodology, Amrit Kafle; validation, Biprodas Dutta and Winnie Wong-Ng.; formal analysis, Amrit Kafle, Biprodas Dutta and David McKeown; investigation, Amrit Kafle and David McKeown; data curation, Amrit Kafle and David McKeown.; writing—original draft preparation, Amrit Kafle.; writing—review and editing, David McKeown, Biprodas Dutta, Winnie Wong-Ng, Meznh Alsubaie, and Manar Alenezi; visualization, Amrit Kafle, and David McKeown; supervision, Biprodas Dutta, and Winnie Wong-Ng ; funding acquisition, Ian Pegg. All authors have read and agreed to the published version of the manuscript.
Funding
This research was funded by Vitreous State Laboratory, the Catholic University of America.
Conflicts of Interest
The authors declare no conflicts of interest.
References
- Z. A. Gardy, C. J. Wilkinson, C. A. Randall, and J. C. Mauro, “Emerging Role of Non-crystalline Electrolytes in Solid-State Battery Research”, Front. Energy Res., Sec. Electrochemical Energy Storage, 2020, vol. 8.
- A. Chandra, A. Bhatt, and A. Chandra, “Ion Conduction in Superionic Glassy Electrolytes: An Overview,” J Mater Sci Technol, Mar. 2013, vol. 29, no. 3, pp. 193–208. [CrossRef]
- A. Pradel, and M. Ribes, “Ionic conductive glasses”, Materials Science and Engineering: B, 1989, vol. 3, pp. 45-56.
- Magistris, G. Chiodelli, and M. Duclot, “Silver boro-phosphate glasses: Ion transport, thermal stability and electrochemical behavior”, Solid State Ionics, 1983, vol. 9 – 10, pp. 611-615.
- S. A. Shuhaimi, R. Hisam, and A. K. Yahya, “Effects of mixed glass former on AC conductivity and dielectric properties of 70[xTeO2+(1-x) B2O3] +15Na2O+15K2O glass system,” Solid State Sci, 2020, vol. 107. [CrossRef]
- R. V. Salodkar, V. K. Deshpande, and K. Singh, “Enhancement of the ionic conductivity of lithium boro-phosphate glass: a mixed glass former approach,” J Power Sources, 1989, vol. 25, no. 4, pp. 257–263. [CrossRef]
- S. Kumar, P. Vinatier, A. Levasseur, and K.J. Rao, “Investigations of structure and transport in lithium and silver borophosphate glasses”, Journal of Solid-State Chemistry, 2004, vol. 177, pp. 1723–1737.
- A. Shaw and, A. Ghosh, “Dynamics of lithium ions in borotellurite mixed former glasses: Correlation between the characteristic length scales of mobile ions and glass network structural units,” Journal of Chemical Physics, 2014, vol. 141. [CrossRef]
- C. H. Lee, K.H. Joo, J. H. Kim, S. G. Woo, H. J. Sohn, T. Kang, Y. Park, and J. Y. Oh, “Characterizations of a new lithium ion conducting Li2O–SeO2–B2O3 glass electrolyte,” Solid State Ion, 2002, vol. 149, pp. 59–65, 2002. [CrossRef]
- S. S. Gundale, V. V. Behare, and A. V. Deshpande, “Study of electrical conductivity of Li2O-B2O3-SiO2-Li2SO4 glasses and glass-ceramics,” Solid State Ion, 2016, vol. 298, pp. 57–62. Solid State Ion. [CrossRef]
- L. F. Maia and A. C. M. Rodrigues, “Electrical conductivity and relaxation frequency of lithium borosilicate glasses,” Solid State Ion, 2004, vol. 168, no. 1–2, pp. 87–92. [CrossRef]
- K. Otto, “Electrical conductivity of SiO2-B2O3 glasses containing lithium or sodium,” Phys Chem Glasses, 1966, vol. 7, pp. 29–33.
- R. H. Doremus, Glass Science, Wiley, 1994.
- P. F. McMillan, “Structural studies of silicate glasses and melts: Applications and limitations of Raman spectroscopy”, American Mineralogist, 1984, vol.69, pp.622-644.
- R. E. Hummel, “Electrical Properties of Polymers, Ceramics, Dielectrics, and Amorphous Materials.” Electronic Properties of Materials: 2011, pp. 181–211, Springer, New York.
- S. J. Edward, “Optimization of fast ionic conducting glasses for lithium batteries “, Retrospective Theses and Dissertations. 3046, 2005. https://lib.dr.iastate.edu/rtd/3046.
- O. L. Anderson and D. A. Stuart, “Calculation of Activation Energy of Ionic Conductivity in Silica Glasses by Classical Methods”, Journal of American Ceramics Society, 1954, vol 37 (12), pp 553-582.
- A. A. Ramadan, R. D. Gould, and A. Ashour, “On the Van Der Pauw method of resistivity measurements.” Thin Solid Films, 1994, vol. 239 (2), pp. 272-275.
- A. Bunde, K. Funke, M. D. Ingram, “Ionic glasses: History and challenges.” Solid State Ionics, 1998, vol. 105(1), pp. 1-13.
- V. Montouillout, H. Fan, L. Campo, and S. Ory, “Ionic conductivity of lithium borate glasses and local structure probed by high-resolution solid-sate NMR,” Journal of Non-Crystalline Solids, 2018, vol. 484, pp. 57–64. [CrossRef]
- P. Kluvanek, R. Klement, and M. Karacon, “Investigation of the conductivity of the lithium borosilicate glass system”, Journal of Non-Crystalline Solids, 2007, vol. 353, pp. 2004-2007.
- J. Ketter, Electrochemical Impedance Spectroscopy: Basics of EIS, Gamry Instruments, 2022.
- M. Neyret, M. Lenoir, A. Grandjean, N. Massoni, B. Penelon, and M. Malki, “Ionic transport of alkali in borosilicate glass. Role of alkali nature on glass structure and on ionic conductivity at the glassy state”, Journal of Non-Crystalline Solids, 2015, vol. 410 (15), pp. 74 - 81.
- A. C. Wright, G. Dalba, F. Rocca, and N. M. Vedishcheva, Borate versus silicate glasses why are they so different, Physics and Chemistry of Glasses - European Journal of Glass Science and Technology, 2010, Part B, Volume 51, Number 5.
- M. Kodama, and S. Kojima, “Anharmonicity and fragility in lithium borate glasses.”, Journal of Thermal Analysis and Calorimetry, 2002, vol. 69, pp. 961-970.
- I. Avramov, Ts. Vassilev, and I. Penkov, “The glass transition temperature of silicate and borate glasses.”, Journal of Non-crystalline Solids, 2005, vol. 351, pp. 472- 476.
- R. Boekenhauer, H. Zhang, S. Feller, D. Bain, S. Kambeyanda, K. Budhwani, P. Pandikuthira, F. Alamgir, A. M. Peters, S. Messer, and K. L. Loh, “The glass transition temperature of lithium borosilicate glasses related to atomic arrangements.” Journal of Non-Crystalline Solids, 1994, vol. 175, pp. 137-144.
- Y. H. Yun, and P. J. Bray, “Nuclear magnetic resonance studies of the glasses in the system Na2O-B2O3-SiO2”, Journal of Non-Crystalline Solids, 1978, vol. 27 (3), pp. 363 – 380.
- Y. H. Yun, S. A. Feller, and P. J. Bray, “Correction and addendum to Nuclear Magnetic Resonance Studies of the Glasses in the System Na 2O-B 2O 3-SiO 2”, Journal of Non-Crystalline Solids, 1979, vol. 33 (2), pp. 273-277.
- W. J. Dell, P. J. Bray, and S. Z. Xiao, “11B NMR studies and structural modeling of Na2O-B2O3-SiO2 glasses of high soda content”, Journal of Non-Crystalline Solids, 1983, vol. 58(1), pp. 1-16.
- B. N. Meera, and J. Ramakrishna, “Raman spectral studies of borate glasses”, Journal of Non-crystalline Solids, 1993, vol. 159 pp.1 – 21.
- W. L. Konijnendijk, and J. M. Stevels, “The Structure of Borate Glasses Studied by Raman Scattering”, Journal of Non-crystalline Solids, 1975, vol. 18, pp. 307 – 331.
- W. L. Konijnendijk, and J. M. Stevels, “The Structure of Borosilicate Glasses Studied by Raman Scattering”, Journal of Non-crystalline Solids, 1976, vol. 20, pp. 193 – 224.
- E. I. Kamitsos, and G. D. Chryssikos, “Borate glass structure by Raman and infrared spectroscopies”, Journal of Molecular Structure, 1991, vol. 247, pp. 1 – 16.
- E. I. Kamitsos, M. A. Karakassides, and G. D. Chryssikos, “Structure of borate glasses: Pt. 1”, Physics and Chemistry of Glasses, 1989, vol. 30 (6), pp. 229 – 234.
- A. Winterstein-Beckmann, D. Möncke, D. Palles, E.I. Kamitsos, and L. Wondraczek, “A Raman-spectroscopic study of indentation-induced structural changes in technical alkali-borosilicate glasses with varying silicate network connectivity”, J Non Cryst Solids, 2014, vol. 405, pp. 196–206. [CrossRef]
- B. J. Krogh-Moe, “The Crystal Structure of Lithium Diborate, Li2O.2B2O3”, Acta Cryst., 1962, vol. 15, pp. 190 – 193.
- R. L. Mozzi, and B. E. Warren, “The structure of vitreous boron”, Journal of Applied Crystallography, 1970, vol. 3, pp. 251 – 257.
- 39. T. W. Bril, “Raman spectroscopy of crystalline and vitreous borates. [. Ph.D. Thesis, 1 (Research TU/e / Graduation TU/e), ” Chemical Engineering and Chemistry, Technische Hogeschool Eindhoven, 1976. [CrossRef]
- E. I. Kamitsos, A. Karakassides, and G. D. Chryssikost, “Vibrational Spectra of Magnesium-Sodium-Borate Glasses. 2. Raman and Mid-Infrared Investigation of the Network Structure”, Journal of Phys. Chem., 1987, vol. 91, pp. 11073 – 1079. [Online]. Available: https://pubs.acs.org/sharingguidelines.
- M. Martizez-Ripoll, S. Martinez-Carrera, and S. Garcia-Blanco, “The Crystal Structure of Zinc Diborate ZnB4O7”, Acta Cryst., 1971, vol. B27, pp.672-577.
- E. I. Kamitsos, and A. Karakassides, “Structural Studies of Binary and Pseudo Binary Sodium Borate Glasses of High Sodium Content”, Physics and Chemistry of Glasses, 1989, vol. 30 (1), pp. 19 – 26.
- R. Akagi, N. Ohtori, and N. Umesaki, “Raman spectra of K2O–B2O3 glasses and melts”, Journal of Non-Crystalline Solids, 2001, vol. 295, pp. 471–476.
- B. P. Dwivedi, M. H. Rahman, Y. Kumar, and B. N. Khanna, “Raman Scattering Study of Lithium Borate Glasses”, J. Phys. Chem. Solids, 1993, vol. 54 (5), pp. 621 – 628.
- D. Manara, A. Grandjean, and D. R. Neuville, “Advances in understanding the structure of borosilicate glasses: A Raman spectroscopy study”, American Mineralogist, 2009, vol. 94, pp. 777–784. [CrossRef]
- T. Yano, T. Kobayashi, S. Shibata, and M. Yamane, “High temperature Raman spectra of R2O-B2O3 glass melts”, Physics and Chemistry of Glasses, 2002, vol. 43C, pp. 90–95.
- T. Furukawa, and W. B. White, “Raman spectroscopic investigation of sodium-boro silicate glass structure”, Journal of materials Science, 1981, vol. 16, pp 2689-2700.
- T. Furukawa, K. E. Fox and W. B. White, “Raman spectroscopic investigation of the structure of silicate glasses. III. Raman intensities and structural units in sodium silicate glasses,” Journal of Chemical Physics, 1998, vol. 75, pp. 3226–3237.
- D. A. McKeown, A. C. Nobles, M. I. Bell, “Vibrational analysis of wadeite K2ZrSi 3O9 and comparisons with benitoite BaTiSi3O9”, Physical Review B, 1996, vol. 54, pp. 291.
- D. A. McKeown, F. L. Galeener, and G. E. Brown, “Raman Studies of AI Coordination in Silica-Rich Sodium Aluminosilicate Glasses and some Related Minerals,” Journal of Non-Crystalline Solids, 1984, vol. 68, pp. 361.
- D.A. McKeown, A. C. Buechele, C. Viragh, and I. L. Pegg, “Raman and X-ray absorption spectroscopic studies of hydrothermally altered alkali-borosilicate nuclear waste glass”, Journal of Nuclear Materials, 2010, vol. 399, pp. 13–25.
- T. Seuthe, M. Grehn, A. Mermillod-Blondin, J. Bonse, and M. Eberstein, “Compositional dependent response of silica-based glasses to femtosecond laser pulse irradiation, in Laser-Induced Damage”, Optical Materials, SPIE, 2013, pp. 88850M. [CrossRef]
- N. Zotov, H. Keppler, Phys. Chem, Miner., 1998, vol. 25, pp. 259.
- N. Zotov, H. Keppler, Am. Mineral, 1998, vol. 83, pp. 823.
- A. A. Osipov, L. M. Osipova, and V. E. Eremyashev, “Structure of alkali borosilicate glasses and melts according to Raman spectroscopy data”, Glass Physics and Chemistry, 2013, vol. 39, pp. 105–112. [CrossRef]
- M. W. Phillips, G. V. Gibbs, and P. H. Ribbe, “The crystal structure of danburite: A comparison with anorthite, albite, and reedmergnerite”, American Mineralogist, 1974, vol. 59, pp. 79–85.
- G. Johansson, “A Refinement of the Crystal Structure of Danburite”, Acta Cryst., 1959, vol. 12, pp. 522-526.
- B. C. Bunker, D. R. Tallant, R. J. Kirkpatrick, and G. L. Turner, “Multinuclear nuclear magnetic resonance and Raman investigation of sodium borosilicate glass structures”, Physics and Chemistry of Glasses, 1990, vol. 31, pp. 30–41.
- D. Manara, A. Grandjean, D. Neuville, “Structure of borosilicate glasses and melts: A revision of the Yun, Bray and Dell model”, Journal of Non-Crystalline Solids., 2009, vol. 355, pp. 2528-2531.
- A. A. Osipov, and L. M. Osipova, “Structure of lithium borate glasses and melts: investigation by high-temperature Raman spectroscopy”, European Journal of Glass Science and Technology, 2009, vol. 50, pp. 343–354.
- W. E. S. Turner, and F. Winks, J. Soc. Glass Tech., 1926, vol. 10, pp. 102.
- J. W. Cahn, Acta. Mate., 1961, vol. 9, pp. 745.
- Van der Pauw, L.J. , “A method of measuring the resistivity and Hall coefficient on lamellae of arbitrary shape”, Philips Technical Review, 1958, vol. 20, pp. 220-224.
- P. Umari, and A. Pasquarello, “First-principles analysis of the Raman spectrum of vitreous silica: comparison with the vibrational density of states”, J. Phys.: Condens. Matter, 2003, vol. 15, S1547.
- Igor Pro Manual, Version 6.3, 2015. [Online]. Available: http://www.wavemetrics.com/.
- G. D. Chryssikos, J. A. Kapoutsis, A. P. Patsis, and E. I. Kamitsos, “A classification of metaborate crystals based on Raman spectroscopy”, Spectrochimica Acta Part A: Molecular Spectroscopy, 1991, vol. 47(8), pp. 1117 – 1126.
- W. L. Konijnendijk, “The structure of borosilicate glasses”, 1975, [Phd Thesis 1 (Research TU/e / Graduation TU/e), Chemical Engineering and Chemistry]. Technische Hogeschool Eindhoven. [CrossRef]
- A. A. Osipov, and L. M. Osipova, “Structural studies of Na2O B2O3 glasses and melts using high-temperature Raman spectroscopy”, Physical Condens Matter, 2010, vol. 405, pp. 4718–4732. [CrossRef]
- A. A. Osipov, and L. M. Osipova, “Structure of lithium borate glasses and melts: investigation by high-temperature Raman spectroscopy”, European Journal of Glass Science and Technology, 2009, vol. 50, pp. 343–354.
- A. A. Osipov, and L. M. Osipova, “Structure of glasses and melts in the Na2O-B2O3 system from high-temperature Raman spectroscopic data: I. Influence of temperature on the local structure of glasses and melts”, Glass Physics and Chemistry, 2009, vol. 35, pp. 121–131. [CrossRef]
- S. Petrescu, M. Constantinescu, E.M. Anghel, I. Atkinson, M. Olteanu, and M. Zaharescu, “Structural and physico-chemical characterization of some soda lime zinc alumino-silicate glasses”, Journal of Non-crystalline Solids, 2012, vol. 328, pp. 3280-3288.
- N. Umesaki, M. Takahashi, M. Tatsumisago, and T. Minami, “Raman spectroscopic study of alkali silicate glasses and melts”, Journal of Non-Crystalline Solids, 1996, vol. 205, pp. 225-230.
- D. A. McKeown, I. S. Muller, A. C. Buechele, I. L. Pegg, and C. A. Kendziora, “Structural characterization of high-zirconia borosilicate glasses using Raman spectroscopy”, Journal of Non-crystalline Solids, 2000, vol. 262 (1 – 3), pp. 126 – 134.
- B. O. Mysen and J., D. Frantz, “Raman spectroscopy of silicate melts at magmatic temperatures: Na2O-SiO2, K2O-SiO2 and Li2O-SiO2 binary compositions in the temperature range 25-1475 °C,” Chemical Geology, 1992, vol. 96, pp. 321-332. Chemical Geology.
- M. Nascimento, and N. O. Dantas, “Anderson-Stuart model of ionic conductors in Na2O-SiO2 glasses,” Science & Engineering Journal, 2003, vol. 12(1), pp. 07-13.
- M. Tatsumisago, K. Yoneda, N. Machida, and T. Minami, “Ionic conductivity of rapidly quenched glasses with high concentration of lithium ions”, Journal of Non-Crystalline Solids, vol. 95, 1987, pp. 857 - 864.
- A. C. Wright, “My borate life: an enigmatic journey”, Int. J. Appl. Glass Sci., 2015, vol. 6, pp. 45-63.
- E. A. Porai-Koshits, V. V. Golubikov, and A. P. Titov, “ The fluctuation structure of vitreous boron oxide and two-component alkali borate glasses.”, Borate Glasses, Structure, Properties, Application, Materials Science Research, 1978, vol. 12, pp. 183-199.
- F. L. Galeener, “Planar rings in glasses”, Soild State Commun., 1982, vol. 44, pp. 1037-1040.
Figure 1.
Li2O-B2O3-SiO2 ternary diagram with the LABS series glass compositions (green squares on red line) with some R (pink) and K (blue) ratio values displayed.
Figure 1.
Li2O-B2O3-SiO2 ternary diagram with the LABS series glass compositions (green squares on red line) with some R (pink) and K (blue) ratio values displayed.
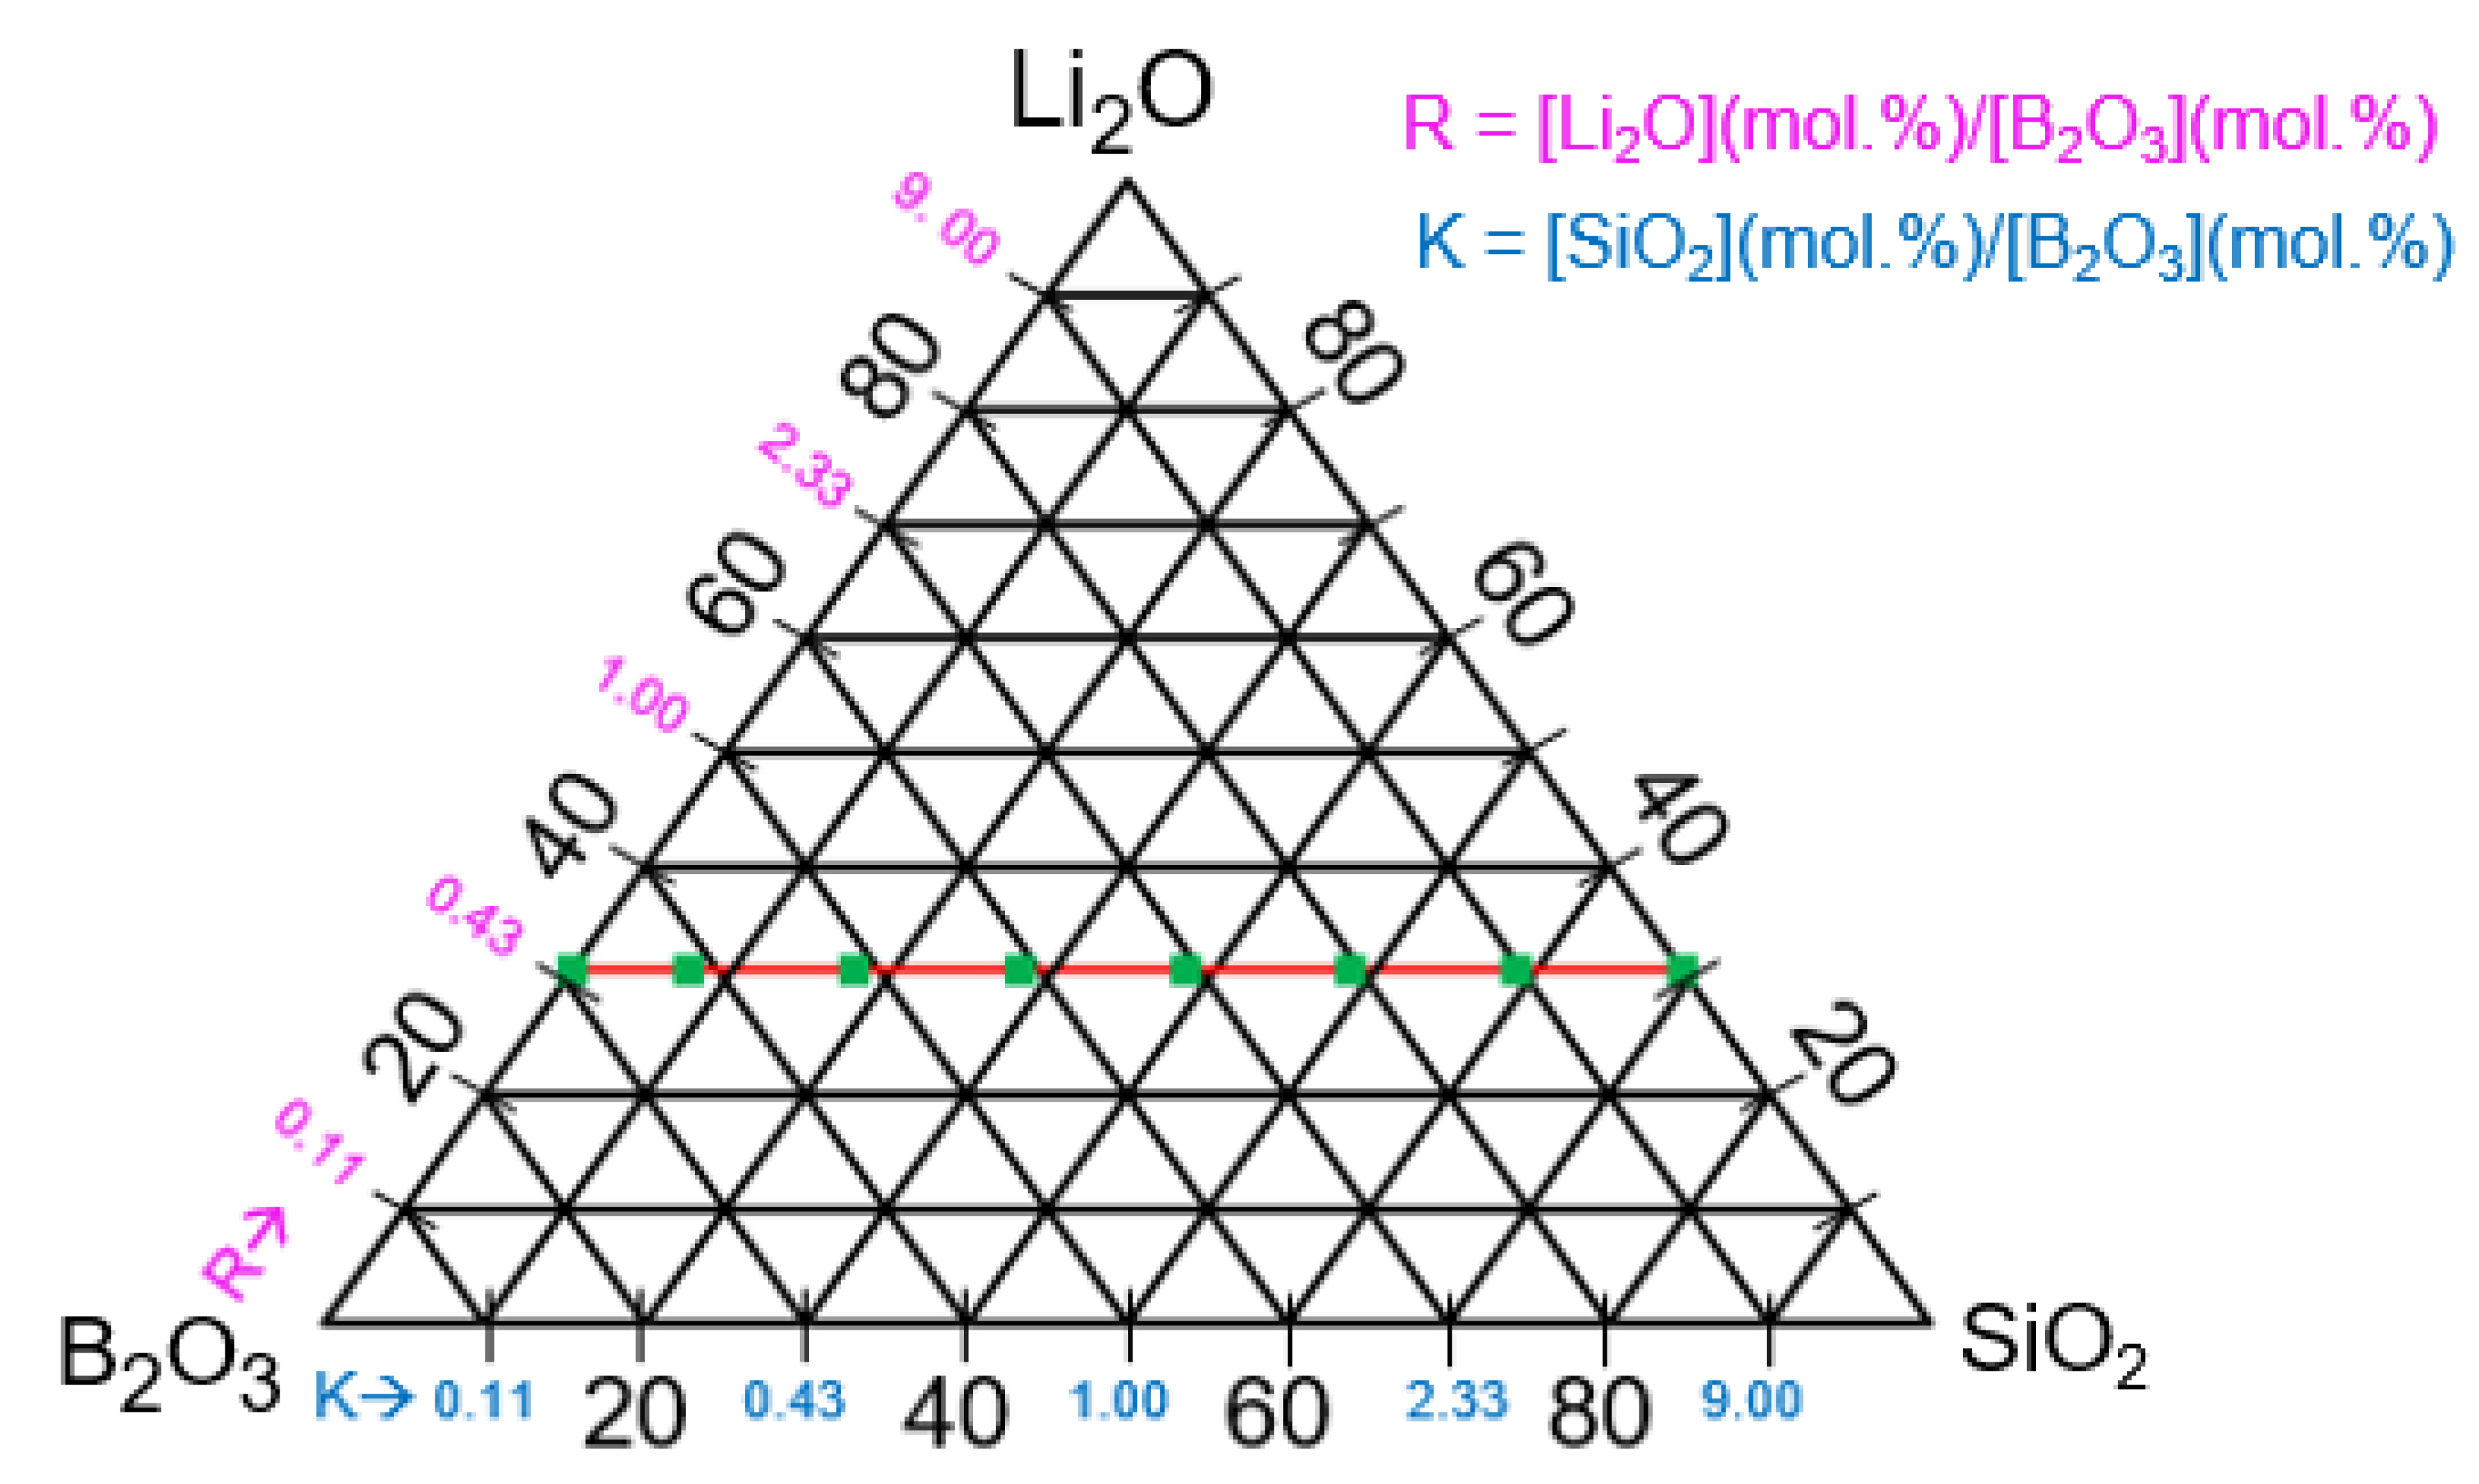
Figure 2.
SEM micrographs of 50B17Si (a), and 30B37Si (b) glass indicating nano-scale phase separation.
Figure 2.
SEM micrographs of 50B17Si (a), and 30B37Si (b) glass indicating nano-scale phase separation.
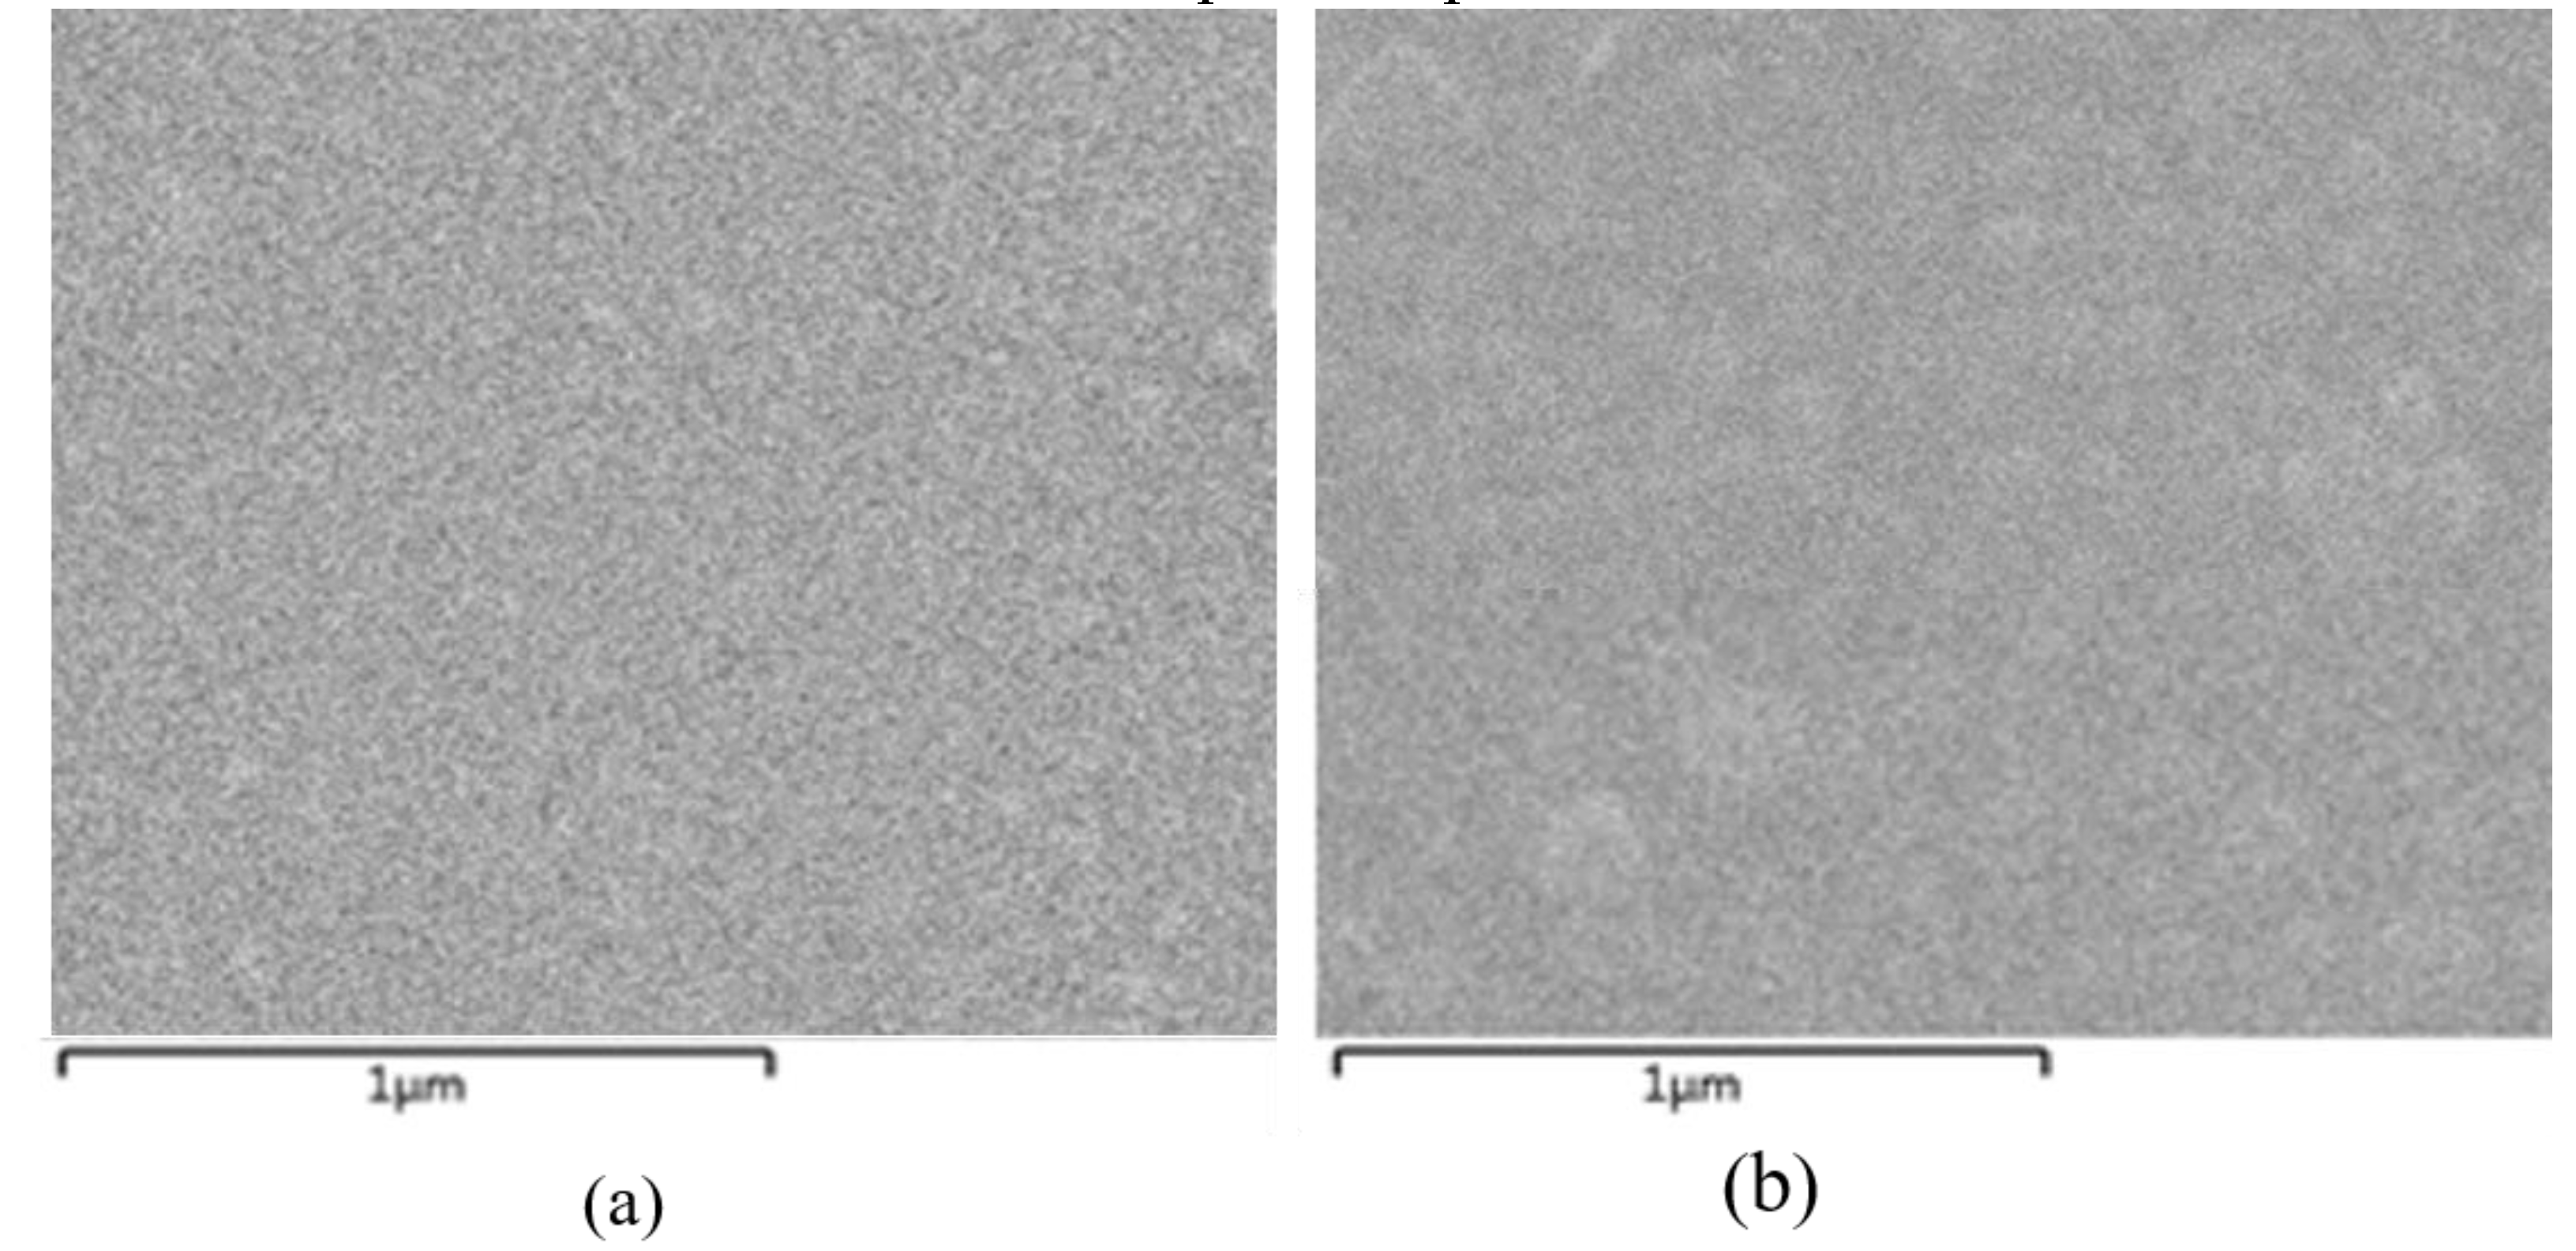
Figure 3.
Glass transition temperature (Tg) variation with glass composition with a guiding line to aid visualization.
Figure 3.
Glass transition temperature (Tg) variation with glass composition with a guiding line to aid visualization.
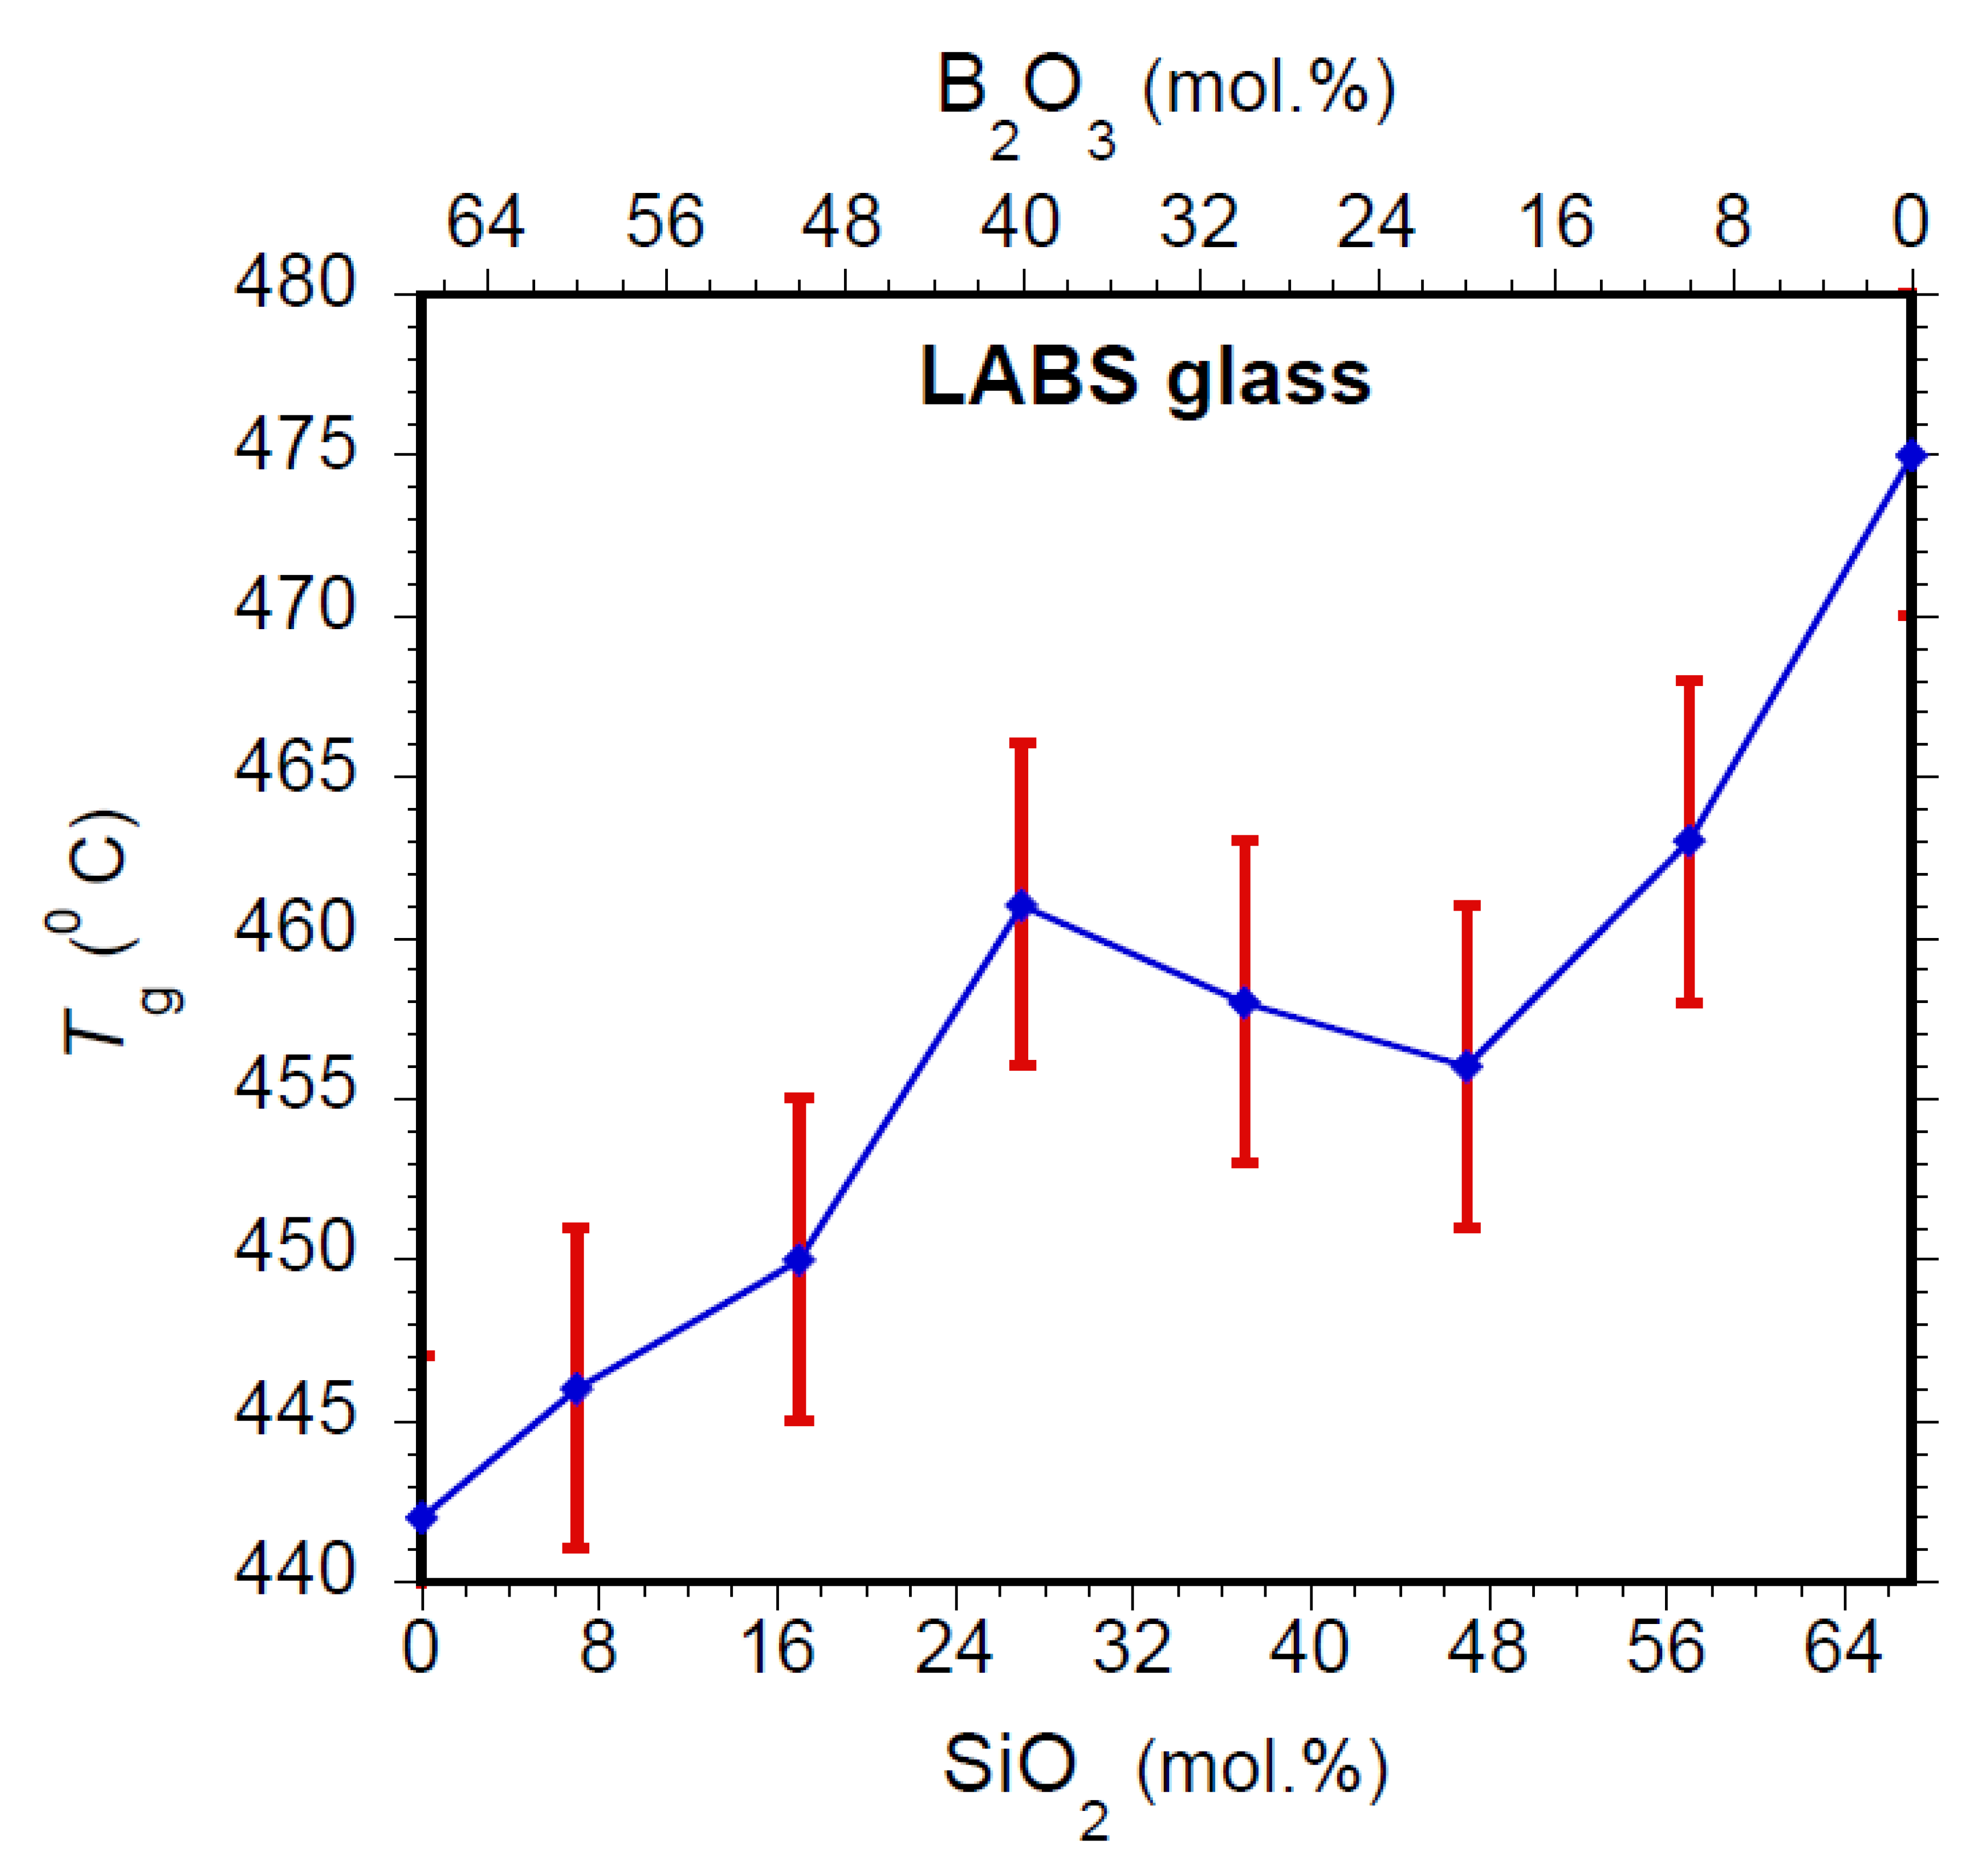
Figure 4.
Electrical conductivity (as log σ) with respect to LABS glass compositions, with guiding lines to aid visualization.
Figure 4.
Electrical conductivity (as log σ) with respect to LABS glass compositions, with guiding lines to aid visualization.
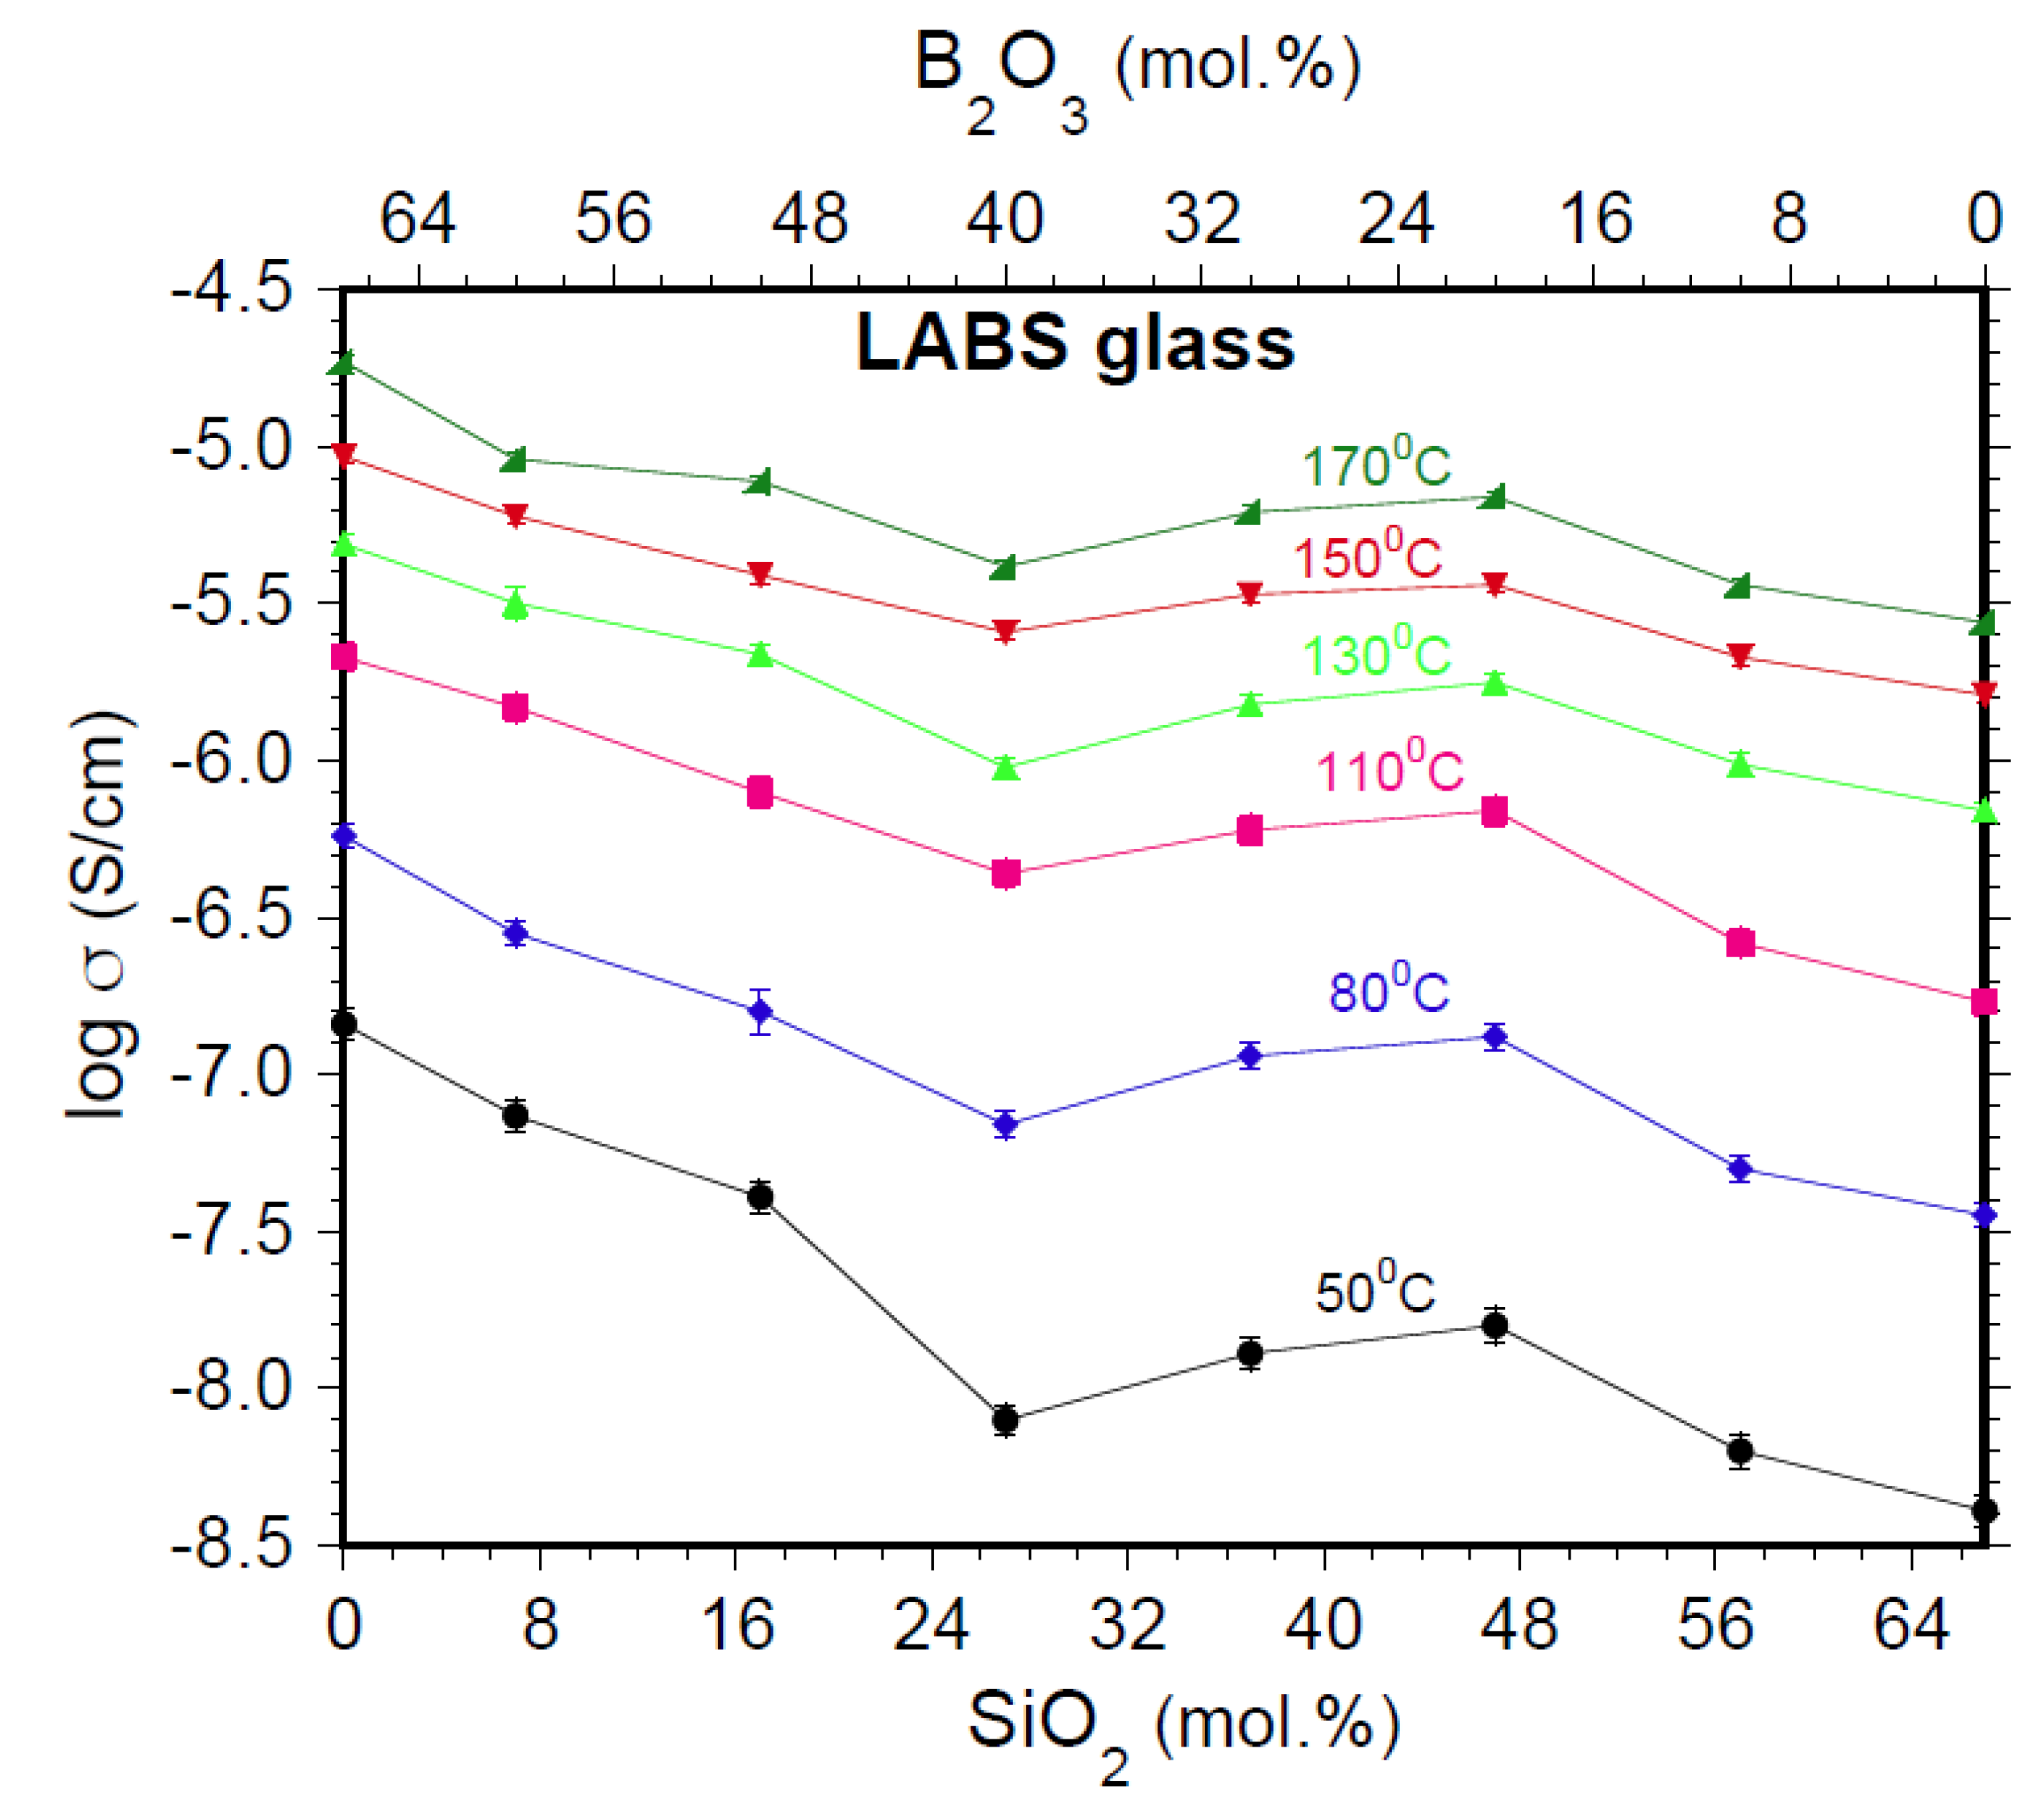
Figure 5.
Arrhenius plots with error bar, showing variation of log σ in S/cm, unit of electrical conductivity, along with the inverse of temperature in K-1 (legends are based on in the order of decrease in conductivity from top to bottom, not on composition across the glass series.).
Figure 5.
Arrhenius plots with error bar, showing variation of log σ in S/cm, unit of electrical conductivity, along with the inverse of temperature in K-1 (legends are based on in the order of decrease in conductivity from top to bottom, not on composition across the glass series.).
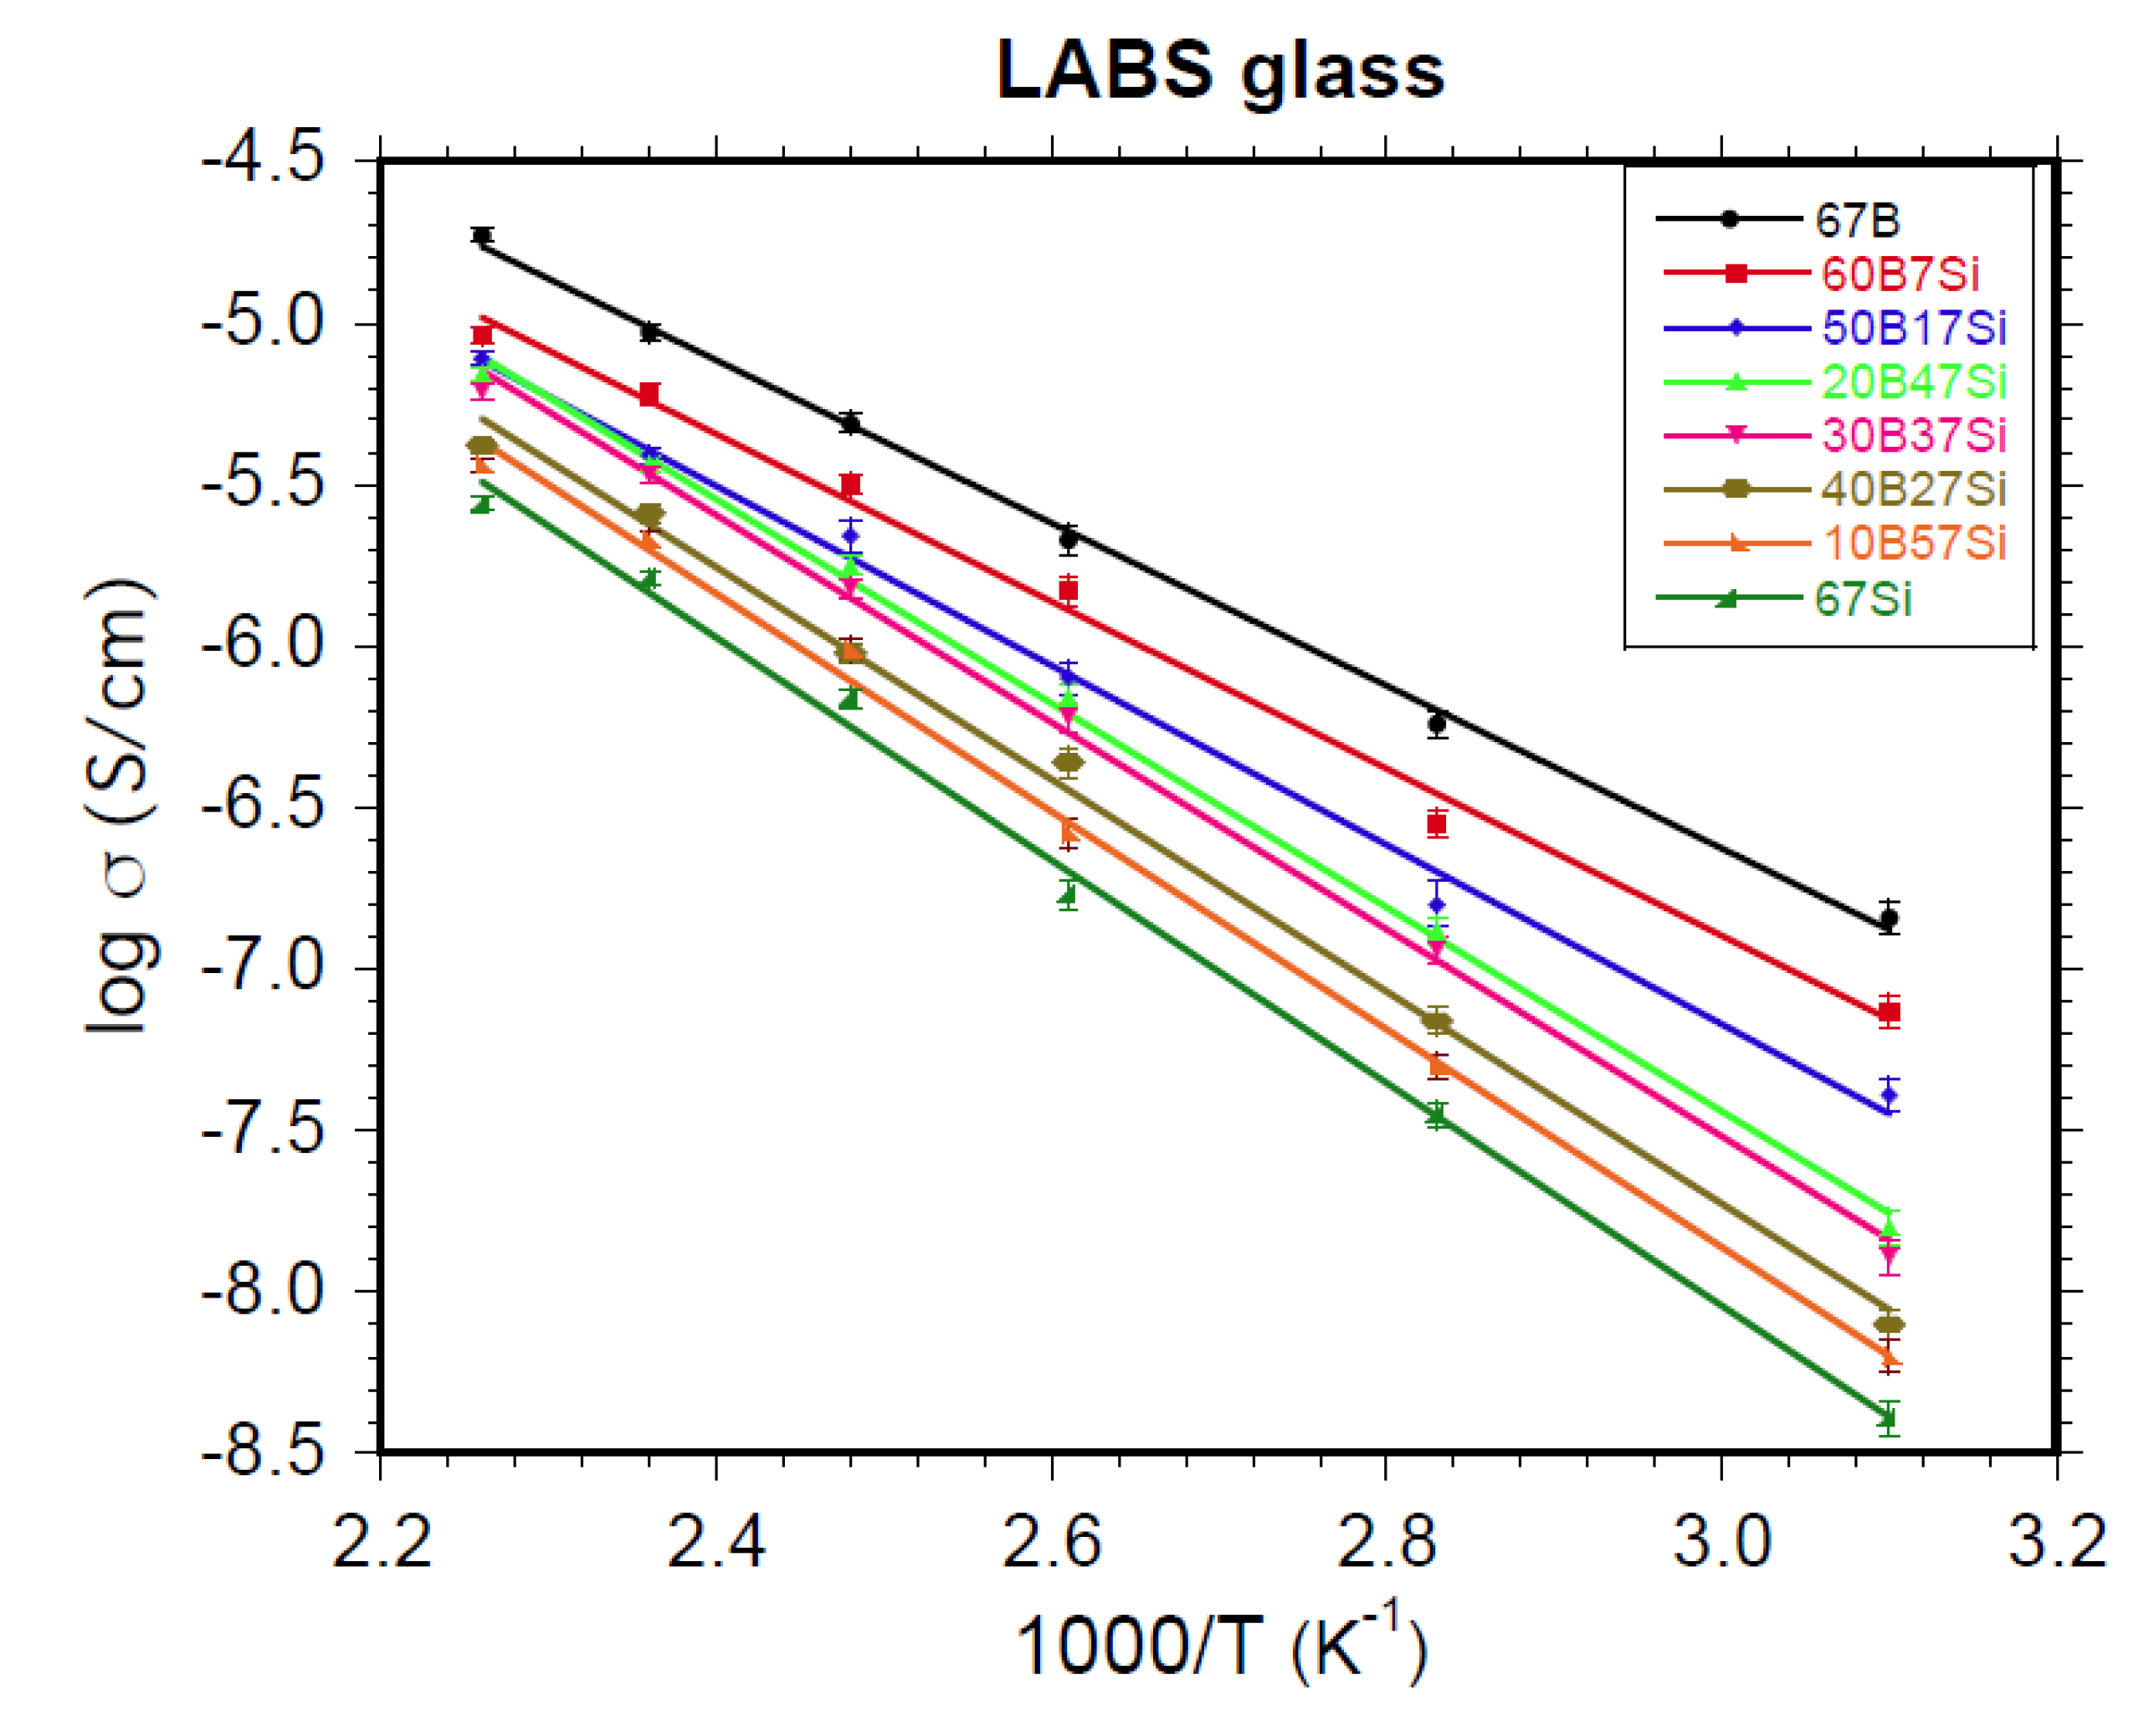
Figure 6.
Activation energy, from 50 °C to 170 °C, with respect to glass composition, with a guiding line to add visualization.
Figure 6.
Activation energy, from 50 °C to 170 °C, with respect to glass composition, with a guiding line to add visualization.
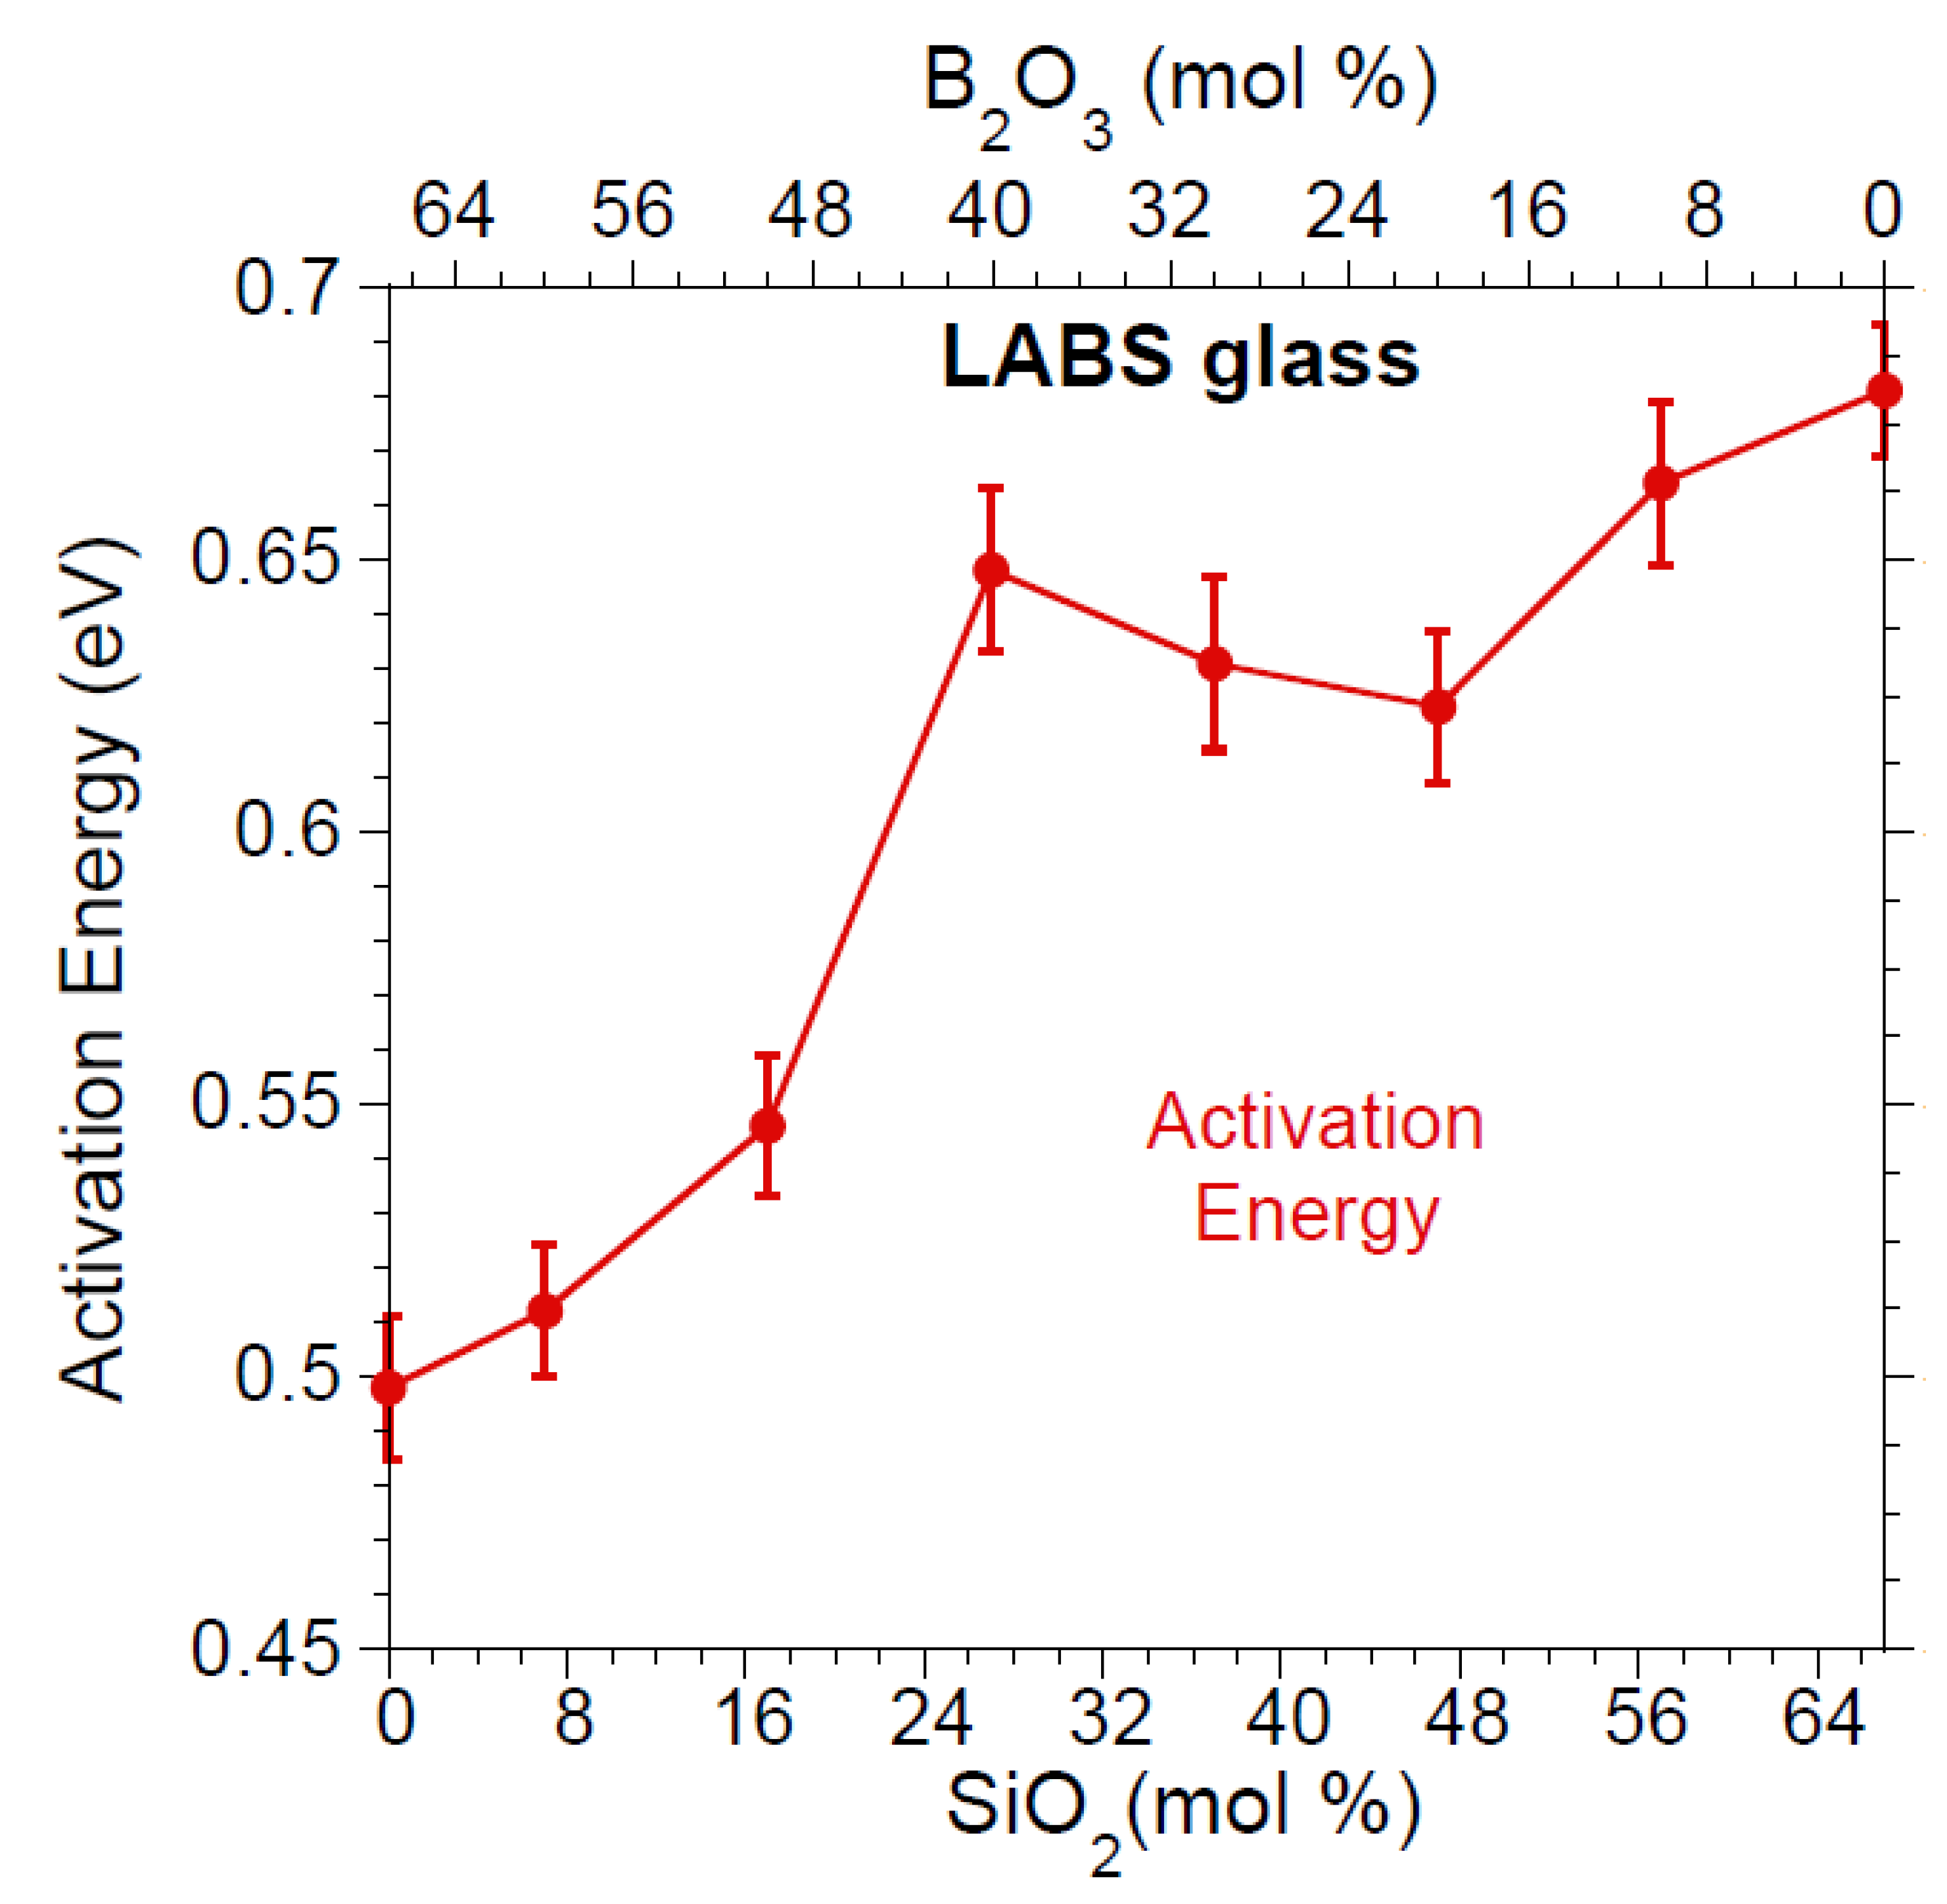
Figure 7.
Parallel polarized reduced Raman spectra for the glass series. Plots are offset for clarity.
Figure 7.
Parallel polarized reduced Raman spectra for the glass series. Plots are offset for clarity.
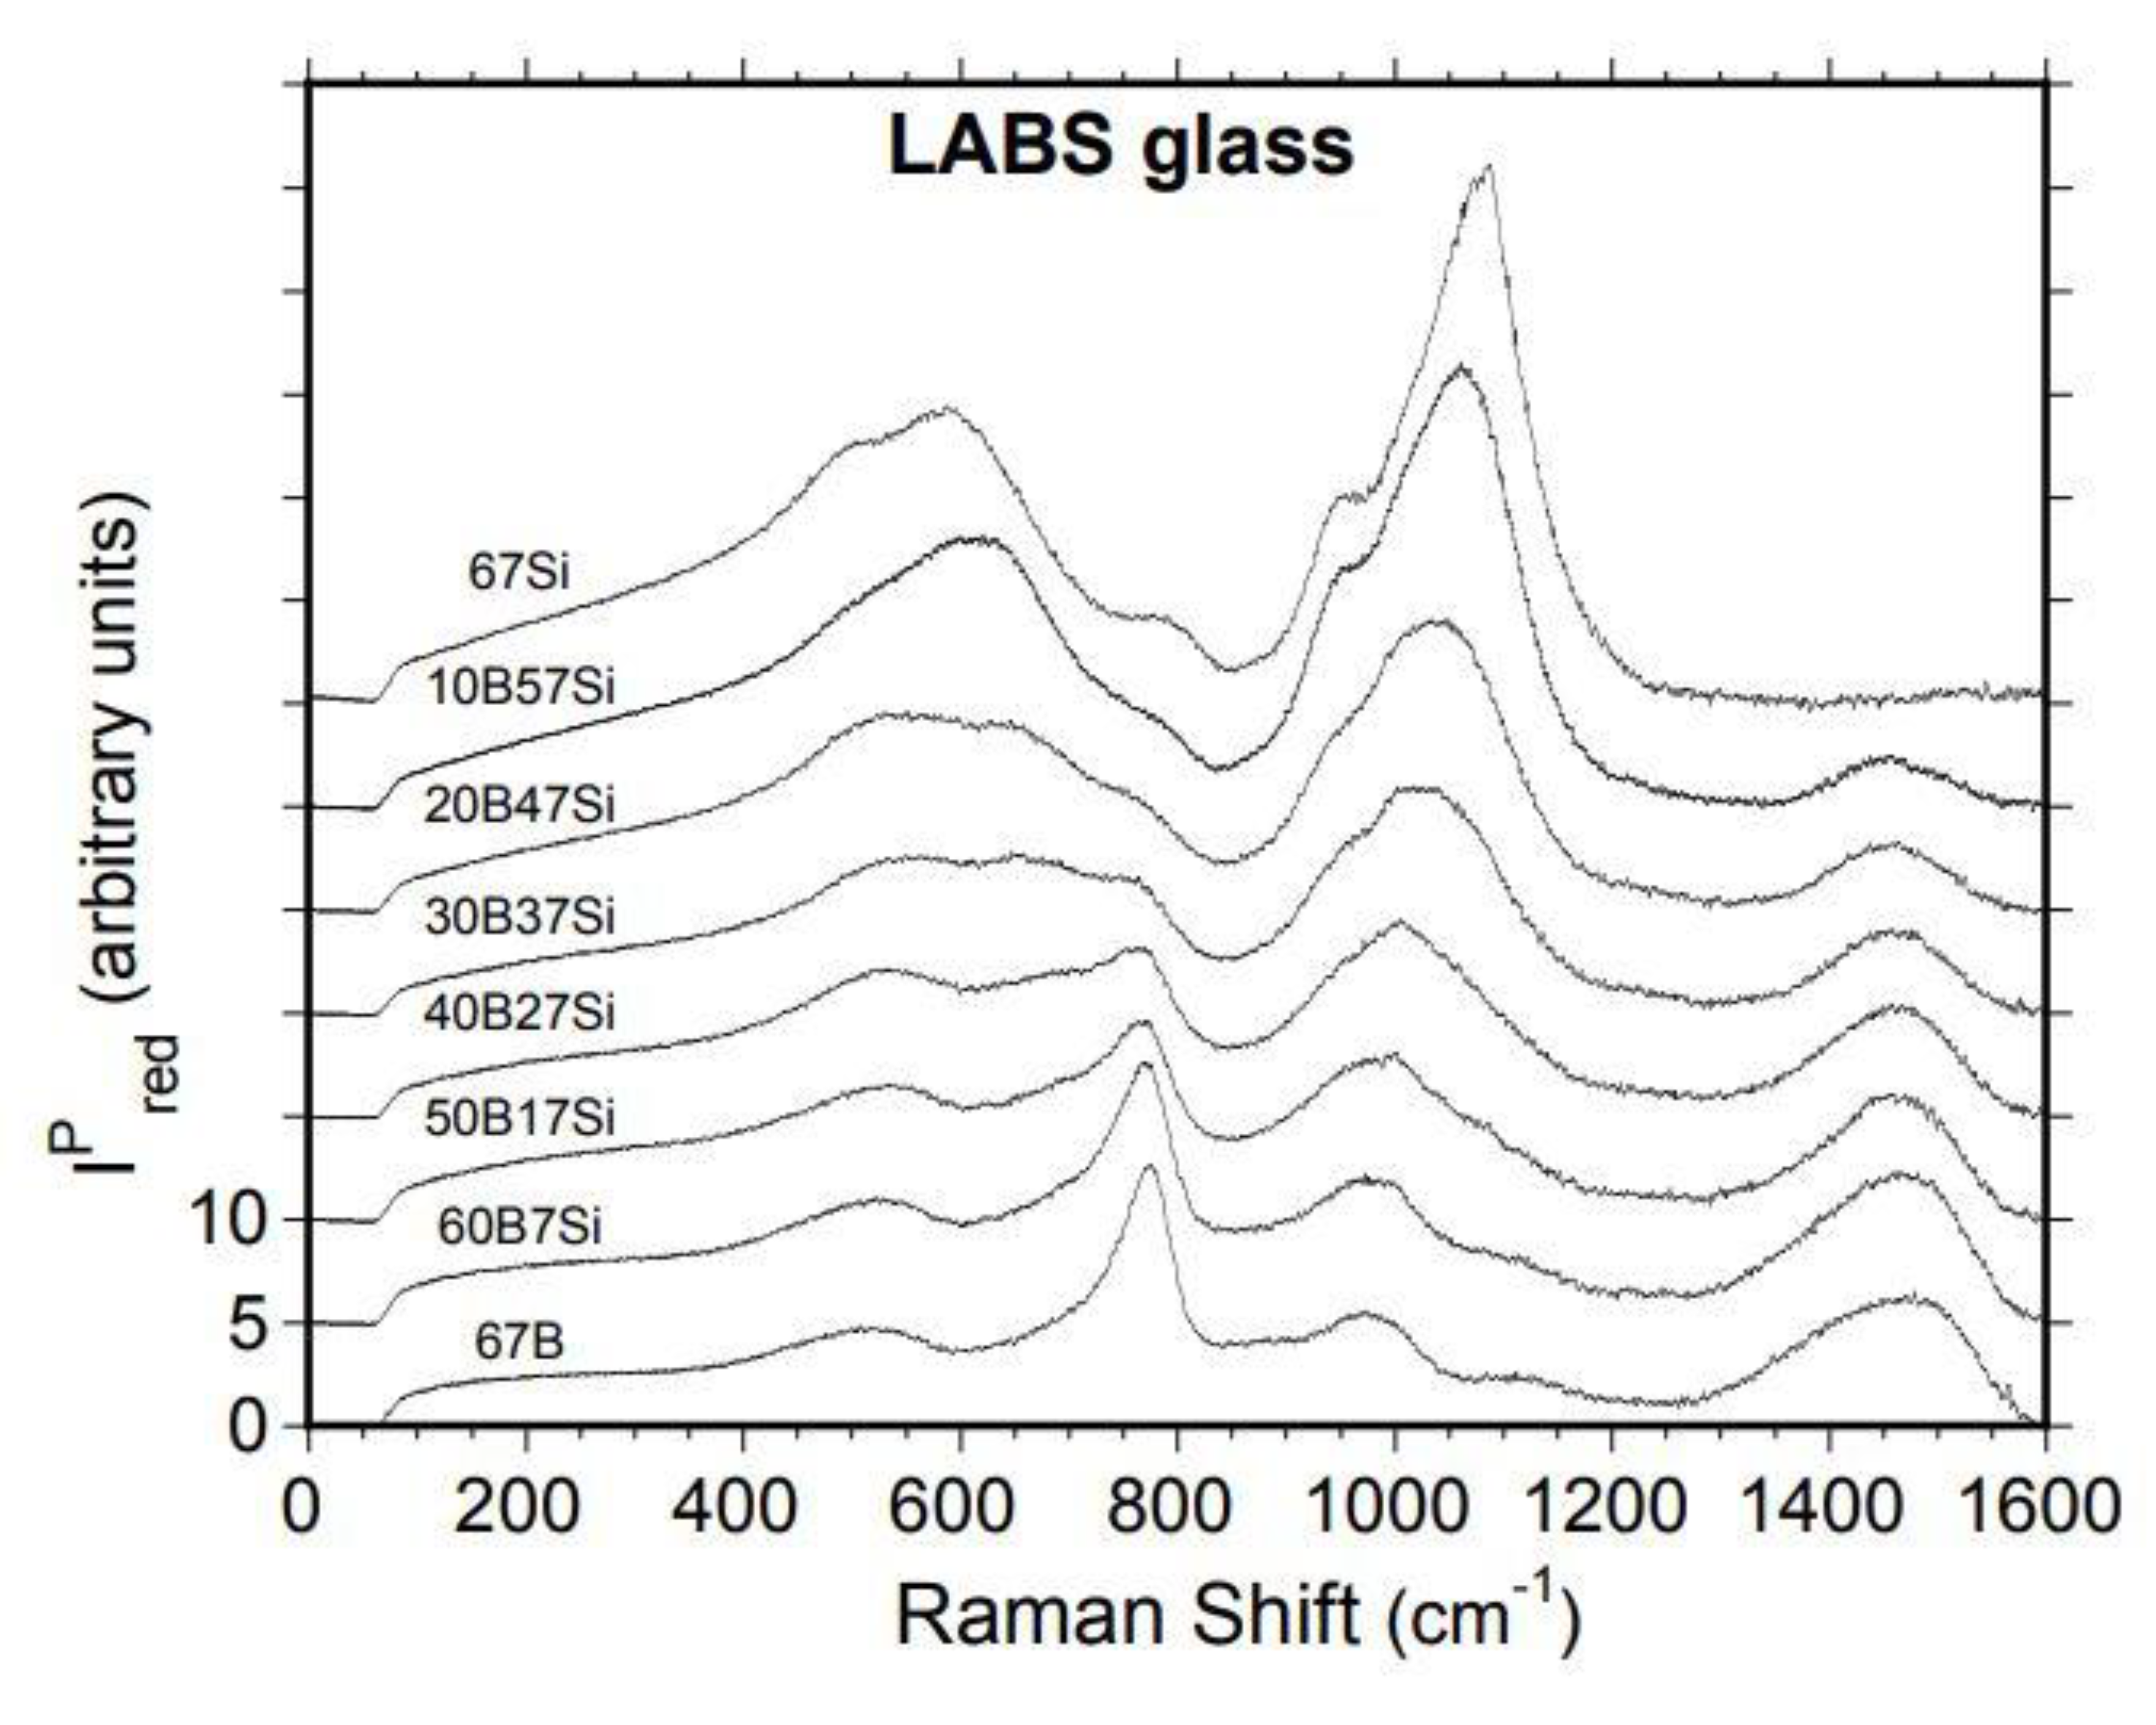
Figure 8.
(a) Simple polyborate species, (b) Complex polyborate species, (c) Silicate species, and (d) Borosilicate species.
Figure 8.
(a) Simple polyborate species, (b) Complex polyborate species, (c) Silicate species, and (d) Borosilicate species.

Figure 9.
Parallel polarized (blue) and cross-polarized (red) reduced Raman spectra for 67B glass. Some vibrational assignments with corresponding structural units are indicated.
Figure 9.
Parallel polarized (blue) and cross-polarized (red) reduced Raman spectra for 67B glass. Some vibrational assignments with corresponding structural units are indicated.
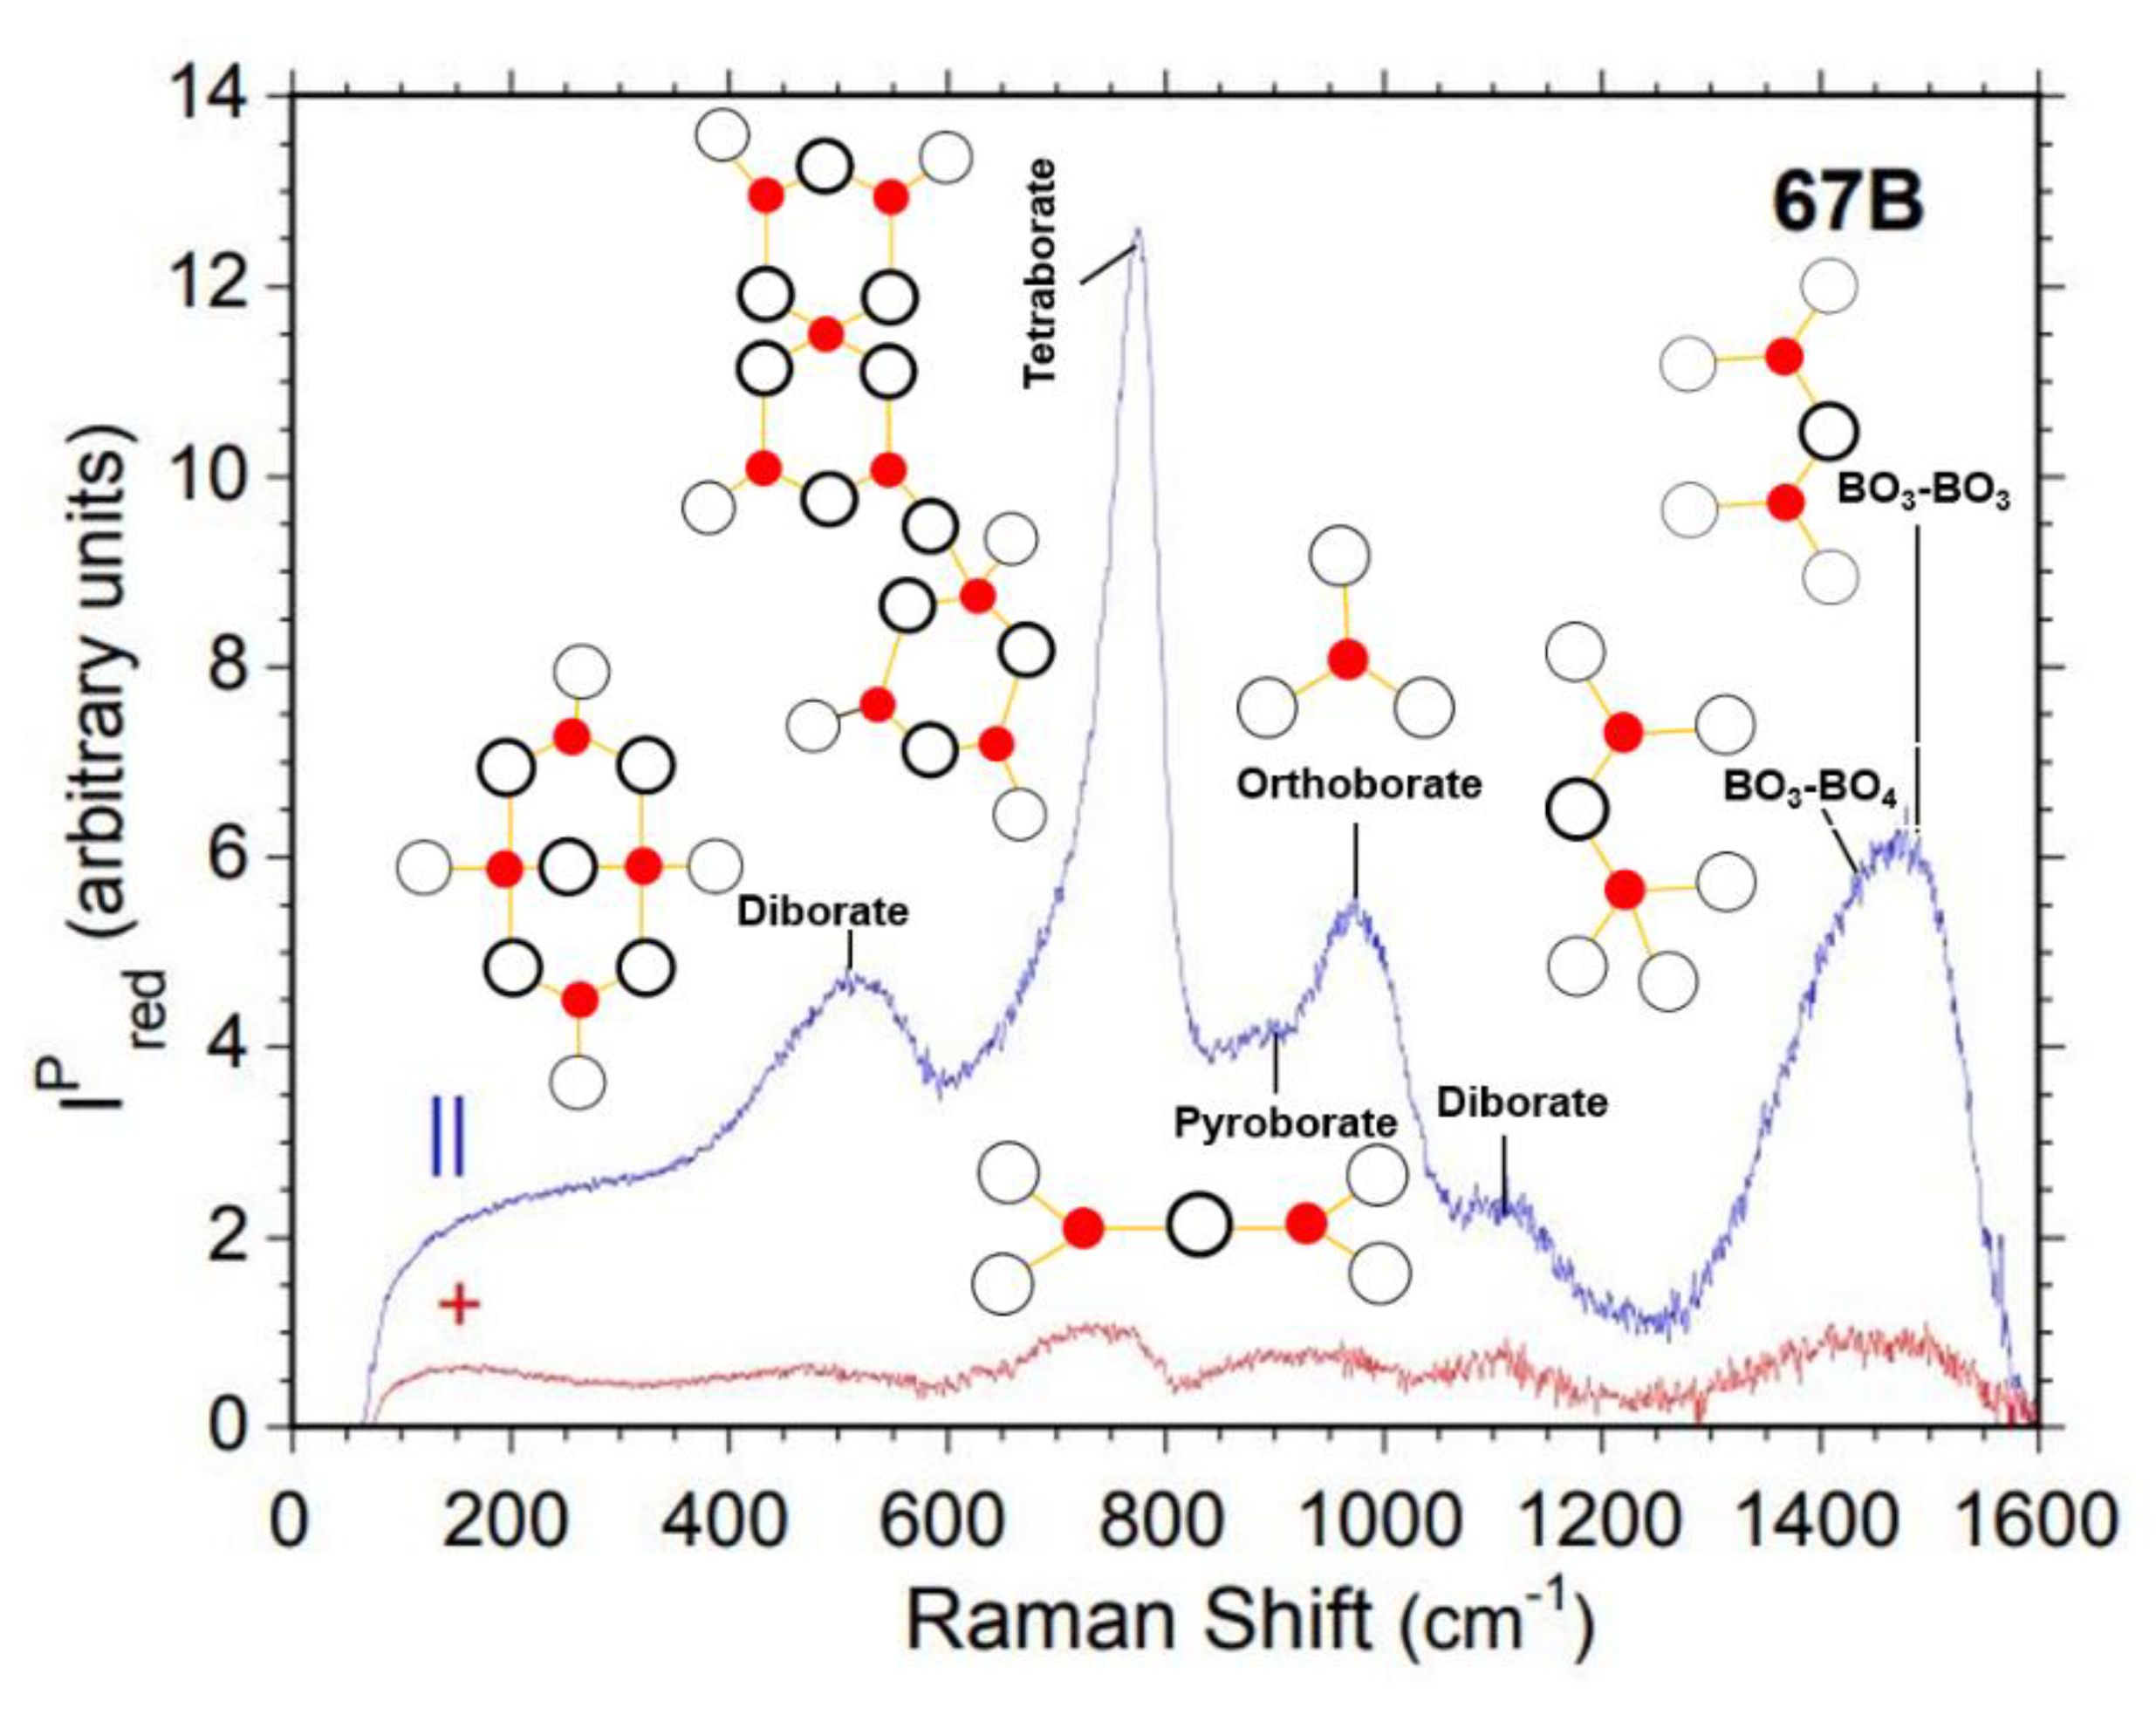
Figure 10.
Parallel polarized Raman spectrum of 67B glass and associated Gaussian component fit by program IGOR [60]. Data are black points, fitted individual Gaussian components are plotted in blue, sum of all Gaussian fitted components are plotted in red. Residual intensities are the differences between observed data and the sum of the Gaussian components. Structural unit assignments are indicated for some of the major fitted Gaussian components.
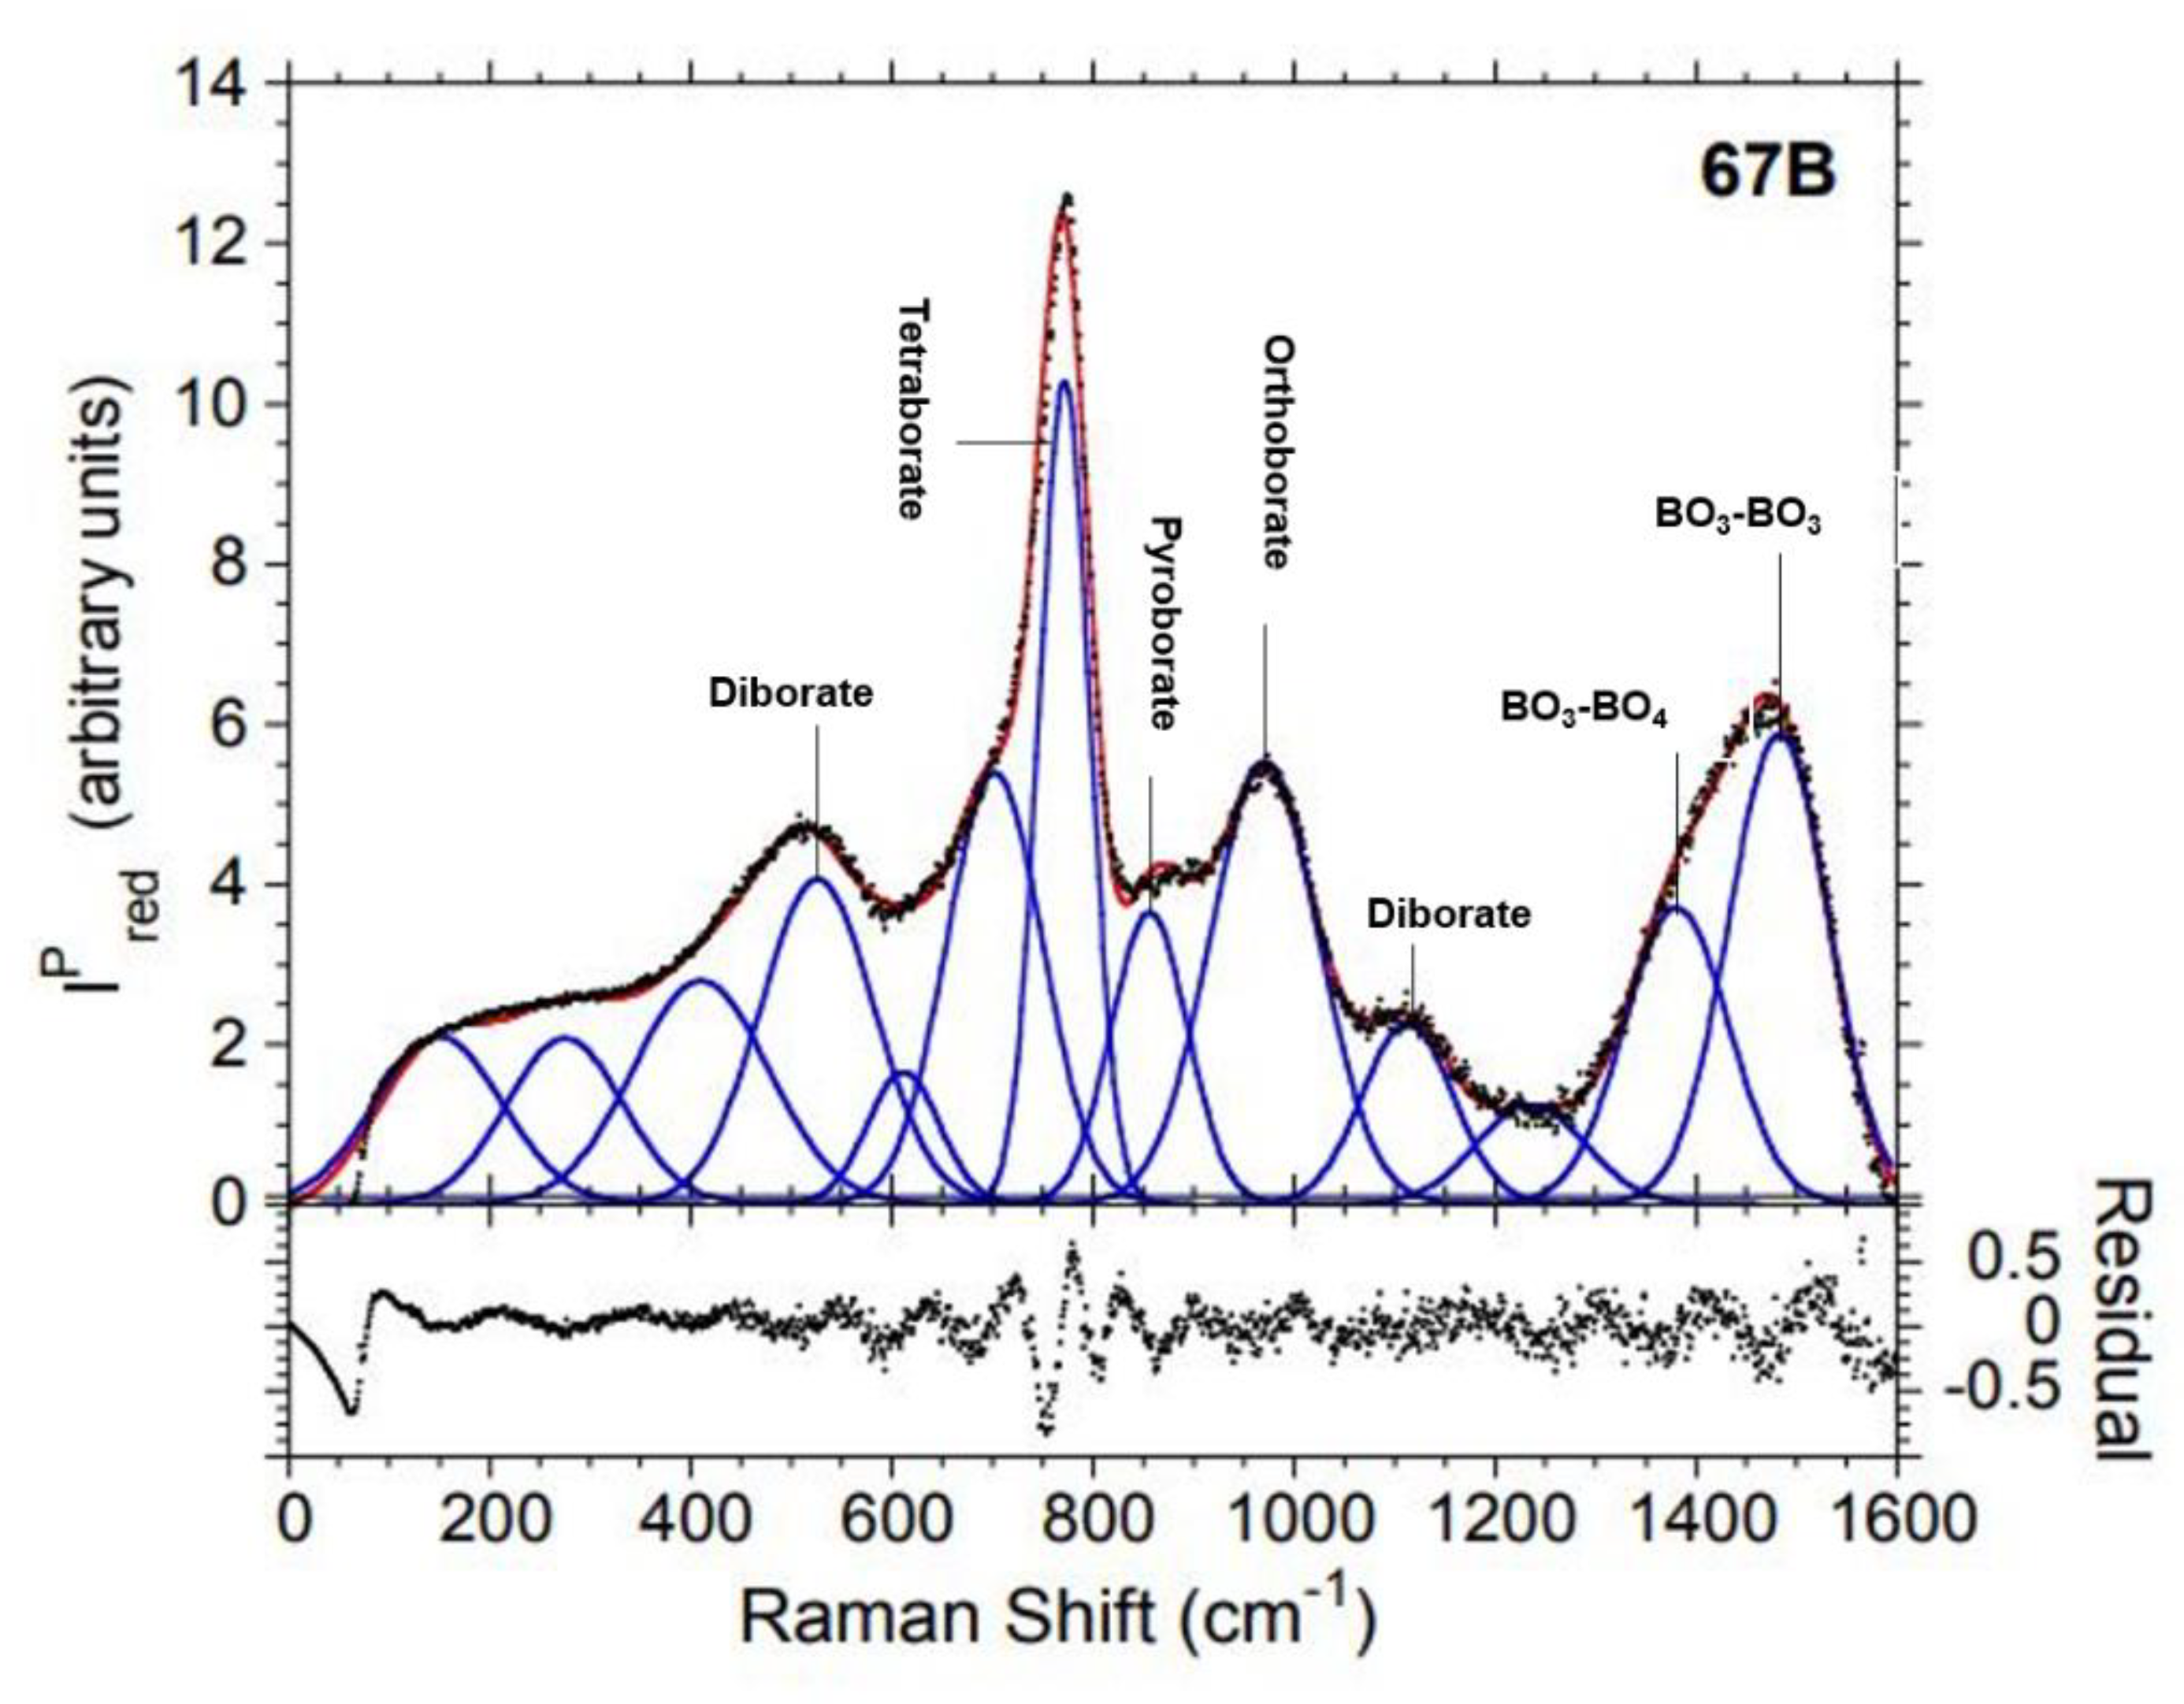
Figure 11.
Parallel polarized (blue) and cross-polarized (red) reduced Raman spectra of 30B37Si glass. Some vibrational assignments with corresponding structural units are indicated.
Figure 11.
Parallel polarized (blue) and cross-polarized (red) reduced Raman spectra of 30B37Si glass. Some vibrational assignments with corresponding structural units are indicated.
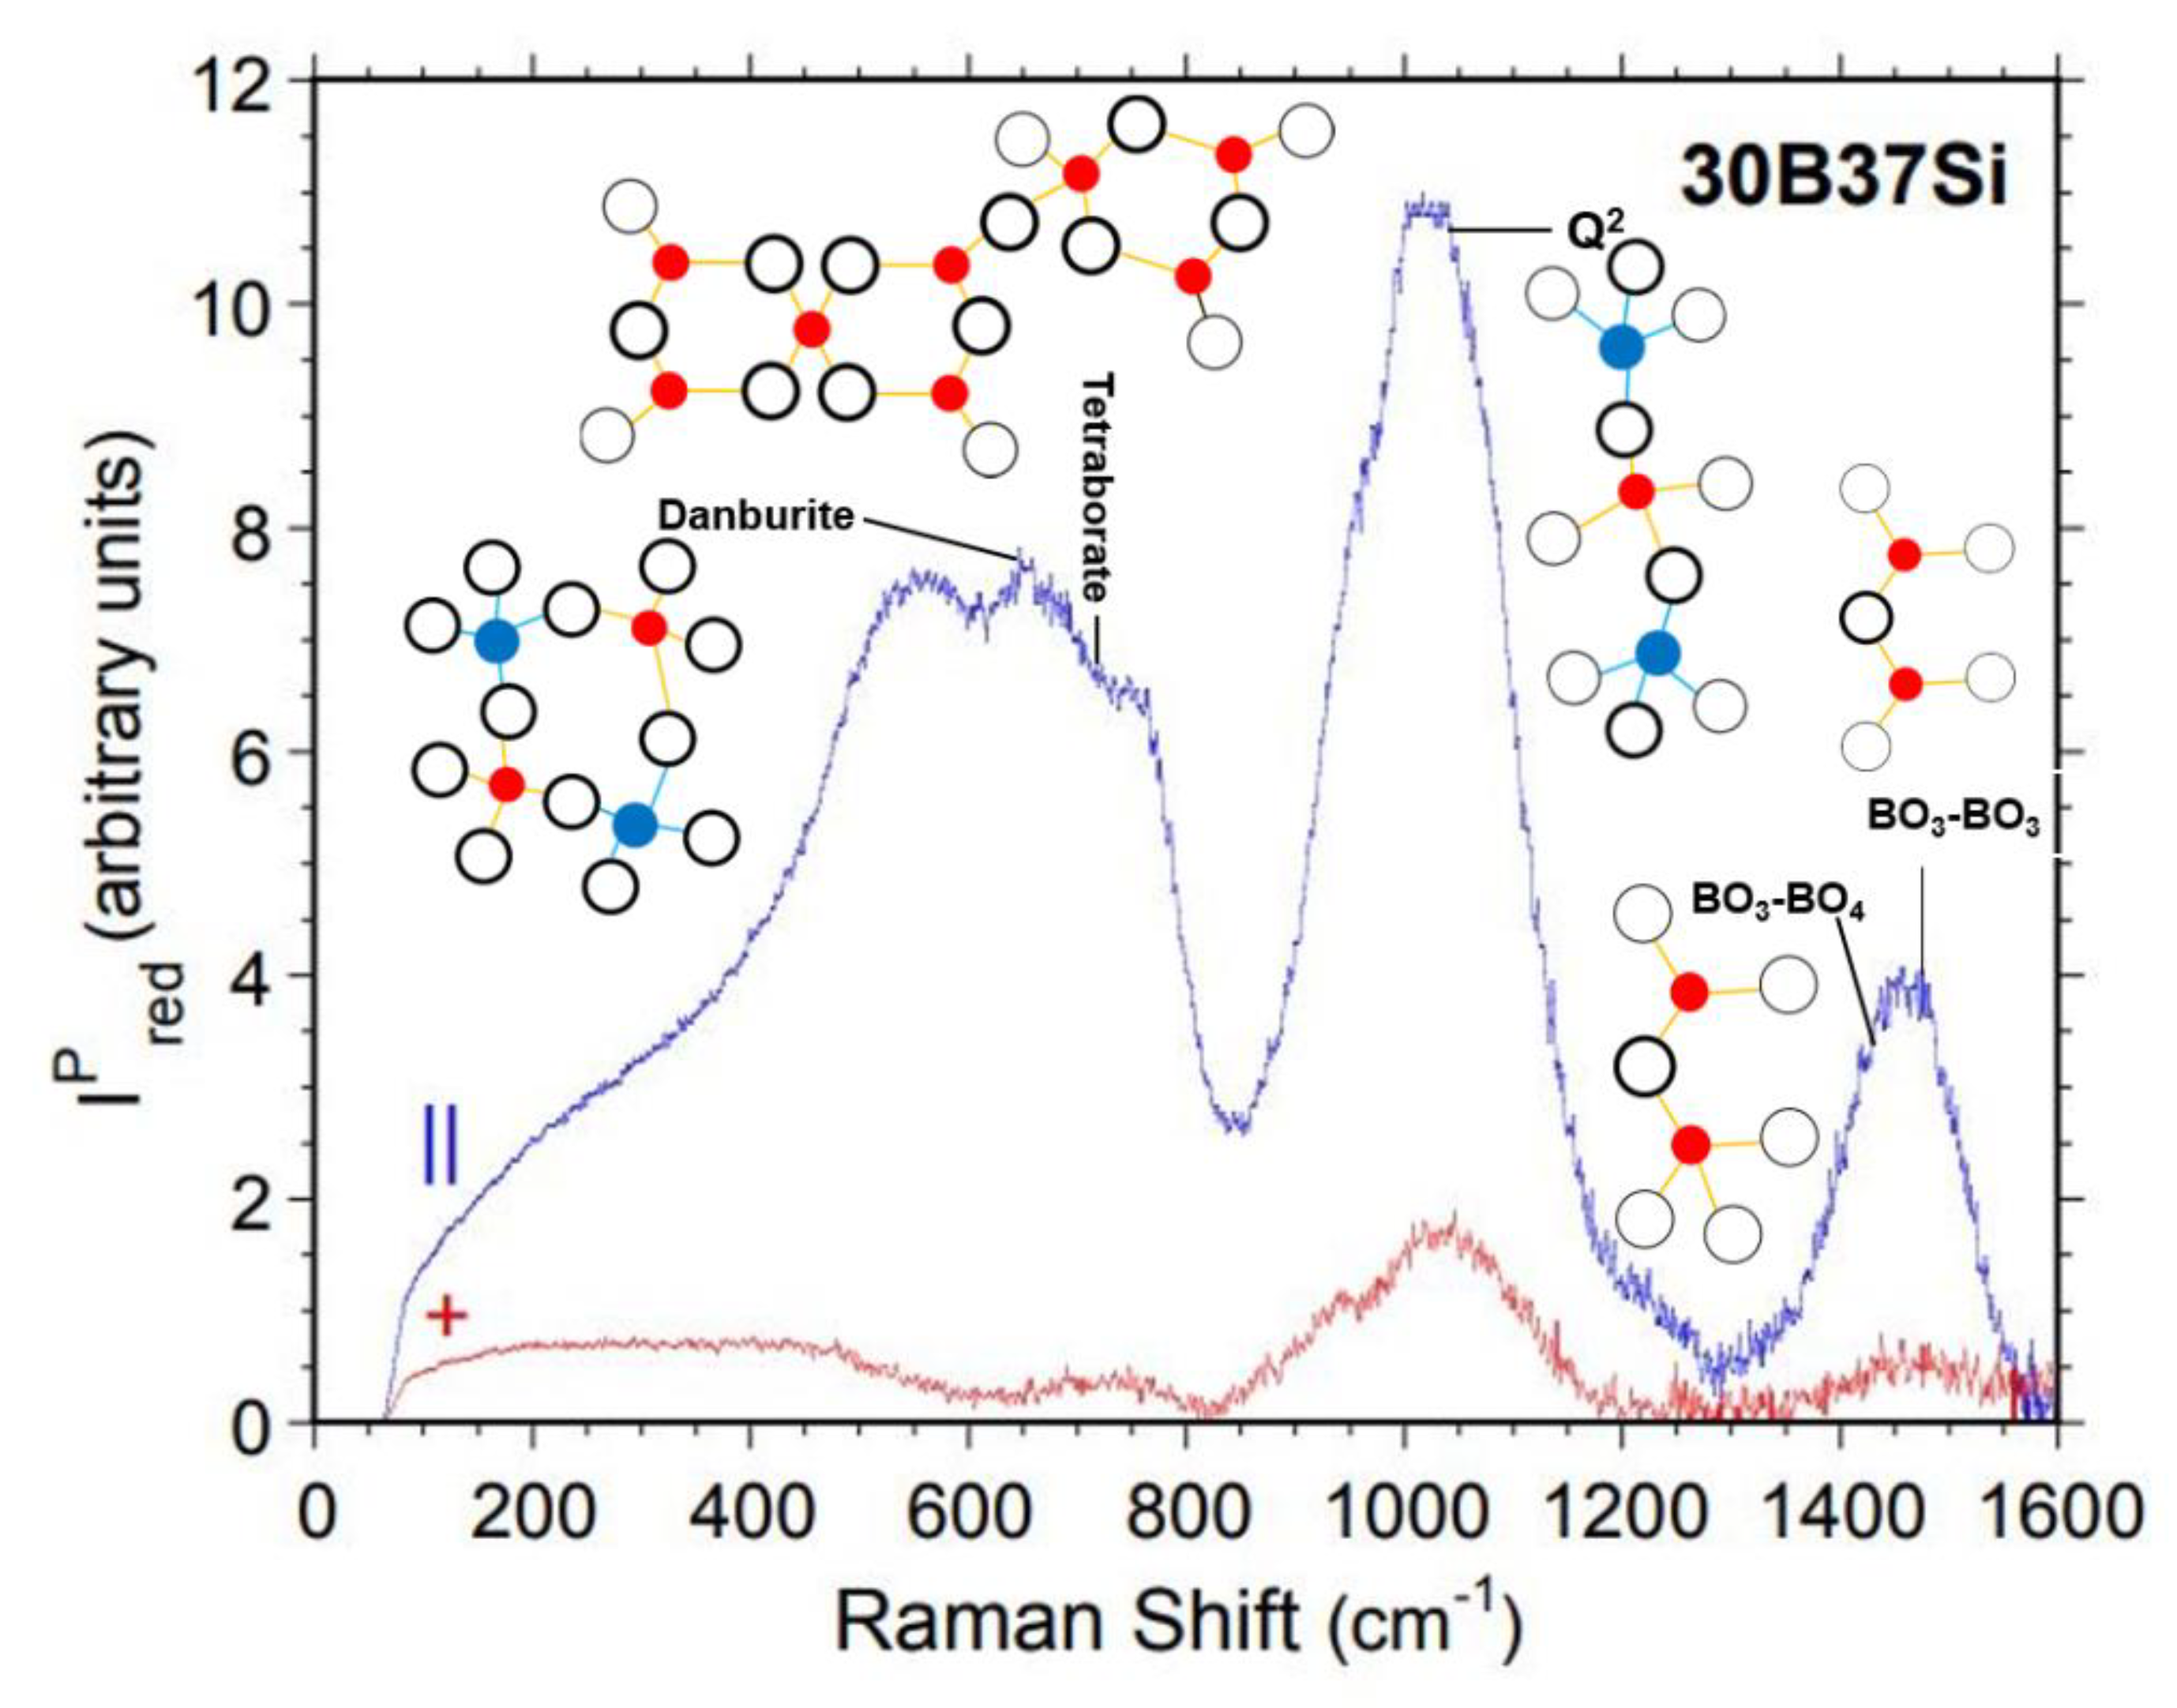
Figure 12.
Parallel polarized Raman spectrum of 30B37Si glass and associated Gaussian component fit by program IGOR [60]. Conventions from Figure 10 are followed.
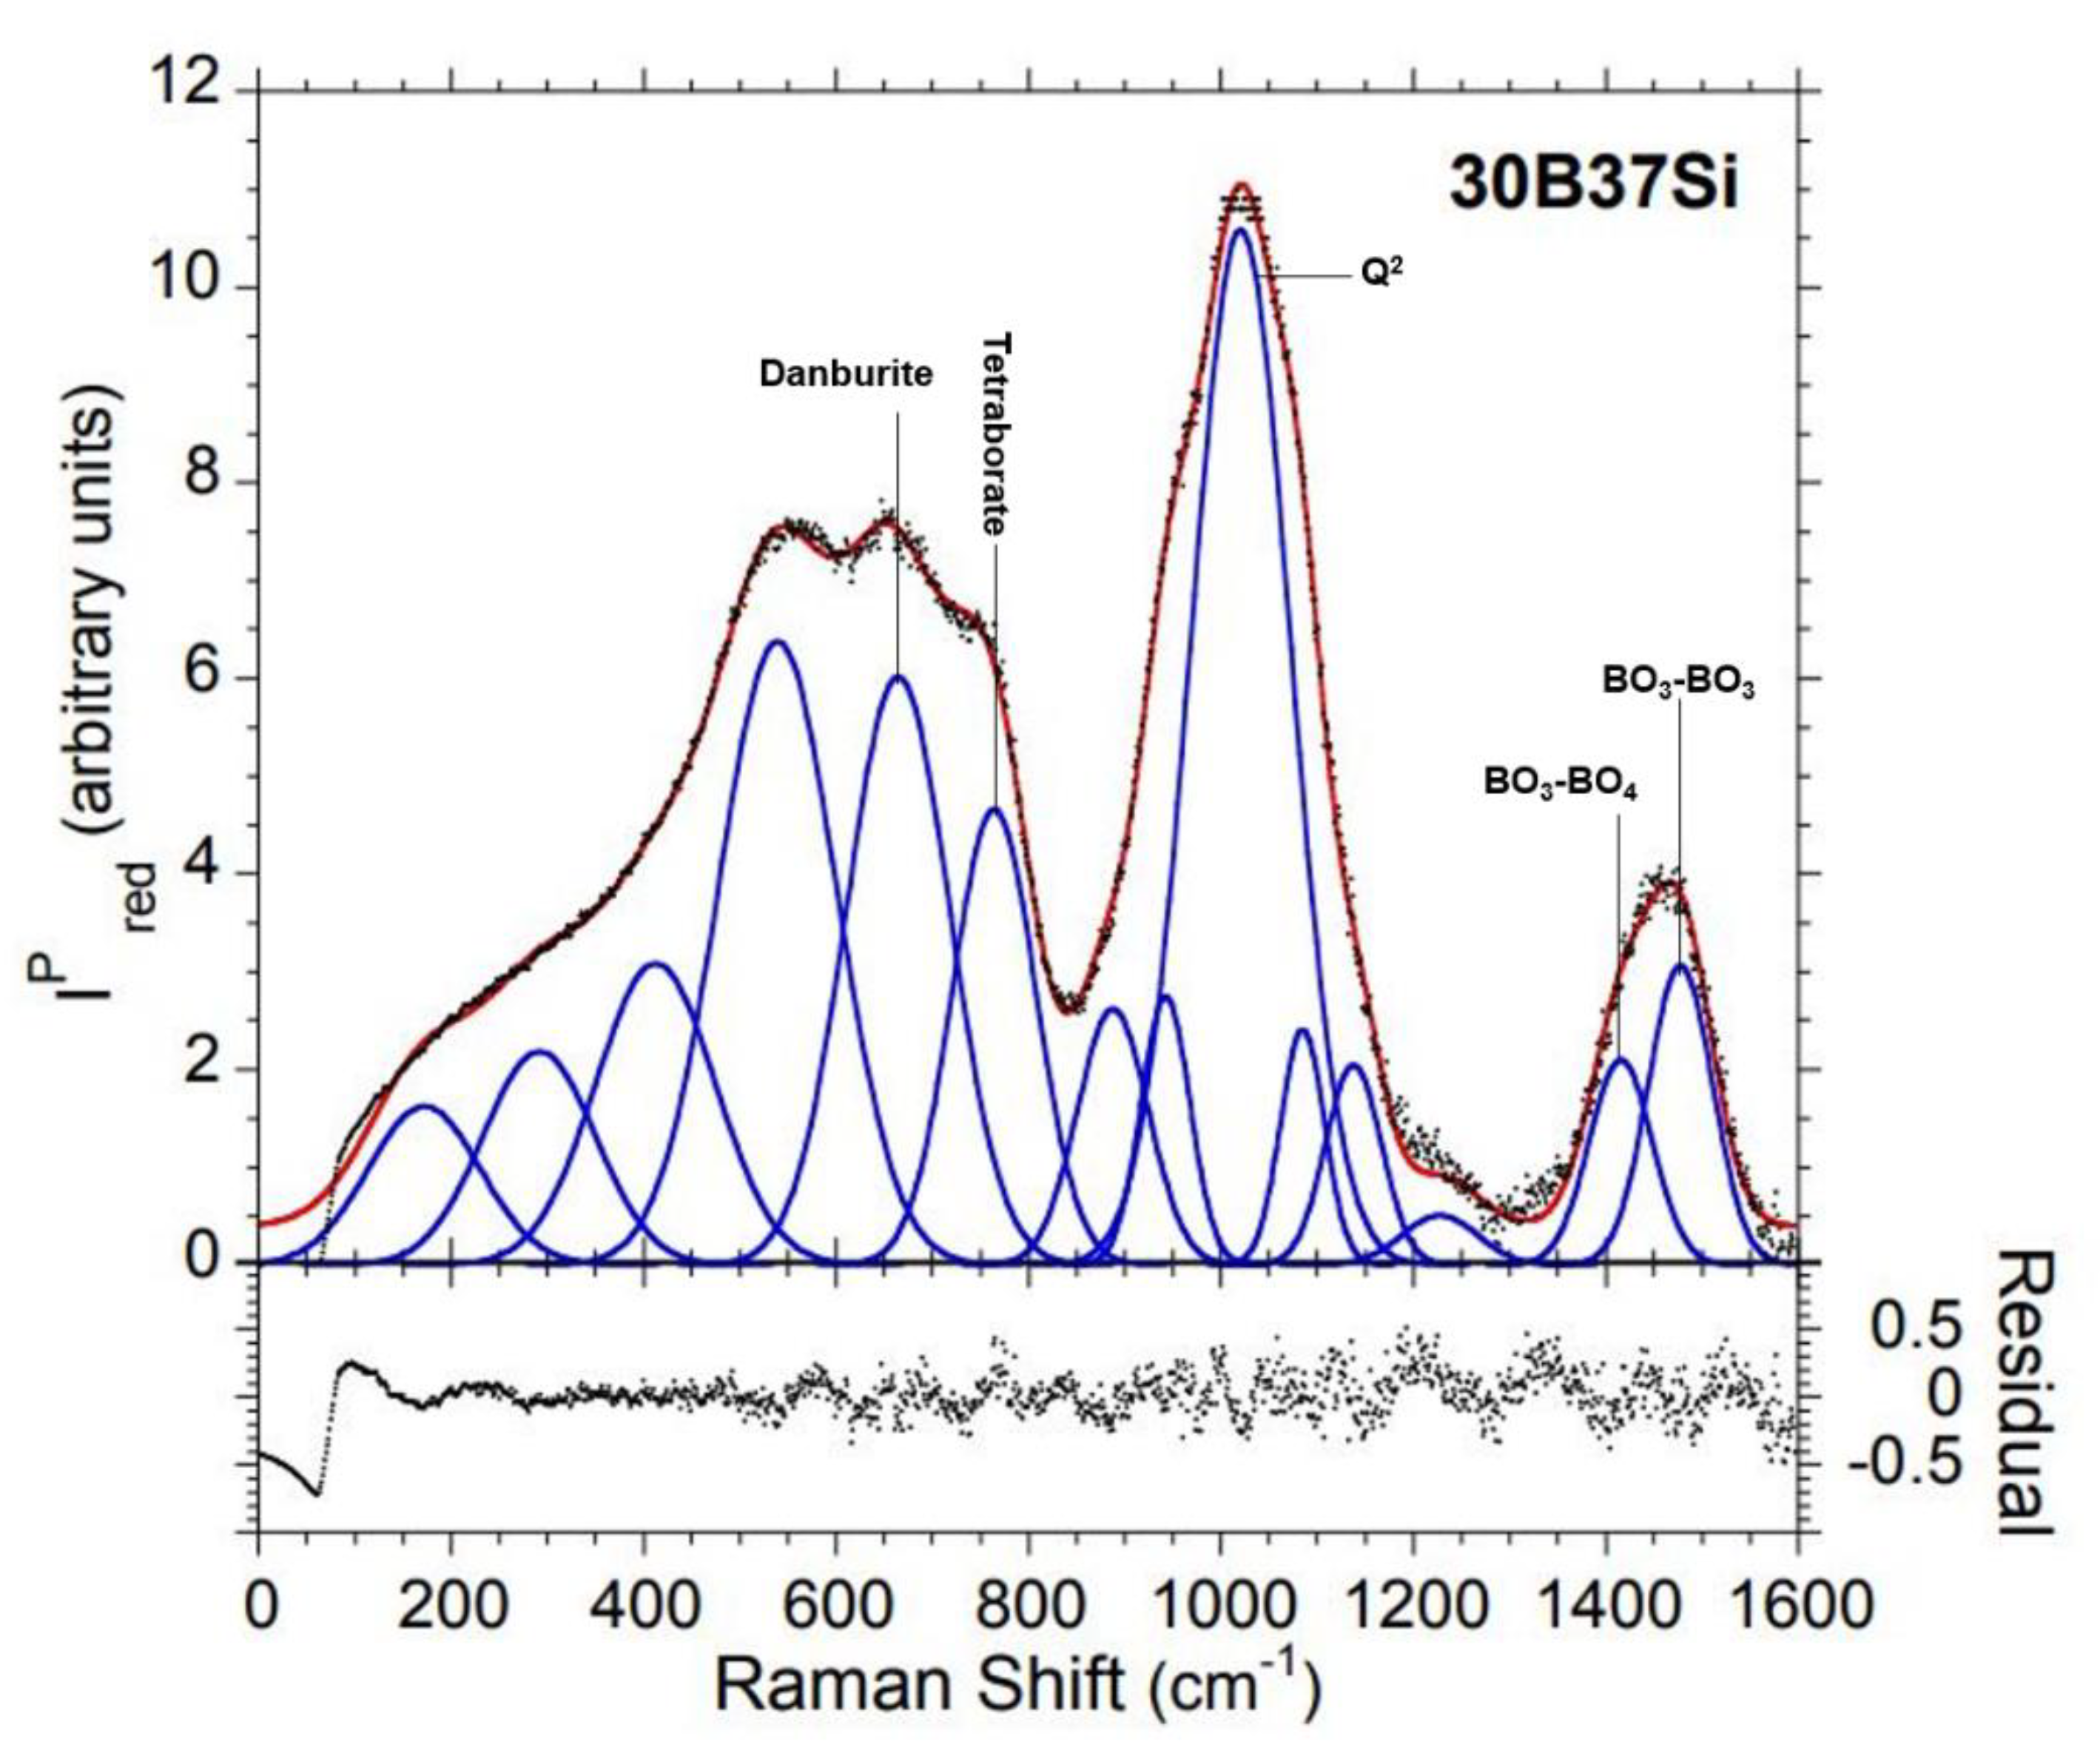
Figure 13.
Parallel polarized (blue) and cross-polarized (red) reduced Raman spectra of 67Si glass. Some vibrational assignments with corresponding structural units are indicated.
Figure 13.
Parallel polarized (blue) and cross-polarized (red) reduced Raman spectra of 67Si glass. Some vibrational assignments with corresponding structural units are indicated.
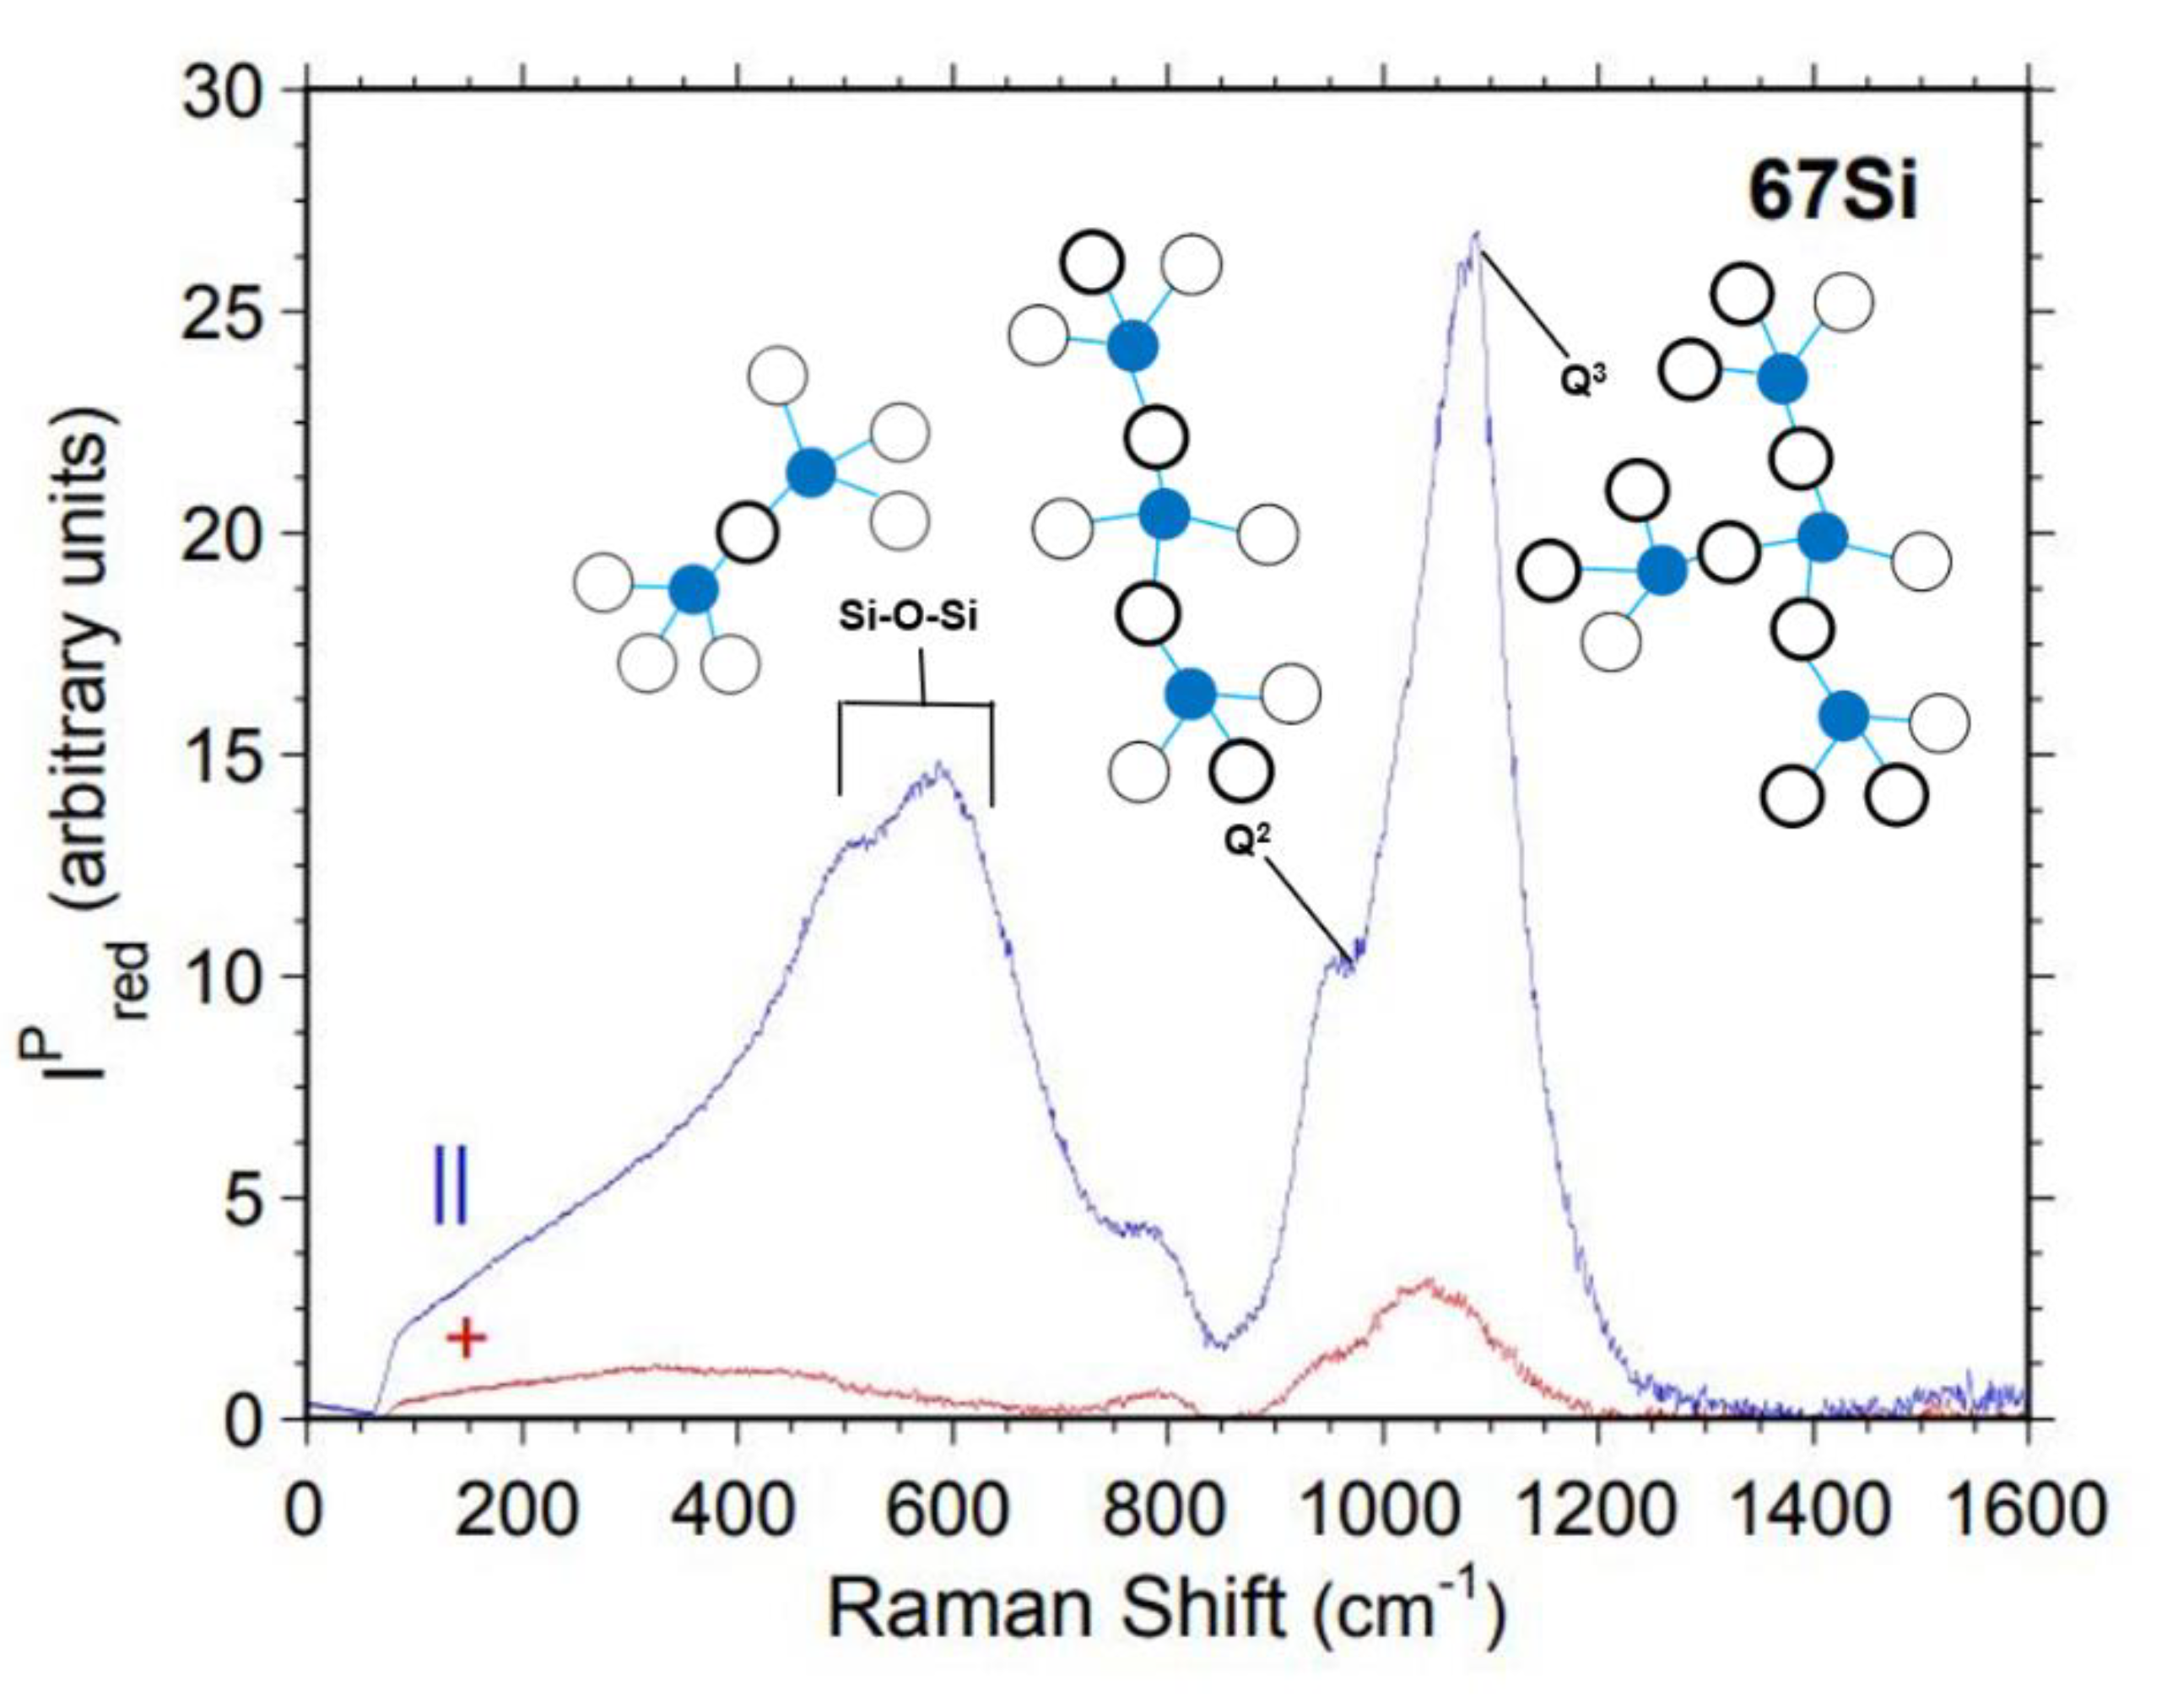
Figure 14.
Parallel polarized Raman spectrum of 67Si glass and associated Gaussian component fit by program IGOR [60]. Conventions from Figure 10 are followed.
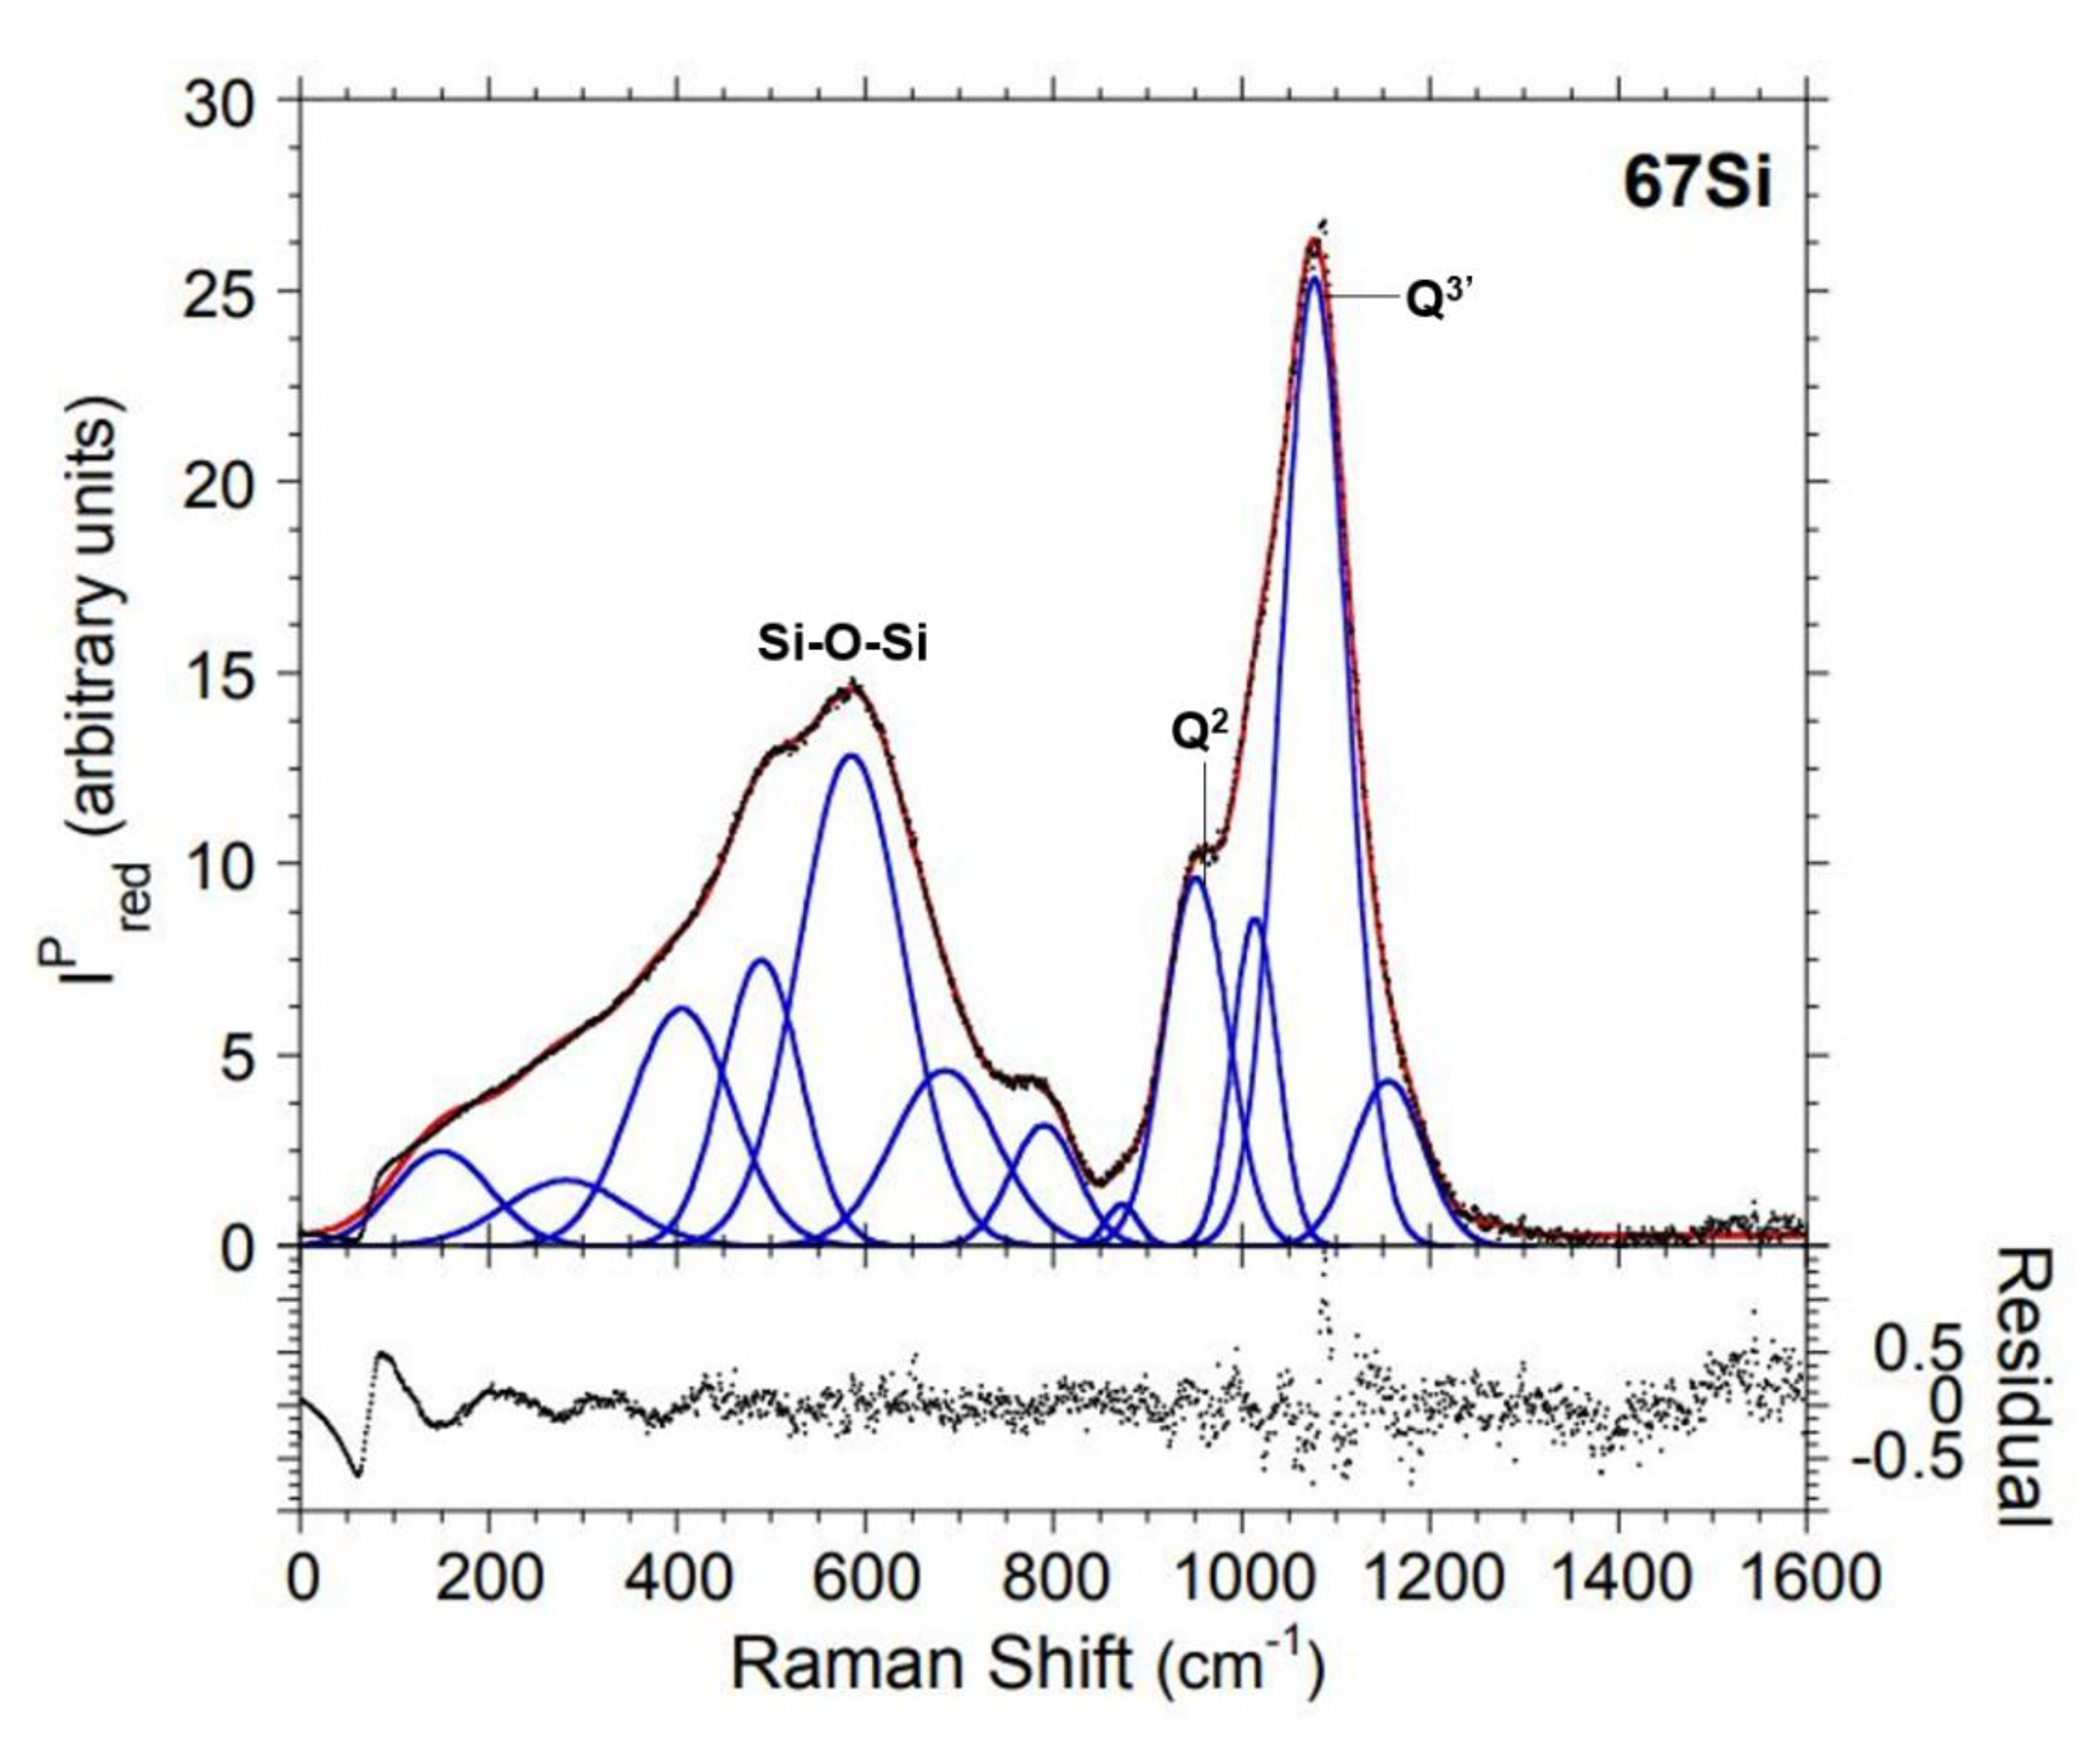
Figure 15.
Major Gaussian component areas versus glass composition for important Raman spectral features. It shows the appearance of danburite ring in 30B37Si and 20B47Si glasses only. Each Gaussian component plotted is labeled with its corresponding glass structural unit assignment.
Figure 15.
Major Gaussian component areas versus glass composition for important Raman spectral features. It shows the appearance of danburite ring in 30B37Si and 20B47Si glasses only. Each Gaussian component plotted is labeled with its corresponding glass structural unit assignment.
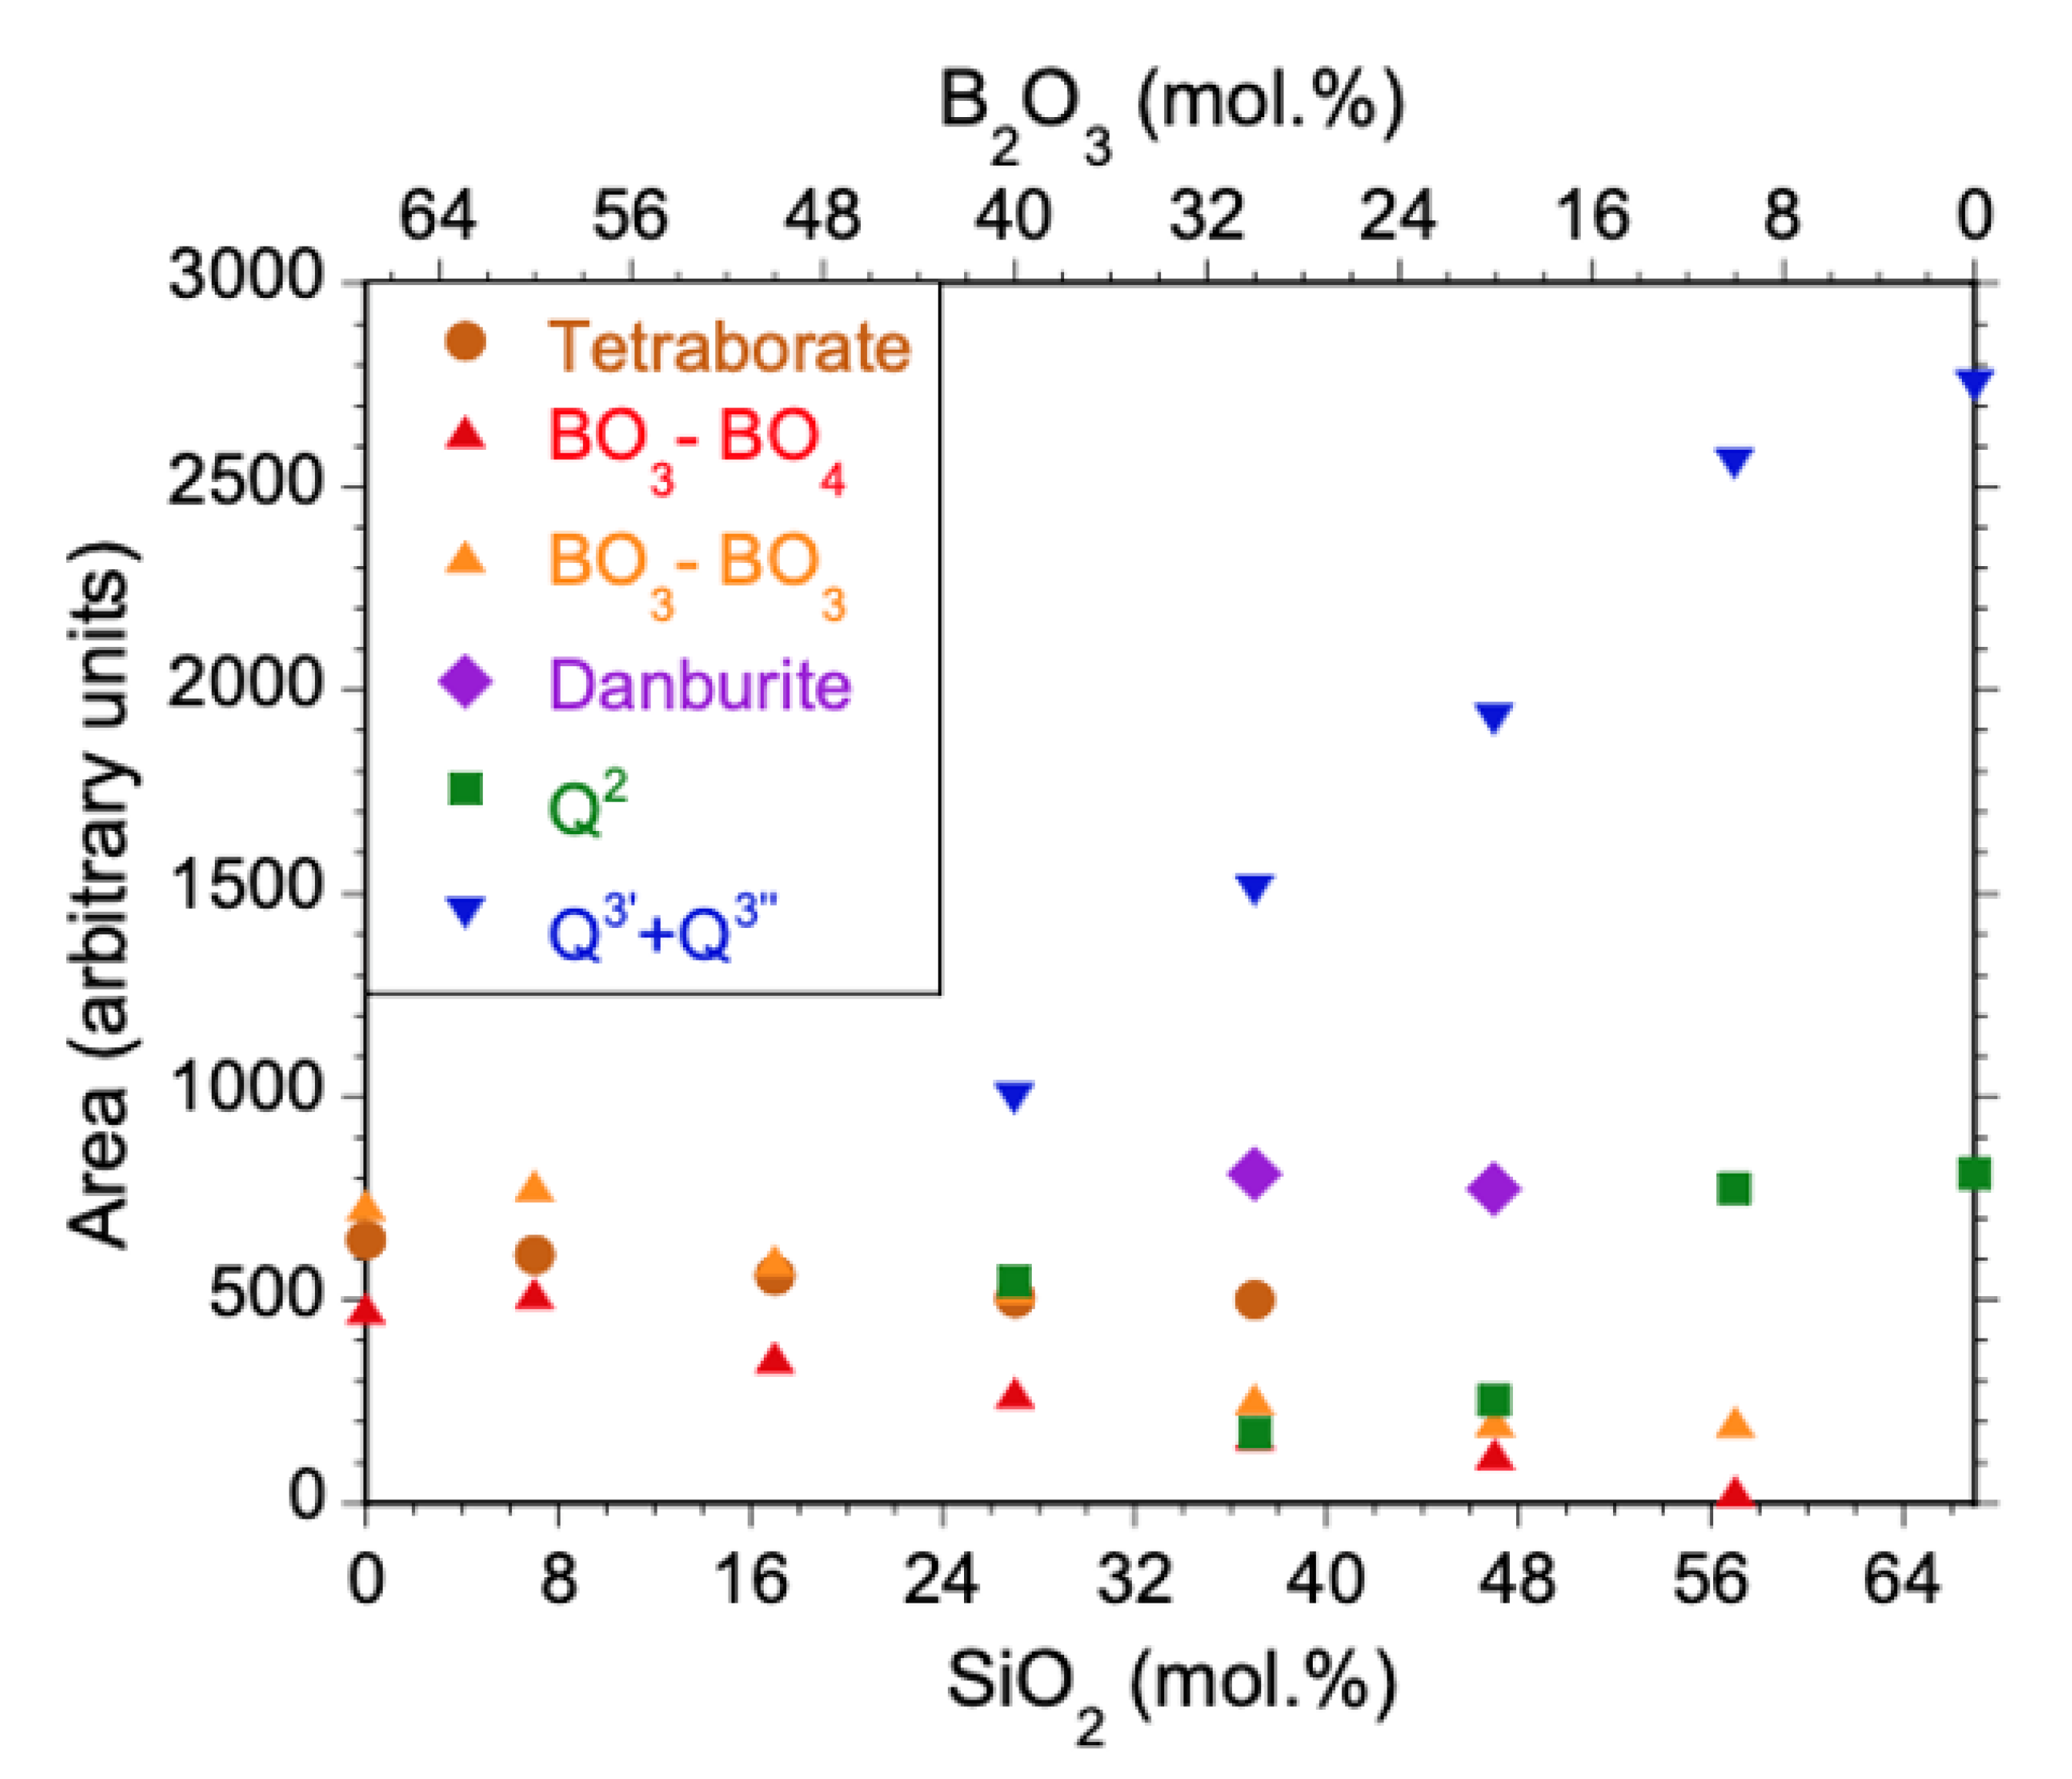
Figure 16.
Activation energy and glass transition temperature with respect to glass composition. The reversal in Ea and Tg indicates the presence of danburite ring in 30B37Si and 20B47Si glasses, with guiding lines to add visualization.
Figure 16.
Activation energy and glass transition temperature with respect to glass composition. The reversal in Ea and Tg indicates the presence of danburite ring in 30B37Si and 20B47Si glasses, with guiding lines to add visualization.
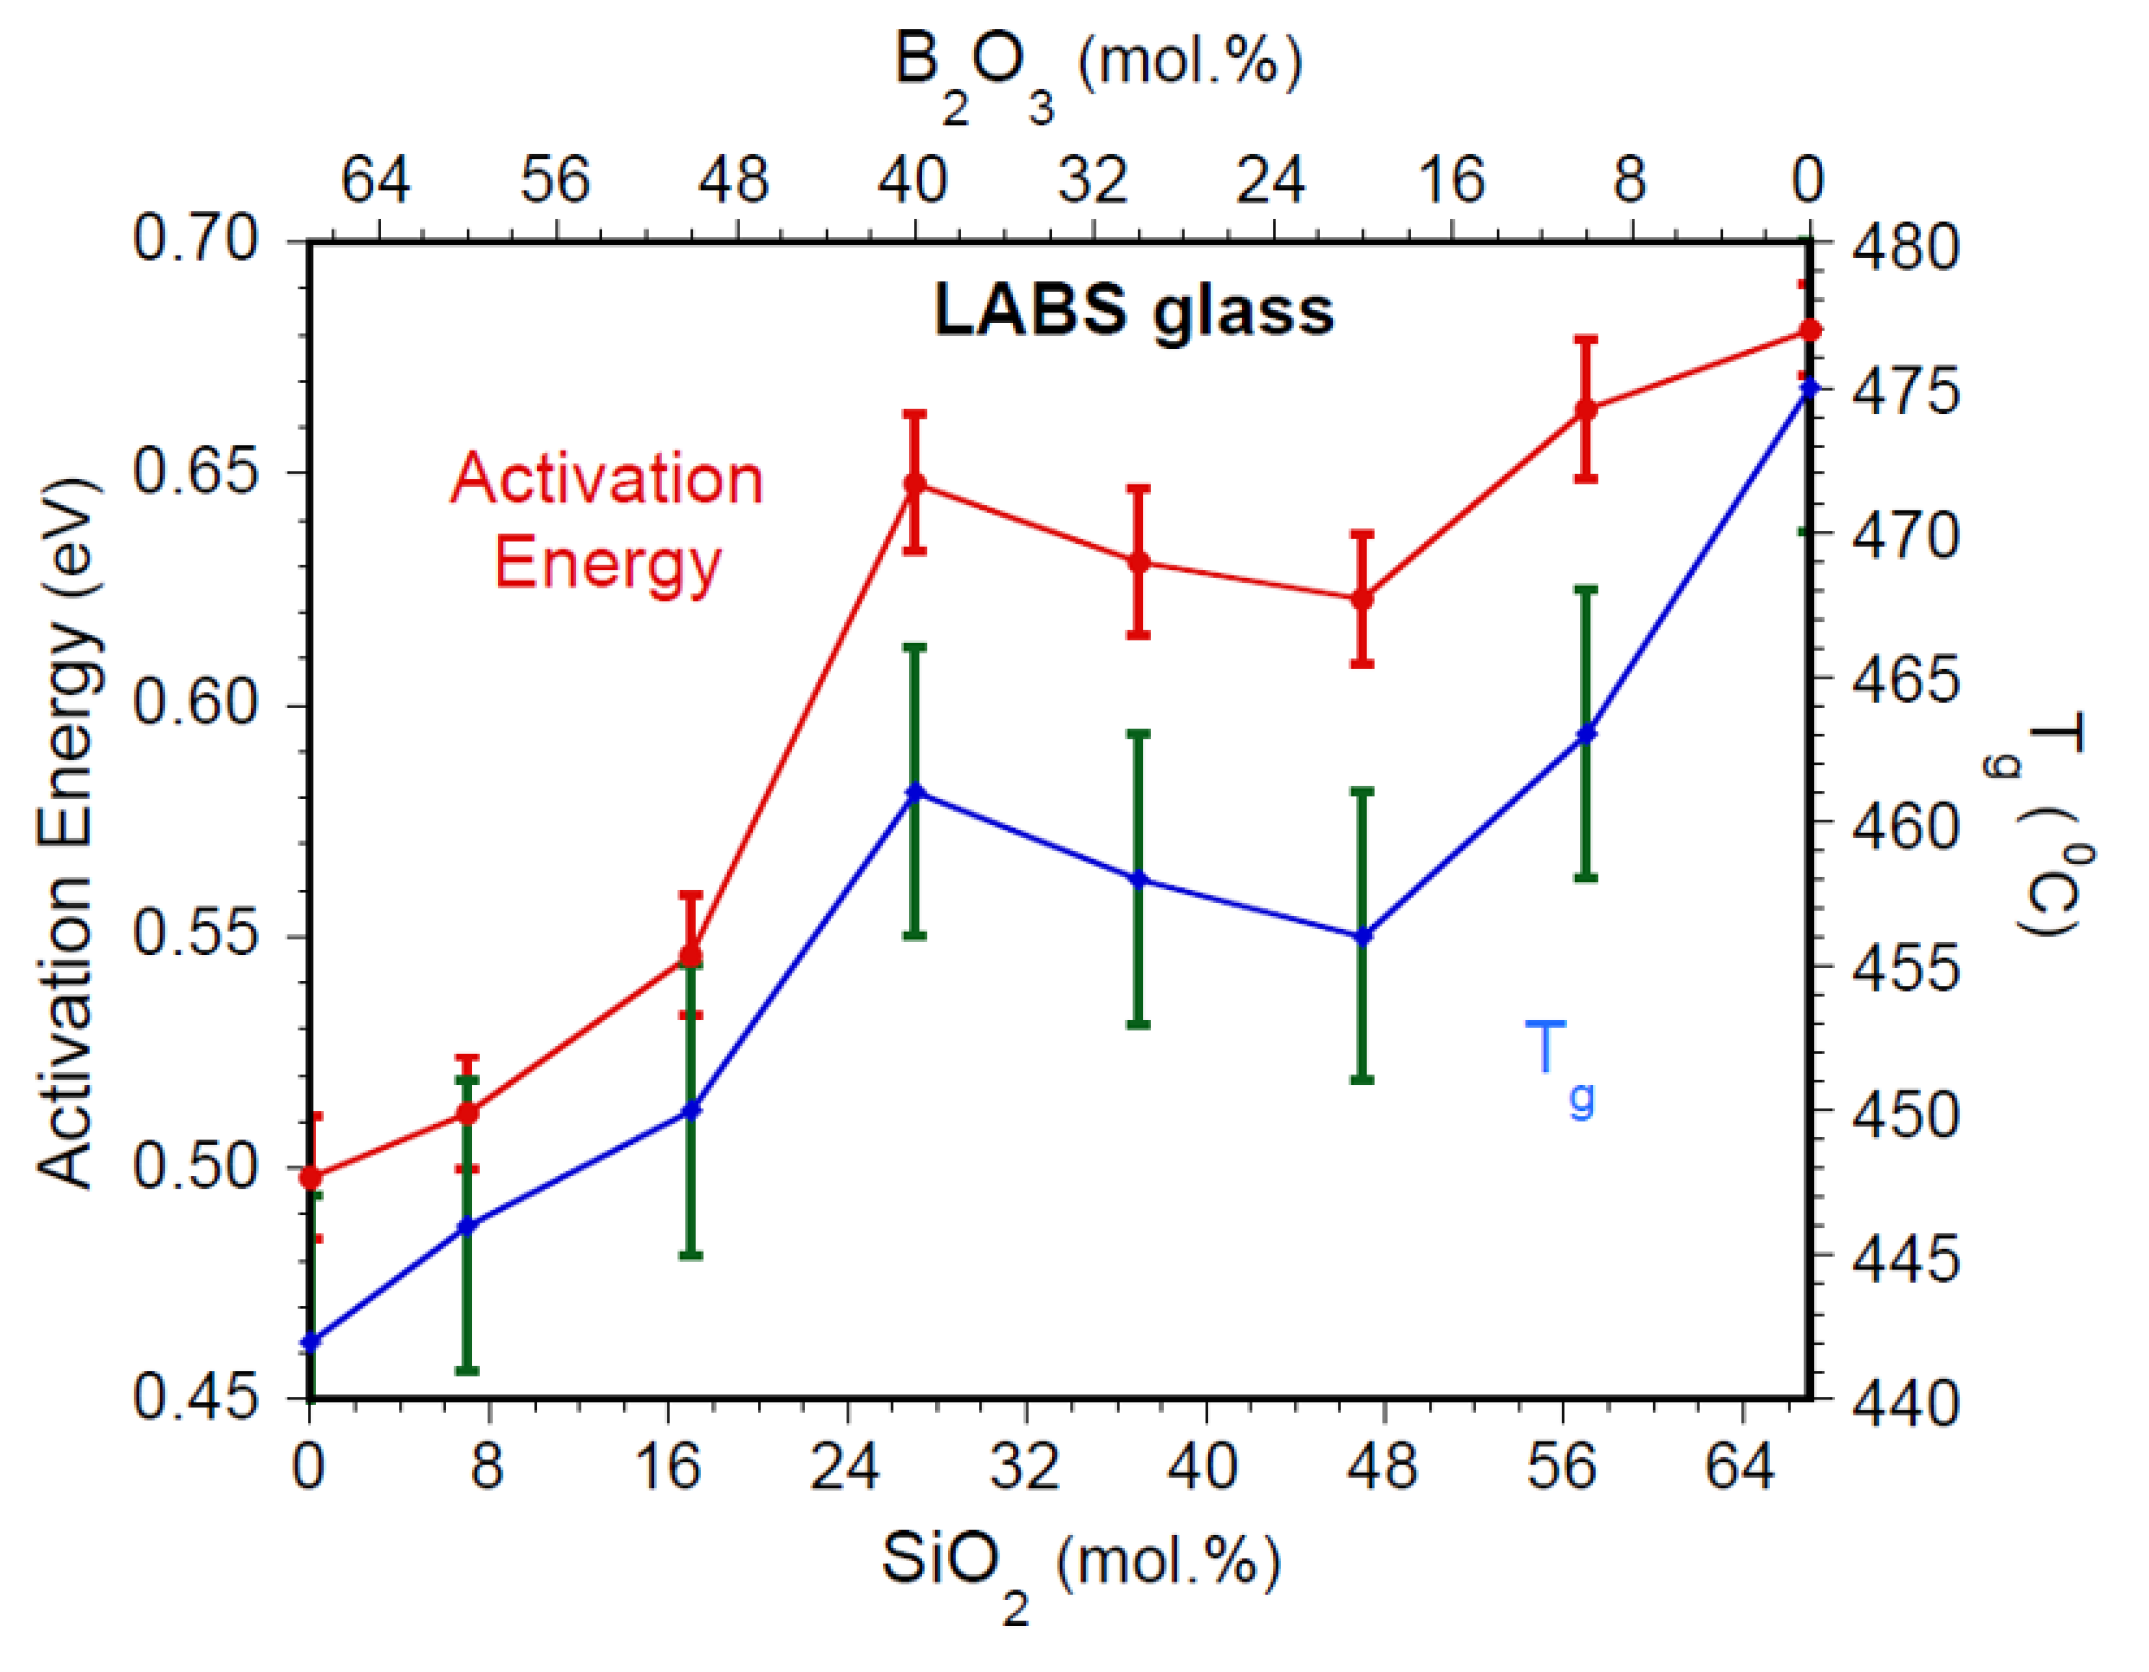
Figure 17.
Parallel polarized reduced Raman spectra of 67B, 30B37Si, and 67Si glass with major structural unit assignments.
Figure 17.
Parallel polarized reduced Raman spectra of 67B, 30B37Si, and 67Si glass with major structural unit assignments.
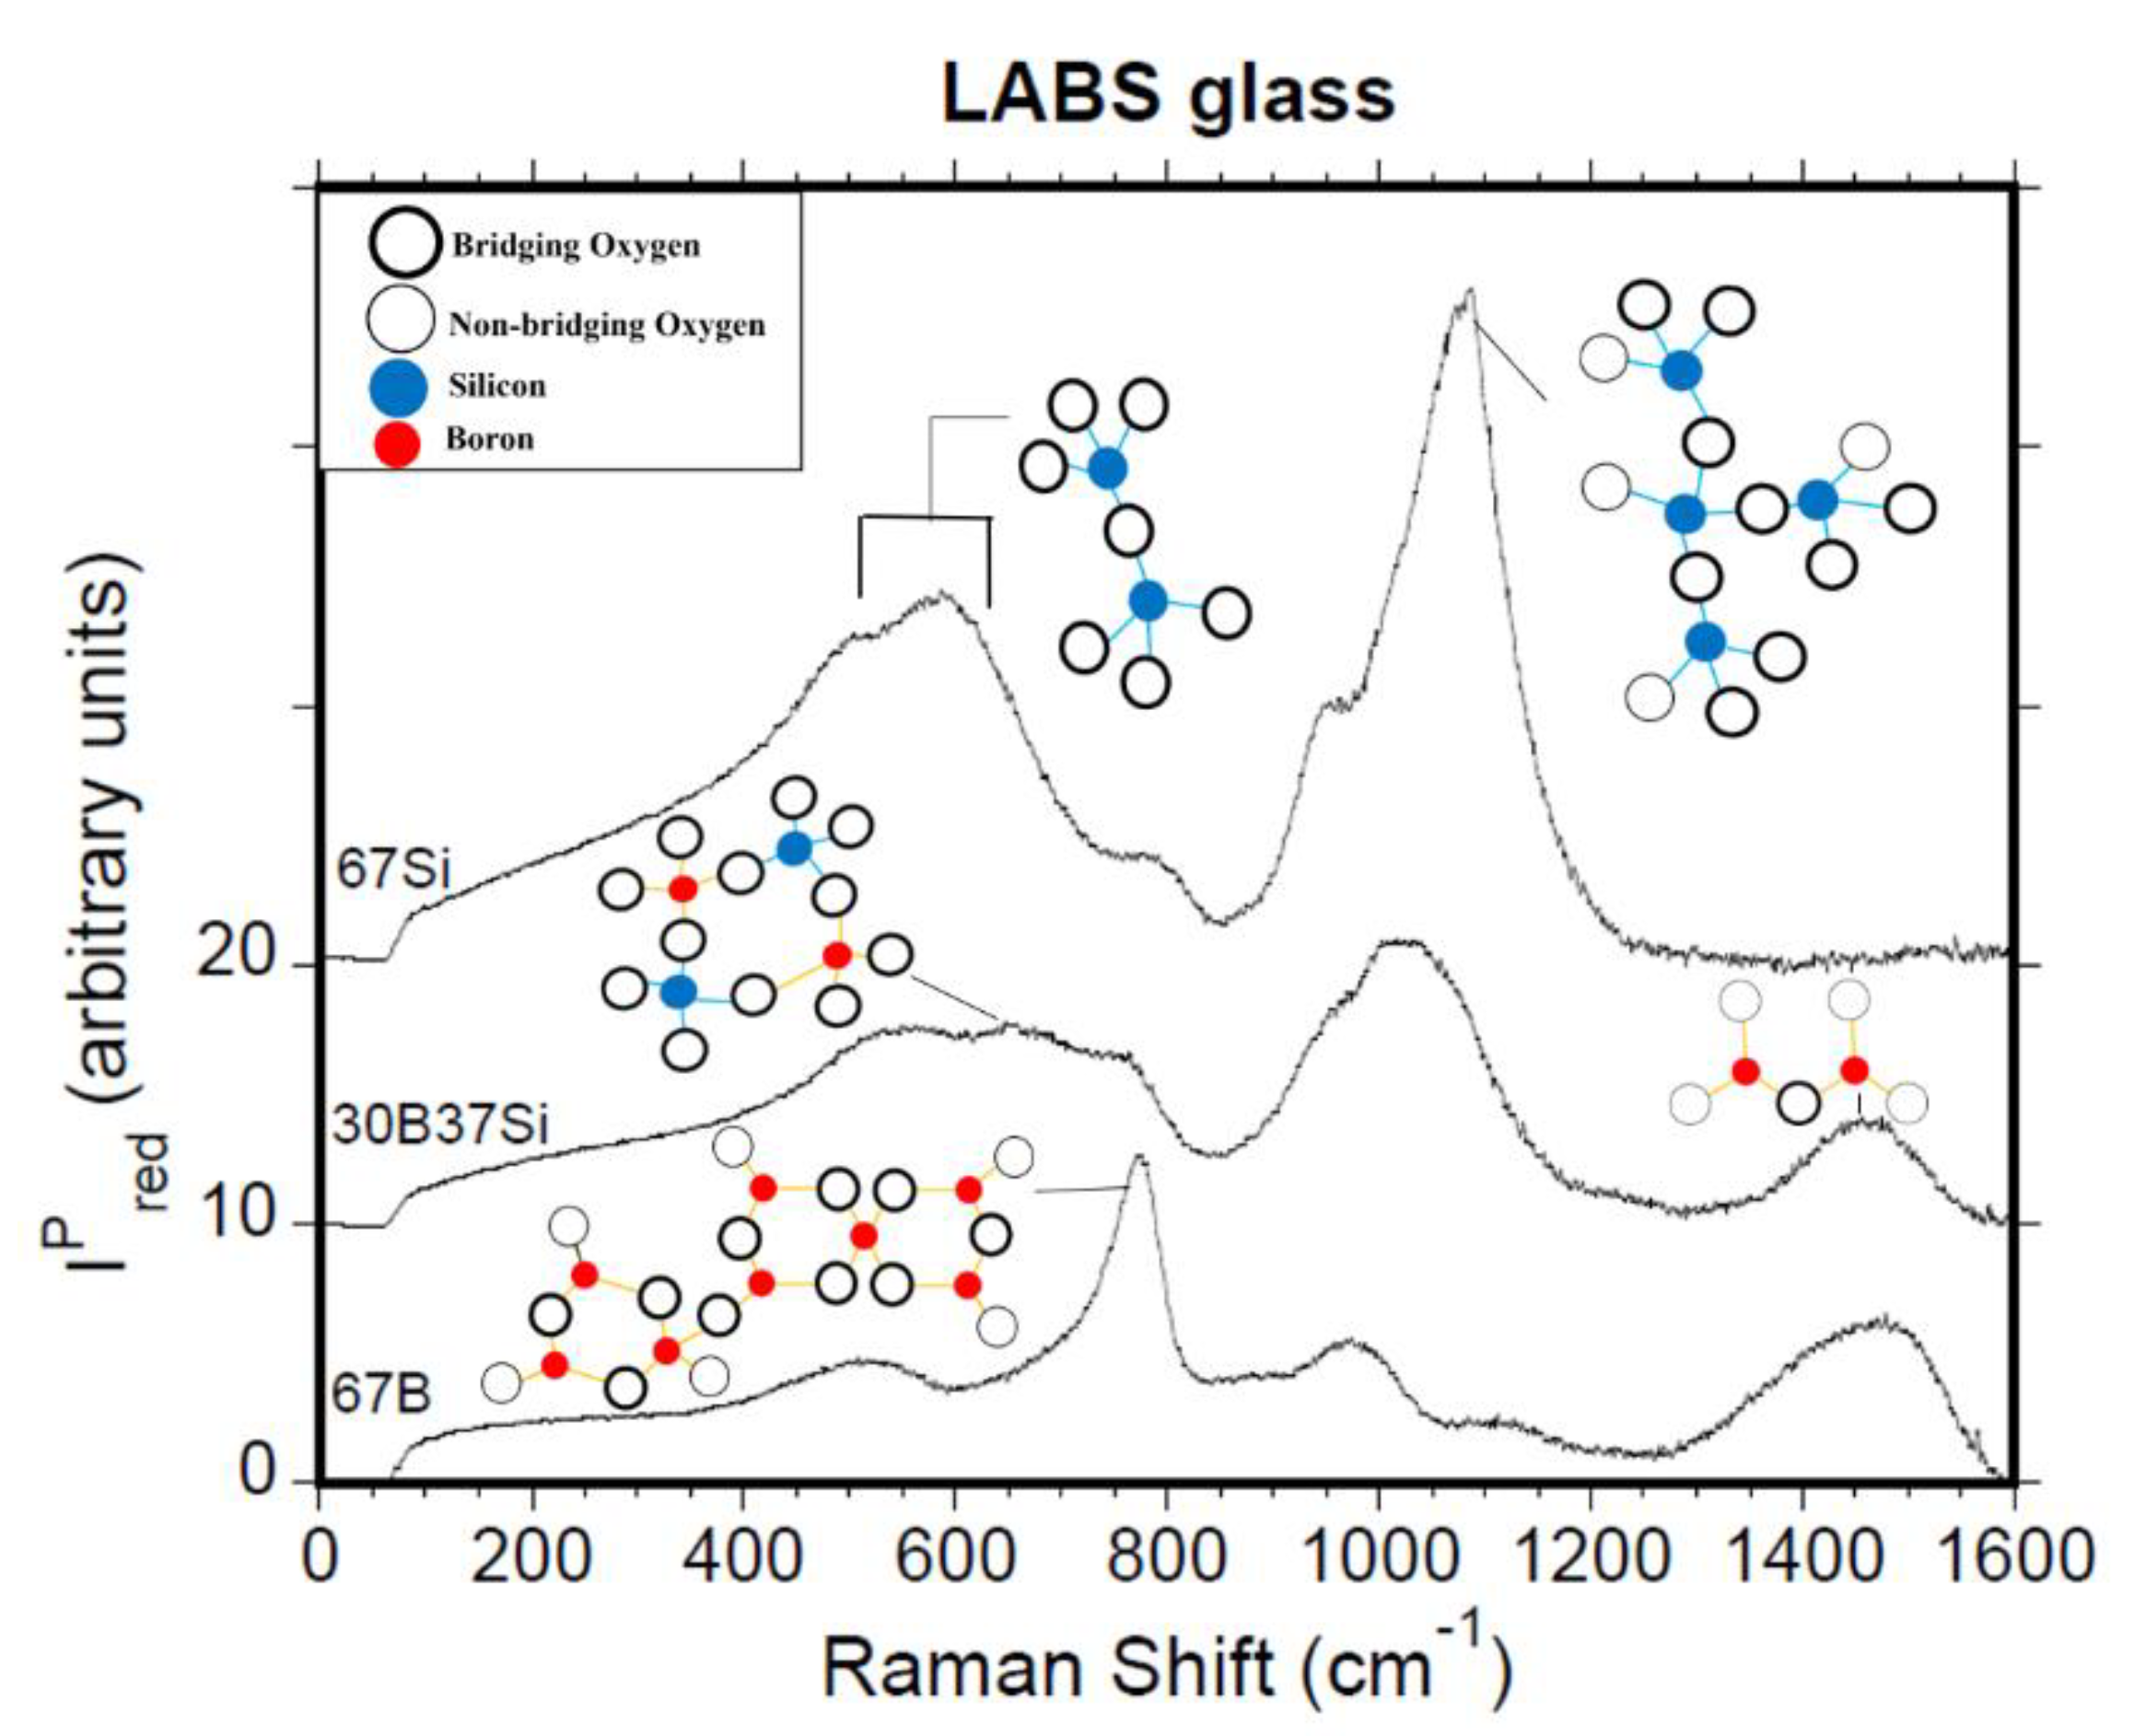
Figure 18.
Phase diagrams showing binodal and spinodal regions in the alkali borate glass system [78].
Figure 18.
Phase diagrams showing binodal and spinodal regions in the alkali borate glass system [78].
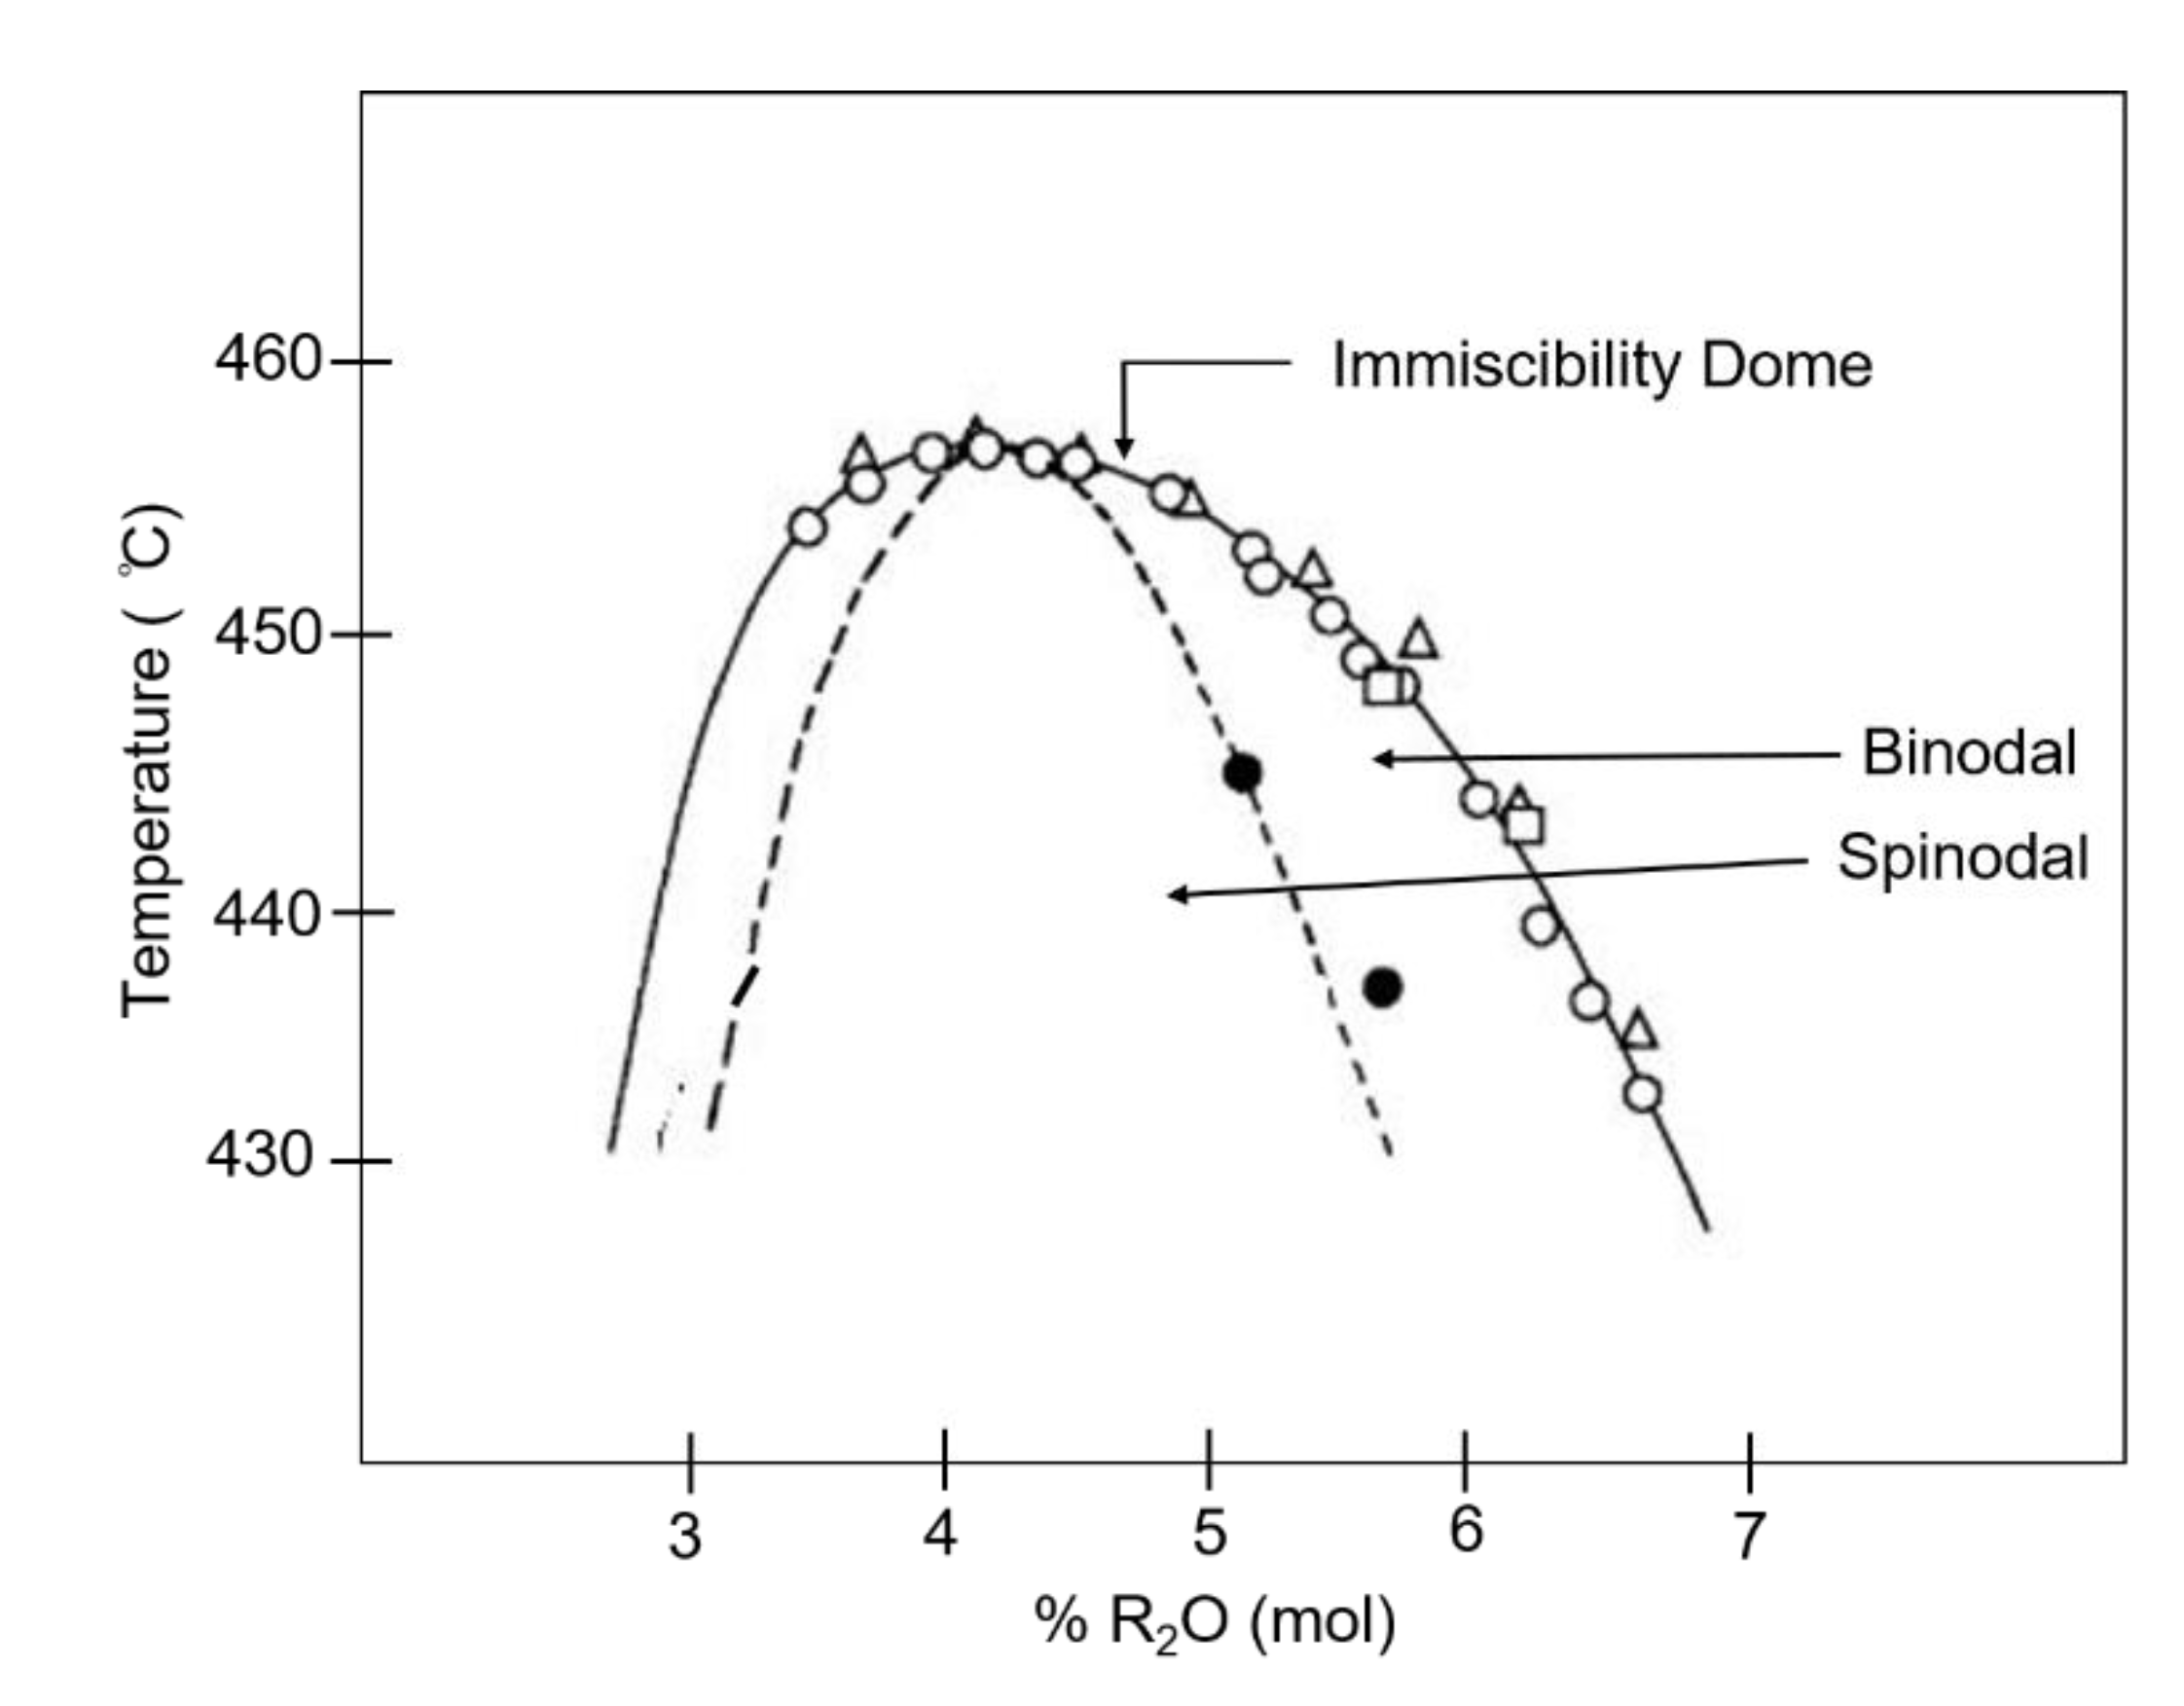

Table 1.
LABS glass series chemical compositions according to XRF. XRF values have a ±10 % uncertainty.
Table 1.
LABS glass series chemical compositions according to XRF. XRF values have a ±10 % uncertainty.
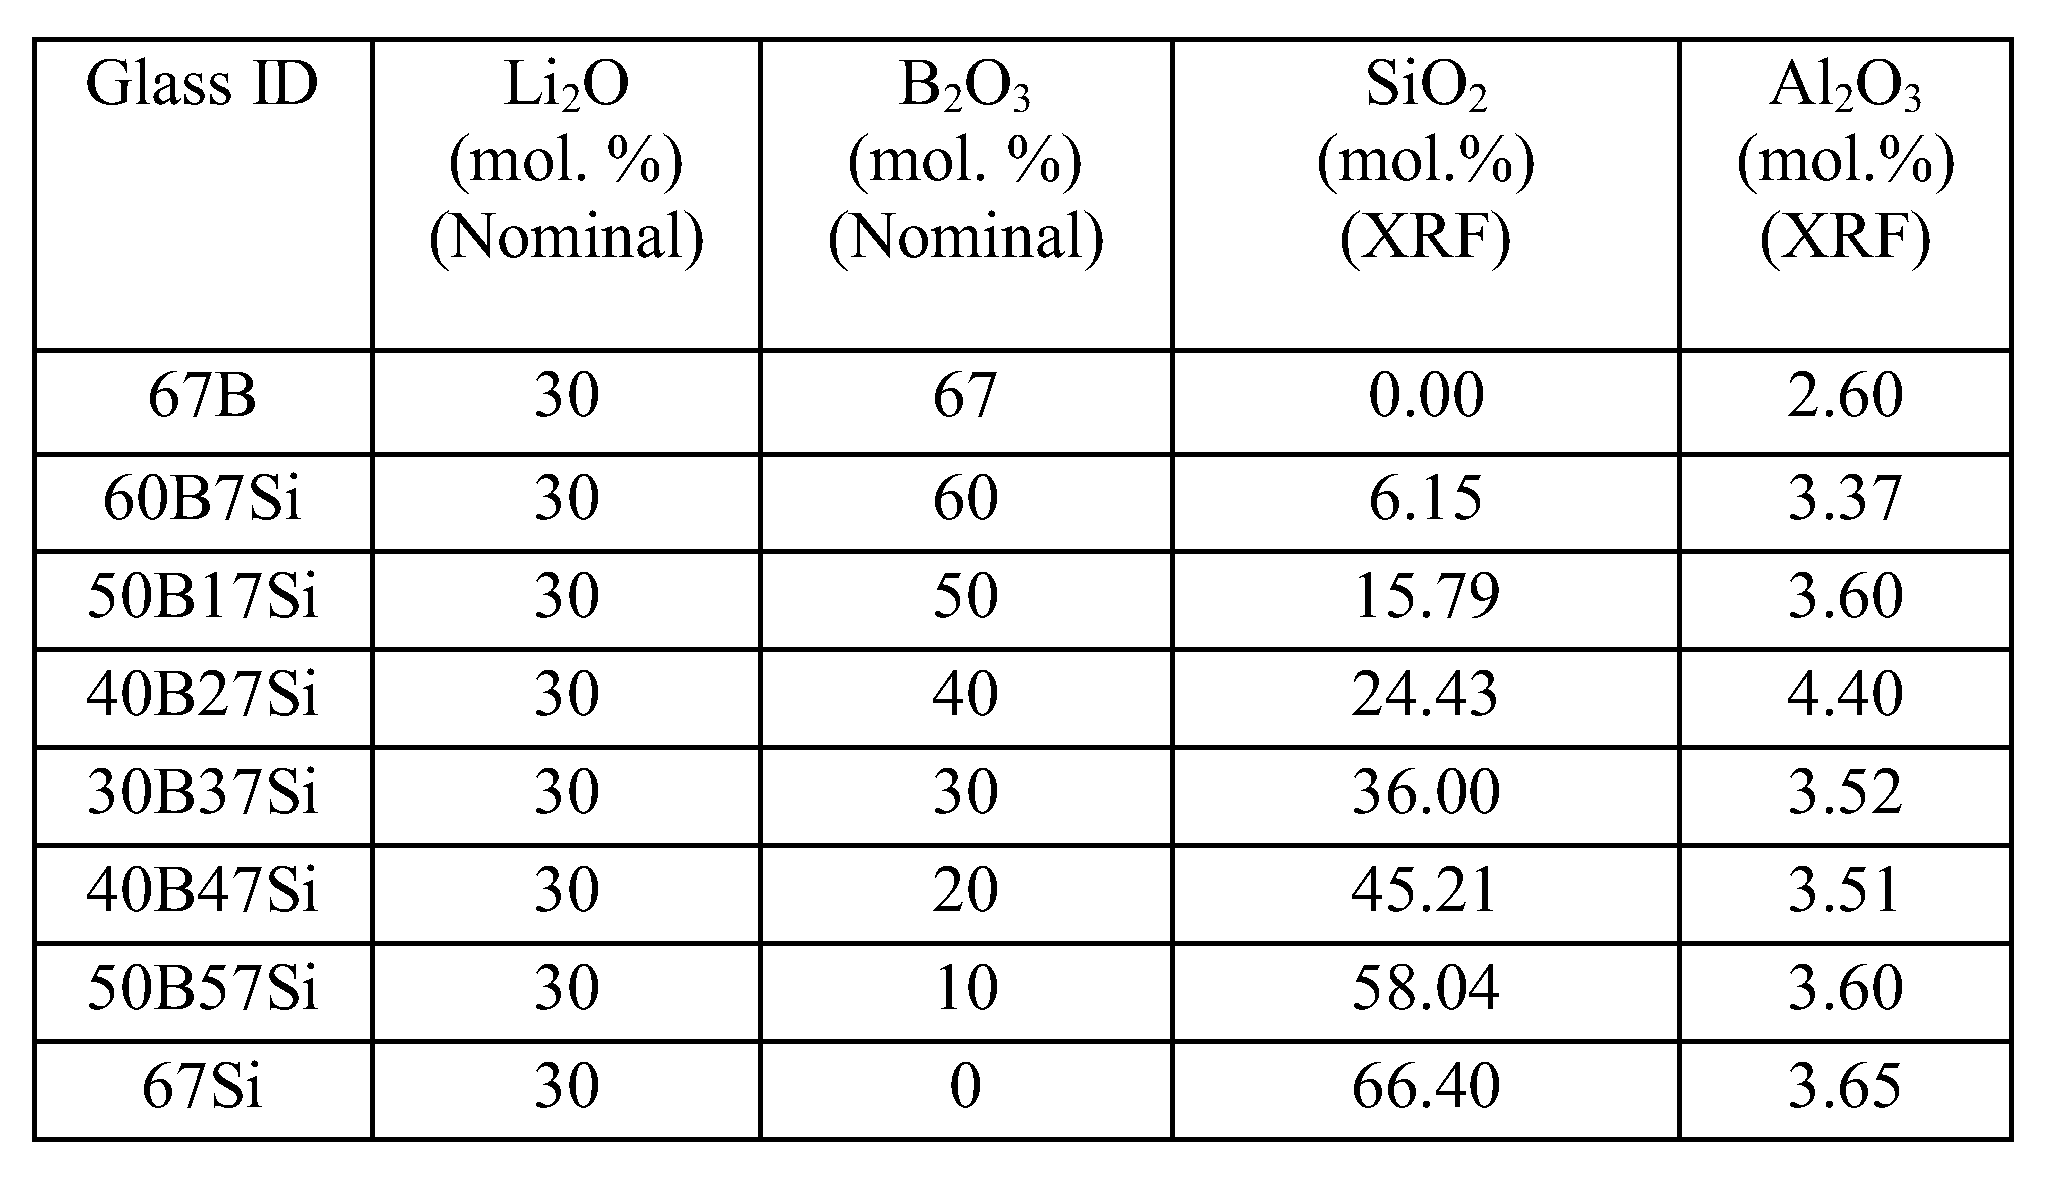
Table 2.
LABS glass series nominal concentrations of Li2O, SiO2, and B2O3, with the associated glass former ratio K, oxide modifier to boron oxide ratio R, critical composition R* [30], and Tg.
Table 2.
LABS glass series nominal concentrations of Li2O, SiO2, and B2O3, with the associated glass former ratio K, oxide modifier to boron oxide ratio R, critical composition R* [30], and Tg.
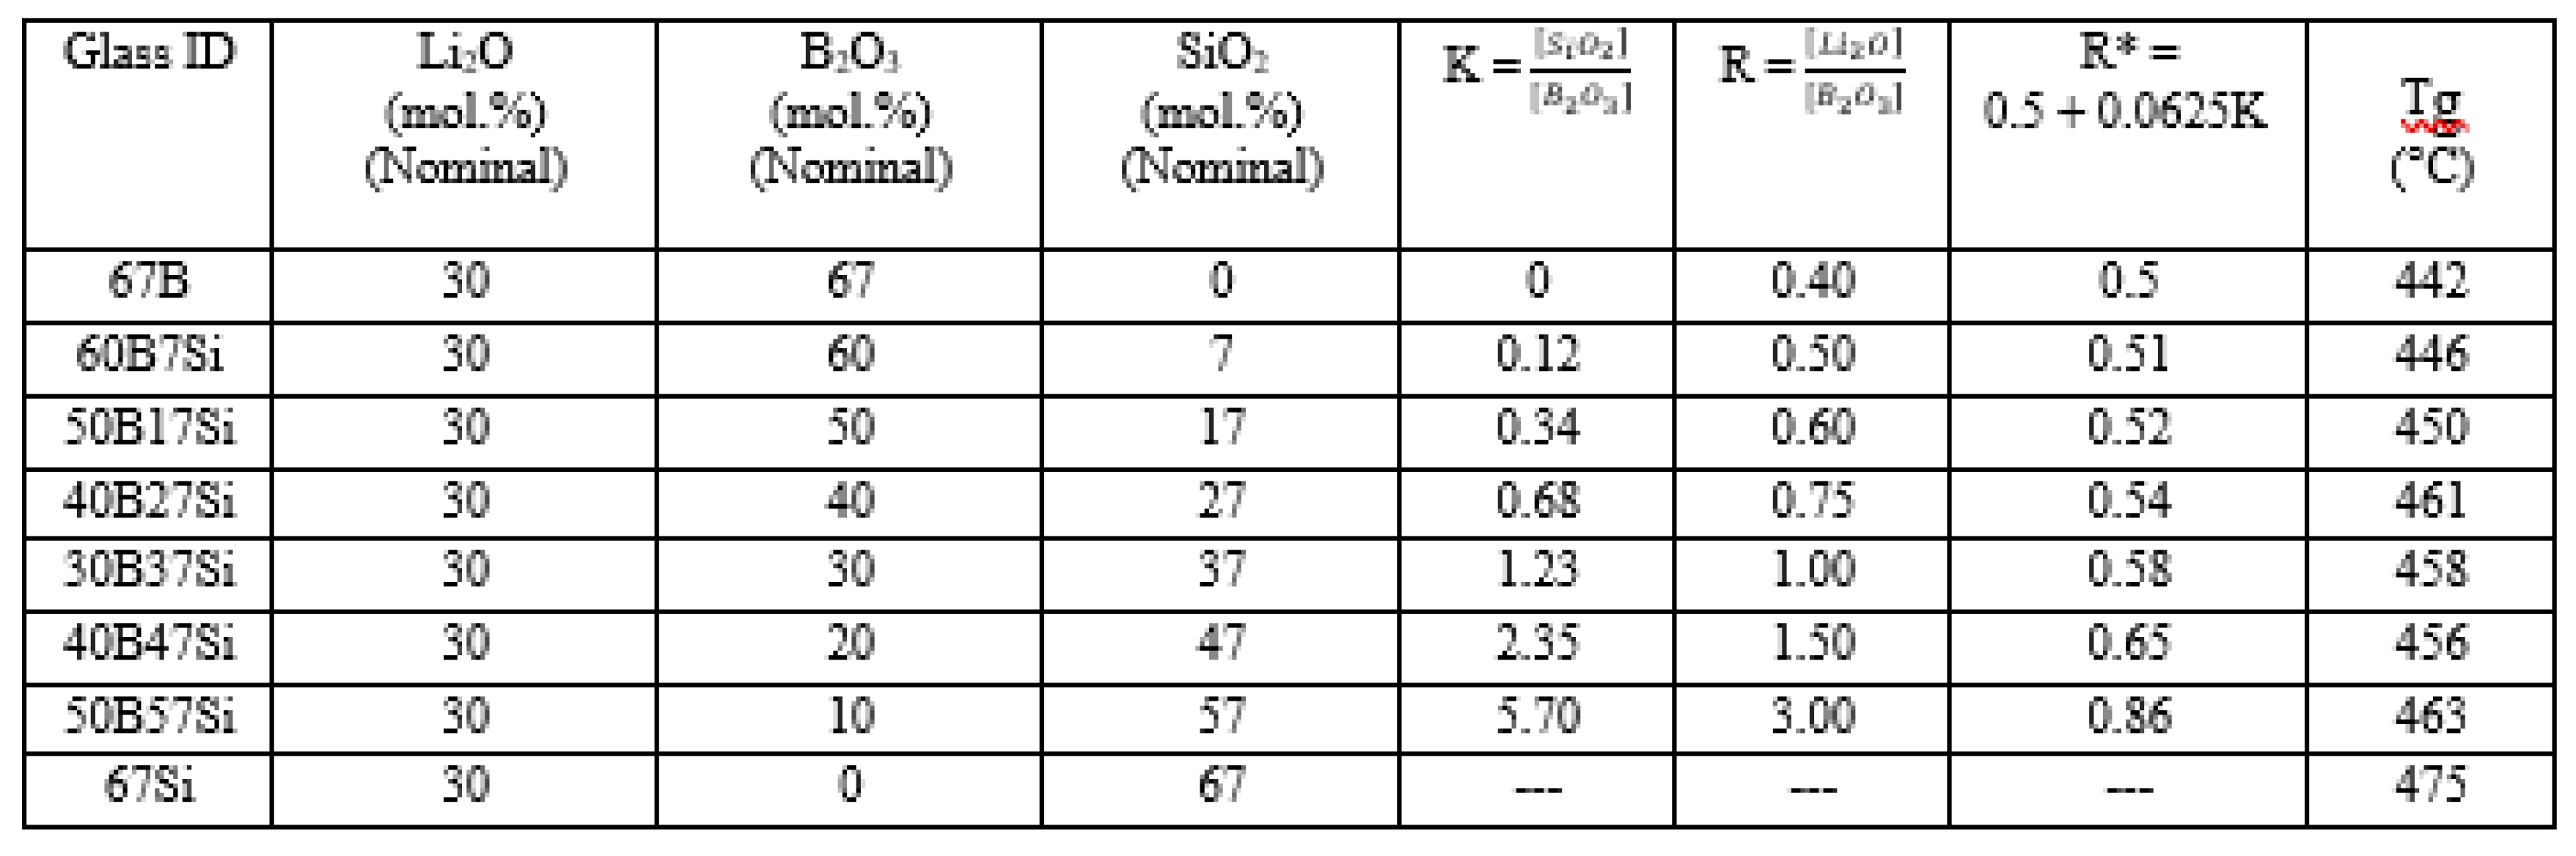
Table 3.
Borate-rich glasses fitted Gaussian component values from program IGOR [60] with corresponding vibrational assignments from the literature. Areas are in arbitrary units.
Table 3.
Borate-rich glasses fitted Gaussian component values from program IGOR [60] with corresponding vibrational assignments from the literature. Areas are in arbitrary units.
| Vibrational Assignment | 67B | 60B7Si | 50B17Si | ||||||
|---|---|---|---|---|---|---|---|---|---|
| Position (cm -1) | peak width | Area | Position (cm -1) | peak width | Area | Position (cm -1) | peak width | Area | |
| Diborate (506 cm -1) [29,39] | 527 | 133 | 575 | 527 | 135 | 746 | 543 | 154 | 994 |
| Ring type metaborate (600-650 cm -1) [29,30,31,32] | 612 | 84 | 148 | 607 | 83 | 142 | 599 | 90 | 0 |
| Chain type metaborate (700-735 cm -1) [29,30,31,32] | 703 | 113 | 646 | 701 | 126 | 890 | 690 | 123 | 790 |
| Tetraborate (740-775 cm -1) [29,38] | 772 | 59 | 649 | 772 | 63 | 612 | 769 | 72 | 561 |
| Pyroborate (820 cm -1) [29,30,31,32,40] | 857 | 89 | 347 | 854 | 91 | 364 | 861 | 105 | 373 |
| Orthoborate (875-1000 cm -1) [29,39,62] | 971 | 127 | 745 | 973 | 133 | 1009 | 981 | 134 | 1127 |
| Diborate (1000-1110 cm -1) [34,52,57] | 1114 | 106 | 254 | 1109 | 110 | 326 | 1098 | 104 | 357 |
| BO3 symmetric stretch (1200 cm -1) [31,35,43] | 1236 | 127 | 168 | 1233 | 125 | 195 | 1233 | 125 | 179 |
| BO3-BO4 (1300-1450 cm -1) [28,29,30,31] | 1381 | 122 | 479 | 1384 | 125 | 517 | 1393 | 125 | 358 |
| BO3-BO3 (1450-1600 cm -1) [28,29,30,31] | 1483 | 117 | 733 | 1480 | 112 | 783 | 1475 | 109 | 597 |
Table 4.
Borosilicate glasses fitted Gaussian component values with corresponding vibrational assignments from the literature.
Table 4.
Borosilicate glasses fitted Gaussian component values with corresponding vibrational assignments from the literature.
| Vibrational Assignment | 40B27Si | 30B37Si | ||||
|---|---|---|---|---|---|---|
| Position (cm -1) | peak width | Area | Position (cm -1) | peak width | Area | |
| Vibration of bridge bonds B-O-B, B-O-Si, Si-O-Si (500-600 cm -1) [44,45,52] | 543 | 155 | 1072 | 539 | 144 | 980 |
| danburite and reedmergnerite rings [42,52,53] | 681* | 118* | 742* | 664 | 121 | 809 |
| Tetraborate (740-775 cm -1) [29,38] | 765 | 79 | 505 | 764 | 102 | 505 |
| orthosilicate-pyroborate (850 cm -1) [40,67] | 858 | 120 | 380 | 888 | 87 | 241 |
| Q2 (950 cm -1) [46,47,48] | 952 | 93 | 548 | 942 | 59 | 174 |
| Q3’ (1020 cm -1) [46,47,48] | 1014 | 80 | 546 | 1020 | 121 | 1369 |
| Q3’’ (1080 cm -1) [46,47,48,51] | 1079 | 90 | 448 | 1085 | 54 | 138 |
| Q4 (1140 cm -1) [46,47,48] | 1148 | 88 | 117 | 1138 | 68 | 148 |
| Symmetric stretching of BO3 units (1200 cm -1) [31,35,43] | 1234 | 121 | 143 | 1227 | 92 | 50 |
| BO3-BO4 (1300-1450 cm -1) [28,29,30,31] | 1391 | 117 | 273 | 1415 | 77 | 172 |
| BO3-BO3 (1450-1600 cm -1) [28,29,30,31] | 1473 | 107 | 529 | 1478 | 78 | 255 |
* The Gaussian component at 681 cm-1 for 40B27Si glass can be assigned to the chain type metaborate units.
Table 5.
Silica-rich glasses fitted Gaussian component values with corresponding vibrational assignments from the literature. Conventions from Table 3 are followed.
Table 5.
Silica-rich glasses fitted Gaussian component values with corresponding vibrational assignments from the literature. Conventions from Table 3 are followed.
| Vibrational Assignment | 20B47Si | 10B57Si | 67Si | ||||||
|---|---|---|---|---|---|---|---|---|---|
| Position (cm -1) | peak width | Area | Position (cm -1) | peak width | Area | Position (cm -1) | peak width | Area | |
| breathing vibration in four membered rings (485 cm -1) [45,50] | 531 | 138 | 1119 | 509 | 127 | 855 | 490 | 98 | 781 |
| breathing vibration in three membered rings (600 cm -1) [52,63,65] | 641** | 138** | 772** | 601 | 131 | 1279 | 585 | 131 | 1790 |
| stretching plus bending of Si-O-Si bond (654 cm -1) [44,45] | 690 | 121 | 436 | 673 | 117 | 735 | 685 | 130 | 635 |
| Si-O-Si bending modes (800 cm -1) [47,66] | 777 | 89 | 314 | 774 | 89 | 333 | 790 | 83 | 280 |
| Orthosilicate (850 cm -1) [67] | 891 | 87 | 239 | 881 | 87 | 156 | 873 | 41 | 47 |
| Q2(950 cm -1) [46,47,48,69] | 941 | 59 | 253 | 950 | 76 | 774 | 952 | 79 | 811 |
| Q3’(1020 cm -1) [46,47,48,68] | 1018 | 105 | 1442 | 1016 | 72 | 841 | 1014 | 56 | 513 |
| Q3’’(1080 cm -1) [46,47,48] | 1084 | 70 | 484 | 1076 | 87 | 1715 | 1077 | 83 | 2234 |
| Q4(1140 cm -1) [46,47,48,69] | 1145 | 68 | 176 | 1159 | 68 | 150 | 1156 | 88 | 407 |
| Symmetric stretching of BO3 units (1200 cm -1) [31,35,43] | 1227 | 92 | 68 | 1229 | 92 | 64 | --- | --- | --- |
| BO3-BO4(1300-1450 cm -1) [28,29,30,31] | 1416 | 62 | 121 | 1449 | 87 | 201 | --- | --- | --- |
| BO3-BO3(1450-1600 cm -1) [28,29,30,31] | 1476 | 74 | 202 | 1512 | 45 | 30 | --- | --- | --- |
** The Gaussian component at 641 cm -1 for 20B47Si glass can be assigned to danburite and reedmergnerite rings.
Disclaimer/Publisher’s Note: The statements, opinions and data contained in all publications are solely those of the individual author(s) and contributor(s) and not of MDPI and/or the editor(s). MDPI and/or the editor(s) disclaim responsibility for any injury to people or property resulting from any ideas, methods, instructions or products referred to in the content. |
© 2024 by the authors. Licensee MDPI, Basel, Switzerland. This article is an open access article distributed under the terms and conditions of the Creative Commons Attribution (CC BY) license (http://creativecommons.org/licenses/by/4.0/).
Copyright: This open access article is published under a Creative Commons CC BY 4.0 license, which permit the free download, distribution, and reuse, provided that the author and preprint are cited in any reuse.


