Submitted:
14 May 2024
Posted:
14 May 2024
You are already at the latest version
Abstract
This work examines the beneficial role of an unsteady stenosis, operating without the use of any external energy source, as a means for augmenting the flow rate of a valveless pump in a hydraulic loop, including an open tank. In contrast to our previous work that the loop was horizontal, here gravity was taken into account. The stenosis neck cross-sectional area was controlled by the fluid pressure and an opposing force applied externally by a spring of adjustable tension. The pincher compressed and decompressed periodically a part of a flexible tube with frequencies from 5 Hz to 11 Hz and compression ratios Ab from 24% to 65%. The presence of the stenosis increased the net flow rate 19 times for Ab = 24%, and 6.3 times for Ab = 38%, whereas for Ab = 65%, the flow rates were comparable. The volumetric efficiency varied from 30% to 40% under the presence of the stenosis, and from 2% to 20% without the stenosis. The role of the stenosis role was to cause a unidirectional flow, opening during tube compression and closing during decompression. The pressure amplitudes along the flexible tube increased towards the rigid-flexible tube junction (as a result of the wave reflections) which were found to be significantly attenuated by the presence of the stenosis.
Keywords:
valveless pump
; unsteady stenosis
; flow rate augmentation
; wave reflection
1. Introduction
The advantage of the simple geometrical features of valveless pumps and consequently the ease of their manufacturing and maintenance is in contrast to their, in general, small net flow rates. Elevated flow rates and volumetric efficiencies do appear, only when the pump’s pinching frequencies are close to the resonant frequencies of the hydraulic loop [1,2]. Therefore, there has been a lot of effort by the scientific community to increase the pump’s net flow rate by introducing several devices as flow rectifiers [3]. Since the reciprocating pinching mechanism of this type of pumps causes a periodic flow of alternating sign, an asymmetry within the pinching period can cause on average a unidirectional flow. In this respect, tapered tube segments are normally used, the hydraulic losses being higher when the flow is directed towards the divergent part of the tube, owing to flow separation, than when the flow is towards the convergent part. In [4], multiple pinchers are proposed with phase differences between them to increase net flow rate and in [5] the performance of an innovative soft-robotic pincher is compared to a mechanical one, showing the advantages of the first.
In a previous work of the present group [6], a new concept was introduced, which caused a significant flow rate increase of a valveless pump. Namely, a very small length of the flexible tube of the pump was squeezed by a spring, causing a local stenosis, the opening of which was time dependent, varying according to the local fluid pressure and the tension of the spring. The present work is in the context of further exploring the efficiency of the latter device. In contrast to the previous configuration of a horizontal closed loop, here the valveless pump is connected to a loop with an open tank at a height above the pump. The beneficial role of the unsteady stenosis is experimentally verified, especially when the tube compression ratio takes low values, increasing the net flow rate many times compared to the non-stenosis case.
2. Materials and Methods
A hydraulic loop was used, including a 920 mm long flexible tube of an internal diameter D = 12 mm, 1 mm thick, being connected to two stiff transparent plastic tubes 1300 mm long each, of the same diameter. Each of the stiff tubes was connected to a water tank (the tanks being side by side, see Figure 1a) at a certain height level above a table at which the pincher of the valveless pump was located with the novel unsteady stenosis device (see Figure 2, [6]). The flowing medium was salt water at an average temperature of 22°C, (10% salt concentration by weight) necessary for the operation of an electromagnetic flow meter.
The pincher, 100 mm long (L1 =100 mm), was asymmetrically located at a distance LE = 220 mm from the flexible-stiff tube connection, and the oscillating stenosis at a distance LB = 180 mm far from the center of the pincher (Figure 1). The frequency of the reciprocating pincher and the tube compression ratio Ab = 1- Amin /A0, (where Amin is the smallest tube cross-sectional area under the pincher and A0 is the undeformed flexible tube cross-sectional area) were both adjustable (see [6]). For each pinching frequency, the spring tension of the stenosis device was adjusted by a trial and error procedure in order to maximize the net flow rate (see [6]). Setting the pump in operation, with the two water tanks having initially the same free surface elevation, with depths smaller than their maximum, an elevation difference progressively appeared between the tanks as time passed, accompanied by a reduction of the flow rate. Eventually, the flow rate was nullified and the free surface height difference reached a maximum depending on the pinching frequency and whether the stenosis was present or not (Figure 1a). Therefore, a maximum flow rate was recorded when both tanks had the same free surface elevation. This is a typical characteristic feature of a valveless pump when it is connected to two tanks, as it has been previously documented [5,7,8,9]. Thus, it was decided to conduct all the experiments having filled the two tanks as shown in Figure 1b, so that the free surface remained constant (not dependent on time), being identical for all the examined cases and at the same time the net flow rate was the maximum one. As a result, the latter conditions facilitated comparisons of the valveless pumping performance with and without the presence of the proposed stenosis device in the present loop configuration. Moreover, the examined pinching frequencies (5.5 Hz to 11 Hz) and compression ratios (38%, 49%, 65%) were the same like in [6] (besides an additional compression ratio 24% which was also examined in this work) allowing comparisons with the previous horizontal closed loop data.
The quantities which were examined as a function of time were: a) the time dependent flow rate which was measured by an electromagnetic flow meter (Carolina Medical FM501, Cary, NC, USA) connected to one of the two solid tubes of the hydraulic loop, b) the gauge static pressures at the two solid-flexible tube junctions measured by piezoresistive transducers (MILLAR, Houston, TX, USA, SPC-370), c) the displacement of the pincher by a wire sensor (Micro-Epsilon, Ortenburg, Germany), d) the width of the unsteady stenosis neck by an inductive sensor (IA8-MIK-13, Pepperl + Fuchs, Mannheim, Germany), and e) the gauge static pressure along the flexible tube by a piezoresistive transducer (MILLAR, Houston, TX, USA, SPC-370). The output analogue signals of the above sensors were digitized with a sampling frequency of 600 Hz and a minimum integration time of 20 s, employing 24-bit A/D converters (MX440A, HBM, Darmstadt, Germany) and 16-bit A/D converters (SPIDER8, HBM, Darmstadt, Germany) connected to two PCs. The synchronization of the two acquisition systems was based on a photodiode from which a voltage pulse was sent to both systems at an arbitrary time instant, by inserting a metallic object between the two terminals of the photodiode, (normally 30 s after the initiation of each experiment to avoid any transitional phenomena). The voltage pulse initiated the digitization of all signals exactly at the same time, which was the starting point of each experiment.
The uncertainty in the measured quantities in this work for a confidence level of 95% was as follows: flow rate: ±1.6%, pressure: ±3.3%, stenosis width: ±3.8%, pincher displacement: ±2.1%.
3. Results
All experiments were conducted keeping the free surface of the water tank 800 mm above the pincher of the valveless pump, so that the maximum static gauge pressure in the loop was 800 mm H2O or 58.86 mmHg when the fluid was still. It is reminded that the initial pressure in the horizontal loop of [6] (when the fluid was still) was 50 mmHg. It has to be noted that representative measurements were also made for a level of 1100 mm of the water tank (80.93 mmHg), without noticeable influence on the flow rate when the stenosis was used, whereas when the stenosis was absent the flow rate was practically zero. On the other hand, smaller pressures than 50 mmHg in the loop did not allow the stenosis to oscillate, due to the higher force applied externally by the spring device compared with the fluid pressure, so that the performance of the proposed device was poor at low transmural pressures.
The net flow rate versus pinching frequency is shown in Figure 2 for three compression ratios 24%, 38% and 49% when the stenosis is present. The direction of the time mean flow is from the pincher towards the stenosis with practically the same peak net flow rate values for Ab =38% and 49%. In case that the stenosis was not present, the flow rate was very small for the above compression ratios and of opposite sign, taking mean values 0.03 L/min for Ab = 24% and 0.12 L/min for Ab =38% and 49%. In contrast, with the stenosis present, the peak flow rates were 0.57 L/min, namely 19 times larger for Ab =24%, and 0.76 L/min (or 6.3 times larger) for Ab=38% and 49%. It is clear that without the stenosis, the valveless pump was not operable in the present configuration for small compression ratios, verifying the value of the proposed device for boosting the flow rate. The major difference from the horizontal loop of [6] is that the flow rates in the present loop were about 50% smaller, either the stenosis was present or not. Peak and valleys did appear in the net flow rate versus pinching frequency graph, the latter being less smooth compared with the horizontal loop case. Therefore, it seems that gravity plays an important role in valeveless pumping, a parameter which has been highlighted by [7]. Moreover, the presence of the open tank with its free surface being constant, caused the pressure at this location of the hydraulic loop to be time-invariant, independently of the pinching frequency, the compression ratio and the presence or not of the stenosis.
Increasing the compression ratio to 65%, the influence of the stenosis on the flow rate was weakened (like in [6]), as shown in Figure 3, the flow rates being comparable between the two cases. The flow direction for Ab = 65% was opposite between the stenosis and the non- stenosis case for pinching frequencies smaller than f = 9.85 Hz, which also occurred for smaller Ab values. However, for higher pinching frequencies, the flow direction was reversed for the non-stenosis case, a typical behaviour of valveless pumping that the flow is nullified (coinciding with a change of flow direction) at multiple frequencies. It has to be reminded that at low pinching frequencies, the flow direction (in case that the stenosis is absent) is from the pincher to the closer tube junction as it has been evidenced by many researchers ([8,9]) and our group [2,10]. Since the stenosis was installed in this work at the longer part of the flexible tube, an opposite flow was established between the two cases (stenosis versus non-stenosis) for f > 9.85 Hz.
The behaviour of a valveless pump is quite complex due two main reasons: a) the interaction of the fluid with the deformable tube walls, and b) the presence of the flexible-rigid tube junctions. During the tube compression phase by the pincher, the pressure increases due to the tube dilation in the rest part of the flexible tube, being a function of the tube material properties (Young’s modulus, Poisson’s ratio) and the tube geometrical features (tube inner radius and wall thickness) (see [6]). Thus, pressure waves are generated at the pincher area which travel along the flexible tube with a finite speed, reflected at the tube junctions. Consequently, the axial pressure distribution is accordingly affected which in turn affects the tube shape and the flow rate. In the present work, a deformable stenosis is introduced in a small distance from the pincher, the shape of which varies in time due to the time dependent pressure and the opposing force of a spring. In Figure 4, three quantities are shown for each compression ratio versus the nondimensional time t/T (T is the pinching period) for two pinching frequencies, namely for 5.96 Hz and for the frequency of the maximum flow rate of each case, namely: a) the pincher displacement in (cm), b) the opening of the stenosis neck in (mm), and c) the flow rate in (L/min). The common feature of the shown curves in Figure 4 is that during the compression phase (that the displacement of the pincher is shown to be reduced in the graphs), the stenosis opening increases as well as the flow rate, as being recorded in one of the stiff tubes of the loop. In contrast, during decompression, the stenosis neck width is reduced (due to the reduced pressures), restricting the backflow towards the pincher, thus enhancing the unidirectional flow from the pincher to the stenosis. The flow rate was maximized a little before the end of the compression phase, with an amplitude which did not exceed 20% of the net flow rate. Similar behaviour was observed for Ab = 65% for the non-stenosis case (Figure 4g,h).
It is noteworthy that the stenosis neck maximum width was of the order of 2 mm or 16% of the tube diameter, whereas its minimum was zero (or slightly negative in some cases), corresponding to a deep occluded case. The stenosis opening was dependent on the spring tension and the opposing pressure force, the first being adjusted by a trial and error procedure, aiming at flow rate maximization. It is important to note that as it was shown in [6], small spring pretension which allows large openings of the stenosis, or high spring pretention which hinders the oscillatory motion of the stenosis, do not augment the flow rate. Namely, the flow rate is affected by the stenosis only if its opening is time dependent and it varies within a certain small interval compared to the tube diameter.
As it was mentioned above, the pressure wave reflections at the flexible-rigid tube junctions play a major role in valveless pumping. The consequence of the latter is the variation of the pressure amplitude along the tube, which was documented here by inserting a pressure catheter at the tube junction and moving it inside the flexible tube to various cross-sections. A representative variation of the peak to peak pressure amplitude (in 104 Pa) along the flexible tube is shown in Figure 5 for Ab = 38% and a pinching frequency 8.16 Hz, with the distance measured from the stenosis neck. The curve with the higher values corresponds to the non-stenosis case.
According to [11] (eq. 8.7.27), the pressure amplitude along a flexible tube connected with a tube of different compliance, non-dimenionalized by the pressure amplitude at the entrance of the tube (where a harmonic pressure variation is generated) is given by the formula:
where is the reflection coefficient, is the wave length of the generated pressure waves and the distance from the tube entrance, both divided by the length of the tube. The reflection coefficient at the junction of two tubes 1, 2 of equal diameter and wave speeds and is ([11], equations 9.5.11 and 9.5.17):
when the flow direction is from tube 1 to tube 2. The wave speed (see [6]) is:
where ρ is the fluid density, t is the tube thickness, D the internal tube diameter, σ the tube material’s Poisson’s ratio and E its Young’s modulus. Since the Young’s modulus of the stiff tube was many orders of magnitude larger compared with that of the flexible tube, namely 1400 MPa compared to 2.38 MPa of the flexible tube (see [2,6]), the ratio of the wave speeds was:
and ~ 0.923.
According to (1), the pressure amplitude is an increasing function of x, if Otherwise, it exhibits a minimum, which is not related to the case presented in Figure 5. Based on (1), the distribution of along the tube is shown in Figure 6 for three values of , namely 3, 4 and 5.
Assuming that the flexible tube starts at the end of the pincher, which plays the role of a pressure wave generator, the closest pressure measurement was 155 mm from it, or = 0.24, based on the tube length from the pincher to the tube junction which was 650 mm. According to Figure 5, the ratio of the pressure amplitudes at the tube end ( = 1) to that at = 0.24, is 2.09 for the non-stenosis case. Therefore, using = 0.24 in equation (1) and knowing that the pressure amplitude at = 1 is +1 (see [11], equation 8. 7.30), the value of that satisfies the above pressure ratio of 2.09, is 4.45. Therefore, the wavelength, λ, of the pressure waves was 4.45 x 650 = 2890 mm for a pinching frequency f = 8.16 Hz. As a result, the wave speed was = λf = 2.89 x 8.16 = 23.58 m/s. It is interesting to note that in [6], the wave speed was estimated to be 15.6 m/s, or 33.8 % smaller, based on two assumptions: the fluid was stationary and the gauge pressure was zero. However, when the flow is pulsating, pressure takes on the mean higher values than zero, the tube becomes stiffer, causing an increase of the tube’s Young’s modulus and consequently an increase of the wave speed. Pressure measurements for a lower pinching frequency of 5.44 Hz and Ab = 38% showed similar trends, albeit smaller variations along the tube, attributed to the larger wavelength /f = 23.58/5.44 = 4.33 m.
The presence of the stenosis reduced the pressure amplitude for Ab = 38%, according to Figure 5, while its variation along the tube was similar with that without the stenosis. In Figure 7, representative pressure waveforms are shown at three cross-sections along the tube for f = 8.16 Hz and Ab = 38%, with and without the stenosis: at 2.08 D, 20.41 D and 43.3 D far from the stenosis neck, respectively. The last station coincides with the flexible-rigid tube junction. During the compression phase, the pressure increased sharply, with an increasing phase lag along the tube, which maximized at the tube junction where this was about T/4. A consequence of the phase lag is that the axial pressure gradient changed sign in each period, being negative during compression and before pressure peak, turned to positive around pressure peak and became again negative during decompression.
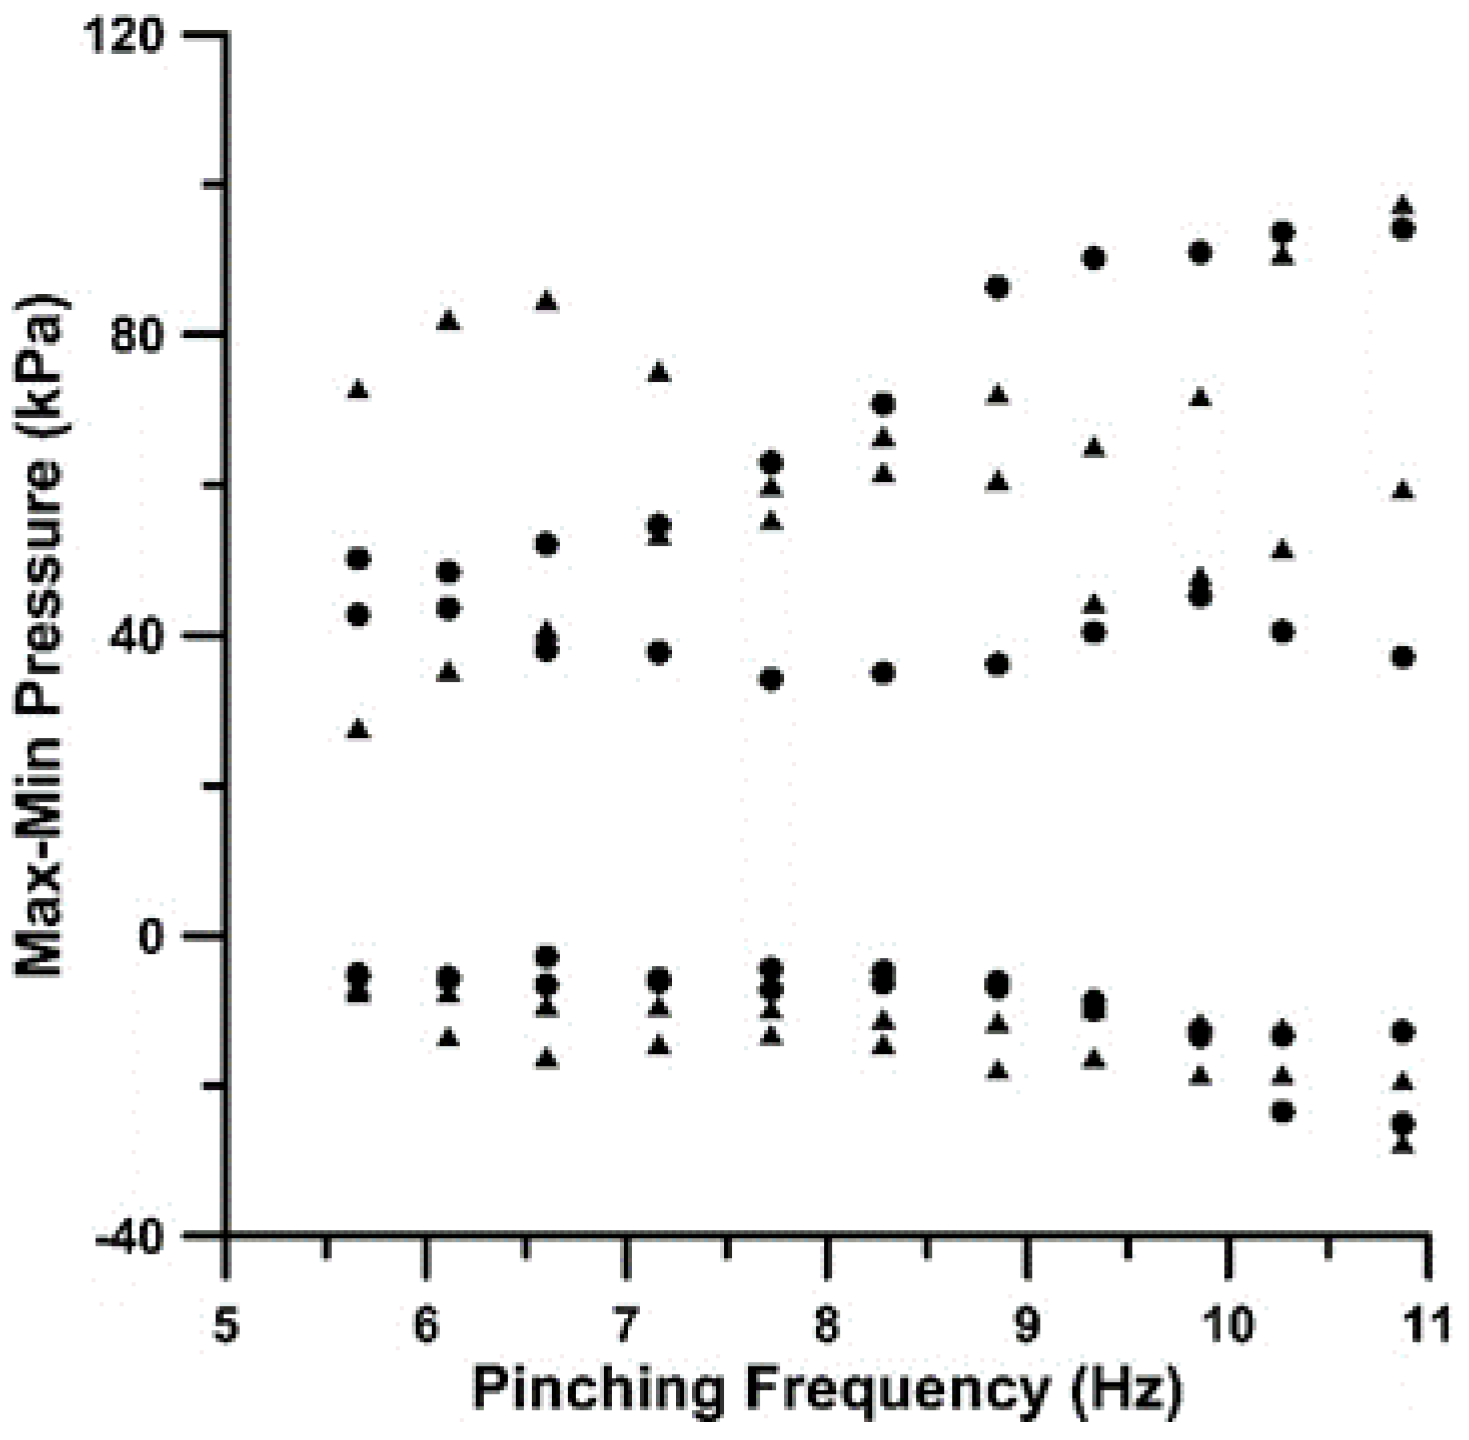
Phase difference was also detected, as expected, between the pressure waveforms at the two flexible-rigid tube junctions, the farthest presenting a phase lag between 0.2T to 0.25T or 72° to 90°, as it is documented in Figure 8. The latter phase angles can be explained based on a) the lengths of the flexible tube between the pincher and the tube junctions, namely 650 mm and 170 mm, respectively, and b) the wave speed of 23.58 m/s. If the wave speed is assumed to be independent of the pinching frequency, the time difference between the two waves traveling from the pincher to the tube junctions for the lowest pinching frequency f = 5.66 Hz, is 0.152T = 54° and for the maximum frequency f =10.8 Hz, 0.22T = 79.2°. The extreme values of pressure are presented in Figure 9 and Figure 10, taking positive values up to 100 kPa and negative to -30 kPa. In general, the pressure amplitudes increase with the pinching frequency (mainly due to the increased fluid inertia) and the compression ratio as the result of the higher flow rates.
4. Discussion
The objective of the present work was to examine the influence of the unsteady stenosis in valveless pumping, taking into account gravity, which was practically absent in the horizontal loop of our previous work. Initially, the experiments were conducted using two tanks, with the same free surface height, which changed as time progressed due to pumping, whereas at the same time the flow rate was reduced. Eventually, the flow rate became null and a height difference was established between the two tanks which was dependent on the pinching frequency and the presence or not of the stenosis. Seeking the maximum possible flow rates of the valveless pump, it was decided to replace the two tanks with one, the height of which was always constant at 800 mm. Since the area of the free surface of the tank was 500 cm2 and the maximum volume of the fluid displaced by the pincher was only 11.3 cm3, the free surface height was practically constant as well as the static pressure at the joints of the two rigid tubes of the loop with the tank being equal to 150 mm = 1.47 kPa. The average static pressures at the flexible-rigid tube junctions were about 10 kPa which dropped to the latter value of 1.47 kPa mainly due to gravity (800 mm = 7.84 kPa). Regarding the hydraulic losses, at the entrance of the tank, these were equal to the fluid kinetic energy, which for a maximum examined flow rate of 1.5 L/min were 24 Pa, and the linear losses are estimated to be 63 Pa, based on the time mean bulked fluid speed and the Darcy’s formula, assuming laminar flow (Re = 2640). It has to be noted that according to [12], Darcy’s formula is valid in pulsating tube flows, either the flow is laminar or turbulent.
It is interesting to note that the pressure amplitudes along the flexible tube, when the stenosis was present, were significantly reduced compared to the non-stenosis case. For Ab = 38% and a pinching frequency f = 8.16 Hz, the amplitude ratios (stenosis to non stenosis cases) were varying from 57% to 68% along the tube, despite the six times larger net flow rates of the stenosis case. The same trend was observed for the same Ab and a smaller frequency f = 5.48 Hz, although the ratios were larger, varying from 65% to 75%. The latter indicates that at low pinching frequencies, the stenosis’ influence on the pressure amplitude attenuation is smaller. Conclusively, the unsteady stenosis caused not only an increase of the net flow rate but also a reduction of the pressure pulsations. It has to be noted that the vibrations of the flexible tube walls were notably reduced when the stenosis was present. The reduction of the pressure pulsations due to a stenosis in a flexible tube has been also observed in [13], attributed to the stenosis hydraulic losses. Conclusively, pressure amplitudes are irrelevant to net flow rates since these are related predominantly to the fluid acceleration-deceleration and the compliance of the flexible tube.
The pressure time-variation at the tube junctions is characterized more or less as sinusoidal, combined with oscillations of decaying amplitude. Namely, during tube compression, the pressure increased and during decompression it decreased, followed by damped oscillations, as it happens in a free vibrating system after its initial excitation (Figure 8). The same behavior was recorded in [2] (Figure 7) and in [14] (Figure 3), in which at small pinching frequencies, compared to the natural frequency of the hydraulic loop, there were multiple pressure oscillations within each pinching period of small amplitude superimposed to the basic variation imposed by the pincher.
Regarding the volumetric efficiency of the pump, when the stenosis was present, it varied from 38% to 32% for Ab =24% to 65%, whereas without the stenosis, it changed from 2% to 20%, exhibiting the stenosis’ significant role in flow augmentation. On the other hand, in the horizontal loop of [6], the volumetric efficiency was much higher, namely when the stenosis was present it dropped from 77% to 50% for Ab =38% to 65% and without the stenosis it increased from 11% to 37%.
A final note is regarding the reduced influence of the stenosis with increasing compression ratio. A probable explanation might be the increased hydraulic losses at the pincher due to the high compression ratio so that when these are combined with the losses of the stenosis, the total available input energy cannot be transformed to increased flow rates.
5. Conclusions
The beneficial role of an unsteady stenosis in increasing the net flow rate in valveless pumping was experimentally examined. The pump was connected to a loop, including an open water tank at a height of 800 mm above the pump’s pincher, in contrast to a horizontal loop which was examined by the same group in a previous study. The presence of the stenosis increased the flow rates up to 19 times for a compression ratio Ab =24%, 6.5 times for Ab =38% and 48%, whereas for Ab = 65% its influence was minimal. The increase of the net flow rate is attributed to the opening and closing of the stenosis in a way that the fluid mass within each pinching period is directed more from the pincher to the stenosis than backwards. Namely, the stenosis opened during the compression phase of the pincher due to the elevated pressures which varied from 20 kPa to 100 kPa and closed during decompression that the gauge pressures took negative values down to -30 kPa, thus restricting the backward flow. The pressure increase at the stenosis area during compression is attributed to the flexible tube dilation due to the fluid mass expelled by the pincher, the inertial forces related to fluid acceleration, the gravitational force of the vertical fluid column and the reflected pressure waves at the tube junctions. An evidence of the pressure reflections is the recorded increase of the pressure amplitude along the tube from the stenosis to the tube junction which were strongly attenuated by the stenosis presence especially at higher pinching frequencies.
Author Contributions
Conceptualization, D.M.; methodology, D.M and C. M.; software, D.M.; validation, C.M. and D.M.; formal analysis, D.M. and C.M.; investigation, C.M and D.M.; data curation, D.M. and C.M.; writing—original draft preparation, D.M. and C.M.; writing—review and editing, D.M. and C.M.; visualization, D.M. and C.M.; All authors have read and agreed to the published version of the manuscript.
Funding
This research received no external funding.
Conflicts of Interest
The authors declare no conflicts of interest.
References
- Hickerson, A.I.; Gharib, M. On the resonance of a pliant tube as a mechanism for valveless pumping. J. Fluid Mech. 2006, 555, 141–148. [Google Scholar] [CrossRef]
- Manopoulos, C.; Tsangaris, S.; Mathioulakis, D. Net flow generation in closed-loop valveless pumping. Proc. Inst. Mech. Eng. Part C J. Mech. Eng. Sci. 2020, 234, 2126–2142. [Google Scholar] [CrossRef]
- Yan, Q.; Yin, Y.; Sun, W.; Fu, J. Advances in Valveless Piezoelectric Pumps. Appl. Sci. 2021, 11, 7061. [Google Scholar] [CrossRef]
- Amselem, G.; Clanet, C.; Benzaquen, M. Valveless pumping at low Reynolds numbers. Physical Review Applied. 2023, 19, 024017. [Google Scholar] [CrossRef]
- Anatol, J. ; García-Díaz,M. ; Barrios-Collado, C.; Moneo-Fernández, J.; Castro-Ruiz, F.; Sierra-Pallares, J. Experimental characterization of an asymmetric valveless pump based on soft robotics technology. Physics of Fluids, 2023, 35, 061904. [Google Scholar]
- Manopoulos, C.; Mathioulakis, D. Flow Rate Augmentation of Valveless Pumping via a Time-Dependent Stenosis: A Novel Device. Fluids 2023, 8, 249. [Google Scholar] [CrossRef]
- Timmermann, S.; Ottesen, J.T. Novel characteristics of valveless pumping. Physics of Fluids, 2009, 21, 053601. [Google Scholar] [CrossRef]
- Bredow, H. Untersuchung eines ventillosen Pumpprinzips. For B VDI Z 1968, 7, 1–89. Available online: https://www.tib.eu/en/search/id/TIBKAT%3A196829372 (accessed on 4 February 2024).
- Mahrenholtz, O.; Bredow, H.J. Modelle ventilloser Pumpen, in Phänomen der pulsierenden Strömung im Blutkreislauf aus technologischer, physiologischer und klinischer Sicht. Pestel E and Liebau G (eds), Bibliographisches Institut, Mannheim, Wien, Zürich, 1970, 738/738a*79-87.
- Manopoulos, C.; Mathioulakis, D.; Tsangaris, S. One-dimensional model of valveless pumping in a closed loop and a numerical solution. Physics of Fluids, 2006, 18, 017106. [Google Scholar] [CrossRef]
- Zamir, M. The Physics of Coronary Blood Flow; Springer: London, ON, Canada, 2005. [Google Scholar]
- Shemer, L.; Wygnanski, I.; Kit, E. Pulsating flow in a pipe. Fluid Mechanics, 1985, 153, 313–337. [Google Scholar] [CrossRef]
- Kumar, K.; Prabhakaran, D. Dynamics of a collapsible tube with internal constriction. Physics of Fluids, 2022, 34, 121905. [Google Scholar] [CrossRef]
- Bringley, T.; Childress, S.; Vandenberghe, N.; et al. An experimental investigation and a simple model of a valveless pump. Phys Fluids 2008, 20, 033602.
Figure 1.
Hydraulic loop. (a) two- tanks and (b) one-tank configuration.
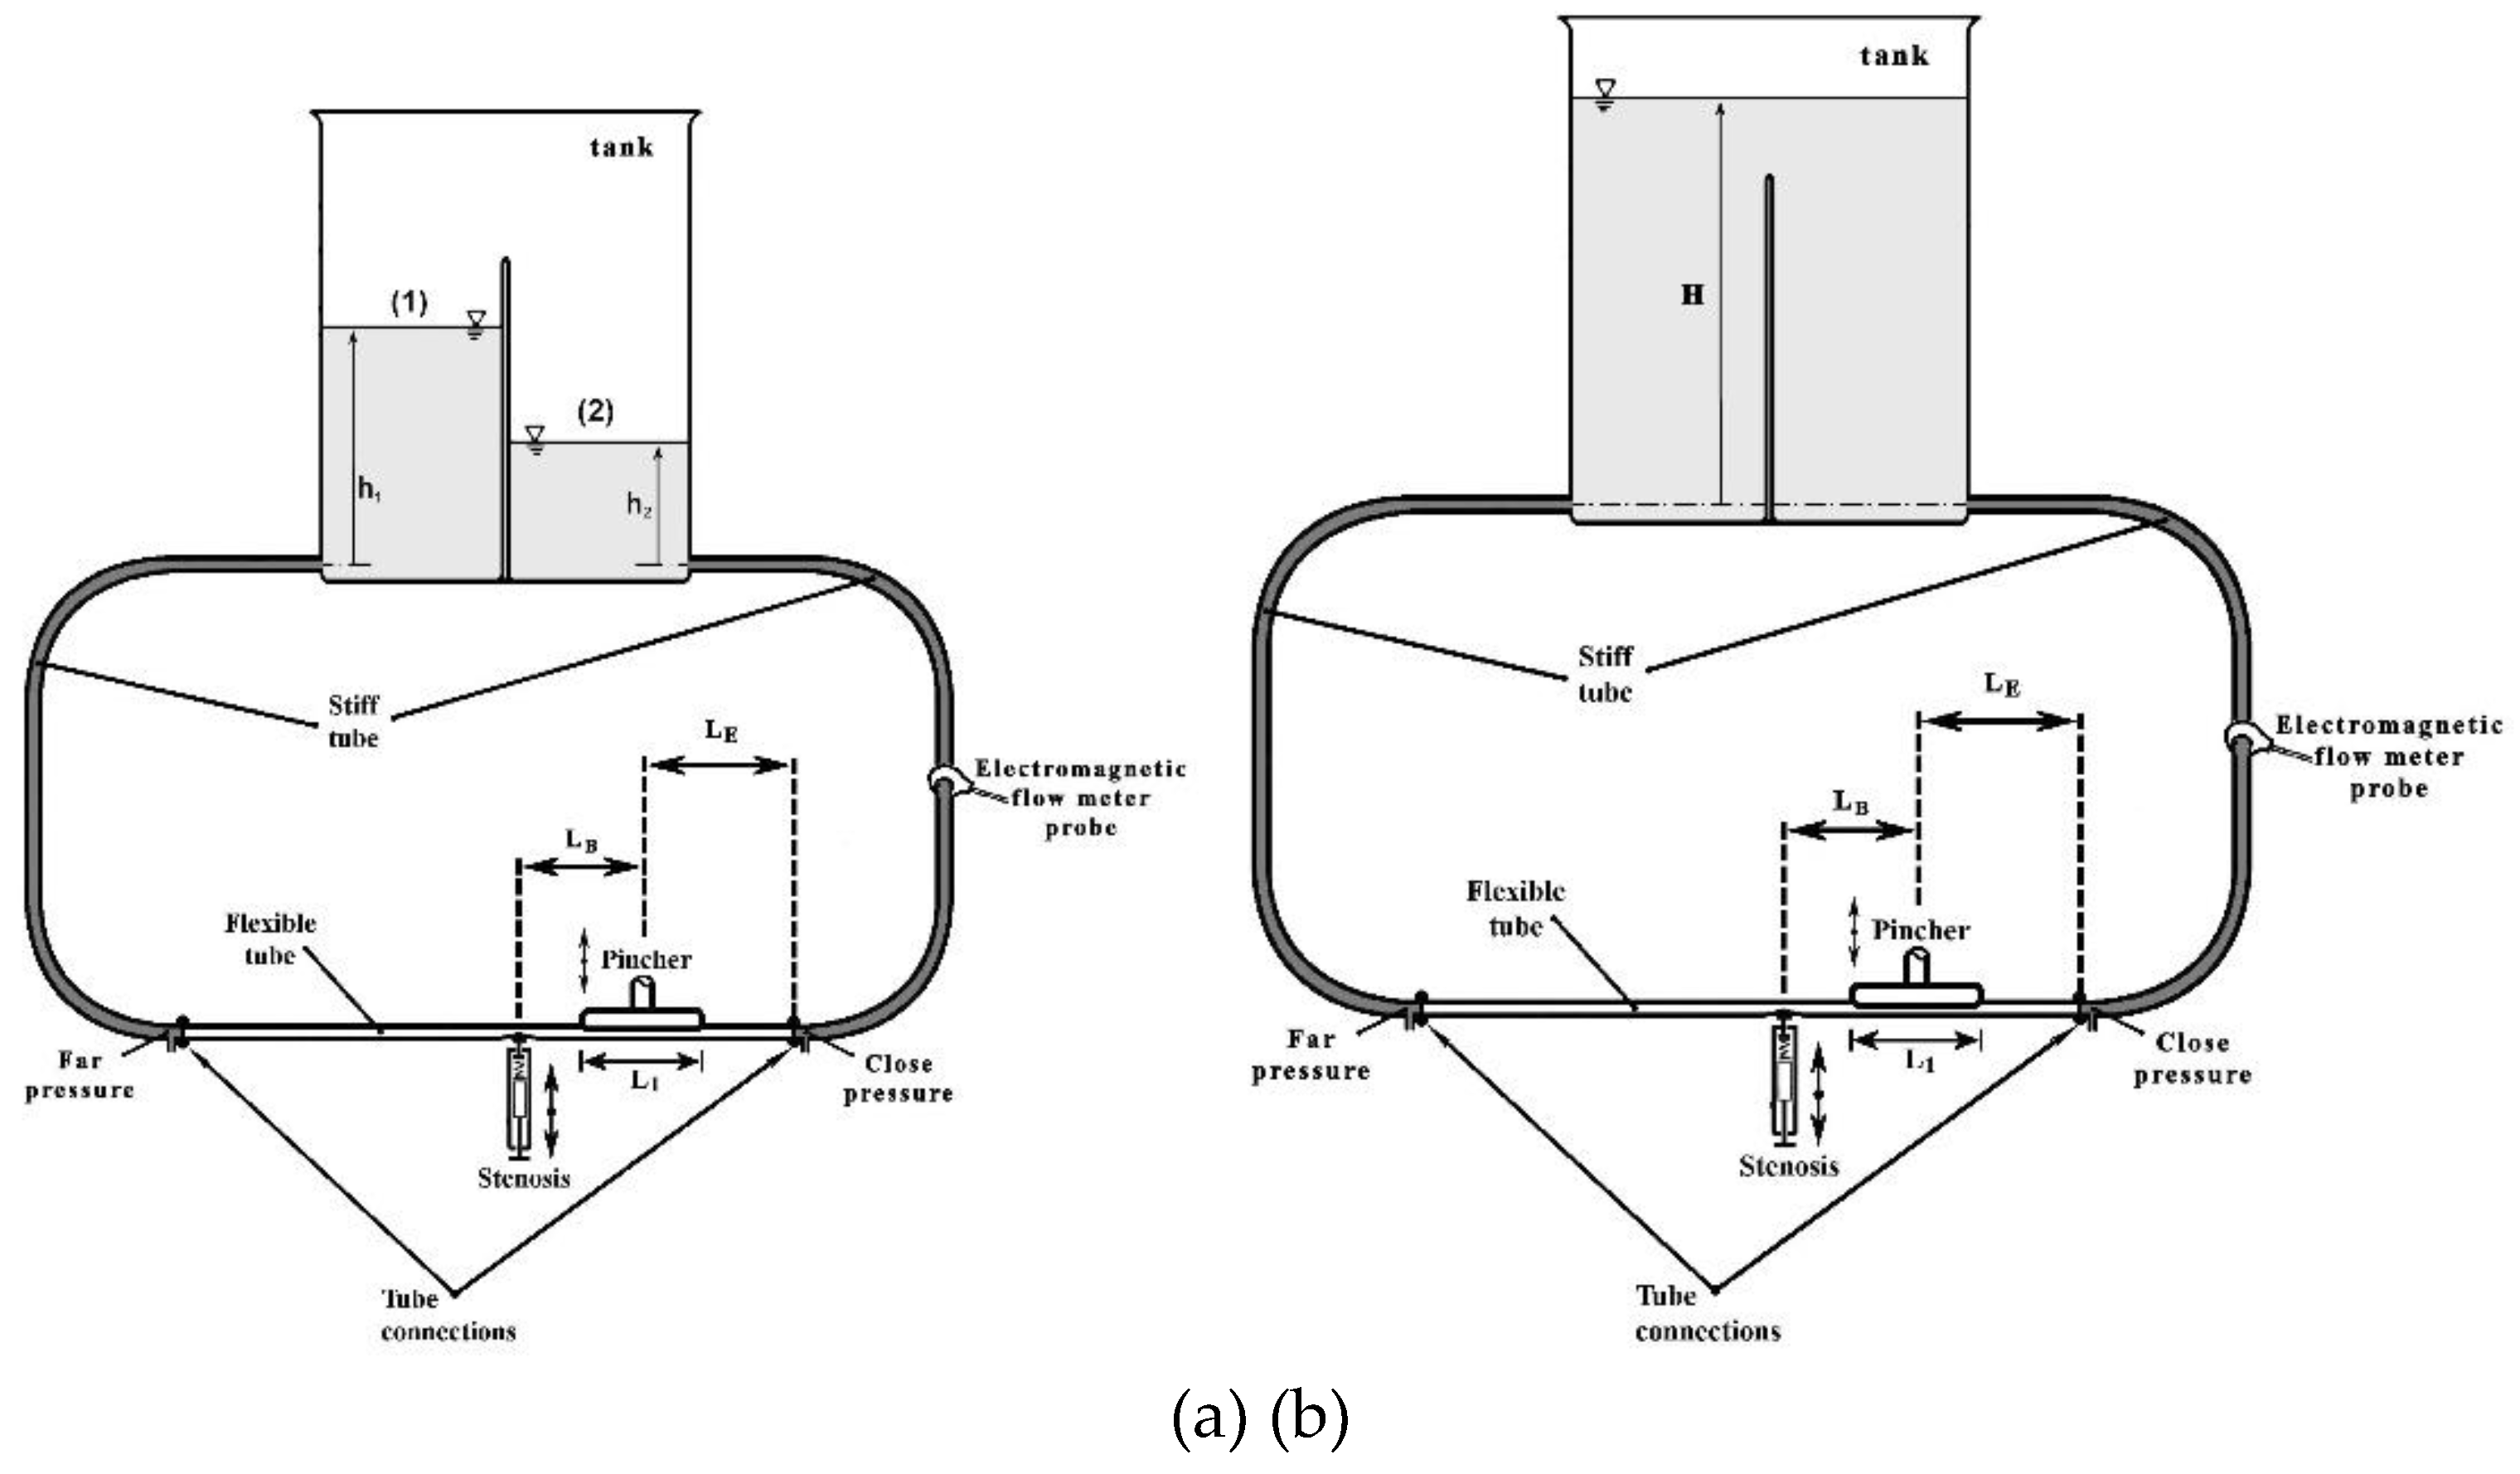
Figure 2.
Net flow rate versus pinching frequency with the stenosis present for three compression ratios Ab: 24% (crosses), 38% (squares) and 49% (triangles).
Figure 2.
Net flow rate versus pinching frequency with the stenosis present for three compression ratios Ab: 24% (crosses), 38% (squares) and 49% (triangles).
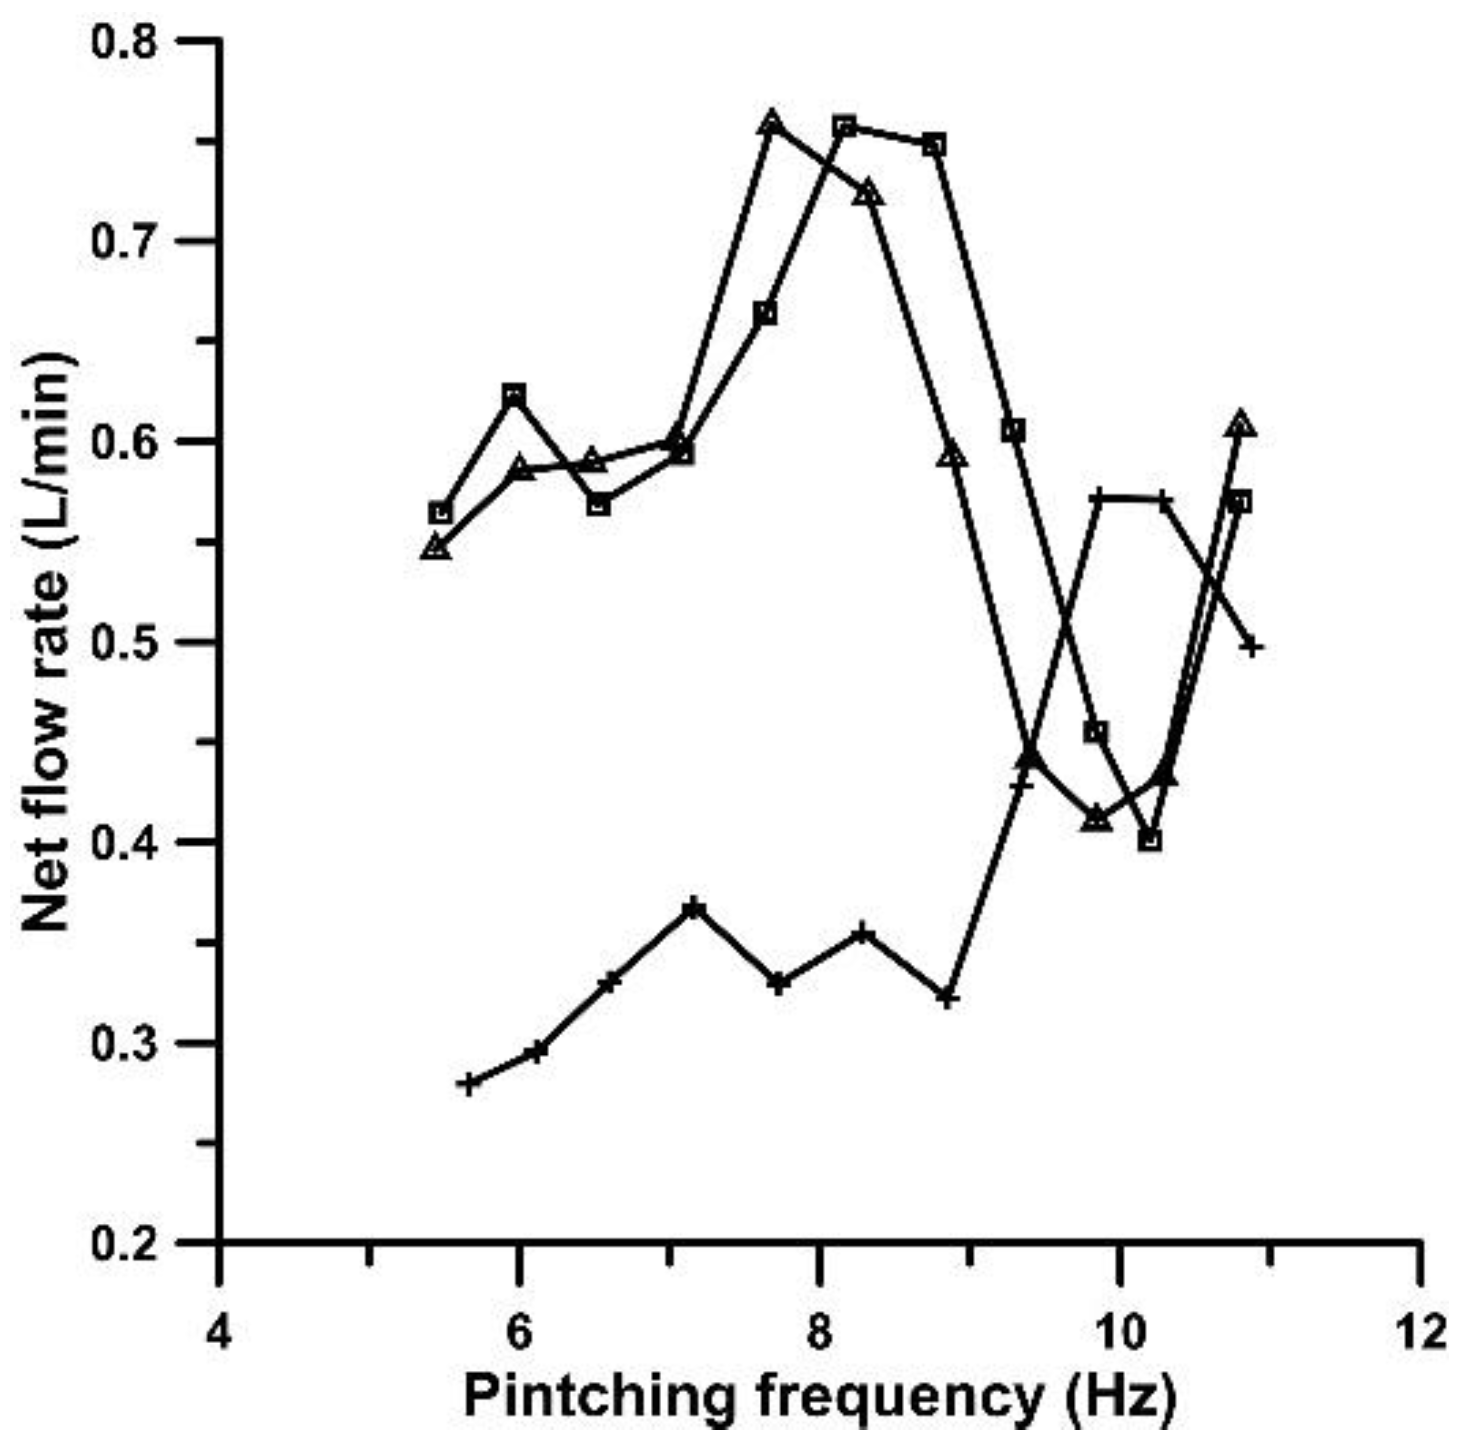
Figure 3.
Net flow rate versus pinching frequency for Ab = 65%: with stenosis (squares), without stenosis (circles).
Figure 3.
Net flow rate versus pinching frequency for Ab = 65%: with stenosis (squares), without stenosis (circles).
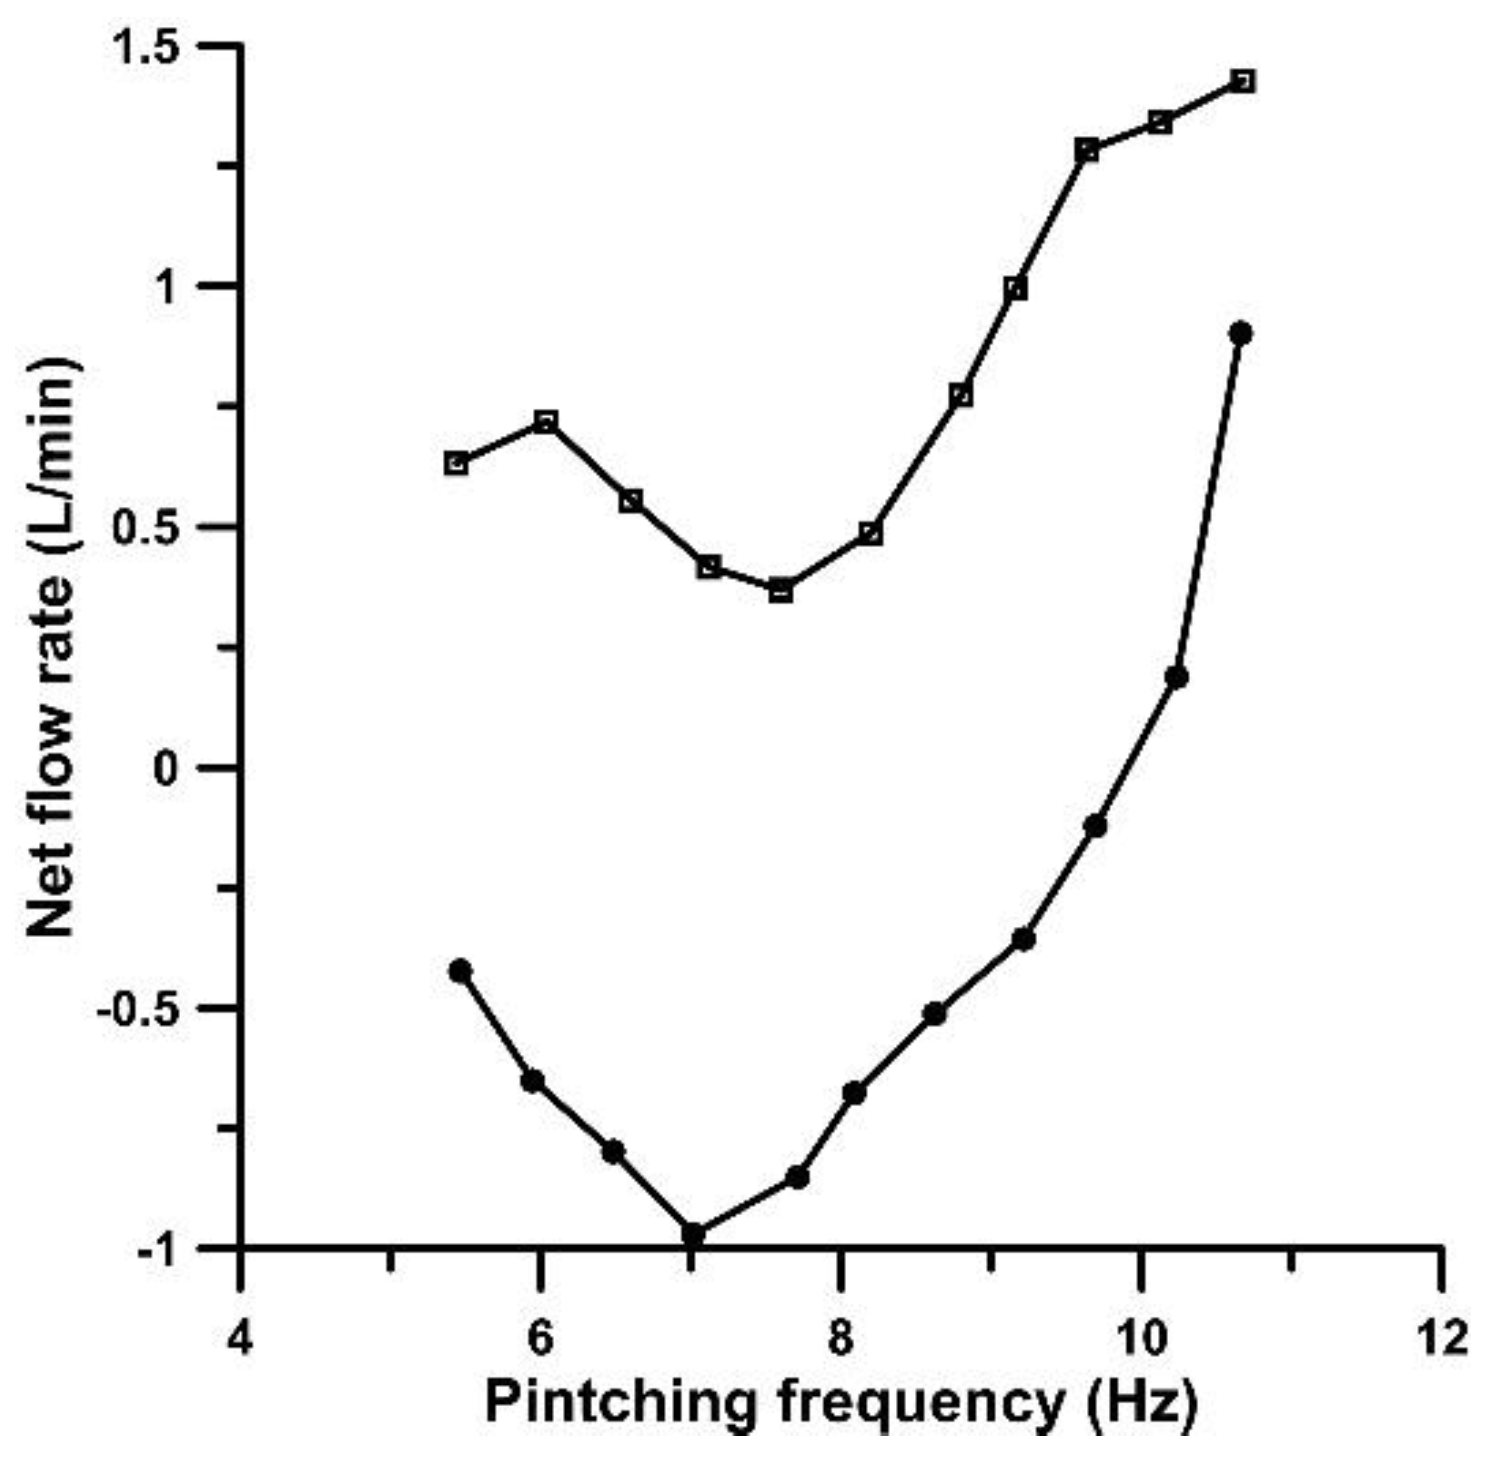
Figure 4.
Pincher displacement (in cm, crosses), stenosis width (in mm, circles) and flow rate (in L/min, squares) versus time. (a) to (f) stenosis is present: (a) Ab = 24%, f = 5.96 Hz, (b) Ab = 24%, f = 9.86 Hz, (c) Ab = 38%, f = 5.96 Hz, (d) Ab = 38%, f = 8.16 Hz, (e) Ab = 65%, f = 5.96 Hz, (f) Ab = 65%, f = 10.68 Hz. (g) to (h) no stenosis: (g) Ab = 65%, f = 5.96 Hz, (h) Ab = 65%, f = 10.66 Hz.
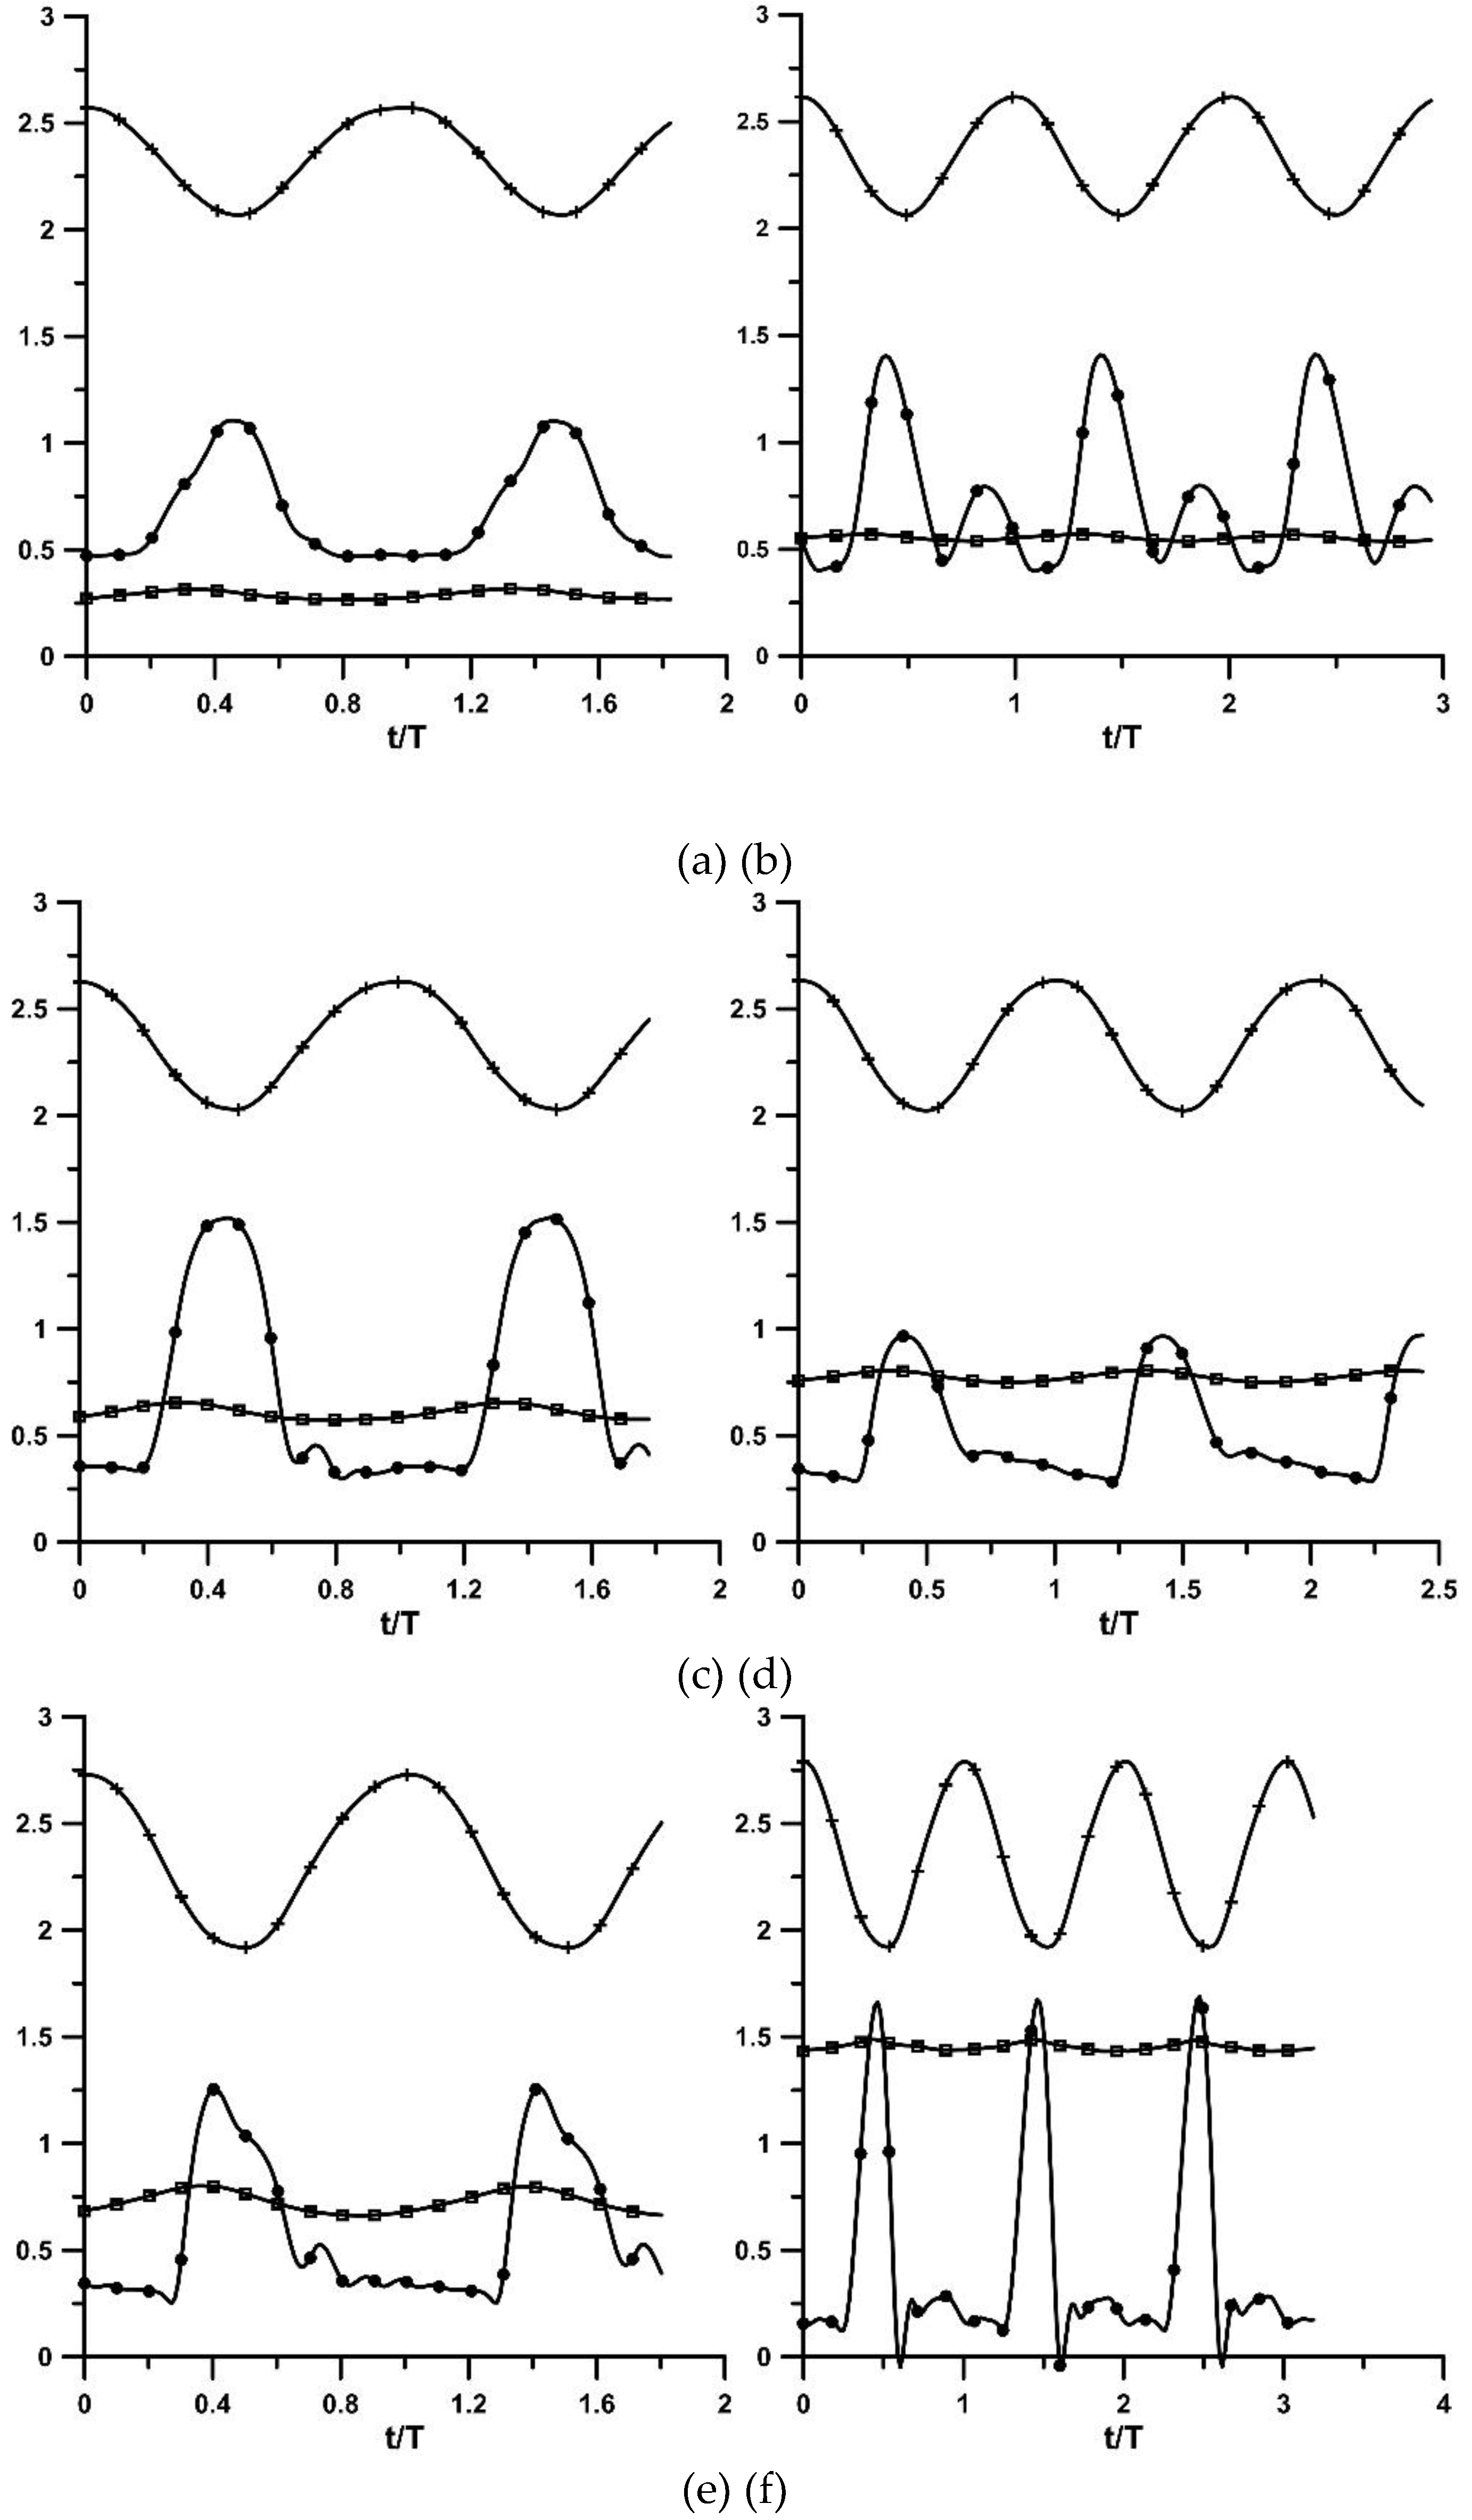
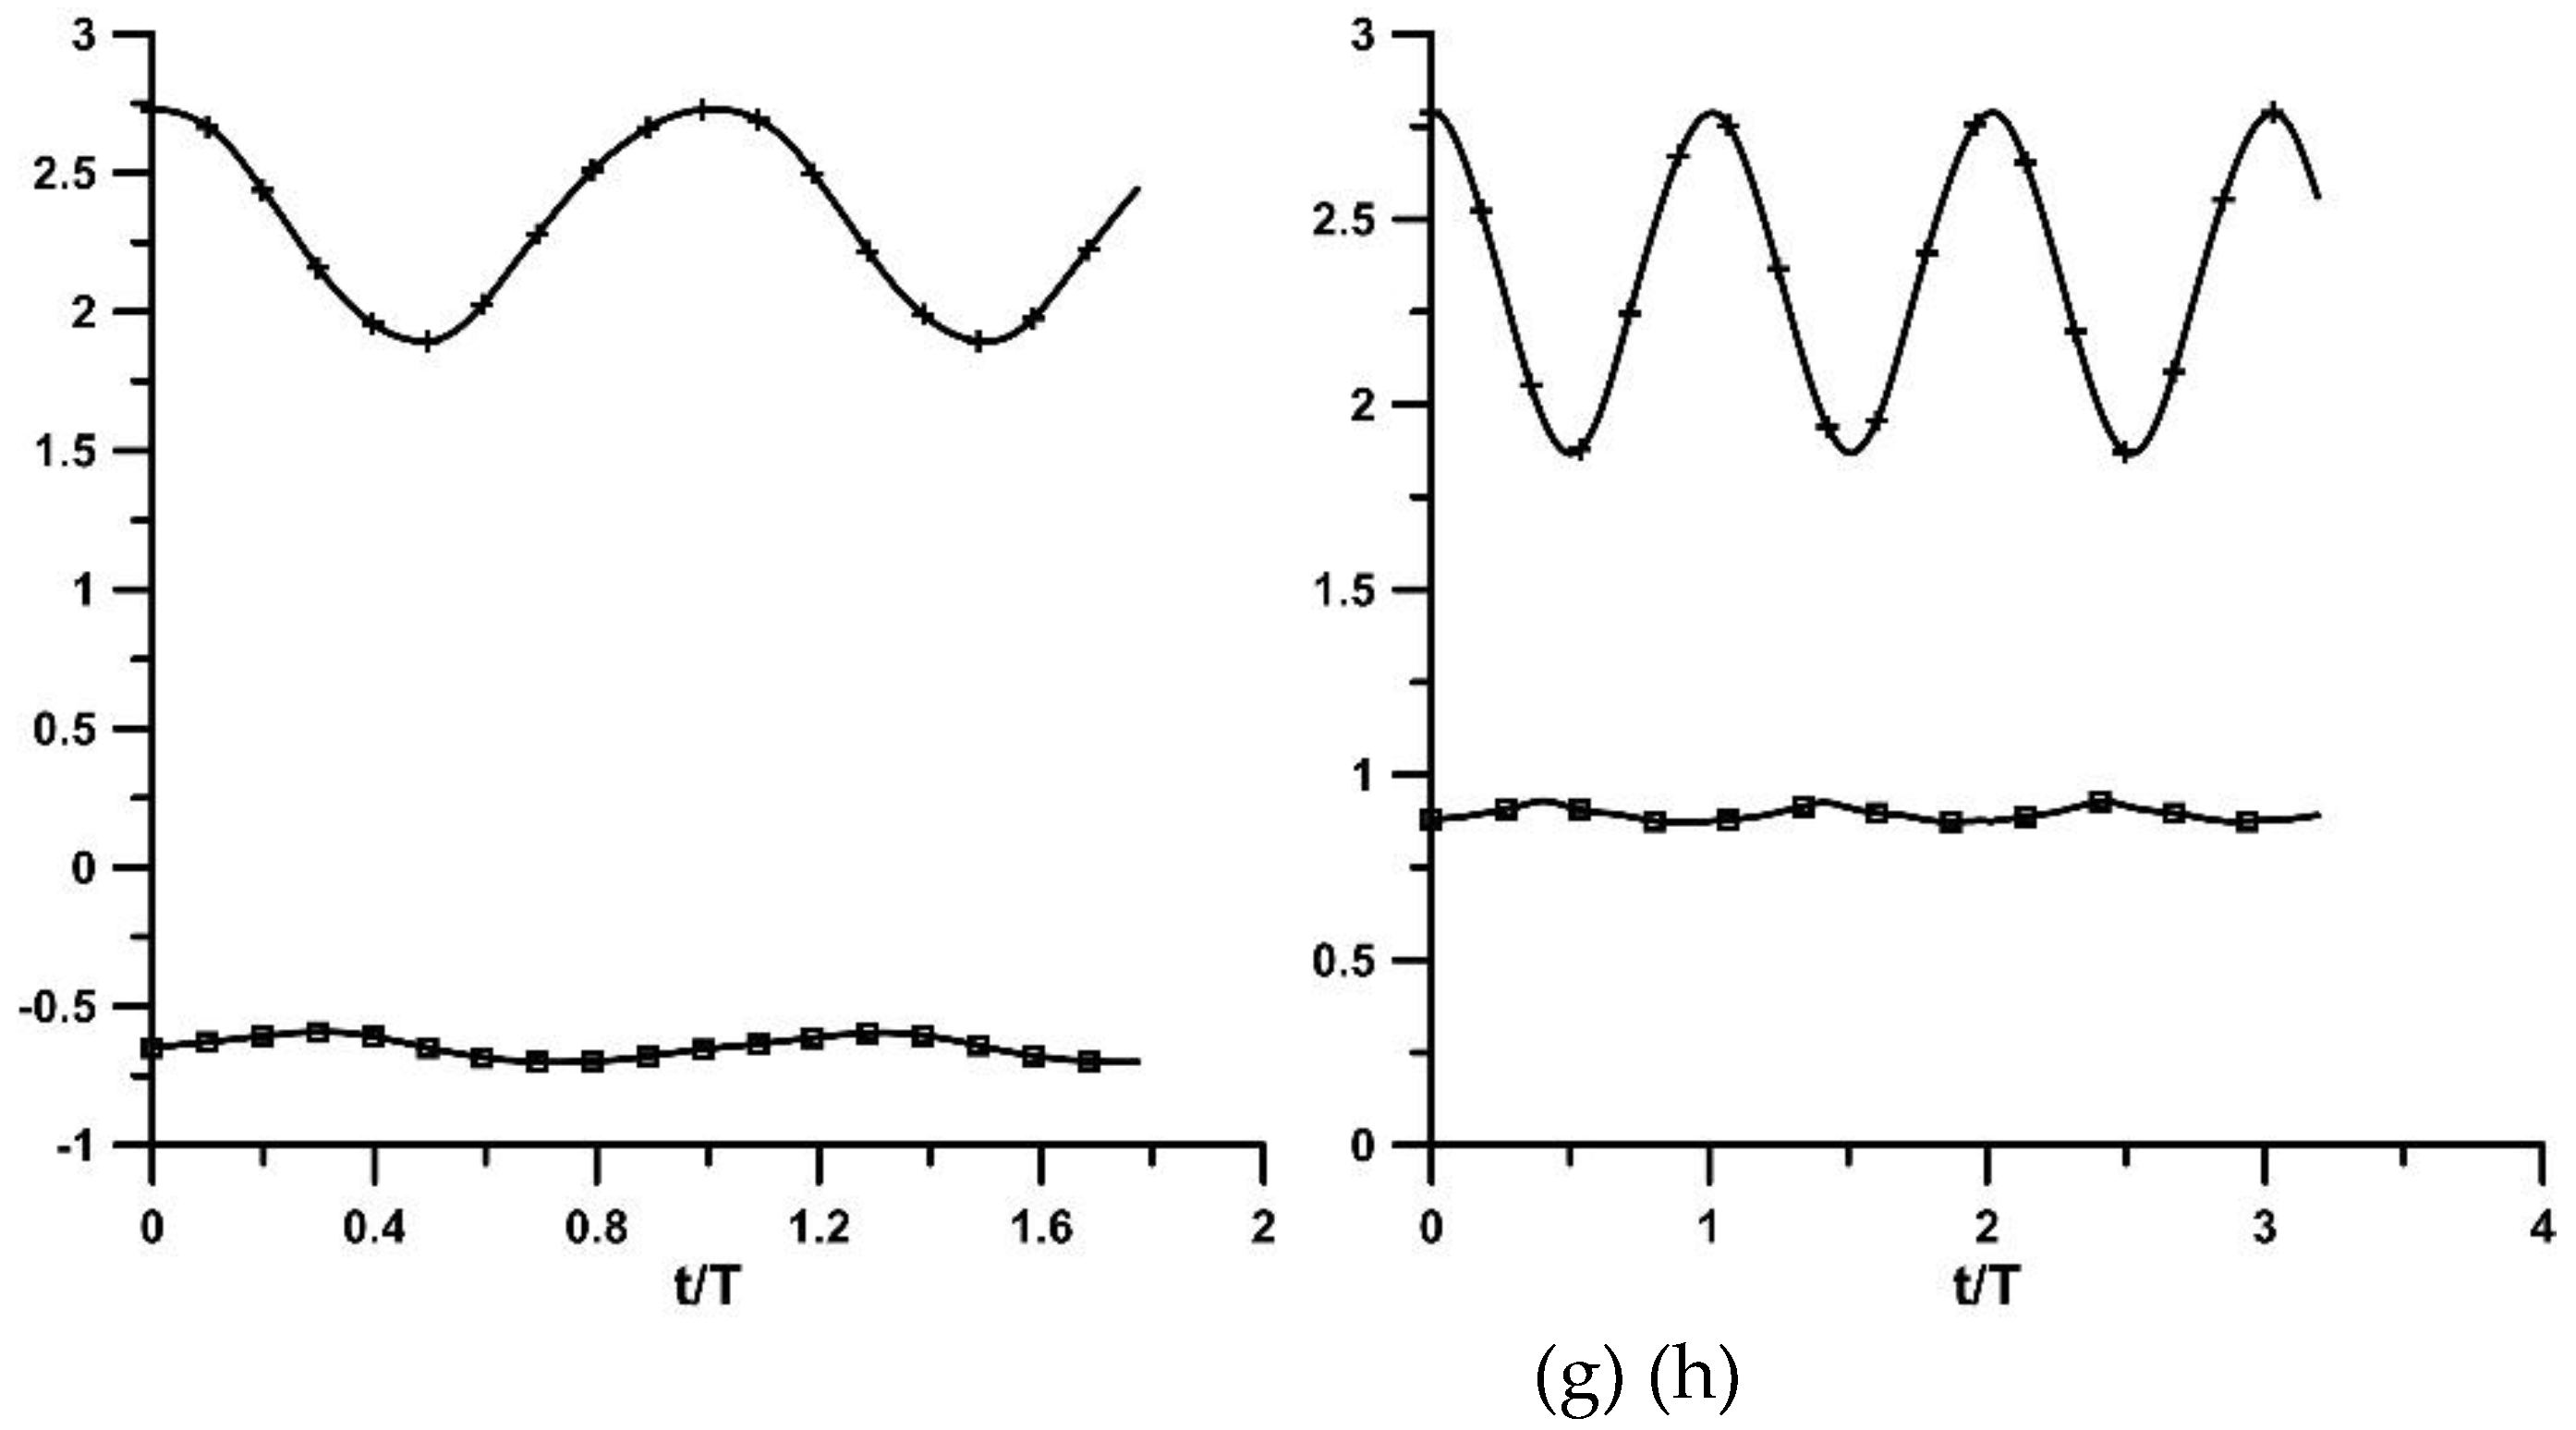
Figure 5.
Peak to peak pressure amplitude along the flexible tube (in 104 Pa) with the stenosis (circles) and without the stenosis (squares). Ab = 38%, f = 8.16 Hz.
Figure 5.
Peak to peak pressure amplitude along the flexible tube (in 104 Pa) with the stenosis (circles) and without the stenosis (squares). Ab = 38%, f = 8.16 Hz.
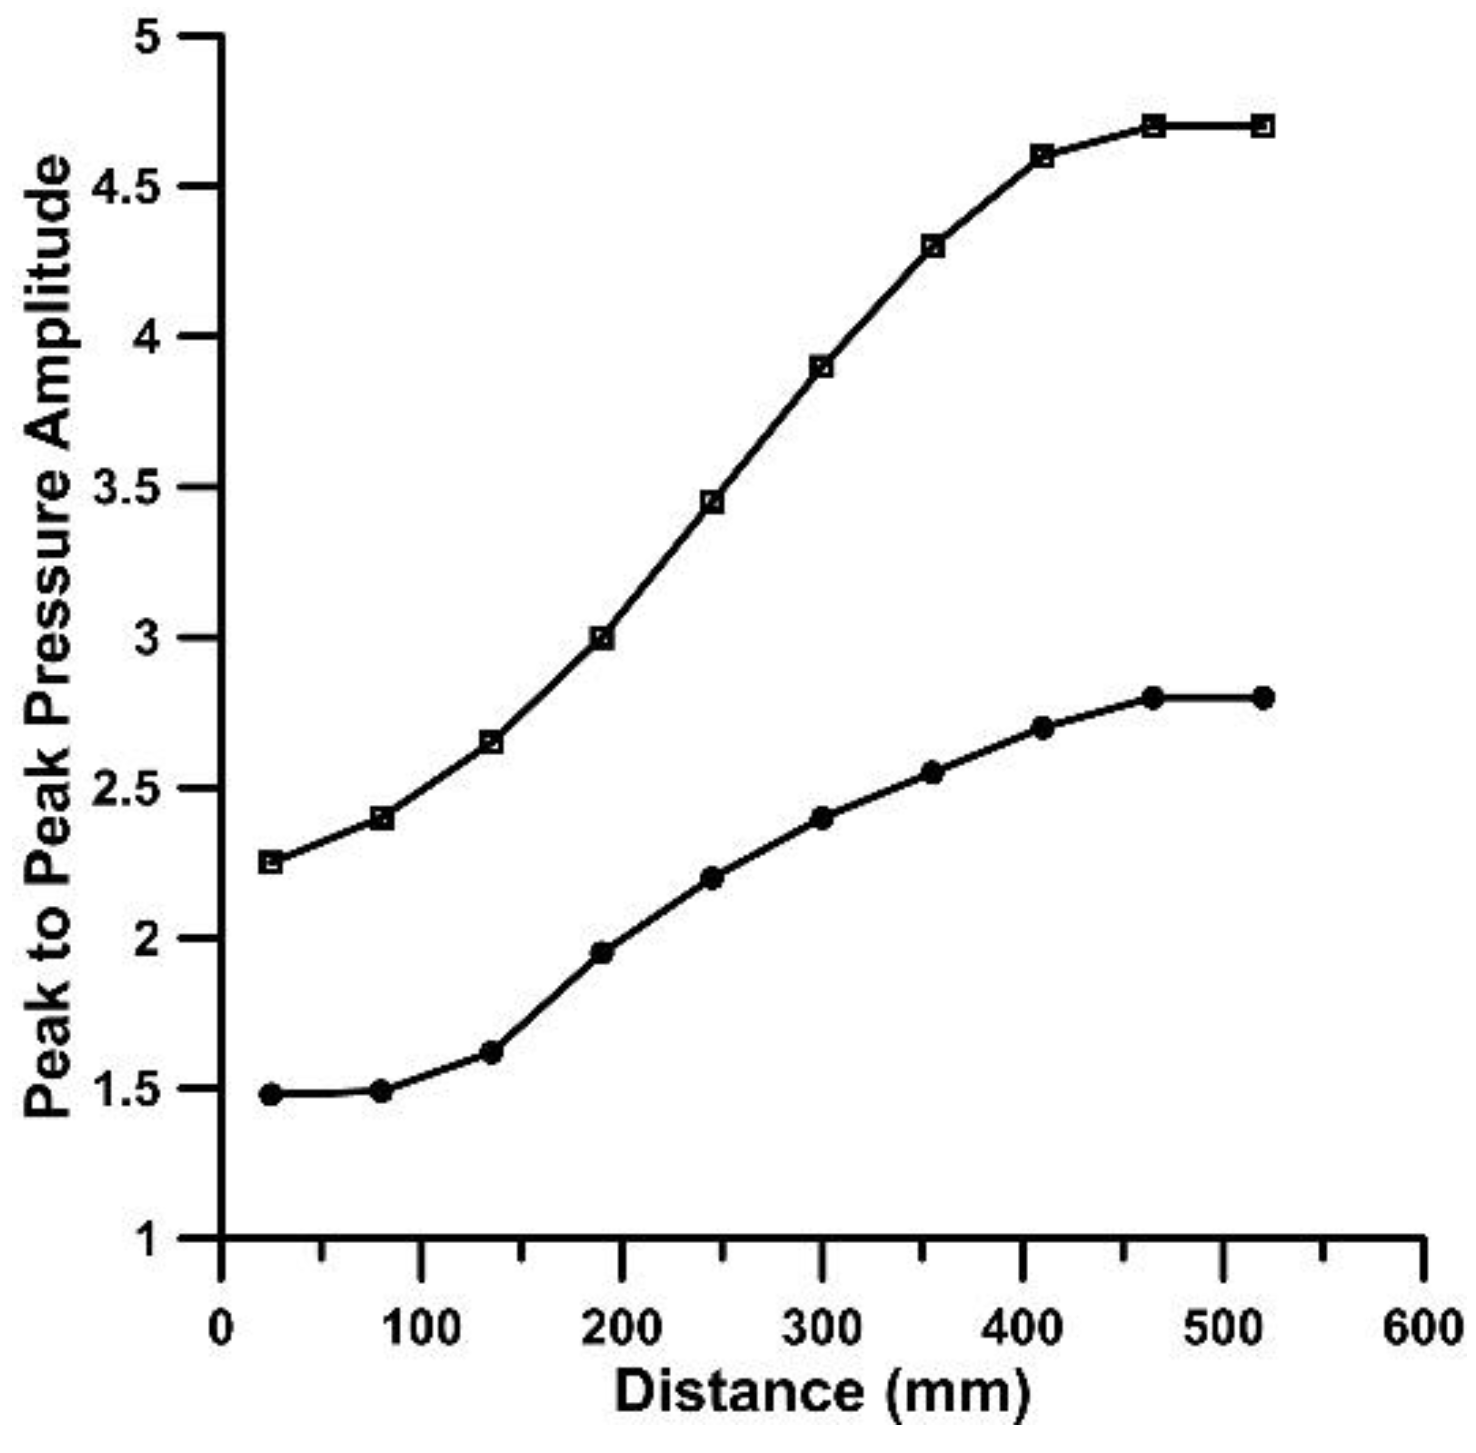
Figure 6.
Pressure amplitude distribution according to equation (1) for = 3 (circles), = 4 (squares), = 5 (triangles) and = 0.923.
Figure 6.
Pressure amplitude distribution according to equation (1) for = 3 (circles), = 4 (squares), = 5 (triangles) and = 0.923.
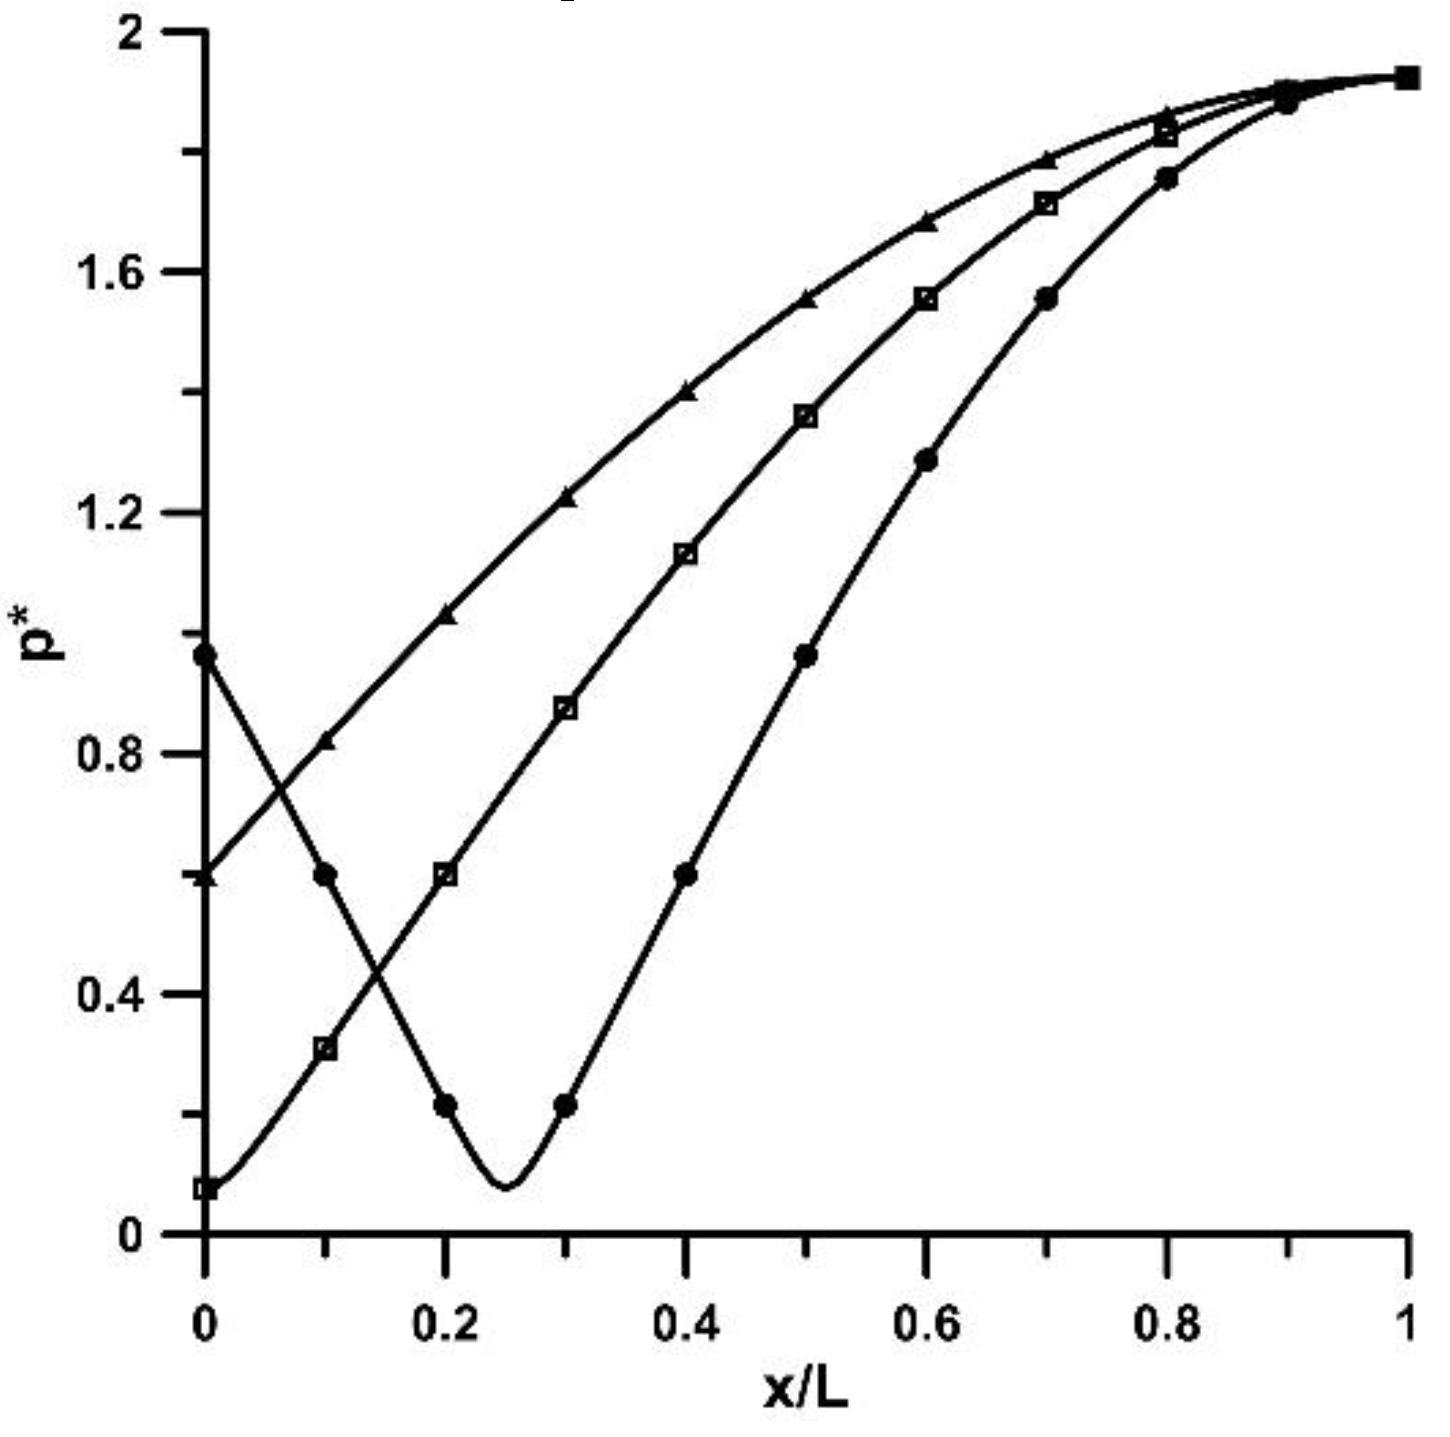
Figure 7.
Peak to peak pressure amplitudes (in 104 Pa) along the flexible tube at three distances from the stenosis neck: 2.08 D (red line), 20.41 D (circles) and 43.3 D (squares) for Ab = 38%, f = 8.16 Hz. (a) stenosis, (b) non-stenosis. Pincher displacement (in cm, triangles).
Figure 7.
Peak to peak pressure amplitudes (in 104 Pa) along the flexible tube at three distances from the stenosis neck: 2.08 D (red line), 20.41 D (circles) and 43.3 D (squares) for Ab = 38%, f = 8.16 Hz. (a) stenosis, (b) non-stenosis. Pincher displacement (in cm, triangles).
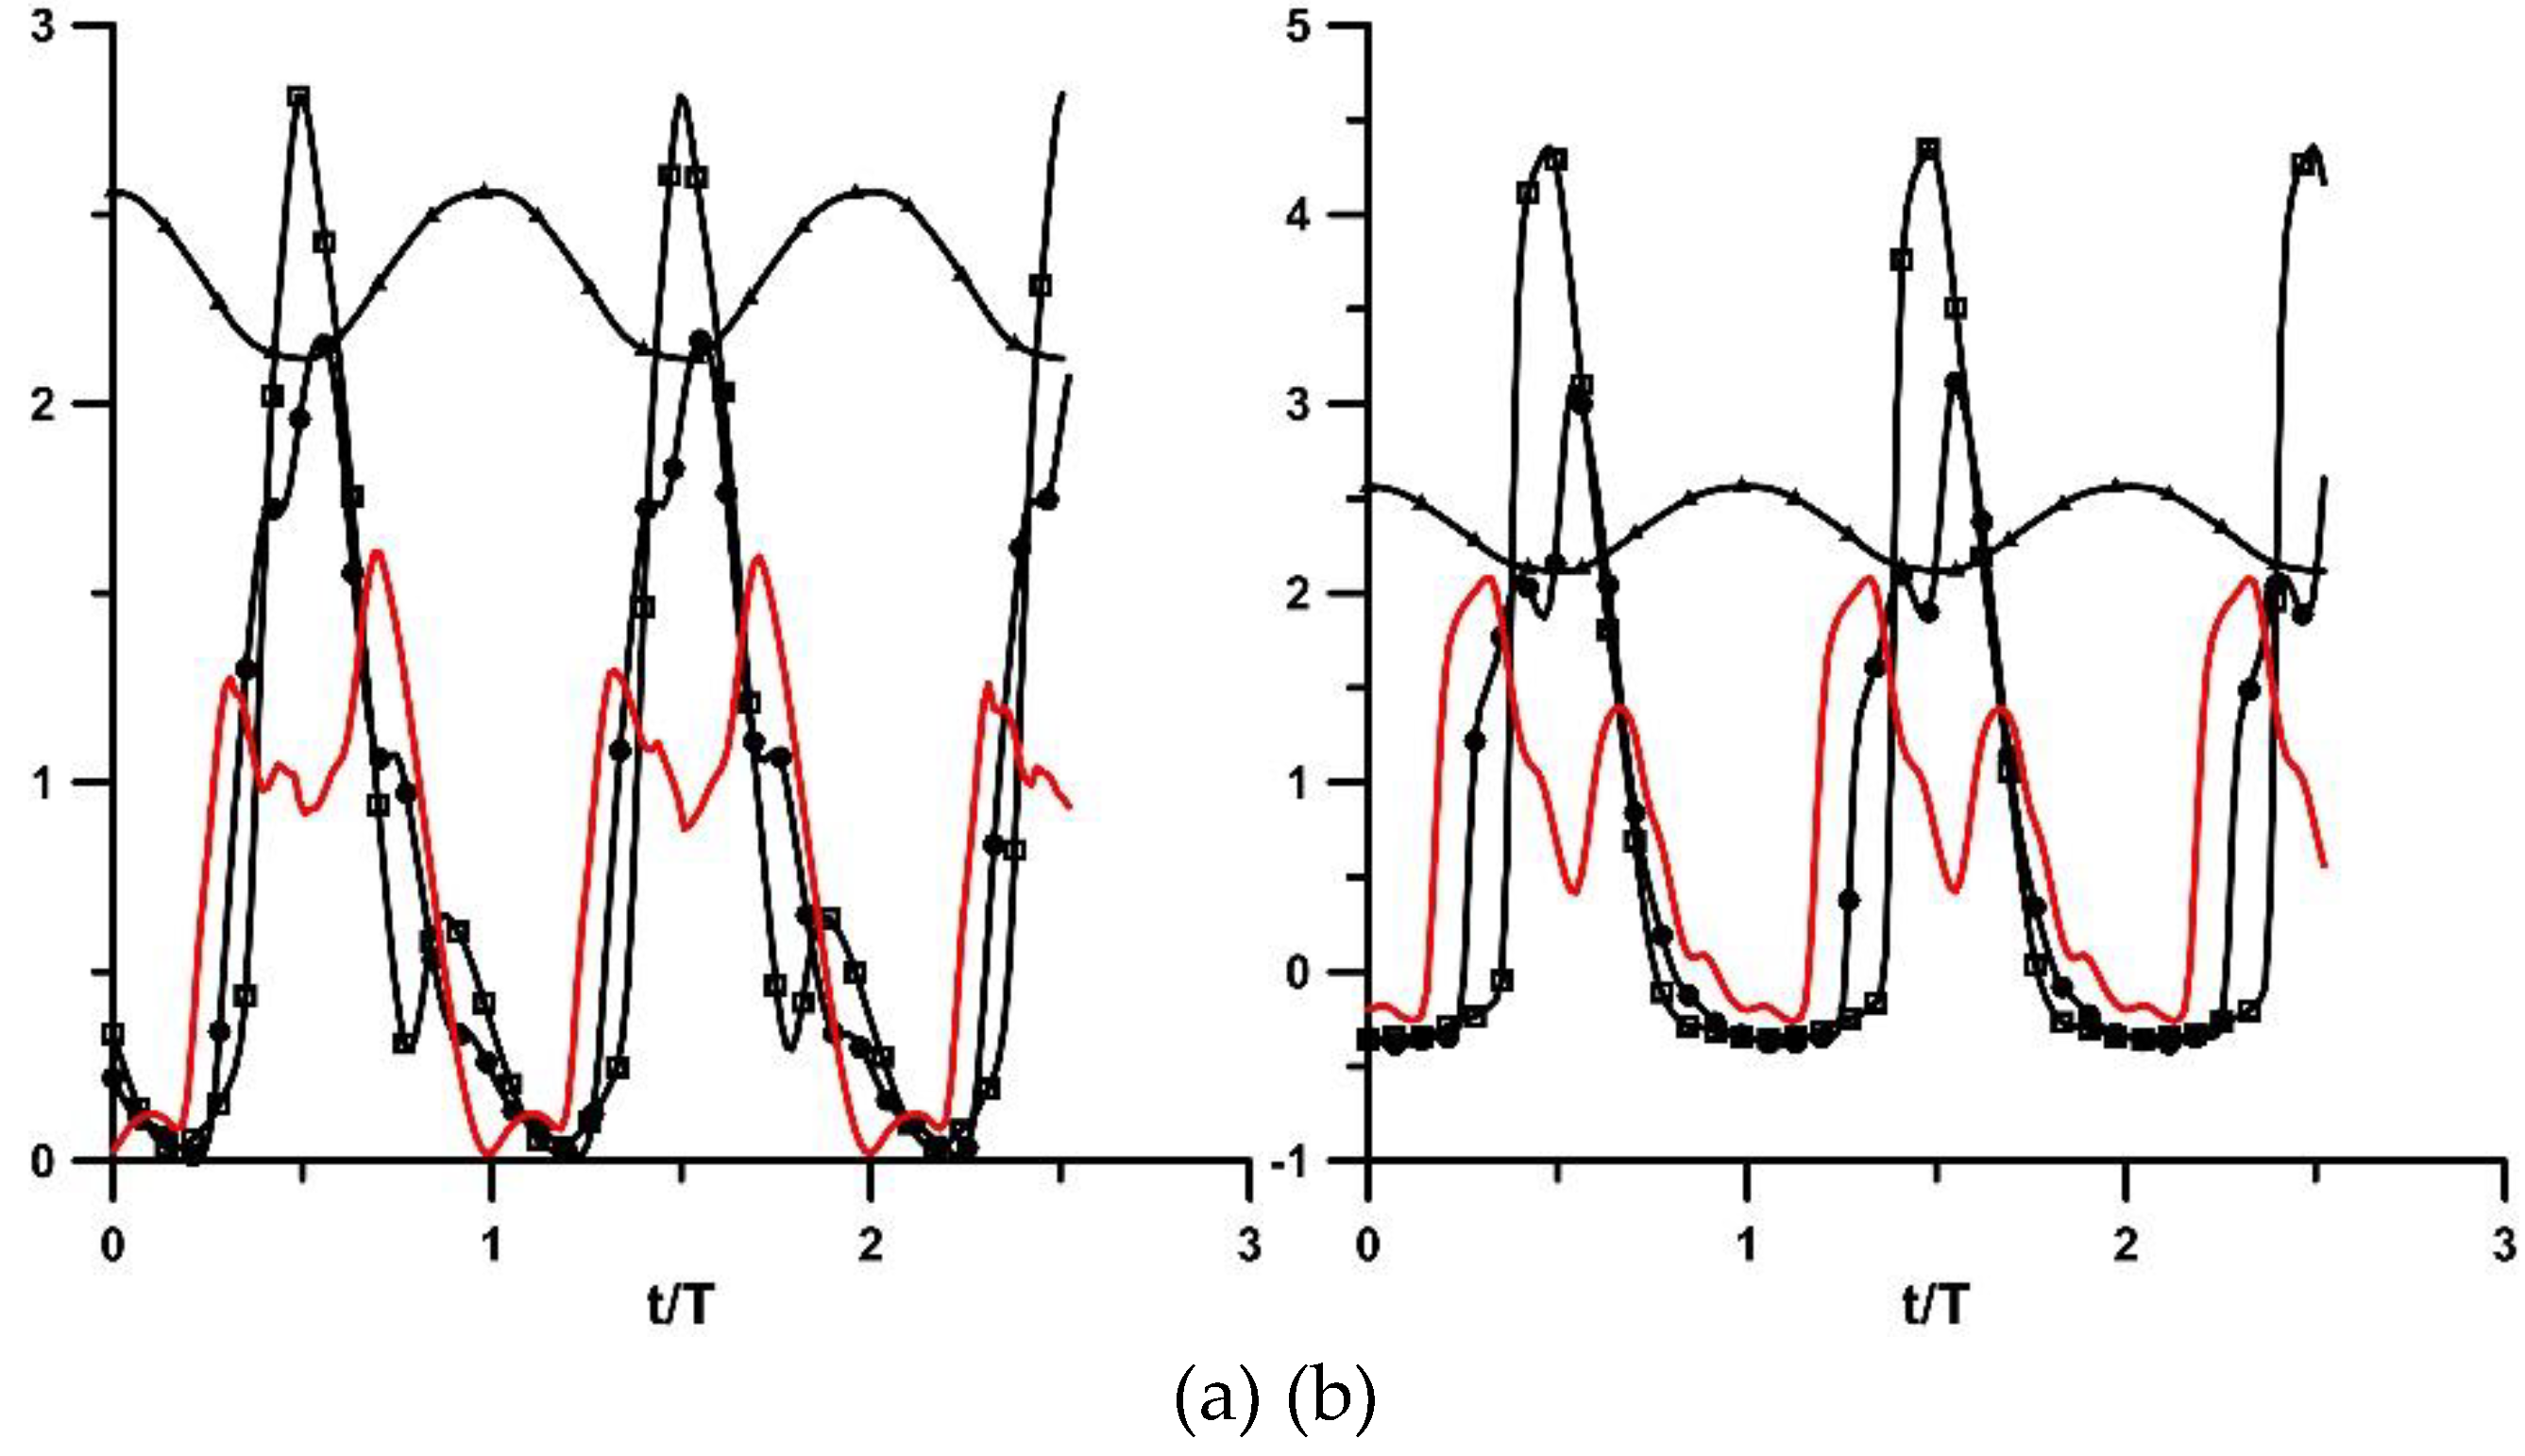
Figure 8.
Pressure time series (in 104 Pa) at the two flexible-rigid tube junctions (far junction (squares)/ close junction (circles)) and stenosis width in mm (triangles). (a) to (f) stenosis is present: (a) Ab = 24%, f = 6.11 Hz, (b) Ab = 24%, f = 9.86 Hz, (c) Ab = 38%, f = 5.96 Hz, (d) Ab = 38%, f = 8.16 Hz, (e) Ab = 65%, f = 7.12 Hz, (f) Ab = 65%, f = 10.18 Hz. No stenosis: (g) to (h): (g) Ab = 65%, f = 6.11 Hz, (h) Ab = 65%, f = 10.66 Hz.
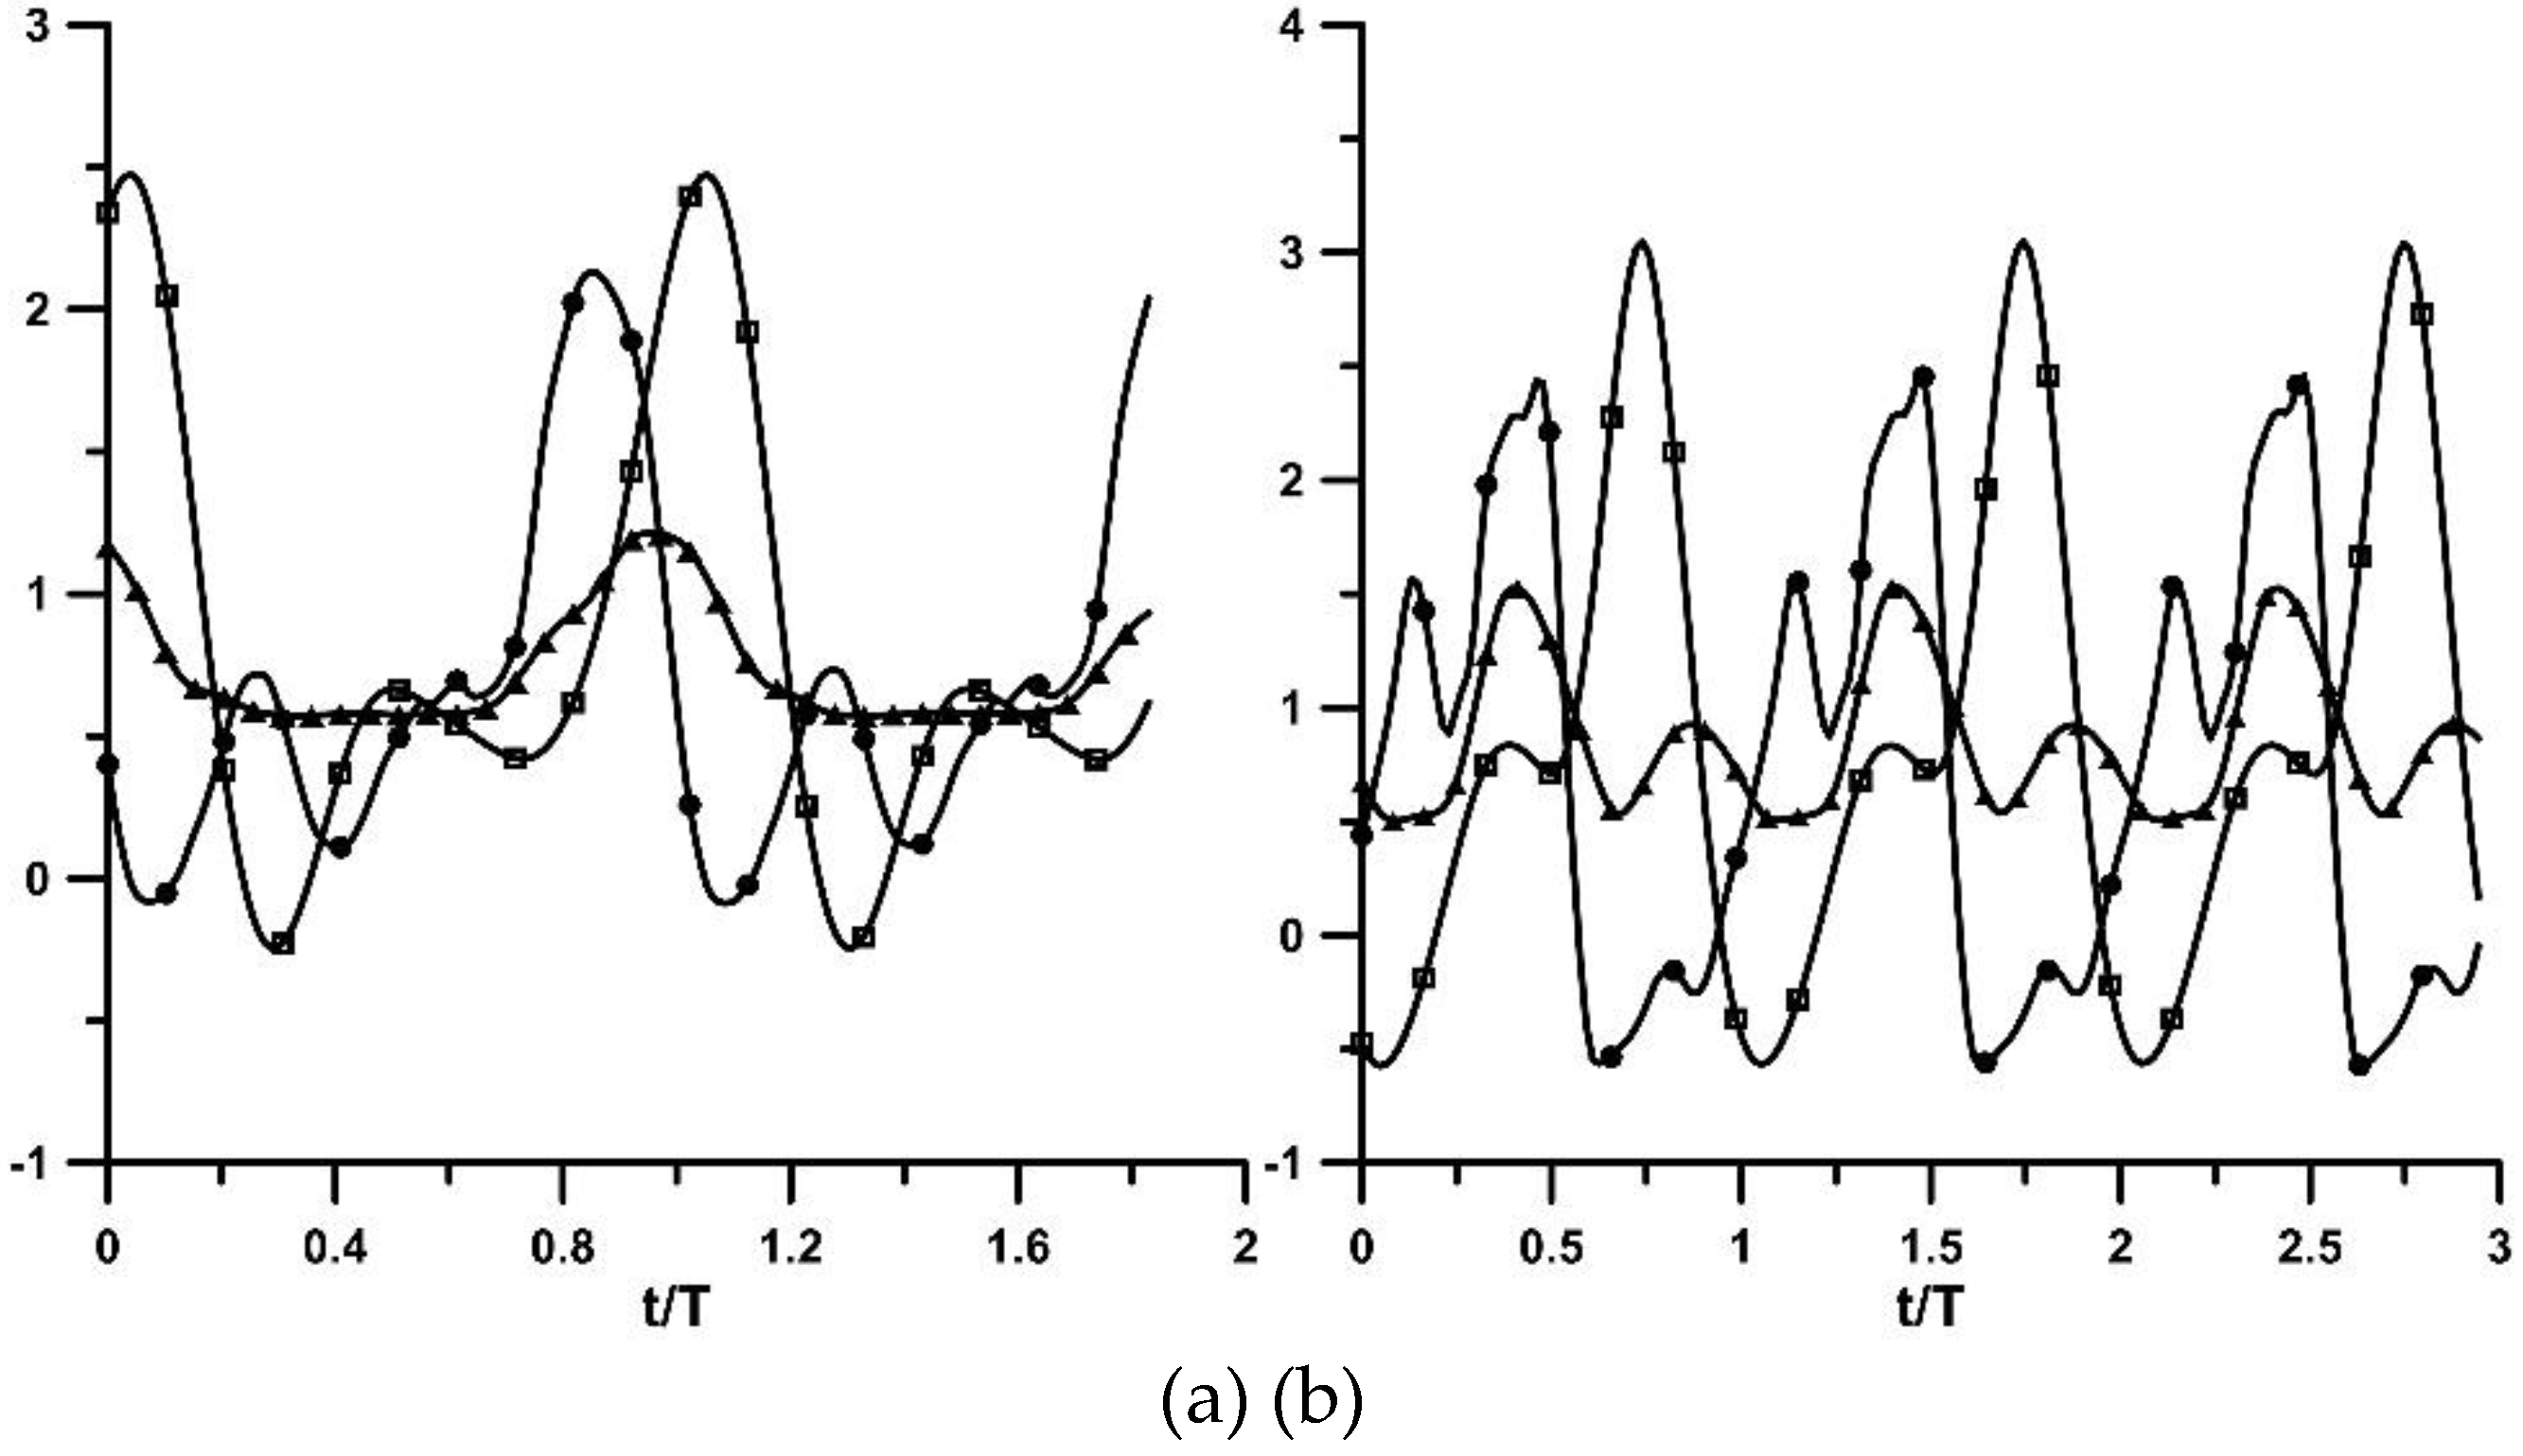
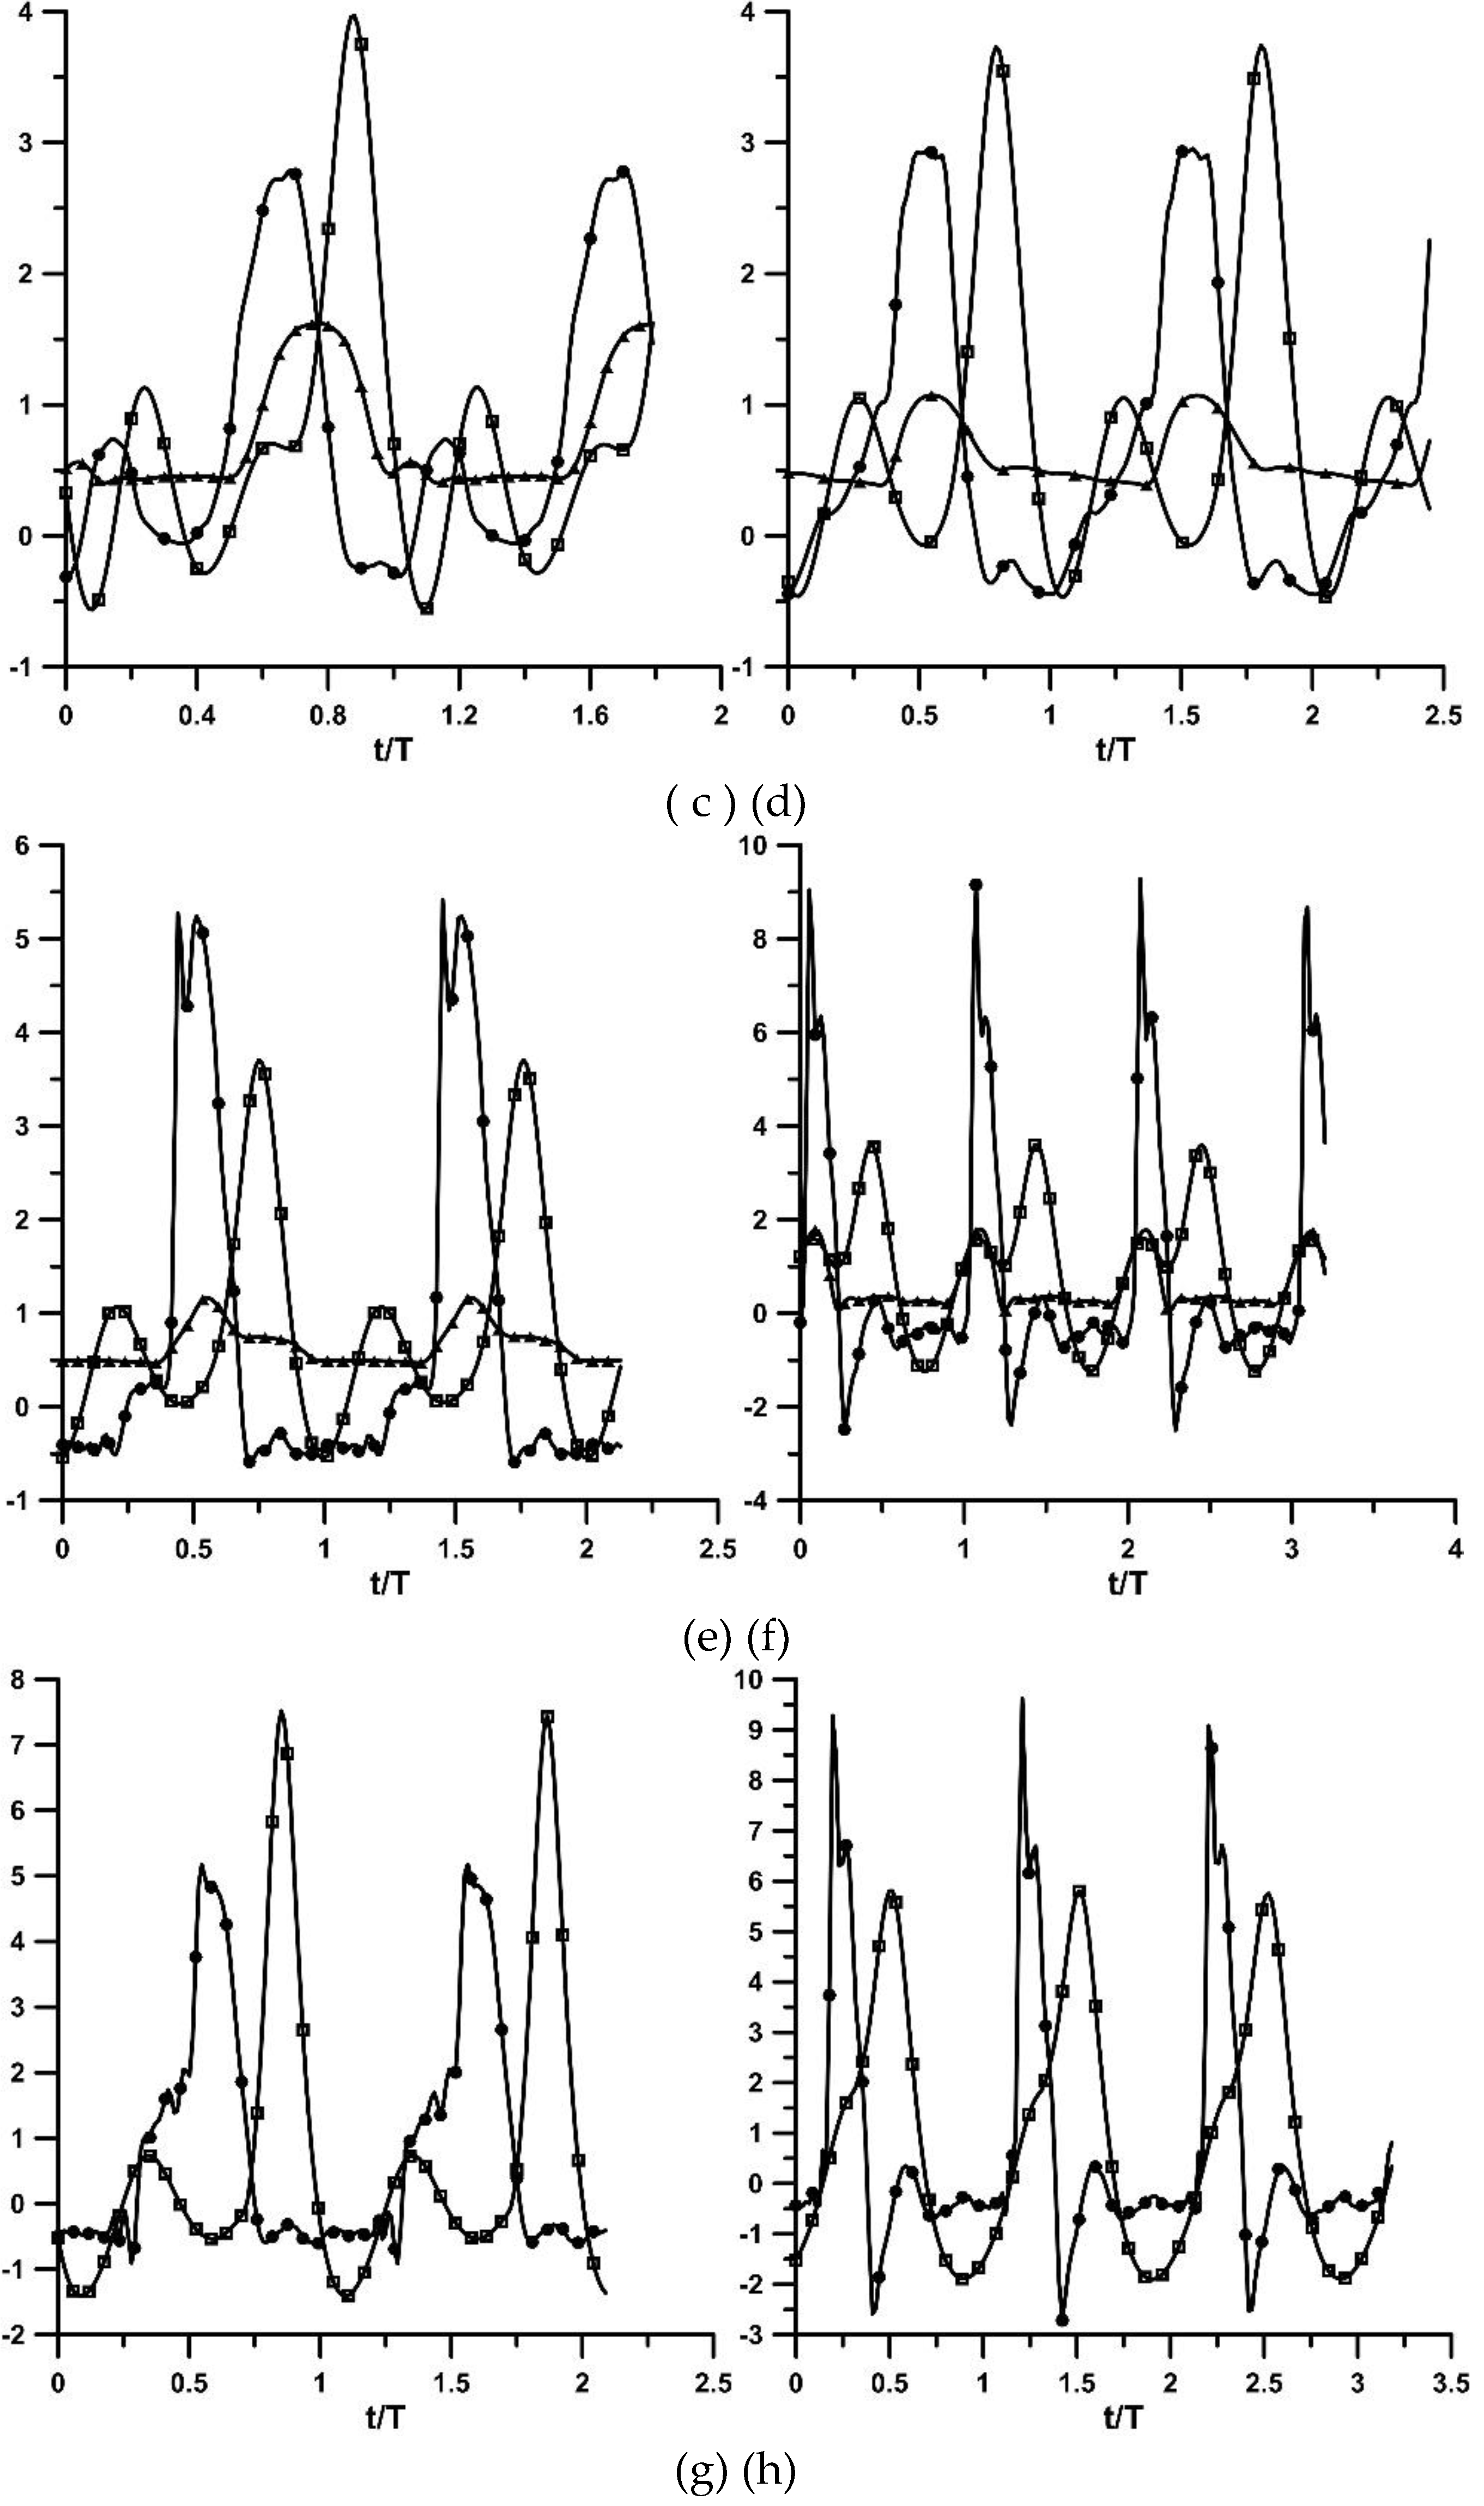
Figure 9.
Extreme pressure values with stenosis present: Ab = 24% (circles), 38% (solid circles) and 48% (rectangles).
Figure 9.
Extreme pressure values with stenosis present: Ab = 24% (circles), 38% (solid circles) and 48% (rectangles).
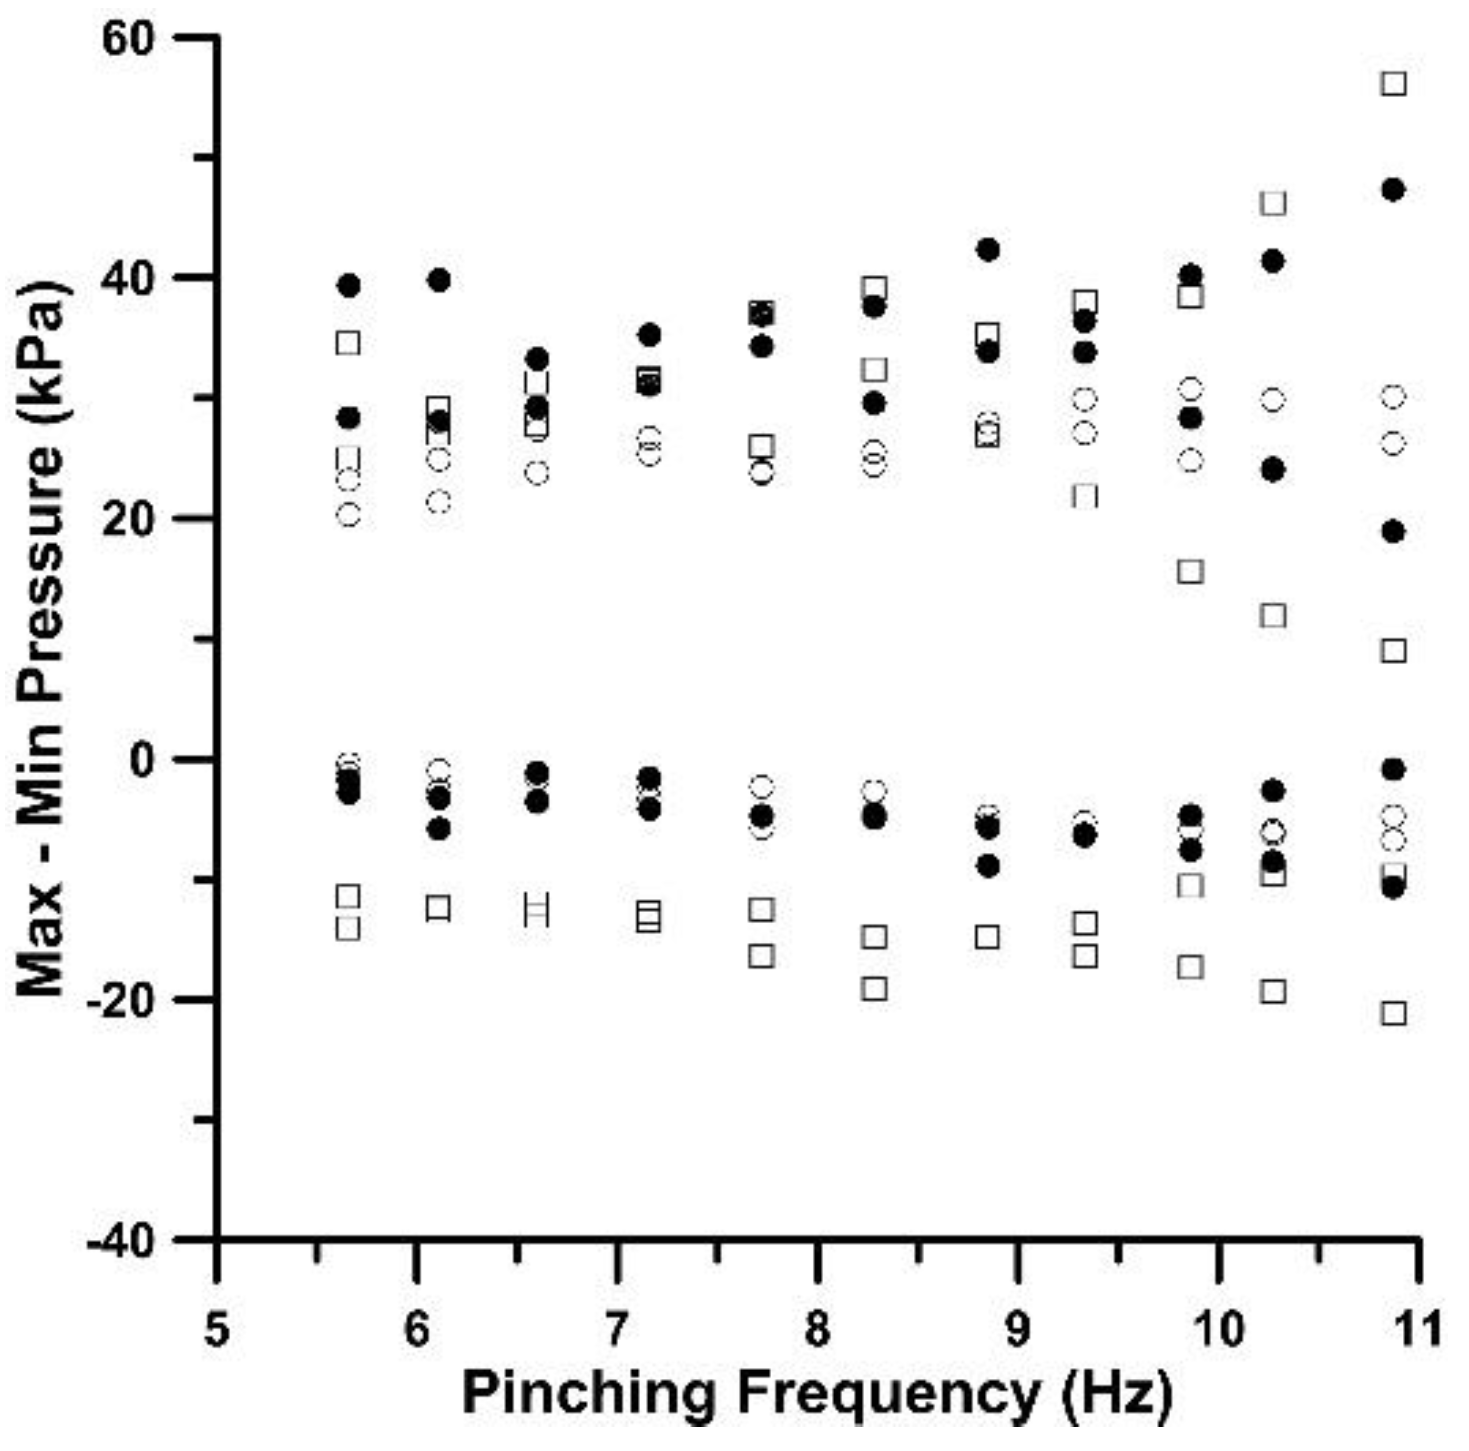
Figure 10.
Extreme pressure values for Ab = 65%, stenosis (circles), non-stenosis (triangles).
Disclaimer/Publisher’s Note: The statements, opinions and data contained in all publications are solely those of the individual author(s) and contributor(s) and not of MDPI and/or the editor(s). MDPI and/or the editor(s) disclaim responsibility for any injury to people or property resulting from any ideas, methods, instructions or products referred to in the content. |
© 2024 by the authors. Licensee MDPI, Basel, Switzerland. This article is an open access article distributed under the terms and conditions of the Creative Commons Attribution (CC BY) license (http://creativecommons.org/licenses/by/4.0/).
Copyright: This open access article is published under a Creative Commons CC BY 4.0 license, which permit the free download, distribution, and reuse, provided that the author and preprint are cited in any reuse.


