Submitted:
10 May 2024
Posted:
10 May 2024
Read the latest preprint version here
Abstract
Steel damper columns (SDCs) are energy-dissipating members that are suitable for reinforced concrete (RC) moment-resisting frames (MRFs) and those often used for multistory housing. In a previous study, an energy-based prediction procedure for the peak and cumulative response of an RC frame building with SDCs was proposed. In this procedure, the accuracy of the equivalent velocity of the maximum momentary input energy (VΔE1*)–peak equivalent displacement (D1*max) relationship is essential for improved prediction. In this article, the seismic capacity curve (VΔE1*–D1*max relationship) of RC MRFs with and without SDCs is evaluated using incremental critical pseudo-multi impulse analysis (ICPMIA). In the ICPMIA, which is based on a study by Takewaki and coauthors, the structure is subjected to various intensities of critical pseudo-multi impulsive lateral force. An ICPMIA of four 8- and 16-story RC MRFs with and without SDCs is performed to obtain their structural behaviors under various intensities of pulsive input. Then, the seismic capacity curve obtained from the ICMPIA results are compared with the predicted results based on the simplified equations. The main findings of this article are as follows. (i) The seismic capacity curve of RC MRFs without SDCs strongly depends on the number of impulsive lateral forces (Np). As Np increases, the seismic capacity decreases. The predicted seismic capacity curve severely underestimates that obtained from the ICMPIA in the case of large Np. This trend is notable when the level of pinching behavior in the RC members is severe. (ii) In the case of an RC MRF with SDCs, however, the influence of Np on its seismic capacity curve is small. The predicted seismic capacity curve agrees very well with that obtained from the ICMPIA. The influence of the level of pinching behavior in RC members on the seismic capacity curve is small.
Keywords:
reinforced concrete moment-resisting frame
; steel damper column
; seismic capacity
; pseudo-multi impulse (PMI)
; incremental critical pseudo-multi impulse analysis (ICPMIA)
; maximum momentary input energy
; peak displacement
1. Introduction
1.1. Background and Motivation
The peak deformation, cumulative strain energy, and residual deformation are essential parameters in assessing the seismic performance of structural members. Two energy-based seismic intensity parameters—the maximum momentary input energy (Hori et al., 2000; Inoue et al., 2000; Hori and Inoue, 2002) and the total input energy (Akiyama, 1985)—are related to the peak and cumulative responses, respectively. According to a study by Hori and Inoue (2002), the peak displacement of a structure can be evaluated by considering the energy balance during a half cycle of the structural response using the maximum momentary input energy. Meanwhile, the cumulative strain energy of structural members can be evaluated by considering the energy balance during an entire seismic event using the total input energy.
The motivation for using energy dissipation devices (dampers) is to mitigate damage to beams and columns during strong seismic events. A dual system with dampers, e.g., a damage-tolerant structure (Wada et al., 2000), is one solution for creating structures with superior seismic performance. In such a dual system, dampers play important roles (a) to reduce the peak displacement of the system and (b) to reduce the cumulative damage to beams and columns by absorbing seismic energy before it reaches the beams and columns. Accordingly, a building with such a dual system is more resilient than one with a traditional system: in the case of traditional moment-resisting frames (MRFs), most of the seismic energy is absorbed by the plastic hinges at the beam ends. Conversely, in the case of a dual system, most of the seismic energy is absorbed by the dampers; therefore, the seismic energy absorbed by the beams and columns is much smaller than in the case of traditional MRFs. Steel damper columns (SDCs; Katayama et al., 2000) are dampers suitable for reinforced concrete (RC) multistory housing. A SDC consists of a damper panel made of low-yield-strength steel plate, which absorbs the hysteresis energy, and a roll-formed H-section column, which behaves elastically. Numerous studies have been conducted on the seismic rehabilitation of existing RC buildings using SDCs (Fujii and Miyagawa, 2018; Fujii et al., 2019) and the seismic design of new RC MRFs with SDCs (Fujii and Kato, 2021; Mukoyama et al., 2021).
The concept of energy balance is quite useful to understand how such dampers work to improve the seismic performance of buildings. Recent advances in energy-based earthquake engineering can be found in Benavent-Climent and Mollaioli (2021) and Varum et al. (2023). Following Akiyama’s theory (1985, 1999), Benavent-Climent and his research group proposed a simplified seismic retrofitting design method for RC frames using dampers (Benavent-Climent, 2011; Benavent-Climent and Mota-Páez, 2017; Mota-Páez, et al., 2021; Benavent-Climent et al., 2024).
Takewaki and his research group (Kojima et al., 2015; Kojima and Takewaki, 2015a, 2015b, 2015c; Akehashi and Takewaki, 2021, 2022) have introduced the concepts of critical double impulse (DI) and critical multi impulse (MI) as substitutes for near-fault and long-duration earthquake ground motions. First, the concept of the critical DI was introduced to derive the upper bound of the earthquake input energy to a building structure (Kojima et al., 2015). Following this study, the critical response of an undamped elastoplastic single-degree-of-freedom (SDOF) model subjected to near-fault and long-duration earthquake ground motions was examined (Kojima and Takewaki, 2015a, 2015b, 2015c). Then, Akehashi and Takewaki (2021, 2022) introduced pseudo-double impulse (PDI) and pseudo-multi-impulse (PMI) to form a multi-degree-of-freedom (MDOF) model. In PDI and PMI analyses, the MDOF model oscillates predominantly in a single mode, considering the impulsive lateral force corresponding to a certain mode vector. When the impulsive lateral force corresponding to the first mode vector is considered, the MDOF model oscillates predominantly in the first mode.
An energy-based prediction procedure for the peak and cumulative response of RC MRFs with SDCs has been proposed (Fujii and Shioda, 2023). In the presented procedure, the building model is converted to an equivalent SDOF model that represents the first modal response based on a monotonic pushover analysis result. Then, the peak displacement is predicted using the maximum momentary input energy (Hori and Inoue, 2002), while the cumulative energy dissipation demand is predicted using the total input energy (Akiyama, 1985). In this procedure, the accuracy of the equivalent velocity of the maximum momentary input energy of the first modal response ()–peak equivalent displacement of the first modal response () relationship is essential for high quality prediction of the peak displacement. This procedure has been verified by comparing nonlinear time-history analysis (NTHA) results using non-pulse-like ground motions (Fujii and Shioda, 2023) and 30 recorded pulse-like ground motions (Fujii, 2023). The accuracy of the – relationship (seismic capacity curve) has also been verified by comparing the critical PDI analysis results (Fujii, 2024). However, the following issues remain.
- The verification in the previous study (Fujii, 2024) was limited because the number of impulsive inputs is fixed to 2 in a critical PDI analysis. The accuracy of the predicted corresponding to depends on the shape of the assumed half cycle of the structural response. In the case of the critical pseudo-multi impulse (PMI) input, the shape of the half cycle of the structural response depends on the number of impulsive inputs (). Therefore, further numerical investigation considering as a parameter is indispensible.
- In the simplified equation using , the influence of the pinching behavior of the RC members on the energy dissipation is not considered. The severe pinching behavior of RC beam-column connections has been reported in experimental studies (e.g., Gentry and Wight, 1994; Kusuhara et al., 2004; Kusuhara and Shiohara, 2008; Benavent-Climent et al., 2009, 2010). Toyoda et al. (2014) compared the shaking table test results of a 1/4-scaled 20-story RC building model conducted at E-defense with NTHA results. They found that, for a better prediction of the peak response, the influence of the pinching behavior of RC beams should be considered. Following their study, Shirai et al. (2024) demonstrated that the pinching behavior of RC members affects the peak responses of 40-story RC super-high-rise buildings. Therefore, the influence of the pinching behavior of RC members on the seismic capacity curve should be investigated.
The residual displacement (Farrow and Kurama, 2003) is another essential parameter that is important to discuss in the repair of structures after earthquakes. The residual displacement is also important when the seismic sequence is considered (Ruiz-García and Negrete-Manriquez, 2011; Ruiz-García, 2012a, 2012b; Tesfamariam and Goda, 2015; Hoveidae, N., Radpour, 2021; Fujii, 2022). Specifically, Ruiz-García (2012b) pointed out that the residual displacement of a stiffness-degrading SDOF model is smaller than that of an elastoplastic SDOF model, even though the peak displacement of a stiffness-degrading SDOF model is larger than that of an elastoplastic SDOF model. In addition, Hoveidae and Radpour (2021) found that the large residual displacement after a mainshock can significantly increase the peak response under an aftershock. In Fujii (2024), the residual displacement obtained from the critical PDI analysis of RC MRFs with SDCs is larger than that of RC MRFs without SDCs: the residual equivalent displacement reaches close to 30% of the peak equivalent displacement in the case of RC MRFs with SDCs. This is larger than that obtained in the NTHA considering the ground motion records (Fujii, 2022). Therefore, the residual displacement obtained from the critical PDI analysis may be the upper bound. Accordingly, the influence of the number of impulsive inputs () on the residual displacement should be investigated.
1.2. Objectives
Given the above-outlined background, this study addresses the following questions.
- (i)
- Considering the critical response of an RC MRF with SDCs subjected to critical PMI input, what is the dependence of the – relationship on the number of impulsive inputs ()?
- (ii)
- How does the pinching behavior of RC members affect the – relationship of RC MRFs? Can the negative influence of the pinching behavior of the RC members on the – relationship be improved by installing SDCs?
- (iii)
- How do and the pinching behavior of RC members affect the ratios of the cumulative energies (cumulative strain energies of the RC MRFs and SDCs) at the end of simulation?
- (iv)
- How does affect the residual equivalent displacement of RC MRFs?
In this article, the seismic capacities of RC MRFs with and without SDCs are evaluated using incremental critical pseudo-multi impulse analysis (ICPMIA). How the seismic capacity of a structure corresponds to is defined in terms of . In the ICPMIA, the structure is subjected to various intensities of pulsive input. From the ICPMIA results, (a) the influence of the number of impulsive inputs () and the pinching behavior of the RC members on and the residual equivalent displacement and (b) the influence of on the cumulative strain energies of the RC MRFs and SDCs are investigated. Then, the – relationships (seismic capacity curves) obtained from the ICPMIA results are compared with the predicted results based on the simplified equations.
The rest of this paper is organized as follows. Section 2 outlines the critical PMI analysis and ICPMIA. Section 3 presents four RC MRFs with and without SDCs and the analysis methods. Section 4 describes the responses of the RC MRFs obtained from the critical PDI and PMI analysis results, focusing in particular on (i) the pulse velocity ()–peak equivalent displacement () relationship, (ii) the hysteresis loop and residual displacement of the first modal response, and (iii) the cumulative strain energies of the RC MRFs and SDCs. Section 5 focuses on comparisons with the predicted results based on the study of Fujii and Shioda (2023) and the ICPMIA results. First, the simplified equations for calculating the energy dissipation capacity during a half cycle of the structural response are formulated. Next, the seismic capacity curve is predicted using the pushover analysis results. Then, the predicited seismic capacity curve is compared with the − plot obtained from the ICPMIA results. The conclusions drawn from this study and the directions of future research are discussed in Section 6.
2. Incremental Critical Pseudo-Multi Impulse Analysis
2.1. Outline of the Critical Pseudo-Multi Impulse Analysis
First, an outline of the critical PMI analysis is described as follows. Note that this analysis is based on the critical PDI analysis presented in Fujii (2024). Figure 1 outlines the critical PMI analysis.
Following a study by Kojima and Takewaki (2015c), the ground acceleration () in the case of the critical PDI and PMI analysis can be written as
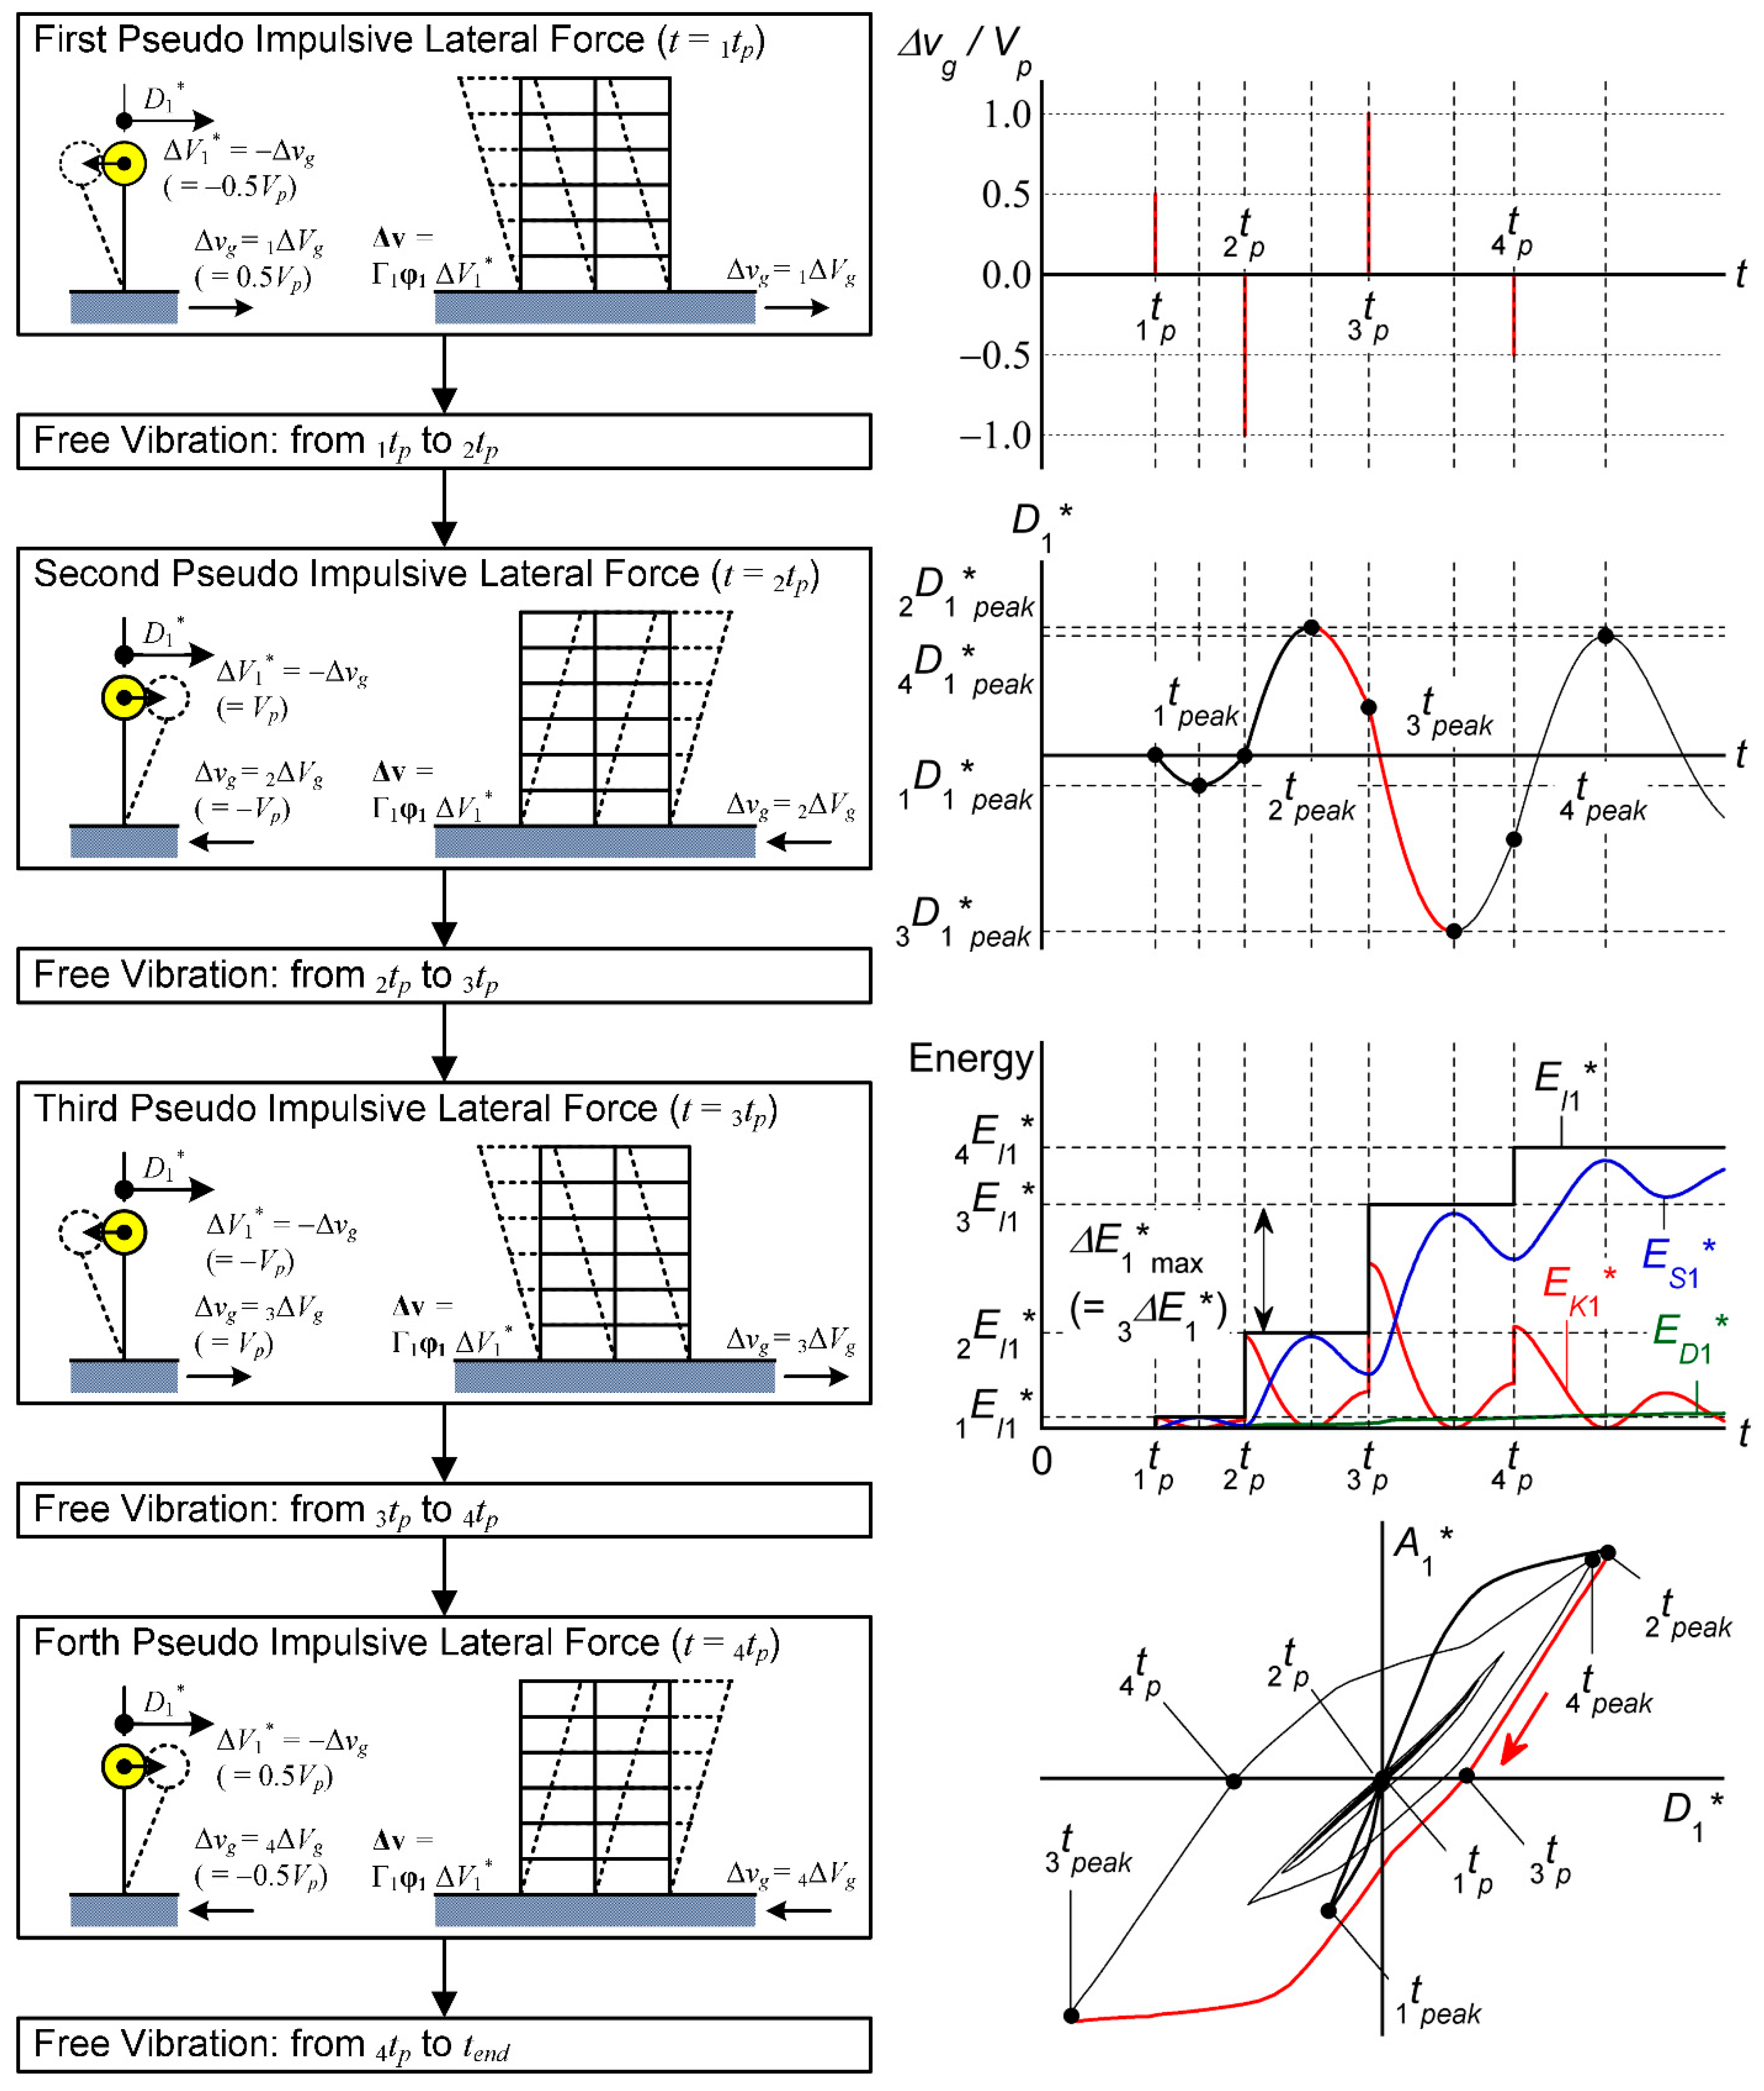
In Eq. (1), (≥ 2) is the number of pseudo impulsive lateral forces, is the ground motion velocity increment of the -th pulse, is the time when the pseudo impulsive lateral force acts, and is the Dirac delta function that satisfies Eq. (2). In the case of the PDI analysis (= 2), is defined as in Eq. (3):
where is the pulse velocity. Similarly in the case of the PMI analysis (≥ 3), is defined as in Eq. (4):
Next, consider a planer frame building model (number of stories, ) subjected to a pseudo impulsive lateral force proportional to the first mode vector. Here, is the mass matrix of the building model; , , and are the relative displacement, velocity, and acceleration vector, respectively; and and are the restoring and damping force vectors, respectively. The equivalent displacement (), equivalent velocity (), and equivalent relative acceleration () of the first modal response are defined in Eqs. (5)–(8):
where is the effective first modal mass. Note that and depend on the local maximum equivalent displacement within the range . In this study, the first mode vector at time is updated assuming that is proportional to the displacemt vector at the time when the maximum equivalent displacement occurs (). The first mode vector at time is updated via Eq. (9):
The equivalent acceleration is defined as in Eq. (10):
2.1.1. First Pseudo Impulsive Lateral Force
At time , the first pseudo impulsive lateral force acts on the building model as shown in Figure 1. Note that, before the action of the first pseudo impulsive force on the building model (), the building model is in a stationary state (, ,). The equivalent velocity of the first modal response just after the action of the first pseudo impulsive lateral force () is calculated using Eq. (11):
and the corresponding velocity vector () is calculated using Eq. (12):
where is the first mode vector at the initial stage. The increment of input energy of the first modal response () is calculated via Eq. (13):
where is the first modal mass at the initial stage. The cumulative input energy of the first modal response () is calculated via Eq. (14):
To calculate the response after the action of the first pseudo impulsive lateral force, the equivalent velocity () and velocity vector () are updated via Eq. (15):
In addition, the counting number of pulsive inputs () is set to = 1.
2.1.2. Free Vibration after the First Pseudo Impulsive Lateral Force
After the action of the first pseudo impulsive lateral force, the building model oscillates without external forces (free vibration) until the arrival of the second pseudo impulsive lateral force. The kinetic energy, the damping dissipated energy, the cumulative strain energy, and the cumulative input energy of the first modal response (, , , and , respectively) are expressed as shown in Eqs. (16)–(19):
The first pseudo impulsive lateral force is proportional to the first mode vector, and thus the building model oscillates predominantly in the first mode. Therefore, the kinetic energy, the damping dissipated energy, the cumulative strain energy, and the cumulative input energy (, , , and , respectively) are approximated as shown in Eq. (20):
Note that the first mode vector () updates any step according to Eq. (9) until reaches its local peak ( shown in Figure 1). The effective first modal mass () is then re-calculated according to Eq. (8). The time is defined as the time when reaches .
The timing of the action of the second pseudo impulsive lateral force () is determined from the following conditions:
Equation (21) is equivalent to the condition of critical timing given by Akehashi and Takewaki (2021, 2022).
2.1.3. Pseudo Impulsive Lateral Force
At time (1 ≤ ≤ −1), the next pseudo impulsive lateral force acts on the building model, as shown in Figure 1. The equivalent velocity of the first modal response just after the action of the next pseudo impulsive lateral force () is calculated via Eq. (22):
Here, is the equivalent velocity of the first modal response just before the action of the next pseudo impulsive lateral force. Assuming that the velocity vector just before the action of the next pseudo impulsive lateral force () can be approximated by the first modal response, the corresponding velocity vector () can be expressed as Eq. (23):
The increment of the input energy of the first modal response () is calculated via Eq. (24):
The cumulative input energy of the first modal response just after the action of the next pseudo impulsive lateral force () is calculated via Eq. (25):
To calculate the response after the action of the second pseudo impulsive lateral force, the equivalent velocity () and the velocity vector () are updated via Eq. (26):
In addition, the counting number of the pulsive inputs () is updated such that .
2.1.4. Free Vibration
After the action of the -th pseudo impulsive lateral force, the building model oscillates without external forces (free vibration). The following response depends on and .
In the case in which is smaller than , the free vibration of the building model continues until the action of the next pseudo impulsive lateral force. During the free vibration, the first mode vector () updates any step according to Eq. (9) until reaches its local peak ( shown in Figure 1). The effective first modal mass () is then re-calculated according to Eq. (8). The time is defined as the time when reaches . The timing of the action of the next pseudo impulsive lateral force () is determined from the following conditions (Eq. (27)):
At time , the next pseudo impulsive lateral force acts as prescribed in Section 2.1.3.
When equals , the free vibration of the building model continues until . The time is defined as the time when reaches . The peak equivalent displacement of the first modal response over the course of the entire seismic event () is obtained using Eq. (28):
The maximum momentary input energy of the first modal response per unit mass () is obtained via Eq. (29):
The cumulative input energy of the first modal response per unit mass () is calculated using Eq. (30):
The equivalent velocity of the maximum momentary input energy of the first modal response () is calculated using Eq. (31):
In addition, the equivalent velocity of the cumulative input energy of the first modal response () is calculated using Eq. (32):
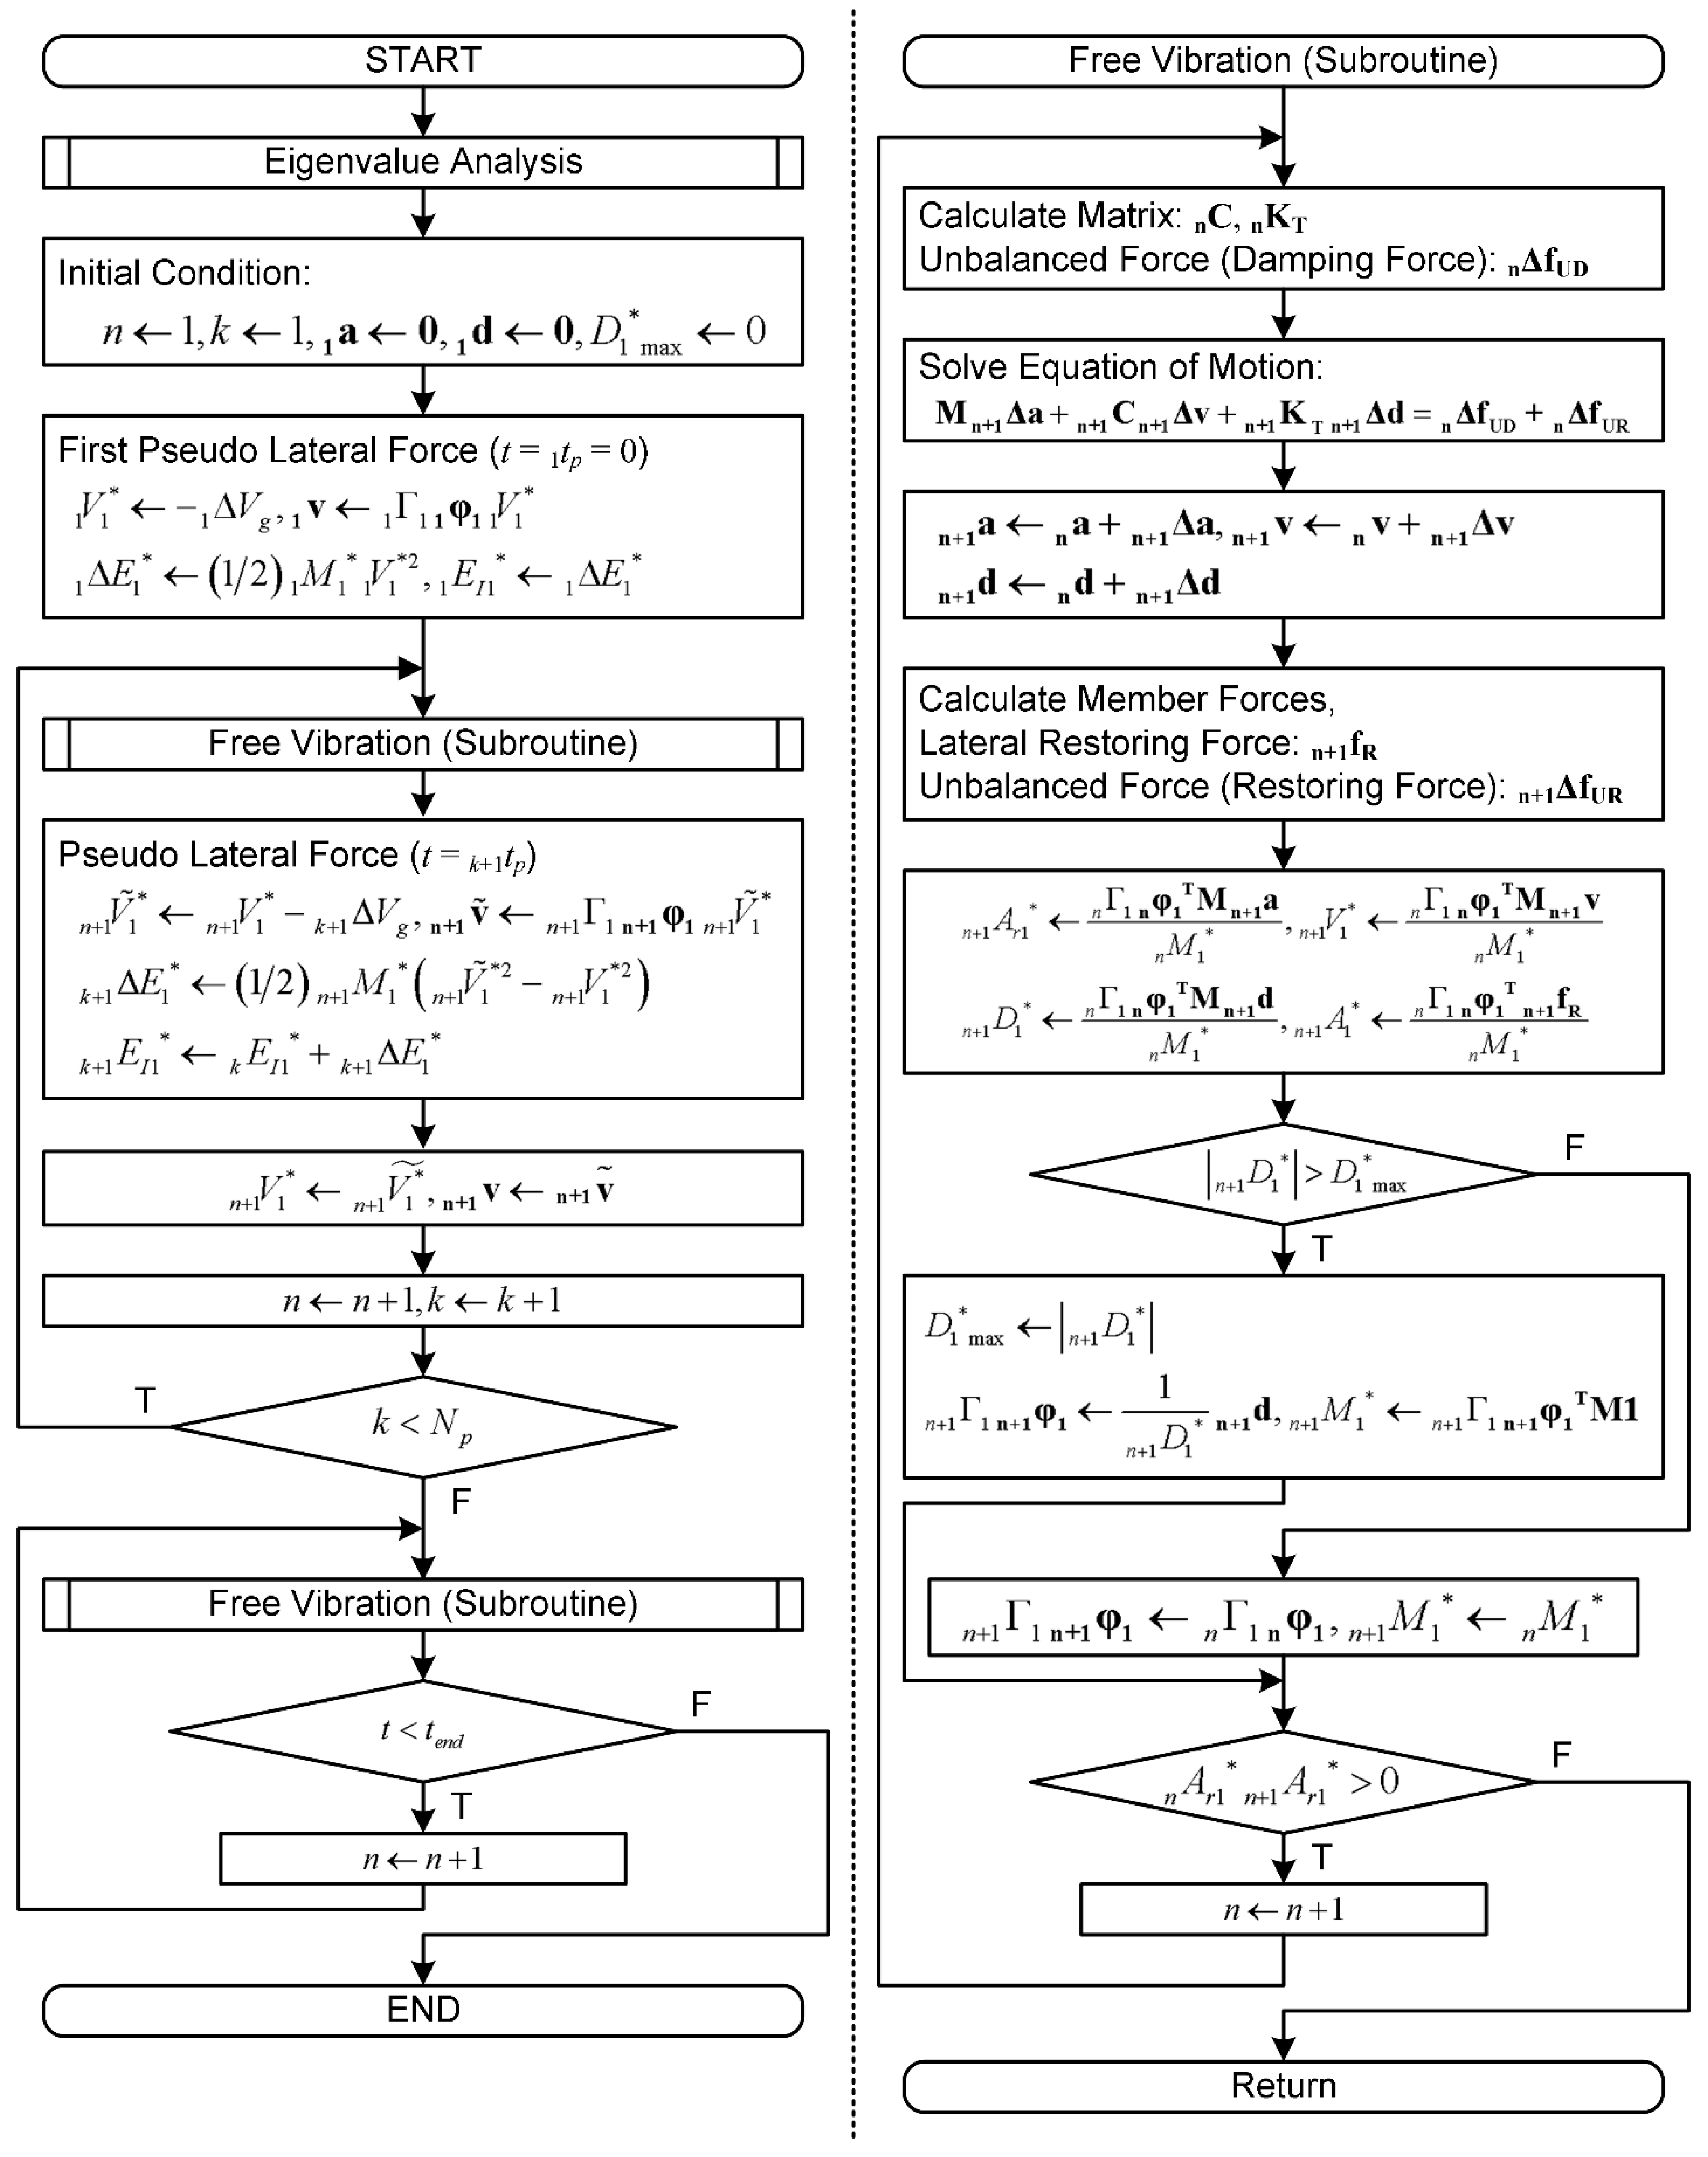
2.2. Analysis Flow of the Critical PMI Analysis
Figure 2 shows the flow of the critical PMI analysis. This flow is based on the flow of the critical PDI analysis presented in Fujii (2024). The analysis procedure is implemented by the computer code used in Fujii and Miyagawa (2018).
2.3. Calculation of the Seismic Capacity Curve from the Incremental Critical Pseudo-Multi Impulse Analysis (ICPMIA) Results
Incremental critical pseudo-multi impulse analysis (ICPMIA) is a parametric analysis method used to evaluate the nonlinear response of a structure by performing a critical PMI analysis considering various pulse velocities (). In the ICPMIA analysis, varies from small to large levels until the structural response reaches a predetermined damage level (e.g., Life Safety of Collapse Prevention). This analysis is similar to the incremental dynamic analysis (IDA) (Vamvatsikos and Cornell, 2002) and the incremental N2 method (Dolšek and Fajfar, 2004). The difference between the three analysis methods is the nonlinear structural analysis method. In IDA, an NTHA of the model is performed using the time-history of the ground accelerations. The IDA results are the most rigorous of the three methods. However, the IDA result is very complex to understand with respect to the nonlinear structural characteristics because the IDA result is intricately intertwined with the nonlinear structural characteristics and the ground motion characteristics. Meanwhile, in IN2, a nonlinear static (pushover) analysis of the model is performed to obtain the nonlinear structural characteristics. Then, the seismic response (the seismic intensity corresponds to a certain peak displacement) is evaluated based on the inelastic spectra. The IN2 result is the most simple and easiest of the three to understand. However, its accuracy strongly depends on several assumptions, that the structure oscillates predominantly in a fundamental mode and that the spectra are inelastic. In ICPMIA, a critical PMI analysis is performed to obtain the nonlinear structural characteristics. Because ICPMIA can directly include the influence of cyclic loading, the influence of the duration of ground motions can be considered in ICPMIA by adjusting the number of pulsive inputs (). In addition, because the ground motion in ICPMIA is simplified as the critical pulses determined automatically from the structural response, the ICPMIA result is still simple to understand with respect to the nonlinear structural characteristics.
The − plot is obtained from the ICPMIA result. In this study, the − curve is referred to as the “seismic capacity curve.” Note that the peak equivalent displacement () may not occur at the end of the half cycle of the structural response corresponding to the maximum momentary input energy per unit mass (). However, because occurs at the end of a half cycle of the structural response, corresponding to in most cases analyzed herein, the relationship between the as-obtained and the as-obtained is simply plotted in this study.
3. Analysis Data and Methods
3.1. Building Data
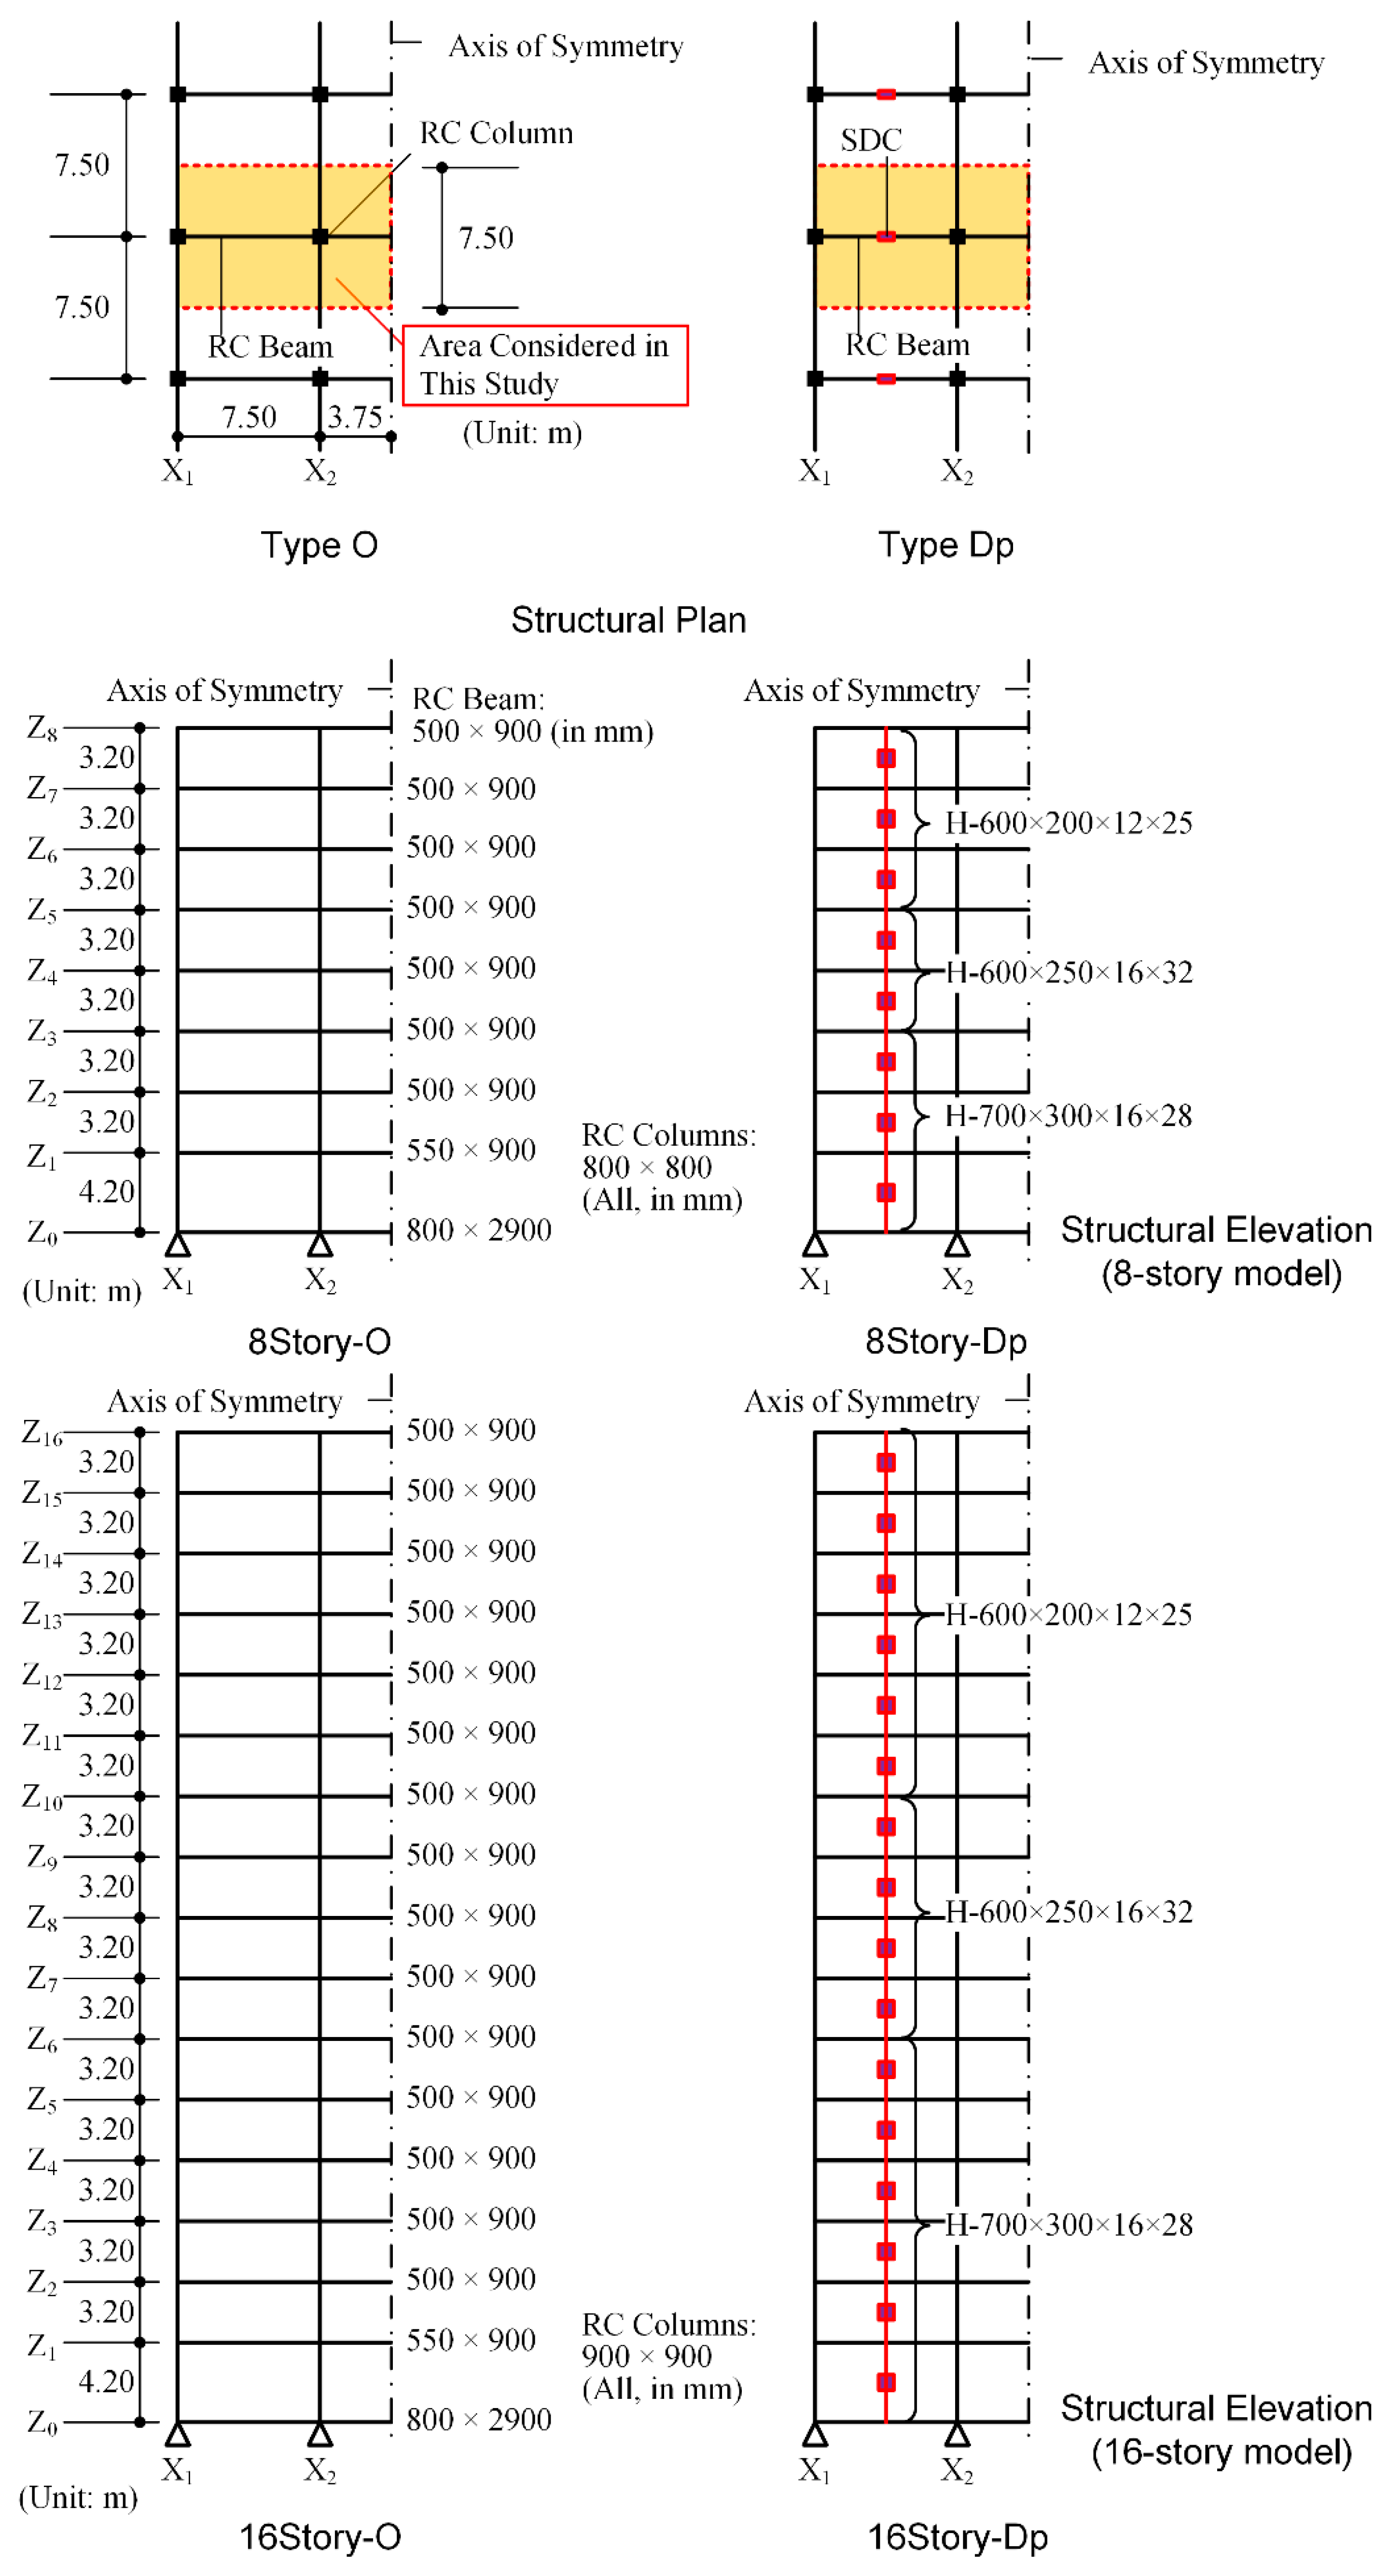
The four planar building models analyzed in this study are 8- and 16-story RC MRFs with and without SDCs. Figure 3 shows the simplified plan and elevation of the RC MRF building models. The two models labeled Type Dp (8Story-Dp and 16Story-Dp) are the same as those used in Fujii and Shioda (2023). The two models made from Type Dp by removing all SDCs are referred to as Type O (8Story-O and 16Story-O). All RC MRFs analyzed herein were designed according to the strong-column/weak-beam concept, except at the foundation level beam and in the case of steel damper columns installed in an RC frame. In the latter case, at the joints between an RC beam and a steel damper column, the RC beam was designed to be sufficiently stronger than the yield strength of the steel damper column considering strain hardening. Sufficient shear reinforcement of all RC members was provided to prevent premature shear failure. The failure of beam–column joints is not considered because it is assumed that sufficient reinforcement is provided. The natural periods of the first modal response in the elastic range () of the 8-story models are 0.740 s and 0.561 s for Types O and Dp, respectively. Similarly, the values of the 16-story models are 1.41 s and 1.12 s for Types O and Dp, respectively.
The nonlinear behavior of the RC members and SDCs is modeled as in previous studies (Mukoyama et al., 2021; Fujii, 2022; Fujii and Shioda, 2023), except the hysteresis rule used for the RC members. Figure 4 shows the nonlinear force–deformation relationship. In this study, the pinching behavior of the RC members is considered. The pinching model is assumed to be a linear combination of perfectly non-pinching and perfectly pinching models. The perfectly non-pinching model is identical to the stiffness degradation model used for RC members in previous studies (Mukoyama et al., 2021; Fujii, 2022; Fujii and Shioda, 2023). Meanwhile, the perfectly pinching model is a model that has no energy hysteresis energy dissipation in symmetric loading. A parameter (0 ≤ ≤ 1) is introduced to control the pinching behavior. When is 0, its behavior is that of a perfectly pinching model; when is 1, its behavior is that of a perfectly non-pinching model. In this study, four different pinching behaviors are considered: the parameter was set to 0.25, 0.50, 0.75, and 1.00, as shown in the bottom of Figure 4. For the damper panel in the SDCs, the same hysteresis model (trilinear model) is used. Other details concerning the four structural models can be found in previous studies (Fujii, 2022; Fujii and Shioda, 2023). In this study, the viscous damping ratio of the first modal response of the RC MRFs in the elastic range () was set to 0.03.
3.2. Analysis Method
In this study, the pulse velocity () was set from 0.10 m/s, with an interval of 0.05 m/s, until was close to 1/75 of the assumed equivalent height (). The target was set to 0.252 m for the 8-story models, while for the 16-story models the target was set to 0.479 m. The total number of pseudo impulsive lateral forces () was set to 4, 6, and 8. A critical PDI analysis ( = 2) of each model was performed for the comparisons. In each analysis, the ending time of the analysis () was determined as the ending of the 32nd half cycle of free vibration after the action of the second pseudo impulsive lateral force.
4. Analysis Results
This section describes the responses of the RC MRFs obtained from the critical PDI and PMI analysis results, focusing in particular on (i) the pulse velocity ()–peak equivalent displacement () relationship, (ii) the hysteresis loop and residual displacement of the first modal response, and (iii) the cumulative strain energies of the RC MRFs and SDCs.
4.1. Peak Response
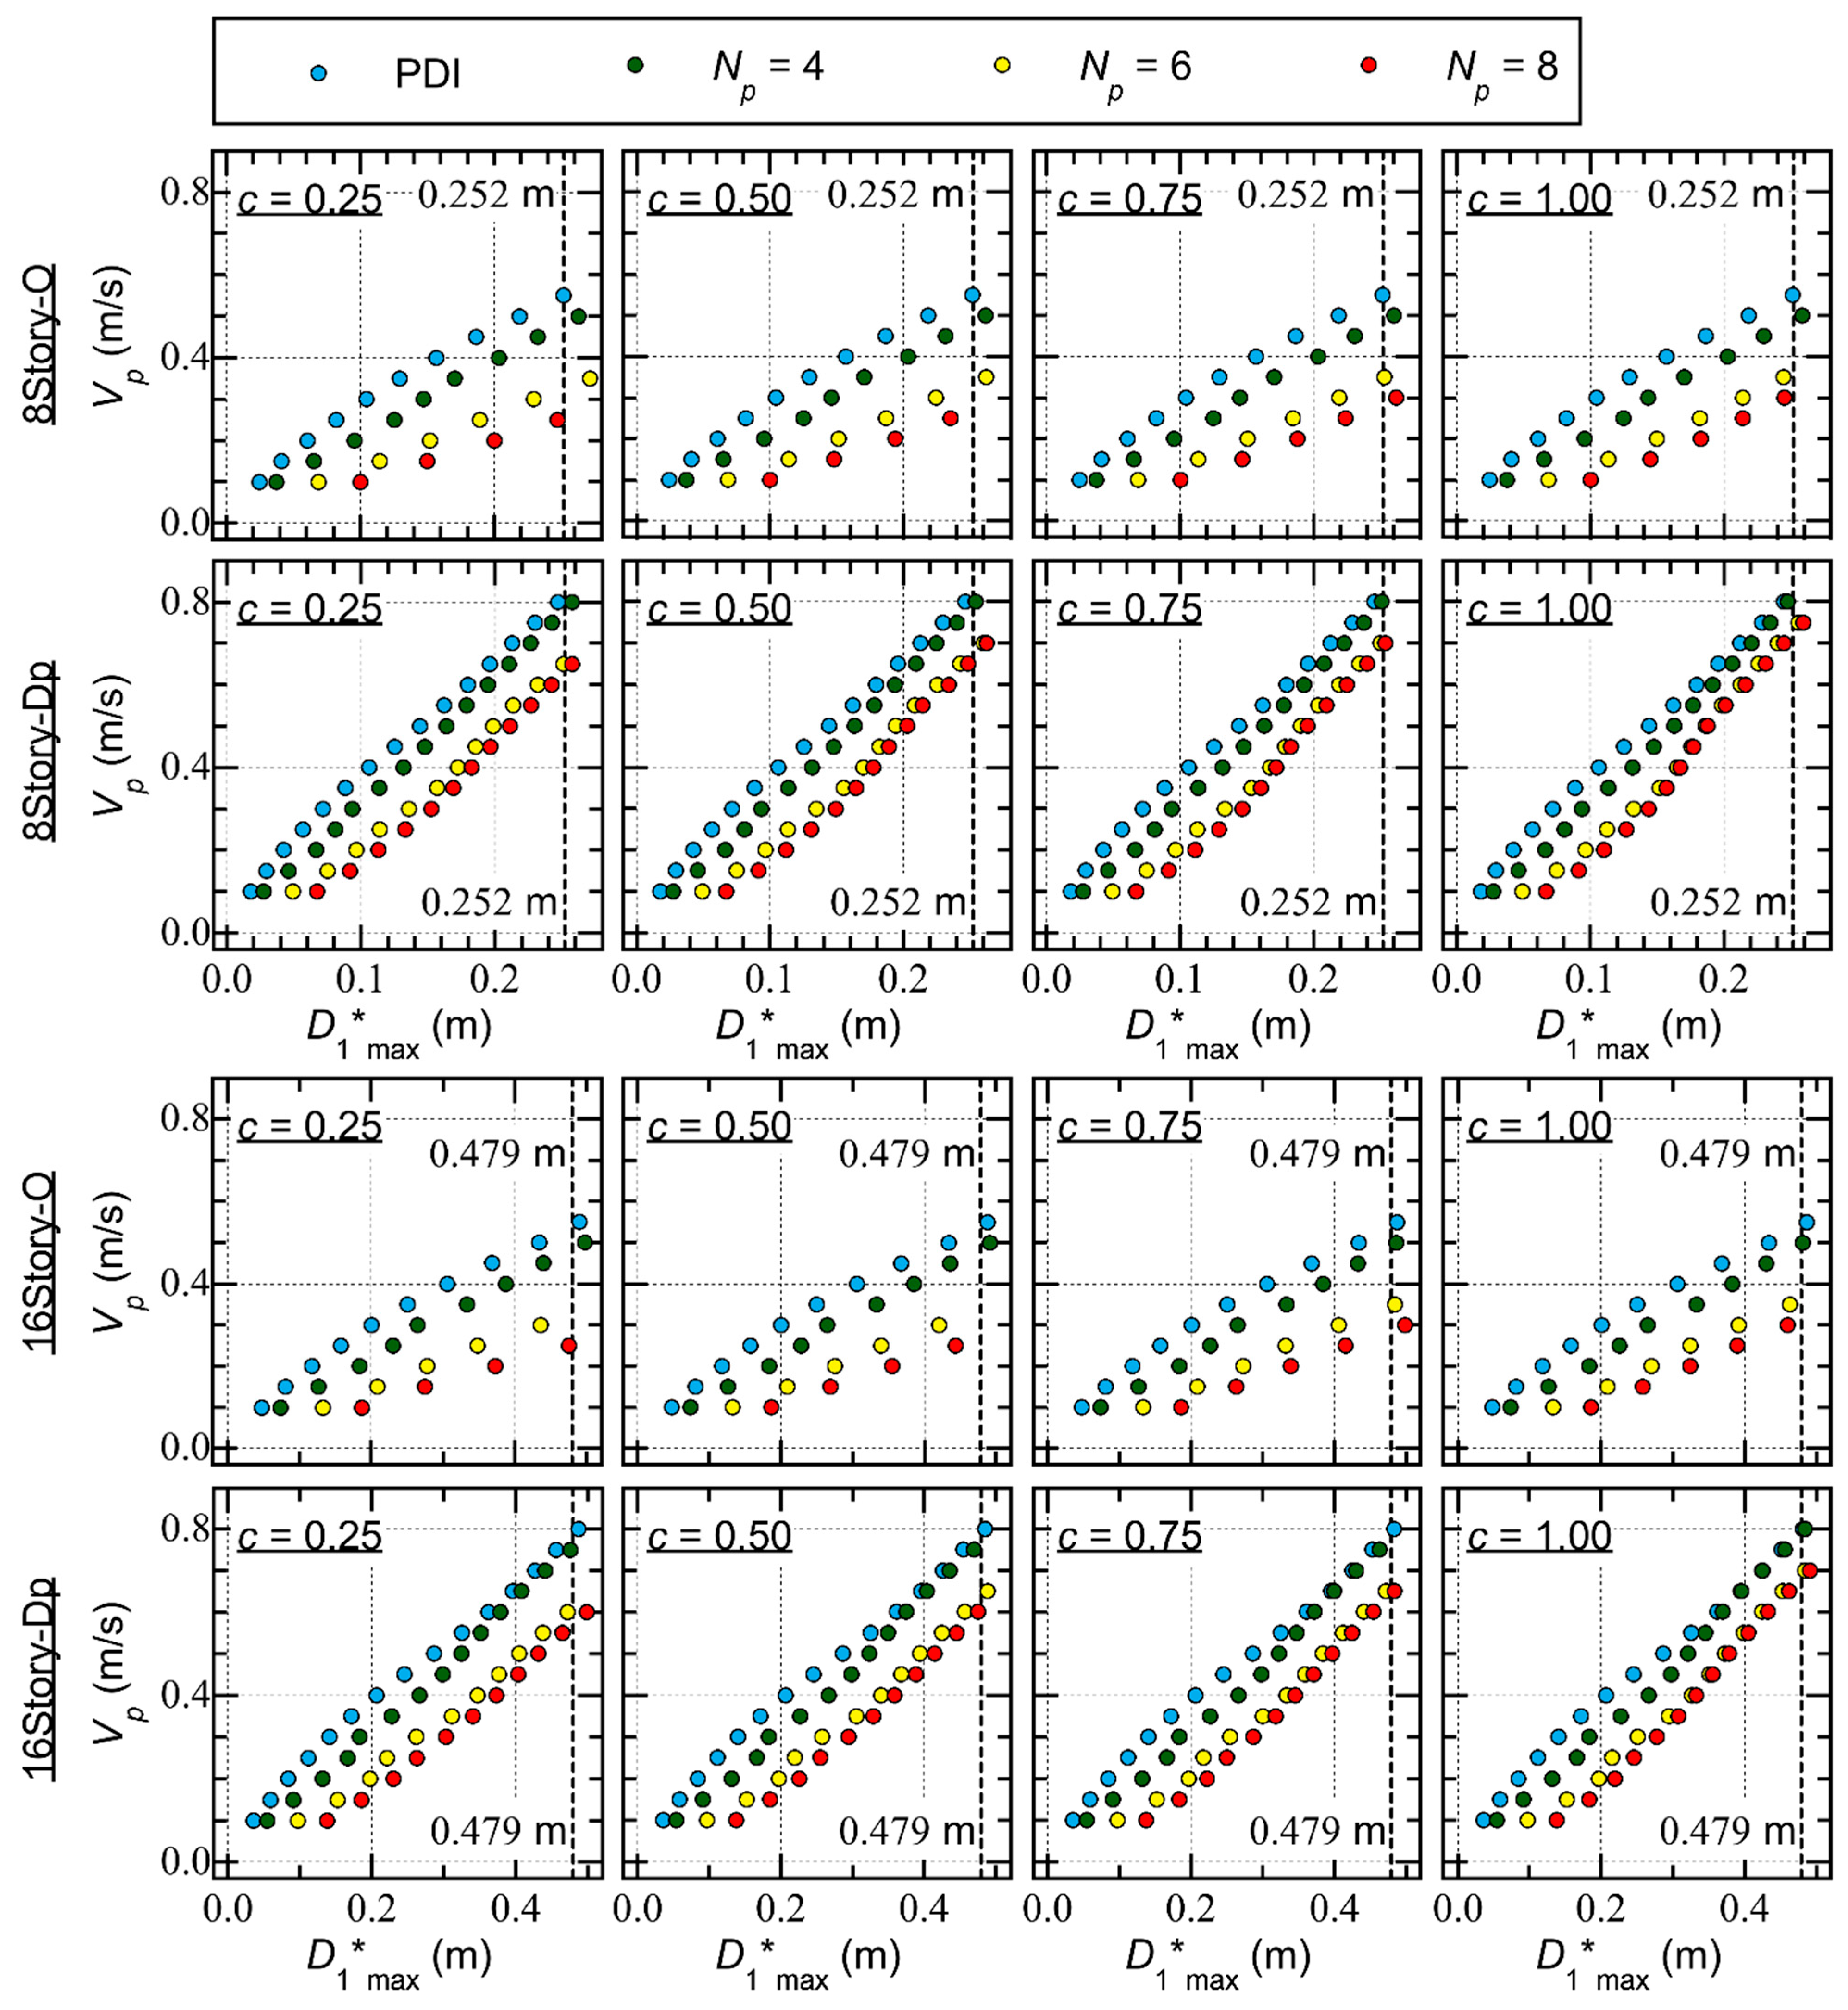
Figure 5 compares the relationship between the pulse velocity () and the peak equivalent displacement (). The following conclusions can be drawn.
- The peak equivalent displacement () increases as the pulse velocity () increases. For the same value of , the obtained by PDI is smaller than that obtained by PMI ( = 4, 6, and 8).
- For Type O, the increase in as a result of the increase in is significant. This trend is more pronounced when the pinching behavior of the RC members is significant. Comparing of 8story-O with = 0.25 m/s and = 0.25 (significant pinching), is 0.082 m when = 2 (PDI) and 0.247 m when = 8. Similar observations can be mabe for 16story-O.
- For Type Dp, however, the increase in as a result of the increase in is less significant than for Type O. Comparing of 8story-Dp, considering = 0.65 m/s and = 0.25 (significant pinching), is 0.196 m when = 2 (PDI) and 0.258 m when = 8. Similar observations can be made for 16story-Dp.
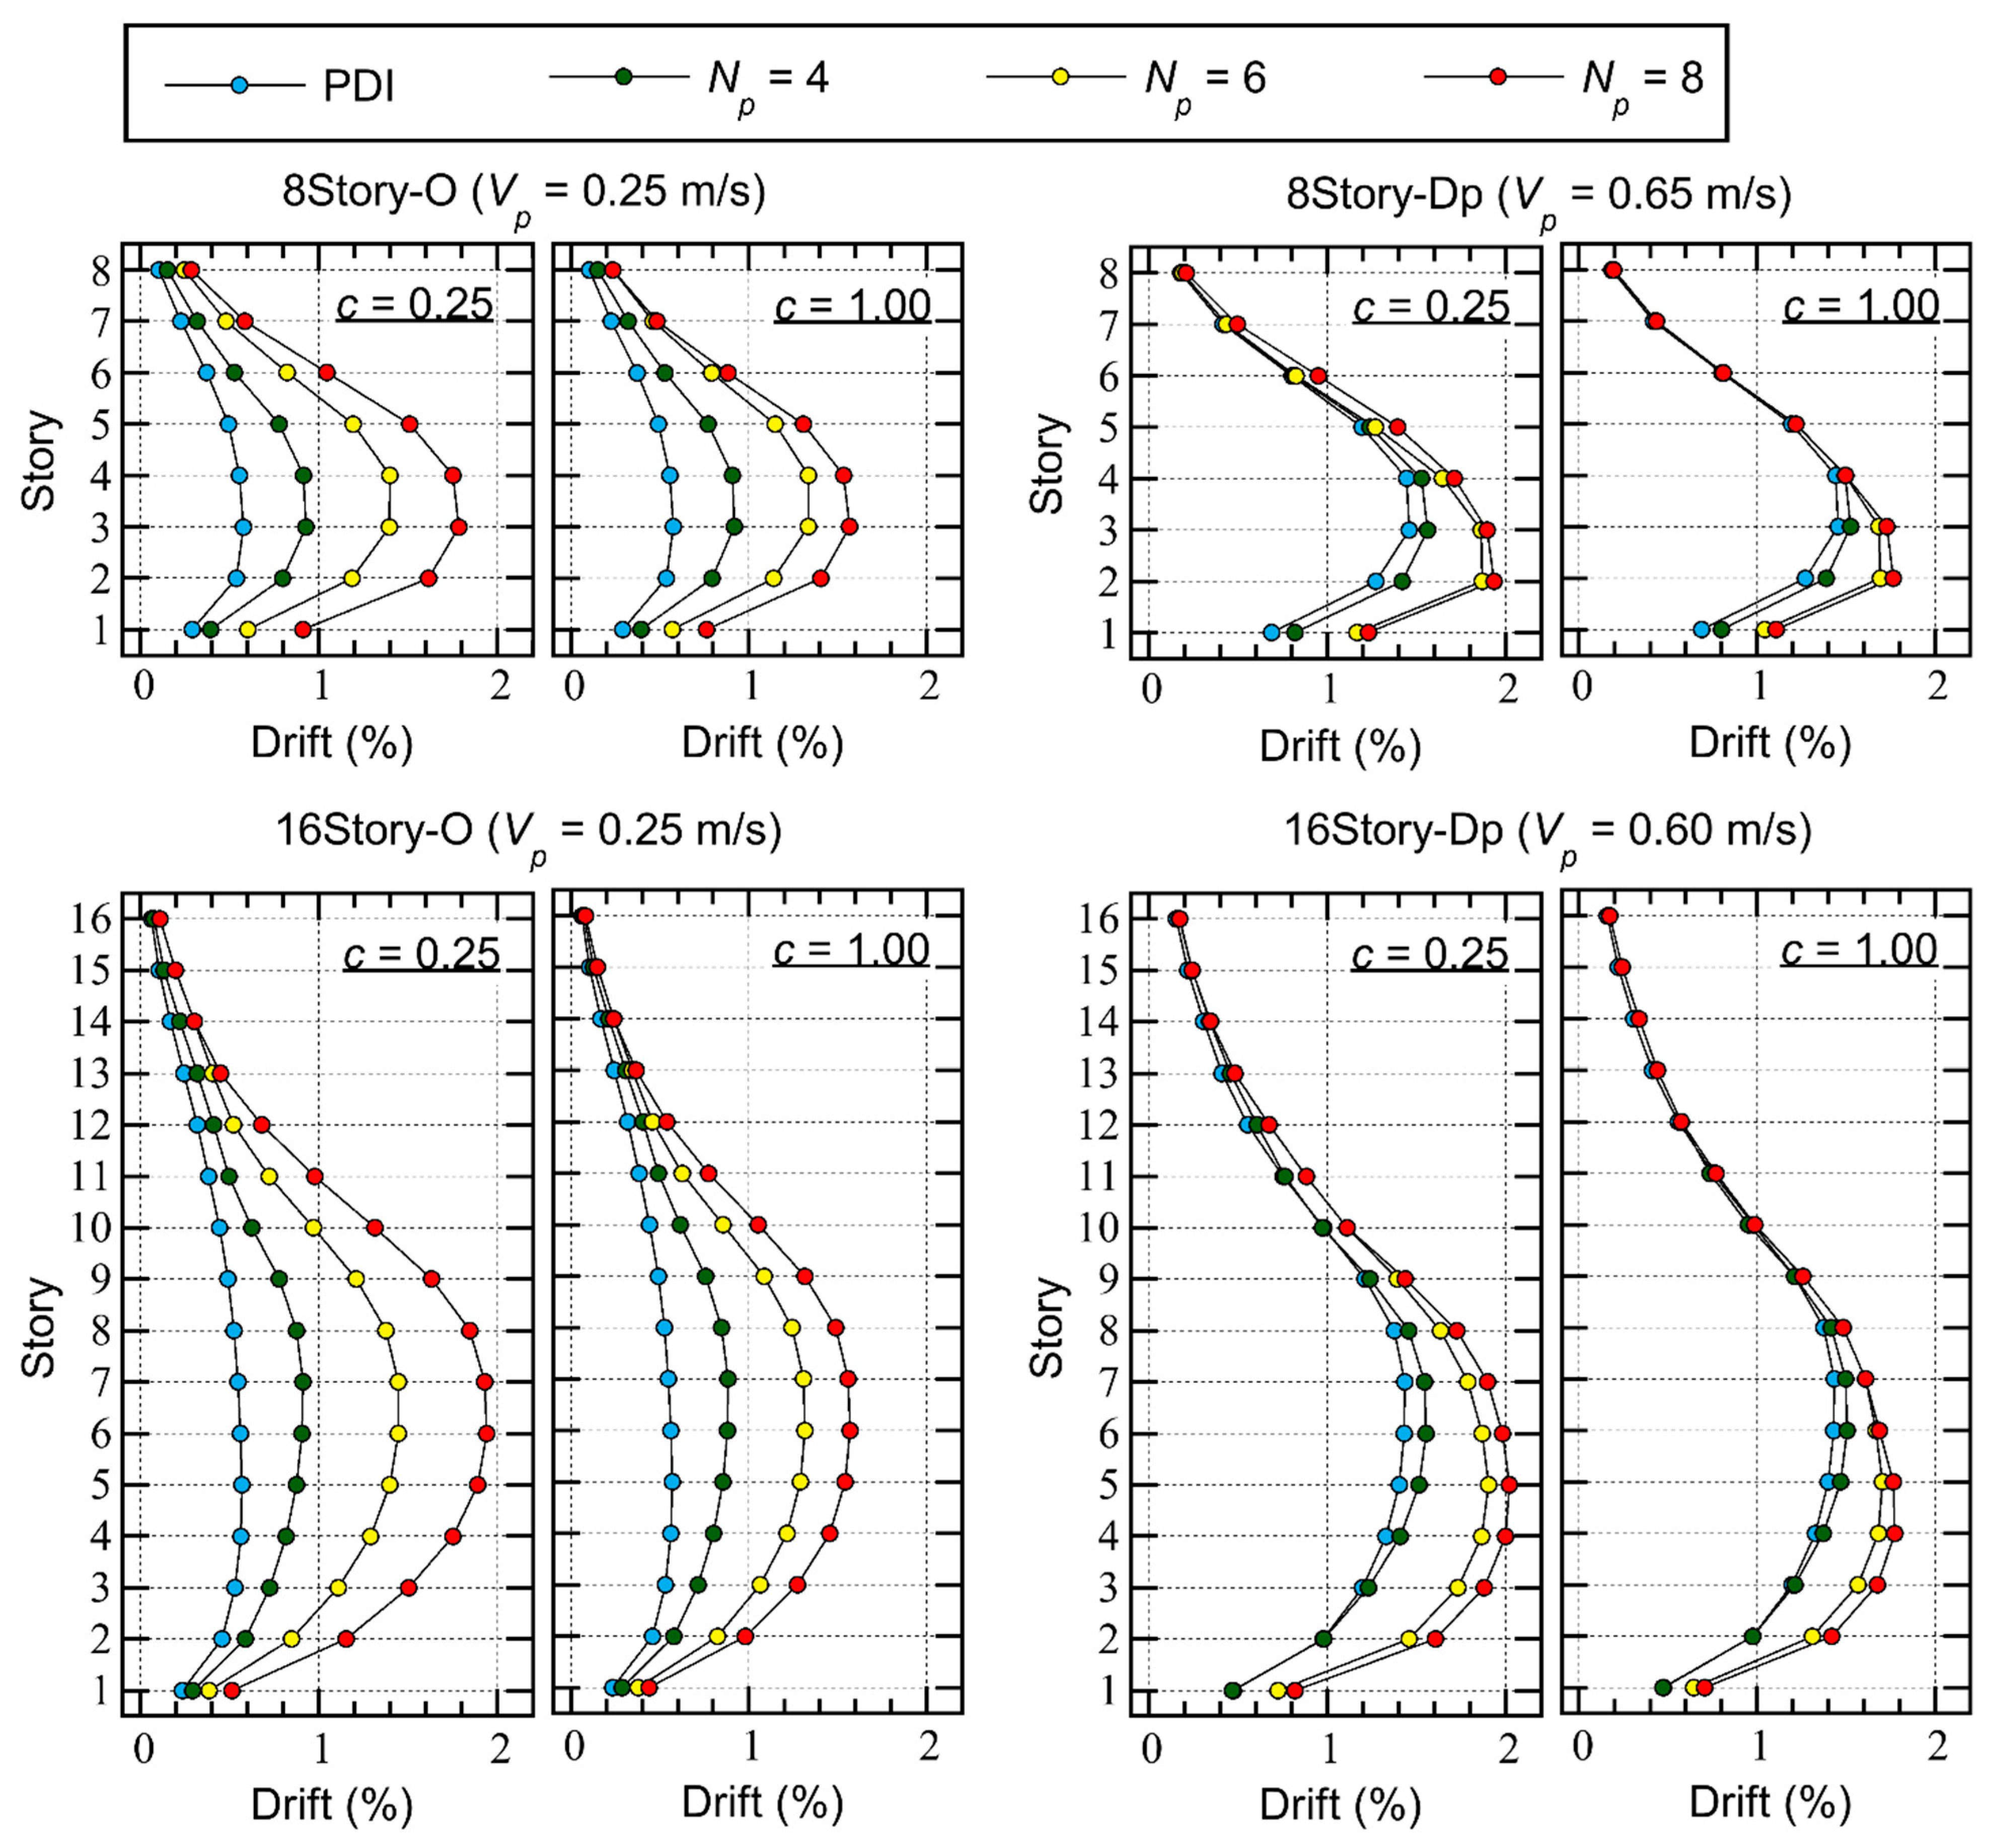
Figure 6 compares the peak story drift. Here, the cases = 0.25 (significant pinching) and = 1.00 (perfectly non-pinching) are selected.
The following conclusions can be drawn from Figure 6.

- For Type O, the increase in the peak story resulting from the increase in is significant, as observed in the trend of . This trend is more pronounced when the pinching behavior of the RC members is significant. Comparing the largest peak story drift of 8story-O, considering = 0.25 m/s and = 0.25 (significant pinching), the largest peak story drift is 0.577% (3rd story) when = 2 (PDI) and 1.78% (3rd story) when = 8. Meanwhile, considering = 0.25 m/s and = 1.00 (perfectly non-pinching), the largest peak story drift is 0.577% (3rd story) when = 2 (PDI) and 1.57% (3rd story) when = 8.
- For Type Dp, however, the increase in the peak story drift as a result of the increase in is less significant than for Type O. Comparing the largest peak story drift of 8story-Dp, considering = 0.65 m/s and = 0.25 (significant pinching), the largest peak story drift is 1.46% (3rd story) when = 2 (PDI) and 1.94% (2nd story) when = 8. Meanwhile, considering = 0.65 m/s and = 1.00 (perfectly non-pinching), the largest peak story drift is 1.46% (3rd story) when = 2 (PDI) and 1.77% (2nd story) when = 8. Similar observations can be made for 16story-Dp.
4.2. Hysteresis Loop and Residual Displacement
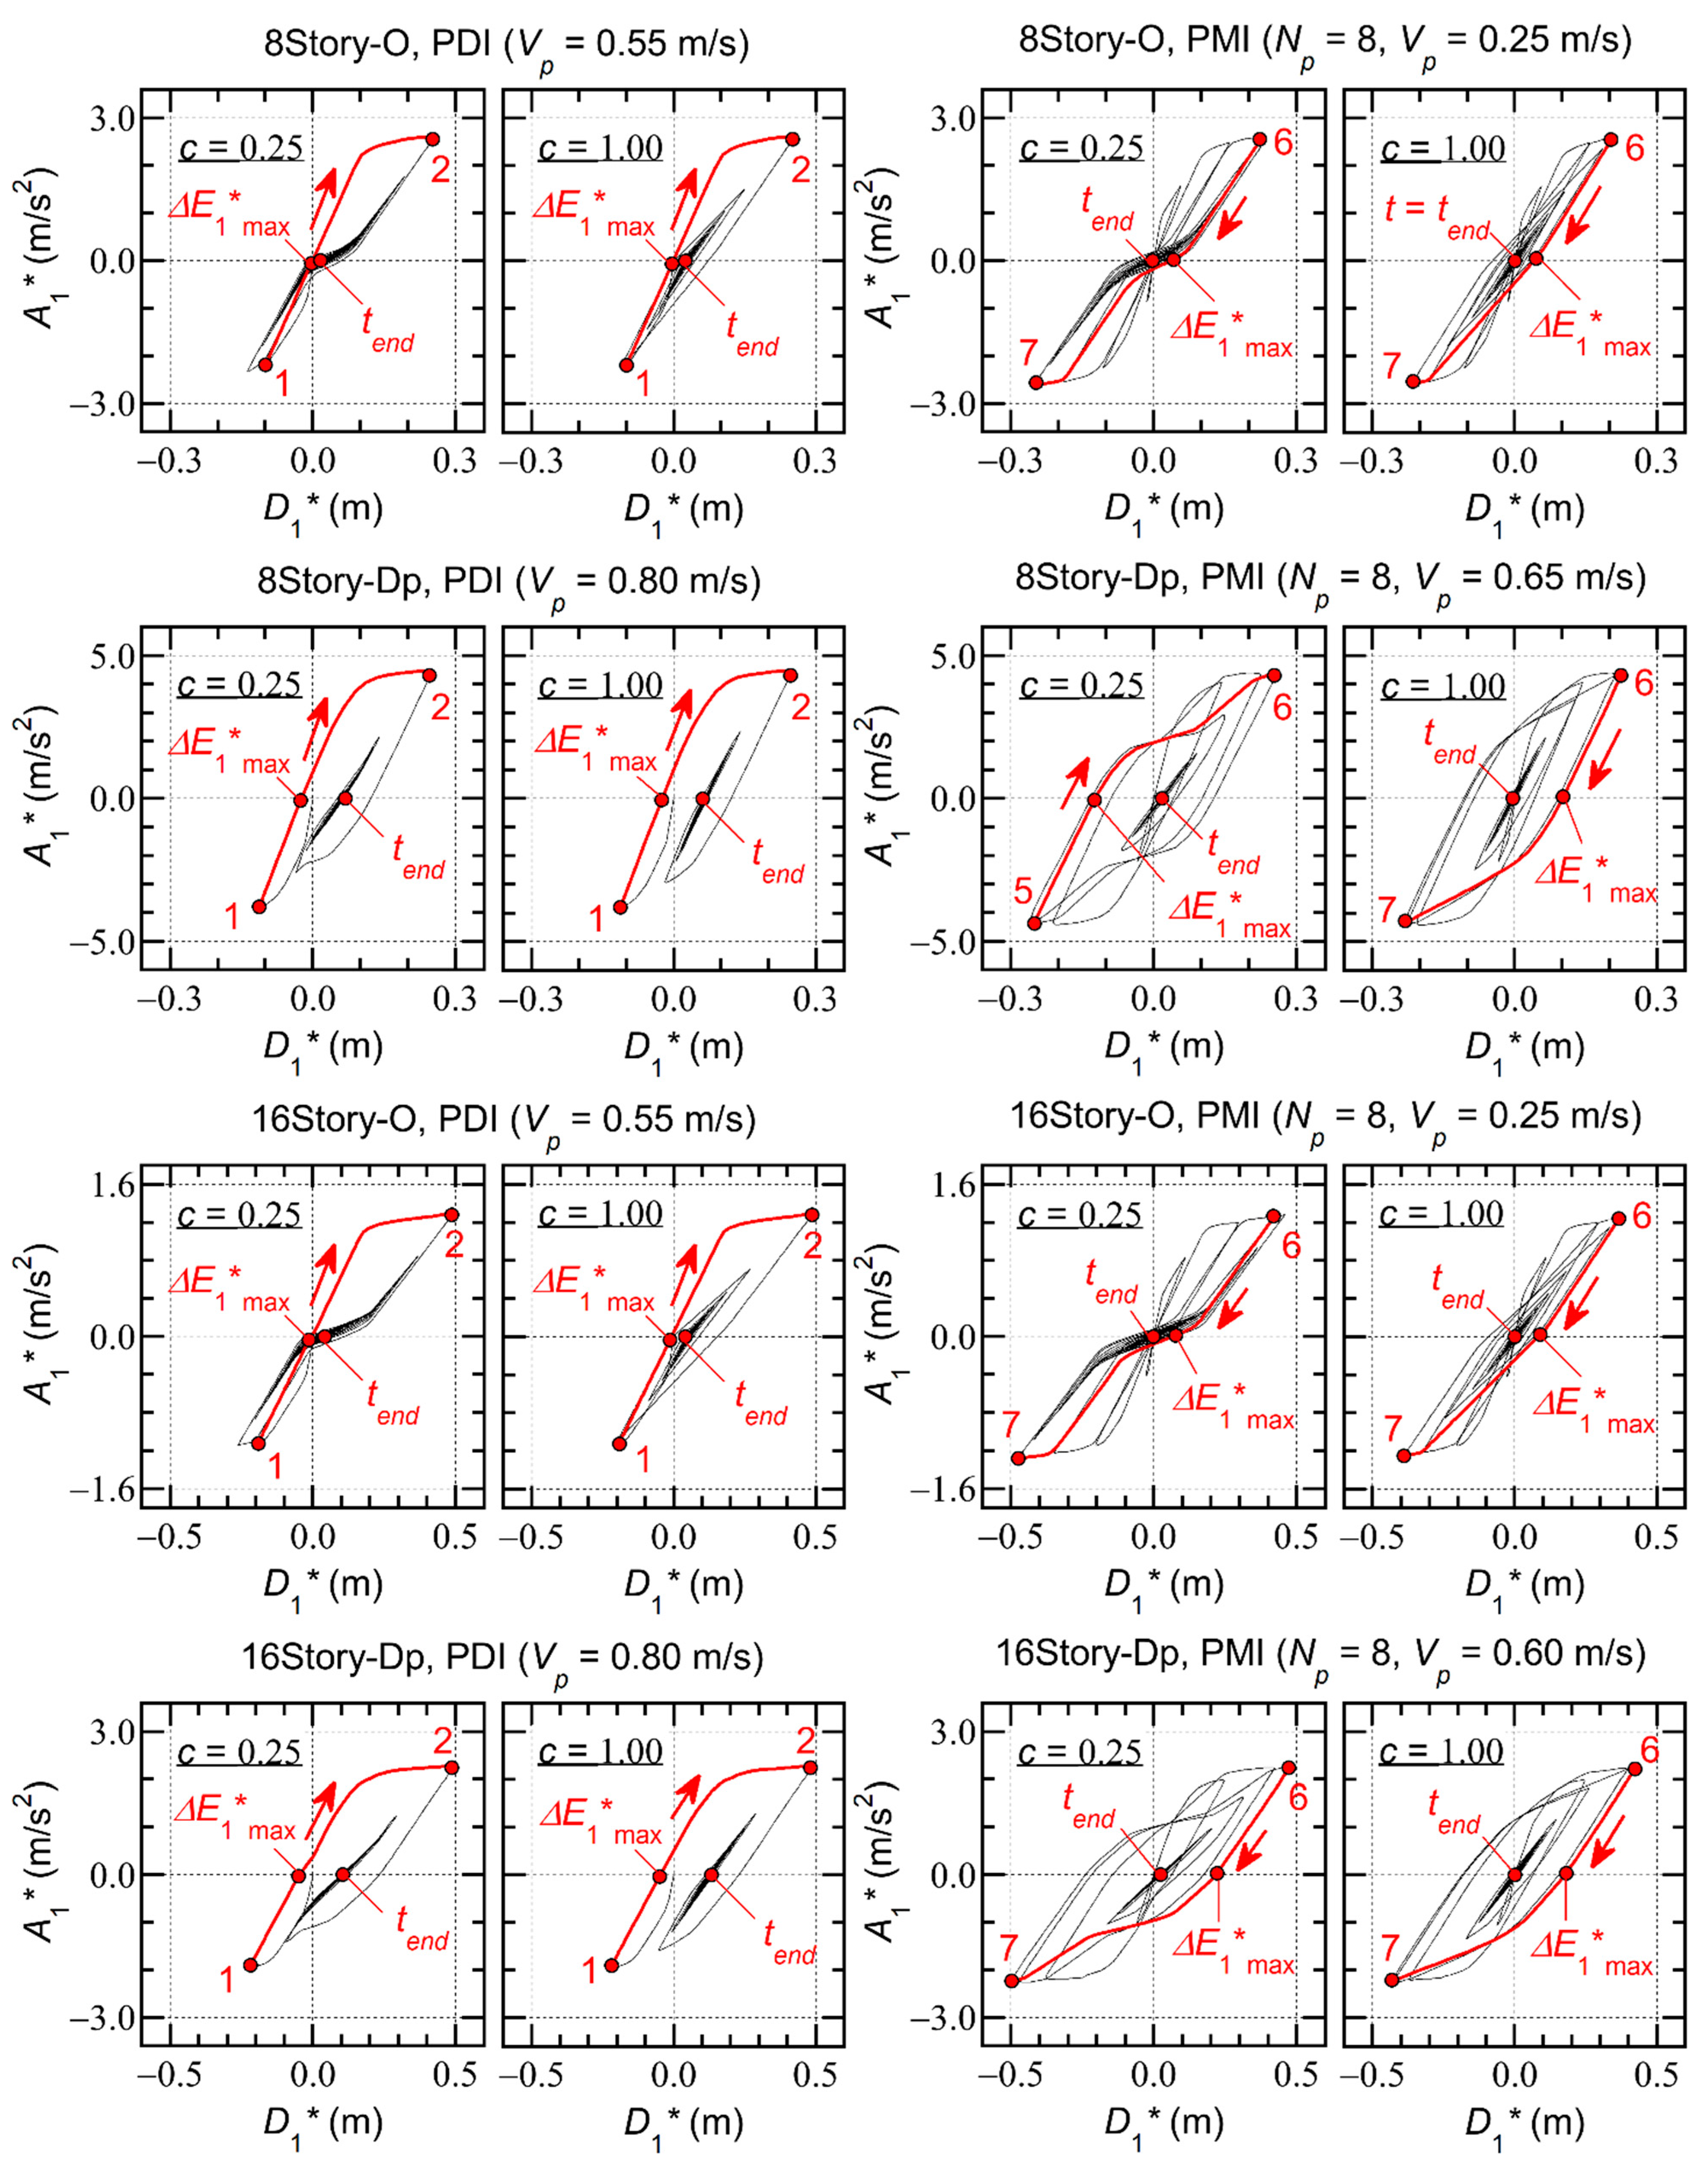
Figure 7 shows the hysteresis loops of the first modal response (− relationship) for each model. The hysteresis loops obtained from the critical PDI analysis ( = 2) and critical PMI analysis ( = 8) are shown in this figure; the hysteresis loops for = 0.25 (significant pinching) and = 1.00 (perfectly non-pinching) are compared. In Figure 7, the beginning and ending points of the half cycle of the structural response when the maximum momentary input energy per unit mass () occurs is shown by the red curve. The numbers in the figure indicate the number of the local peak. The points at which the pseudo impulsive lateral force acts () and the point at the end of the simulation () are also shown.
The following conclusions can be drawn from Figure 7.
- In the critical PDI analysis results ( = 2), the difference in the half cycle of the structural response resulting from the pinching behavior is negligibly small. The displacement response is larger in positive directions than in negative directions. A notable residual equiavalent displacement at = is observed, especially for Type Dp.
- In the critical PMI analysis results ( = 8), the difference in the half cycle of the structural response resulting from the pinching behavior is noticeable. In the case of = 0.25 (significant pinching), the pinching behavior in the half cycle of the structural response is clearly observed for both Types O and Dp. The displacement response is almost symmetric in the positive and negative directions. The residual equivalent displacement is negligibly small for both Types O and Dp.
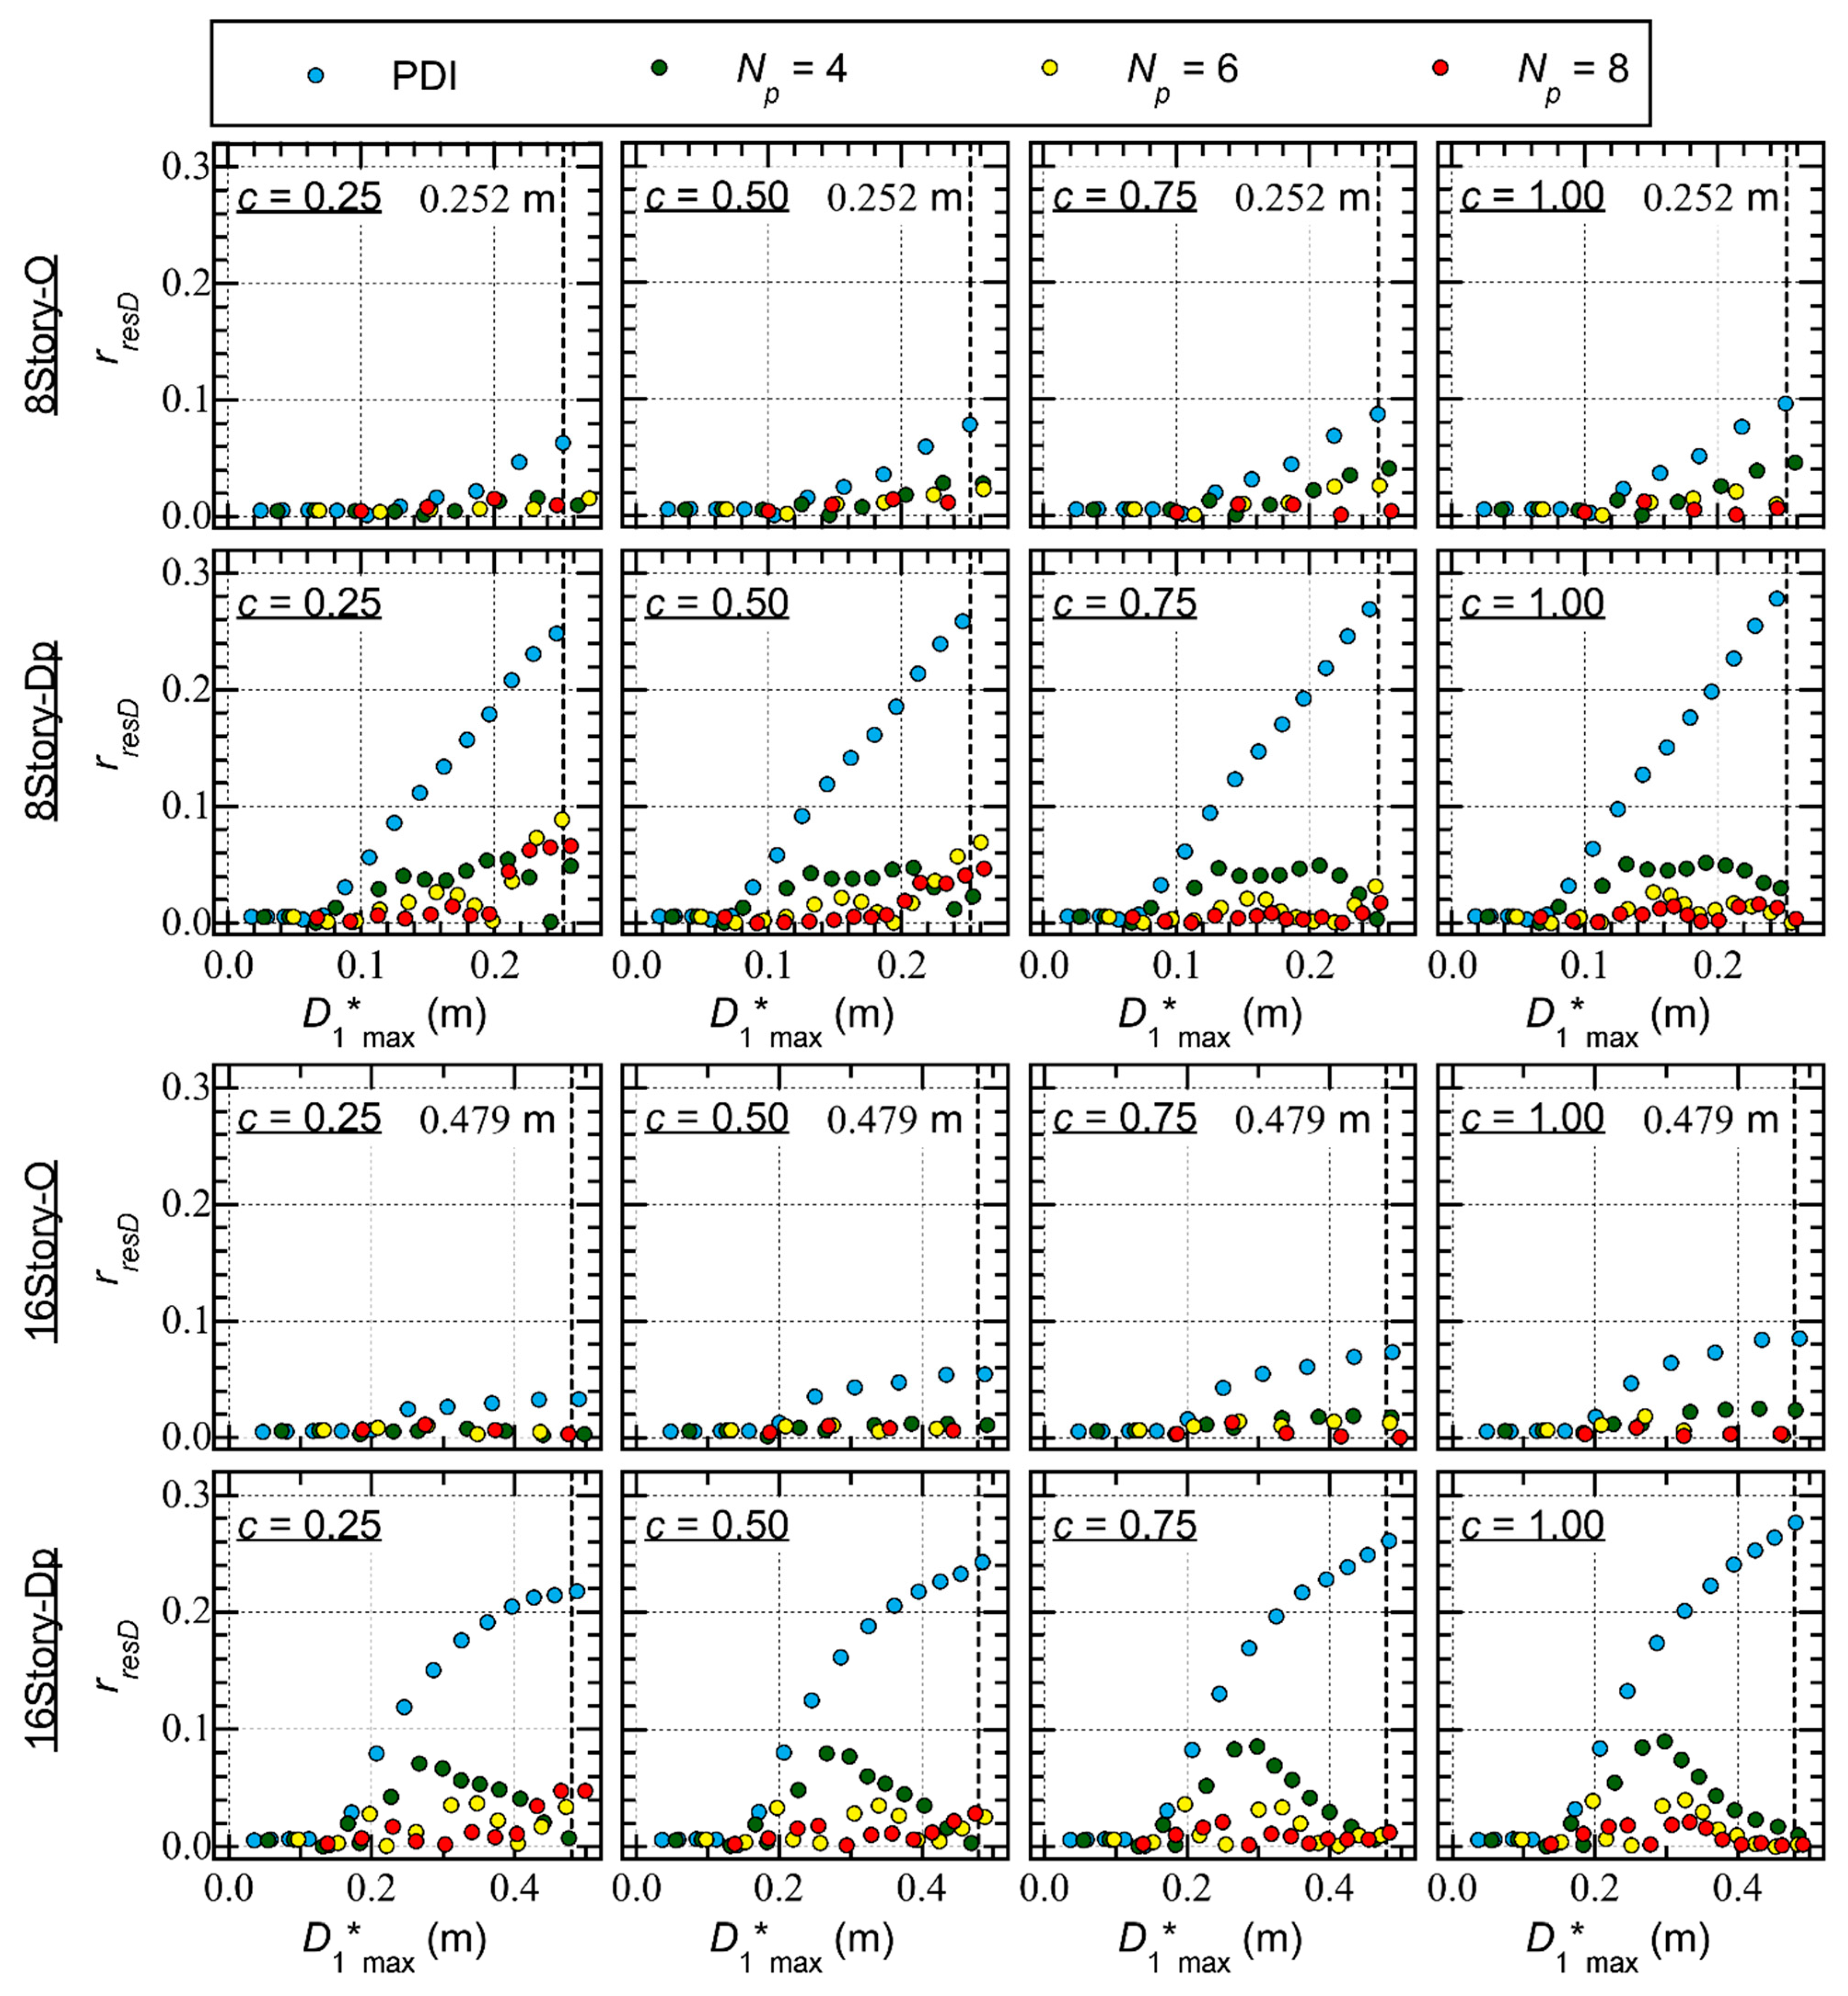
Figure 8 shows the residual equivalent displacement ratio (). Here, the ratio is defined as shown in Eq. (33):
The following conclusions can be drawn from Figure 8.
- For Type O, is smaller than 0.1. The ratio is largest in the critical PDI analysis ( = 2), and increases as increases. However in the critical PMI analysis, is small and no regular trend is observed between and : the ratio may decrease when increases.
- For Type Dp, the ratio increases as increases in the critical PDI analysis ( = 2) and the ratio may be larger than 0.2. The ratio is larger when the parameter is larger (pinching behavior is not significant). However, in the critical PMI analysis, the ratio is smaller than 0.1. In addition, no regular trend is observed between and : the ratio may decrease when increases.
4.3. Cumulative Strain Energy
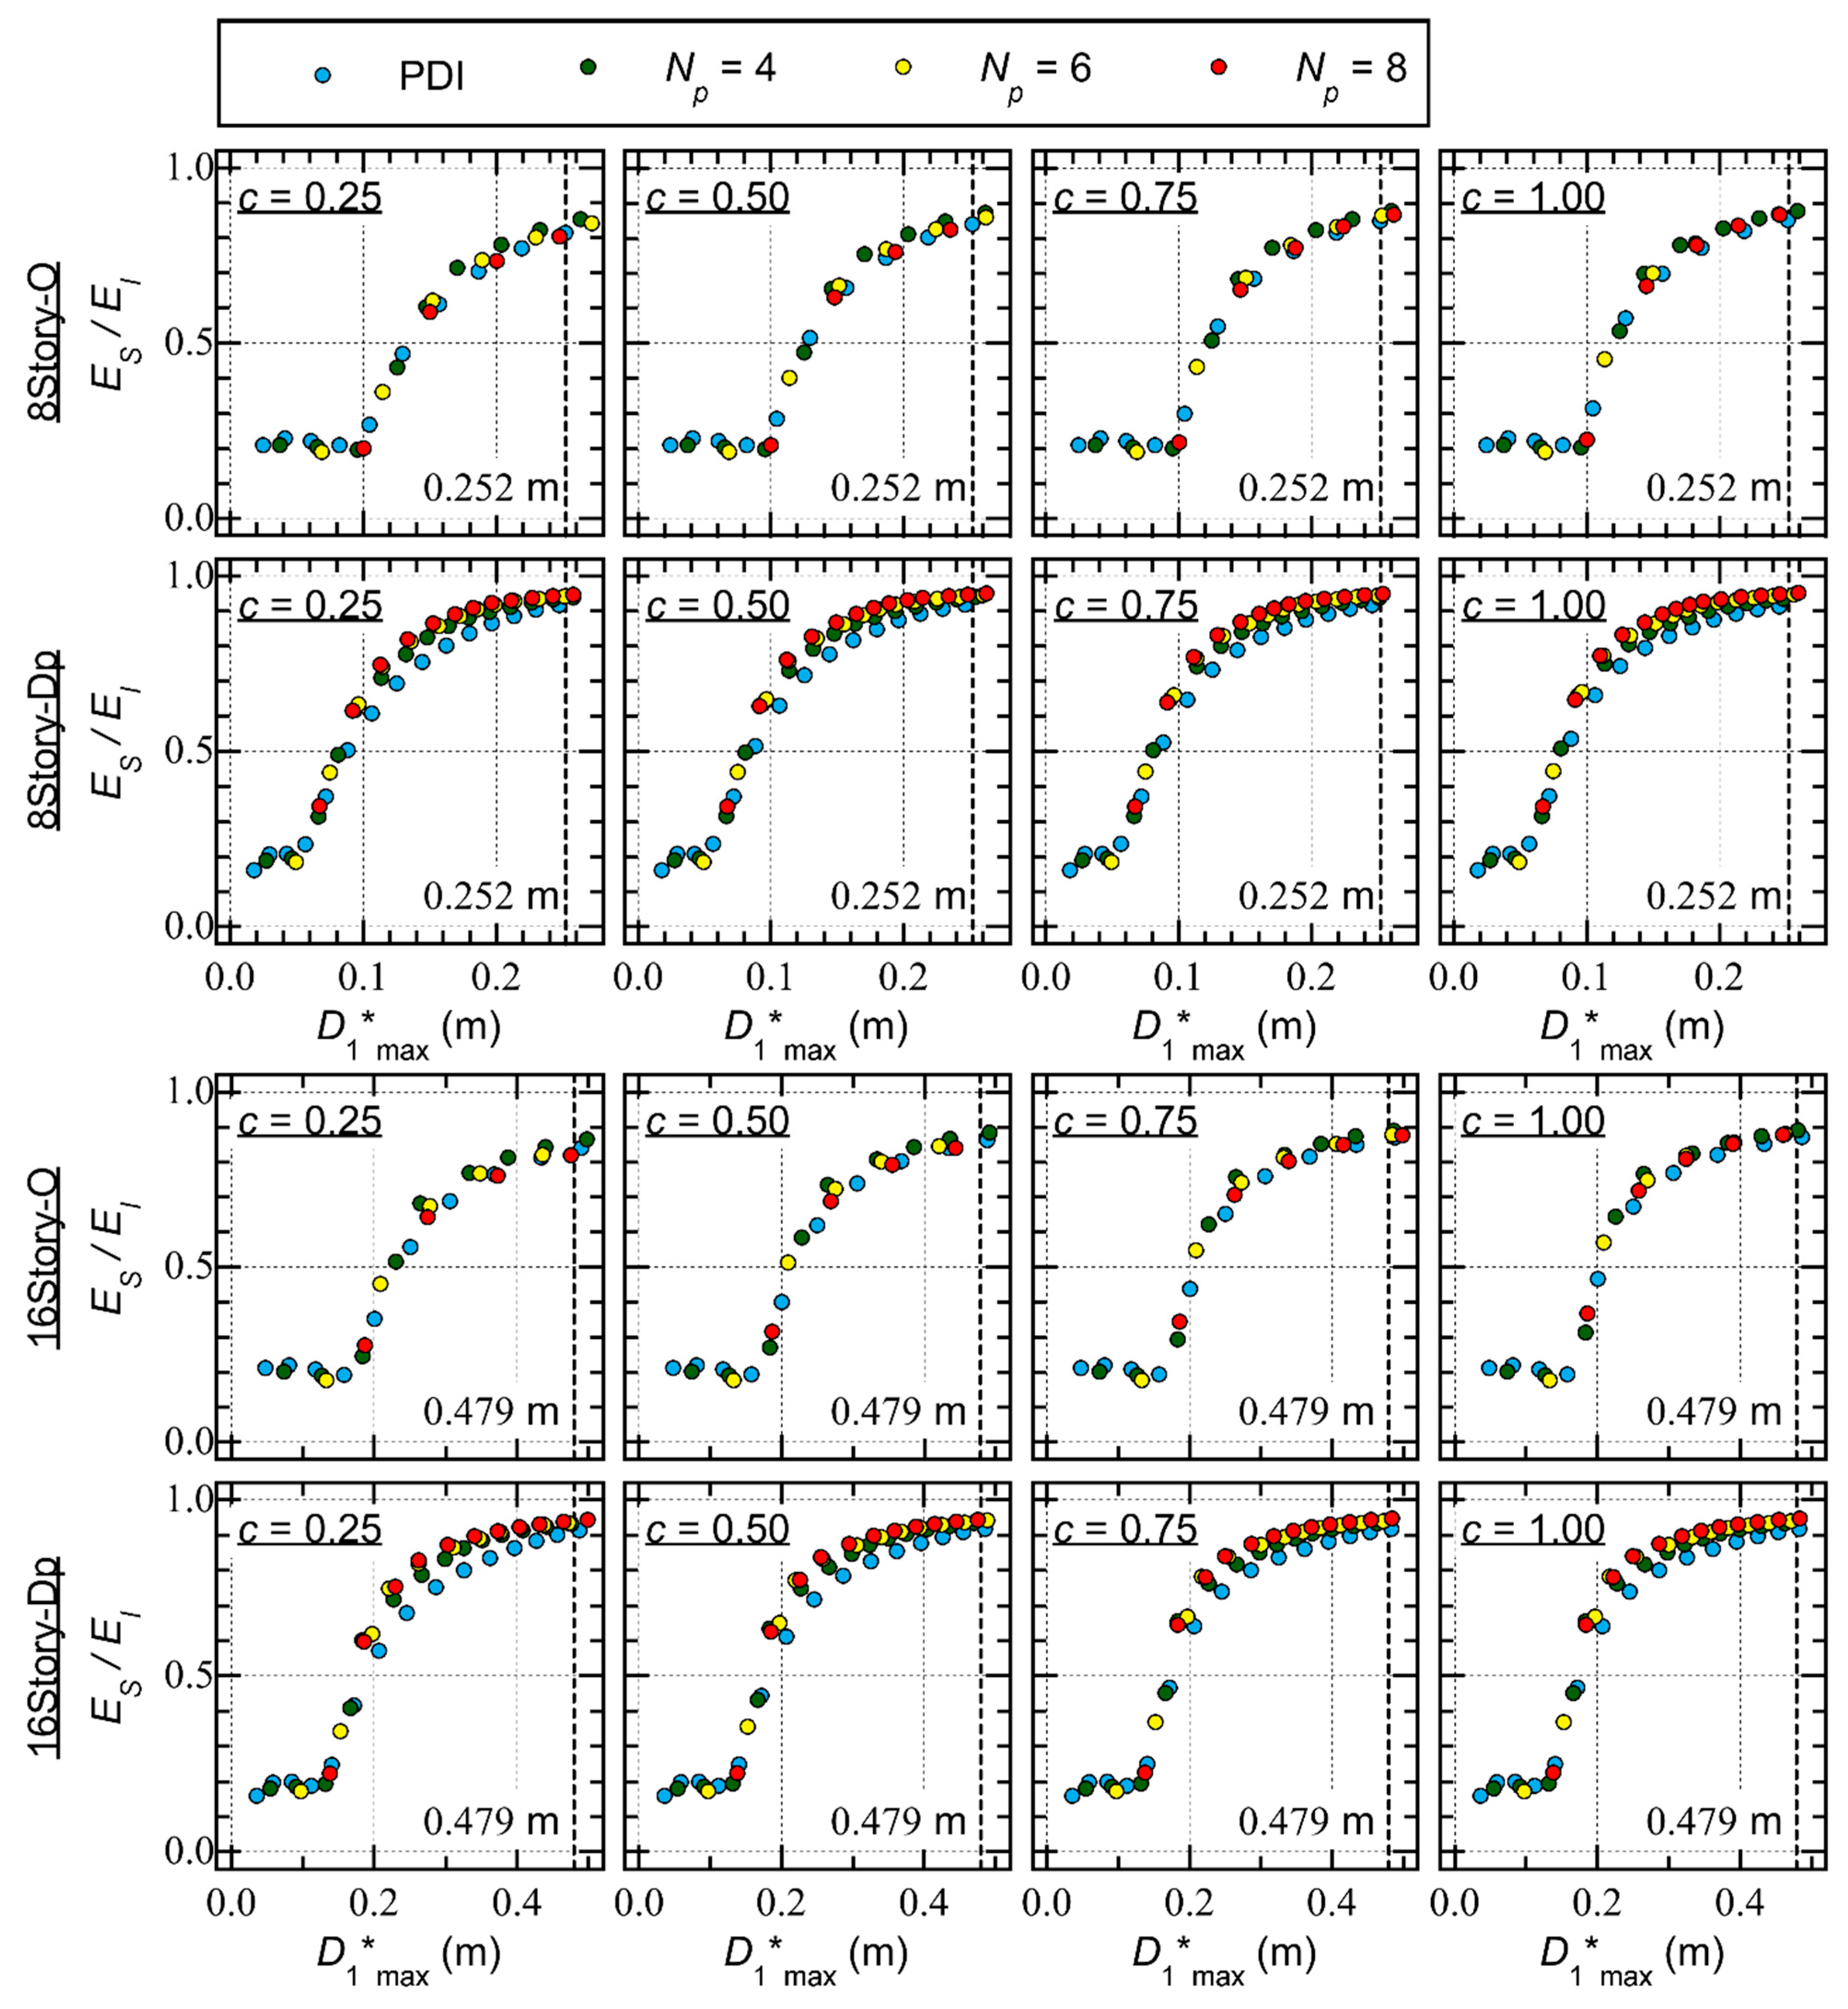
Figure 9 compares the ratios of the cumulative strain energy of the entire frame model () at the end of the simulation.
For Type O, the following conclusions can be drawn from Figure 9.
- For 8story-O, the ratio is close to 0.2 when is less than 0.1 m. The ratio increases as increases when is larger than 0.1 m. When is close to 0.25 m, is between 0.8 and 0.9.
- For 16story-O, the ratio increases as increases when is larger than 0.2 m. When is larger than 0.4 m, is between 0.8 and 0.9.
- The difference in the ratio resulting from the difference in is negligible.
In addition, the following conclusions can be drawn from Figure 9 for Type Dp.
- The ratio increases rapidly as increases. For 8story-Dp, the ratio reaches 0.9 when is larger than 0.2 m. Meanwhile, for 16story-Dp, the ratio reaches 0.9 when is larger than 0.4 m.
- In the PMI analysis results ( ≥ 4), the ratio is larger than that obtained from the PDI analysis results ( = 2).
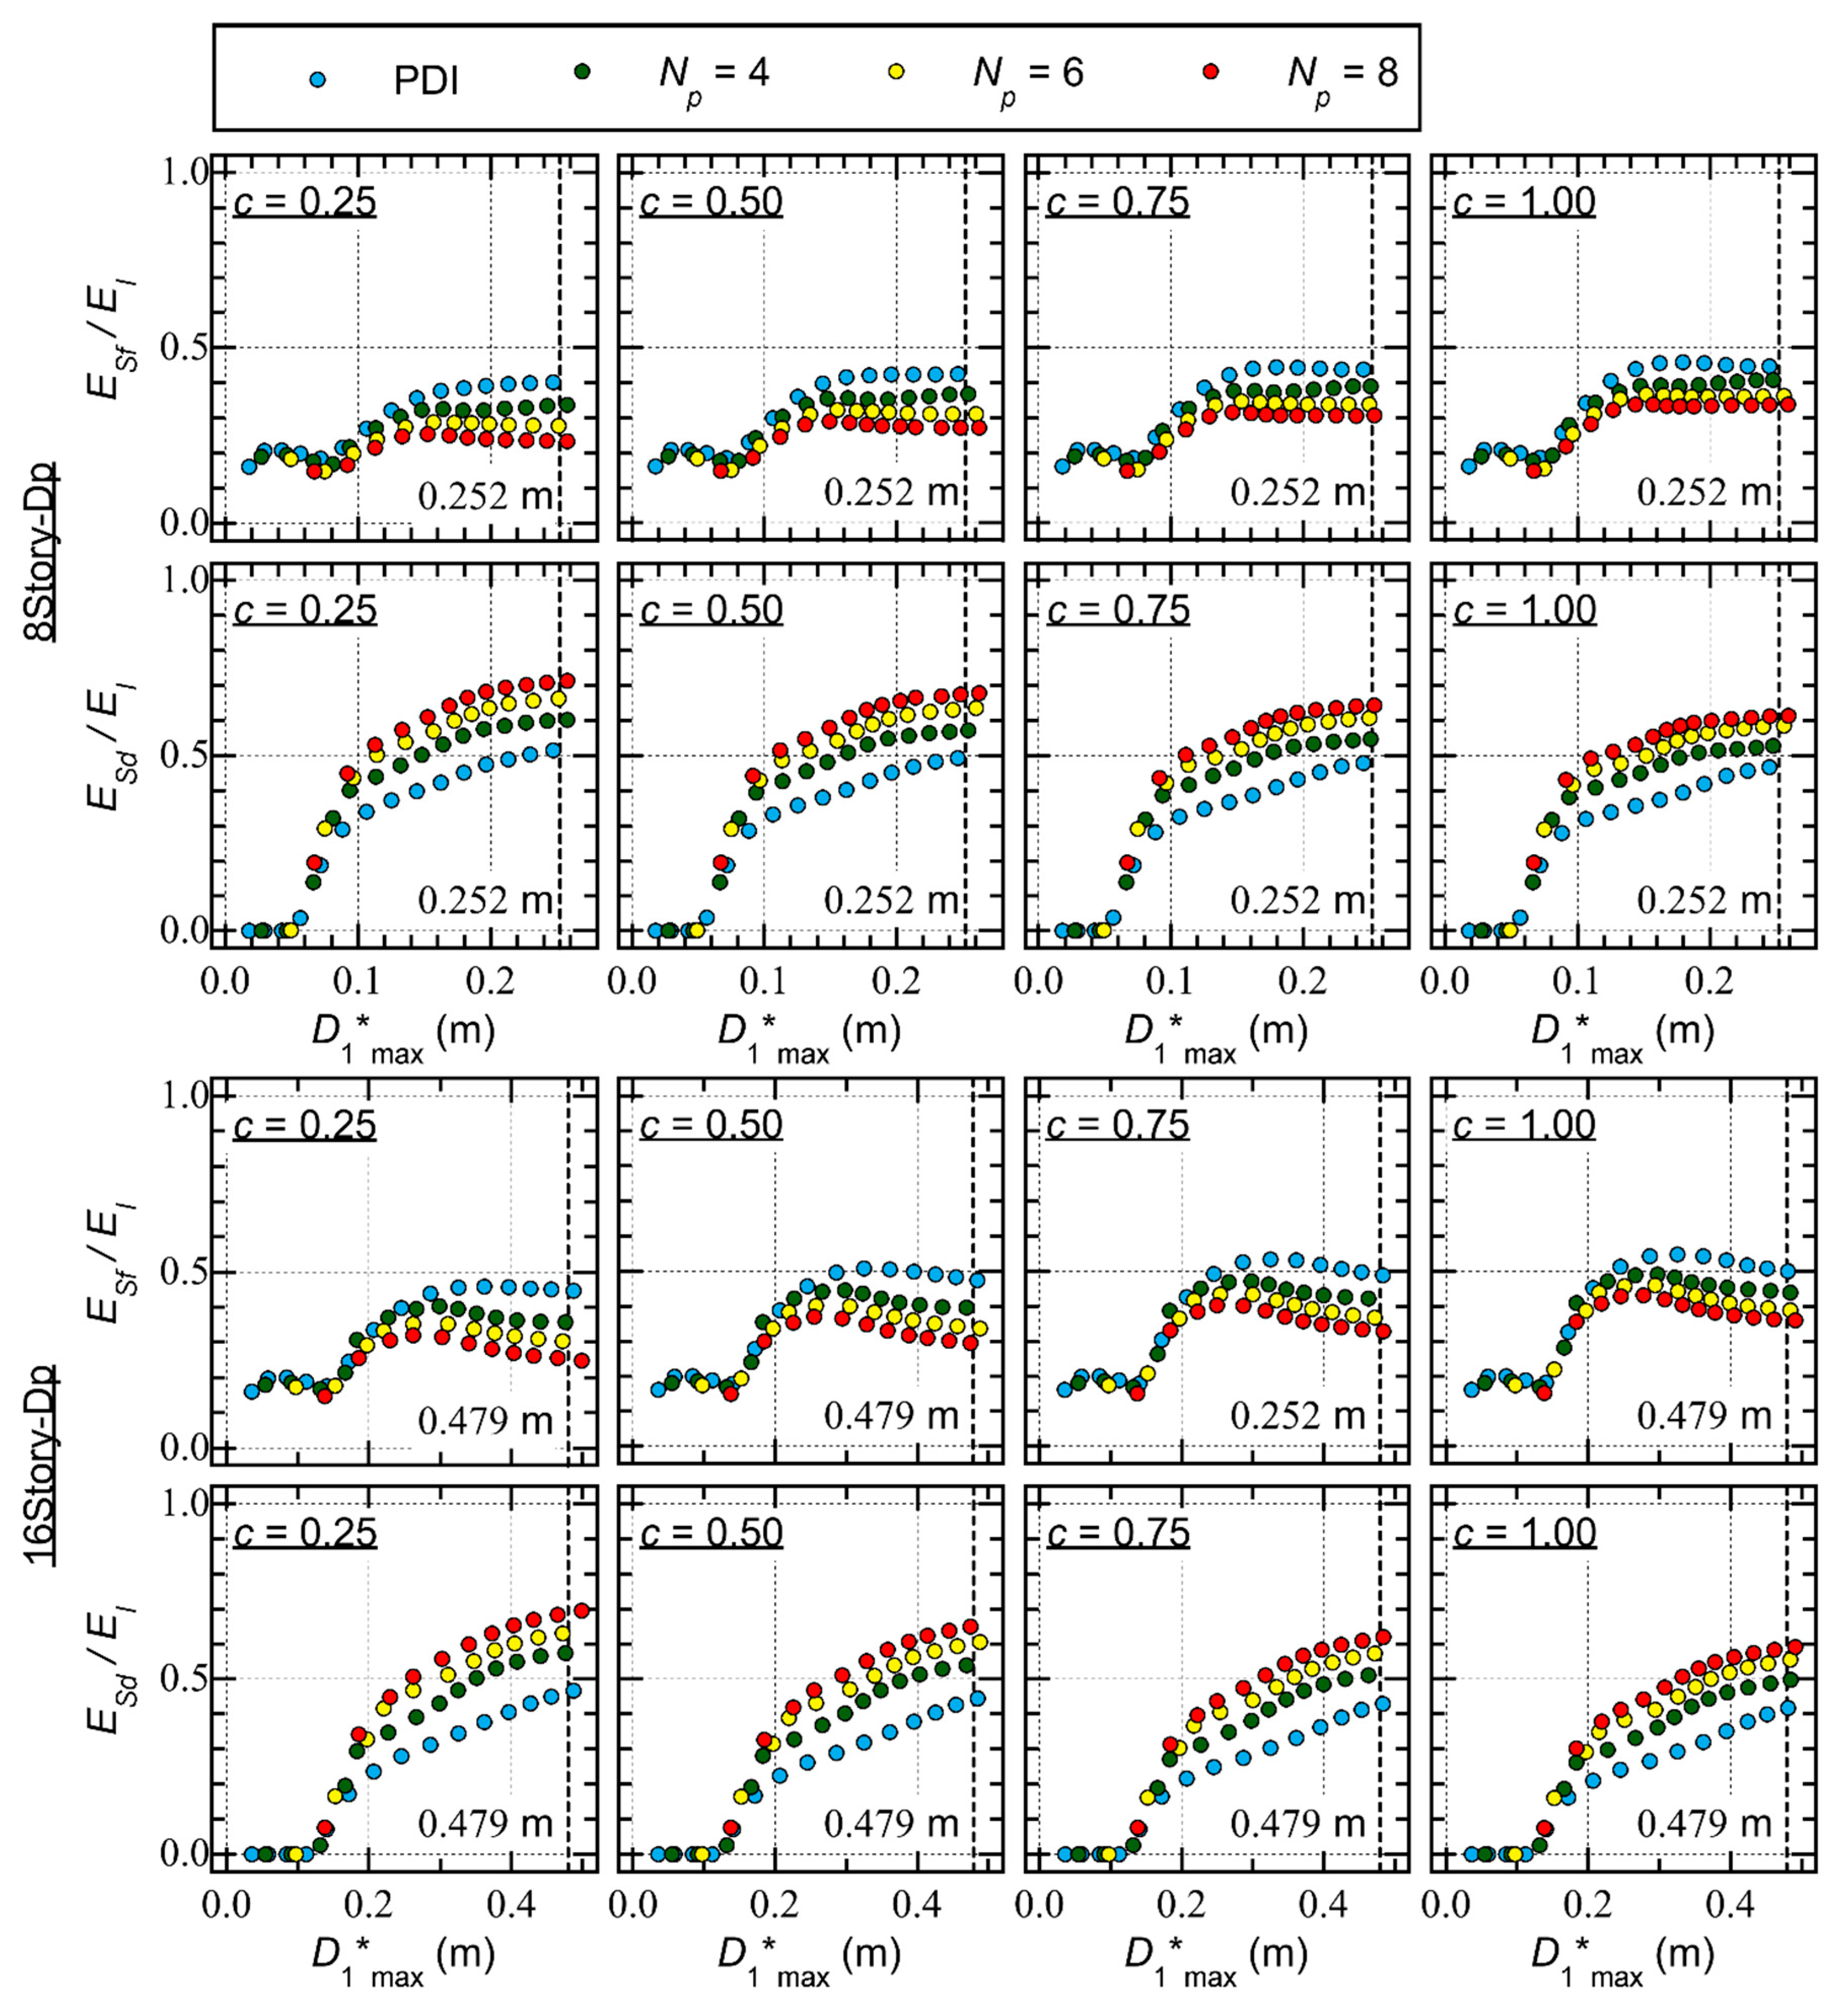
Next, the discussion focuses on the cumulative strain energy ratio of the RC MRF () and the cumulative strain energy ratio of the SDCs () for Type Dp models. Figure 10 compares the ratios and .
For 8story-Dp, the following conclusions can be drawn from Figure 10.
- The ratio is close to 0.2 when is less than 0.1 m. When is larger than 0.1 m, increases as increases. However, decreases as increases. This trend is pronounced when the parameter is small (the pinching behavior is significant).
- The ratio is negligibly small when is less than 0.06 m. The ratio increases rapidly as increases. The ratio increases as increases. This trend is pronounced when the parameter is small.
In addition, the following conclusions can be drawn from Figure 10 for 16story-Dp.
- The ratio is close to 0.2 when is less than 0.15 m. When is larger than 0.15 m, increases as increases. However, decreases as increases. Considering = 0.25, the ratio is 0.447 when is 0.487 m in the PDI analysis results ( = 2). Conversely, the ratio is 0.248 when is 0.498 m in the PMI analysis results ( = 8).
- The ratio is negligibly small when is less than 0.1 m. The ratio increases rapidly as increases. The ratio increases as increases. Considering = 0.25, the ratio is 0.466 when is 0.487 m in the PDI analysis results ( = 2). Conversely, the ratio is 0.695 when is 0.498 m in the PMI analysis results ( = 8).
4.4. Summary of the Analysis Results
This section summarizes the responses of the RC MRF models with and without SDCs as obtained from the critical PMI analysis results.
- A)
- The influence of the number of pseudo impulsive lateral forces () on the – relationship is significant in the case of RC MRFs without SDCs (Type O). For the same value of , the increases as increases. This trend is pronounced when the pinching behaviour is siginificant. In cases of RC MRFs with SDCs (Type Dp), increases as increases; however, this trend is less pronounced than that observed in the RC MRFs without SDCs. The influence of the pinching behavior of the RC MRFs on the – relationship in the RC MRFs with SDCs is smaller than that in the RC MRFs without SDCs.
- B)
- In the PMI analysis results ( ≥ 4), the difference in the half cycle of the structural response resulting from the pinching behavior is more pronounced than that in the PDI analysis results ( = 2). Therefore, the influence of the pinching behavior of the RC members on the peak equivalent displacement () is more notable in PMI than in PDI.
- C)
- The residual displacement obtained from the PMI analysis results is smaller than that obtained from the PDI analysis results ( = 2). This difference is significant in the case of RC MRFs with SDCs.
- D)
- The ratio of the cumulative strain energy of the entire frame model () at the end of the simulation is nearly independent of the number of pseudo impulsive lateral forces (), regardless of the presence or absense of SDCs. Meanwhile, the ratio of the cumulative strain energy of the RC MRFs () decreases and that of the SDCs () increases as increases in the RC MRFs with SDCs (Type Dp). This trend is pronounced when the pinching behavior of the RC members is significant.
5. Prediction of the Maximum Momentary Input Energy of RC MRFs
This section focuses on comparisons with the predicted results based on the study of Fujii and Shioda (2023) and the ICPMIA results. First, simplified equations for calculating the energy dissipation capacity during a half cycle of the structural response are formulated. Next, the seismic capacity curve (the − curve) is predicted using the pushover analysis results. Then, the predicted seismic capacity curve is compared with the − plot obtained from the ICPMIA results.
5.1. Simplified Equations for Calculating the Energy Dissipation Capacity during a Half Cycle of the Structural Response
It is assumed that the peak equivalent displacement of the first modal response () occurs when the maximum momentary energy input () occurs. Following Fujii and Shioda (2023), the energy dissipation capacity during a half cycle of the structural response is expressed as
In Eq. (34), and are the contributions from the hysteretic dissipated energies of the RC MRFs and SDCs, respectively, while is the contribution from viscous damping.
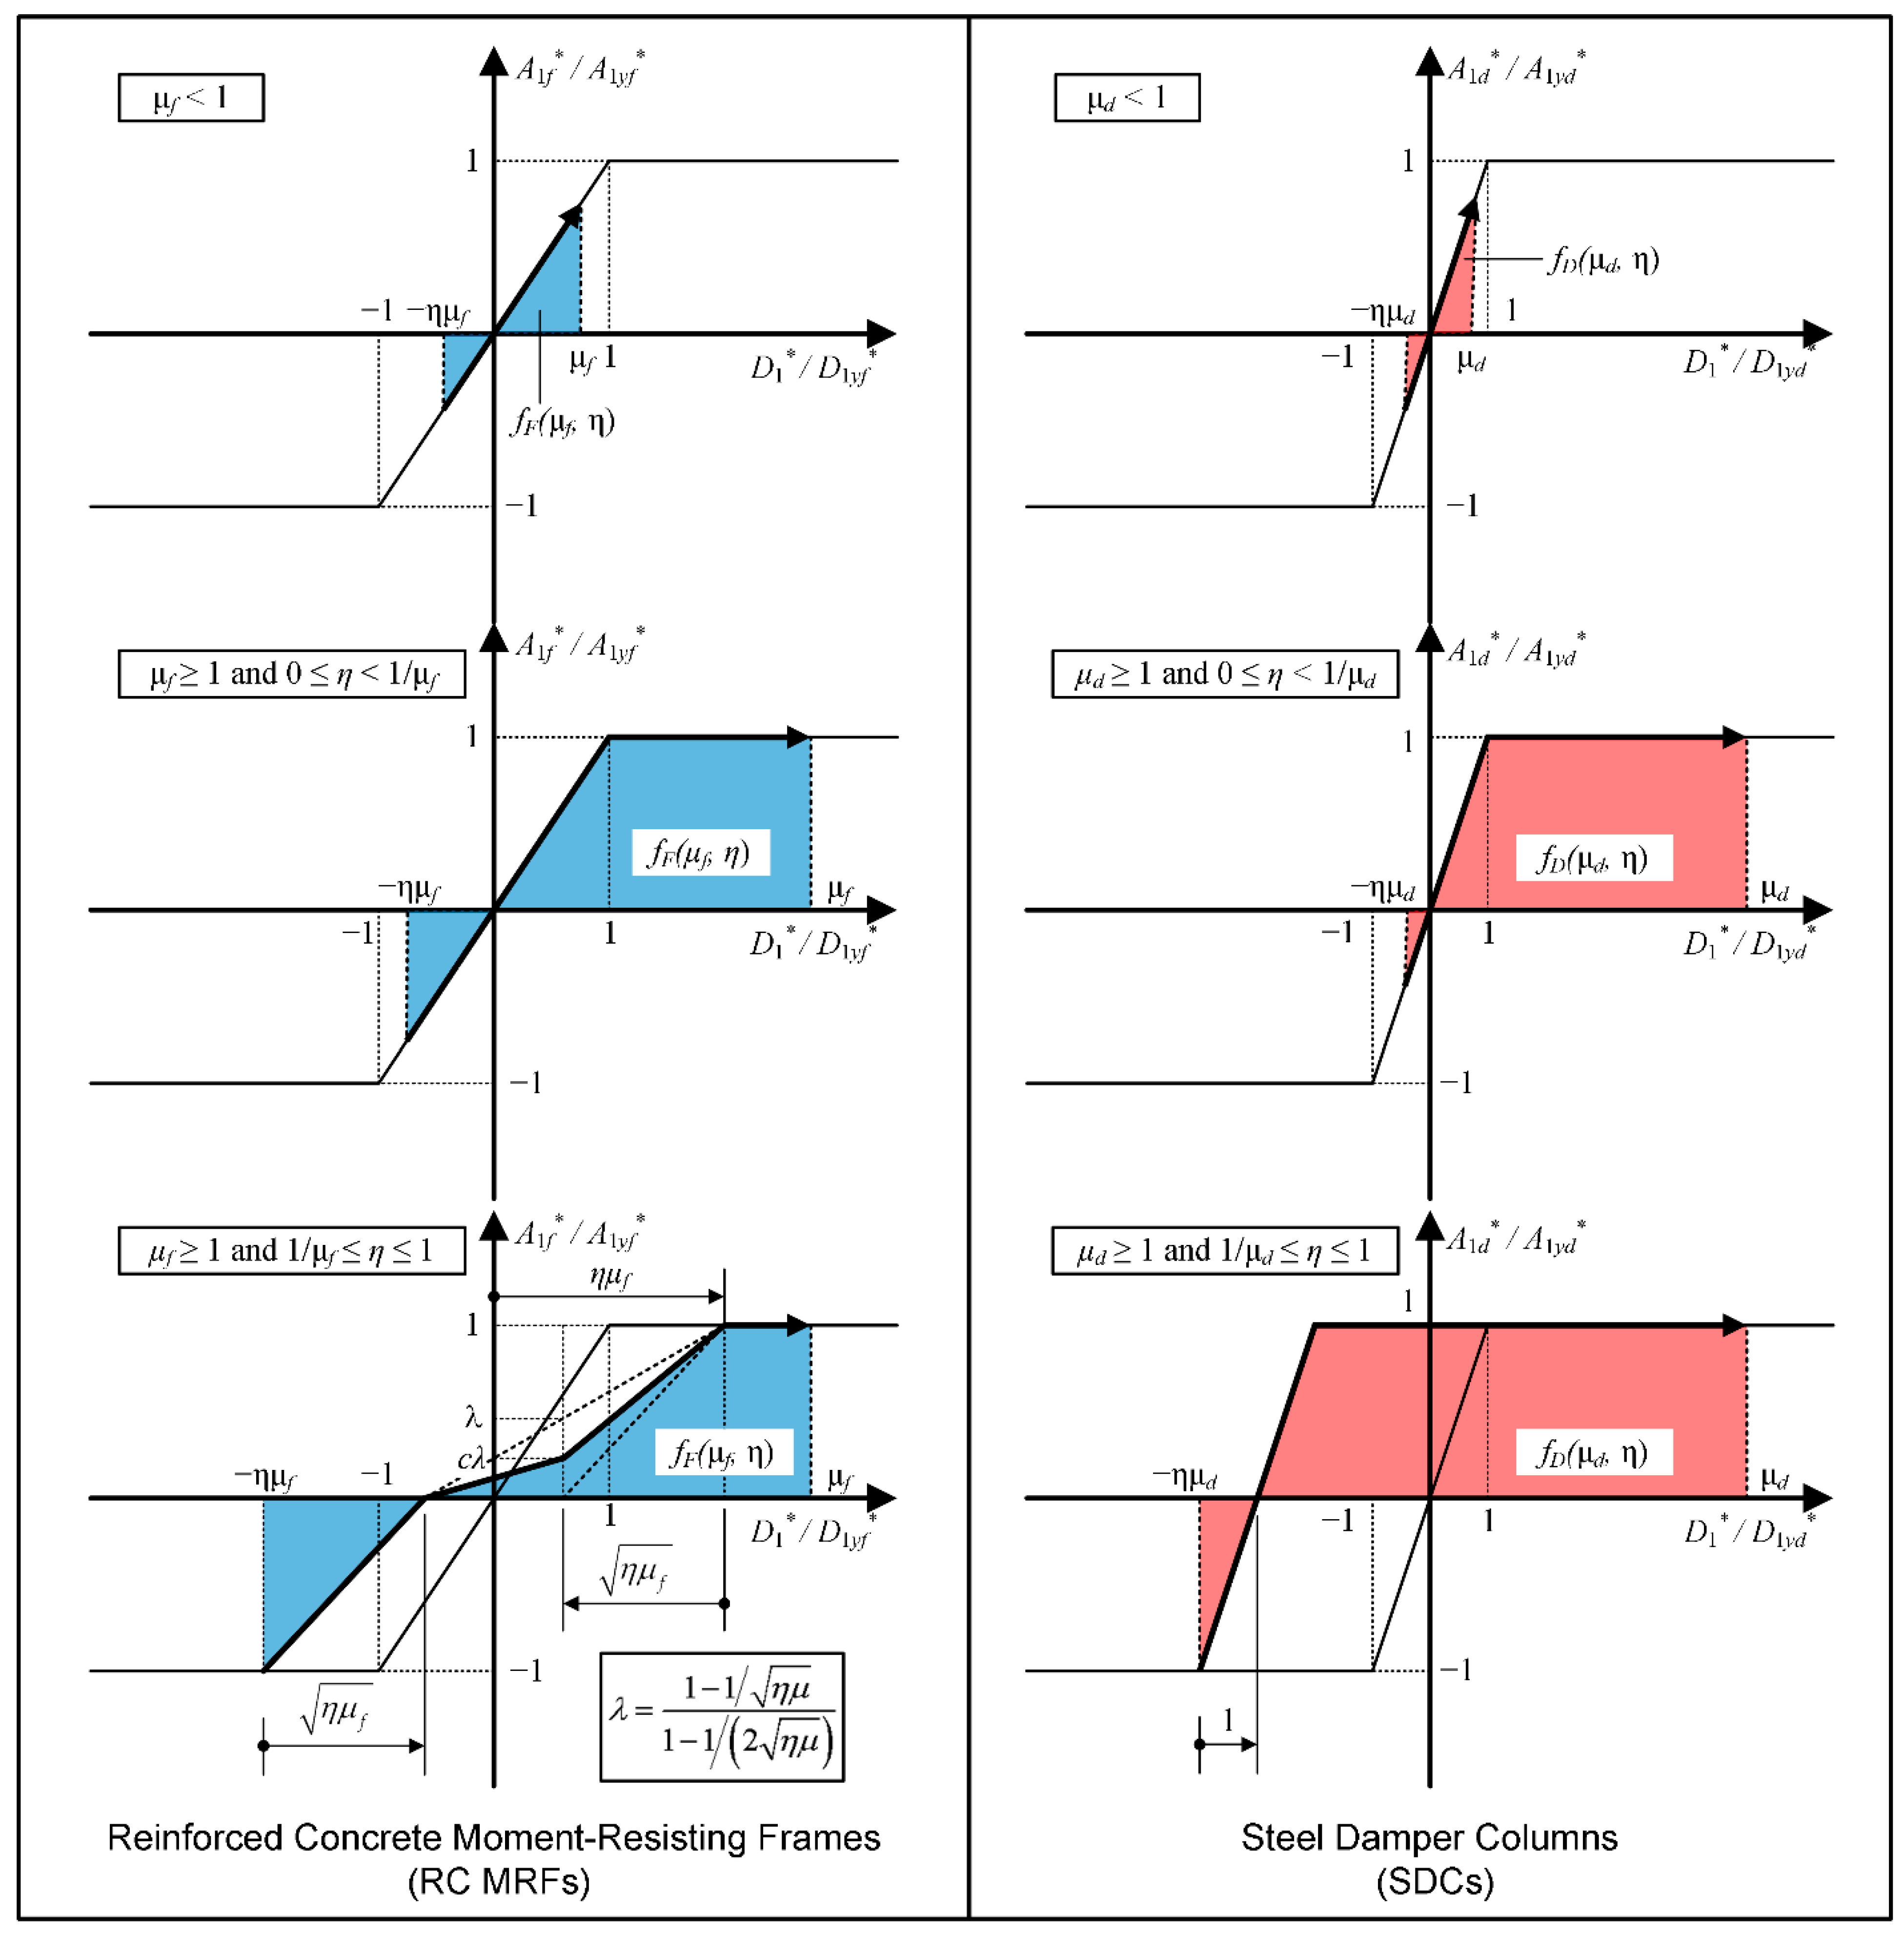
Figure 11 shows the simplified model for calculating and . In the figure, and are the contributions of the RC MRFs and SDCs, respectively, to the equivalent acceleration of the first modal response (). Here, the − and − relationships are idealized by bilinear curves, where the “yield” point of the idealized − relationship is YF(, ) and that of the idealized − relationship is YD(, ). In addition, and denote the global ductilities of the RC MRFs and SDCs, respectively, which are defined in Eq. (35):
The contribution of the hysteretic dissipated energy of the RC MRFs is calculated using Eq (36):
The function is defined by Eq. (37):
where is the ratio of the displacements in the positive and negative directions. Given the left panel of Figure 11, is calculated as
Note that, in Eq. (38), the influence of the pinching behavior of the RC members on the hysteretic energy dissipation in a half cycle of the structural response is considered by the parameter . This is an updated version of this equation, as compared with previous studies (Fujii, 2022; Fujii and Shioda, 2023). By substituting Eq. (38) into Eq. (37), the function is calculated as
Note that Eq. (39) is consistent with the equation in Fujii and Shioda (2023): by substituting = 1 into Eq. (39), the same equation for the perfectly non-pinching RC MRFs (Fujii and Shioda, 2023) is obtained. Similarly, the contribution of the hysteretic dissipated energy of the SDCs is calculated using Eq (40):
The function is defined as in Eq. (41):
It is assumed that the energy dissipation of SDCs is independent of the pinching behavior of the surrounding RC beams, as shown in the right panel of Figure 11. Therefore, is calculated such that
By substituting Eq. (42) into Eq. (41), the function is calculated as shown in Eq. (43):
The contribution of the viscous damping is calculated using Eq. (44), as in Fujii (2022):
where is the damping ratio corresponding to the peak equivalent displacement () and is the contribution of the RC MRF to the equivalent acceleration at .
5.2. Prediction of the Seismic Capacity Curve Based on the Pushover Analysis
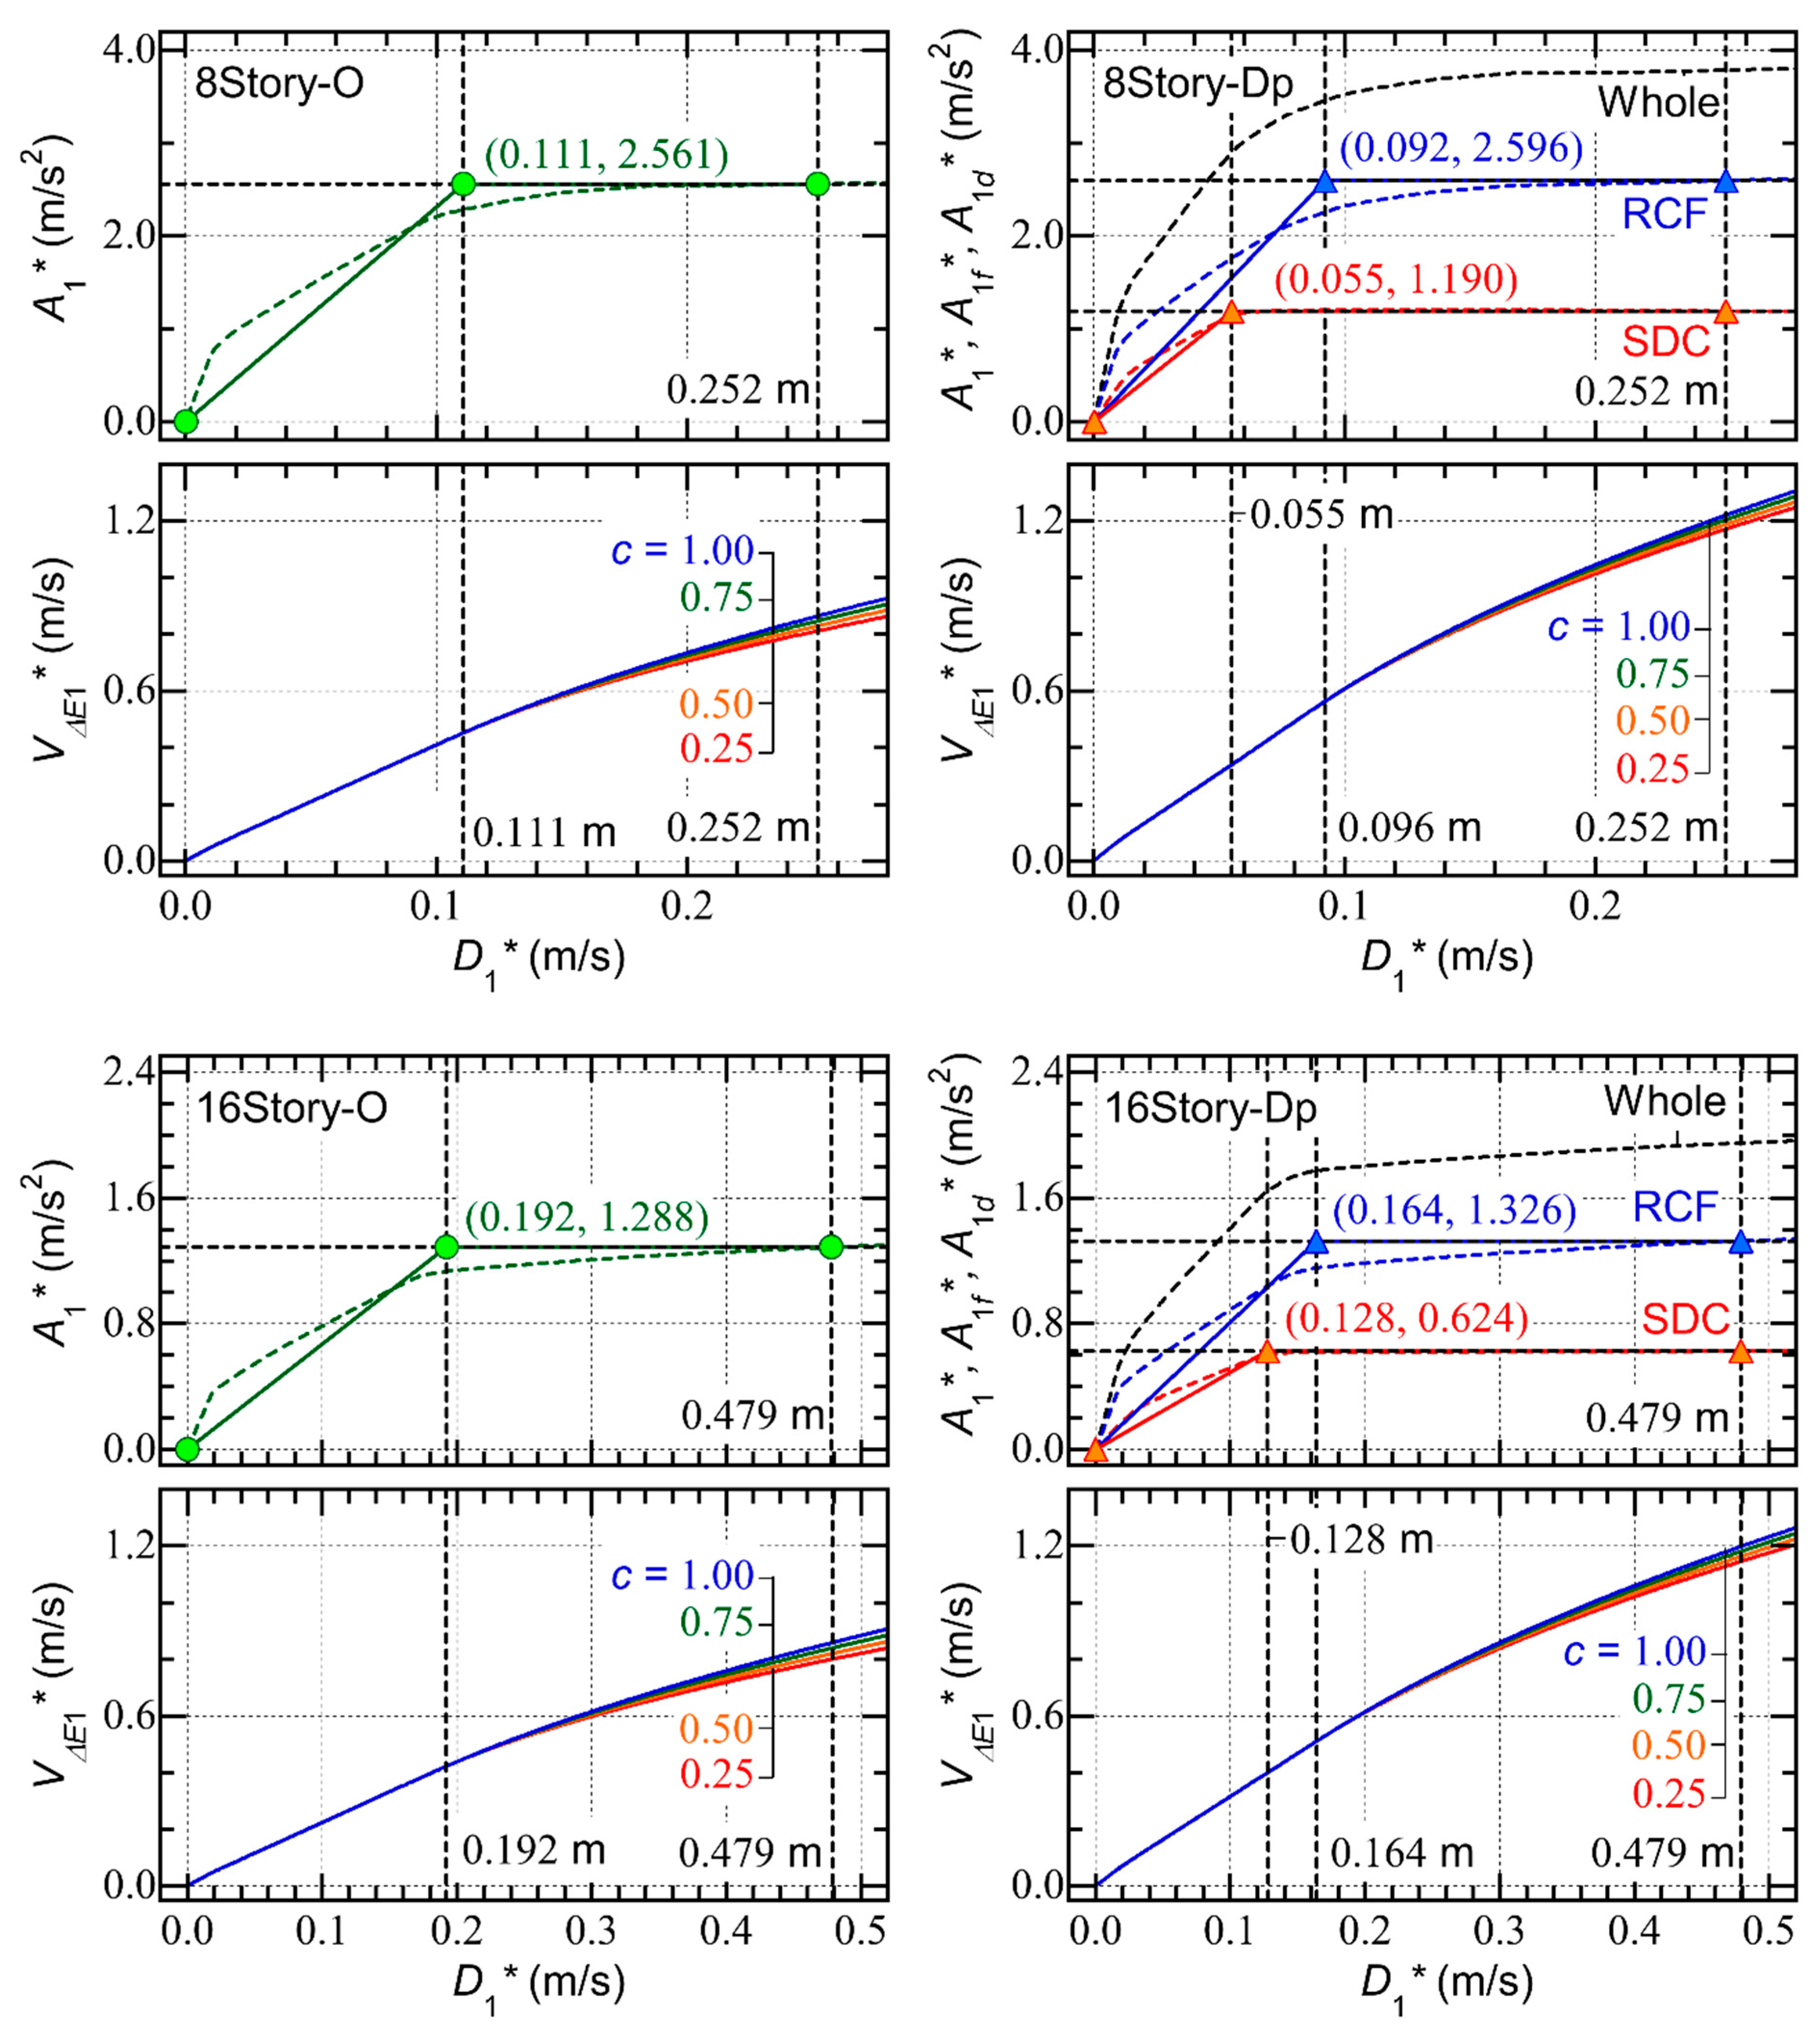
Next, the seismic capacity curve (the − curve) is predicted based on the formulated equations. First, a pushover analysis of the -story MRF model is performed. Then, the equivalent displacement at loading step () and the equivalent acceleration at step () are calculated as in Eqs. (45) and (46), given Eq. (47), assuming that the displacement vector at the loading step () is proportional to the first mode vector at step ():
In Eq. (46), denotes the restoring force of the entire MRF model. The contributions of the equivalent accelerations of the RC MRFs and SDCs ( and , respectively) are calculated using Eqs. (48) and (49):
Here, and denote the restoring forces of the RC MRFs and SDCs, respectively. The restoring force vector is equal to the sum of and , which are calculated from the shear forces of the RC columns and SDCs, respectively. Then, the − and − relationships are idealized by bilinear curves.
Then, the energy dissipation capacity during a half cycle of the structural response of the equivalent SDOF model () is calculated using Eq. (50):
The contributions of the hysteretic dissipated energy of the RC MRFs and SDCs are calculated using Eqs. (51) and (52):
The values of and are calculated via Eq. (53):
The contributions of the viscous damping are calculated such that
In Eq. (54), is the viscous damping ratio of the RC MRFs for the first modal response in the elastic range, while defined in Eq. (55) is the secant circular frequency of the first mode of the RC MRFs. In this study, it is assumed that in Eq. (44) is proportional to the secant circular frequency of the RC MRFs ().
The equivalent velocity of the energy dissipation capacity during a half cycle of the structural response of the equivalent SDOF model corresponding to () is calculated via Eq. (56):
Figure 12 shows the calculated seismic capacity curves (the − relationships) of the four models calculated from the pushover analysis results. The calculated curves for = 0.25, 0.50, 0.75, and 1.00 are compared in the figure. As shown here, the differences in the calculated curves resulting from the parameter are limited.
5.3. Comparisons with ICPMIA Results
Figure 13 shows comparisons between the predicted seismic capacity curves and the ICPMIA analysis results. The following conclusions can be drawn.
- For Type O, the plots obtained from the PDI and PMI analysis ( = 4) results are above the predicted seismic capacity curve. However, the plots obtained from the PMI analysis ( = 6 and 8) results are below the predicted curve. Specifically, for 8story-O, with = 0.25 (significant pinching) and = 8, the value corresponding to = 0.247 m is 0.616 m/s, while the predicted value corresponding to = 0.247 m is 0.802 m/s; this is a 23.1% underestimation of .
- For Type Dp, the plots obtained from the PDI and PMI analysis ( = 4) results agree very well with the predicted seismic capacity curve. In addition, the plots obtained from the PMI analysis ( = 6 and 8) results are slightly below the predicted curve. The dependence of the Type Dp – plots on is limited.
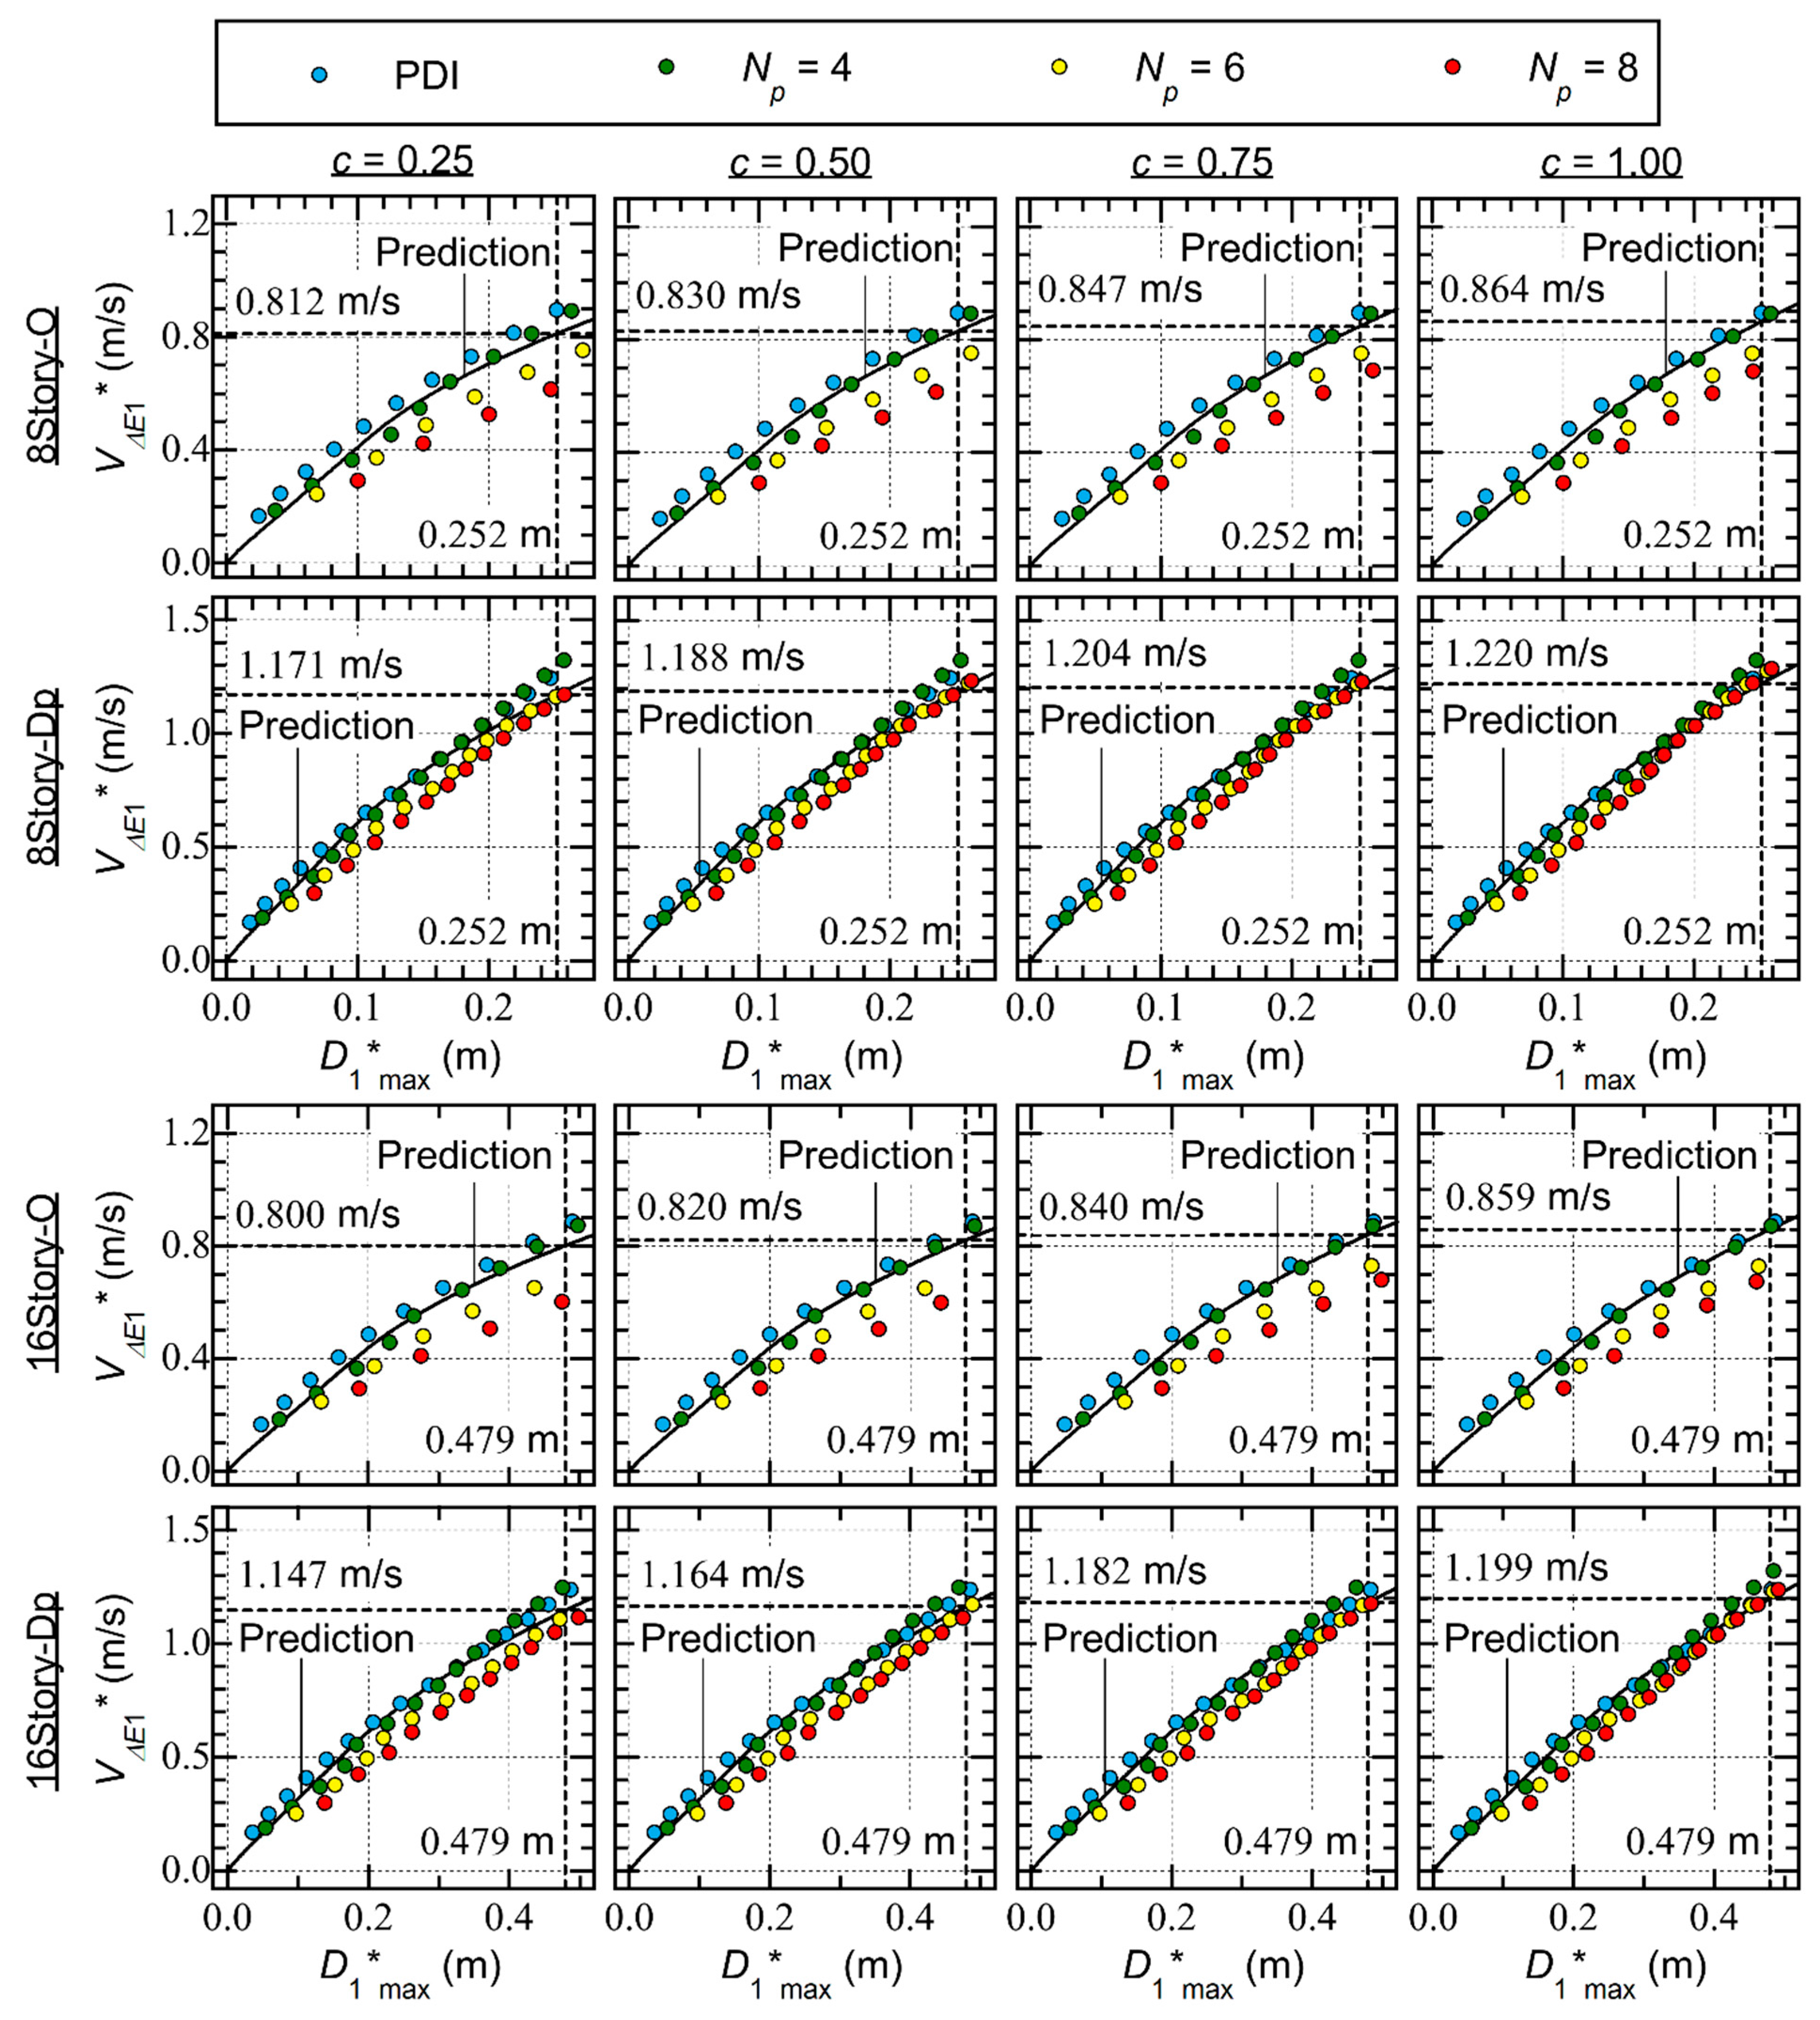
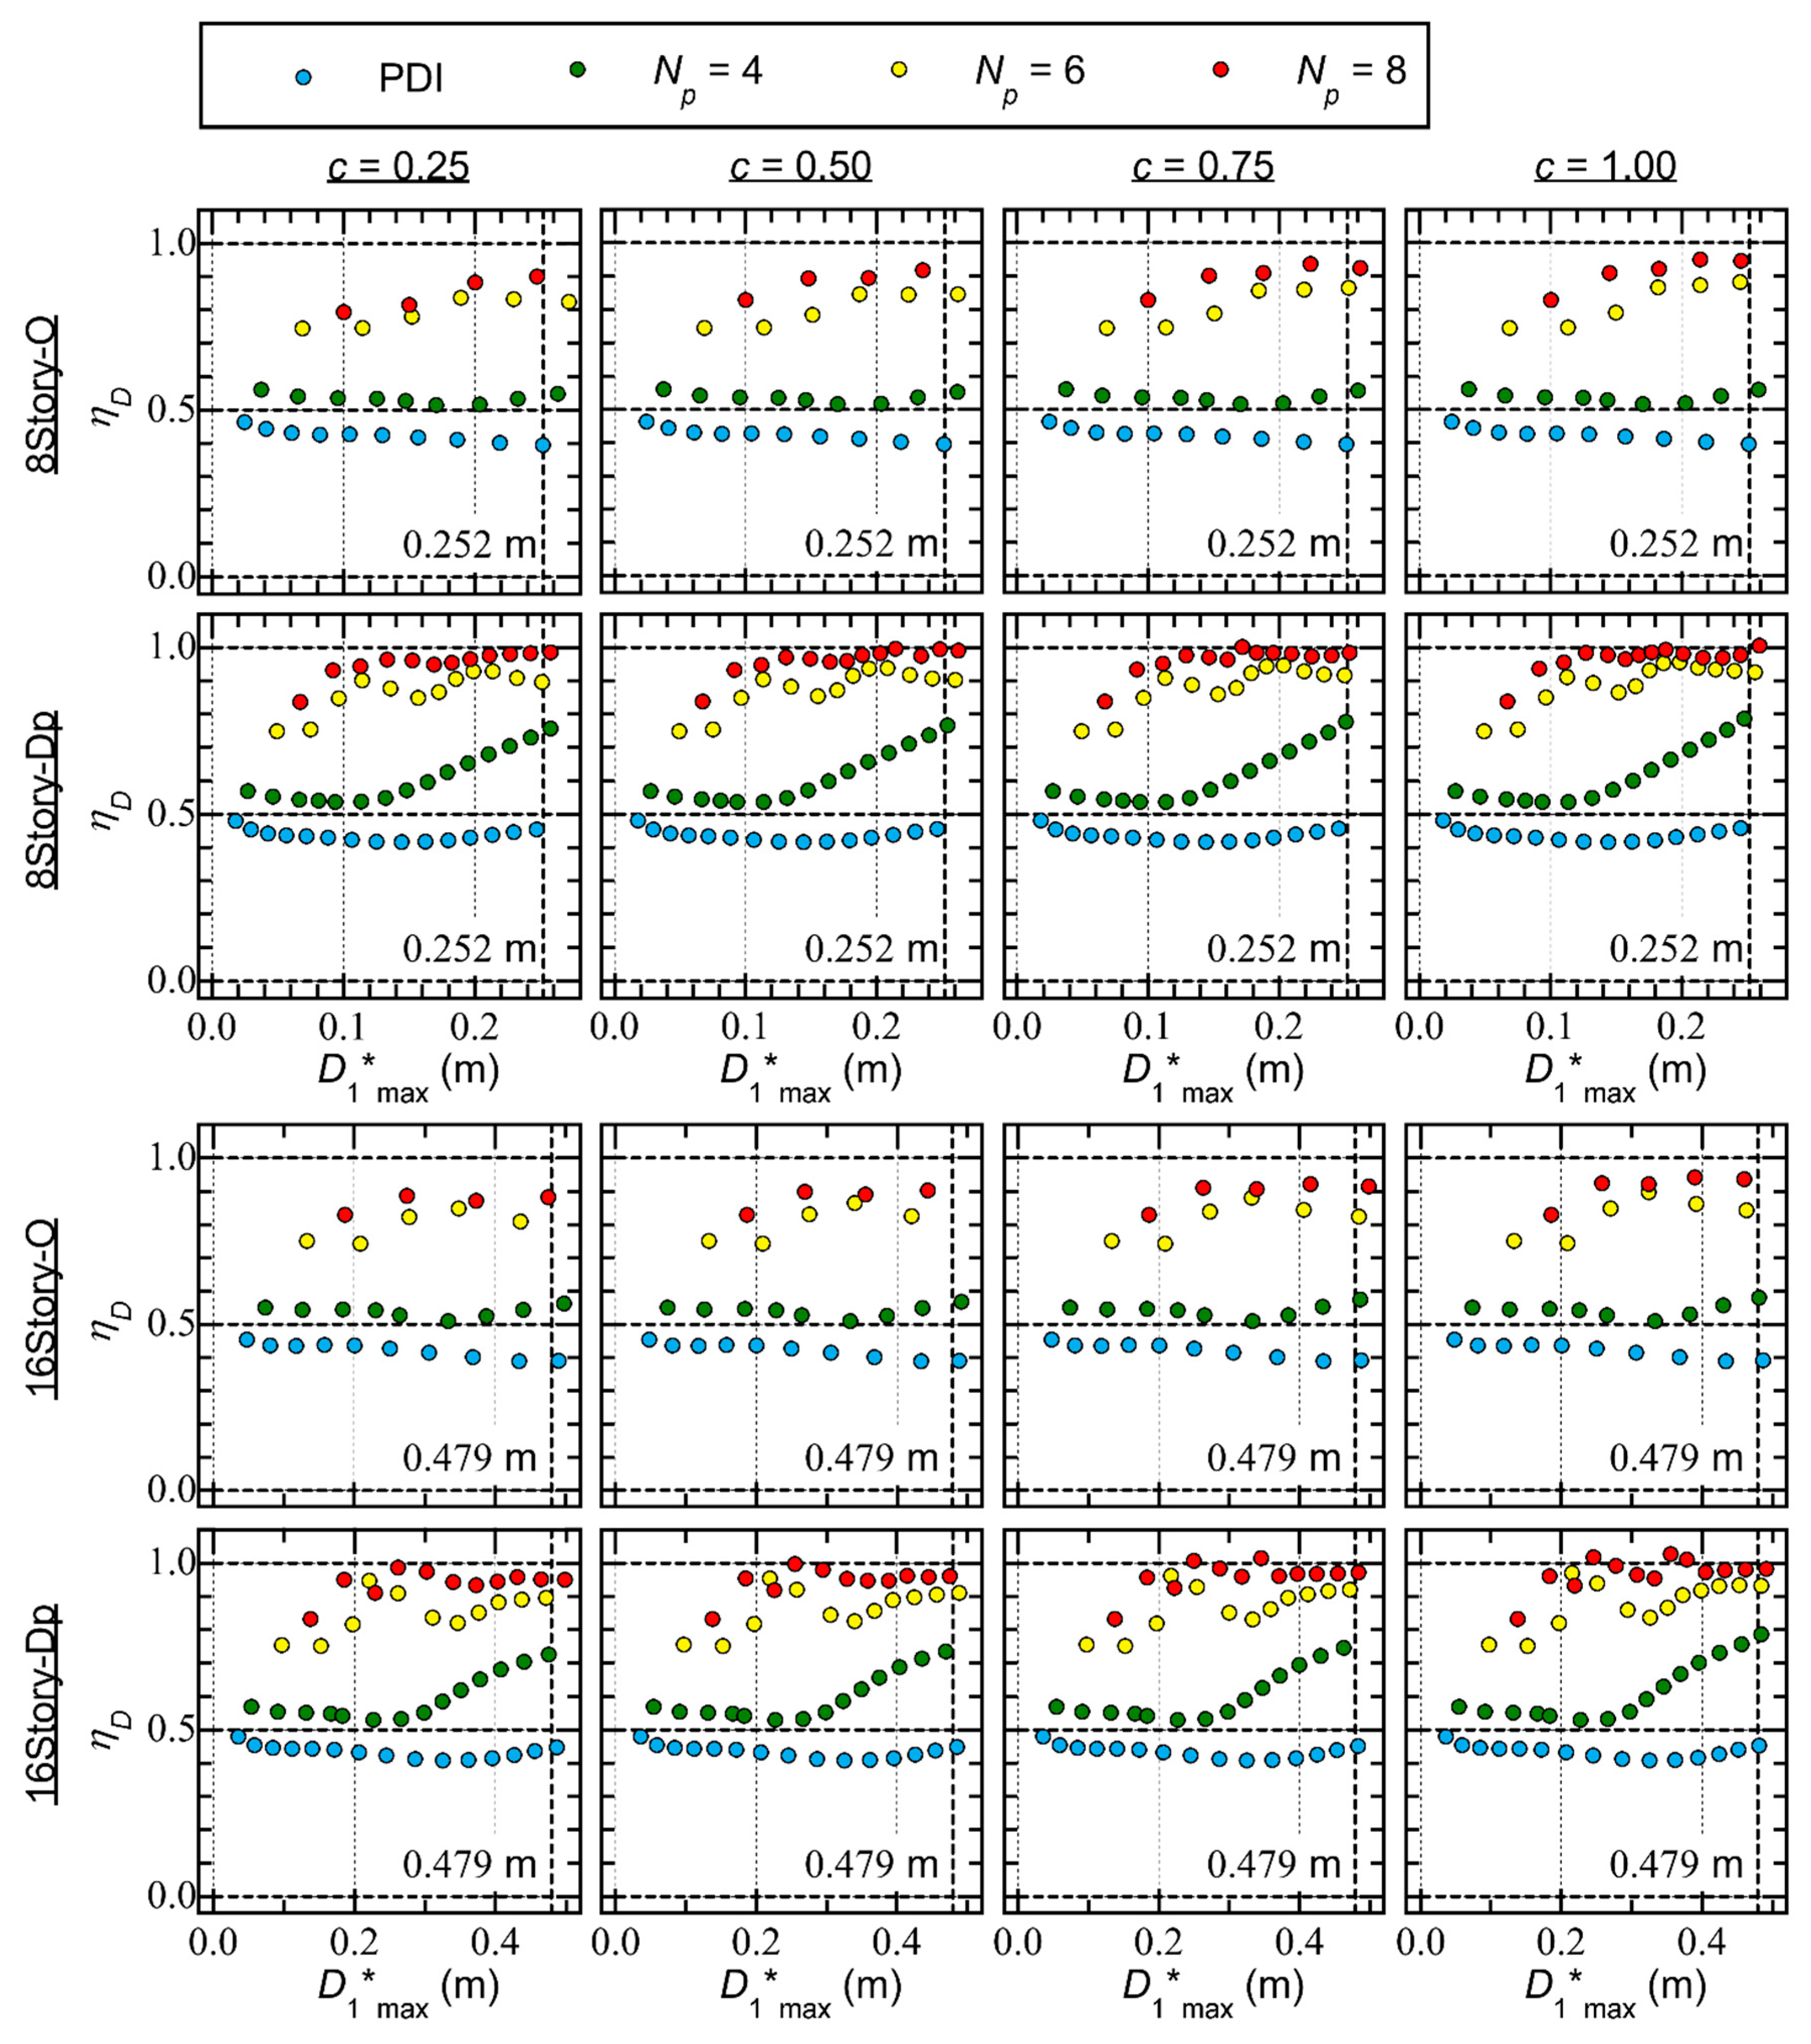
The results shown in Figure 13 indicate that the accuracy of the predicted capacity curve is acceptable for Type Dp, while the predicted capacity curve is unacceptably underestimated for Type O for larger . As described in Section 5.1, the equation for calculating the energy dissipation capacity during a half cycle of the structural response is simplified by calculating the average in the range of . Accordingly, the following discussion focuses on the ratio. First, Figure 14 shows the ratio obtained from the PDI and PMI analysis results. Here, is calculated using Eq. (57):
where is the counting number when the maximum momentary energy input occurs. The following conclusions can be drawn from Figure 14.
- For Type O, the ratio is between 0.4 and 0.5 in the PDI analysis results. Similarly, in the PMI analysis ( = 4) results, is between 0.5 and 0.6. Meanwhile, in the PMI analysis ( = 6 and 8) results, increases as increases: is between 0.7 and 0.9 when is 6, while is larger than 0.8 when is 8.
- For Type Dp, the ratio is between 0.4 and 0.5 in the PDI analysis results. However, in the PMI analysis ( = 4) results, increases as increases. For 8story-Dp, is close to 0.5 when is close to 0.1 m and reaches 0.7 when is close to 0.25 m. In the PMI analysis ( = 6 and 8) results, is larger than 0.7 and increases as increases; then, approaches 1.
The results shown in Figure 14 indicate that the ratio increases as increases for both Types O and Dp. Next, the relationship between the energy dissipation capacity during a half cycle of the structural response and is investigated. Following the discussion in Section 5.1, the contributions from the hysteretic dissipated energies of the RC MRFs and SDCs ( and , respectively) can be expressed as shown in Eqs. (58) and (59):
In addition, the contribution from the viscous damping () can be expressed as
In Eq. (60), , the secant circular frequency of the first mode of the RC MRFs, corresponds to and is calculated from Eq. (55).
Figure 15 shows the relationships between the energy dissipation capacity calculated from Eqs. (58)–(60) and the ratio. In this figure, is assumed to be 1/75 of the assumed equivalent height (): is set to 0.252 m for the 8-story models and to 0.479 m for the 16-story models.
The following conclusions can be drawn for Type O from Figure 15.
- The contribution from the hysteretic dissipated energy of the RC MRFs () decreases rapidly as increases. Conversely, the contribution from the viscous damping () increases as increases. However, because is much smaller than , the calculated decreases rapidly as increases: is largest when is zero and smallest when is unity.
- The variation in the calculated as a result of the ratio is predominant when the parameter is 0.25 (significant pinching). For 8story-O and = 0.25, the calculated corresponding to = 0 is 0.509 m2/s2, while the calculated corresponding to = 1 is 0.077 m2/s2 (only 15.2% of the value when = 0). Meanwhile, for 8story-O and = 1.00 (perfectly non-pinching), the calculated corresponding to = 0 is 0.509 m2/s2 (the same value as for = 0.25) and the calculated corresponding to = 1 is 0.241 m2/s2 (47.3% of the value when = 0).
The following conclusions can be drawn for Type Dp from Figure 15.
- The contribution from the hysteretic dissipated energy of the SDCs () increases as increases. Therefore, the variation in the calculated of Type Dp resulting from the ratio is less significant than that of Type O.
- The variation in the calculated of Type Dp resulting from the ratio is much less significant than that of Type O, even for = 0.25 (significant pinching). For 8story-Dp and = 0.25, the calculated corresponding to = 0 is 0.808 m2/s2, while the calculated corresponding to = 1 is 0.557 m2/s2 (68.9% of the value when = 0). Meanwhile, for 8story-Dp and = 1.00, the calculated corresponding to = 0 is 0.808 m2/s2 (the same value as for = 0.25) and the calculated corresponding to = 1 is 0.751 m2/s2 (92.9% of the value when = 0).
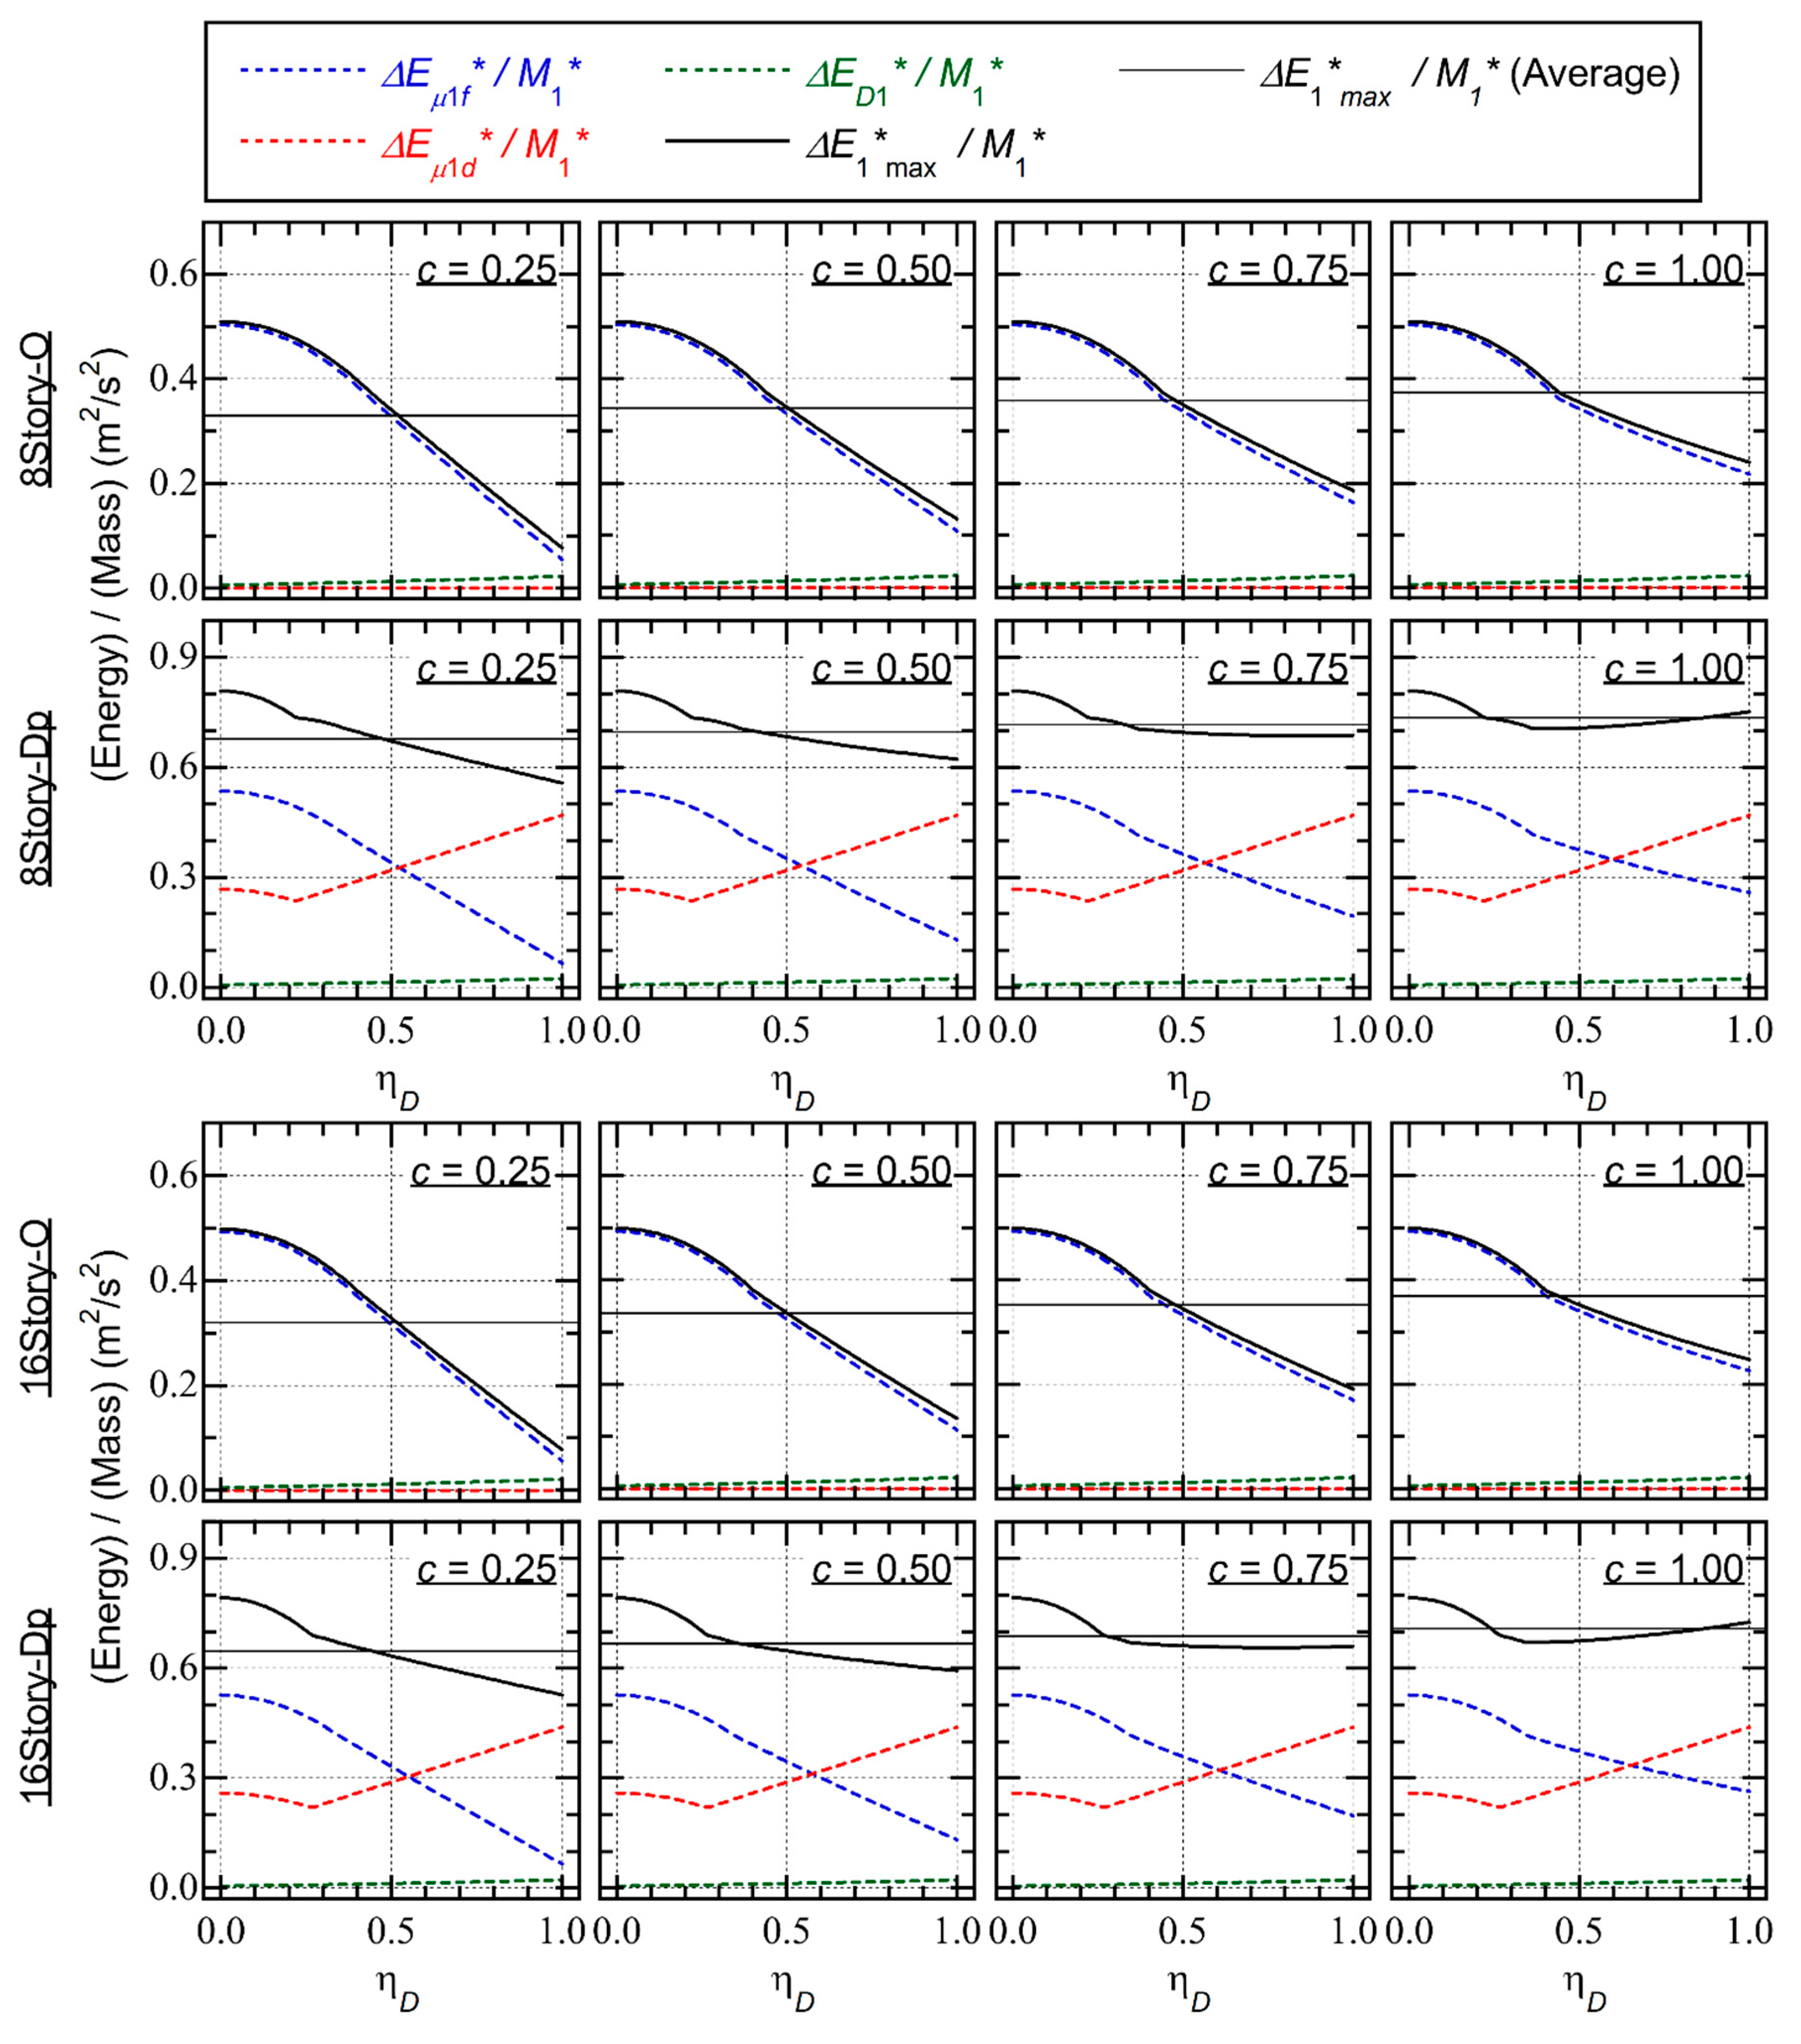
The results shown in Figures 14 and 15 can explain why the Type O – plots are influenced significantly by while the dependence of the Type Dp – plots on is limited. As shown in Figure 14, in general, increases as increases for both Types O and Dp. In addition, decreases significantly as increases in the case of Type O, as shown in Figure 15. Therefore, in the case of Type O, decreases as increases because the increase in leads to an increase in . Conversely, in the case of Type Dp, the variation in resulting from is less significant, as shown in Figure 15. Therefore, in the case of Type Dp, the variation in as a result of the increase in is less significant.
Note that the contribution of the hysteresis energy of the RC MRFs () decreases drastically as increases, especially when the pinching behavior of the RC members is significant. Therefore, the variation in of RC MRFs without SDCs as a result of becomes larger. This implies that the variation in the peak displacement () of RC MRFs without SDCs corresponds to the given becoming larger. Conversely, the contribution of the hysteresis energy of the SDCs () increases as increases. Therefore, the variation in of RC MRFs resulting from can be reduced by installing SDCs within the MRFs. Consequently, the use of SDCs as supplimental energy dissipating devices in RC MRFs is effective in reducing: (i) the peak displacement; (ii) the cumulative strain energy of RC members; and (iii) the variation in the peak displacement.
5.4. Summary of the Discussion
This section focuses on comparisons with the predicted results based on Fujii and Shioda (2023) and the ICPMIA results. On the basis of these comparisons, the following conclusions can be drawn.
- A)
- In the case of RC MRFs without SDCs, the – plots obtained from the PDI and PMI analysis ( = 4) results are above the predicted seismic capacity curve. However, the – plots obtained from the PMI analysis ( = 6 and 8) results are below the predicted curve. The dependence of the – plots of RC MRFs without SDCs on is significant.
- B)
- In the case of RC MRFs with SDCs, the – plots obtained from the PDI and PMI analysis ( = 4) results agree very well with the predicted seismic capacity curve. In addition, the – plots obtained from the PMI analysis ( = 6 and 8) results are slightly below the predicted curve. The dependence of the – plots of the RC MRFs with SDCs on is limited.
- C)
- The ratio of the displacements in the positive and negative directions () increases as increases. In the case of RC MRFs without SDCs, decreases drastically as increases, especially when the pinching behavior of the RC members is significant. Meanwhile, in the case of RC MRFs with SDCs, the variation in resulting from is less significant.
6. Conclusions
In this article, the seismic capacities of RC MRFs with and without SDCs were evaluated using incremental critical pseudo-multi impulse analysis (ICPMIA). From the ICPMIA results, (a) the influence of the number of impulsive inputs () and the pinching behavior of the RC members on and the residual equivalent displacement and (b) the influence of on the cumulative strain energies of RC MRFs and SDCs were investigated. Then, the – plots obtained from the ICPMIA results were compared with the predicted seismic capacity curves based on the simplified equations. The main results and conclusions can be summarized as follows.
- (i)
- In the case of RC MRFs without SDCs, the influence of on the – relationship is notable: decreases as increases. Meanwhile, in the case of RC MRFs with SDCs, the influence of on the – relationship is limited. This is because the energy dissipation capacity in a half cycle of the structural response decreases drastically in the case of RC MRFs without SDCs when the ratio of the displacements in the positive and negative directions is close to unity.
- (ii)
- In the case of RC MRFs without SDCs, the influence of the pinching behavior of RC members on the – relationship is small when is small. However, when is larger, the influence of the pinching behavior of RC members on the – relationship is notable. Conversely, the influence of the pinching behavior of RC members on the – relationship is limited in the case of RC MRFs with SDCs, regardless of .
- (iii)
- For RC MRFs with SDCs, the ratio of the cumulative strain energy of the RC MRFs () decreases and that of the SDCs () increases as increases. This trend is pronounced when the pinching behavior of the RC members is significant.
- (iv)
- The residual equivalent displacement ratio (), defined as the ratio of the residual equivalent displacement to the peak equivalent displacement (), obtained from the critical PMI analysis results is smaller than that obtained from the critical PDI analysis results. This difference is significant in the case of RC MRFs with SDCs. No regular trend was observed between the ratio and : the ratio may decrease when increases.
Conclusion (i) supports the accuracy of the prediction procedure (Fujii and Shioda, 2023). Specifically, the predicted – curve is sufficiently accurate for RC MRFs with SDCs, regardless of the number of impulsive lateral forces . For RC MRFs without SDCs, however, the predicted – curve may not be conservative in the case of long-duration earthquake ground motion and resonance. Conclusion (ii) indicates that the installation of SDCs within RC MRFs can effectively reduce the peak displacement, especially when long-duration earthquake ground motion is considered. This conclusion is consistent with the study by Shirai et al. (2024). Conclusion (iii) indicates that the contribution of SDCs in terms of the cumulative strain energy depends on the duration of the input ground motion. Therefore, to better predict the cumulative strain energy of RC members and SDCs, such phenomema should be properly considered. Conclusion (iv) indicates that the residual deformation obtained from the critical PDI analysis results may be the upper bound for RC MRFs with and without SDCs. It is important to consider the extention of the critical PMI analysis as a substitute for seismic sequences because, as shown by Hoveidae and Radpour (2021), the residual displacement after the first earthquake affects the peak response under the second earthquake.
Another finding of interest is the dependence of the calculated energy dissipation capacity () on the ratio of the displacement in the positive and negative directions (). As discussed in Section 5.3, the variation in the – plot resulting from is small in the case of RC MRFs with SDCs because the variation in resulting from is less significant. This implies that, if were constant in the range of , the variation in the – plot would be minimized. Such a structural system can be constructed by considering the proper combination of RC MRFs and SDCs or by developing a new energy dissipating system with the proper – relationship. As shown in Section 5.3, the – relationship of RC MRFs indicates that decreases as increases. Therefore, the – relationship of dampers for RC MRFs should have the opposite behavior with increasing with increasing . Such information is useful when choosing proper dampers considering the characteristics of the main structures (e.g., RC and/or steel MRFs or wood structures).
Note that the results shown in this study are, so far, valid only for RC MRF models with and without SDCs. Therefore, apart from further verifications using additional building models, the following questions remain unanswered, although the list below is not comprehensive.
- How can the number of impulsive inputs as a substitute of recorded ground motions be determined? To the author’s best knowledge, the ratio of the equivalent velocities of the total input energy to the maximum momentary input energy () would be the best parameter for this purpose. If the number were chosen to obtain the ratio of the considered ground motion, the response obtained from the critical PMI analysis results could represent the peak and cumulative response of the structure subjected to the considered ground motion.
- Can the prediction procedure (Fujii and Shioda, 2023) properly predict the cumulative strain energies of RC MRFs and SDCs obtained by the critical PMI analysis results? As far as the peak response is concerned, the prediction procedure has been validated. However, the prediction procedure has not been validated for the cumulative response. In such a validation, the pinching behavior of the RC members and the number of impulsive inputs would be key parameters.
- Can the ICPMIA be extended for the case of seismic sequences? To the author’s best knowledge, the NTHA is the only method that analyzes the responses of structures subjected to seismic sequences. However, the results obtained from NTHA are too complex to derive general conclusions. This is because the NTHA results are intricately intertwined with the nonlinear structural characteristics and the ground motion characteristics. In the case of a seismic sequence, the complexity increases as a result of the mainshock-aftershock (or foreshock-mainshock) combined ground motions. The nonlinear characteristics of the damaged structure would likely be easier to understand using ICPMIA.
Data Availability Statement
The raw data supporting the conclusions of this article will be made available by the author without undue reservation.
Author Contributions
KF: Writing–original draft; writing–review; and editing.
Funding
The author declares that financial support was received for the research, authorship, and/or publication of this article. This study received financial support from JSPS KAKENHI Grant Number JP23K41046.
Conflict of Interest
The author declares that the research was conducted in the absence of any commercial or financial relationships that could be construed as a potential conflict of interest.
Acknowledgments
This work was supported by JSPS KAKENHI Grant Number JP23K41046. We thank Martha Evonuk, PhD, from Edanz (https://jp.edanz.com/ac), for editing a draft of this manuscript.
Abbreviations
| DB-MAP | displacement-based mode-adaptive pushover. |
| ICPMIA | incremental critical pseudo-multi impulse analysis. |
| MDOF | multi-degree-of-freedom. |
| MRF | moment-resisting frame. |
| NTHA | nonlinear time-history analysis. |
| PDI | pseudo-double impulse. |
| PMI | pseudo-multi impulse. |
| RC | reinforced concrete. |
| SDC | steel damper column. |
| SDOF | single-degree-of-freedom. |
References
- Akehashi, H., Takewaki, I. (2021). Pseudo-double impulse for simulating critical response of elastic-plastic MDOF model under near-fault earthquake ground motion. Soil Dynamics and Earthquake Engineering. 150, 106887.
- Akehashi, H., Takewaki, I. (2022). Pseudo-multi impulse for simulating critical response of elastic-plastic high-rise buildings under long-duration, long-period ground motion. The Structural Design of Tall and Special Buildings. 31(14), e1969.
- Akiyama, H. (1985). Earthquake resistant limit-state design for buildings. Tokyo: University of Tokyo Press.
- Akiyama, H. (1999). Earthquake-resistant design method for buildings based on energy balance. Tokyo: Gihodo Shuppan.
- Benavent-Climent, A. (2011). An energy-based method for seismic retrofit of existing frames using hysteretic dampers. Soil Dynamics and Earthquake Engineering, 31, 1385-1396.
- Benavent-Climent, A., Cahís, X., Zahran R. (2009). Exterior wide beam-column connections in existing RC frames subjected to lateral earthquake loads. Engineering Structures, 31, 1414-1424.
- Benavent-Climent, A., Cahís, X., Vico, J. M. (2010). Interior wide beam-column connections in existing RC frames subjected to lateral earthquake loading. Bulletin of Earthquake Engineering, 8, 401-420.
- Benavent-Climent, A., Mollaioli, F. (Eds) (2021). Energy-Based Seismic Engineering, Proceedings of IWEBSE 2021. Cham, Switzerland: Springer Nature.
- Benavent-Climent, A., Mota-Páez, S. (2017). Earthquake retrofitting of R/C frames with soft first story using hysteretic dampers: Energy-based design method and evaluation. Engineering Structures, 137, 19-32.
- Benavent-Climent, A., Oliver-Saiz, E., Donaire-Ávila, J. (2024). Seismic retrofitting of RC frames combining metallic dampers and limited strengthening with FRP/SRP applying energy-based methods. Soil Dynamics and Earthquake Engineering, 177, 108432.
- Dolšek, M., Fajfar, P. (August 2004). “IN2 – a simple alternative for IDA,” in Proceedings of the 13th World Conference on Earthquake Engineering, Vancouver, Canada.
- Farrow, K.T.; Kurama, Y.C. (2003). SDOF demand index relationships for performance-based seismic design. Earthquake Spectra. 19(4), 799-838.
- Fujii, K. (2022). Peak and cumulative response of reinforced concrete frames with steel damper columns under seismic sequences. Buildings. 12, 275.
- Fujii, K. (2023), Energy-based response prediction of reinforced concrete buildings with steel damper columns under pulse-like ground motions. Frontiers in Built Environment. 9, 1219740.
- Fujii, K. (2024), Critical pseudo-double impulse analysis evaluating seismic energy input to reinforced concrete buildings with steel damper columns. Frontiers in Built Environment. 10, 1369589.
- Fujii, K., Kato, M. (2021). Strength balance of steel damper columns and surrounding beams in reinforced concrete frames. Earthquake Resistant Engineering Structures XIII, WIT Transactions on The Built Environment. 202, PII25–36.
- Fujii, K., Miyagawa, K. (June 2018). “Nonlinear seismic response of a seven-story steel reinforced concrete condominium retrofitted with low-yield-strength-steel damper columns” in Proceedings of the 16th European Conference on Earthquake Engineering (Thessaloniki).
- Fujii, K., and Shioda, M. (2023). Energy-based prediction of the peak and cumulative response of a reinforced concrete building with steel damper columns. Buildings. 13, 401.
- Fujii, K., Sugiyama, H., Miyagawa, K. (2019). Predicting the peak seismic response of a retrofitted nine-storey steel reinforced concrete building with steel damper columns. Earthquake Resistant Engineering Structures XII, WIT Transactions on The Built Environment. 185, PII75–85.
- Gentry, T. R., Wight, J. K. (1994). Wide beam-column connections under earthquake-type loading. Earthquake Spectra, 10(4), 675-703.
- Hori, N., Iwasaki, T., Inoue, N. (January 2000). “Damaging properties of ground motions and response behavior of structures based on momentary energy response,” in Proceedings of the 12th World Conference on Earthquake Engineering, Auckland, New Zealand.
- Hori, N., Inoue, N. (2002). Damaging properties of ground motion and prediction of maximum response of structures based on momentary energy input. Earthquake Engineering and Structural Dynamics. 31, 1657–1679.
- Hoveidae, N., Radpour, S. (2021). Performance evaluation of buckling-restrained braced frames under repeated earthquakes. Bulletin of Earthquake Engineering. 19, 241–262.
- Inoue, N., Wenliuhan, H., Kanno, H., Hori, N., Ogawa, J. (2000). “Shaking table tests of reinforced concrete columns subjected to simulated input motions with different time durations, “in Proceedings of the 12th World Conference on Earthquake Engineering, Auckland, New Zealand.
- Katayama, T., Ito, S., Kamura, H., Ueki, T., Okamoto, H. (January 2000). “Experimental study on hysteretic damper with low yield strength steel under dynamic loading,” in Proceedings of the 12th World Conference on Earthquake Engineering, Auckland, New Zealand.
- Kusuhara, F., Azukawa, K., Shiohara, H., Otani, S. (August 2004). “Tests of reinforced concrete Interior beam-column joint subassemblage with eccentric beams,” in Proceedings of the 13th World Conference on Earthquake Engineering, Vancouver, Canada.
- Kusuhara F., Shiohara, H. (October 2008). “Tests of R/C beam-column joint with variant boundary conditions and irregular details on anchorage of beam bars,” in Proceedings of the 14th World Conference on Earthquake Engineering, Beijing, China.
- Kojima, K., Fujita, K., Takewaki, I. (2015). Critical double impulse input and bound of earthquake input energy to building structure. Frontiers in Built Environment. 1, 5.
- Kojima, K., Takewaki, I. (2015a). Critical earthquake response of elastic–plastic structures under near-fault ground motions (Part 1: Fling-step input). Frontiers in Built Environment. 1, 12.
- Kojima, K., Takewaki, I. (2015b). Critical earthquake response of elastic–plastic structures under near-fault ground motions (Part 2: Forward-directivity input). Frontiers in Built Environment. 1, 13.
- Kojima, K., Takewaki, I. (2015c). Critical input and response of elastic–plastic structures under long-duration earthquake ground motions. Frontiers in Built Environment. 1, 15.
- Mota-Páez, S., Escolano-Margarit, D., Benavent-Climent, A. (2021). Seismic response of RC frames with a soft first story retrofitted with hysteretic dampers under near-fault earthquakes, Applied Sciences. 2021, 11, 1290.
- Mukoyama, R., K. Fujii, K., Irie, C., Tobari, R., Yoshinaga, M., K. Miyagawa, K. (October 2021). “Displacement-controlled Seismic Design Method of Reinforced Concrete Frame with Steel Damper Column,” in Proceedings of the 17th World Conference on Earthquake Engineering, Sendai, Japan.
- Ruiz-García, J., Negrete-Manriquez, J. C. (2011). Evaluation of drift demands in existing steel frames under as-recorded far-field and near-fault mainshock–aftershock seismic sequences. Engineering Structures. 33. 621-634.
- Ruiz-García, J. (2012a). Mainshock-Aftershock Ground Motion Features and Their Influence in Building's Seismic Response. Journal of Earthquake Engineering. 16(5), 719-737.
- Ruiz-García, J. (2012b). “Issues on the Response of Existing Buildings Under Mainshock-Aftershock Seismic Sequences,” in Proceedings of the 15th World Conference on Earthquake Engineering, Lisbon, Portugal.
- Shirai, K., Okano, H., Nakanishi, Y., Takeuchi, T., Sasamoto, K., Sadamoto, M., Kusunoki, K. (2024). Evaluation of response, damage, and repair cost of reinforced concrete super high-rise buildings subjected to large-amplitude earthquakes. Japan Architectural Review. 7, e12418.
- Tesfamariam, S. Goda, K. (2015). Seismic performance evaluation framework considering maximum and residual inter-story drift ratios: application to non-code conforming reinforced concrete buildings in Victoria, BC, Canada. Frontiers in Built Environment. 1, 18.
- Toyoda S, Kuramoto H, Katsumata H, Fukuyama H. (2014). Earthquake response analysis of a 20-story RC building under long period seismic ground motion. Journal of Structural and Construction Engineering (Transactions of AIJ). 79(702), 1167-1174. (in Japanese).
- Vamvatsikos, D., Cornell, C. A. (2002). Incremental dynamic analysis. Earthquake Engineering and Structural Dynamics. 31, 491–514.
- Varum, H., Benavent-Climent, A., Fabrizio Mollaioli, F. (eds) (2023). Energy-Based Seismic Engineering, Proceedings of IWEBSE 2023. Cham, Switzerland: Springer Nature.
- Wada, A., Huang, YH., Iwata, M. (2000). Passive damping technology for buildings in Japan. Progress in Structural Engineering and Materials. 2(3), 335-350.
Disclaimer/Publisher’s Note: The statements, opinions and data contained in all publications are solely those of the individual author(s) and contributor(s) and not of MDPI and/or the editor(s). MDPI and/or the editor(s) disclaim responsibility for any injury to people or property resulting from any ideas, methods, instructions or products referred to in the content. |
© 2024 by the authors. Licensee MDPI, Basel, Switzerland. This article is an open access article distributed under the terms and conditions of the Creative Commons Attribution (CC BY) license (http://creativecommons.org/licenses/by/4.0/).
Copyright: This open access article is published under a Creative Commons CC BY 4.0 license, which permit the free download, distribution, and reuse, provided that the author and preprint are cited in any reuse.


