Submitted:
09 May 2024
Posted:
10 May 2024
Read the latest preprint version here
Abstract
: In this investigation, the impact of reducing agent concentration on the production of zinc oxide nanoparticles (ZnO NPs) was examined. During the synthesis, an assessment of ionic conductivity was carried out, revealing a significant increase in conductivity prior to the introduction of the reducing agent, followed by a sharp decrease upon its addition. Characterization of the ZnO NPs involved UV-visible spectroscopy, scanning electron microscopy, Fourier infrared spectroscopy, and x-ray diffraction analysis. The outcomes suggest that the characteristics of the ZnO NPs are influenced by the concentration of the reducing agent during the synthesis process. Notably, employing a concentration of 0.5 v/v resulted in the production of nanoparticles with relatively uniform sizes. Conversely, concentrations below 0.5 v/v led to slow formation, while concentrations exceeding 0.5 v/v yielded non-uniform nanoparticles. Furthermore, the ZnO NPs synthesized with a higher concentration of reducing agent exhibited a narrower optical band gap and increased surface energy.
Keywords:
zinc oxide
; nanoparticle
; reducing agent
; surface energy
; band gap and size of zinc oxide nanoparticles
1. Introduction
Metal oxide nanoparticles have a variety of applications, including optoelectronics, biosensors, beauty products and solar cell [1]. The synthesis of uniform-size metal oxide nanoparticles with a well-defined size is crucial for these applications [2]. Metal oxide nanoparticles are produced by physical, chemical, and green synthesis processes [3]. According to the literature, some of the harmful compounds we employ in physical and chemical procedures may be present in the generated metal oxide nanoparticles, which could be dangerous if used in the medical area [4]. Besides, these kinds of preparations need a lot of energy and contain dangerous substances that pose a risk to biological systems. Metal oxide nanoparticles can be synthesized using environmentally friendly reducing and capping agents that prevent agglomeration, such as plant extracts [5]. These methods are nowadays more preferred than chemical and physical methods because they are non-toxic and less costly. There are studies on the effect of the concentration of reducing agents on the size and shape of metal nanoparticles. Rajalakshmi et al. studied the effect of the concentration of Impatiens balsamina L. plant flower extract (utilized as a reducing agent) on the synthesis of silver nanoparticles and observed that high concentration of extract led to the production of smaller nanoparticles [6]. Similarly, Kim et al. explored variations in reducing agent concentration during the synthesis of gold nanoparticles. Their findings indicated that an increase in reducing agent concentration resulted in a reduction in the size of AuNPs, [7]. Despite the prevalent preference for green synthesis over chemical methods, there is a notable absence of comparative research on the effects of reducing agent concentration on the characteristics of zinc oxide nanoparticles (ZnO NPs) in existing literature.. Therefore, in this paper, we studied the effect of reducing agent concentration on the size of ZnO NPs, which are one of the most widely used metal oxide nanoparticles for device fabrication and preparation of beauty products [9]. In the investigation, SEM analysis was used to confirm size and structure, and EDX was utilized to check the purity and composition. FTIR was employed to examine the stretching and bonding, X-ray diffraction (XRD) was used to investigate the shape and average size, and UV-vis was utilized to study the optical properties of the ZnO NPs.
2. Materials and Methods
Chemicals and Materials: The orange fruit was purchased from the local market in Bahir Dar City, Ethiopia. Zinc nitrate dihydrate [Zn (NO3)2 2H2O, 99.5%)], sodium hydroxide (NaOH, 98%), ferric chloride (FeC13 (10%)), Wagner‘s reagent, sulfuric acid (H2SO4, 98%), ethanol (98%) and hydrochloric acid (HCl, 35.4%), were purchased from Abron, India. All glassware was thoroughly cleaned using deionized water and ethanol then dried in an oven prior to use. The equipment employed in the synthesis of nanoparticles includes an electronic digital balance (Ohaus Corporation, Switzerland), a Whatman filter paper for the separation of resulting solids from the liquid phase, a magnetic stirrer and hot plate (IKA RH digital, Germany) to ensure a consistent mixture by agitation, a pH meter (model: 902) for monitoring pH levels, and a conductivity meter (model: 4510, Jenway) for assessing conductivity. Furthermore, an oven (model: Ambala Cantt-133001 HR, India) was utilized for drying the samples, while a Muffle furnace (Model: ME2.5-12GJ, China) was used for calcination purposes. Other essential items included a test tube, a ceramic crucible, measuring cylinders for liquid volume measurements, volumetric flasks for the preparation of various solution concentrations, and a thermometer for temperature monitoring.
Preparation of Orange Fruit Peel Extract: To obtain the extracts, the orange fruit was washed repeatedly with deionized water to remove all the dust and particulate matter and dried before being peeled as thinly as possible. The oranges were peeled, and then the peel was dried in an oven at 60 ° C for 24 hours until completely dry and then ground into a moderately fine powder. The 50 g orange peel extract powder was placed in a 500 ml conical flask with 250 ml of deionized water. The mixture was then stirred and boiled for 3 hours at 60 ° C on a magnetic stirrer. The solution was allowed to cool to room temperature for approximately 15 minutes and filtered twice using Whatman filter paper. Finally, the resulting orange peel-filtered extract was stored in a cool and dry place for further experimental use. The general procedure for the preparation of orange peel extract is shown in Figure 1.
Phytochemical test of orange fruit peel extract: Phytochemical tests include for the presence of flavonoids, polyphenols, alkaloids, tannins, and glycosides in the extract. The evaluation of flavonoids involved the addition of 4 ml of orange peel extract to a test tube, followed by treatment with 2 ml of a 10% NaOH solution. To test for alkaloids, 2 ml of orange peel extract was mixed with 5 drops of Wagner’s reagent (1.27 g of iodine and 2.0 g of potassium iodide in 100 ml of water. The glycoside examination was carried out by dissolving a small amount of orange peel extract in 1 ml of distilled water, followed by the addition of aqueous sodium hydroxide. The tannin evaluation was carried out by mixing 1 ml of orange peel extract, 1 ml of distilled water, and 2–3 drops of lead acetate (Pb(C2H3O2)2) solution in a test tube. Lastly, the phenol test involved adding a few drops of a 10% aqueous ferric chloride solution to 1 ml of the orange peel extract in a test tube.
Preparation of Zinc Nitrate Dihydrate Solutions (Zn (NO3)22H2O): Zinc nitrate dehydrate (10 g) was dissolved in 500 ml of deionized water (0.1M). The solution was kept under constant stirring for 20 minutes with a magnetic stirrer to completely dissolve the zinc nitrate. This solution was used in the production of zinc oxide nanoparticles.
Synthesis of ZnO NPs: The impact of varying concentrations of orange peel extract on the characteristics of the ZnO NPs was examined by adjusting the ratio of orange peel extract to zinc nitrate dihydrate solution. For instance, sample A was created by combining 25 ml of orange peel extract with 100 ml of zinc nitrate dihydrate (0.5: 2), sample B by mixing 35 ml of orange peel extract with 100 ml of zinc nitrate dihydrate (0.75: 2), sample C by blending 50 ml of orange peel extract with 100 ml of zinc nitrate dihydrate (1: 2), and sample D by mixing 100 ml of orange peel extract with 100 ml of zinc nitrate dihydrate solution (2:2 ratio). Following stirring of the mixtures at 60 ° C for 2 hours using a magnetic stirrer, a 2.0 M NaOH solution was gradually added until the solution reached a pH of 12. Stirring continued for an additional 30 minutes until a solid product of a pale cream color was achieved. To eliminate any residual impurities or unreacted components, the precipitate was washed three times with ethanol and deionized water. Subsequently, the precipitate was dried in an oven at 60 ° C for a duration of 36 hours to ensure complete drying. The resulting product was then subjected to calcination at 400 ° C for 2 hours. During the synthesis, conductivity measurement was carried out using a conductivity meter (model: 4510, Jenway). A smartphone was used to record the measurements. First, 100 ml of zinc nitrate dihydrate solution was added to a beaker and its conductivity was measured. Next, 50 ml of orange peel extract was added to the zinc nitrate dihydrate solution. The mixture was stirred for 2 hours at 60 ° C using a magnetic stirrer, during which a reduction process occurred. This process was evident by a decrease in the conductivity of the solution and a gradual change in color to pale yellow, as shown in Figure 2. This color change served as an initial evidence for the formation of ZnO NPs. Finally, the formation of ZnO NPs was confirmed by measuring the conductivity of the solution.
2.1. Characterization of the Synthesized ZnO NPs:
The characterization of the synthesized ZnO NPs was performed using various techniques, including ultraviolet-visible (UV-vis) spectroscopy, Fourier transform infrared spectroscopy (FTIR), X-ray diffraction (XRD), scanning electron microscopy (SEM), energy-dispersive X-ray spectroscopy (EDX), and thermogravimetric analysis (TGA).
Ultraviolet-visible (UV-Vis) spectroscopy: For the purpose of measuring UV-visible spectra, a specimen was prepared by utilizing 1 mg of ZnO NPs dispersed in 10 ml of ethanol. A reference was established by employing a blank cuvette containing the dispersing ethanol. The samples' absorption spectra across the wavelength range of 200 – 800 nm were obtained using a spectrometer (DR6000 model, manufactured in Germany). The band gap energy of the ZnO NPs was determined from the UV-visible spectra through the utilization of the Tauc plot methodology (Equation 1).
Where, hν is the photon energy, K is the proportionality constant, is the band gap energy, and n is equal to ½ for direct band gap, and α represents the absorption coefficient.
Fourier transforms infrared spectroscopy (FT-IR): The FT-IR spectra of the ZnO NPs were recorded using a Perkin Elmer spectrum two spectrometer that scans from 4000 cm-1 to 400 cm-1. The sample for the FT-IR test was prepared by mixing ZnO NP with potassium bromide (KBr) and pressing it into a pellet.
X-ray diffraction (XRD): The XRD patterns of ZnO NPs were performed on an XRD-6000 X-ray diffractometer (Shimadzu, Japan) using Cu Kα radiation (λ = 0.15406175 nm). The scan range ( 2θ) was from 10 ° to 80°, and the scan rate was 2 ° per minute. From the XRD data, the crystalline size of the ZnO NPs was obtained using the Debye-Scherer equation; see equation 2.
Where, D is the average size of the crystalline, λ is the wavelength of the X-ray (0.15406175 nm), k is the shape factor or Scherer’s constant (0.94), θ is Bragg’s diffraction angle, and β is the full width of the XRD peak at half maximum.
Scanning electron microscopy with energy dispersive X-ray (SEM-EDX): The morphology, particle size and elemental composition of ZnO NPs were studied using a scanning electron microscope (JEOL JSM-6701F) with an energy dispersive X-ray spectrometer (EDX) (ZEISS SIGMA). Images were obtained at an operating voltage of 10 kV.
Thermogravimetric Analysis (TGA): The thermal stability of the ZnO NPs was analyzed by thermogravimetric analysis (BJHENVEN, HCT-1). It was scanned at a rate of 15 °C/min in the range of 20 to 800 ° C under ambient conditions.
2.2. Mathematical Models
Size Determination of the ZnO NPs from UV Vis Spectroscopy: Before determining the size, the band gap of the ZnO NPs was determined through the utilization of the Tauc plot in UV Vis spectroscopy. Subsequently, the size of the ZnO NPs was derived from the band gap by employing the effective mass model (Equation 3). After solving Equation 3, the size of the ZnO NPs can be obtained using Equation 4.
Where , , Where, is the bulk band gap (3.3eV), h = 6.625×10⁻³⁴ J·s, r is particle radius (m), is the free electron mass (9.11×10⁻³¹ kg), is effective mass of a conduction band electron in ZnO (0.24), is effective mass of a valence band hole in ZnO (0.45 ),
e is the charge on an electron(1.602×10⁻¹⁹ C), ε0 is the permittivity of free space (8.854×10⁻¹² C2N-1m-2), ε is relative permittivity of zinc oxide (3.7) [10].
Determination of Surface Energy: The estimation of surface energy for ZnO NPs can be readily calculated based on the bond energy, bulk surface energy, and lattice constants of the unit cell [11]. The correlation among bulk surface energy, lattice parameter, and bond energy is defined by equation 5. Furthermore, the calculation of surface energy for nanoparticles with radius r is achievable through equation 6. The numerical values of the constants include Avogadro’s number (NA=6.02214 x 10^23 mol-1), lattice parameter (a) for zinc oxide is 0.32 nm, critical radius r0 for zinc oxide nanoparticles is 1.6 nm, and bond energy of zinc oxide (Eav) is 284.1 kJ/mol [12].
Determination of concentration of ZnO NPs: The number of ZnO NPs was estimated from UV-vis spectroscopy using the Beer-Lambert law, see Equation 7 [13]. Furthermore, the uniformity of the ZnO NPs was estimated from the FWHM of the UV-vis spectra.
Where A is absorbance, ε is the molar extinction coefficient with unit of M−1 cm−1, l is the path length of the sample (1 cm), and c is the number of suspensions of ZnO NPs (M).
3. Result and Discussions
Phytochemical tests: Figure 3 illustrates the phytochemical tests of the orange peel extracts where A, B, C, D, and E corresponds to a screening for alkaloids, flavonoids, tannins, glycosides, and phenols, respectively. Table 1 is the results of the phytochemical examination. The test has yielded evidence that the orange peel extract contains phytochemicals capable of reducing zinc. Furthermore, these phytochemicals may encapsulate and stabilize zinc oxide nanoparticles.
Visual Observation: A visual observation of the change in color during synthesis served as our initial confirmation of the formation of ZnO NPs, depicted in Figure 4. When zinc nitrate dihydrate solution (displayed in Figure 4A) was mixed with the orange fruit peel extract (shown in Figure 4B), it led to the manifestation of a faint yellow color (illustrated in Figure 4C).. Subsequent introduction of sodium hydroxide for the purpose of precipitation (as indicated in Figure 7D) generated a white precipitate (demonstrated in Figure 4E), a finding that aligns with previous research. These alterations in color serve as a reliable indication of the effective fabrication of ZnO NPs.
Conductivity Measurement Analysis: In addition to visual confirmation, ionic conductivity measurement was conducted to explore the kinetics of zinc oxide nanoparticle formation. Figure 5 shows the variation in the conductivity of the solution over time. Initially, there was a sharp increase in conductivity that was attributed to the dissolution of the precursor, leading to an increase in the number of ions in the solution. Subsequently, a plateau in conductivity was observed between 5 and 60 seconds, indicating complete dissolution of all precursors with no further ion addition. In the final stage, a decrease in conductivity was noted because of the introduction of a reducing agent, which facilitated the reduction of ions to neutral nanoparticle forming atoms, signifying the formation of ZnO NPs.
Ultraviolet-Vis Absorption Spectroscopy Analysis: UV-vis spectroscopy was utilized to investigate the optical characteristics of the ZnO NPs, as illustrated in Figure 6. The solution containing zinc nitrate dihydrate exhibited a wide peak at 302 nm, indicating the light absorption by the metal ions in the solution. Similarly, the orange peel extract displayed a distinct peak at 297 nm, corresponding to the presence of polyphenolic compounds in the extract.
Figure 7 illustrates the UV–vis absorbance spectra of ZnO NPs fabricated using varying concentrations of orange peel extract (0.5:2, 0.75:2, 1:2, and 2: 2) which showed absorption peaks at 369.5, 372, 374, and 377 nm, respectively. The presence of a distinct, intense peak, devoid of other minor peaks within the absorption spectrum, indicates the high purity of synthesized ZnO NPs. The shift in peak wavelength toward longer wavelengths as the concentration of the orange peel extract increases is attributed to the increased availability of electron donors at a higher concentration of the reducing agent. These electron donors aid in the reduction of precursor ions into their corresponding neutral atoms. This indicates that increasing the concentration of the reducing agent promotes the generation of a large number of nanoparticles, evident in a more pronounced signal during absorbance measurement.
The band gap of the ZnO NPs was determined using the Tauc plot (Equation 1). Figure 8 (A, B, C, and D) illustrate various concentrations of reducing agents, specifically the ratios of 0.5:2, 0.75:2, 1:2, and 2:2. Analysis of the Tauc plot revealed that the band gap values for samples A, B, C, and D are 3.27 eV, 3.24 eV, 3.23 eV, and 3.21 eV, respectively. Table 2 is the energy band gap of the nanoparticles versus the concentration of the reducing agent.
Figure 9 illustrates a graph showing the relationship between the energy band gap of ZnO NPs and the concentration of the reducing agent. A variation in the band gap is observed with changes in the concentration of orange peel extract. In particular, ZnO NPs with the highest orange peel extract concentration (1 v/v or 2: 2 ratio) demonstrate the lowest band gap energy of 3.21 eV. Consequently, it is evident from these findings that an increase in the concentration of orange peel extract leads to a reduction in the band-gap values. To further investigate the cause of the energy band reduction while increasing the concentration of orange peel extract, the size of the nanoparticle was determined using the effective mass model.
Size Determination from the Band Gap: The size of the ZnO NPs was determined based on the band gap using the effective mass model (Equation 4). Figure 10 illustrates the relationship between the size of the ZnO NPs and the concentration of the reducing agent. The increase in reducing agent concentrations leads to a corresponding increase in the size of the ZnO NPs. This phenomenon occurs as a result of the conversion of more Zn+ to Zn as the concentration of the reducing agent rises, thereby increasing the surface reaction rate. The band gap widens as the particle size decreases, since the proximity of electron-hole pairs results in a non-negligible columbic interaction, leading to heightened kinetic energy.
Determination of the surface energy of ZnO NPs: Surface energy serves as a crucial parameter for nanoparticles, influencing various aspects such as their growth mechanism, morphology, reactivity in different environments, as well as surface segregation. The determination of surface energy is dependent on the size of the ZnO NPs, as indicated in Equation 6. Within this study, the surface energy of the ZnO NPs was established on the basis of its size. The relationship between surface energy and the size of ZnO NPs is illustrated in Figure 11a, revealing an increase in surface energy with the growth of ZnO NPs. Additionally, Figure 11b presents the correlation between surface energy and the concentration of the reducing agent. The observed increase in surface energy with increasing reducing agent concentration can be attributed to the subsequent increase in size leading to a larger surface area and ultimately a higher surface energy.
Estimation of the Number of ZnO NPs: Nanoparticles made from semiconductors strongly interact with light at a specific wavelength. Their unique extinction peaks on UV-vis spectra can be utilized to calculate nanoparticle concentrations via the Beer-Lambert law (equation 7). To accurately calculate the concentration as per Equation 7, it is essential to have knowledge of the molar extinction coefficient specific to the nanoparticles under consideration. The extinction coefficient has been determined for ZnO NPs in correlation with their particle size. The relevant data was extracted from ref [14] and it was replotted using matplotlib, see Figure 12. The fitting process was carried out utilizing SymPy optimize, to establish a mathematical correlation between the extinction coefficient and particle size. The fit equation is ε=0.02564 r3 + 0.02051 r2 - 0.2084 r + 1.511 with R square value of 0.99 and the number of nanoparticles can be estimated using equation 8
Figure 13 illustrates a graph showing the amount of ZnO NPs present in the solution in relation to the concentration of the reducing agent. Rapid growth in the ZnO NPs count occurs as the concentration of the reducing agent increases from zero to 0.4, after which the rate of change decelerates with further increases in concentration. This phenomenon can be attributed to the critical role that zinc ions and the reducing agent play in the production of zinc oxide nanoparticles. Manipulation of only one factor, such as the concentration of the reducing agent in this scenario, can significantly impact the rate of nanoparticle formation, provided that a sufficient quantity of zinc ions is available for reduction. Conversely, if the concentration of the reducing agent increases without a corresponding increase in zinc ions, there will be no significant influence on the formation rate.
Estimation of the Uniformity of the ZnO NPs: The uniformity of the nanoparticles can be related to the values of the full width at half-maximum of the UV-vis spectra. Figure 14 is a plot of the full width at half maximum of the UV-vis spectra of the ZnO NPs versus concentration of the reducing agent. The plot shows an increase in the FWHM as the concentration of the reducing agent increased, indicating the formation of different sizes of ZnO NPs. This is because as the concentration of the reducing agent increases, the non-uniformity of the ZnO NPs increases because more and more Zn+ is reduced to Zn, thereby creating new nucleation.
Furrier transform infrared (FTIR) spectroscopy analysis:Figure 15a shows the FTIR spectrum of orange peel extract that shows absorption bands at 2924 cm-1 associated with unsaturated groups (C-N), at 1739 cm-1 indicating the presence of C=O stretching bands, at 1640 cm-1 corresponding to the stretching of the functional groups C = C and C = O, at 1427 cm-1 associated with the N-H group of amides, and at 1059 cm-1 related to the vibration of bending of C-H. Figures 15b-d illustrate the FTIR spectra of ZnO NPs synthesized using varying proportions of orange peel extracts (0.5:2, 0.75:2 and 1:2 ratios). The FTIR spectra of alcohols, phenols, or water molecules exhibit a significant peak around 3414–3442 cm-1 attributed to O-H stretching. Peaks within the range of 1400–1649 cm-1 are linked to C=O stretching, while the band at 1398 cm-1 is associated with the bending vibration of COH. Furthermore, the bands spanning from 1000 to 1300 are attributed to the C-O stretching of esters and carboxylic functional groups. Zn-OH stretching vibrations are denoted by small, intense bands at 875 cm-1 and 712 cm-1.
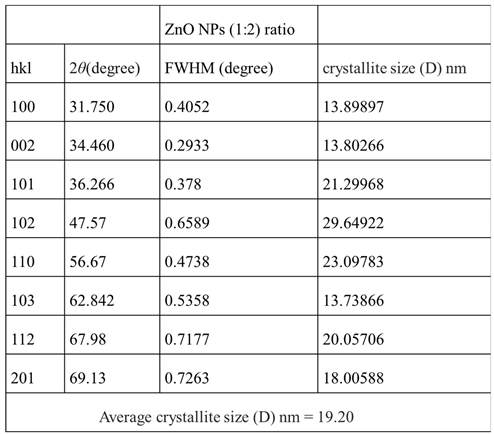
XRD Analyses: Figure 16 shows the XRD pattern of ZnO NPs synthesized using zinc nitrate dihydrate and orange peel extract in 1:2 ratios. The distinct diffraction peaks at 2θ = 31.78º, 34.44º, 36.27º, 47.57º, 56.62º, 62.89º, 67.98º and 69.12º were assigned to planes (100), (002), (101), (102), (110), (103), (112), and (201), respectively. The ZnO NP diffraction peaks were determined to be zincate phases with hexagonal wurtzite crystal structures and lattice constants of a = b = 3.248532 and c = 5.203366. The results obtained are in good agreement with those previously reported. The average crystalline size of the zinc oxide nanoparticles was determined using the Debye-Scherer equation (Equation 2). The estimated average crystalline size (D) of the synthesized zinc oxide nanoparticles using orange peel extract was found to be 19.2 nm.

Table 3.
Average crystalize sizes calculated from equation 2 of the the ZnO NPs synthesized using 1: 2 ratio of orange peel extract and zinc nitrate dehydrate. .
Table 3.
Average crystalize sizes calculated from equation 2 of the the ZnO NPs synthesized using 1: 2 ratio of orange peel extract and zinc nitrate dehydrate. .
Thermogravimetric Analysis (TGA): Thermogravimetric analysis was conducted to investigate the thermal stability of ZnO nanoparticles. The results of this investigation were also employed to authenticate the existence of organic molecules that function as capping agents, as the decomposition of organic molecules at lower temperatures leads to weight loss, thus confirming the presence of such agents. A sample weighing 1 g of zinc oxide nanoparticles was heated to 850 ° C with subsequent weight loss recording. The weight loss plot against temperature for the zinc oxide nanoparticles is shown in Figure 17. The graph illustrates four distinct weight loss phases within the defined temperature range. The initial decomposition, which occurs between 30 ° C and 60 ° C with a weight loss of 0.37%, is related to the elimination of surface impurities adhered to zinc oxide. The subsequent phase, observed from 60 ° C to 305 ° C with a weight loss of 0.56%, is attributed to the evaporation of water molecules and the dehydration of hydroxyls. The third phase, which spanned 305 ° C to 326°C, resulted in a weight loss of 1.12%, possibly due to the breakdown of the organic compounds that protect the synthesized ZnO NPs. The final phase of weight loss is associated with the decomposition of any residual organic components or the conversion of specific inorganic species present in ZnO NPs at temperatures ranging from 326 ° C to 670°C, leading to a weight loss of 0.5%. After 670 ° C, no substantial weight loss was observed, which confirms the thermal stability of the ZnO NPs.
Scanning Electron Microscope (SEM) Analysis: The morphology of the ZnO NPs was revealed by SEM analysis, as depicted in Figure 18. The particle sizes observed in the SEM images ranged from 75 to 180 nm, demonstrating consistency with prior research outcomes [15]. Discrepancies in the average particle size reported by XRD (19.2 nm) and SEM (50–180 nm) may be due to the limited sampling region in the SEM image and the extended storage duration (90 days for SEM and 10 days for XRD) before SEM analysis, which could lead to particle aggregation and coalescence.
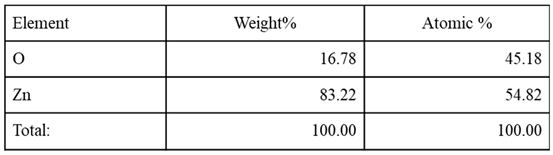
Energy Dispersive X-ray Spectroscopy (EDX) Analysis: Elemental analysis was performed using energy dispersive X-ray spectroscopy (EDX), and the results are summarized in Table 4. The existence of zinc was confirmed by the presence of a few peaks between 1 and 10 Kev, including a significant peak at 1 keV, as shown in the EDX spectra (Figure 19 (A)). The zinc and oxygen elements are present with a weight percentage of 83.22% and 16.78%, respectively, which is close to the bulk weight percentage of zinc oxide (80 for Zn and 20 for O). In addition, the analysis showed atomic percentages of 54.82% for zinc and 45.18% for oxygen, with an atomic percentage composition similar to the results reported in related studies. The distribution of elements within a sample is depicted in elemental mapping images, as shown in Figures 19 (B and C). The absence of any other elements suggests that the zinc oxide nanoparticles that were produced are extremely pure.
4. Conclusions
In the present study, zinc oxide nanoparticles were effectively produced using orange peel extract as a reducing agent which is an environmental friendly and economical procedure. The synthesized zinc oxide nanoparticles were characterized using UV-vis, FT-IR, XRD, SEM, EDX, and TGA. Initially, the formation of zinc oxide nanoparticles was confirmed by a visual change in color from pale yellow to a white precipitate. The observed decrease in conductivity during the synthesis process provides preliminary evidence for the reduction of zinc ions and the potential formation of ZnO NPs. UV-vis spectral analysis confirmed that the maximum absorption was in the 365 to 380 nm range, which is specific for ZnO NPs. Furthermore, the optical band-gap energies were determined from UV-vis spectroscopic data using the Tauc plot. An increase in the concentration of the reducing agent resulted in a decrease in the ZnO NPs band gap and a shift in the absorption maxima toward higher wavelengths. FTIR analysis showed characteristic peaks at 436, 443, and 450 cm-1, confirming the formation of ZnO NPs. XRD analysis confirmed the hexagonal wurtzite structure of the ZnO NPs, with well-matched diffraction peaks. Furthermore, the XRD analysis showed that the average crystal sizes of the ZnO NPs is 19.2 nm. SEM analysis confirmed the size and morphology of the nanoparticles. The elemental composition, elemental mapping, and purity were determined by EDX studies. TGA confirmed a total weight loss of 1.56% of the nanoparticles when heated to 670 ° C.
Acknowledgments
The authors acknowledge the International Science Program (ISP), Sweden, and Bahir Dar University, Ethiopia, for financial support.
Data Availability
The data can be obtained from the corresponding author upon request.
Conflicts of Interest
The author declares that there are no conflicts of interest with respect to the publication of this paper.
References
- Marouzi, S.; Sabouri, Z.; Darroudi, M. Greener synthesis and medical applications of metal oxide nanoparticles. Ceram. Int. 2021, 47, 19632–19650. [Google Scholar] [CrossRef]
- Chavali, M.S.; Nikolova, M.P. Metal oxide nanoparticles and their applications in nanotechnology. SN Appl. Sci. 2019, 1, 607. [Google Scholar] [CrossRef]
- Singh, J.; Dutta, T.; Kim, K.-H.; Rawat, M.; Samddar, P.; Kumar, P. ‘Green’ synthesis of metals and their oxide nanoparticles: applications for environmental remediation. J. Nanobiotechnol. 2018, 16, 84. [Google Scholar] [CrossRef] [PubMed]
- Ijaz, I. , Gilani, E., Nazir, A. & Bukhari, A. Detail review on chemical, physical and green synthesis, classification, characterizations and applications of nanoparticles. Green Chem. Lett. Rev. 13, 59–81 (2020).
- Osman, A.I.; Zhang, Y.; Farghali, M.; Rashwan, A.K.; Eltaweil, A.S.; El-Monaem, E.M.A.; Mohamed, I.M.A.; Badr, M.M.; Ihara, I.; Rooney, D.W.; et al. Synthesis of green nanoparticles for energy, biomedical, environmental, agricultural, and food applications: A review. Environ. Chem. Lett. 2024, 22, 841–887. [Google Scholar] [CrossRef]
- Rajalakshmi, T. U., Reena, T., Doss, A., Kumar, T. A. & Alahmadi, T. A. Evidence on temperature and concentration of reducing agents to control the nanoparticles growth and their microbial inhibitory efficacy Evidence on temperature and concentration of reducing agents to control the nanoparticles growth and their microbial i. (2023).
- Kim, H.-S.; Seo, Y.S.; Kim, K.; Han, J.W.; Park, Y.; Cho, S. Concentration Effect of Reducing Agents on Green Synthesis of Gold Nanoparticles: Size, Morphology, and Growth Mechanism. Nanoscale Res. Lett. 2016, 11, 1–9. [Google Scholar] [CrossRef] [PubMed]
- Malek, F. & Nahid, M. Influence of temperature and concentration on biosynthesis and characterization of zinc oxide nanoparticles using cherry extract. J. Nanostructure Chem. 8, 93–102 (2018).
- Kumar, B.; Smita, K.; Cumbal, L.; Debut, A. Green Approach for Fabrication and Applications of Zinc Oxide Nanoparticles. Bioinorg. Chem. Appl. 2014, 2014, 1–7. [Google Scholar] [CrossRef] [PubMed]
- Hale, P.S.; Maddox, L.M.; Shapter, J.G.; Voelcker, N.H.; Ford, M.J.; Waclawik, E.R.; Koenig, E.; Jacobs, A.; Lisensky, G.; Caetano, B.L.; et al. Growth Kinetics and Modeling of ZnO Nanoparticles. J. Chem. Educ. 2005, 82. [Google Scholar] [CrossRef]
- The, I. Surfaces 2.1.
- Shaba, E.Y.; Jacob, J.O.; Tijani, J.O.; Suleiman, M.A.T. A critical review of synthesis parameters affecting the properties of zinc oxide nanoparticle and its application in wastewater treatment. Appl. Water Sci. 2021, 11, 1–41. [Google Scholar] [CrossRef]
- Mamouei, M.; Budidha, K.; Baishya, N.; Qassem, M.; Kyriacou, P.A. An empirical investigation of deviations from the Beer–Lambert law in optical estimation of lactate. Sci. Rep. 2021, 11, 1–9. [Google Scholar] [CrossRef] [PubMed]
- Hens, Z.; Moreels, I. Light absorption by colloidal semiconductor quantum dots. J. Mater. Chem. 2012, 22, 10406–10415. [Google Scholar] [CrossRef]
- Gaspar, D.; Pimentel, A.C.; Mendes, M.J.; Mateus, T.; Falcão, B.P.; Leitão, J.P.; Soares, J.; Araújo, A.; Vicente, A.; Filonovich, S.A.; et al. Ag and Sn Nanoparticles to Enhance the Near-Infrared Absorbance of a-Si:H Thin Films. Plasmonics 2014, 9, 1015–1023. [Google Scholar] [CrossRef]
Figure 1.
Steps involved in the preparation of orange peel extract.
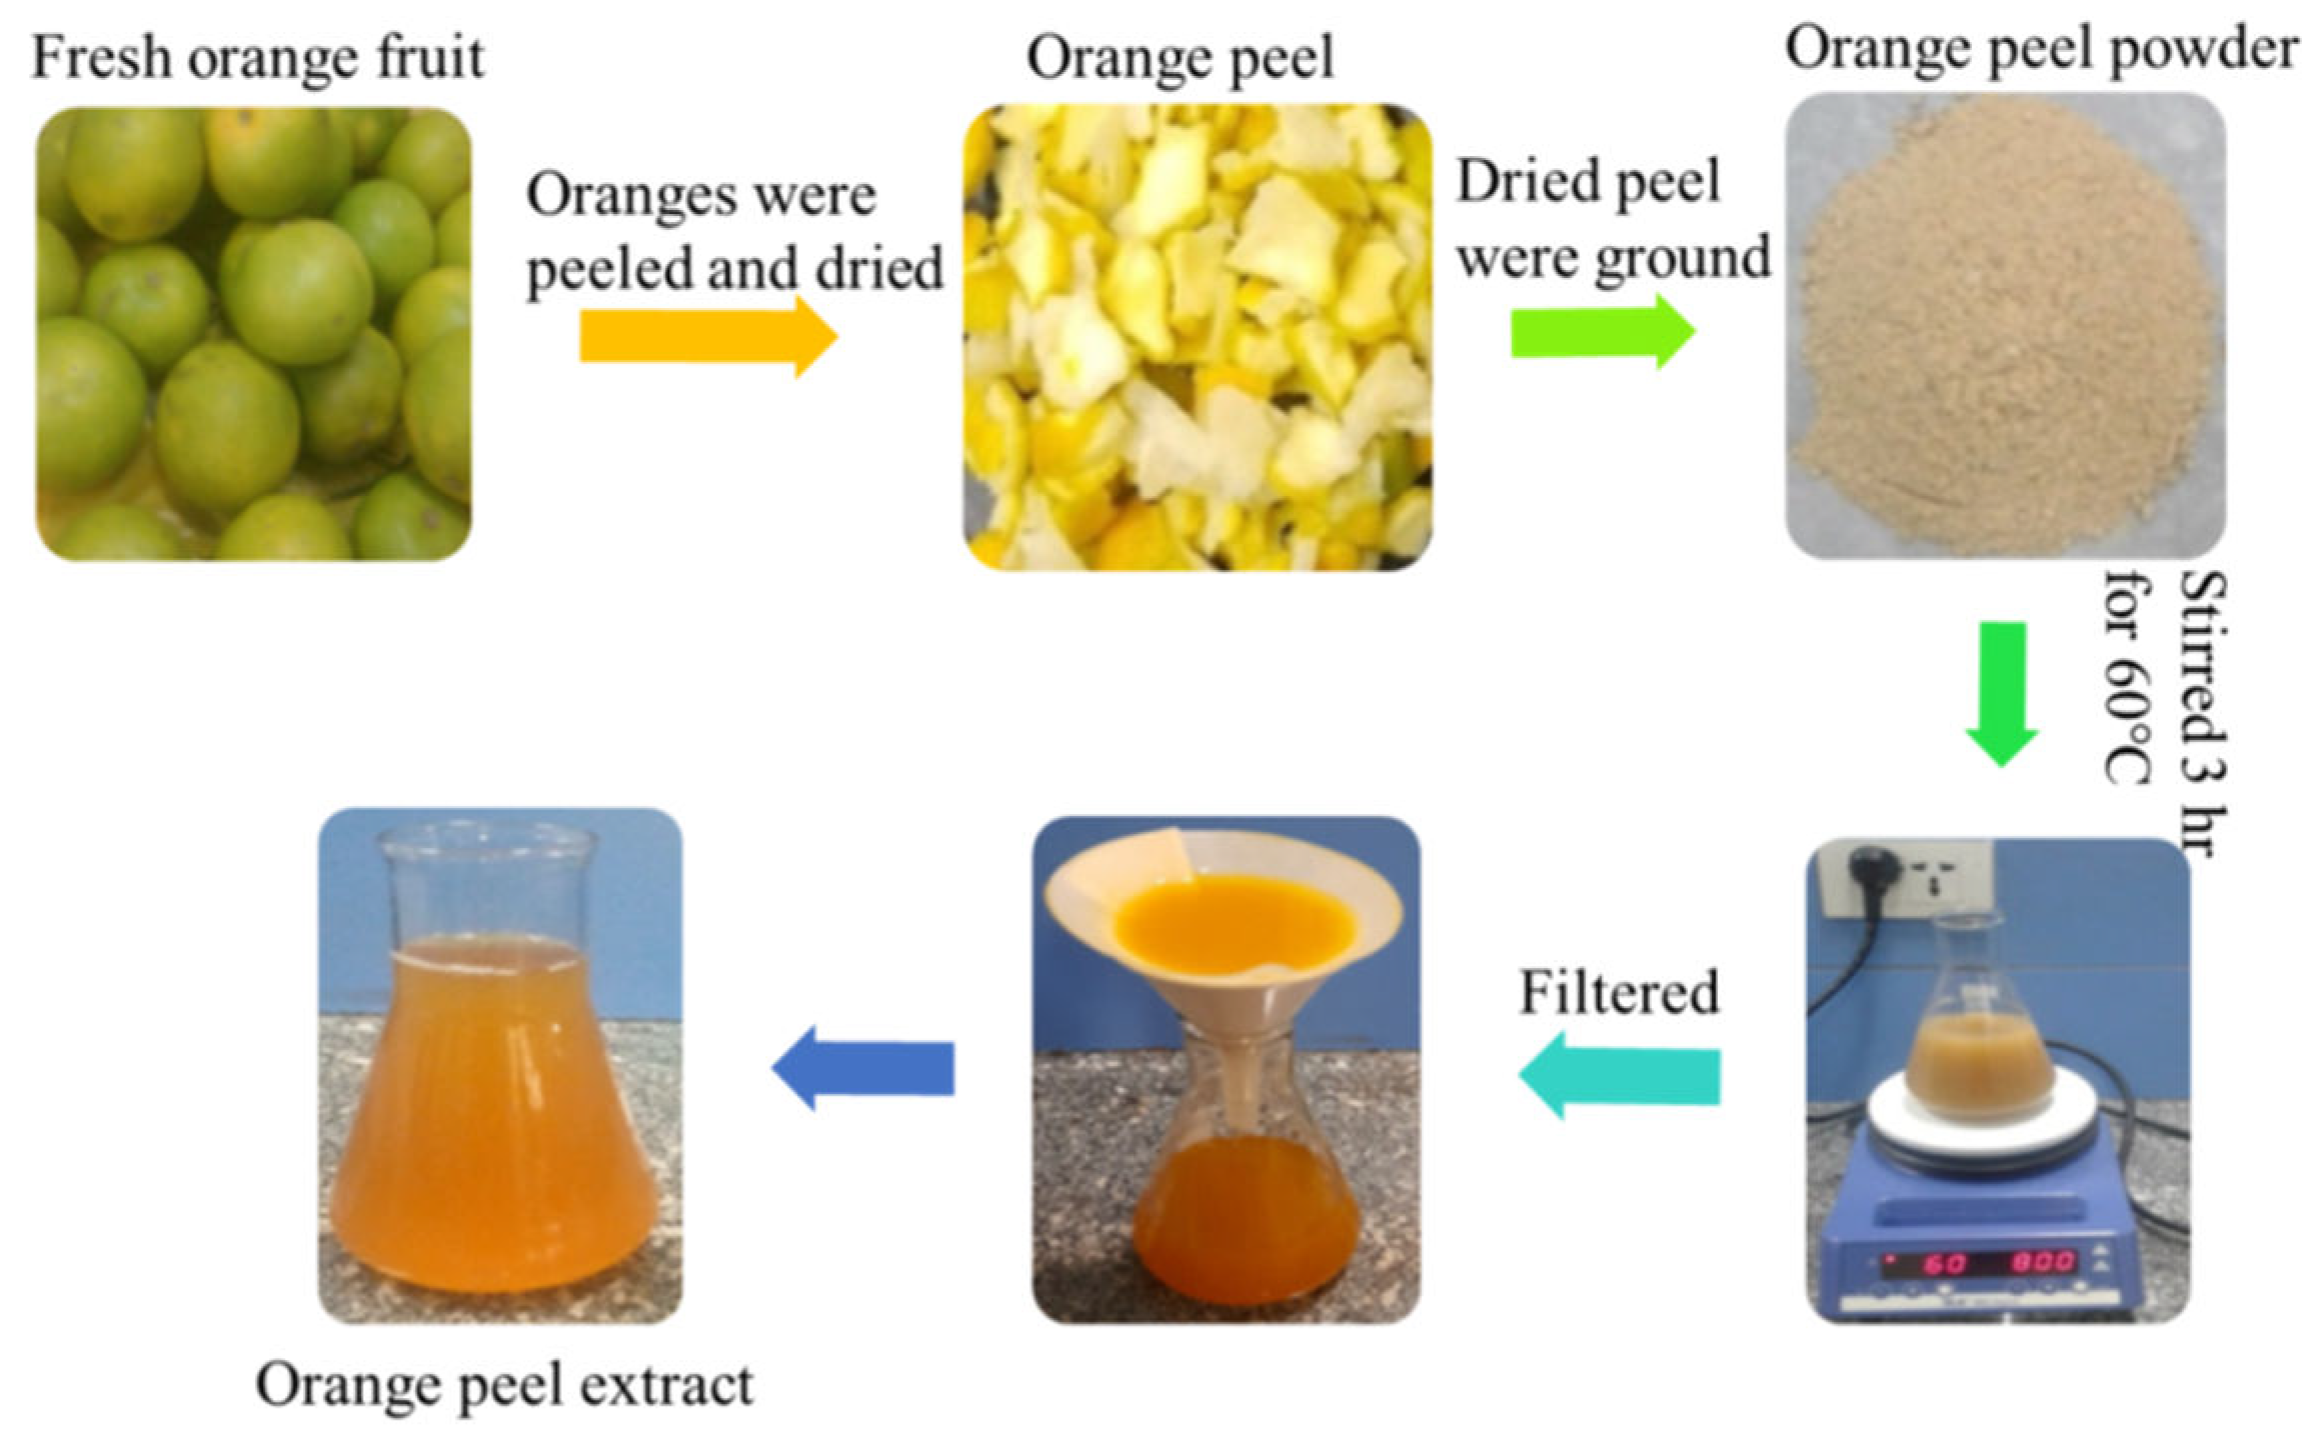
Figure 2.
Schematic diagram of the conductivity measurement during the synthesis of ZnO NPs.
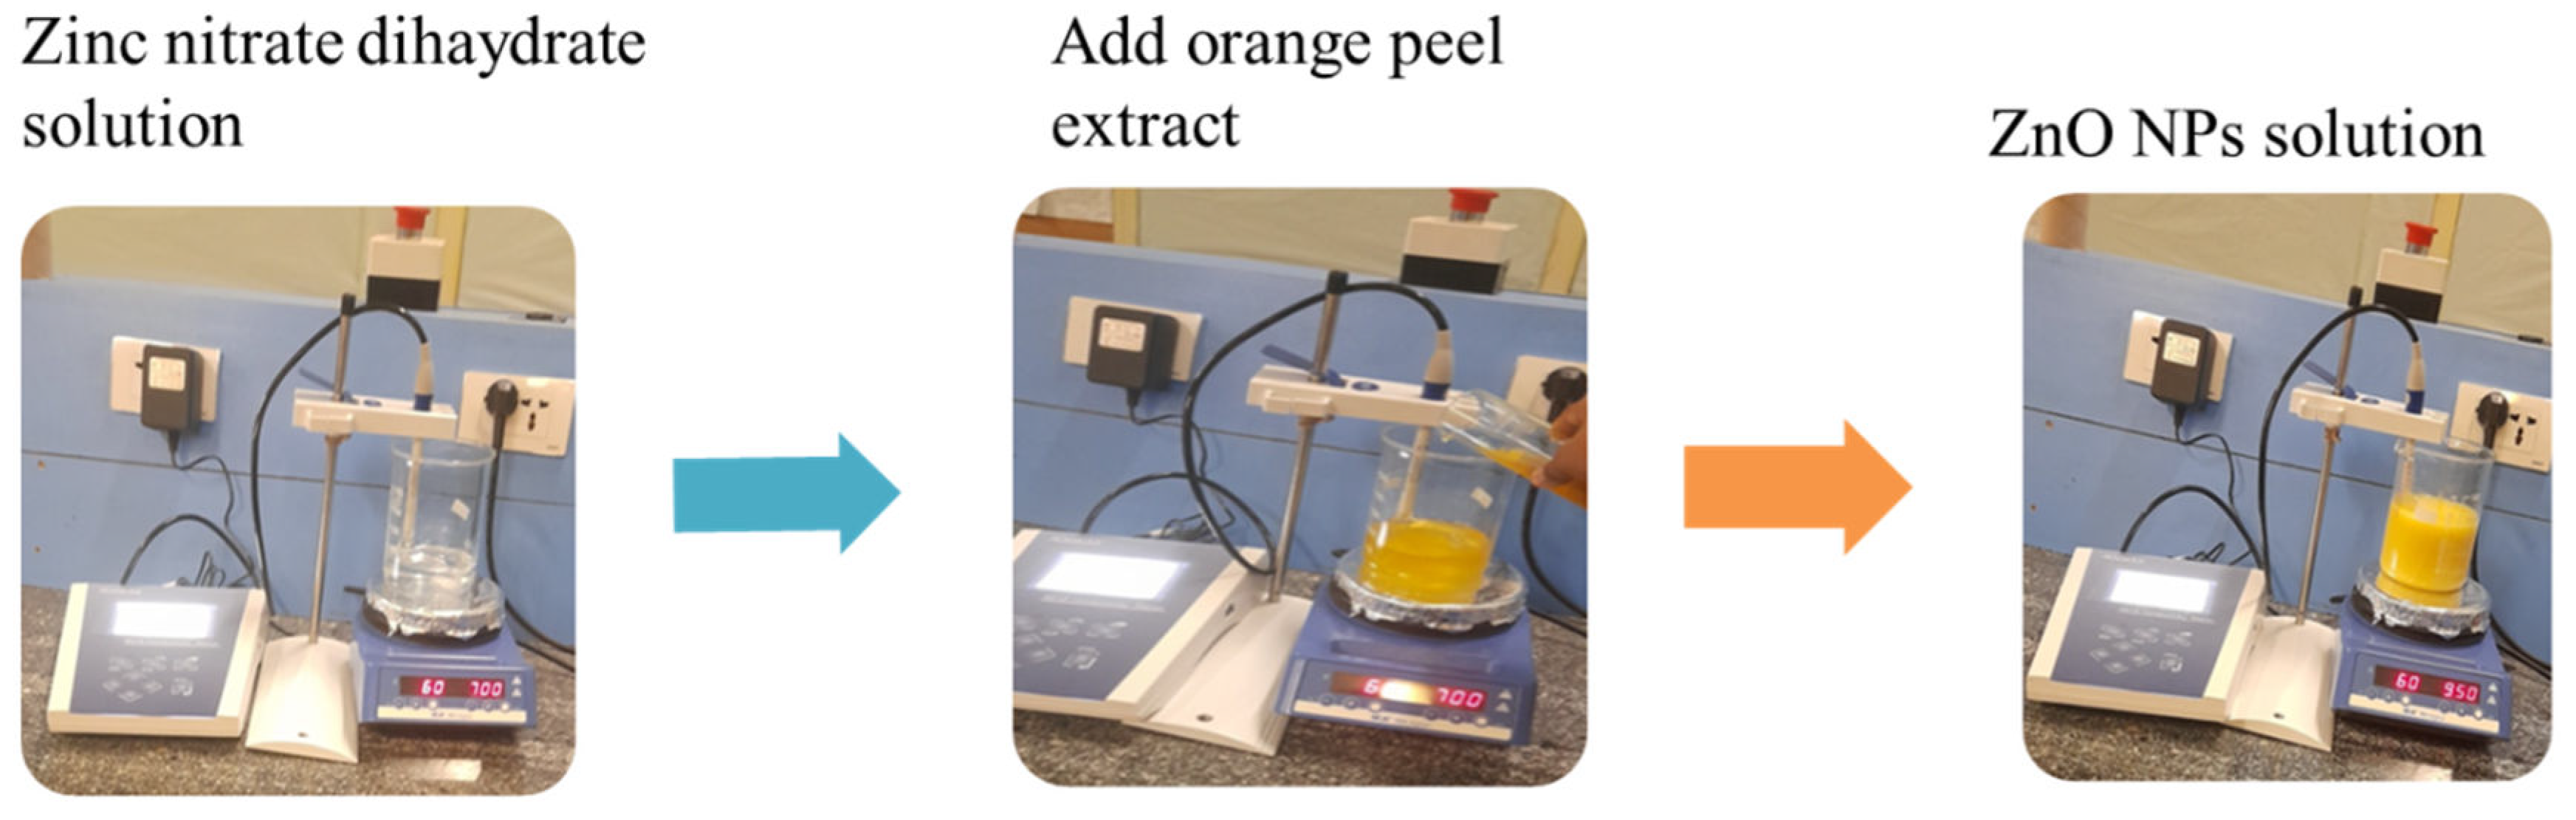
Figure 3.
a) Orange fruit peel extract and b) test tubes for phytochemical screening where A, B, C, D, and E corresponds to a screening for alkaloids, flavonoids, tannins, glycosides, and phenols, respectively.
Figure 3.
a) Orange fruit peel extract and b) test tubes for phytochemical screening where A, B, C, D, and E corresponds to a screening for alkaloids, flavonoids, tannins, glycosides, and phenols, respectively.
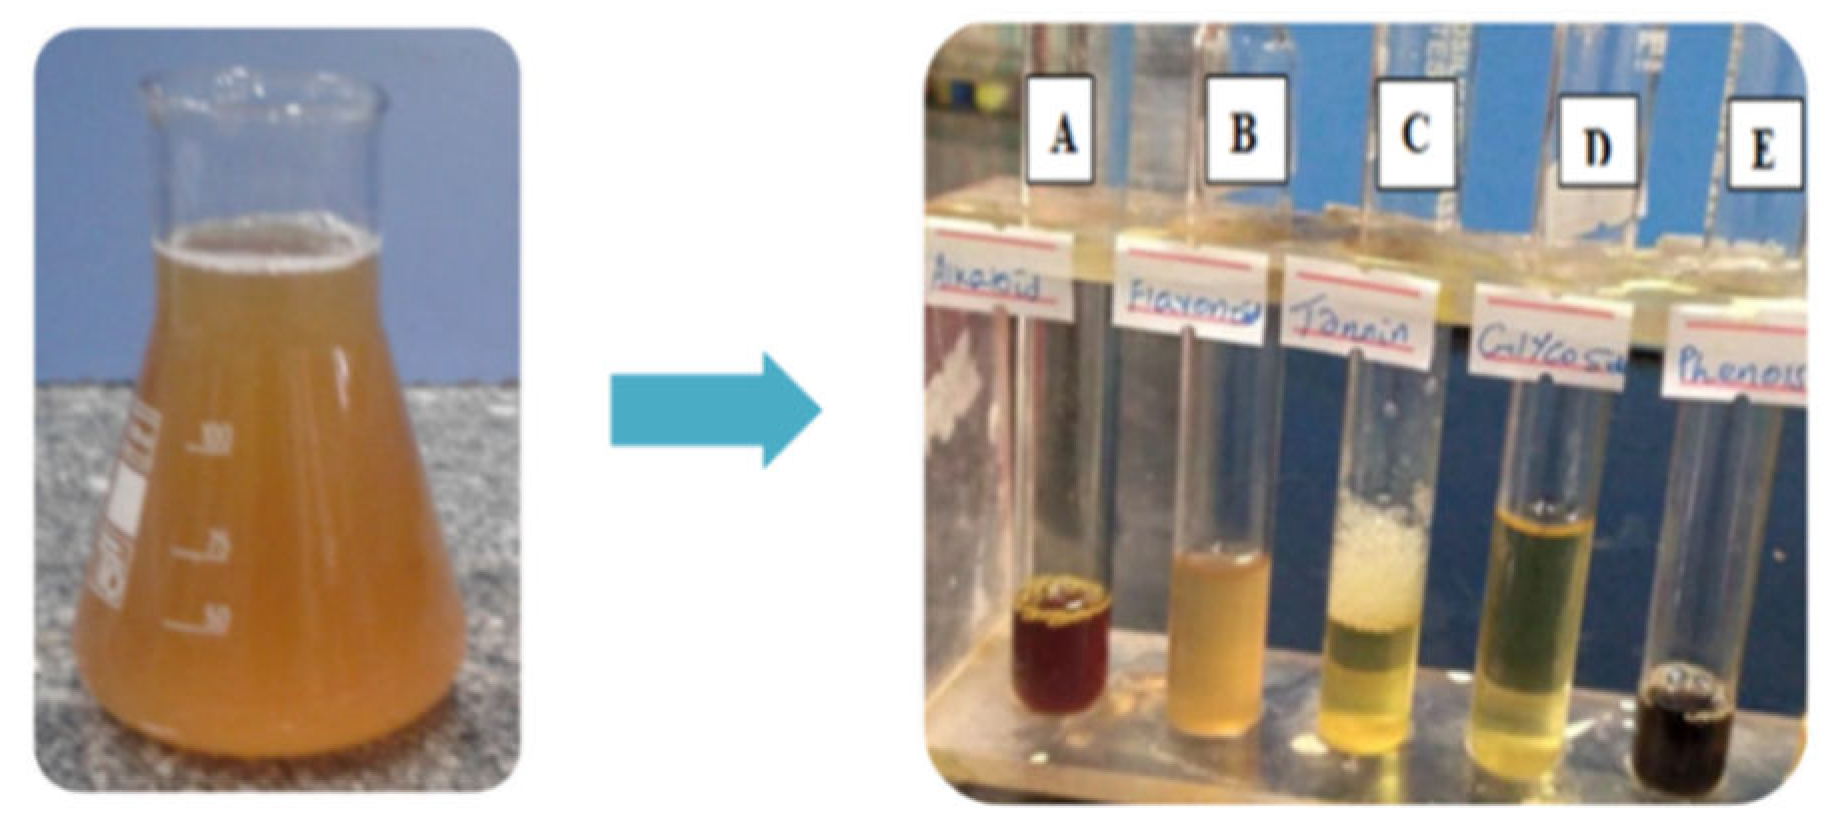
Figure 4.
Color changes were observed during the formation of ZnO NPs. Shown are: (A) Zn(NO3)2·6H2O solution (colorless), (B) orange peel extract (orange), (C) ZnO NP (pale yellow), (D) NaOH solution (colorless) and (E) final precipitate of ZnO NP (white).
Figure 4.
Color changes were observed during the formation of ZnO NPs. Shown are: (A) Zn(NO3)2·6H2O solution (colorless), (B) orange peel extract (orange), (C) ZnO NP (pale yellow), (D) NaOH solution (colorless) and (E) final precipitate of ZnO NP (white).
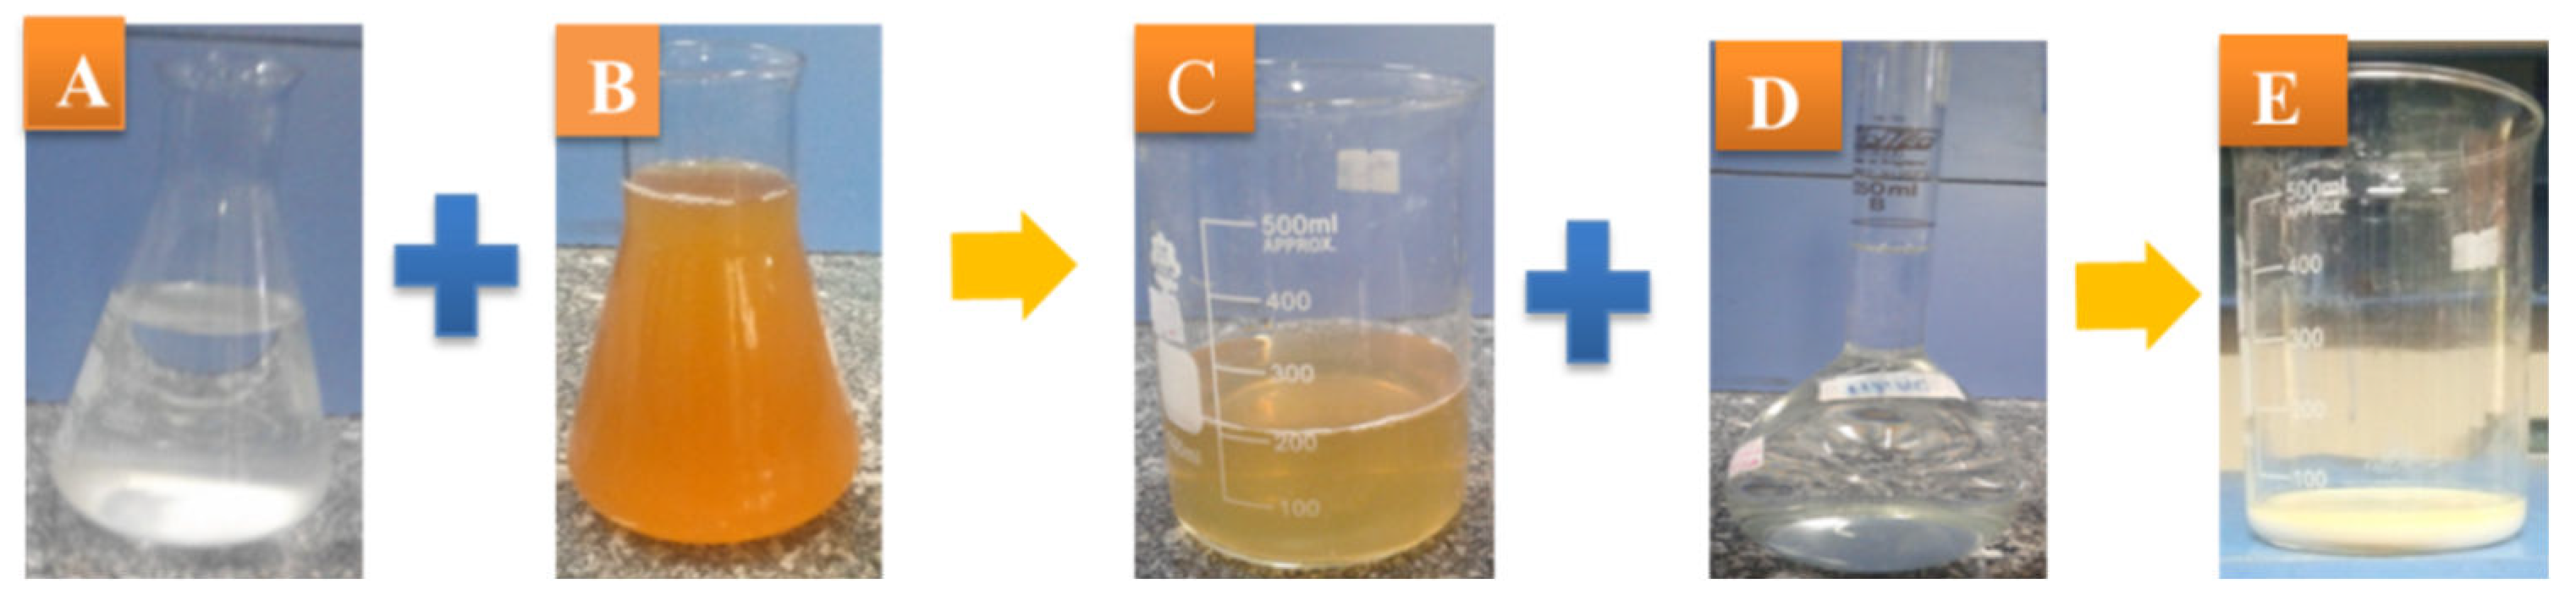
Figure 5.
Plot of conductivity versus time of reaction.
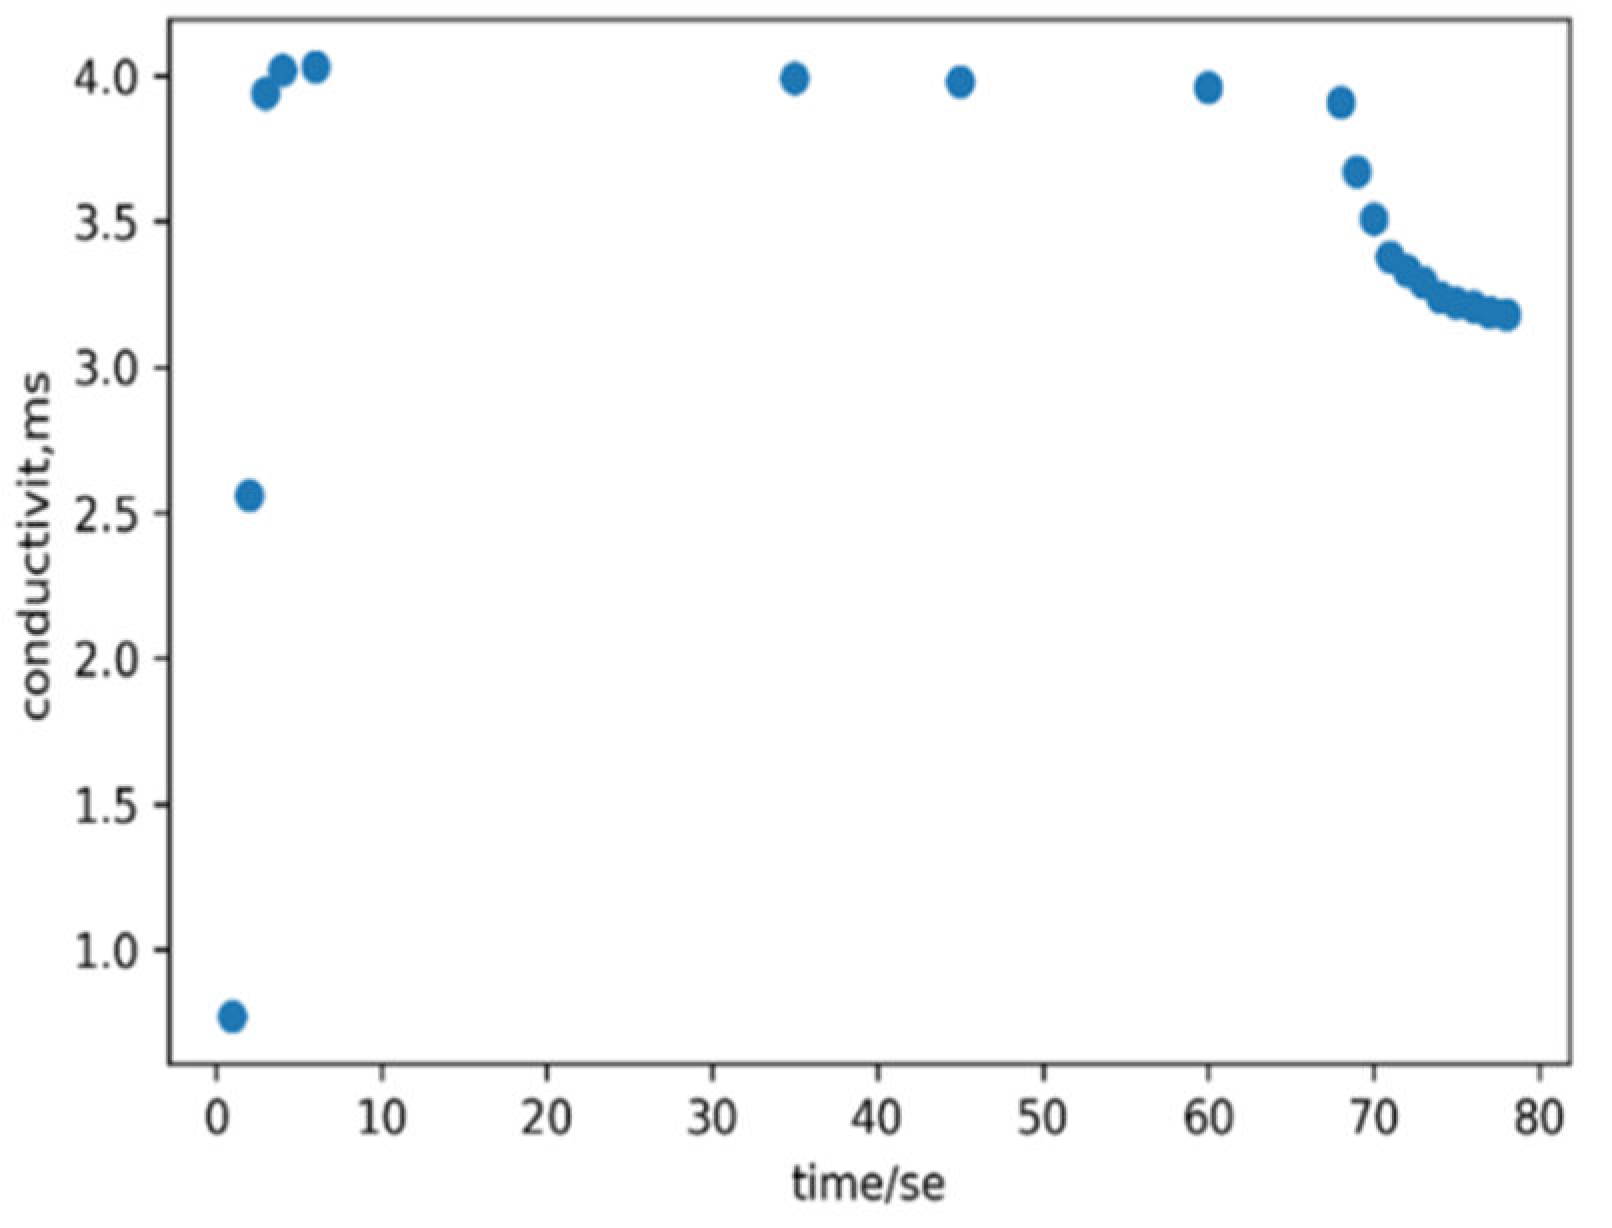
Figure 6.
UV–visible absorption spectra of orange peel extract and zinc nitrate solution.
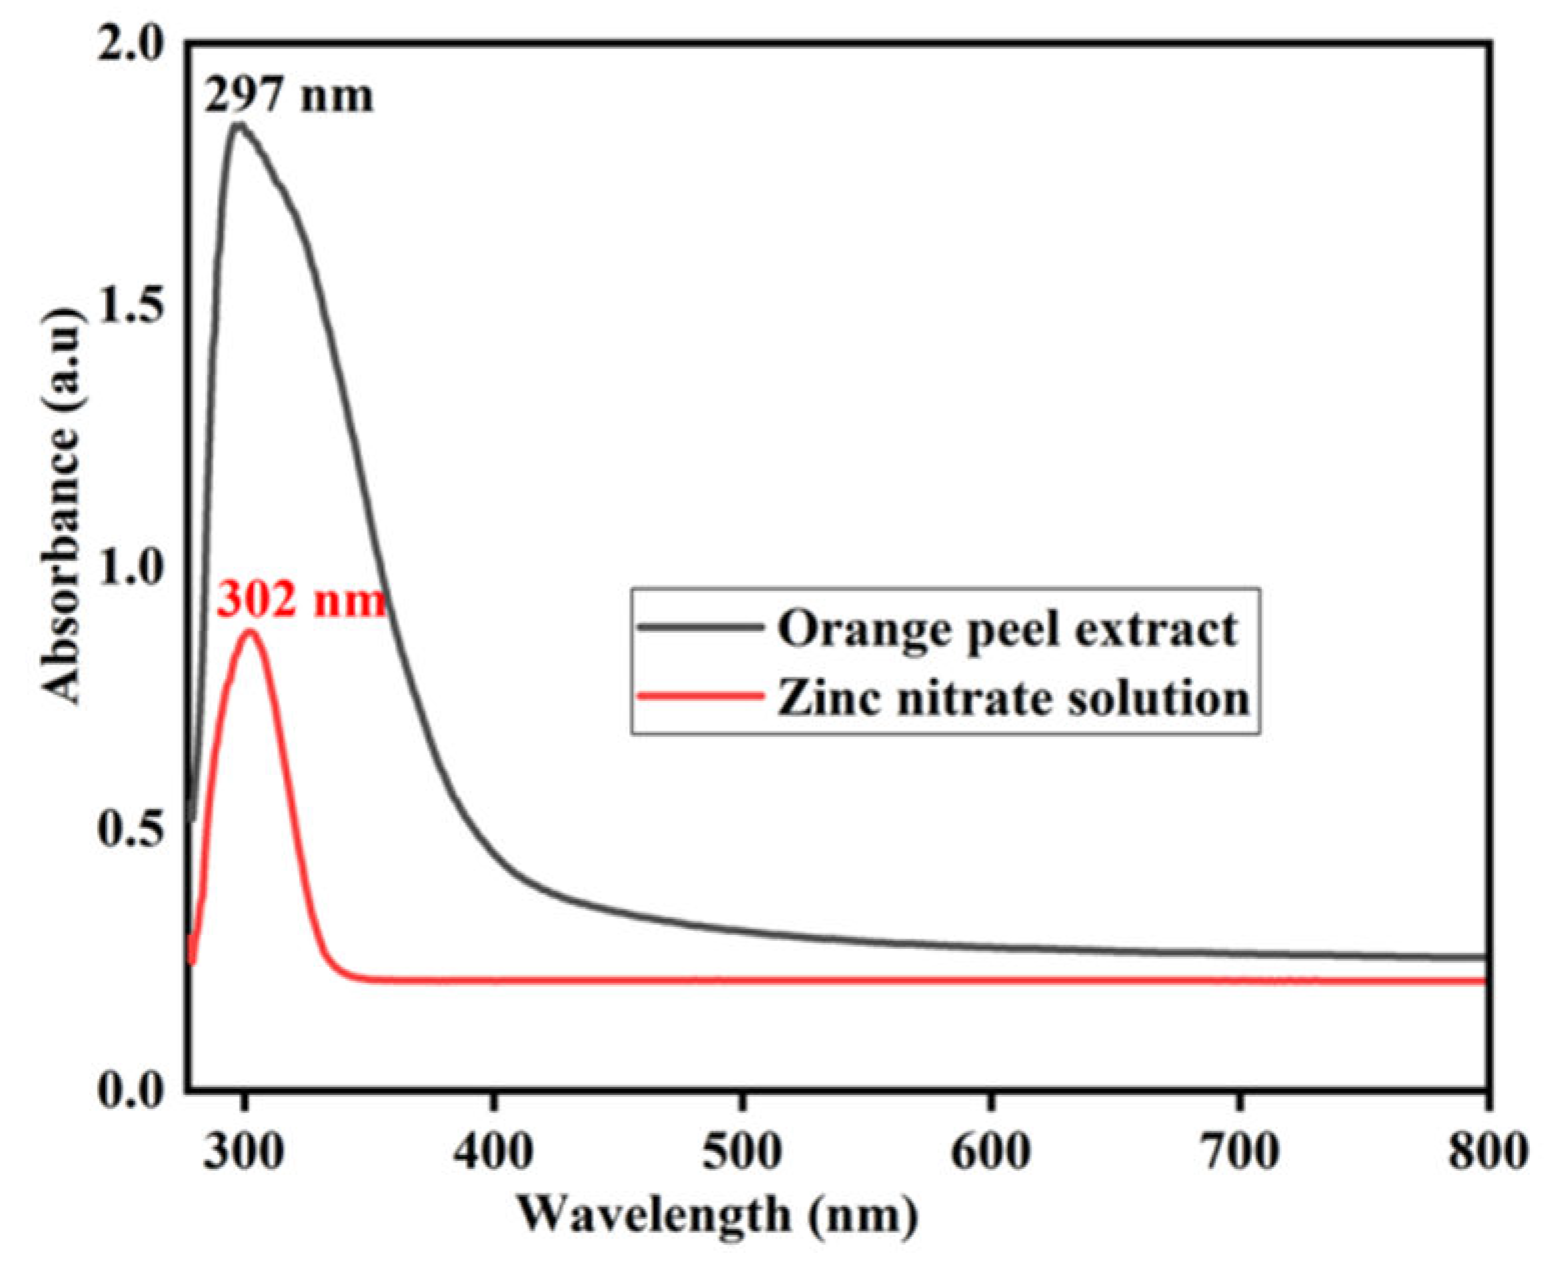
Figure 7.
UV-vis spectra of ZnO NPs at different concentrations of orange peel extract.
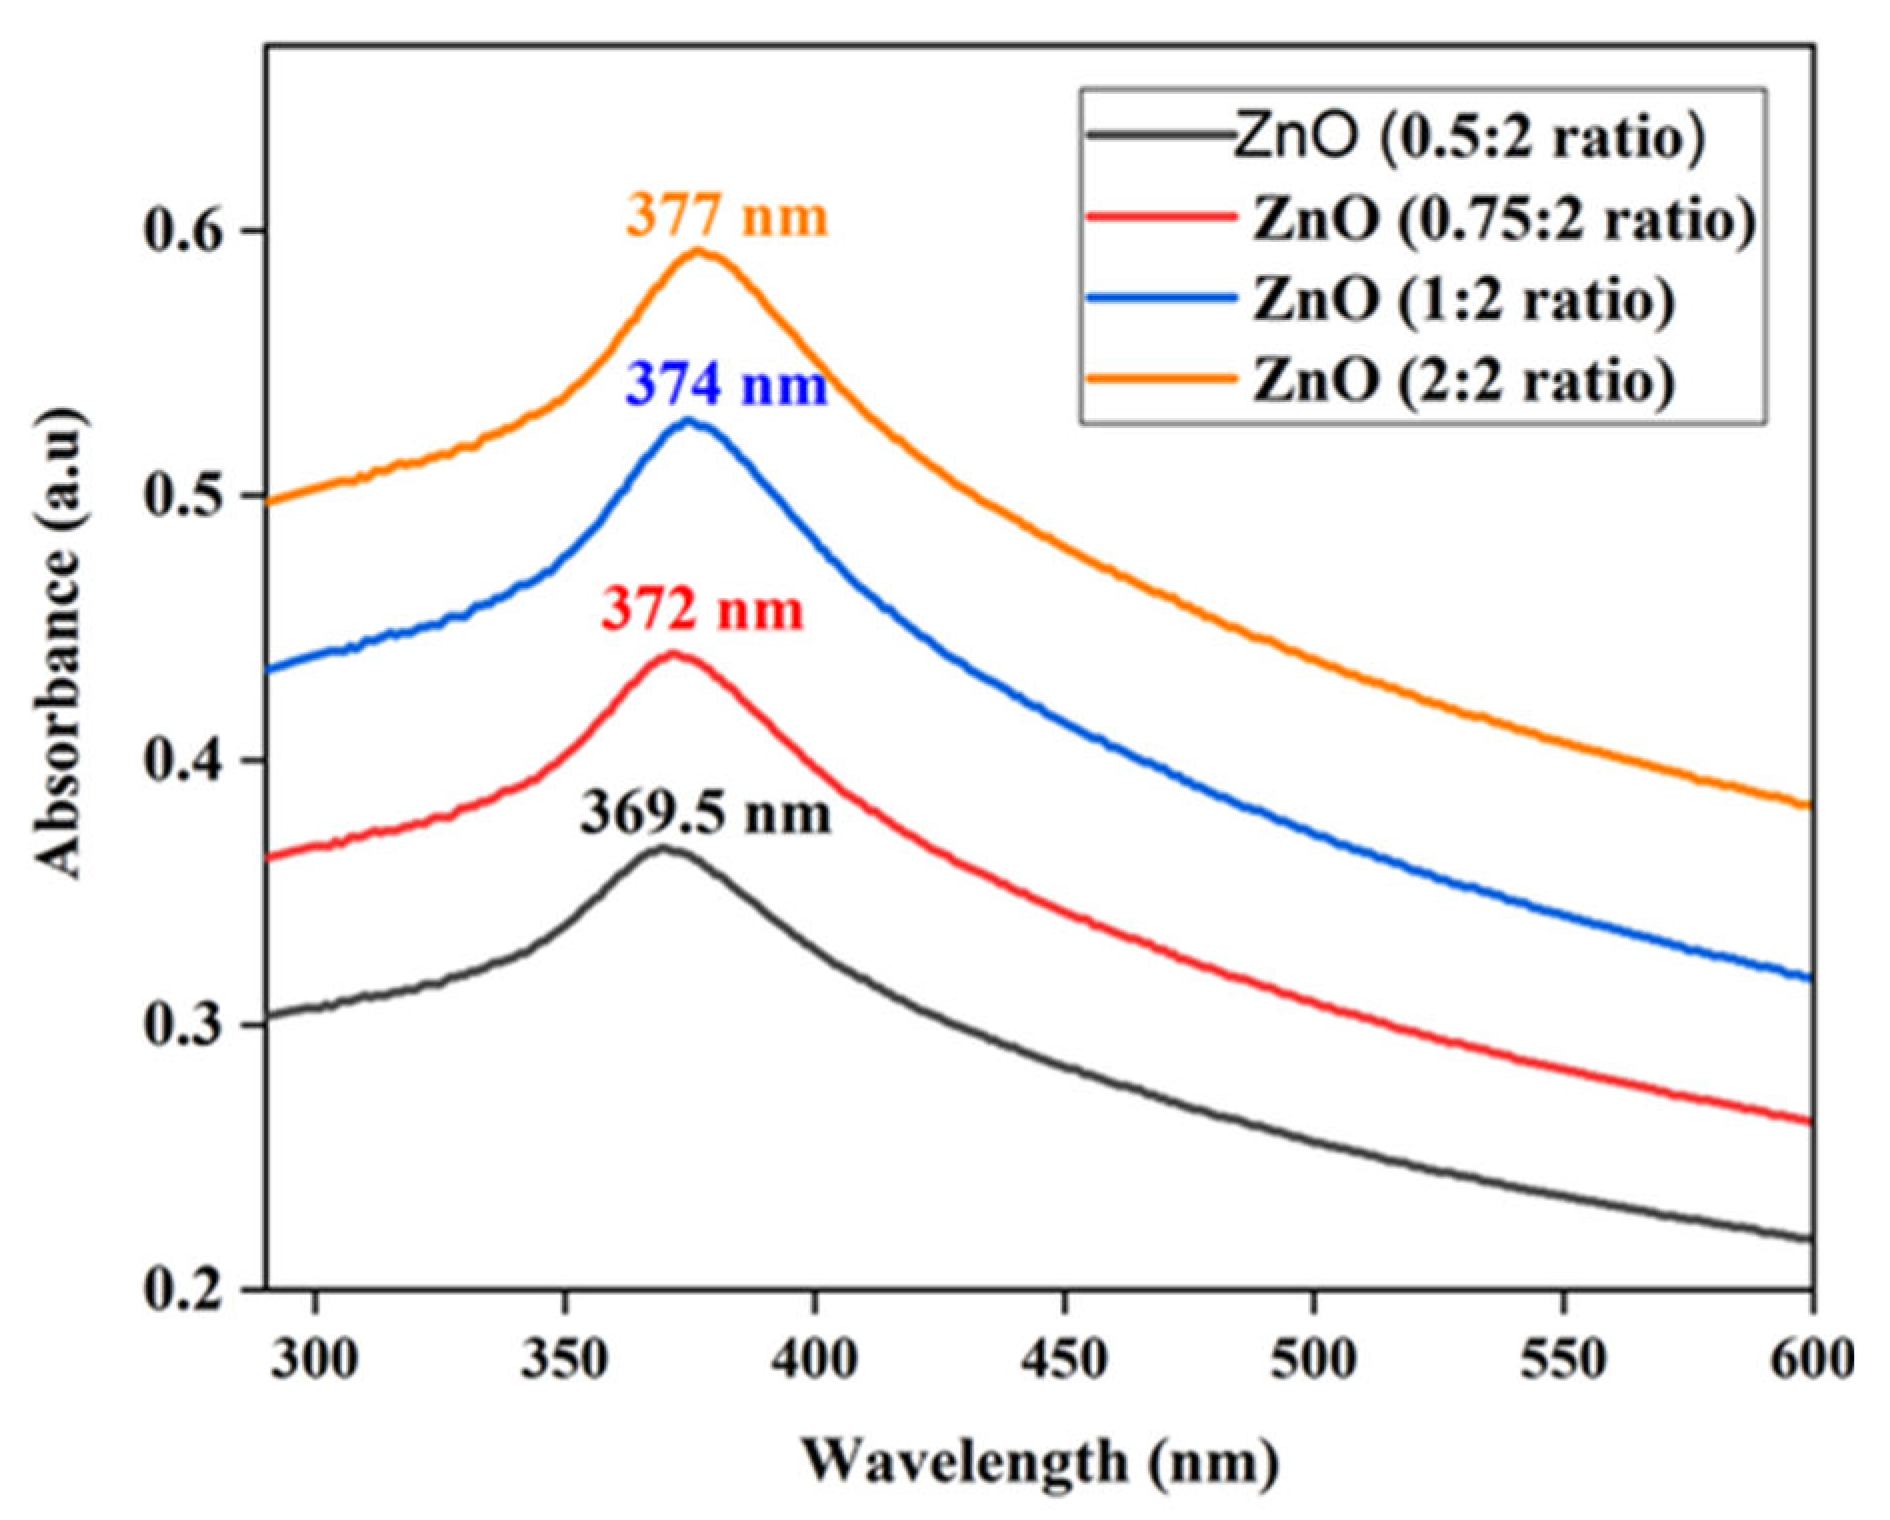
Figure 8.
UV-Vis absorption spectrum of ZnO NPs alongside the corresponding Tauc plot. Specifically, sample A is associated with a ratio of 0.5:2, sample B with a ratio of 0.75:2, sample C with a ratio of 1:2, and sample D with a ratio of 2:1.
Figure 8.
UV-Vis absorption spectrum of ZnO NPs alongside the corresponding Tauc plot. Specifically, sample A is associated with a ratio of 0.5:2, sample B with a ratio of 0.75:2, sample C with a ratio of 1:2, and sample D with a ratio of 2:1.
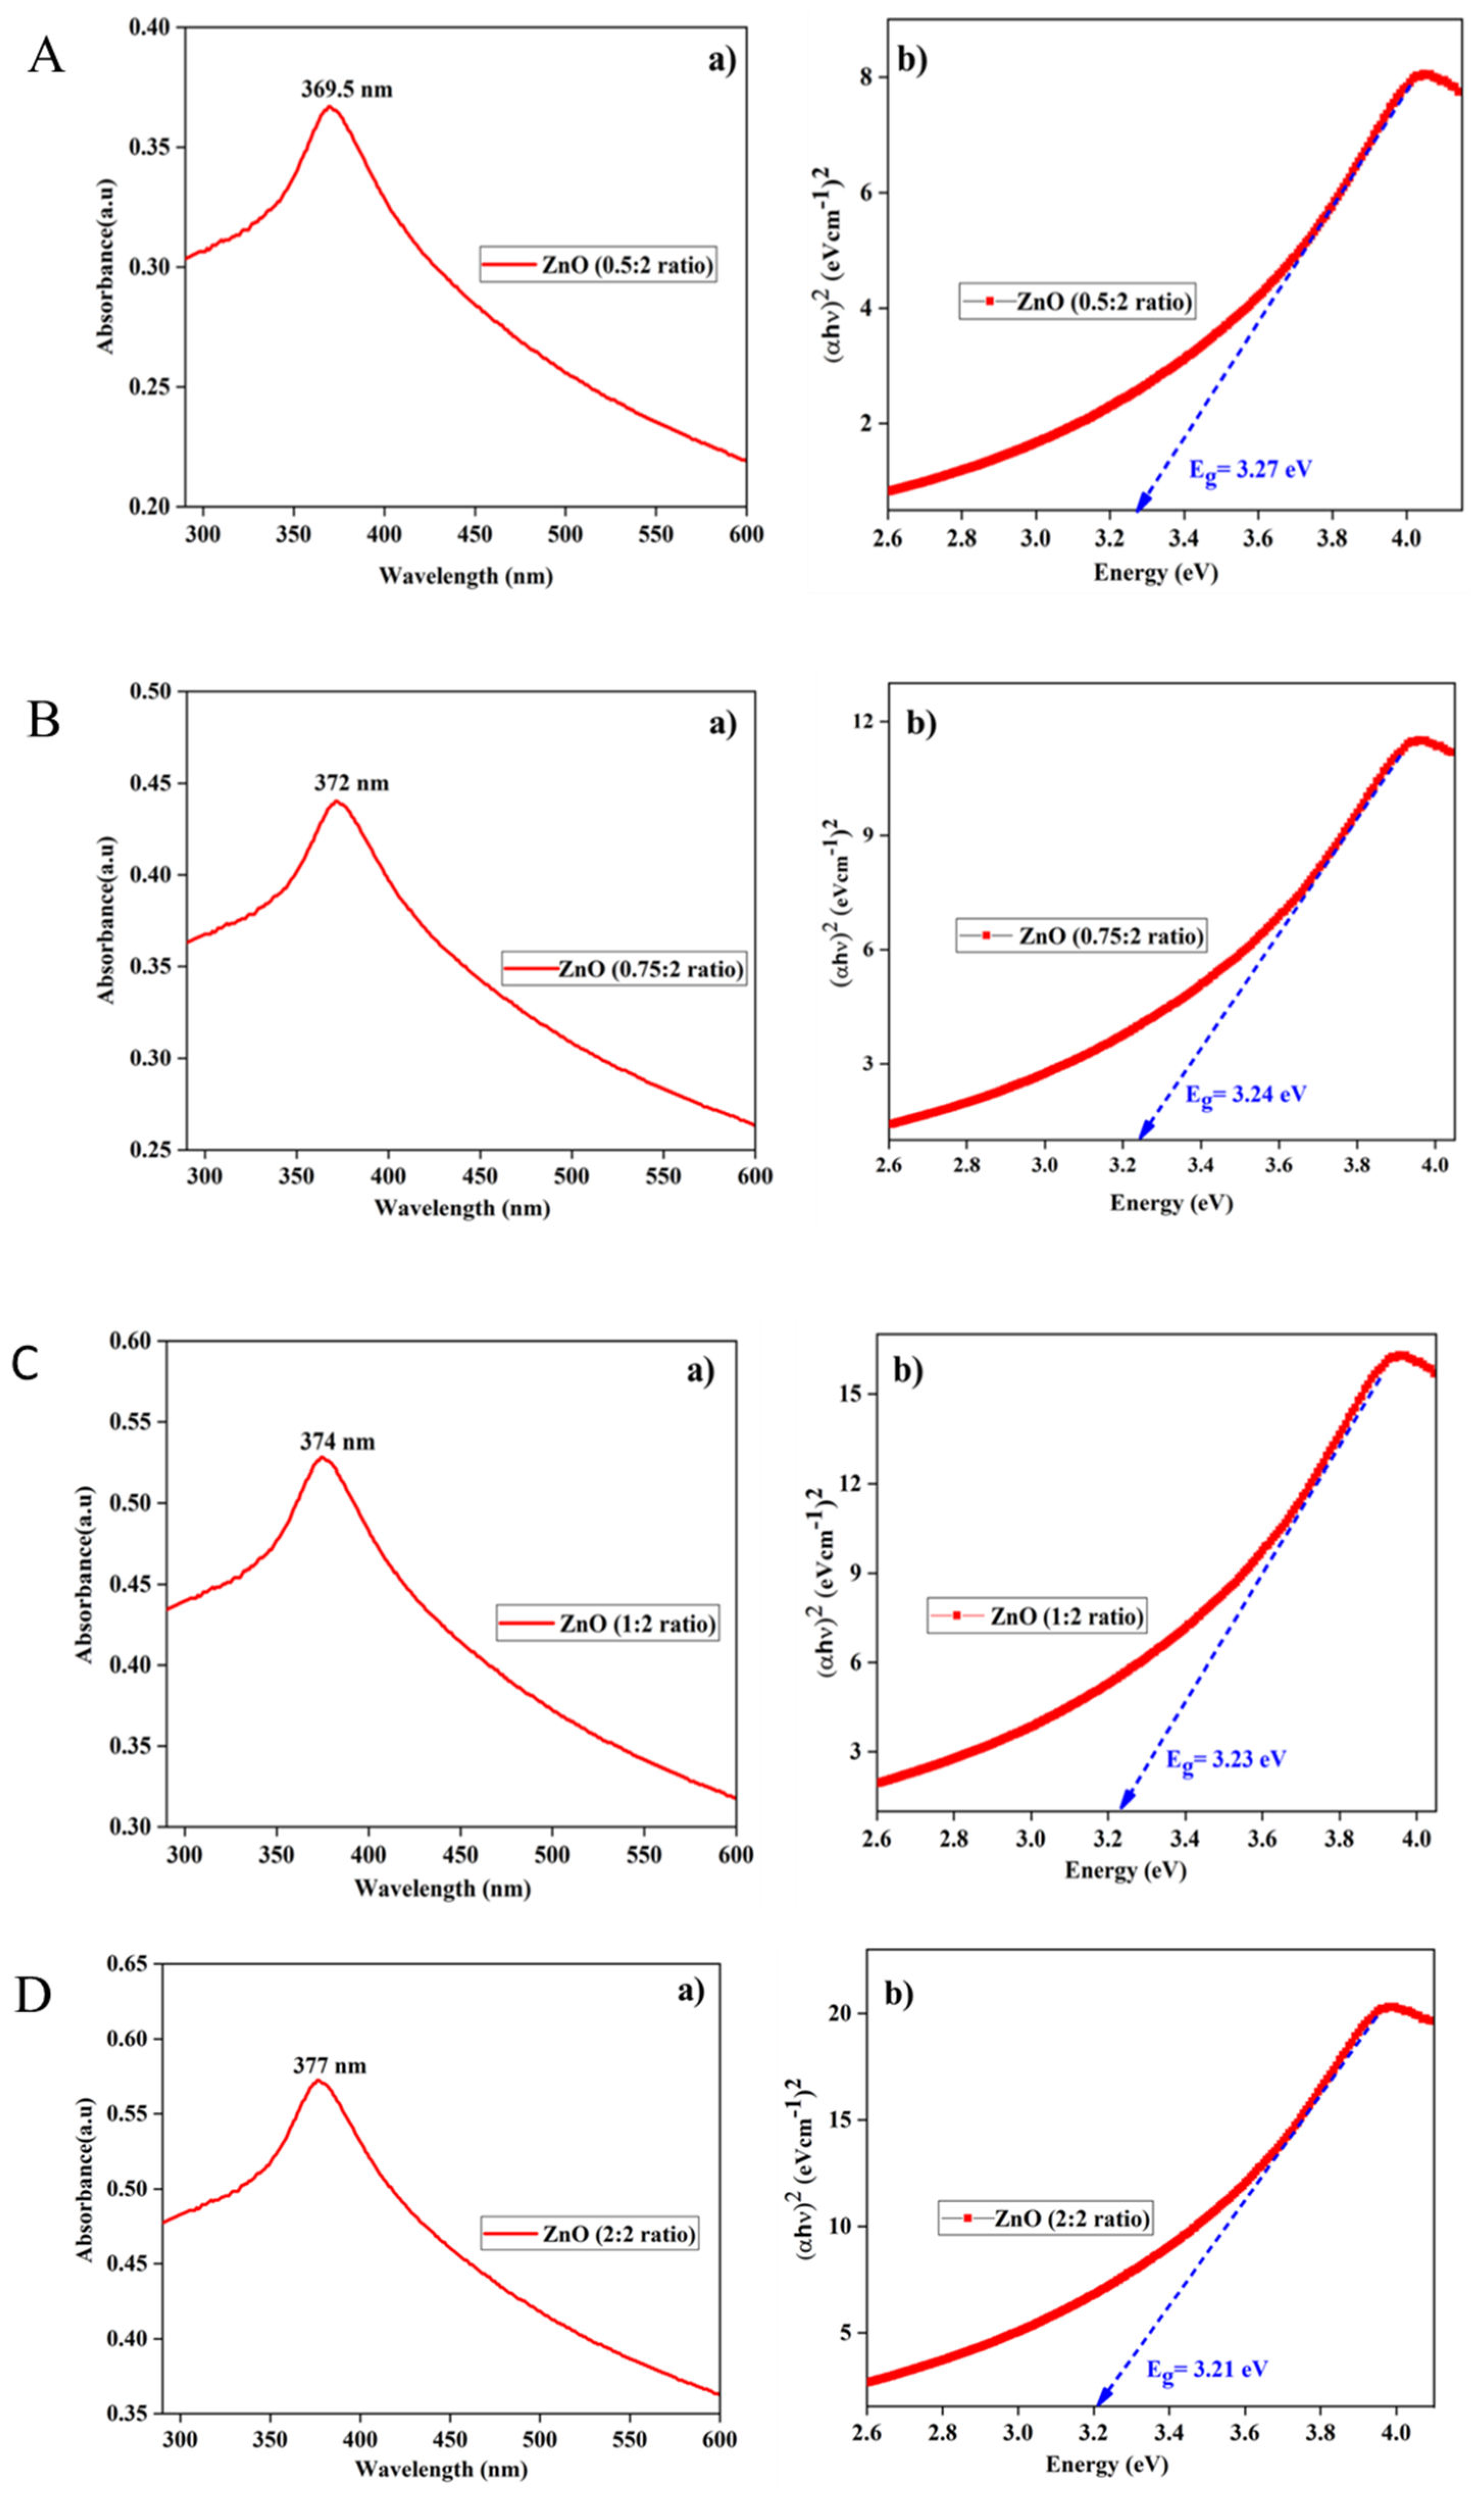
Figure 9.
Optical bandgap of ZnO NPs versus concentration of the reducing agent.
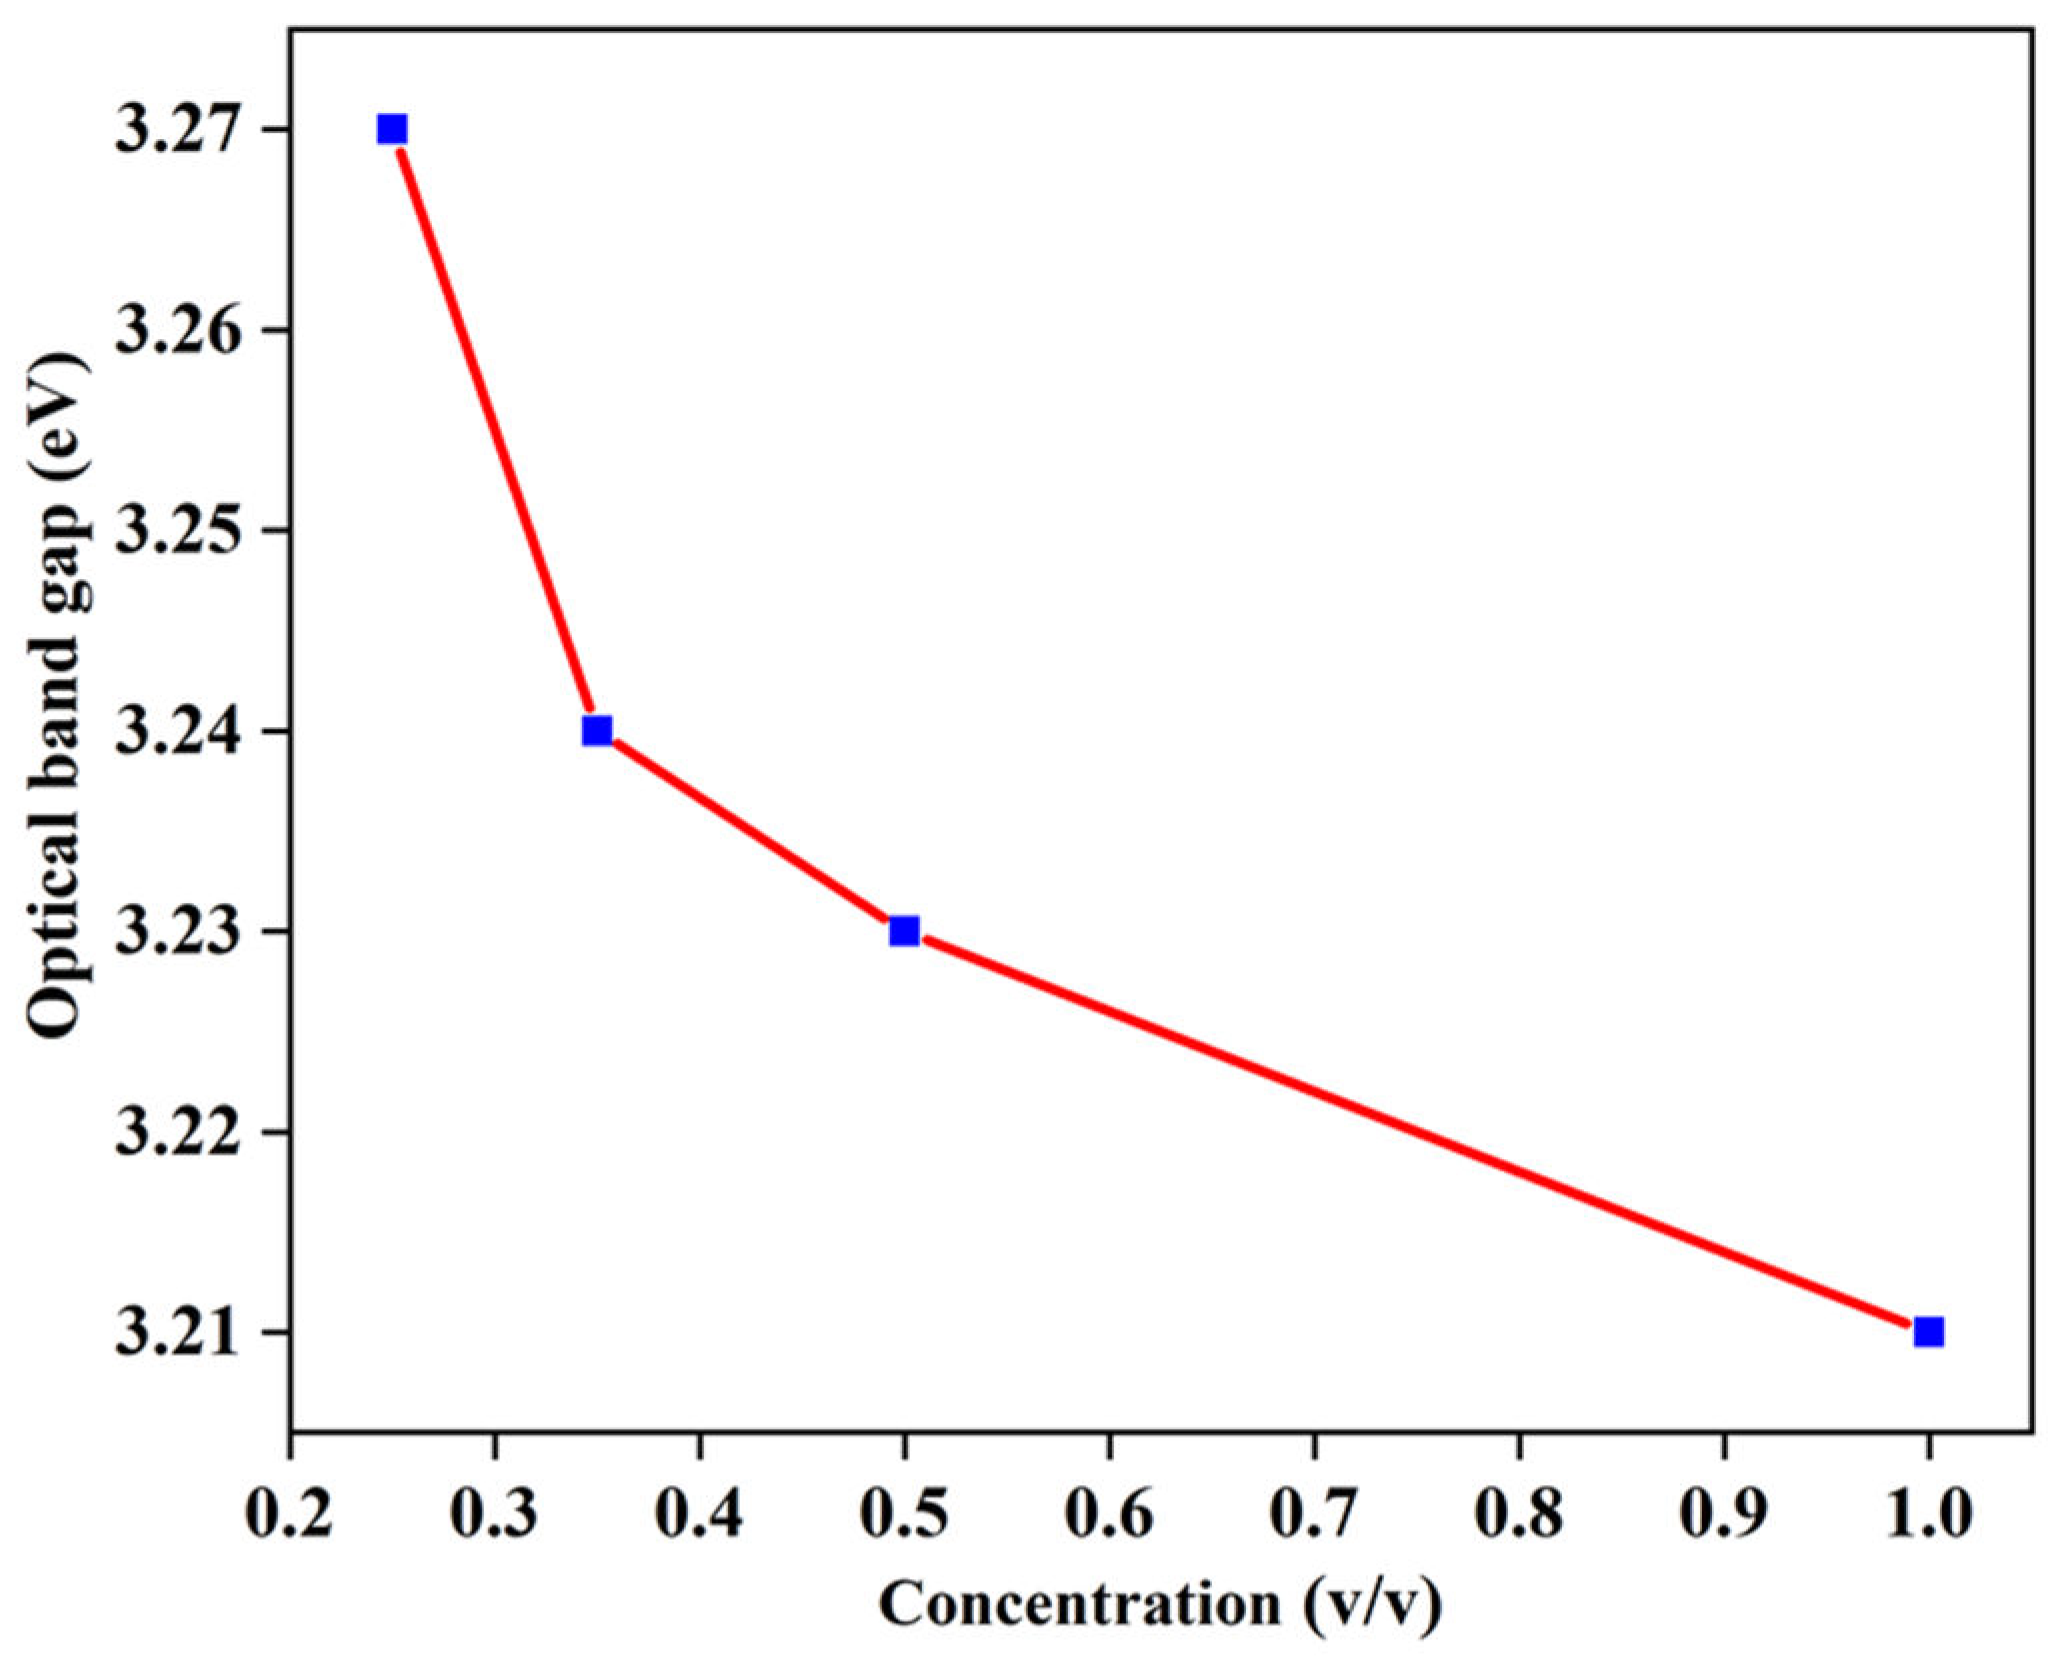
Figure 10.
Plot of the size of ZnO NPs versus the concentration of reducing agents.
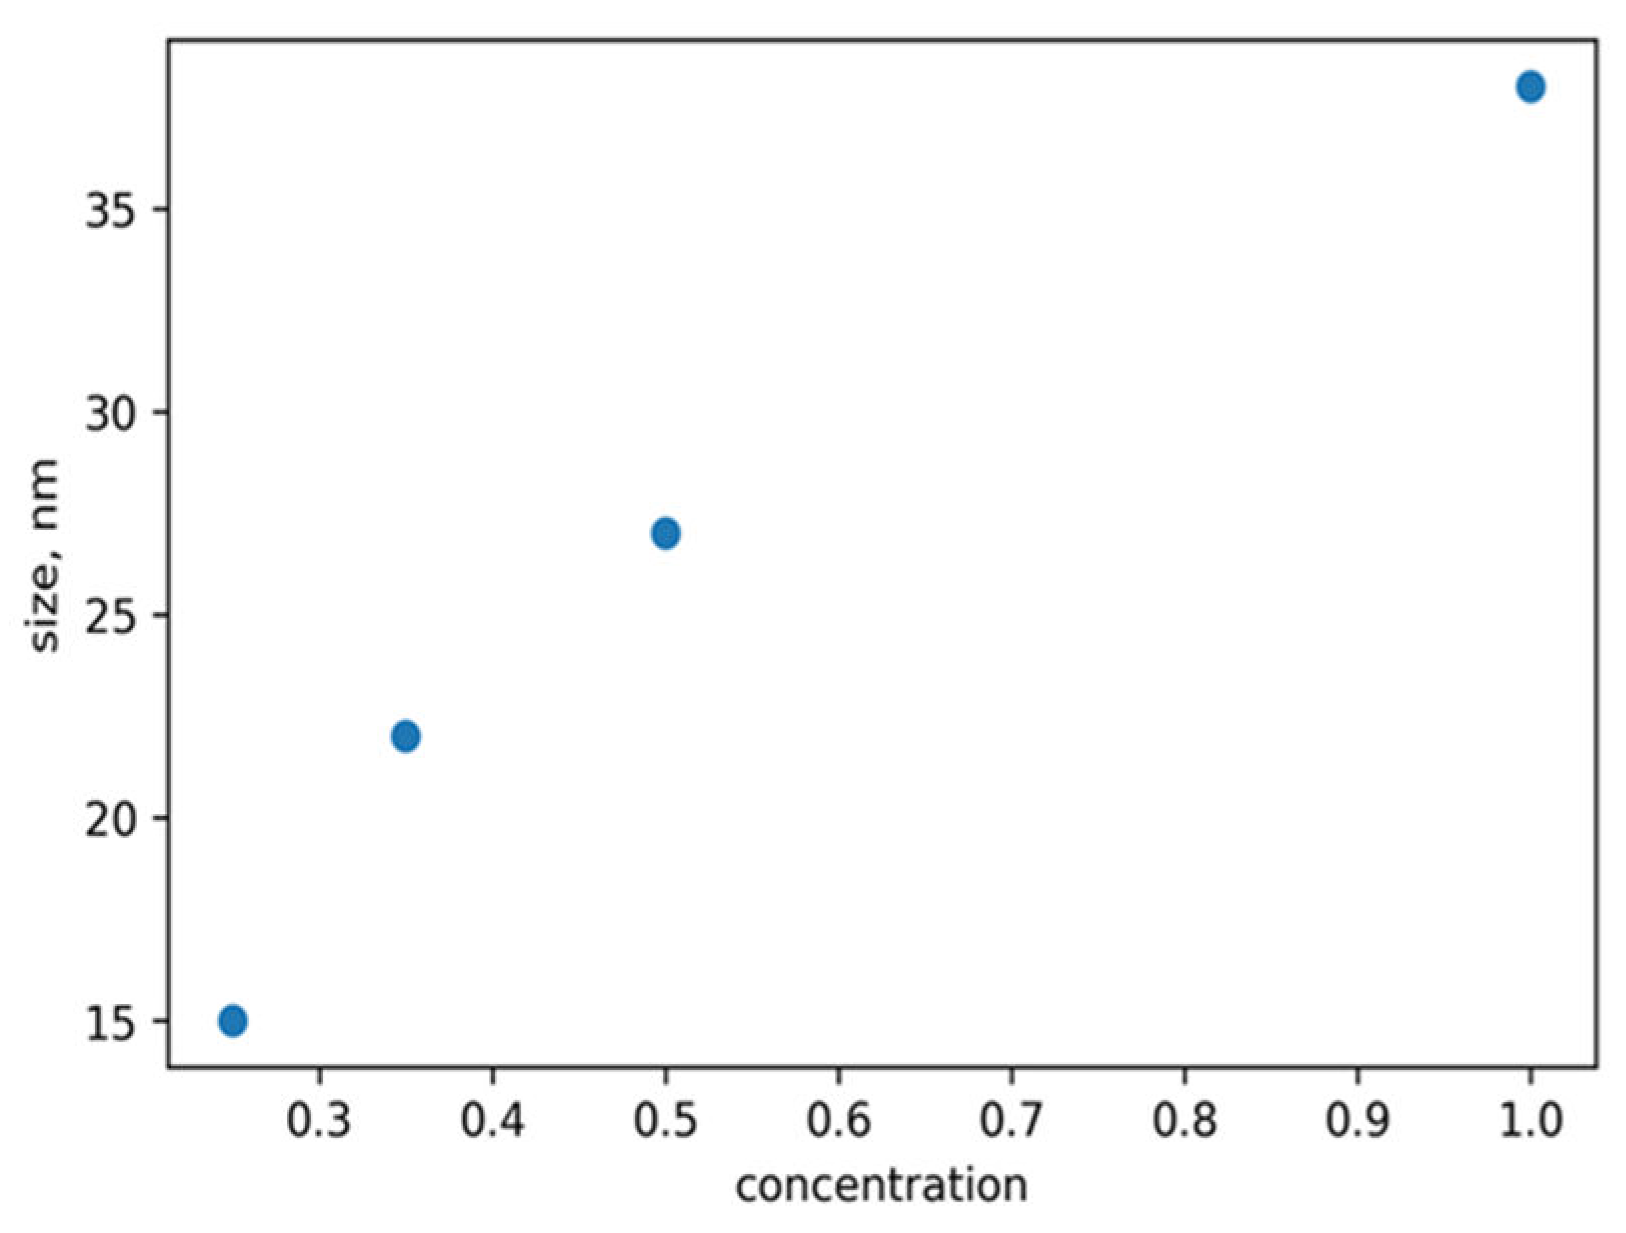
Figure 11.
a) plot of surface energy of ZnO NPs versus their size and b) plot of surface energy of ZnO NPs versus the concentration of the reducing agent.
Figure 11.
a) plot of surface energy of ZnO NPs versus their size and b) plot of surface energy of ZnO NPs versus the concentration of the reducing agent.

Figure 12.
Plot of the extinction coefficient versus the size of the ZnO NPs.
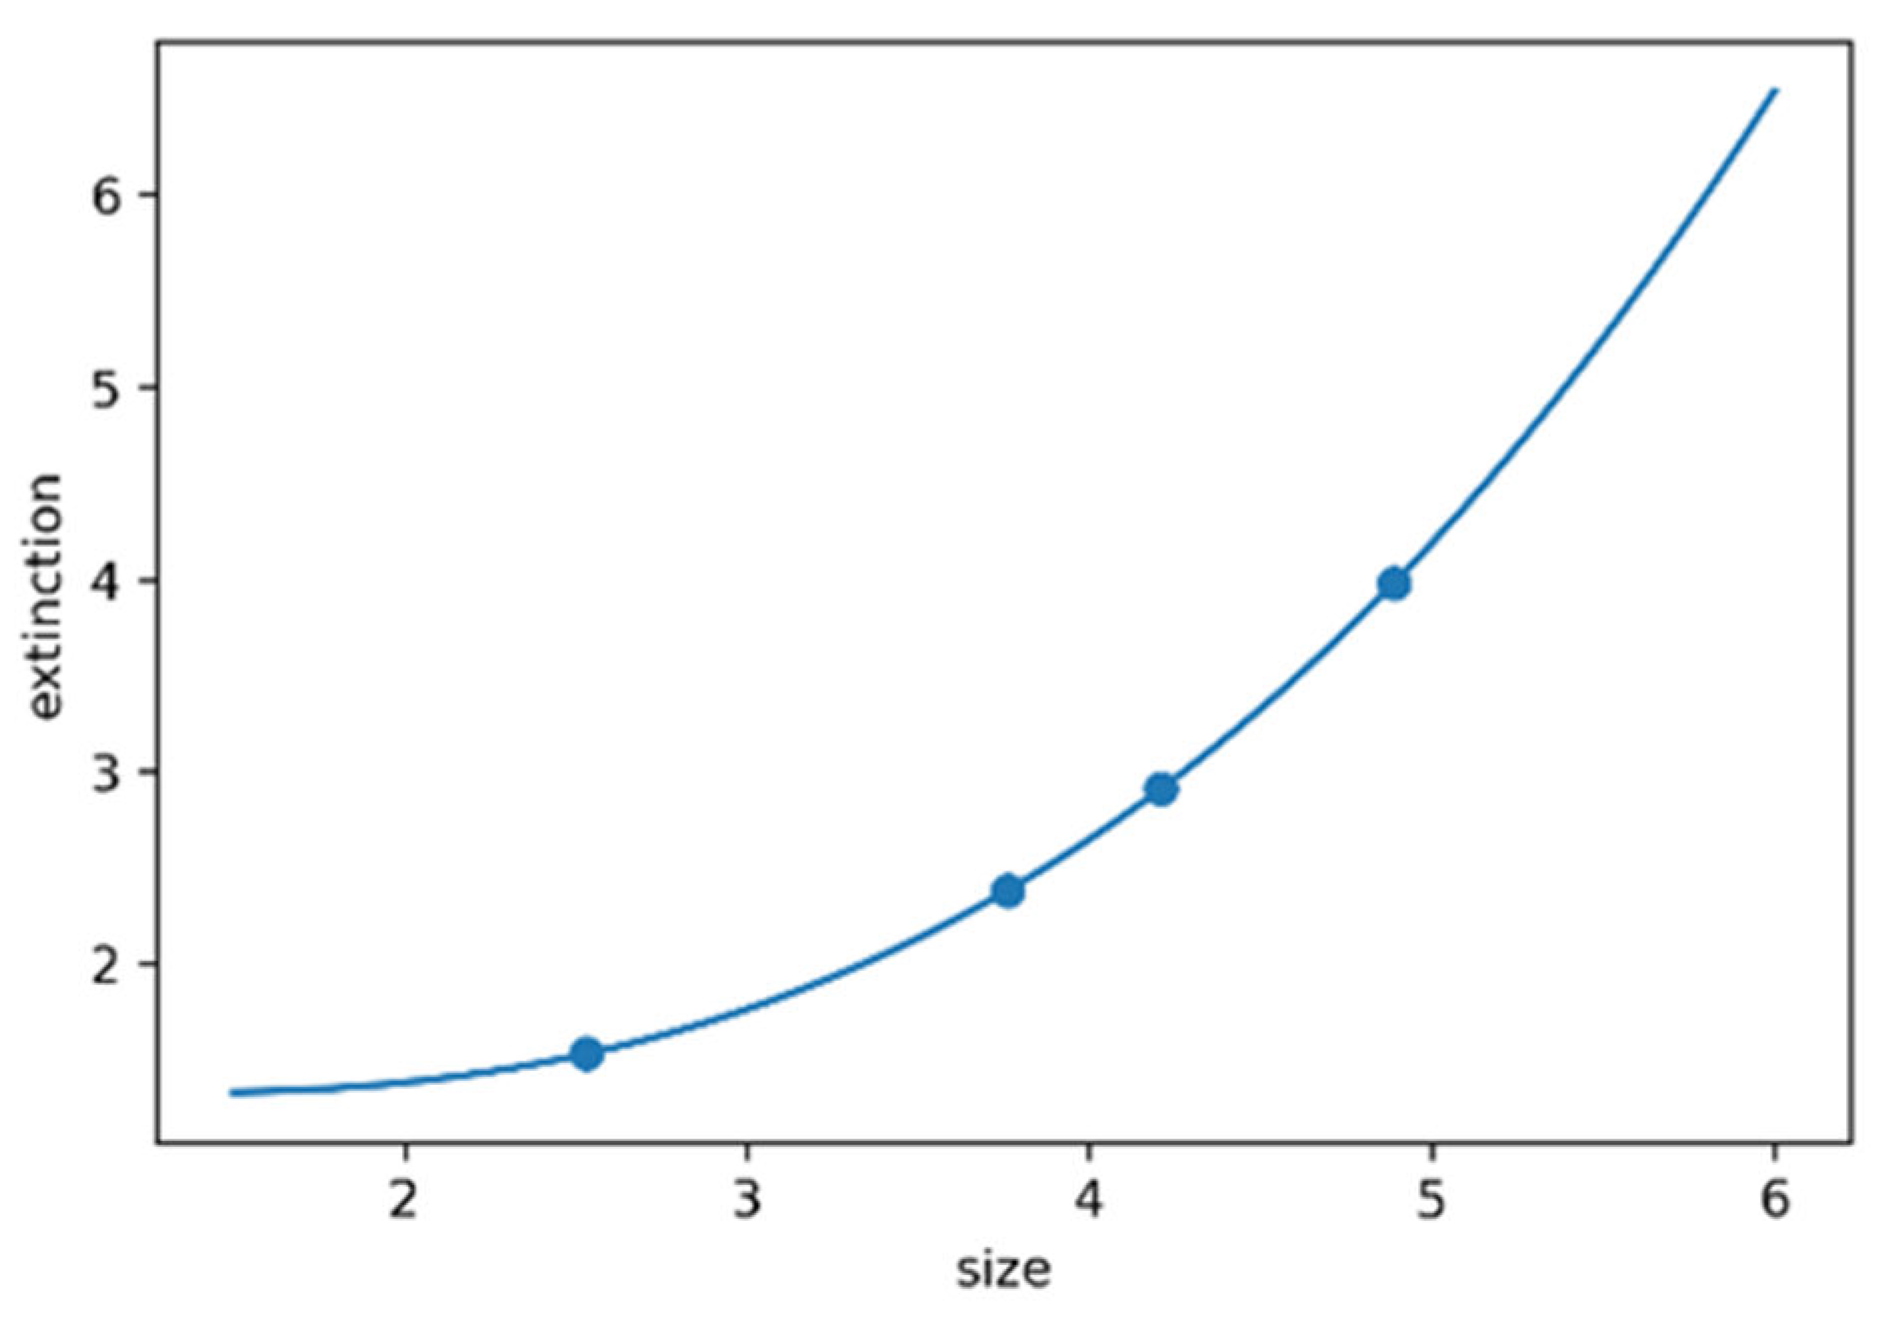
Figure 13.
is a plot of the number of ZnO NPs in the solution as a function of the reducing agent concentration.
Figure 13.
is a plot of the number of ZnO NPs in the solution as a function of the reducing agent concentration.
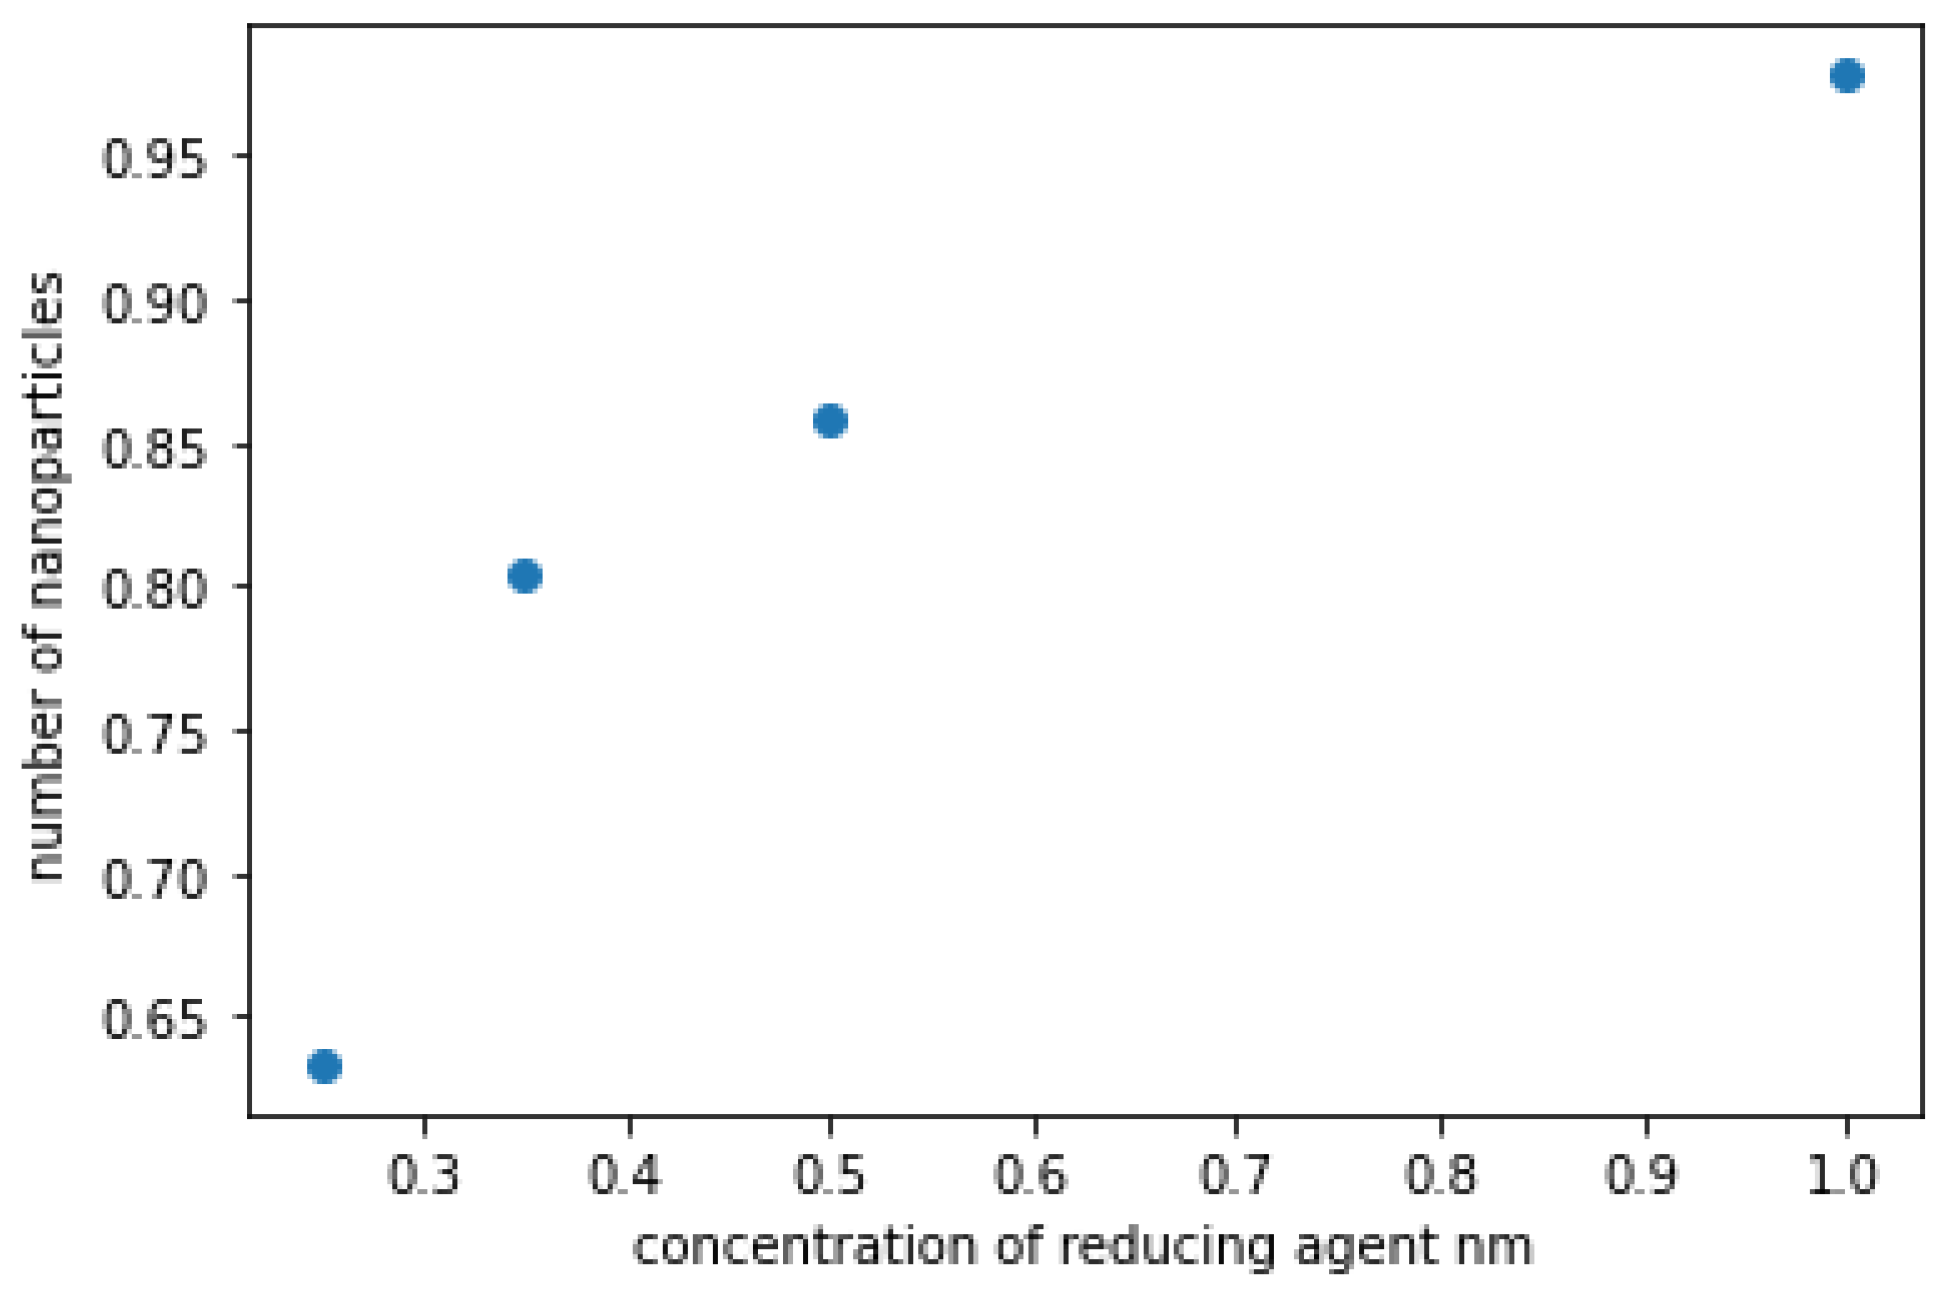
Figure 14.
plot of FWHM of UV-vis spectra of the ZnO NPs versus reducing agent concentration.
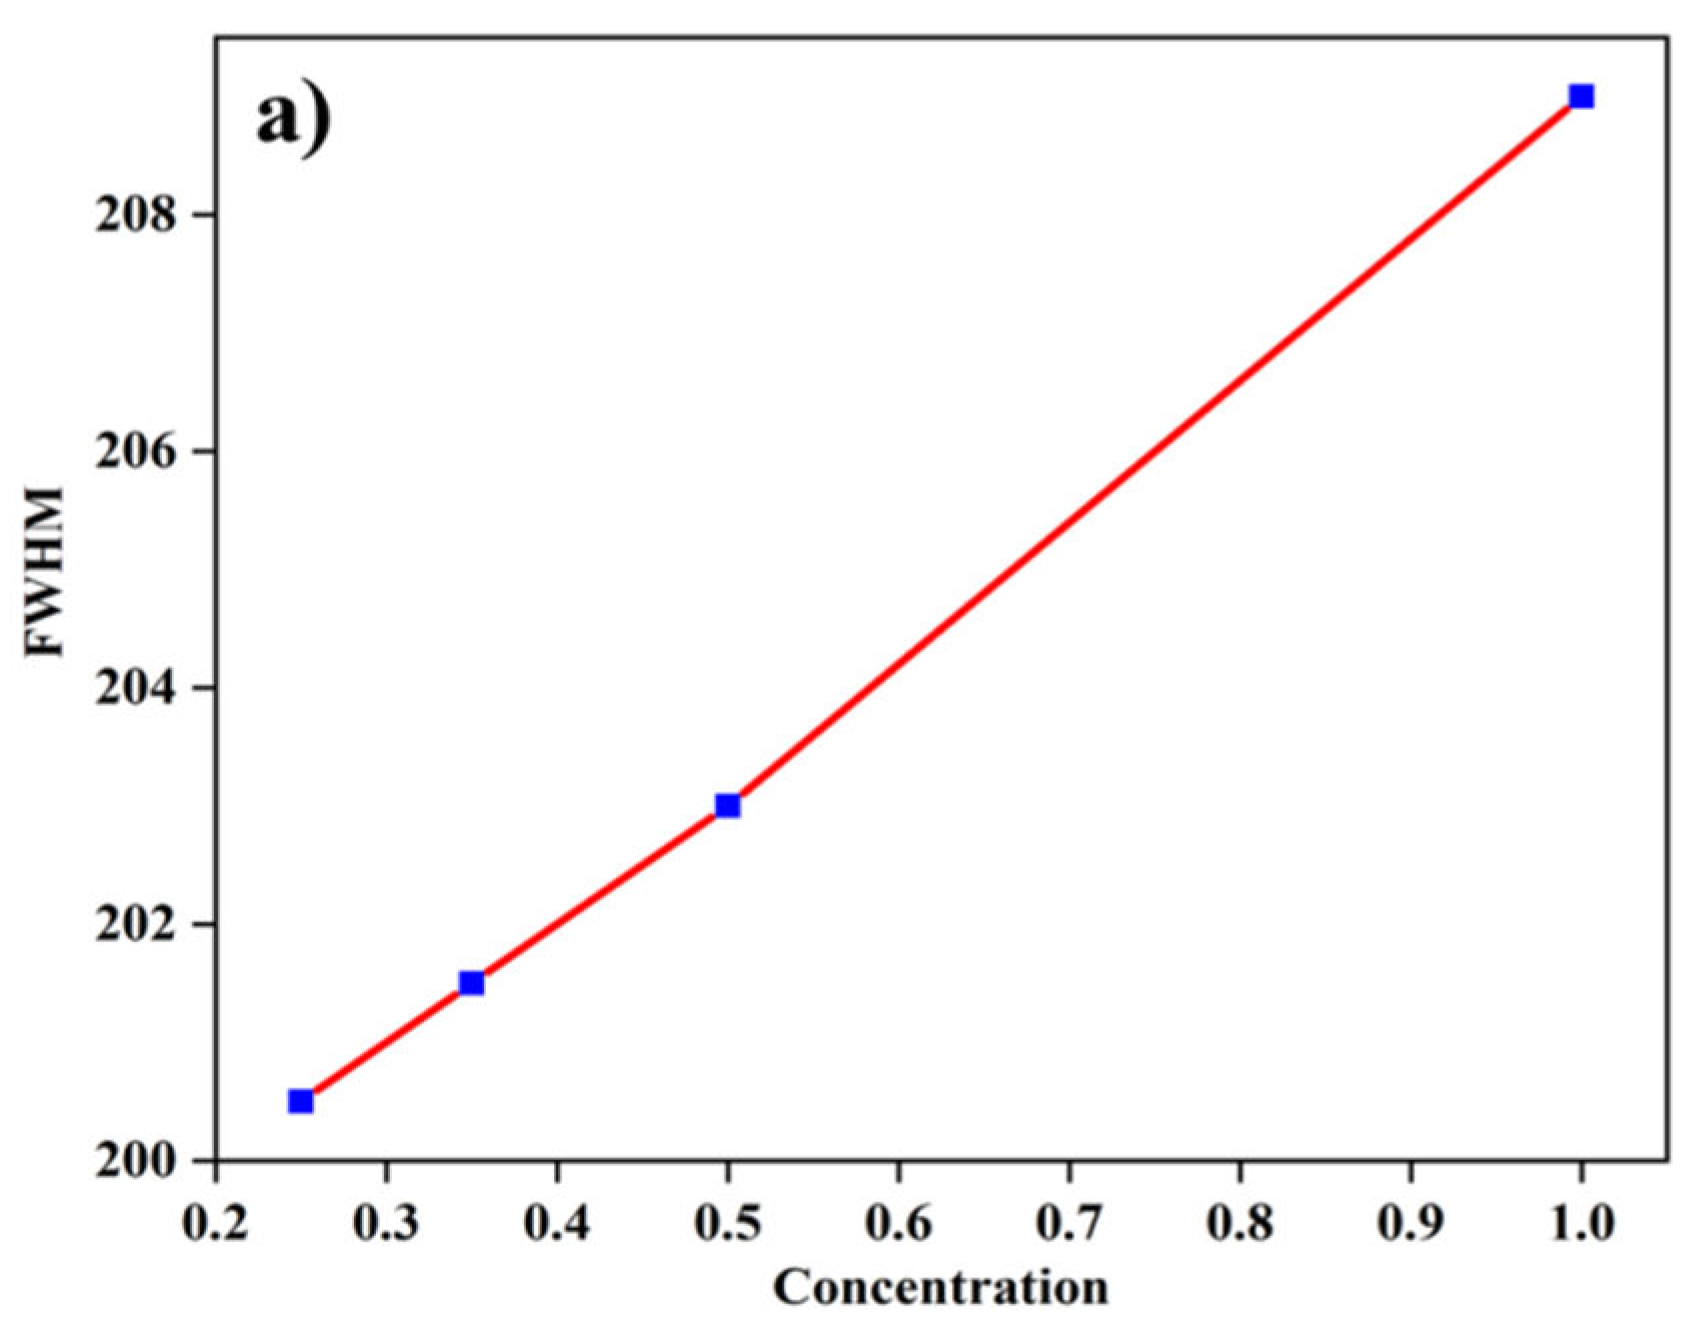
Figure 15.
FTIR spectra of aqueous orange peel extract and ZnO NPs.
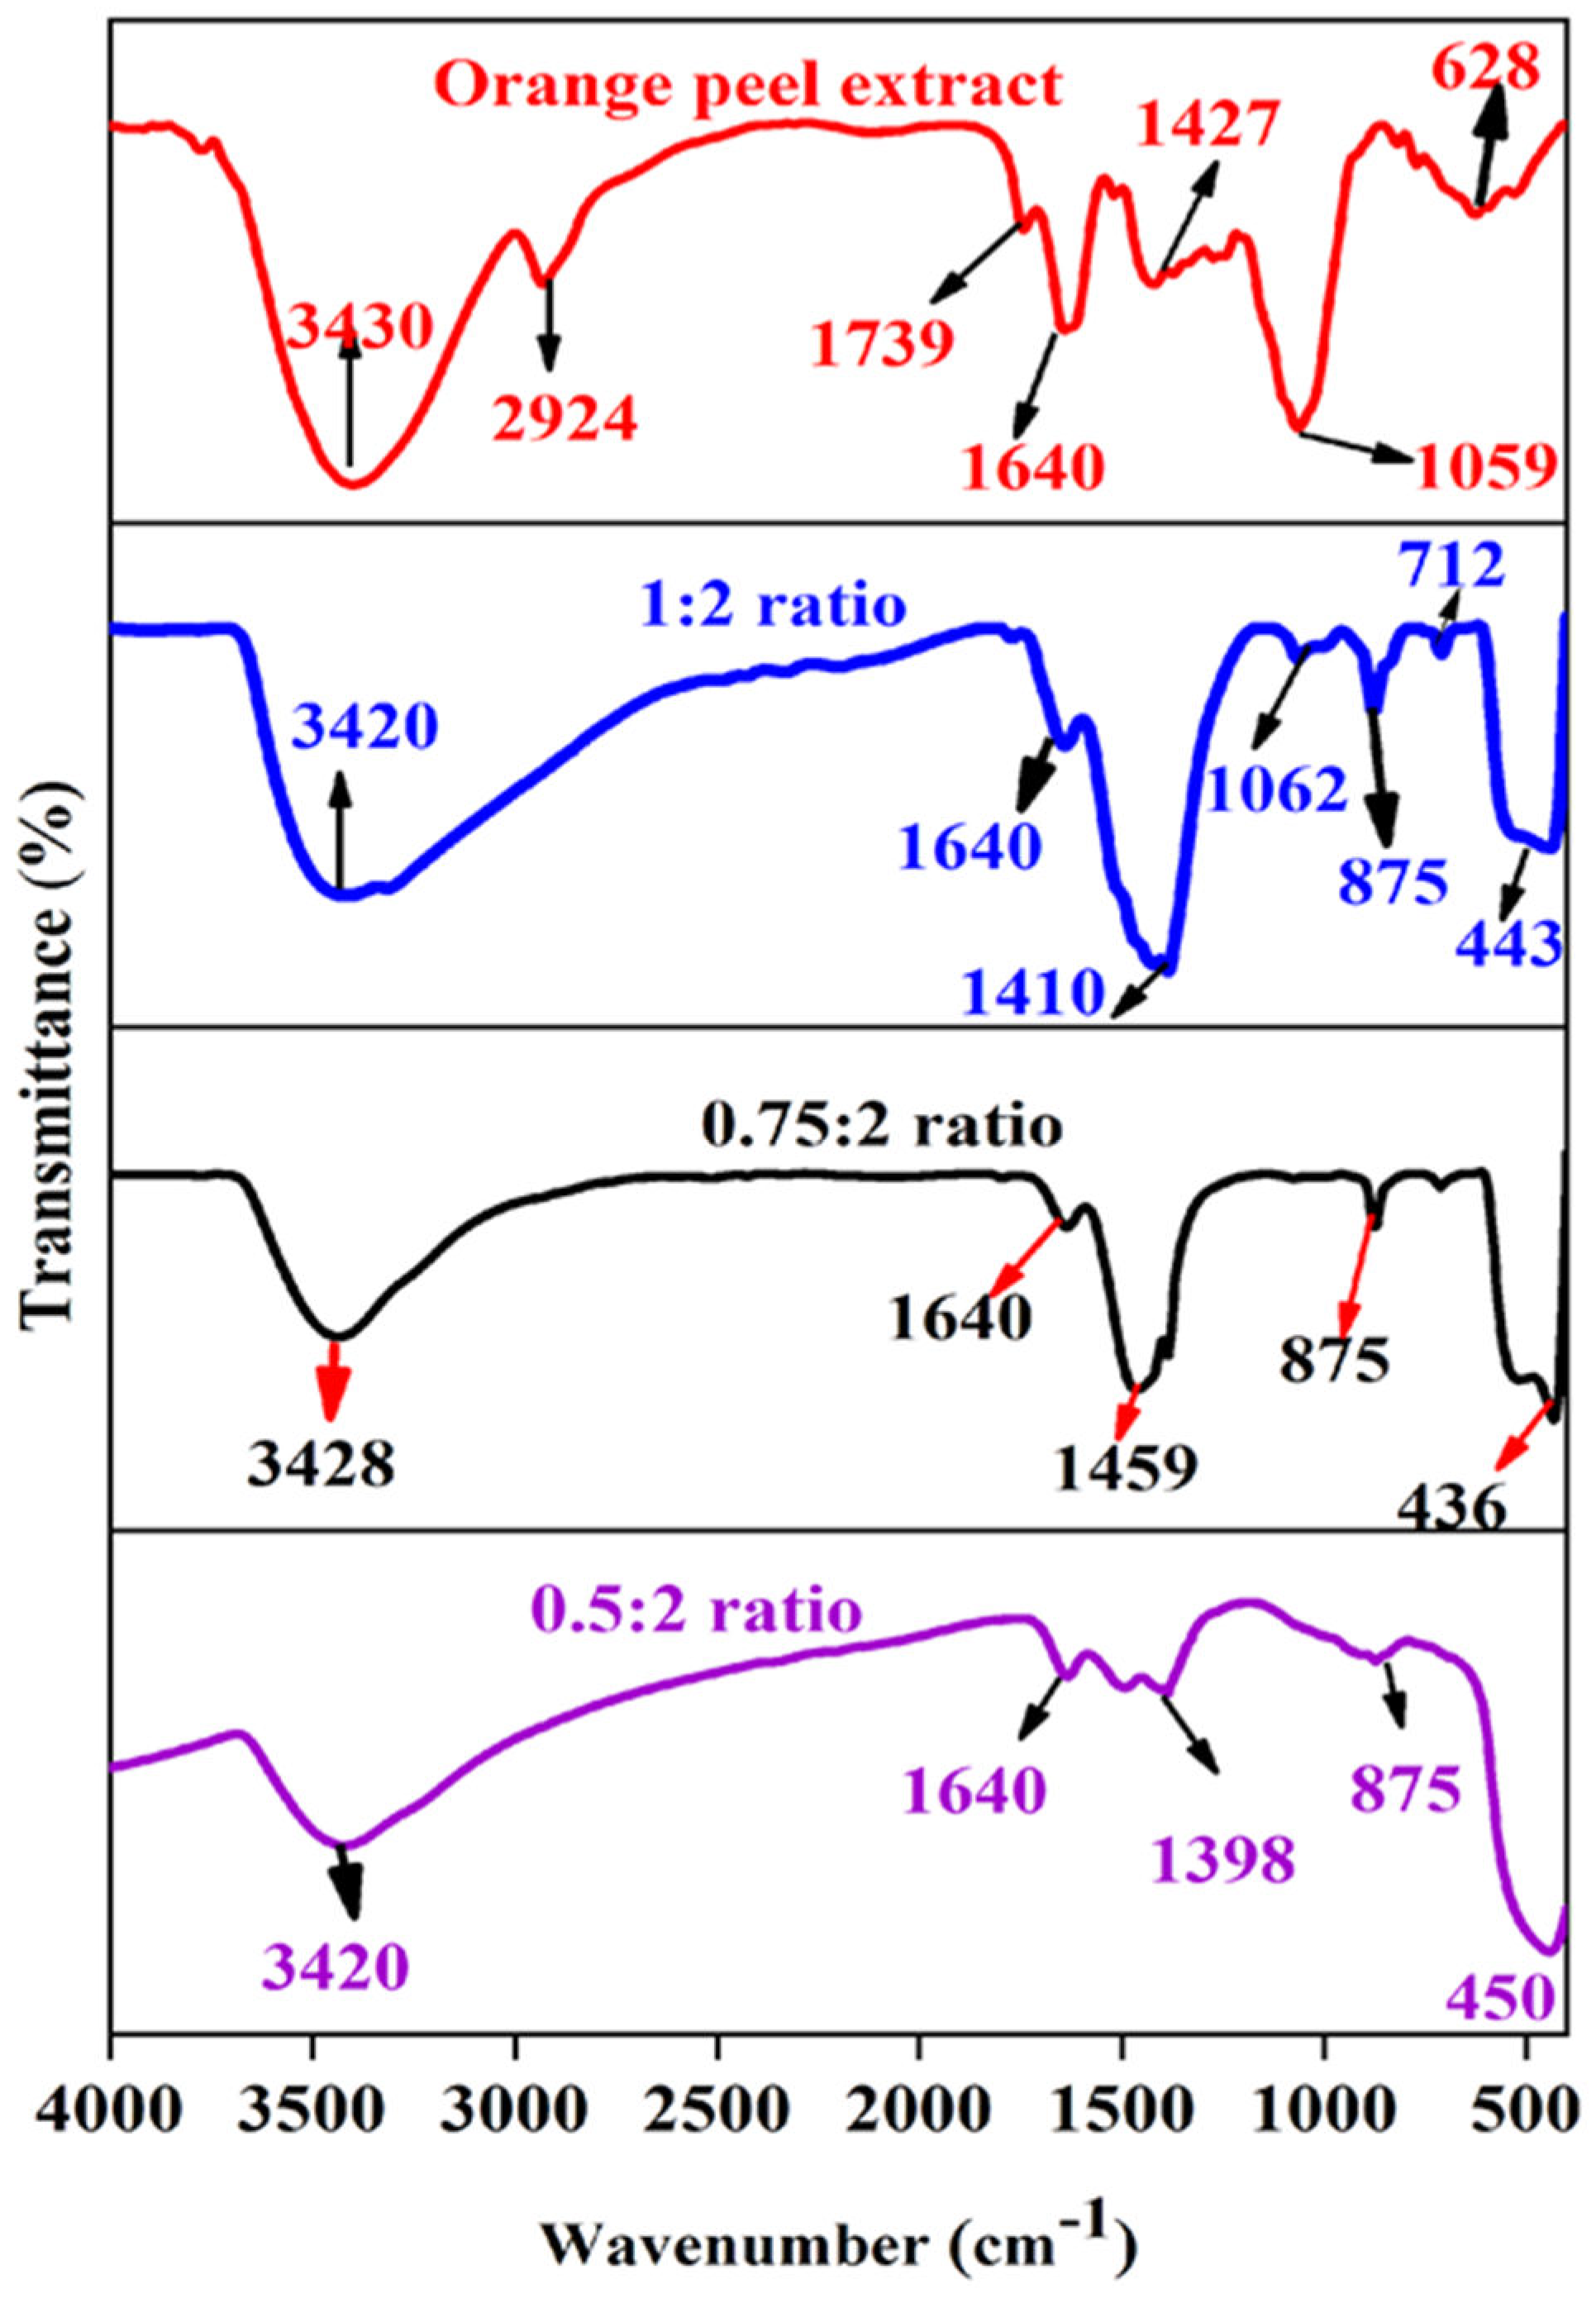
Figure 16.
XRD pattern of green synthesized ZnO NPs using orange peel extract.
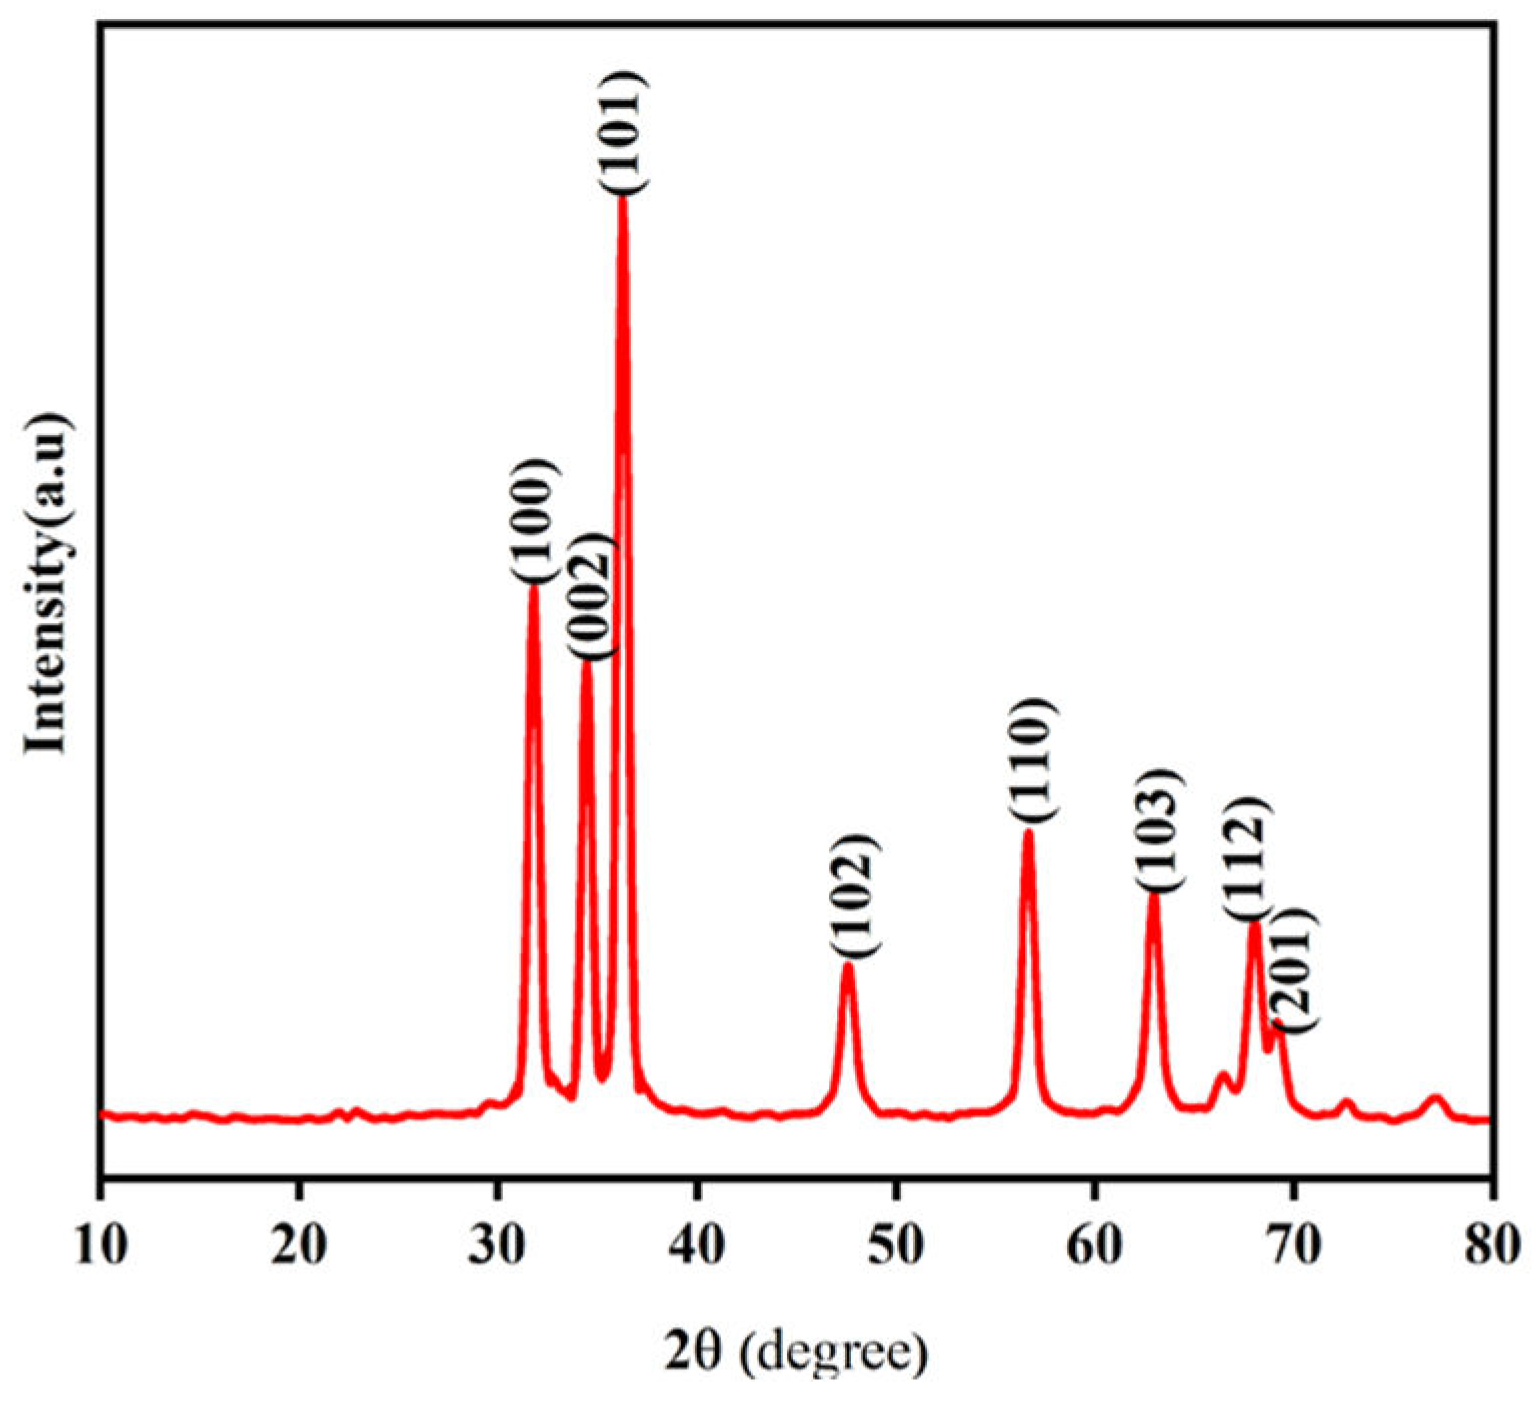
Figure 17.
Weight loss versus temperature plot of zinc oxide nanoparticles.
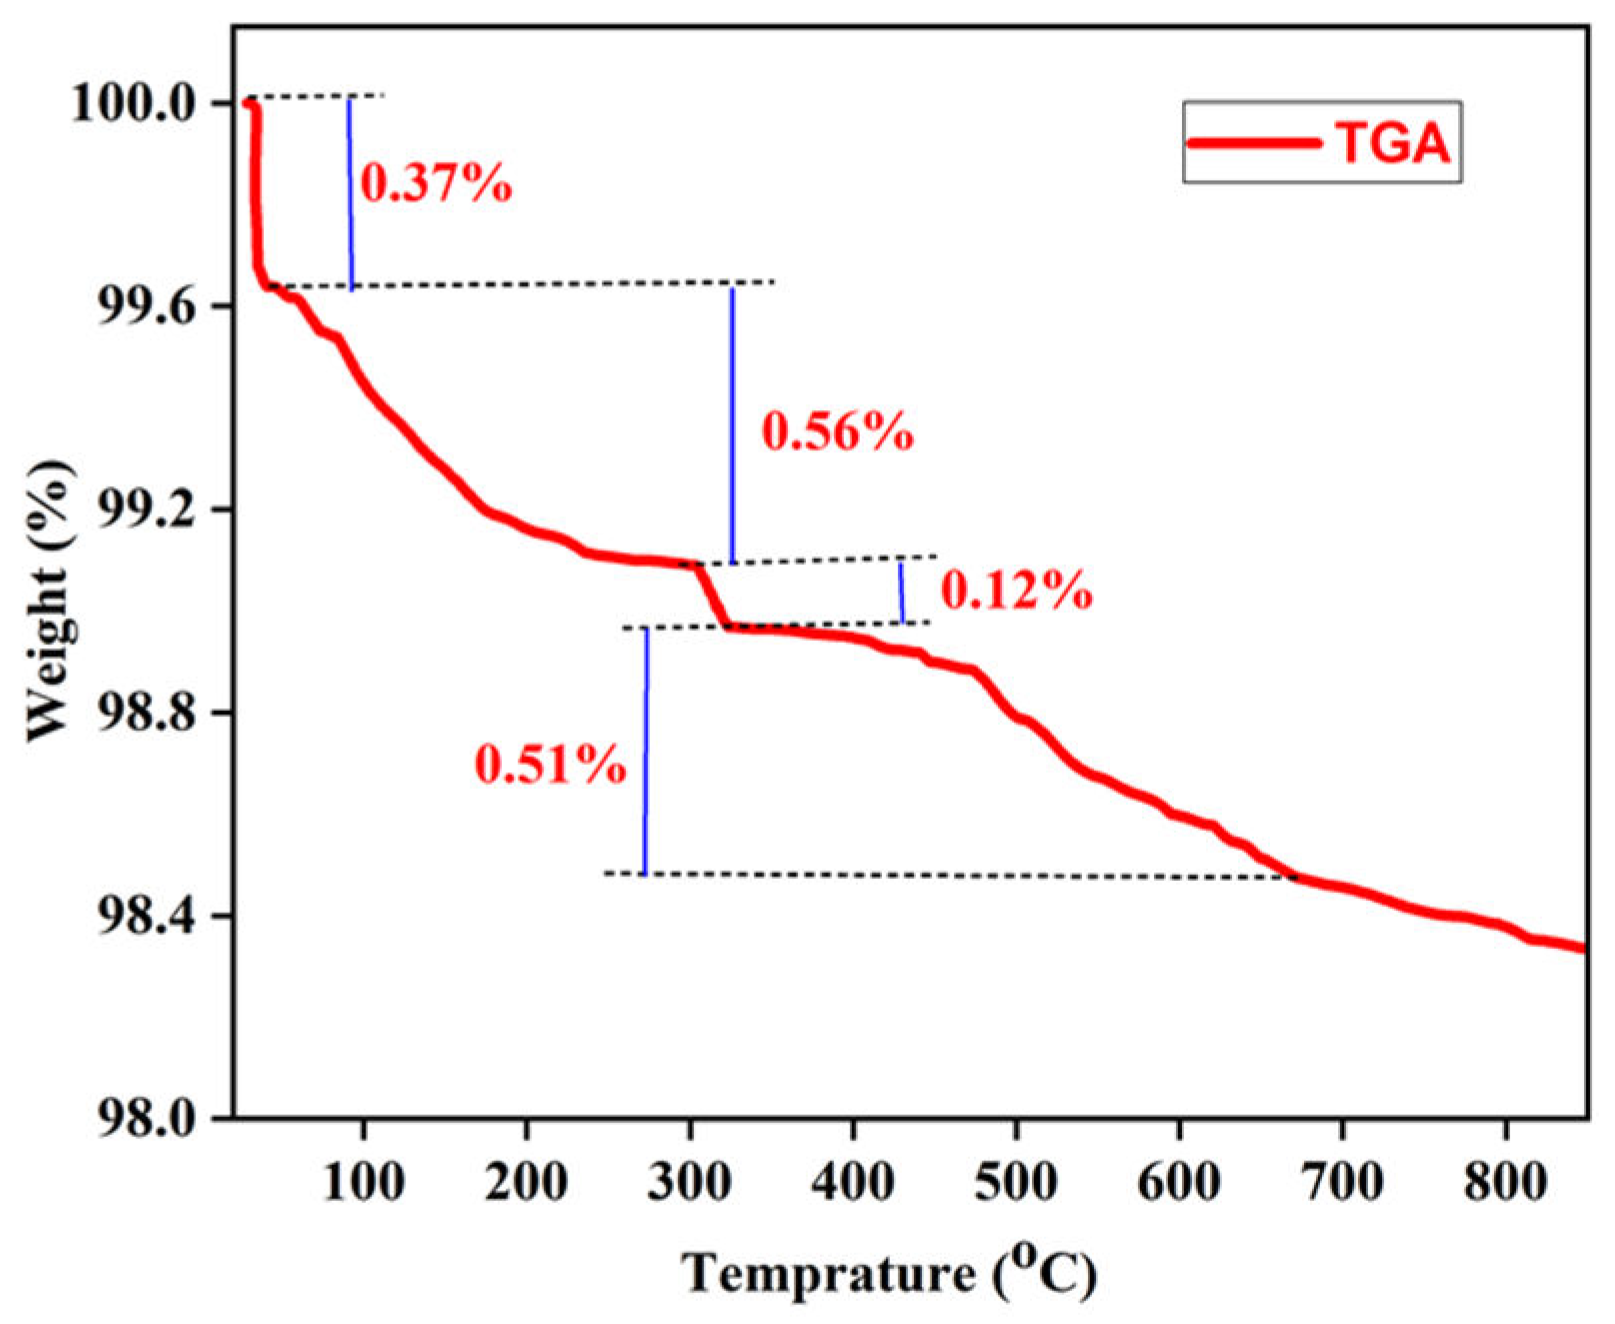
Figure 18.
SEM image of the ZnO NPs synthesized using zinc nitrate dihydrate and orange peel extract in 1:2 ratios.
Figure 18.
SEM image of the ZnO NPs synthesized using zinc nitrate dihydrate and orange peel extract in 1:2 ratios.
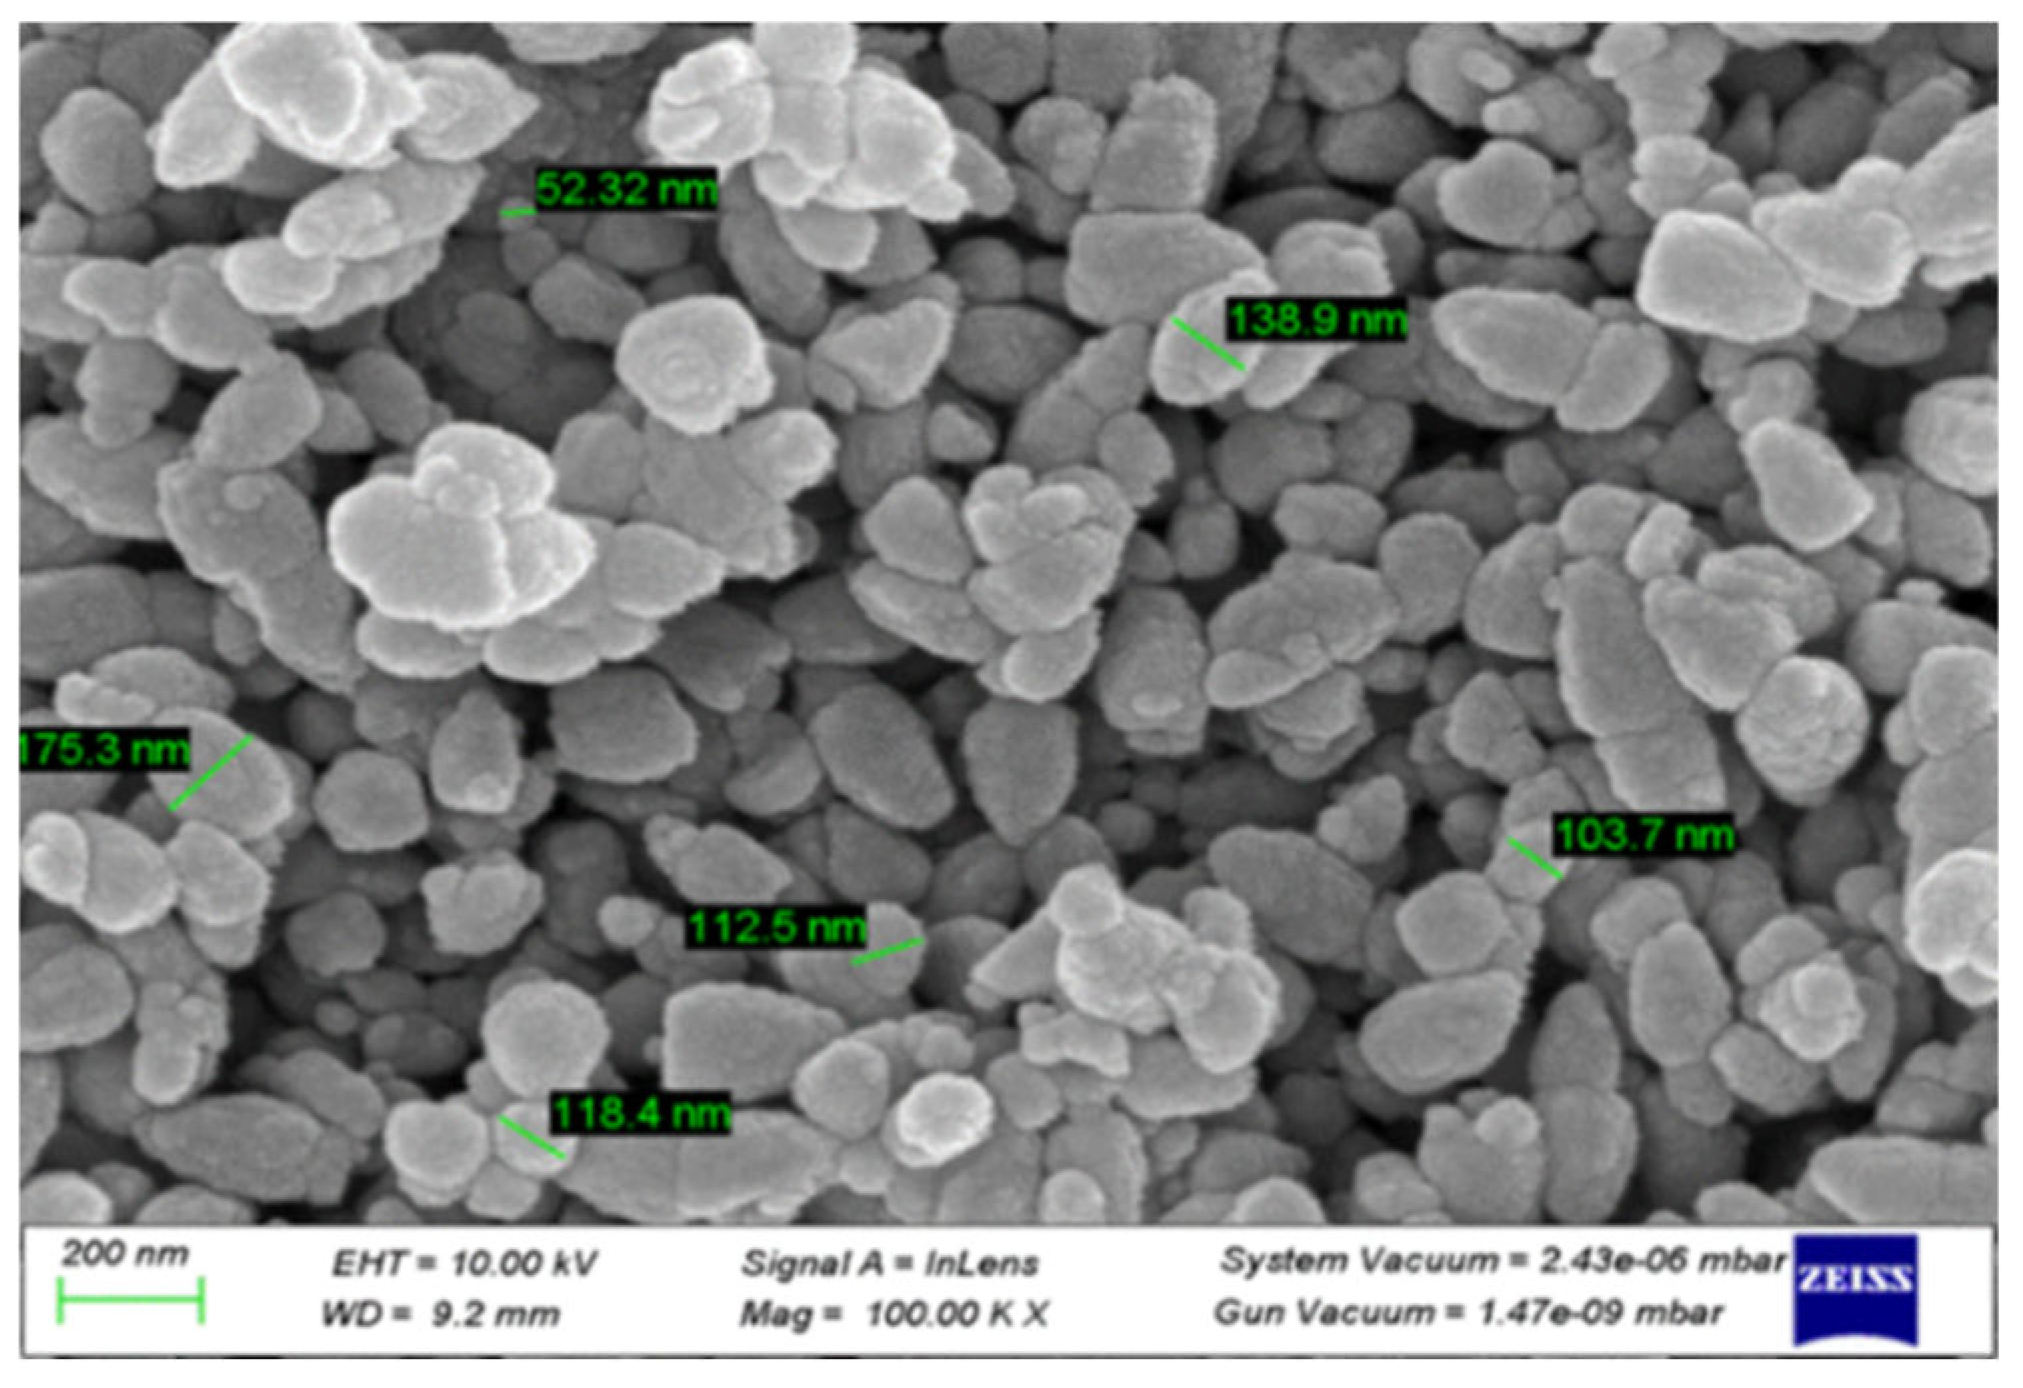
Figure 19.
(A) EDX spectrum of ZnO NPs; (B and C) elemental mapping image the ZnO NPs.
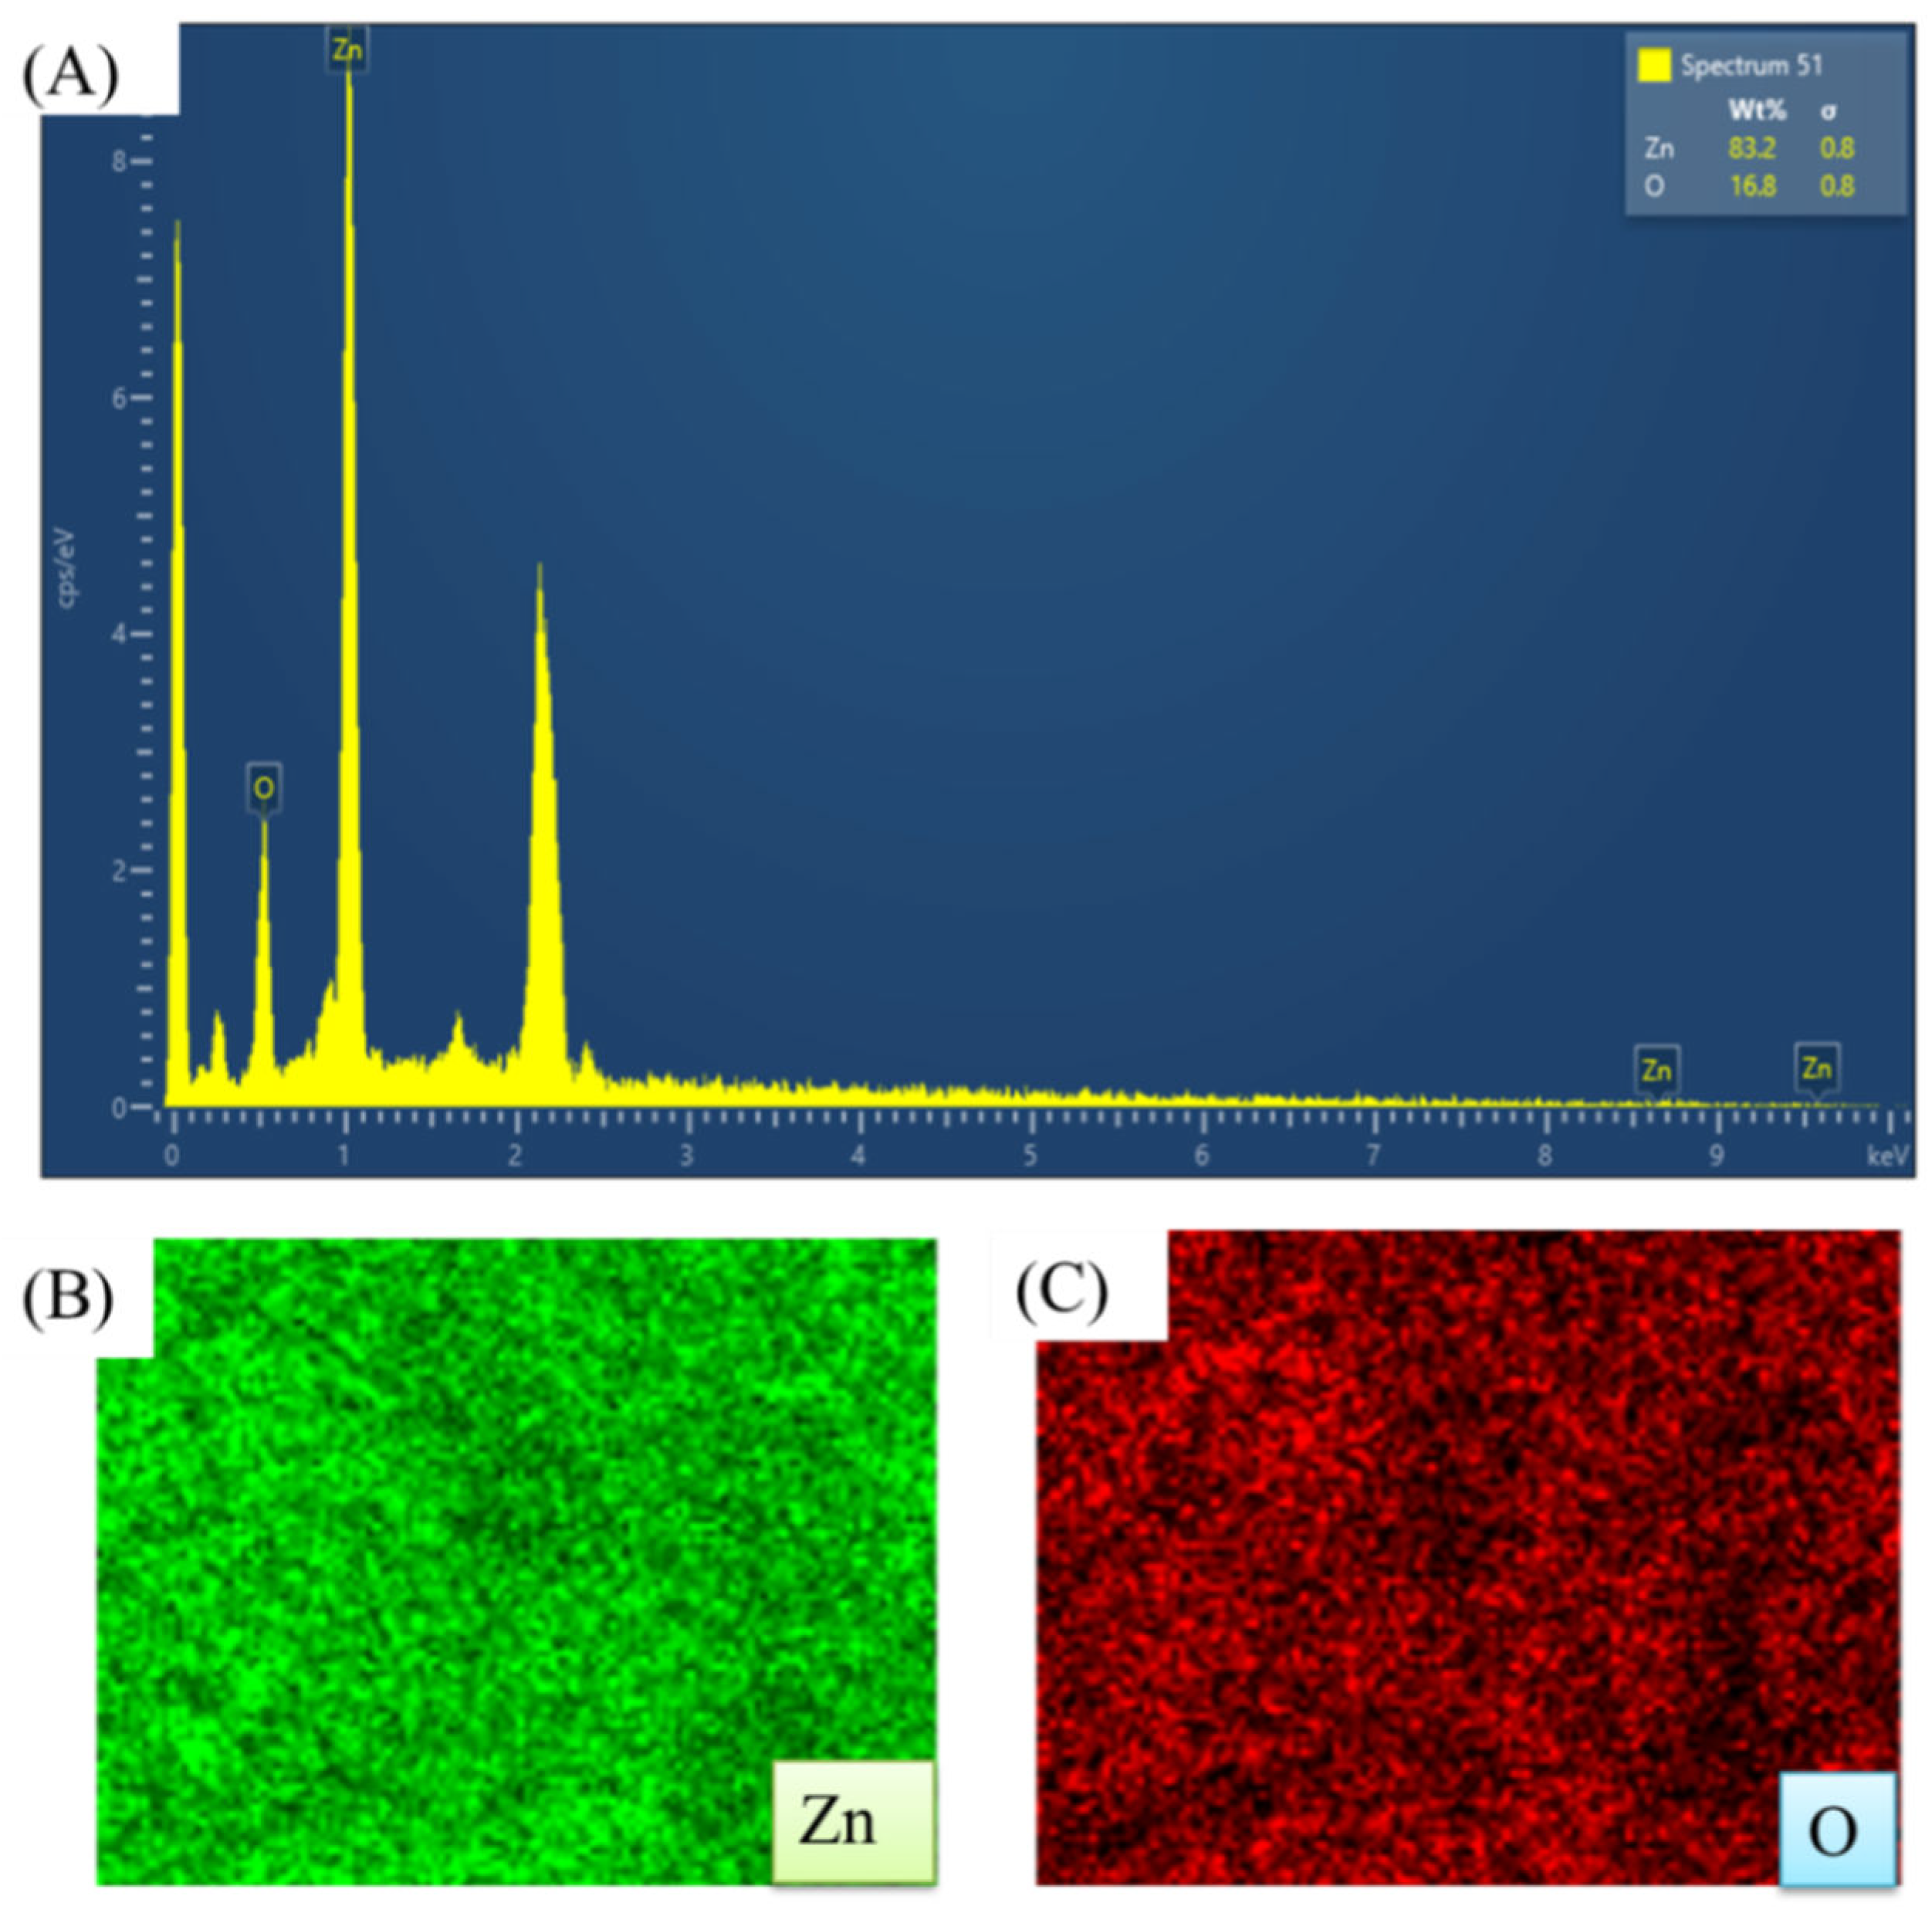
Table 1.
Results of phytochemical screening of orange peel extracts.
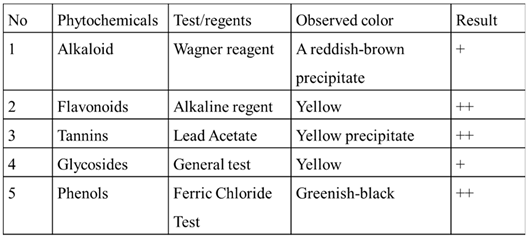
Keys: ++ = Present in excess, + = Present in excess
Table 2.
Energy band gap of the ZnO NPs for different concentration of orange peel extract.
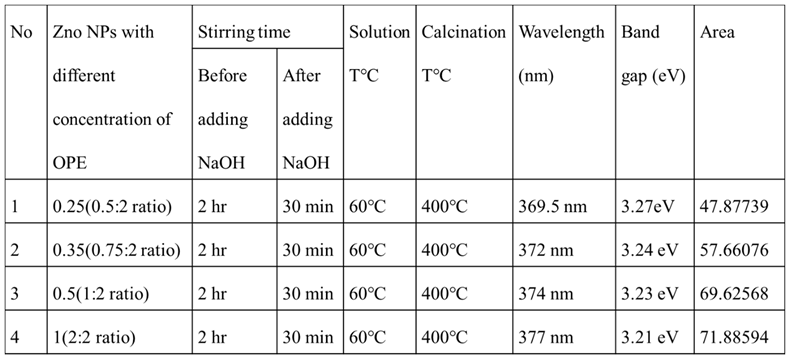
Table 4.
Elemental composition of ZnO NPs from the EDX analysis.
Disclaimer/Publisher’s Note: The statements, opinions and data contained in all publications are solely those of the individual author(s) and contributor(s) and not of MDPI and/or the editor(s). MDPI and/or the editor(s) disclaim responsibility for any injury to people or property resulting from any ideas, methods, instructions or products referred to in the content. |
© 2024 by the authors. Licensee MDPI, Basel, Switzerland. This article is an open access article distributed under the terms and conditions of the Creative Commons Attribution (CC BY) license (http://creativecommons.org/licenses/by/4.0/).
Copyright: This open access article is published under a Creative Commons CC BY 4.0 license, which permit the free download, distribution, and reuse, provided that the author and preprint are cited in any reuse.


