Submitted:
24 May 2024
Posted:
27 May 2024
Read the latest preprint version here
Abstract
In directional forming processes such as rolling and extrusion, the microstructure is strongly elongated in the forming direction. This results in a preferred alignment of the crystal orientations of the initially randomly oriented grains. These preferred orientations – the texture – and elongations of the grains are the cause of the material anisotropy. This anisotropy leads to phenomena such as earing, which occur during further forming processes, e.g., during deep drawing of sheet metal. Considering anisotropic properties in numerical simulations allows to investigate the effects of texture-dependent defects in forming processes and the development of possible solutions. Purely phenomenological models for modelling anisotropy work by fitting material parameters or applying measured R-values in experiments which are applied to all elements of the part and remain constant over the duration of the simulation. In contrast, methods such as the Visco-Plastic Self-Consistent (VPSC) model, which has been used in this work, provide a deeper insight into the development of the material microstructure. By experimentally measuring the initial texture and using it as an initial condition for the simulations, it is possible to predict the evolution of the microstructure and the resulting effect on the mechanical properties during forming operations. The results of the simulations with VPSC show good qualitative agreement with tests typically used for rolled stock.
Keywords:
VPSC
; Anisotropy
; Compression Test
; Deep Drawing
; Earing
1. Introduction
Directional forming processes usually lead to the formation of an anisotropic grain structure in metals, called texture. This is known to cause multiple effects, the most obvious of which are direction-dependent material properties. Such behaviour is particularly evident in metal extrusion profiles and sheet metal. Both products have already undergone highly directional forming during the production processes. For subsequent deformation steps, the material behavior is strongly dependent on the resulting direction-dependent strength. Therefore, it is essential to take the anisotropy of pre-deformation and the resulting microstructure into account when investigating multi-stage forming processes, e.g. forging of extruded profiles or rolling followed by deep-drawing.
In finite element (FE) simulations the relationship between the stresses and the direction-dependent deformation behavior is usually described by classical anisotropic material models such as Hill [1], Barlat [2,3] , Cazacu [4], or similar. These models typically use measured anisotropy coefficients that are applied to the entire component. However, local changes in the anisotropy coefficients during the material deformation are usually not covered. For this purpose, methods that take the local microstructure evolution into account must be applied.
While multiple approaches have been used to calculate the development of local anisotropy [5], a distinction must be made between approaches for calculating the interactions of individual crystals (full-field single crystal) and mesoscopic (polycrystal) approaches. When using single crystal approaches, only a smaller number of crystals are usually considered due to the computational intensity of the methods [6,7]. In contrast, the mesoscopic approach allows the simulation of larger components [8]. A representative of this mesoscopic approach is the VPSC model (Visco-Plastic Self-Consistent [9]), developed by the Los Alamos National Laboratory.
Due to the numerical effort involved, texture calculation methods were previously mainly performed without taking the component geometry into account. Today’s availability of high computing power has made approaches such as CPFE (Crystal Plasticity Finite Element [7]) methods or the implementation of VPSC in finite element calculation routines [8] possible. This means that complex part geometries, manufacturing processes or process chains can now be simulated in including e.g. the texture evolution.
In the work of Li, et al. [10], they have implemented a crystal plasticity model for precipitation hardenable aluminum alloys in LS-DYNA®. Li et al. found a gooed agreement of experimental and simulated results for AA6060 in T6 state. Properties such as strain hardening rate, plastic anisotropy and the Bauschinger effect could be captured very well. The model is very well suited for parametric studies were the influence of the precipitate volume fraction or the precipitate aspect ratio can be investigated.
The deep-drawing process of a cup made of AA 6K21 e.g. was simulated in the work of Wang et al. [11] by means of a quarter model in LS-DYNA®. They used anisotropic Drucker, Hill48 and YLD91 yield functions and compared the results with the implementation of a CPFEM model in ABAQUS. The texture was considered by a RVE (Representative Volume Element) containing 800 grains and applied to the full-field CPFEM method. They found a good agreement of the position and height of ears, especially for the CPFEM implementation in ABAQUS. The numerical effort, however was approx. 13 times higher than that of the constitutive models in LS-DYNA® explicit.
In the work of Asgharzadeh et al. [12], CPFEM was applied by an RVE model for a low carbon steel. Their focus was on the effect of second phase particles on the mechanical properties. Dog-bone specimen were cut out of a heat-treated steel tube and the properties were determined by uniaxial tensile tests. Here as well as in the work of Wang et al. [11], a multitude of parameters need to be determined. Therefore, only a single uniaxial tensile test in ED direction was used to calibrate the CP (crystal plasticity) parameters using a 3D RVE (representative volume alement). It took 60 days to run the CPFEM simulation with the RVE model of the virtual tensile test. To solve this issue, they used a "homogenization" procedure for the second phase particles to reduce the numerical effort by 99 %. Although a good agreement of experiments and simulations could be achieved, only a tensile test based on a RVE was simulated.
Another way to increase the numerical efficiency is to apply the VPSC model. VPSC was already applied by Zhang et al. [13] to simulate the local texture evolution in porthole die extrusion of hollow profiles for the automobile industry. However, VPSC was applied as standalone code to predict the local anisotropy of certain flow lines and to fit a Barlat YLD2004-18p flow rule. For the prediction of the spatial variation of plastic strain near the weld seams, the fitted material model was applied in a LS-DYNA® simulation. Good agreement could be found between DIC measurements and FEM results.
More crystallographically more complex materials and effects like Twinning in Magnesium alloys were already investigated using e.g. elasto-viscoplastic self-consistent (EVPSC) models by Bhattacharyya [14]. Although the standalone code was used, and therefore the geometry neglected, good results could be obtained for the very complex phenomenon of twinning in Magnesium alloys.
Engler et al. [15] already modeled the earing formation for EN AW-3104 by performing FE-simulations of the cup drawing process and used the results to derive boundary conditions for the standalone VPSC computations. The VPSC code afterwards calculates the yield information according to the determined load history for the radial elongation under different in-plane angles. The yield information was afterwards introduced by Hill’s yield criterion [16]. 2D axial symmetric models as well as a 3D model, where earing was already predicted, are presented in [15]. Pronounced earing could be found at 0° and 90° to the rolling direction (RD) for recrystallized sheets and at 45° for the as-rolled state [15].
A version of VPSC for the integrated use in the FE solver ABAQUS was published in 2018 by Zecevic et al. [8]. They have implemented the VPSC code as material subroutine in ABAQUS and applied it to a Taylor impact test of a cylinder made of Tantalum. During the impact test, a good agreement of the resulting texture could be achieved even for high strain rates.
In this paper, the VPSC code described in [8] was implemented in the LS-DYNA® solver as user-defined subroutine for implicit calculations. Several adaptations in the LS-DYNA solver and the FE-VPSC code of [8] were necessary to allow the multitude of variables for VPSC to be stored for each element and timestep.
The functionality is demonstrated for texture development calculations by means of compression and deep-drawing simulations. Keeping in mind that in future works several slip systems, and possibly temperatures, are to be considered the simple Voce hardening law was applied in VPSC. The Voce model needs 4 parameters per slip system and temperature, which keeps the calibration parameters as low as possible. Since the aim of this work is to give details about the implementation of FE-VPSC as material subroutine (UMAT) in LS-DYNA®, only a crystallographically simple FCC material (EN AW-6082) using one slip system was used. Due to the available material (rectangular extruded profile), the characterization could be performed in all three main directions (ED, ND, TD). However, this material could not be used for deep-drawing experiments. The material model parameters were therefore determined from the compression tests and used in the show-case example of the cup drawing. Experimental results and details about the cup drawing example will be later published using another material (sheet metal).
2. Materials & Methods
FE-VPSC is an independent variant of the original VPSC program for implementation in FE solvers [8,17]. For the simulations presented below, FE-VPSC was implemented as a user-defined material subroutine in the LS-DYNA® FE solver.
2.1. VPSC-Model
The deformation path input for the VPSC subroutine is directly obtained from the FE program in the form of strain increments for each element. The resulting average stress matrix for each element, calculated by VPSC, is passed back to the FE program. At each timestep in the simulation, the current texture information is also stored for each grain of an element. The initial conditions and material constants are predominantly read at the beginning of the FE simulation, while only the latest state of deformation and texture is updated at each timestep by VPSC.
As a mesoscopic method, VPSC links macroscopic effects, i.e. plastic deformation, and the resulting microscopic material responses. The resulting changes in grain orientation and local flow stresses of a polycrystalline structure are calculated in correspondence with the plastic deformation applied. In this context a grain is only defined by its orientation, i.e. three Euler angles, and its size fraction in relation to the whole material structure. Consequently, grain orientations, e.g. from electron back scattered diffraction (EBSD) measurements, descriptions of the slip system activities and the prescribed deformation path are required as input parameters for the material simulation. The simulations are based on the assumption that each grain is embedded in a viscoplastic matrix, which in turn represents the average of all grains present in the material. The forming behavior of each individual grain is controlled by their individual slip system activities, which are derived from the grain orientation and the critical resolved shear stress (CRSS) of the slip systems [18]. The stresses are calculated in VPSC using an elastic predictor-plastic corrector method [19] based on the Voce hardening model. A set of Voce parameters must be assigned for each slip system under consideration. In addition, the crystal orientations are stored so that the texture evolution can be considered.
Thereby, the used VPSC approach allows for fast simulation times when compared to full-field methods, but shows rising calculation effort with increasing number of considered grains.
2.2. Implementation of FE-VPSC into LS-DYNA®
LS-DYNA® is a widely applied FE solver that allows a direct implementation of FORTRAN-based user-defined material models. As part of the implementation as a material subroutine, the stress response to a specified deformation increment is calculated by the FE-VPSC model in each FE time step and for each relevant element. The current strain increment tensor is submitted by the FEM framework to the VPSC implementation in every timestep and for every element. The hardening due to the strain is considered by applying the Voce model for each grain in each element and accounting for the grain orientation with respect to the local loading direction of the element. The results are submitted to LS-DYNA®, which in turn uses the stresses to determine the local strains for the next time step.
Based on the implementation of the VPSC method in the FE solver ABAQUS by Zecevic [20] a tailored interface converts the inputs from LS-DYNA® into a suitable form for FE-VPSC and then returns the relevant results. Important results from the FE-VPSC calculations are stored for each VPSC instance of each finite element for visualization by LS-DYNA®.
To simplify the interpretation of the texture evolution for the whole simulated part, an algorithm for the macroscopic visualization of the texture was developed and implemented. The grain structure, which is used in each VPSC instance of each FE element and time step, consists of multiple grains with individual orientations. The algorithm calculates the weighted average of all crystal orientations for each element and time step. For the averaging of the crystal orientations, the Euler angles need to be first converted into Quaternions. The weighted average of the Quaternions of all grain orientations is then used to color the elements with a color corresponding to the inverse pole figure (IPF), see insert in Figure 2. The coloring scheme of the IPF allows to compare or interpret the results similar to the EBSD measurements. In addition, the texture for selected elements can be exported and displayed as a pole figure, see Figure 1 (b).
2.3. Clustering of Textures
The VPSC (and FE-VPSC) simulations require the proportions of the respective grain orientations of the initial texture as input. The crystal orientations in the form of Euler angles can be exported from electron back scattered diffraction (EBSD) measurements. In addition, the fraction of each individual grain orientation in relation to the measured domain can be exported from the experiements as well. In case of FE-VPSC the model recalculates the changes in grain orientation for each FE element. It is therefore useful to reduce the number of measured grain orientations per element to limit the computational effort. The VPSC approach only considers the ratio of grain orientations compared to the whole input texture instead of each individual grain and its respective location. It is thus feasible to reduce the number of different grain orientations by applying a clustering algorithm. Our algorithm is based on a k-means clustering using weighted input data which merges clusters with similar orientations, according to a preset degree of data reduction (called cluster radius). Details about the clustering algorithm can be found in the work of Theil [21]. In this work a total of 16 effective clusters were determined from approximately 3000 measured grains. A comparison between the original and clustered texture is shown in Figure 1 (a).
Figure 1 (a) shows a comparison between the original pole figure and the clustered texture with a clustering radius of 0.8 (red dots). The contour plot of the clustered texture from the simulation is depicted in Figure 1 (b) and shows a fairly good agreement with the original pole figure despite the huge reduction from 3000 grains to only 16 clusters.
2.4. Material
An initial texture is required for a crystal-based simulation of anisotropy and macroscopic material behavior. If semi-finished products are deformed, e.g. a rolled sheet or an extruded profile, it already has an inherent texture due to its production process. The material data used for the simulations in this work stems from a extruded rectangular aluminum profile with the dimensions 25 x 12 mm (EN AW-6082). The necessary microstructure data, e.g. grain orientations and corresponding microstructural components, were determined using a Tescan Mira3 field emission scanning electron microscope equipped with a EDAX Hikari Plus electron back scattered diffraction (EBSD) detector, operated at 20 mm working distance. Figure 2 (a) shows the initial microstructure and the measured texture as an inverse pole figure map (IPF map).
Figure 2.
Microstructure of a extruded profile (EN AW-6082) shown as an inverse pole figure map, the insert at the top right shows the corresponding color coding (a), and three deformed specimens from each extruded EN-AW6082 after compression tests at room temperature in direction (ED, ND, TD).
Figure 2.
Microstructure of a extruded profile (EN AW-6082) shown as an inverse pole figure map, the insert at the top right shows the corresponding color coding (a), and three deformed specimens from each extruded EN-AW6082 after compression tests at room temperature in direction (ED, ND, TD).
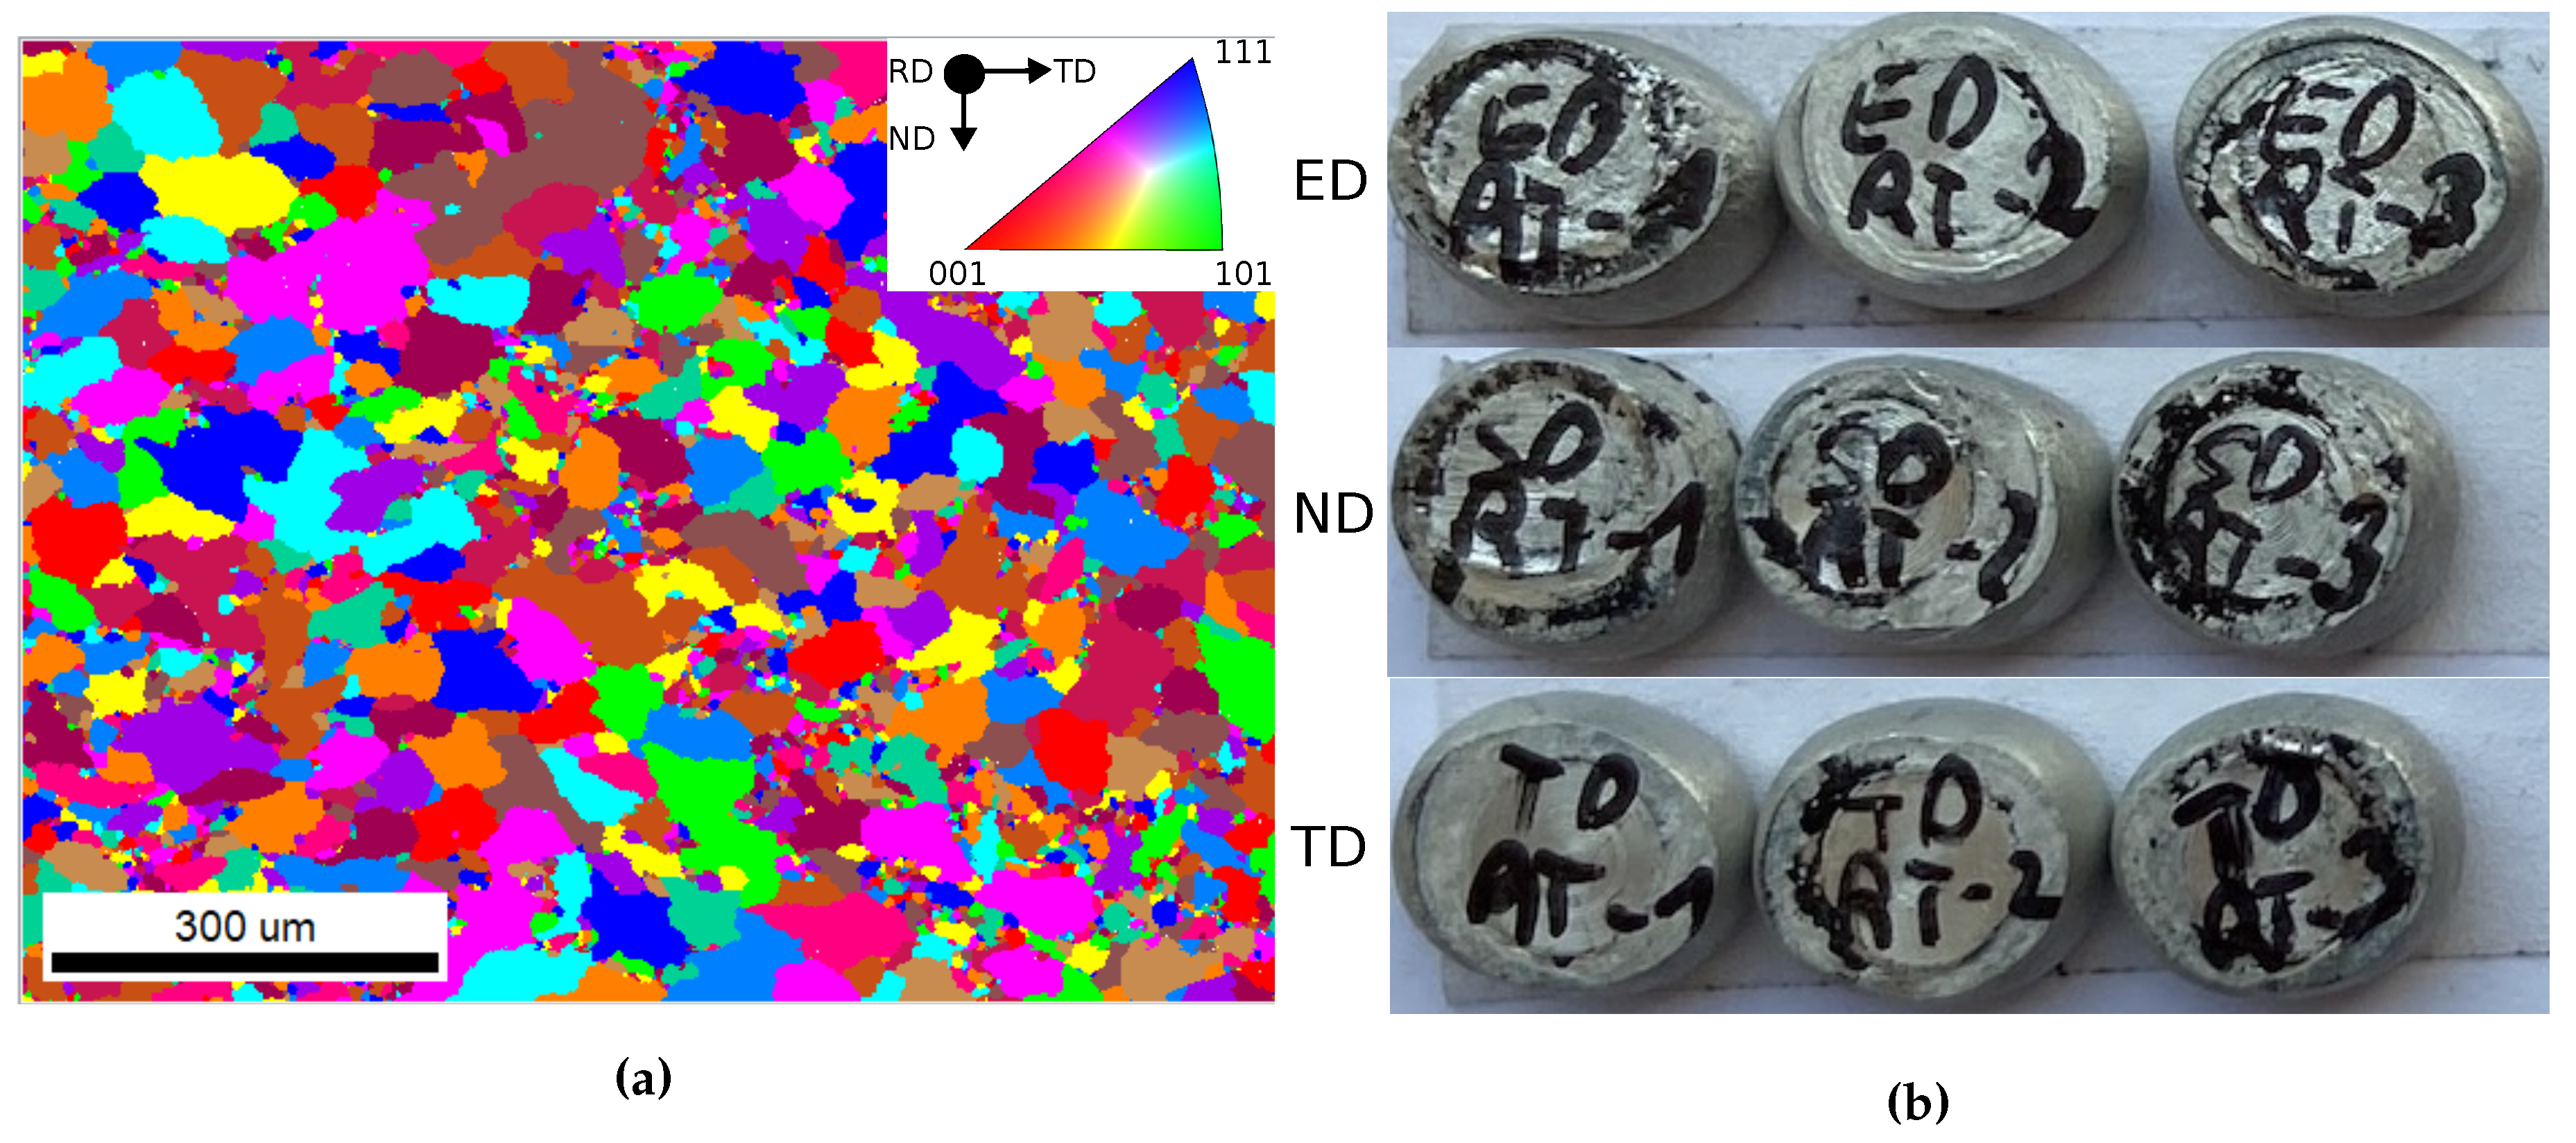
A DIL508 A/D of Texas Instruments was used to perform compression tests in three different directions, see Figure 2 (b). A simplified model of the compression test was used in a optimization procedure to fit the Voce parameters in a way to reproduce the measured force-displacement curves. The results of the compression tests, see Figure 3, show a reasonable agreement of force-displacement curves between experimental and simulated compression tests. The simulation results were obtained by calibrating the Voce hardening parameters using the compression test model according to the experimental results from ED and by applying it to the models corresponding to the ND and TD directions.
Figure 3.
Comparison of measured, and simulated force-displacement curves.
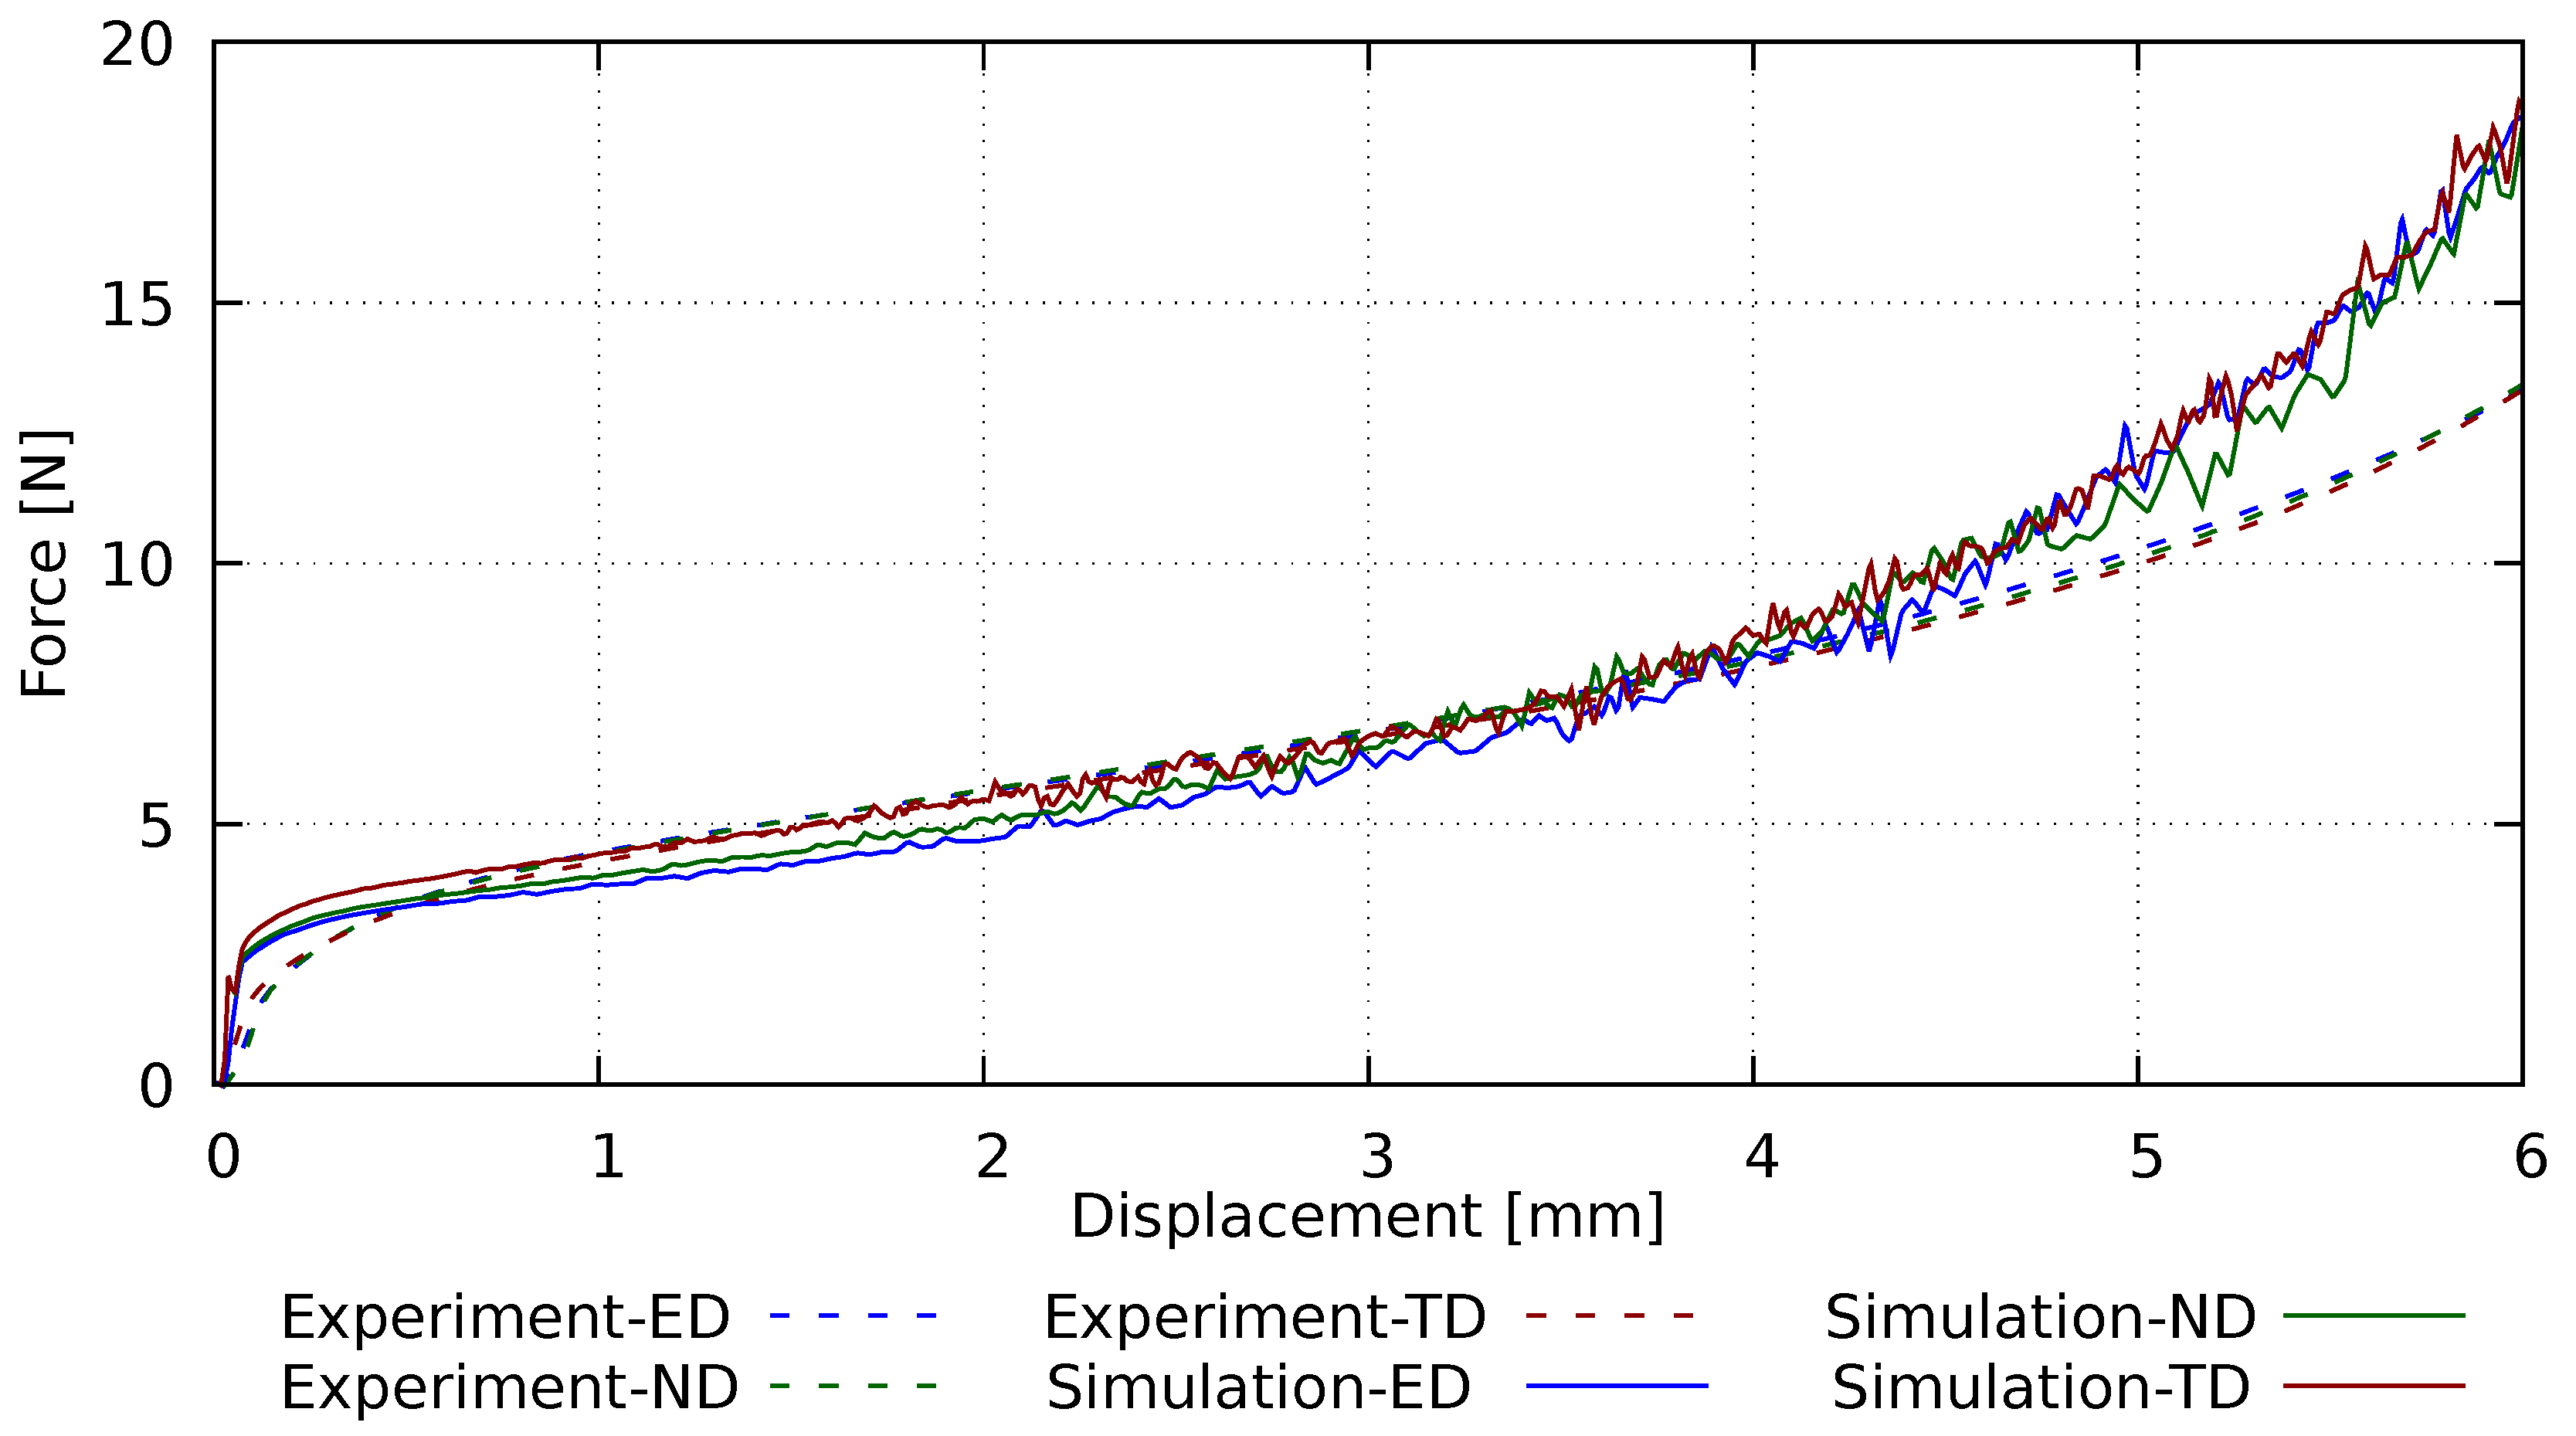
The compression experiment, see Figure 4 (a), was numerically reproduced for the extrusion direction (ED) with the aim to determine appropriate parameters for the Voce hardening law. An optimizer software (LS-Opt®) was used to find the fitting parameters for the ED direction. The same parameters were also used for the ND and TD direction tests. As can be seen in Figure 3, the two remaining directions (normal direction ND and transverse direction TD) are also fitting well for the main parts of the experimental curves.
3. Results & Discussion
To investigate the effects of an existing texture on the material behavior during a simulated forming process, LS-DYNA® in combination with FE-VPSC was used. The resulting simulations of a compression and a deep-drawing test are analyzed and compared with a similar FE setup using an isotropic and anisotropic material model.
The parameters for the experimental setup and the corresponding simulations are given in Table 1 for the compression test and Table 2 for the deep-drawing test. R denotes the sample radius, H the sample height, t the sheet thickness for the deep-drawing test, the forming rate in the compression test and , represent the inner and outer radius of the punch in the deep-drawing test. The number of elements (N), the number of iterations (I) and the simulation time per element and iteration () for the forming simulations are also provided. Due to the uniform distribution of the anisotropy in the extruded aluminum profile, all FE elements start with the same input texture, see Figure 2.
In the results of the respective simulations, which are presented below, RD refers to the rolling direction of the sheet metal. Furthermore, TD (transversal direction) denotes the sheet width and ND (normal direction) the profile thickness.
3.1. Compression Test Simulation
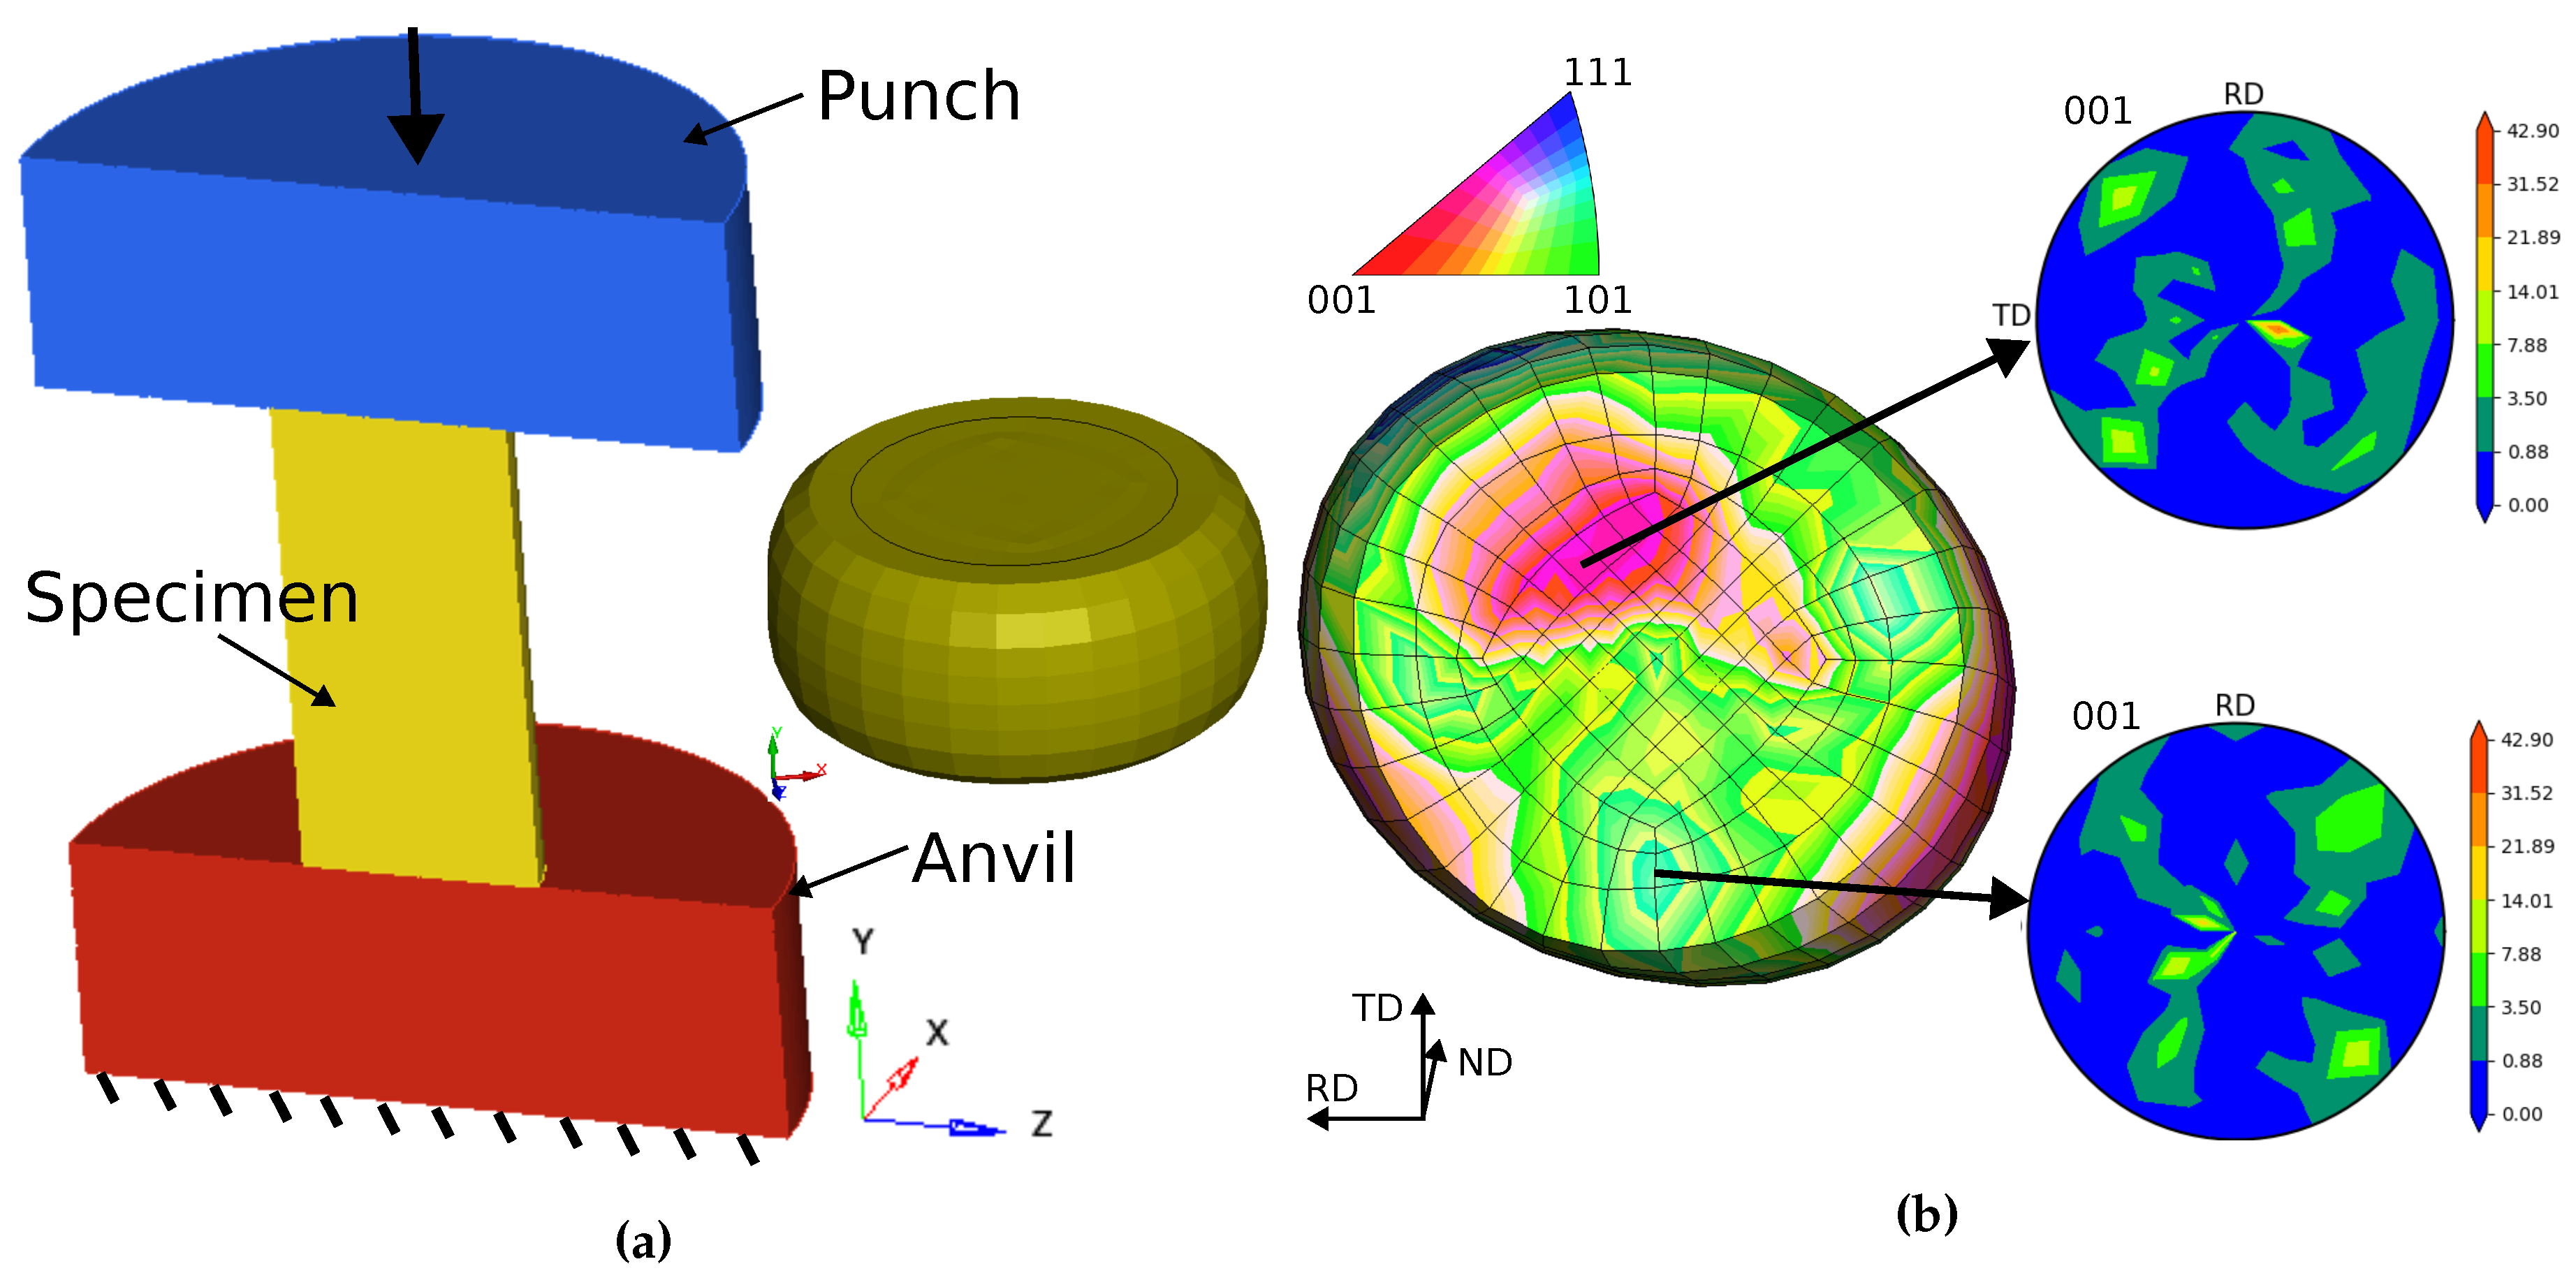
In the compression test, a cylinder was compressed at a constant deformation rate. The test setup is shown in Figure 4 (a) and Table 1 contains the relevant parameters.
The resulting geometry from the reference simulation with an isotropic material model is also shown in Figure 4 (a). Due to the isotropy, the result is completely rotationally symmetrical and has no preferred direction of deformation. However, in reality there is often an ovality when compressing samples made of rolled material [22] or extruded profiles (see Figure ). Such a behaviour can be caused by the inherent texture and corresponding mechanical anisotropy of the sample. As the material deforms more easily in directions of low mechanical strength, the sample gets distorted accordingly. The result of the FE-VPSC simulation in Figure 4 (b) also shows such an oval shape, providing proof of the successful interaction of material texture via FE-VPSC and the deformation path superimposed by LS-DYNA®.
The colors of the FE elements in Figure 4 (b) show different (average) crystal orientations in correspondence to the rolling direction, as briefly described in Section 2.2. As all FE elements start with the same initial texture this is a clear indication for the texture evolution calculated individually for each element. The pole figures of two simulated elemental textures after deformation are shown in Figure 4 (b).
Figure 4.
Test setup of the compression test and resulting isotropic simulation (a) and contour plot of the deformed compression test model with clustered texture (radius 0.8) and pole figures for two selected elements (b).
Figure 4.
Test setup of the compression test and resulting isotropic simulation (a) and contour plot of the deformed compression test model with clustered texture (radius 0.8) and pole figures for two selected elements (b).
3.2. Deep-Drawing Simulation
Deep-drawing operations are important industrial processes, which are used to form metal sheets into various (complex) part geometries, e.g. automotive parts. For our investigation we simulated the cup drawing process, which is relatively simple but a well known test in material characterization. Pronounced earing was already found by Engler et al. [15] at 0° and 90° to the rolling direction (RD) for recrystallized sheets and at 45° for the as-rolled state.
In contrast to Engler et al., we introduced VPSC directly into the FEM code and therefore obtain the anisotropic behavior in a two-way coupling between mechanical calculation and texture evolution. Our test setup and the isotropic reference simulation are shown in Figure 5 (a). The relevant parameters are summarized in Table 2. Punch, blank holder and die were modelled as rigid bodies and meshed with shell elements. However, since FE-VPSC is currently only implemented for solid elements, the workpiece is meshed with three layers of solid elements.

Table 2.
Parameters for the deep-drawing simulation.
| R [mm] | H [mm] | t [mm] | [mm] | [mm] | N [-] | I [-] | [s] |
|---|---|---|---|---|---|---|---|
| 1.0 | 100 | 1.0 | 18.75 | 25 | 22320 | 87 | 0.1 |
Similar to the compression test, the isotropic material model produces a rotationally symmetrical result, see Figure 5 (a). On the other hand, the result of the FE-VPSC simulation in Figure 5 (b) clearly shows variations in the texture. As the initial texture is identical for all FE elements at the start of the simulation, the texture evolutions are caused by the complex displacement fields of this simulation. The polefigures of two different FE elements, depicted for verification, show that differences exist both between each element and in comparison to the initial texture in Figure 1 (b).
The most striking result of this calculation is the formation of four so-called ears. Earing is a well-known effect of textured materials, which also occurs regularly in experiments [15]. The anisotropic profile properties, caused by the pronounced texture from the rolling process, lead to earing of the drawn cup. According to Engler et al. [15], the formation of ears occurs in the flange under the blank holder. Material behavior similar to this description was reproduced by the simulation model, where the ears form at approximately 45° to the extrusion direction in the as-extruded state, see Figure 6.
4. Conclusions
An efficient way of modelling the local texture development during the deformation of metals by using a mesoscopic approach was presented. The VPSC (Visco-Plastic Self-Consistent) model was used to simulate the texture evolution in an EN AW-6082 aluminum profile during a simple compression test and in a cup drawing operation. By implementing the VPSC model in the context of the finite element method, the effects of the material texture on the mechanical material properties as well as the forming behavior for entire components can be shown directly. In contrast to simpler phenomenological approaches to modeling material anisotropy, the evolution of the local texture during forming can be described and investigated.
In our work we have shown that:
- By implementing VPSC in the FEM framework of LS-DYNA®, even industry relevant part sizes could be simulated in a reasonable time.
- By applying a texture clustering algorithm, the numerical effort could be successfully reduced.
- The developed visualization method based on the averaging of crystal orientations converted to Quaternions gives a good first overview of the changes in the texture.
- First results for the compression tests show a oval specimen geometry, similar to the experiments.
- The cup drawing simulation also showed the earing phenomenon which is typical for this kind of test.
It is thought that the prediction and analysis of local correlations in the microstructure with external boundary conditions and process parameters will help to optimize individual processes and process chains. The mesoscopic (polycrystal) approaches employed in the VPSC model allows more detailed investigations of forming processes of real components. In contrast to some full-field methods, the enormous computing capacities and elaborate preparation of input data can be significantly reduced.
The implementation of FE-VPSC for shell elements should make it more convenient for sheet-metal forming processes in the future. This is thought to result in a significant acceleration of the currently still extensive calculation times. With further improvements in computational efficiency (e.g. the implementation of the clustering algorithm for the VPSC calculation itself, improvements in the parallelization procedures, ...), phenomenological approaches could be replaced in the future.
The results presented here are still a proof of concept. Since the extruded profile material could not be used for deep-drawing experiments, only the simulation of the cup-drawing process was shown. Subsequently, investigations using another material (sheet metal) are planned to validate the simulated cup-drawing results and to prove the accuracy of the predictions.
Author Contributions
Conceptualization, J. K. and N. P.; methodology: J. K.; software: J. K. and E. T.; validation: J. K. and N. P.; data curation: A. O. and A. A.; writing–—original draft preparation: J. K. and E.T.; writing—review and editing: J. K. and A.O. and N. P. All authors have read and agreed to the published version of the manuscript.
Funding
This research was funded by the Province of Upper Austria in the course of the Data-T-Rex project, grant number: Wi-2021-305676/13-Au.
Data Availability Statement
The data that support the findings of this study are available from the corresponding author, J. K., upon reasonable request.
Acknowledgments
Thanks go to the Los Alamos National Laboratory and especially to Miroslav Zecevic for providing the FE-VPSC code and supporting the implementation in LS-DYNA®.
Conflicts of Interest
The authors declare no conflict of interest.
References
- Hill, R. Constitutive modelling of orthotropic plasticity in sheet metals. Journal of the Mechanics and Physics of Solids 1990, 38, 405–417. [Google Scholar] [CrossRef]
- Barlat, F.; Lege, D.J.; Brem, J.C. A six-component yield function for anisotropic materials. International Journal of Plasticity 1991, 7, 693–712. [Google Scholar] [CrossRef]
- Barlat, F.; Brem, J., C.; Yoon, J., W.; Chung, K.; Dick, R., E.; Lege, D.; Pourboghrat, F.; Choi, S.H.; Chu, E. Plane stress yield function for aluminum alloy sheets—part 1: theory. International Journal of Plasticity 2003, 19, 1297–1319. [Google Scholar] [CrossRef]
- Cazacu, O.; Plunkett, B.; Barlat, F. Orthotropic yield criterion for hexagonal closed packed metals. International Journal of Plasticity 2006, 22, 1171–1194. [Google Scholar] [CrossRef]
- Roters, F.; Eisenlohr, P.; Hantcherli, L.; Tjahjanto, D., D.; Bieler, T., R.; Raabe, D. Overview of constitutive laws, kinematics, homogenization and multiscale methods in crystal plasticity finite-element modeling: Theory, experiments, applications. Acta Materialia 2010, 58, 1152–1211. [Google Scholar] [CrossRef]
- Ruiz Sarrazola, D.; Pino Muñoz, D.; Bernacki, M. A new numerical framework for the full field modeling of dynamic recrystallization in a CPFEM context. Computational Materials Science 2020, 179, 109645. [Google Scholar] [CrossRef]
- Knezevic, M.; Drach, B.; Ardeljan, M.; Beyerlein, I.J. Three dimensional predictions of grain scale plasticity and grain boundaries using crystal plasticity finite element models. Computer Methods in Applied Mechanics and Engineering 2014, 277, 239–259. [Google Scholar] [CrossRef]
- Zecevic, M.; Knezevic, M. A new visco-plastic self-consistent formulation implicit in dislocation-based hardening within implicit finite elements: Application to high strain rate and impact deformation of tantalum. Computer Methods in Applied Mechanics and Engineering 2018, 341, 888–916. [Google Scholar] [CrossRef]
- Lebensohn, R.; Tomé, C., N. A self-consistent anisotropic approach for the simulation of plastic deformation and texture development of polycrystals: Application to zirconium alloys. Acta Metallurgica et Materialia 1993, 41, 2611–2624. [Google Scholar] [CrossRef]
- Li, Y.L.; Kohar, C.P.; Mishra, R.K.; Inal, K. A new crystal plasticity constitutive model for simulating precipitation-hardenable aluminum alloys. International Journal of Plasticity 2020, 132, 102759. [Google Scholar] [CrossRef]
- Wang, S.; Shang, H.; Zhang, Z.; Lou, Y. Multi-scale numerical investigation of deep drawing of 6K21 aluminum alloy by crystal plasticity and a stress-invariant based anisotropic yield function under non-associated flow rule. Journal of Manufacturing Processes 2023, 102, 736–755. [Google Scholar] [CrossRef]
- Asgharzadeh, A.; Park, T.; Nazari Tiji, S.; Pourboghrat, F. A Computationally Efficient Multiscale, Multi-Phase Modeling Approach Based on CPFEM to Assess the Effect of Second Phase Particles on Mechanical Properties. Crystals 2023, 13, 1199. [Google Scholar] [CrossRef]
- Zang, A.; Béland, J.F.; Wang, Y.; Parson, N.; Poole, W.J. , The Role of Local Crystallographic Texture on Strain Localization at Weld Seams in Al-Mg-Si Porthole Die Extrusions. In Proceedings of the 14th International Conference on the Technology of Plasticity - Current Trends in the Technology of Plasticity; Springer Nature Switzerland; 2023; pp. 427–434. [Google Scholar] [CrossRef]
- Bhattacharyya, J.; Kada, S.; Barnett, M.; Agnew, S. Crystal plasticity and in-situ diffraction-based determination of the dislocation strengthening and load-sharing effects of precipitates in Mg alloy, AZ91. Materialia 2019, 6, 100308. [Google Scholar] [CrossRef]
- Engler, O.; Kalz, S. Simulation of earing profiles from texture data by means of a visco-plastic self-consistent polycrystal plasticity approach. Materials Science and Engineering: A 2004, 373, 350–362. [Google Scholar] [CrossRef]
- Hill, R. A theory of the yielding and plastic flow of anisotropic metals. Proceedings of the Royal Society of London. Series A. Mathematical and Physical Sciences 1948, 193, 281–297. [Google Scholar] [CrossRef]
- Segurado, J.; Lebensohn, R.A.; LLorca, J.; Tomé, C.N. Multiscale modeling of plasticity based on embedding the viscoplastic self-consistent formulation in implicit finite elements. International Journal of Plasticity 2012, 28, 124–140. [Google Scholar] [CrossRef]
- Tomé, C.N.; Lebensohn, R.A. VISCO-PLASTIC SELF-CONSISTENT (VPSC) Version 7c. Los Alamos National Laboratory, 2009.
- Tsakmakis, C.; Willuweit, A. , Use of the Elastic Predictor-Plastic Corrector Method for Integrating Finite Deformation Plasticity Laws. In Lecture Notes in Applied and Computational Mechanics; Springer Berlin Heidelberg, 2003; pp. 79–106. [CrossRef]
- Zecevic, M.; Lebensohn, Ricardo, A. ; Rogers, M.; Moore, J.; Chiravalle, V.; Lieberman, E.; Dunning, D.; Shipman, G.; Knezevic, M.; Morgan, N. Viscoplastic self-consistent formulation as generalized material model for solid mechanics applications. Applications in Engineering Science 2021, 6, 100040. [Google Scholar] [CrossRef]
- Theil, E. Clustering technique for efficient coupled simulations of grain structure and precipitation kinetics. Master’s thesis, TU Wien, 2022.
- Oberländer, T.F. , Stoffflußbetrachtungen. In Ermittlung der Fließkurven und der Anisotropie-Eigenschaften metallischer Werkstoffe im Rastegaev-Stauchversuch; Springer Berlin Heidelberg, 1990; pp. 76–98. [CrossRef]
Figure 1.
Polefigures of the texture before (black) and after (red) clustering with radius 0.8 (a) and contour plot of the clustered texture with a clustering radius of 0.8 (b).
Figure 1.
Polefigures of the texture before (black) and after (red) clustering with radius 0.8 (a) and contour plot of the clustered texture with a clustering radius of 0.8 (b).
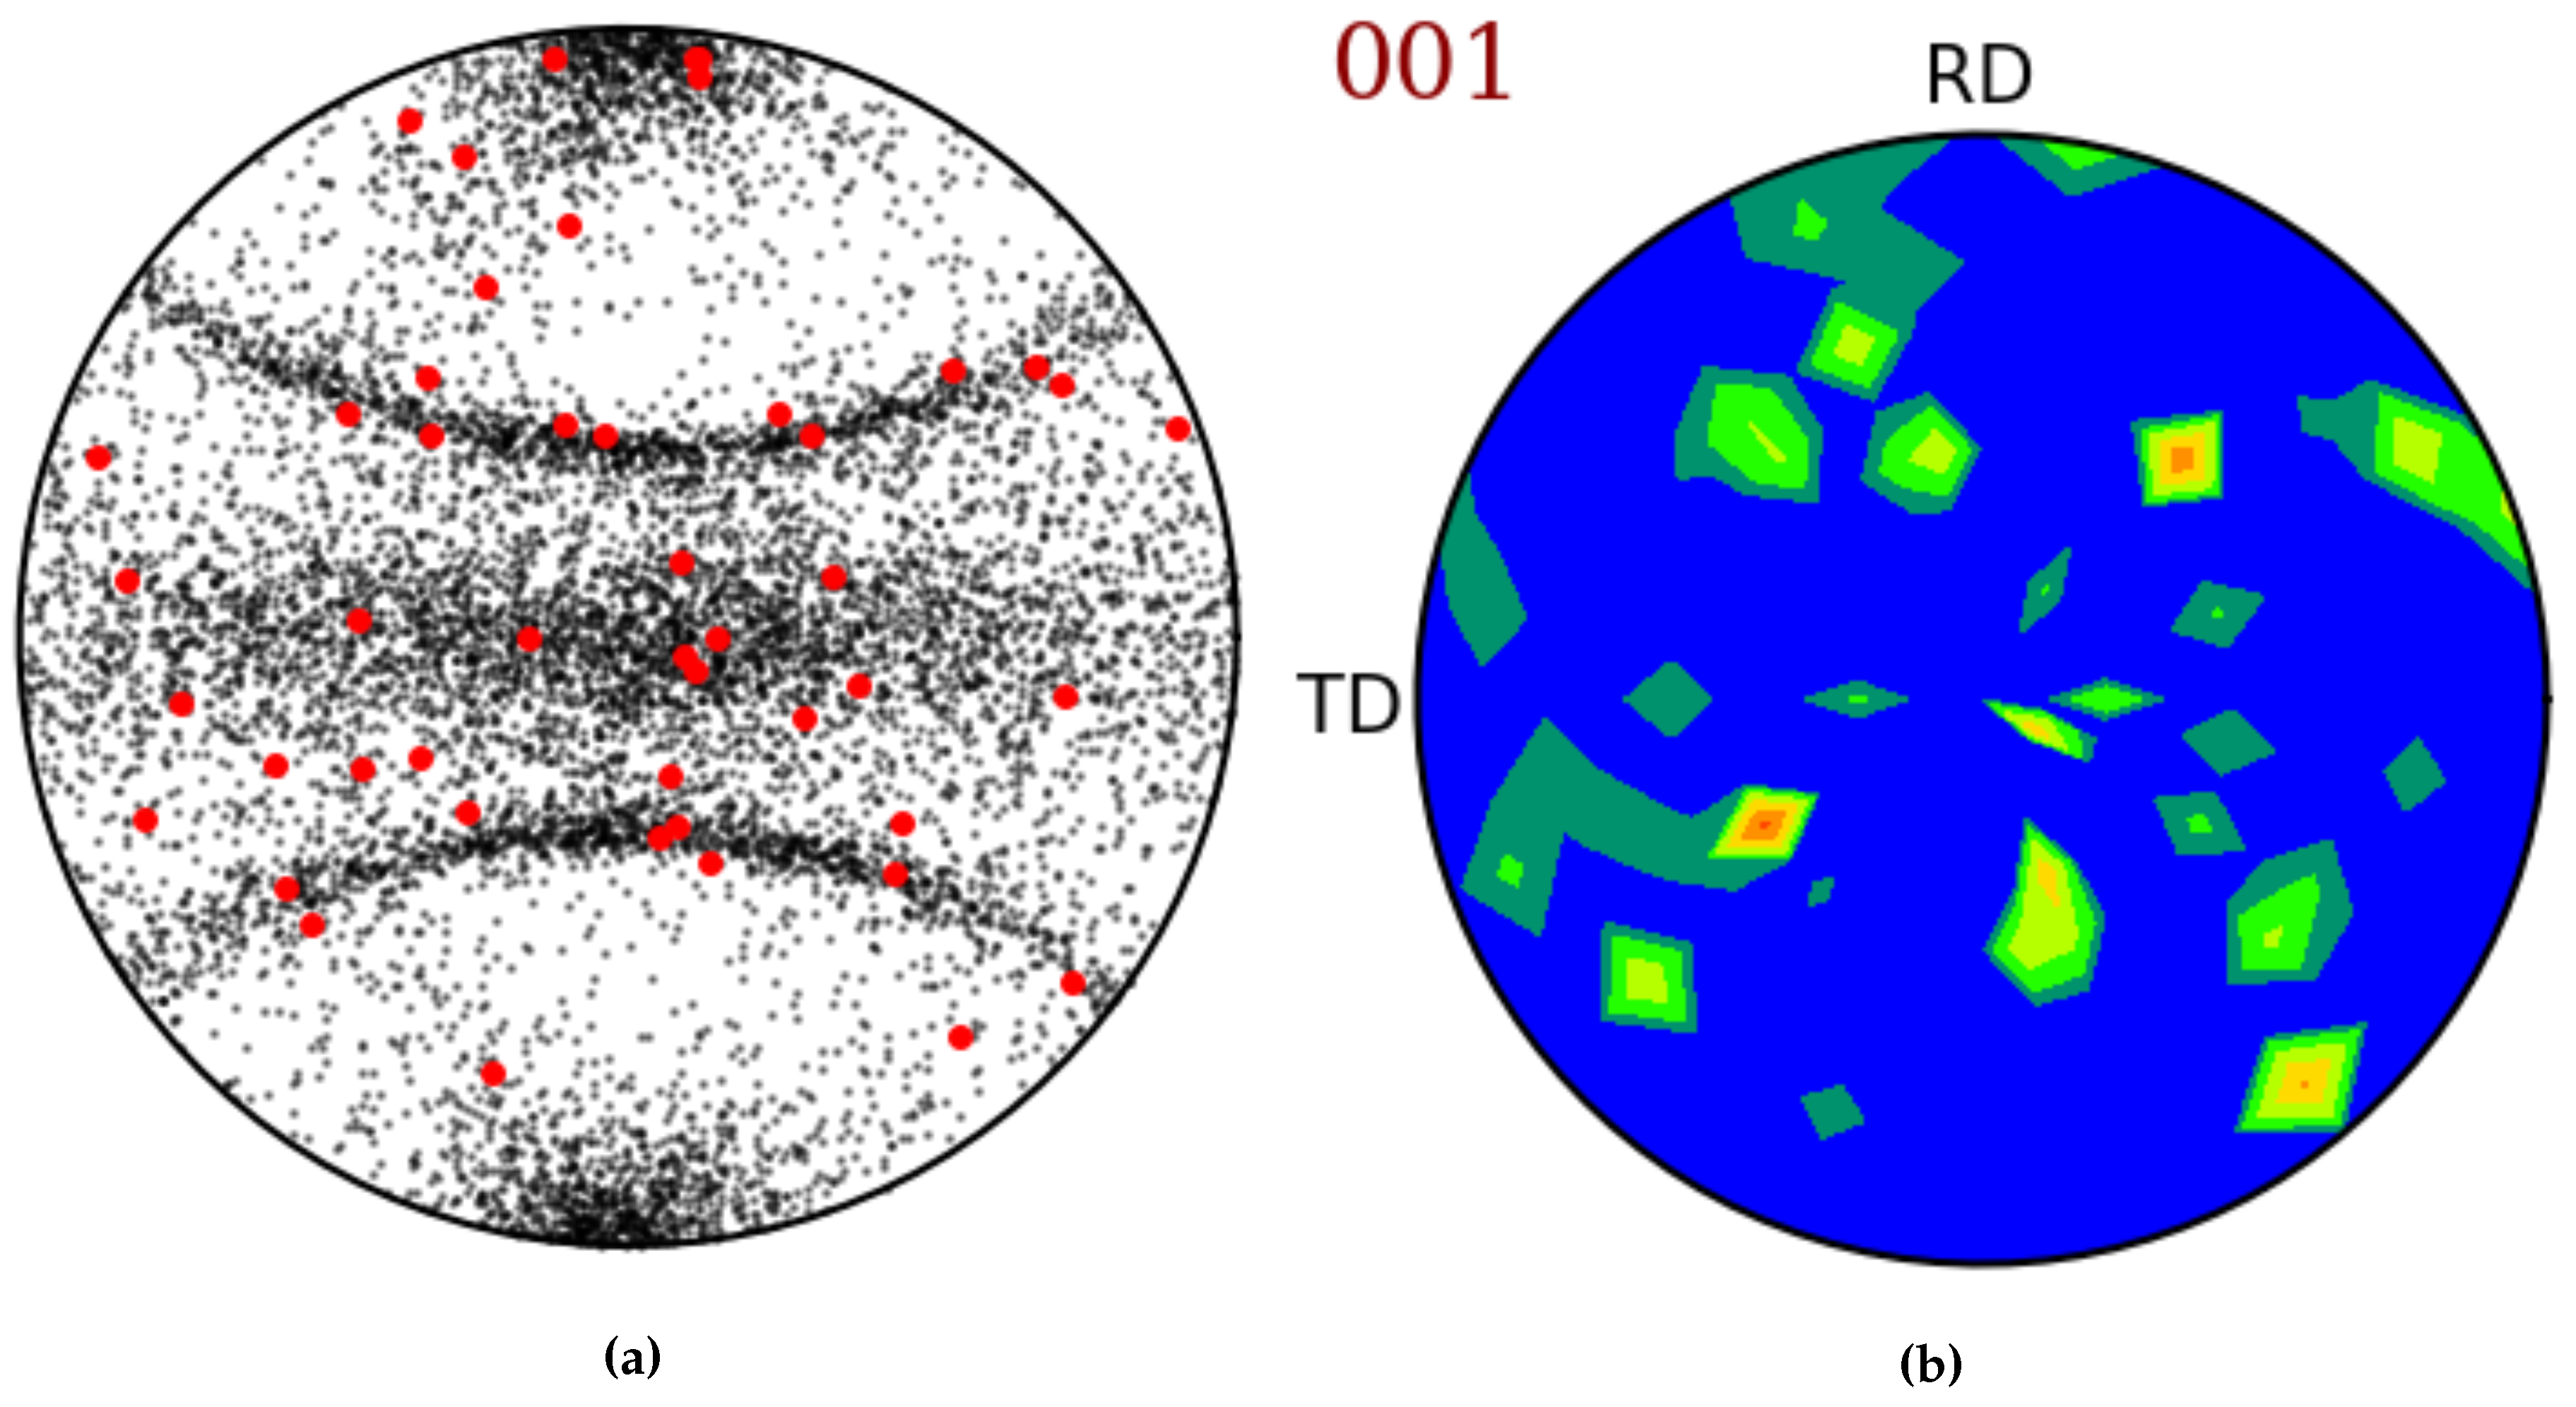
Figure 5.
Test setup of the deep-drawing test with punch and matrix and result of the reference simulation (a). Contour plot of the deformed deep-drawing test sample with clustered (radius 0.8) texture and pole figures for two selected elements (b).
Figure 5.
Test setup of the deep-drawing test with punch and matrix and result of the reference simulation (a). Contour plot of the deformed deep-drawing test sample with clustered (radius 0.8) texture and pole figures for two selected elements (b).

Figure 6.
Formation of ears at 37 mm punch displacement in the flange under the blank holder during the deep-drawing process (a). The blank holder and punch are omitted for an unrestricted view. Comparison of blank geometry at different stages of the deep-drawing process (b).
Figure 6.
Formation of ears at 37 mm punch displacement in the flange under the blank holder during the deep-drawing process (a). The blank holder and punch are omitted for an unrestricted view. Comparison of blank geometry at different stages of the deep-drawing process (b).
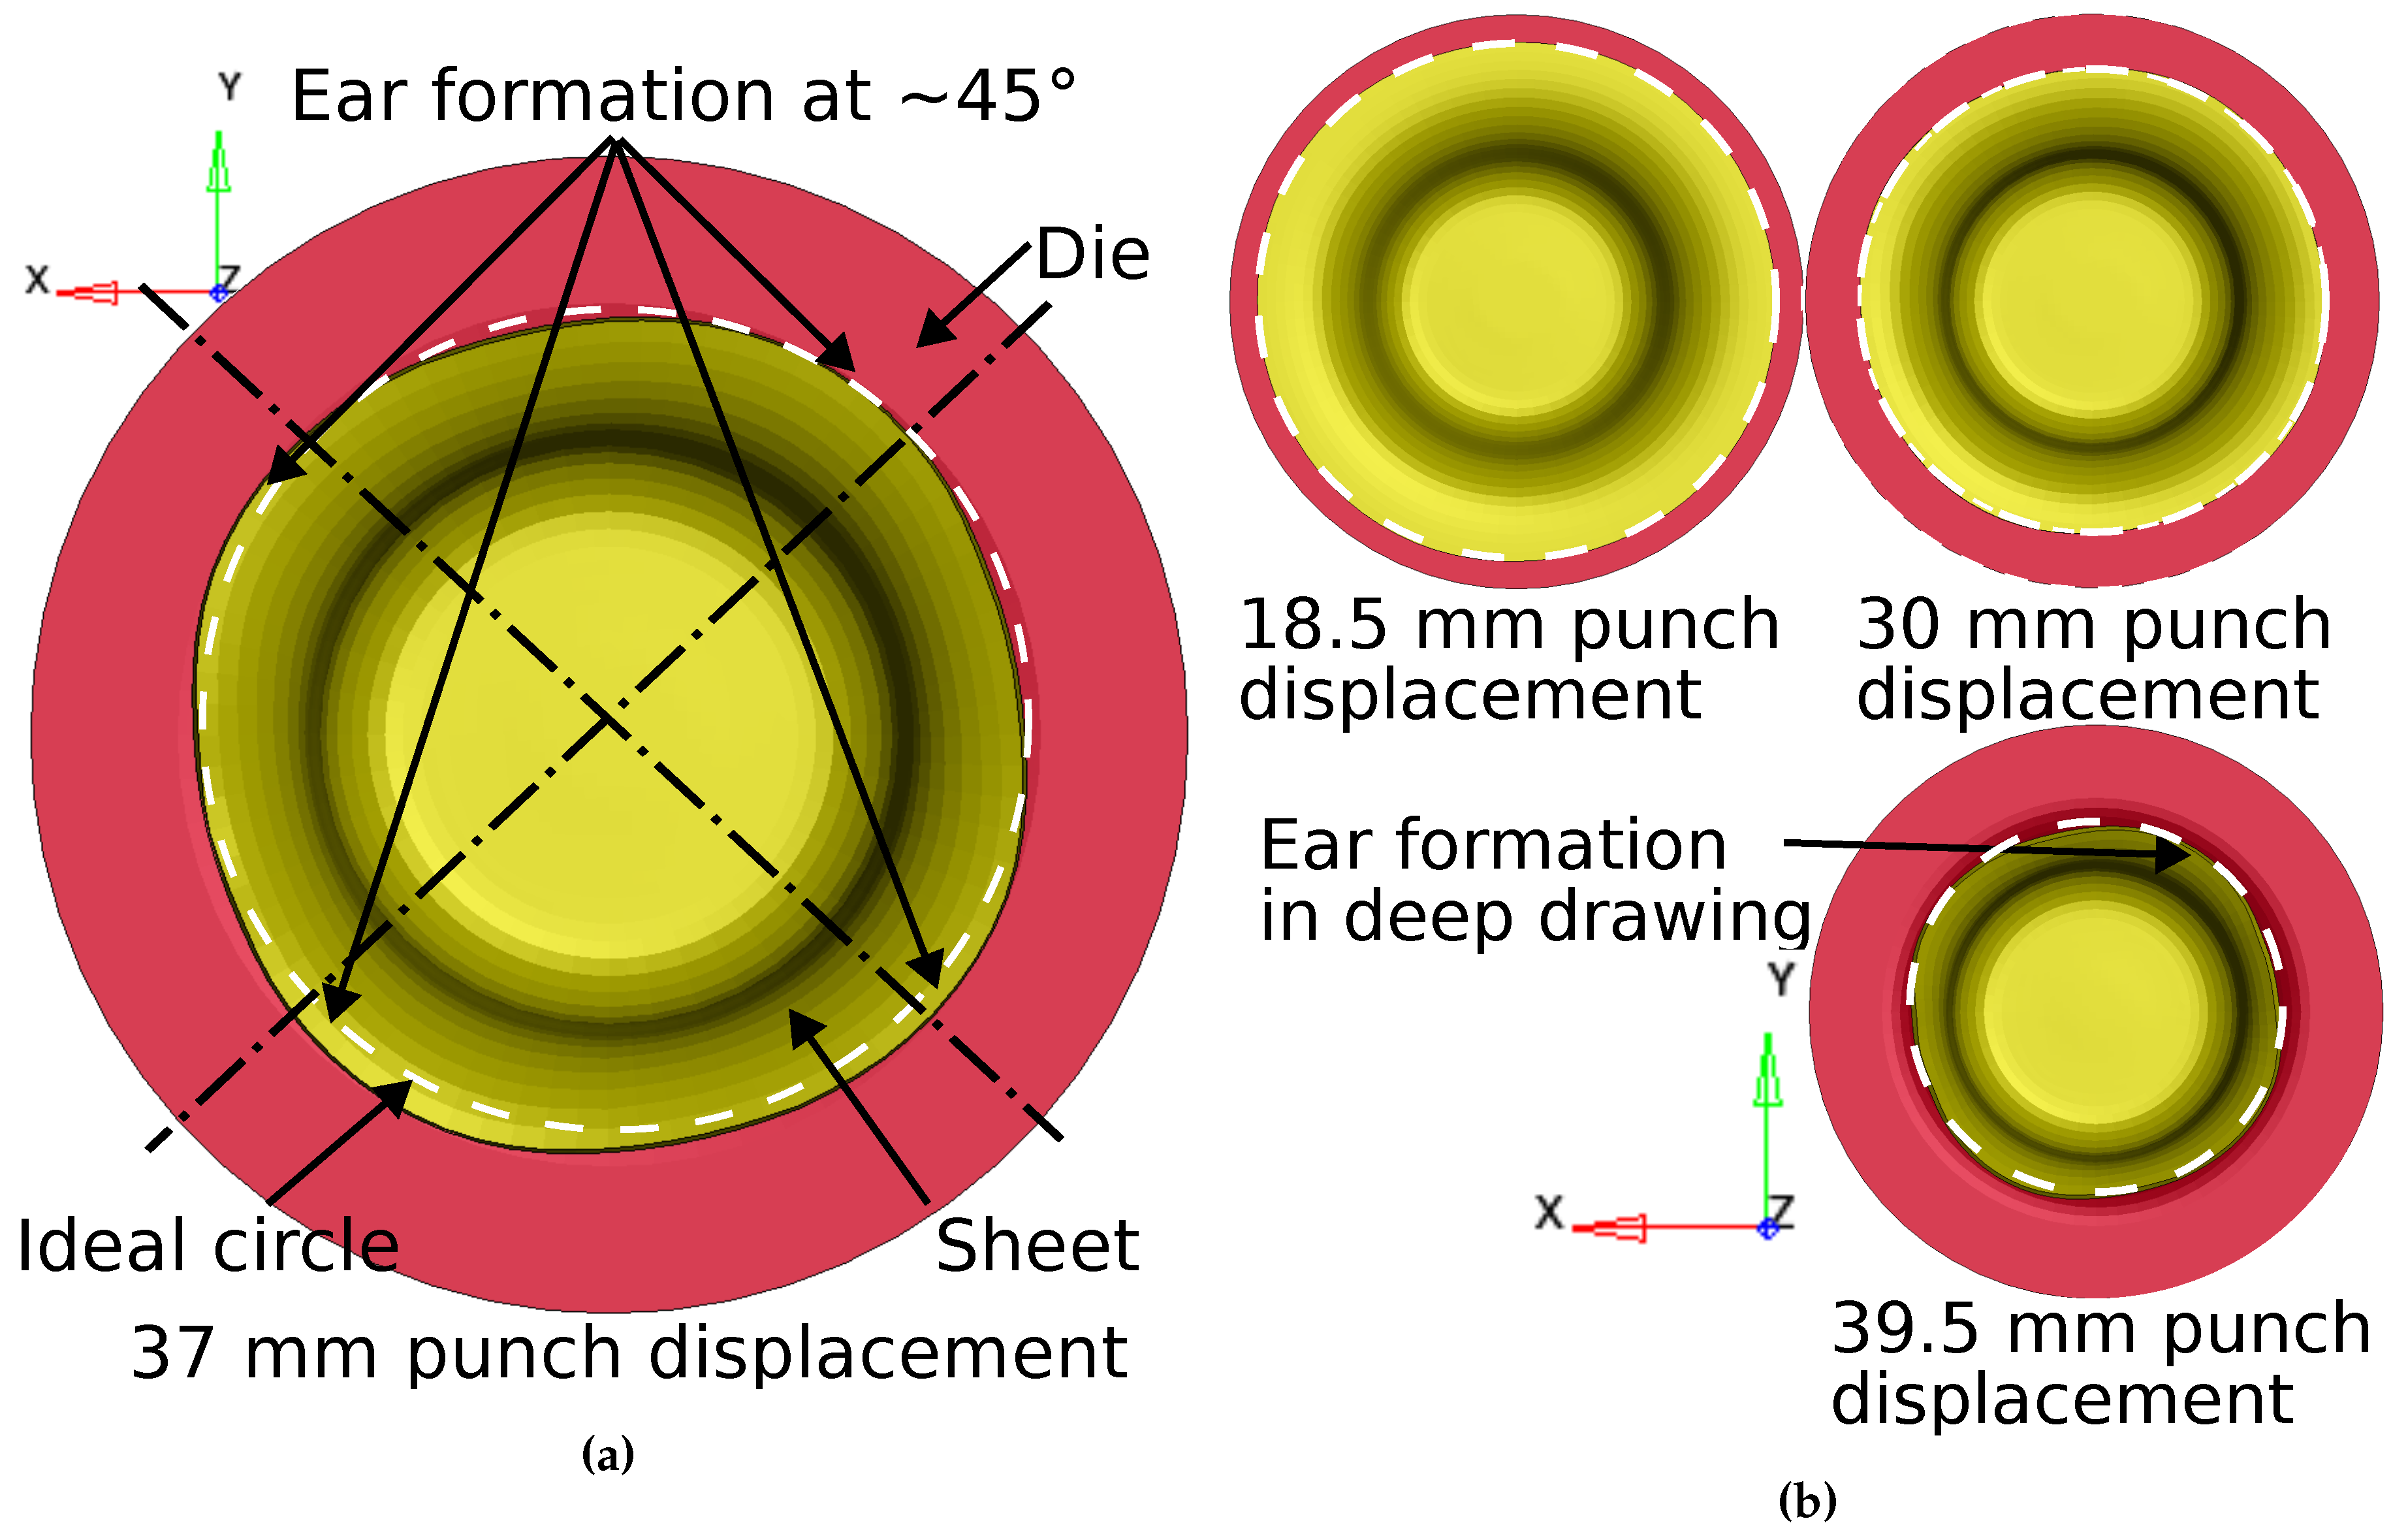
Table 1.
Parameters for the compression test simulation.
| R [mm] | H [mm] | [1/s] | N [-] | I [-] | [s] |
|---|---|---|---|---|---|
| 2.5 | 10 | 0.1 | 1280 | 196 | 0.2 |
Disclaimer/Publisher’s Note: The statements, opinions and data contained in all publications are solely those of the individual author(s) and contributor(s) and not of MDPI and/or the editor(s). MDPI and/or the editor(s) disclaim responsibility for any injury to people or property resulting from any ideas, methods, instructions or products referred to in the content. |
© 2024 by the authors. Licensee MDPI, Basel, Switzerland. This article is an open access article distributed under the terms and conditions of the Creative Commons Attribution (CC BY) license (http://creativecommons.org/licenses/by/4.0/).
Copyright: This open access article is published under a Creative Commons CC BY 4.0 license, which permit the free download, distribution, and reuse, provided that the author and preprint are cited in any reuse.


