Submitted:
07 May 2024
Posted:
07 May 2024
Read the latest preprint version here
Abstract
Accurate forecasting of crop yields holds paramount importance in guiding decision-making processes related to breeding efforts. This study focused on the application of multi-sensor data fusion and machine learning algorithms based on unmanned aerial vehicles (UAVs) in wheat yield prediction. Five machine learning (ML) algorithms namely random forest (RF), partial least squares (PLS), ridge regression (RR), K-Nearest Neighbor (KNN) and eXtreme Gradient Boosting Decision Tree (XGboost) were utilized for multi-sensor data fusion, and three ensemble methods including the second-level ensemble methods (stacking and feature-weighted) and the third-level ensemble method (simple average) for wheat yield prediction. The 270 wheat hybrids were used as planting materials under full and limited irrigation treatments. A cost-effective multi-sensor UAV platform, equipped with red–green–blue (RGB), multispectral (MS), and thermal infrared (TIR) sensors, was utilized to gather remote sensing data. The results revealed that the XGboost algorithm exhibited outstanding performance in multi-sensor data fusion, with the RGB+MS+Texture+TIR combination demonstrating the highest fusion performance (R2=0.660, RMSE= 0.754). Compared with the single ML model, the employment of three ensemble methods significantly enhanced the prediction accuracy of wheat yield. Notably, the third-layer simple average ensemble method demonstrated superior performance (R2 = 0.733, RMSE= 0.668 t ha-1). It significantly outperformed both the second-layer ensemble methods of Stacking (R2= 0.668, RMSE= 0.673 t ha-1) and feature-weighted (R2= 0.667, RMSE= 0.674 t ha-1), thereby exhibiting superior predictive capabilities. This finding demonstrated that the third-layer ensemble method not only augments the predictive ability of the model but also fine-tuned the accuracy of wheat yield prediction through the employment of simple average ensemble learning. Consequently, it offers a novel perspective for crop yield prediction and breeding selection.
Keywords:
Machine learning
; Yield prediction
; Data fusion
; Wheat
; Phenotyping
1. Introduction
Wheat stands as one of the most vital crops globally, with approximately 35%-40% of the world's population relying on it as a primary food source. It contributes approximately 21% of food energy and 20% of protein intake. Given the backdrop of population growth and climate change, the early and accurate estimation of wheat yield holds utmost importance for safeguarding national food security and maintaining people's living standards (Sun et al., 2020; Zhou et al., 2017). Conventionally, the yield prediction method has primarily been dependent on field observation and investigation, which is not only a time-consuming and laborious process but also susceptible to subjective biases, and can even result in crop damage (Bian, et al., 2022). In recent years, remote sensing technology has gained widespread application in the domain of agricultural monitoring. This technology enables the effective acquisition of canopy spectral data from aerial sources, thereby facilitating the estimation of crop yields (Xu et al., 2021; Thenkabail et al., 2011). Furthermore, unmanned aerial vehicle (UAV)-based remote sensing technology has witnessed rapid development, owing to its distinctive advantages of flexibility and high resolution (Li et al., 2012).
The vegetation index (VI) derived from UAV images has demonstrated its effectiveness in predicting crop yields. Spectral, structural, thermal infrared (TIR), and texture features extracted from UAV-collected datasets through sensors can be utilized to assess various plant traits and structures (Maimaitijiang et al., 2020). For instance, low-altitude UAVs were employed to capture RGB imaging data of potato canopies at two distinct growth stages, to predict yields (Li et al., 2020). The use of a multispectral (MS) UAV platform for swift monitoring of the normalized vegetation index (NDVI) during the wheat filling stage exhibited a strong correlation with wheat grain yield (Hassan et al., 2019). Texture information extracted from UAV images can effectively reflect the spatial variations in pixel intensity, thereby emphasizing the structural and geometric characteristics of the plant canopy (De et al., 2009). The potential of UAV TIR imaging technology for assessing crop water stress and predicting wheat kernel yield in different wheat varieties has also been thoroughly validated (Das et al., 2020). However, the majority of studies solely rely on data from a single sensor to estimate crop yields, overlooking the advantages of combining multiple sensors. For example, by combining the features derived from MS, RGB, and TIR imaging, the accuracy of soybean yield prediction can be significantly improved (Maimaitijiang et al., 2020). The combination of canopy TIR information with spectral and structural characteristics can improve the robustness of crop yield prediction across diverse climatic conditions and developmental stages (Rischbeck et al., 2016). In particular, the application of machine learning (ML) techniques to the analysis of multi-sensor data collected by UAVs can significantly enhance the accuracy of crop yield predictions (Fei et al., 2022). On this basis, to fully harness the potential of ML algorithms, the machine learning technology is combined with the VIs extracted from the spectral image of the sensor to build a yield prediction model, which provides strong support for the relevant practices of precision agriculture (Liakos et al., 2016; Ramos et al., 2020).
At present, a variety of machine learning methods have been applied to yield prediction, such as random forest (RF) (Han et al., 2020), partial least squares (PLS) (Maimaitijiang et al., 2017), ridge regression (RR) (Ahmed et al., 2022), K-Nearest Neighbor (KNN) (Lontsi et al., 2022) and eXtreme Gradient Boosting Decision Tree (XGboost) (Sarijaloo et al., 2021). However, the predictions of the same model may vary significantly across different crops and environments, primarily due to the quality of data, the representation of the model, and the dependencies between input and target variables within the collected dataset (Chlingaryan et al., 2018). If the data is biased or if the chosen model exhibits overfitting to the respective dataset, the model will fail to demonstrate accurate performance (Van der Laan et al., 2007). Ensemble learning, a research hotspot, is proposed to address these challenges. Its objective is to integrate data fusion, data modeling, and data mining into a cohesive framework (Dong et al., 2019). the ensemble learning paradigm known as stacked regression involves linearly combining various predictors to enhance prediction accuracy (Leo et al., 1996; Zhang et al., 2015). The feature-weighted ensemble method assigns weights according to the correlation of features and estimates the degree of correlation between each feature and the extracted output model (Wei et al., 2015; Kelly et al., 1991; Raymer et al., 2000; Daszykowski et al., 2007). In this study, we employ a feature-weighted ensemble learning approach that assigns weights to the training dataset generated by the primary learner, based on the prediction accuracy of each individual learner. Subsequently, utilizing these weighted data, the meta-learner is trained to enhance the overall model's learning efficiency. To further refine the model performance, we introduce an innovative third-layer ensemble method, specifically the simple average ensemble method. To further optimize the model performance, we introduce a novel ensemble method in the third layer, specifically the simple average ensemble method. The method calculates the average values of the predictions of the stacking ensemble method and the feature-weighted ensemble method on the test set and compares them with the actual measured values to realize the effect of the third-layer ensemble learning.
The primary objective of this study was to explore the utilization of UAV-based remote sensing data obtained 21 days after wheat flowering to predict wheat yield. It includes: (1) evaluation and data fusion of UAV yield prediction methods based on RGB, MS, Texture and TIR; (2) Compare the accuracy of the basic learner (RF, PLS, RR, KNN and XGboost) and three ensemble methods (stacking, feature-weighted and simple average) for yield prediction, and then select the optimal approach.
2. Materials and Methods
2.1. Experiment Location and Design
Two hundred and seventy RILs from cross Zhongmai 578/Jimai 22 were planted at the research site of Chinese Academy of Agriculture Sciences (35°18′0″N, 113°52′0″E) in Xinxiang, Henan province, China during the 2021-2022 growing season. This experiment used randomized complete blocks with three replications under full and limited irrigation treatments. Two irrigations at the seedling and overwintering stages were poured for both treatments, the full irrigation treatment was flooded at the greening jointing and early grain filling stages. A plot area was 3.6 m2(1.2 m×3 m). It was designed in 6 lines, with a line spacing of 0.20 m. The planting density was maintained at 270 plants/m2, and agricultural management was performed according to local conditions. After maturity, the harvest was conducted using a combine harvester. The seeds were weighed after drying to a moisture content of less than 12.5%.
2.2. Multi-Sensor Image Acquisition and Processing Based on UAV
Data acquisition for all traits was done by a UAV platform M210 (SZ DJI Technology Co., Shenzhen, China). An RGB and TIR were the same sensor (Zenmuse XT2 camera, SZ DJI Technology Co., Shenzhen, China) with lens pixels of 4000×3000 and 640×512, respectively. MS sensor (Red-Edge MX camera, MicaSense, Seattle, USA) captures same pixel images (1280×960) in five bands including blue, green, red, red edge and near infrared (NIR) with wavelength were 475 nm, 560 nm, 668 nm, 717 nm and 842 nm, respectively. The aerial surveys were carried out at the 21 days post-anthesis due to the proven high accuracy of yield predictions during this period (Fei et al., 2022). All flight tasks were carried out from 10:00 to 14:00 in clear skies, using DJI Pilot software to set route parameters as follows: the forward and side overlap were 90% and 85%, respectively, and the flight altitude was 30 meters.
In this study, the Pix4D Mapper Pro 4.5.6 software (Pix4D, Lausanne, Switzerland) was used to perform radiometric correction and image stitching on RGB, TIR and MS images of UAV, and the visible, TIR orthophoto image and five-band orthophoto reflectance map were obtained. The obtained images with spectral reflectance were imported into ArcGIS 10.8.1 (Environmental Systems Research Institute, Inc., Redlands, USA) software for image cropping, each cell was selected as the area of interest, the features were extracted and to calculate the different VIs used in this study. The detailed process is shown in Figure 1. To minimize the noise impact on the images and enhance the efficiency of subsequent processing steps, it was necessary to exclude non-target areas from the acquired MS images. The Pix4D Mapper software was utilized to perform image stitching, shading correction, and digital number (DN) processing on the filtered MS data, ultimately converting it into a TIFF image format with spectral reflectivity. Radiation calibration was conducted prior to and following each flight using a dedicated calibration plate. Subsequently, the TIR data was calibrated based on the blackbody reference to determine the temperature corresponding to each pixel value in the TIR imagery.
2.3. Extraction of Vegetation and Texture Index
As a metric for evaluating physiological parameters of crops, VIs could effectively reflect the real-time growth level of crops (Xue et al., 2017). Ten color index and eleven MS VIs were selected as shown in Table 1.
In addition to spectral information, texture features as another important remote sensing information were less susceptible to external environmental factors. They reflected the grayscale nature of the image and its spatial relationships, thereby enhancing the inversion accuracy of single spectral information sources that may suffer from saturation issues. Furthermore, texture features enhanced the potential for inverting physicochemical parameters to a certain extent (Humeau-Heurtier, 2019). In ENVI 5.3, the widely utilized gray level co-occurrence matrix (GLCM) was used to extract 40 texture features for the RGB-based R, G, B bands and MS based red-edge, NIR bands. Then, the region of interest was delimited for the texture feature images of each band in ArcGIS 10.8.1 (Figure 1).
Principal component analysis (PCA) was a data mining technique in multivariate statistics. It transformed convert high-dimensional data into low-dimensional data through dimensionality reduction, while preserving the majority of the information within the data without compromising its integrity (Abdi et al., 2010). Through principal component analysis, we transformed the initial 40 texture features into 3 new principal components, which were linear combinations of the original features. Each principal component encapsulated a portion of the information from the original features. By utilizing these principal components, we effectively represented the original data in a lower-dimensional space while preserving as much of the data's variance as possible. Consequently, these three principal components could be regarded as representative of the most significant texture features within the dataset (Figure 1).
2.3. Ensemble Learning Framework
In ML, each algorithm possesses its distinct strengths. Ensemble learning achieves superior generalization performance by harnessing the combined advantages of various machine learning algorithms (Dong et al., 2020). This study proposed three methods in total. The first method was stacking regression, which was a heterogeneous ensemble learning model first introduced by WOLPERT in 1992 (Quinlan, 1992). The objective of this study was to integrate the predictive strengths of five fundamental models: RF, PLS, RR, KNN and XGboost. Initially, the training dataset was partitioned into an 80% training subset and a 20% testing subset. Each base model was then trained independently on the training subset, utilizing a 10-fold cross-validation approach, and their respective predictions were generated for the testing subset. Subsequently, these prediction results were employed as input features for the meta-model. RR served as the regression algorithm for the meta-model, tasked with learning to effectively integrate the learning algorithms of the various basic models in order to generate a final ensemble prediction. Throughout the training process, cross-validation techniques were employed to meticulously fine-tune the hyperparameters of the meta-model, with the ultimate goal of bolstering its generalization capabilities. Upon completion of the training phase, the refined stacking model was then utilized to predict outcomes for the test set, subsequently enabling a thorough evaluation of the model's overall performance (Figure 2).
The second approach was feature-weighted ensemble learning. Its essence laied in assigning distinct weights to each base learner depending on their predictive prowess. Each base model underwent training on the training set, and the coefficient of determination (R2) for each base model was computed using the testing set. Subsequently, the R2 values served as the foundation for allocating weights (Figure 2).
The third approach proposed in this study was simple average ensemble learning, where the predictions obtained from Stacking regression and the feature-weighted ensemble method on the testing set were averaged. Then, the R² score was computed between the averaged predictions and the true values of the testing set (Figure 2).
2.4. Model Performance Evaluation
In this study, the selection R2, root-mean-square error (RMSE) and normalized root-mean-square error (NRMSE) were selected as the indexes to evaluate the prediction accuracy of the base learner. The formula is as follows:
Where and are measured and predicted values of wheat yield, respectively, is the mean value of measured yield and n is the sample size.
The weight allocation formula is as follows:
Where is the weight of the primary learner, = 1, 2, ... , T; T is the number of primary learners; is the R2 of the primary learner; is the R2 of the primary learner.
This formula transforms the R² scores of each base model into weights and ensures that the sum of all weights equals 1. Thus, the stronger predictive performance of each base model is assigned a higher weight, leading to a larger proportion in the ensemble prediction.
3. Results
3.1. Principal Component Analysis of Texture Features
In analysing the initial value, variance contribution rate and cumulative variance contribution rate of the texture eigenprincipal components (Table 2), we observed that the initial eigenvalues of the first, second, and third principal components exceed 1, specifically 19.72, 11.13 and 3.09, respectively. The variance contribution rates were 49.30%, 27.80% and 7.70%, respectively, and the cumulative variance contribution rate amounted to 84.90%. This indicated that the first three principal components were capable of retaining 84.90% of the information from the original data. Consequently, the first three components were extracted as the principal components for the comprehensive evaluation of texture features.
Figure 3 displayed the loadings of the principal component analysis for the 40 texture features. The variance contributions of the first (PC1), second (PC2), and third (PC3) principal components were represented on the X-, Y- and Z-axes, respectively. It was evident that the larger the absolute value of a variable's coefficient on a particular principal component, the greater its contribution to that component.
3.2. Correlation Analysis of CI, VI, Texture Features and TIR with Wheat Yield
The Pearson’s correlation coefficient (r) analysis of vegetation index including 10 CIs and 11 VIs, 3 texture features and thermal infrared index were shown in Figure 4. The absolute correlation between CI and wheat yield ranged from r = 0.13 to r = 0.72. Among these, the highest correlation was observed with VARI (r = 0.72), while the lowest correlations were with PPR and GBRI (r = 0.13). The remaining 6 indices, IKAW, ExG, RGBVI, GLA, CIVE, RBRI and VARI, all exhibited correlations of 0.6 and above (r ≥ 0.60). The absolute correlation between VIs and wheat yield consistently approached 0.70, with RDVI and GOSAV showing the highest correlation (r = 0.70). The lowest correlation was observed with MTCI (r = 0.68). The texture features were primarily consisted of component analysis. In the correlation analysis between TIR and wheat yield, it was found that the absolute correlation value of PC1 was the highest (r = 0.69), whereas the remaining indices exhibited lower correlations. Notably, TIR demonstrated a relatively higher correlation (r = 0.68).
3.3. Wheat Yield Estimation for Optimal Sensor
In this study, five regression algorithms (RF, PLS, RR, KNN, and XGboost) were employed, alongside three ensemble learning algorithms, to forecast wheat yield. These predictions were based on features extracted from three distinct types of sensors (RGB, MS, and TIR) and their various combinations, as depicted in Table 3 and Figure 5. Among the predicted results from the single data source, the fusion of two data sources, the fusion of three data sources and the fusion of four data sources across eight machine learning algorithms, the highest R² values were observed for Texture (R² = 4.773), Texture+TIR (R² = 4.934), RGB+Texture+TIR (R² = 5.153) and RGB+MS+Texture+TIR (R² = 5.238). Additionally, the prediction error value based on the RGB+MS+Texture+TIR data fusion model was also the lowest, with RMSE = 5.546 t ha⁻¹ and NRMSE = 55.733%. Therefore, the RGB+MS+Texture+TIR data fusion yielded the most accurate predictions for wheat yield, surpassing single, dual and triple data source fusion. Specifically, it achieved a higher overall R² value, ranging from 9.74% to 33.48%, 6.17% to 19.61% and 1.64% to 8.88%, respectively, compared to the other fusion strategies. Furthermore, it demonstrated a lower total RMSE, decreasing by 7.53%-17.72%, 5.12%-16.07% and 3.23%-6.97%, respectively. Similarly, the total NRMSE was reduced by 7.54%-17.73%, 5.13%-16.06% and 3.31%-6.98%, respectively. In conclusion, the RGB+MS+Texture+TIR data fusion emerged as the most precise in estimating wheat yield.
3.4. Optimal Machine Learning Algorithm For Wheat Yield Estimation
Based on the results above, the fusion data of RGB+MS+Texture+TIR demonstrated high accuracy in predicting wheat yield. Among the five base models, the RR model performed the best when using RGB data (R² = 0.517) and TIR data (R² = 0.490) as single data sources. Conversely, PLS exhibited the highest predictive value for MS data (R² = 0.534), while XGboost showed the highest predictive value for Texture data (R² = 0.593). After the fusion of multi-sensor data, the prediction accuracy of most machine learning models was notably enhanced. The findings indicated that XGboost emerged as the top-performing predictive machine learning model, achieving an R² value of 0.660 (Table 3). The analysis results of the models on different data combinations are depicted in Figure 6. The R² value of XGboost was observed to be 0.011, 0.014, 0.0053, and 0.044 higher than RF, PLS, RR, and KNN, respectively. Furthermore, the XGboost model exhibited smaller errors in terms of RMSE and NRMSE. Specifically, its RMSE was lower than the other four models by 0.010, 0.013, 0.005, and 0.040, respectively, while the NRMSE was lower than 0.104, 0.131, 0.053, and 0.399, respectively. These findings further confirm the superiority of XGboost in wheat yield prediction, followed by RR.
Compared with the basic model, three ensemble methods were used in this study, including two second-layer ensemble methods (stacking and feature-weighted methods) and one third-layer ensemble method (simple average method). The analysis results were shown in Table 3. All three ensemble methods demonstrated higher model prediction accuracy compared to the single ML model. When compared to the single ML model that performed best on single sensor data, stacking, feature-weighted and simple average ensemble learning increased the R² values of the single sensor by 1.53% -2.16%, 0.50%-2.67% and 14.33%-21.26%, respectively. Additionally, RMSE was reduced by 0.81%-1.48%, 0.33%-1.55% and 1.10%-1.65%, respectively, while NRMSE was reduced by 0.83%-1.51%, 0.37%-1.54% and 1.08%-1.66%, respectively.
Compared with the single ML models exhibiting the best performance in the optimal combination of multi-source data fusion (RGB+MS+Texture+TIR), the prediction accuracy of the three ensemble learning methods was also superior, surpassing each single model by 1.23%, 1.07% and 11.01%, respectively. Additionally, the RMSE was reduced by 1.19%, 1.03% and 1.97%, respectively, while NRMSE decreased by 1.20%, 1.04% and 1.68%, respectively. The ensemble learning model consistently achieved higher estimation accuracy in average R2, RMSE and NRMSE compared to all the base models, which confirmed the effectiveness of the ensemble learning model. In addition, it can be seen from Figure 6 that the R2 of the simple average ensemble model was significantly higher than the stacking ensemble and the feature-weighted ensemble model, surpassing them by 1.121 and 1.157, respectively. Moreover, both RMSE and NRMSE were lower in the simple average ensemble model compared to the other two ensemble models. Therefore, it can be inferred that the simple average ensemble model was more accurate for wheat yield prediction.
By comparing the correlation and linear fit between the estimated yield and measured yield of different integration methods under the optimal combination of RGB+MS+Texture+TIR (Figure 7); it was observed that the prediction result of the simple average ensemble method exhibited a closer correspondence with the actual tested yield. This observation confirms that the simple average ensemble method was the most accurate for wheat yield prediction
4. Discussion
4.1. Estimation of Wheat Yield from Single Sensor Data and Multi-Sensor Fusion Data
In this study, through the analysis of the single sensor prediction results, it was found that the wheat yield prediction accuracy ranked as follows: Texture > MS > RGB > TIR. Among them, texture features exhibited superior performance in wheat yield prediction accuracy, with R² values ranging from 0.539 to 0.593. This has been consistently demonstrated in studies across various sites and crops. The utilization of PCA in maize yield prediction effectively reduced the standard deviation of the prediction performance, thereby enhancing the accuracy of yield forecasts (Croci et al., 2013).
In Vietnam, the rice yield prediction model utilizing PCA-ML exhibited an average improvement of 18.5-45.0% compared to using ML alone. This outcome fully underscores the reliability and effectiveness of the combined model (Pham et al., 2022). This indicates that the method combining PCA and ML effectively handles redundant data in multi-channel texture features, consequently leading to a significant enhancement in the accuracy of yield prediction.
The wheat yield prediction results from MS data were superior to those from RGB data, primarily due to its capability to capture spectral information across multiple bands from visible light to near infrared. Particularly, the near-infrared band provides the opportunity to accurately calculate Vis such as NDVI, which in turn can be utilized to better assess wheat yield. Furthermore, the stability of MS cameras across varying lighting conditions minimizes the influence of environmental fluctuations on prediction accuracy, ensuring the provision of reliable data for yield estimation (Soria et al., 2017; Cao et al., 2021). The performance of TIR information extracted by TIR sensors was not satisfactory, with R² values ranging from 0.434 to 0.490. This finding aligns with the results reported by Luz and Elarab (Luz et al., 2010; Elarab et al., 2015). The possible explanation for this could be that canopy heat information is intricately linked to factors such as leaf water content, pigment concentration and canopy structural characteristics. If these factors are not appropriately controlled or corrected for during data processing, they can significantly impact the accuracy of yield predictions (Beatriz et al., 2007; Maimaitijiang et al., 2020).
Multi-sensor fusion (RGB+MS+Texture+TIR) demonstrated clear advantages over single sensor prediction. By harnessing the capabilities of multiple sensors and integrating data from different sources, it provided a more comprehensive overview of crop growth information, thereby enhancing forecast accuracy (Fei et al., 2022).
However, it also poses challenges in terms of data processing and algorithm optimization. Future research efforts should focus on streamlining the fusion process and enhancing algorithm efficiency to achieve more reliable wheat yield prediction.
4.2. Application of Basic Model in Wheat Yield Estimation
Five basic models were employed for wheat yield forecasting. XGboost, as a novel ML algorithm, has demonstrated superior predictive capabilities compared to other models, such as RF (Bolón-Canedo et al., 2019). RF has been favored by many researchers due to its capability of removing redundant information from spectral data and achieving higher inversion accuracy through a smaller set of spectral characteristic variables (Bolón-Canedo et al., 2019; Huang et al., 2022). Indeed, the XGboost model exhibited exceptional performance in the wheat yield prediction task. This was primarily attributed to its innovative algorithm design and optimization strategy, which effectively minimized overfitting and reduced computational demands. Consequently, the model's generalization ability was significantly enhanced, leading to more accurate predictions (Nagaraju, 2021). This research result has been corroborated by Li et al., who confirmed that the XGboost model outperforms other models in soybean yield prediction when utilizing the same input data (Li et al., 2023). Furthermore, in the prediction of winter wheat yield, the XGboost model not only marginally exceeded the RF model in terms of prediction accuracy but also demonstrated significant superiority in computational efficiency in most scenarios. Notably, it requires less time, making it a more efficient and practical choice for yield prediction (Joshi et al., 2023). These results underscore the advantages of XGboost in processing large-scale agricultural data, particularly in situations where swift and efficient output predictions are imperative. The model's superior performance in terms of both accuracy and computational efficiency demonstrates its potential as a valuable tool for agricultural yield forecasting.
The PLS model exhibited the poorest performance in wheat yield prediction, both in single-sensor and multi-sensor data fusion scenarios. Although PLS is capable of addressing the issue of multicollinearity among independent variables, as the number of potential variables increases, the training model tends to overfit. This overfitting phenomenon adversely impacts the model's performance on new test data, limiting its accuracy and reliability for yield prediction tasks (Aguate et al., 2017; Zeng et al., 2018).
4.3. Performance of Ensemble Learning in Wheat Yield Prediction
Despite the recent significant advancements in ML methods and their successful applications across various fields, the pure data-driven approach in utilizing ML technology still poses some fundamental limitations. The accuracy and uncertainty of predictions generated by ML algorithms heavily depend on several factors. These include the quality of the data, the representativeness of the chosen model, and the dependencies between the input and target variables within the collected dataset (Wei et al., 2015). Data that contains high levels of noise, erroneous information, outliers, biases, and incompleteness can significantly diminish the predictive capabilities of a machine learning model (Chlingaryan et al., 2018). For this reason, this study incorporates three ensemble methods: stacking, feature-weighted and simple average ensemble. In comparison to a single model, the ensemble model demonstrates higher precision. This finding aligns with the outcomes of previous research (Fei et al., 2022; Ji et al., 2023). The R² values of the stacking ensemble method, which served as the second layer, were closely comparable to those of the feature-weighted ensemble learning approach. The primary advantage of the stacking ensemble method lies in its ability to learn and capitalize on the complementarities among diverse base learners, thereby enhancing the accuracy of predictions (Li et al., 2021). However, since the performance of each primary learner varies, the presence of large output errors in some primary learners can introduce significant error features into the training process of the meta-learner. This, in turn, can negatively impact the prediction accuracy of the entire model (Pavlyshenko et al., 2018). Another feature-weighted ensemble learning method involves correcting the prediction error of each primary learner. By doing so, it addresses the issue of poor prediction performance of individual models to some extent, generating a dataset that is more conducive to learner training (Wei et al., 2015). Therefore, when there is variation in the correlation among features within the data, it is a prudent choice to select ensemble methods tailored to the specific characteristics of the dataset (Anh et al., 2017). In summary, the prediction accuracy of both stacking and feature-weighted methods was comparable, likely due to the unique advantages each approach offers. Notably, the novel layer 3 simple average ensemble method exhibited the highest R² value. This superior performance may be attributed to its ability to effectively integrate prediction results from diverse methods, mitigating potential issues such as model disparities, variations in sample distribution, and inaccuracies in feature weights, ultimately leading to enhanced prediction accuracy.
5. Conclusions
This study delved into the capabilities of UAV multi-sensor data fusion and machine learning algorithms for wheat yield prediction. Three ensemble learning methods of stacking, feature-weighted and simple average were proposed to improve the performance of the prediction model. The results demonstrated that these ensemble learning methods enhanced the accuracy of wheat yield prediction. By synthesizing the strengths of different learners, ensemble learning methods effectively mitigated the potential risk of overfitting associated with individual models, thereby bolstering the model's generalization ability. The introduction of the simple average as the third layer ensemble learning represented a novel concept in wheat yield estimation. This method not only evaluated and improved the model's forecasting performance in a more robust and comprehensive manner, but also enhanced its adaptability and flexibility to data variations while maintaining high predictive accuracy. Therefore, it is anticipated that these ensemble learning methods will find widespread application in assessing the yield of diverse crops, serving as a scientific foundation and providing crucial management decision support for the advancement of precision agriculture.
Funding
This work was funded by the National Science and Technology Major Program(2022ZD015703), the National Natural Science Foundation of China (32372196), and the Beijing Joint Research Program for Germplasm Innovation and New Variety Breeding (G20220628002).
References
- Author 1, A.B.; Author 2, C.D. Title of the article. Abbreviated Journal Name Year, Volume, page range.
- Abdi, H., & Williams, L. J. (2010). Principal component analysis. Wiley interdisciplinary reviews: Computational statistics, 2(4), 433-459.
- Aguate, F. M., Trachsel, S., Pérez, L. G., Burgueño, J., Crossa, J., Balzarini, M., & de los Campos, G. (2017). Use of hyperspectral image data outperforms vegetation indices in prediction of maize yield. Crop Science, 57(5), 2517-2524. [CrossRef]
- Anh, V.P., Minh, L.N., Lam, T.B. (2017). Feature weighting and svm parameters optimization based on genetic algorithms for classification problems. Applied Intelligence, 46, 455-469.
- Ahmed, A.A.M., Sharma, E., Jui, S.J.J., Deo, R.C., Nguyen-Huy, T., & Ali, M. (2022). Kernel ridge regression hybrid method for wheat yield prediction with satellite-derived predictors. Remote Sensing, 14(5), 1136. [CrossRef]
- Beatriz, R. D. L., & Crowley, J. K. (2007). Spectral reflectance and emissivity features of broad leaf plants: Prospects for remote sensing in the thermal infrared (8.0-14.0 μm). Remote Sensing of Environment, 109, 393-405.
- Basso, B., Cammarano, D., & Vita, P. D. (2004). Remotely sensed vegetation indices: Theory and applications for crop management. Journal of Agrometeorology, 1, 36–53.
- Boulesteix, A.L., Janitza, S., Kruppa, J., König, I.R. (2012). Overview of Random Forest Methodology and Practical Guidance with Emphasis on Computational Biology and Bioinformatics. Wiley Interdisciplinary Reviews: Data Mining and Knowledge Discovery, 2, 493–507. [CrossRef]
- Bolón-Canedo, V., & Alonso-Betanzos, A. (2019). Ensembles for feature selection: A review and future trends. Information fusion, 52, 1-12. [CrossRef]
- Bian, C., Shi, H., Wu, S., Zhang, K., Wei, M., & Zhao, Y.; et al. (2022). Prediction of Field-Scale Wheat Yield Using Machine Learning Method and Multi-Spectral UAV Data. Remote Sensing,14, 1474. [CrossRef]
- Chlingaryan, S. W. B. (2018). Machine learning approaches for crop yield prediction and nitrogen status estimation in precision agriculture: A review. Computers and Electronics in Agriculture, 151,61-69.
- Chen, J. M. (1996). Evaluation of vegetation indices and a modified simple ratio for boreal applications. Canadian Journal of Remote Sensing, 22(3), 229-242. [CrossRef]
- Cao, X., Liu, Y., Yu, R., Han, D., & Su, B. (2021). A comparison of UAV RGB and multispectral imaging in phenotying for stay green of wheat population. Remote Sensing, 13(24), 5173.
- Croci, M., Impollonia, G., Meroni, M., & Amaducci, S. (2022). Dynamic maize yield predictions using machine learning on multi-source data. Remote sensing, 15(1), 100. [CrossRef]
- Cedric, L. S., Adoni, W. Y. H., Aworka, R., Zoueu, J. T., Mutombo, F. K., Krichen, M., & Kimpolo, C. L. M. (2022). Crops yield prediction based on machine learning models: Case of West African countries. Smart Agricultural Technology, 2, 100049. [CrossRef]
- Daszykowski, M., Kaczmarek, K., Heyden, Y.V., & Walczak, B. (2007). Robust statistics in data analysis–a review: Basic concepts. Chemometrics & Intelligent Laboratory Systems, 85(2), 203-219. [CrossRef]
- De Grandi, G.D., Lucas, R.M., & Kropacek, J. (2009). Analysis by wavelet frames of spatial statistics in sar data for characterizing structural properties of forests. IEEE Transactions on Geoscience & Remote Sensing, 47(2), 494-507. [CrossRef]
- Dong, S., & Luo, T. (2013). Bearing degradation process prediction based on the PCA and optimized LS-SVM model. Measurement, 46(9):3143-3152. [CrossRef]
- Dong, X., Zhiwen, Y.U., Cao, W., Shi, Y., & Qianli, M.A. (2019). A survey on ensemble learning. Frontiers of Computer Science, 14(2). [CrossRef]
- Das, S., Christopher, J., Apan, A., Choudhury, M. R., Chapman, S., Menzies, N. W., & Dang, Y. P. (2020). UAV-thermal imaging: A robust technology to evaluate in-field crop water stress and yield variation of wheat genotypes. In 2020 IEEE India Geoscience and Remote Sensing Symposium (InGARSS), 138-141.
- Dong, X., Yu, Z., Cao, W., Shi, Y. & Ma, Q. (2020). A survey on ensemble learning. Frontiers of Computer Science, 14: 241-258. [CrossRef]
- Elarab, M., Ticlavilca, A. M., Torres-Rua, A.F., Maslova, I., & Mckee, M. (2015). Estimating chlorophyll with thermal and broadband multispectral high resolution imagery from an unmanned aerial system using relevance vector machines for precision agriculture. International Journal of Applied Earth Observation and Geoinformation, 43, 32-42. [CrossRef]
- Fei, S., Hassan, M. A., Xiao, Y., Su, X., Chen, Z., Cheng, Q.; et al. (2022). UAV-based multi-sensor data fusion and machine learning algorithm for yield prediction in wheat. Precision Agriculture, 24, 187-212. [CrossRef]
- Gitelson, A. A., & Merzlyak, M. N. (1996). Signature analysis of leaf reflectance spectra: Algorithm development for remote sensing of chlorophyll. Journal of plant physiology, 148(3-4), 494-500. [CrossRef]
- Gitelson, A. A., Kaufman, Y. J., Stark, R., & Rundquist, D. (2002). Novel algorithms for remote estimation of vegetation fraction. Remote sensing of Environment, 80(1), 76-87. [CrossRef]
- Gilabert, M. A., González-Piqueras, J., Garcıa-Haro, F. J., & Meliá, J. (2002). A generalized soil-adjusted vegetation index. Remote Sensing of environment, 82(2-3), 303-310. [CrossRef]
- Gitelson, A. A., Viña, A., Arkebauer, T. J., Rundquist, D. C., Keydan, G., & Leavitt, B. (2003). Remote estimation of leaf area index and green leaf biomass in maize canopies. Geophysical research letters, 30(5). [CrossRef]
- Guijarro, M., Pajares, G., Riomoros, I., Herrera, P. J., Burgos-Artizzu, X. P., & Ribeiro, A. (2011). Automatic segmentation of relevant textures in agricultural images. Computers and Electronics in Agriculture, 75(1), 75-83. [CrossRef]
- Humeau-Heurtier, A. (2019). Texture feature extraction methods: A survey. IEEE access, 7, 8975-9000. [CrossRef]
- Hassan, M. A., Yang, M., Rasheed, A., Yang, G., Reynolds, M., Xia, X.; et al. (2019). A rapid monitoring of NDVI across the wheat growth cycle for grain yield prediction using a multi-spectral UAV platform. Plant science, 282, 95-103. [CrossRef]
- Han, J., Zhang, Z., Cao, J., Luo, Y., Zhang, L., Li, Z., Zhang, J. (2020). Prediction of Winter Wheat Yield Based on Multi-Source Data and Machine Learning in China. Remote Sensing, 12, 236. [CrossRef]
- Huang, L., Liu, Y., Huang, W., Dong, Y., Ma, H., Wu, K., & Guo, A. (2022). Combining random forest and XGBoost methods in detecting early and mid-term winter wheat stripe rust using canopy level hyperspectral measurements. Agriculture, 12(1), 74. [CrossRef]
- Jacquemoud, S., Ustin, S.L., Verdebout, J., Schmuck, G., Andreoli, G., & Hosgood, B. (1996). Estimating leaf biochemistry using the PROSPECT leaf optical properties model. Remote Sensing of Environment, 56, 194–202. [CrossRef]
- Ji, Y., Liu, R., Xiao, Y. Cui, Y., Chen, Z., & Zong, X.; et al. (2023). Faba bean above-ground biomass and bean yield estimation based on consumer-grade unmanned aerial vehicle RGB images and ensemble learning. Precision Agriculture, 24, 1439–1460. [CrossRef]
- Joshi, A., Pradhan, B., Chakraborty, S., & Behera, M. D. (2023). Winter wheat yield prediction in the conterminous United States using solar-induced chlorophyll fluorescence data and XGBoost and random forest algorithm. Ecological Informatics, 77, 102194. [CrossRef]
- Kelly, J.D., Davis, L. (1991). A Hybrid Genetic Algorithm for Classification. IJCAI, 91, 645–650.
- Kawashima, S., & Nakatani, M. (1998). An algorithm for estimating chlorophyll content in leaves using a video camera. Annals of Botany, 81(1), 49-54. [CrossRef]
- Leo, B. (1996). Stacked regressions. Machine learning, 24, 49-64.
- Louhaichi, M., Borman, M. M., & Johnson, D. E. (2001). Spatially located platform and aerial photography for documentation of grazing impacts on wheat. Geocarto International, 16(1), 65-70. [CrossRef]
- Luz, B.R.D., & Crowley, J.K. (2010). Identification of plant species by using high spatial and spectral resolution thermal infrared (8.0–13.5μm) imagery. Remote Sensing of Environment, 114(2): 404-413.
- Li, B., Liu, R., Liu, S., Liu, Q., Liu, F., & Zhou, G. (2012). Monitoring vegetation coverage variation of winter wheat by low-altitude UAV remote sensing system. Transactions of the Chinese Society of Agricultural Engineering, 28(13), 160-165.
- Li, J., Tran, M., & Siwabessy, J. (2016). Selecting optimal random forest predictive models: A case study on predicting the spatial distribution of seabed hardness. PLoS ONE, 11. [CrossRef]
- Li, B., Xu, X., Zhang, L., Han, J., & Jin, L. (2020). Above-ground biomass estimation and yield prediction in potato by using UAV-based RGB and hyperspectral imaging. ISPRS Journal of Photogrammetry and Remote Sensing, 162, 161-172. [CrossRef]
- Liakos, K.G., Busato, P., Moshou, D., Pearson, S., Bochtis, D. (2018). Machine Learning in Agriculture: A Review. Sensors,18, 2674. [CrossRef]
- Li, C., Wang, Y., Ma, C., Chen, W., Li, Y., Li, J., & Ding, F. (2021). Improvement of wheat grain yield prediction model performance based on stacking technique. Applied Sciences, 11(24), 12164. [CrossRef]
- Li, Y., Zeng, H., Zhang, M., Wu, B., Zhao, Y., Yao, X., Cheng, T., Qin, X., & Wu., F. (2023). A county-level soybean yield prediction framework coupled with XGBoost and multidimensional feature engineering. International Journal of Applied Earth Observation and Geoinformation, 118, 103269. [CrossRef]
- Merzlyak, M. N., Gitelson, A. A., Chivkunova, O. B., & Rakitin, V. Y. (1999). Non-destructive optical detection of pigment changes during leaf senescence and fruit ripening. Physiologia plantarum, 106(1), 135-141. [CrossRef]
- Murray, H., Lucieer, A., & Williams, R. (2010). Texture-based classification of sub-antarctic vegetation communities on heard island. International Journal of Applied Earth Observation & Geoinformation, 12(3), 138-149. [CrossRef]
- Mutanga, O., Adam, E., Cho, A. M. A. (2012). High density biomass estimation for wetland vegetation using worldview-2 imagery and random forest regression algorithm. International Journal of Applied Earth Observation and Geoinformation, 18, 399–406. [CrossRef]
- Maimaitijiang, M., Ghulam, A., Sidike, P., Hartling, S., Maimaitiyiming, M., Peterson, K.; et al. (2017). Unmanned aerial system (UAS)-based phenotyping of soybean using multi-sensor data fusion and extreme learning machine. ISPRS Journal of Photogrammetry and Remote Sensing, 134, 43–58. [CrossRef]
- Maimaitijiang, M., Sagan, V., Sidike, P., Hartling, S., & Fritschi, F.B. (2020). Soybean yield prediction from UAV using multimodal data fusion and deep learning. Remote Sensing of Environment, 237, 111599. [CrossRef]
- Mongus, D., & Alik, B. (2018). Segmentation schema for enhancing land cover identification: A case study using sentinel 2 data. International Journal of Applied Earth Observation and Geoinformation, 66, 56-68.
- Nagaraju, A., & Mohandas, R. (2021). Multifactor Analysis to Predict Best Crop using Xg-Boost Algorithm. In 2021 5th International Conference on Trends in Electronics and Informatics (ICOEI), 155-163.
- Peñuelas, J., Gamon, J. A., Fredeen, A. L., Merino, J., & Field, C. B. (1994). Reflectance indices associated with physiological changes in nitrogen-and water-limited sunflower leaves. Remote sensing of Environment, 48(2), 135-146. [CrossRef]
- Peñuelas, J., Filella, I., & Gamon, J. A. (1995). Assessment of photosynthetic radiation-use efciency with spectral refectance. New Phytologist, 131, 291–296.
- Pinter Jr, P. J., Hatfield, J. L., Schepers, J. S., Barnes, E. M., Moran, M. S., Daughtry, C. S., & Upchurch, D. R. (2003). Remote sensing for crop management. Photogrammetric Engineering & Remote Sensing, 69(6), 647-664.
- Pavlyshenko, B. (2018). Using stacking approaches for machine learning models. 2018 IEEE second international conference on data stream mining & processing (DSMP), 255-258.
- Pham, H.T., Awange, J., Kuhn, M., Nguyen, B.V., & Bui, L.K. (2022). Enhancing Crop Yield Prediction Utilizing Machine Learning on Satellite-Based Vegetation Health Indices. Sensors, 22, 719. [CrossRef]
- Quinlan, J. R. (1992). Learning with continuous classes. In 5th Australian joint conference on artificial intelligence, 92, 343-348.
- Roujean, J. L., & Breon, F. M. (1995). Estimating PAR absorbed by vegetation from bidirectional reflectance measurements. Remote sensing of Environment, 51(3), 375-384. [CrossRef]
- Raymer, M. L., Punch, W. F., Goodman, E. D., Kuhn, L. A., & Jain, A. K. (2000). Dimensionality reduction using genetic algorithms. IEEE transactions on evolutionary computation, 4(2), 164-171. [CrossRef]
- Rodriguez-Galiano, V. F., Ghimire, B., Rogan, J., Chica-Olmo, M., & Rigol-Sanchez, J. P. (2012). An assessment of the effectiveness of a random forest classifier for land-cover classification. Isprs Journal of Photogrammetry & Remote Sensing, 67, 93-104. [CrossRef]
- Rischbeck, P., Elsayed, S., Mistele, B., Barmeier, G., Heil, K., & Schmidhalter, U. (2016). Data fusion of spectral, thermal and canopy height parameters for improved yield prediction of drought stressed spring barley. European Journal of Agronomy, 78, 44-59. [CrossRef]
- Ramos, A. P. M., Osco, L. P., Furuya, D.E.G., Gonalves, W.N., & Pistori, H. (2020). A random forest ranking approach to predict yield in maize with uav-based vegetation spectral indices. Computers and Electronics in Agriculture, 178, 105791. [CrossRef]
- Sellaro, R., Crepy, M., Trupkin, S. A., Karayekov, E., Buchovsky, A. S., Rossi, C., & Casal, J. J. (2010). Cryptochrome as a sensor of the blue/green ratio of natural radiation in Arabidopsis. Plant physiology, 154(1), 401-409. [CrossRef]
- Sirmacek, B., & Unsalan, C. (2011). A probabilistic approach to detect urban regions from remotely sensed images based on combination of local features. 5th International Conference on Recent Advances in Space Technologies (RAST'2011). Istanbul, Turkey.
- Sirmacek, B., & Ünsalan, C. (2011). Road detection from remotely sensed images using color features. In Proceedings of 5th International Conference on Recent Advances in Space Technologies-RAST2011, 112-115.
- Soria, X., Sappa, A.D. and Akbarinia, A. (2017). Multispectral single-sensor RGB-NIR imaging: New challenges and opportunities. In 2017 Seventh International Conference on Image Processing Theory, Tools and Applications (IPTA), 1-6.
- Sami, K., John, F., Andrew, K., Nathan, D., & Scott, S. (2018). Integration of high resolution remotely sensed data and machine learning techniques for spatial prediction of soil properties and corn yield. Computers and Electronics in Agriculture, 153, 213-225.
- Sun, C., Dong, Z., Zhao, L., Ren, Y., Zhang, N., & Chen, F. (2020). The wheat 660k SNP array demonstrates great potential for marker-assisted selection in polyploid wheat. Plant Biotechnology Journal, 18(6). [CrossRef]
- Sarijaloo, F.B., Porta, M., Taslimi, B., & Pardalos, P.M. (2021). Yield performance estimation of corn hybrids using machine learning algorithms. Aritificial Intelligence in Agriculture, 5, 82-89. [CrossRef]
- Thenkabail, P.S., Lyon, J.G., Huete, A. (2011). Hyperspectral remote sensing of vegetation and agricultural crops: Knowledge gain and knowledge gap after 40 years of research. CRC Press, 26, 663-688.
- Van der Laan, M. J., Polley, E. C., & Hubbard, A. E. (2007). Super learner. Statistical applications in genetics and molecular biology, 6(1).
- Woebbecke, D. M., Meyer, G. E., Von Bargen, K., & Mortensen, D. A. (1995). Color indices for weed identification under various soil, residue, and lighting conditions. Transactions of the ASAE, 38(1), 259-269. [CrossRef]
- Wei, P., Lu, Z., & Song, J. (2015). Variable importance analysis: A comprehensive review. Reliability Engineering & System Safety, 142, 399-432. [CrossRef]
- Xue, L., Cao, W., Luo, W., Dai, T., & Zhu, Y. (2004). Monitoring leaf nitrogen status in rice with canopy spectral reflectance. Agronomy Journal, 96(1), 135-142.
- Xu, W., Chen, P., Zhan, Y., Chen, S., Zhang, L., & Lan, Y. (2021). Cotton yield estimation model based on machine learning using time series uav remote sensing data. International Journal of Applied Earth Observation and Geoinformation, 104. [CrossRef]
- Xue, J., & Su, B. (2017). Significant remote sensing vegetation indices: A review of developments and applications. Journal of sensors, 2017, 1-17. [CrossRef]
- Zhang, S., & Liu, L. (2014). The potential of the MERIS Terrestrial Chlorophyll Index for crop yield prediction. Remote sensing letters, 5(8), 733-742. [CrossRef]
- Zhang, W., Ren, H., Jiang, Q., & Zhang, K. (2015). Exploring Feature Extraction and ELM in Malware Detection for Android Devices. International Symposium on Neural Networks. Springer, Cham, 489-498.
- Zhou, X., Zheng, H. B., Xu, X. Q., He, J. Y., Ge, X. K., & Yao, X.; et al. (2017). Predicting grain yield in rice using multi-temporal vegetation indices from uav-based multispectral and digital imagery. ISPRS Journal of Photogrammetry and Remote Sensing, 130, 246-25. [CrossRef]
- Zeng, W. Z., Xu, C., Zhao, G., Wu, J.W., & Huang, J. (2018). Estimation of sunflower seed yield using partial least squares regression and artificial neural network models. Pedosphere, 28(5), 764-774. [CrossRef]
Figure 1.
Processing of UAV-based data.
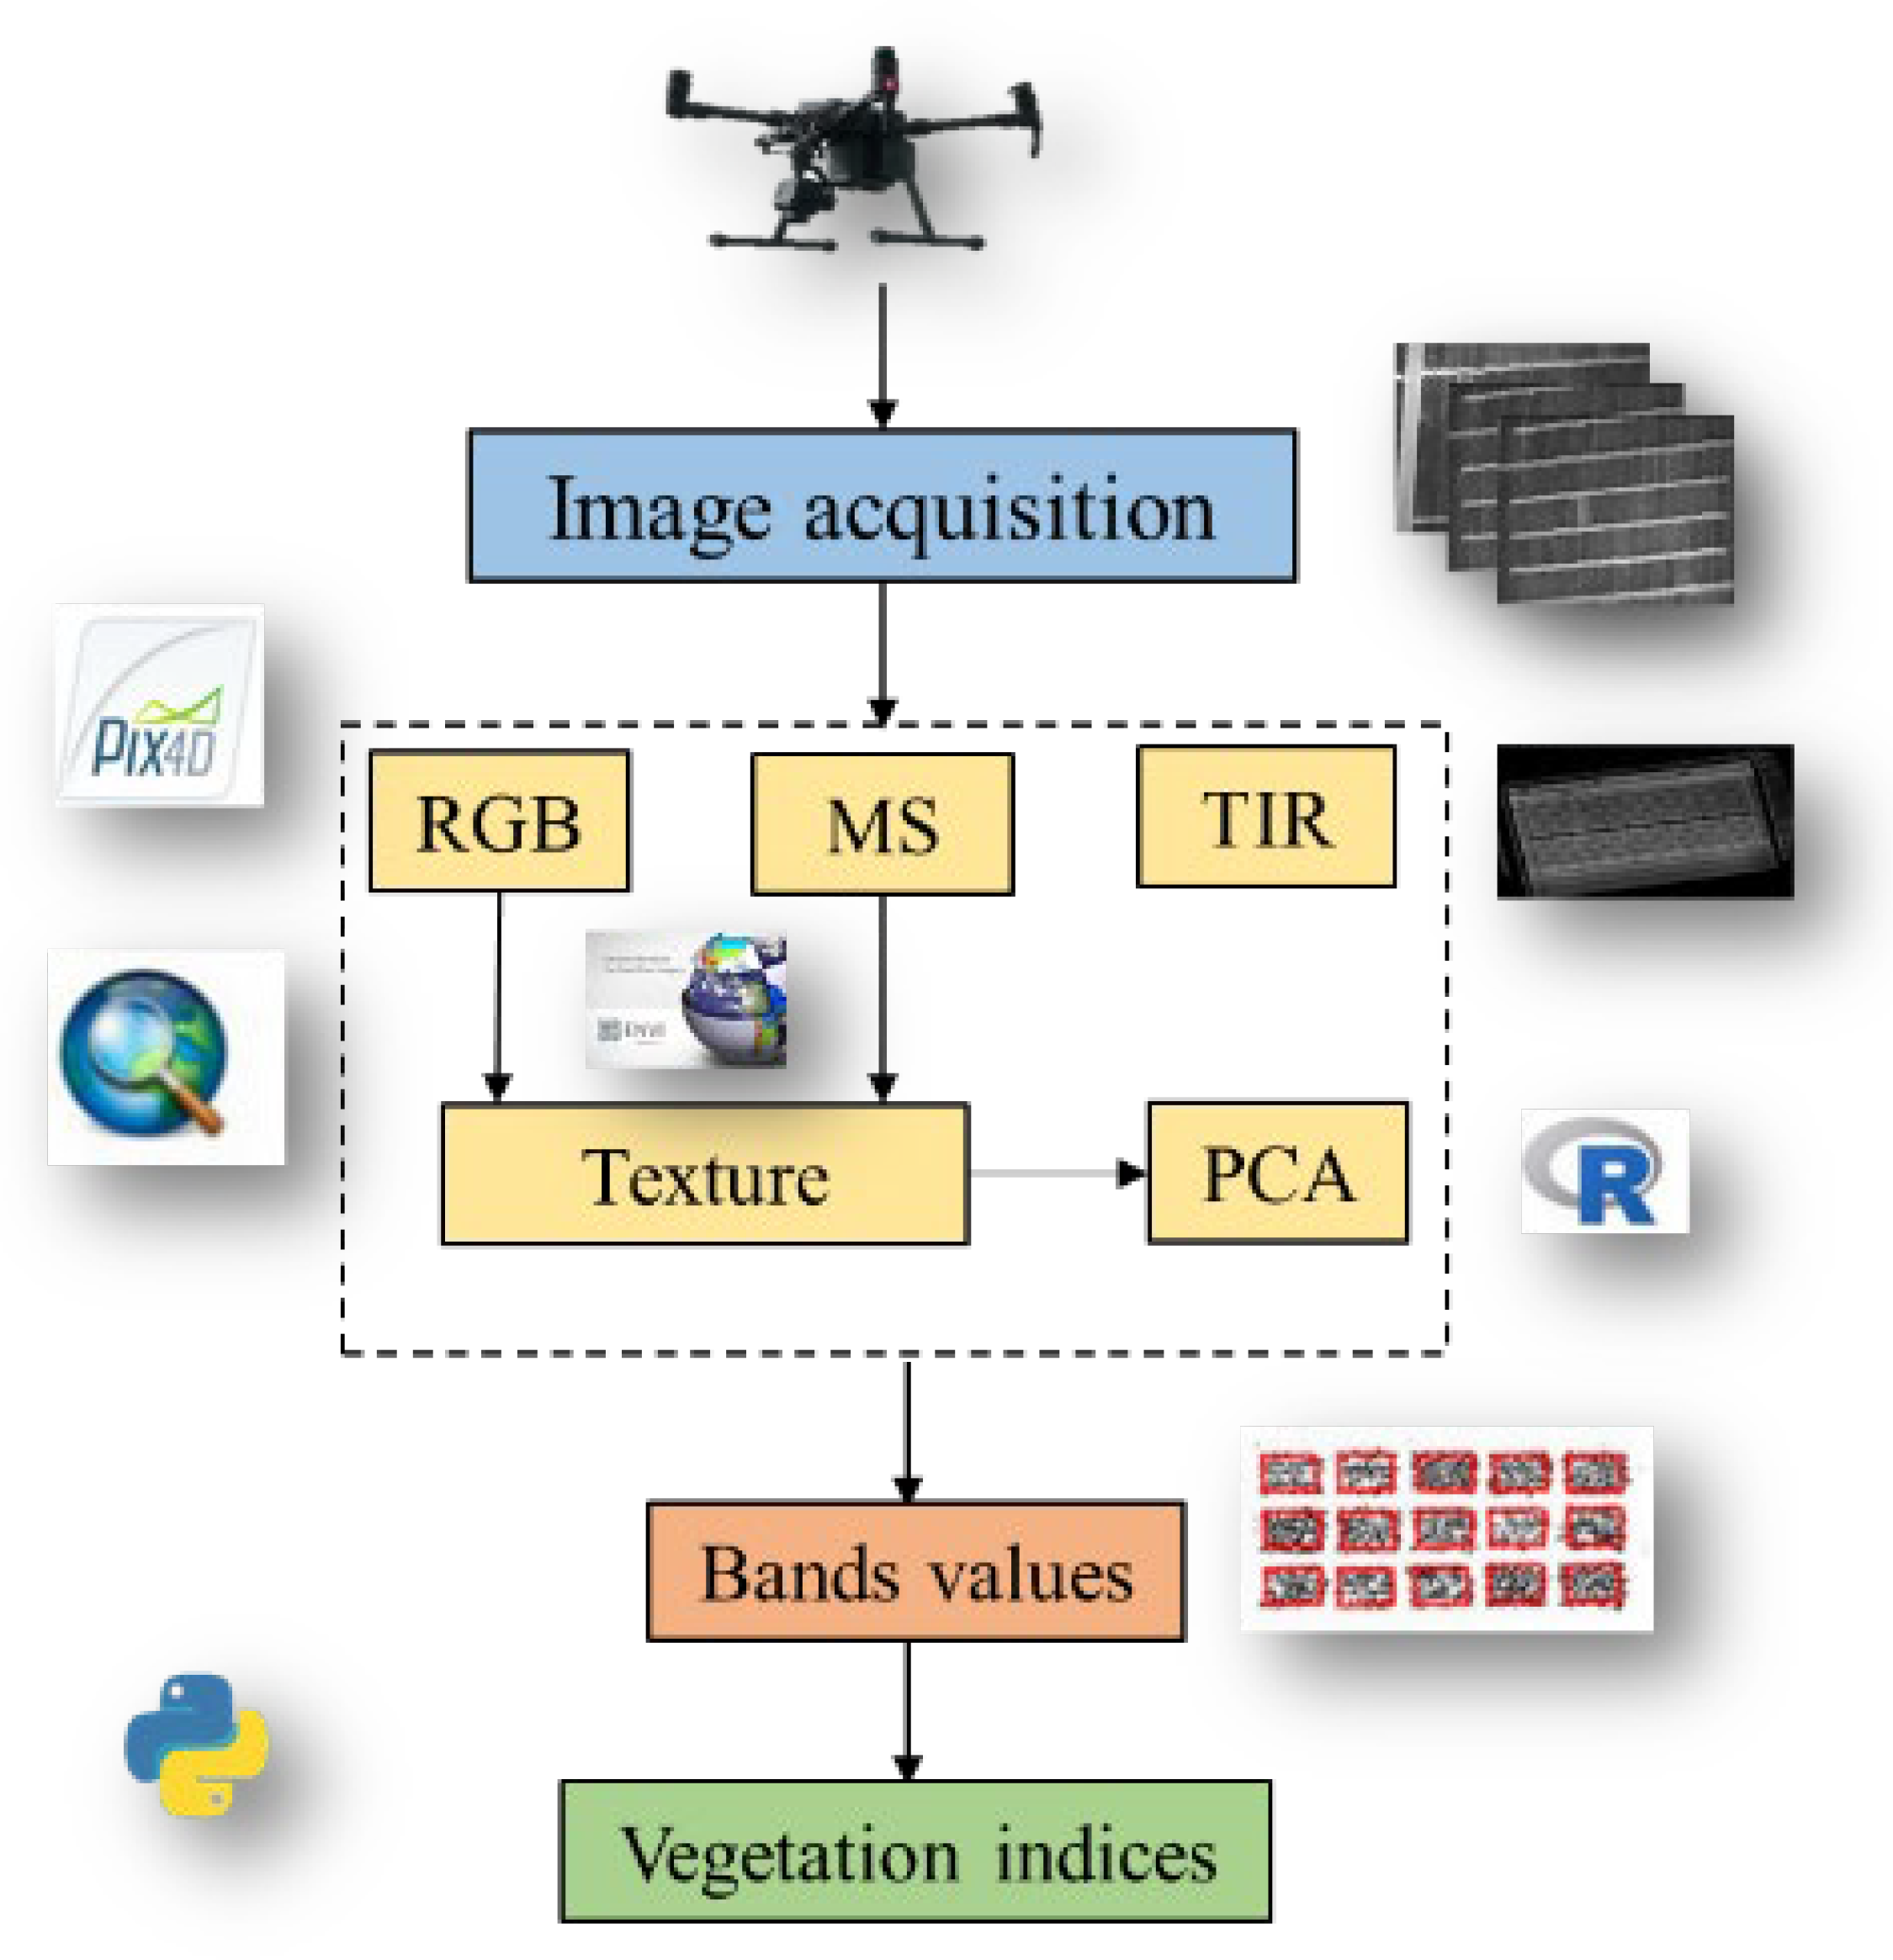
Figure 2.
Modeling construction and assessment.
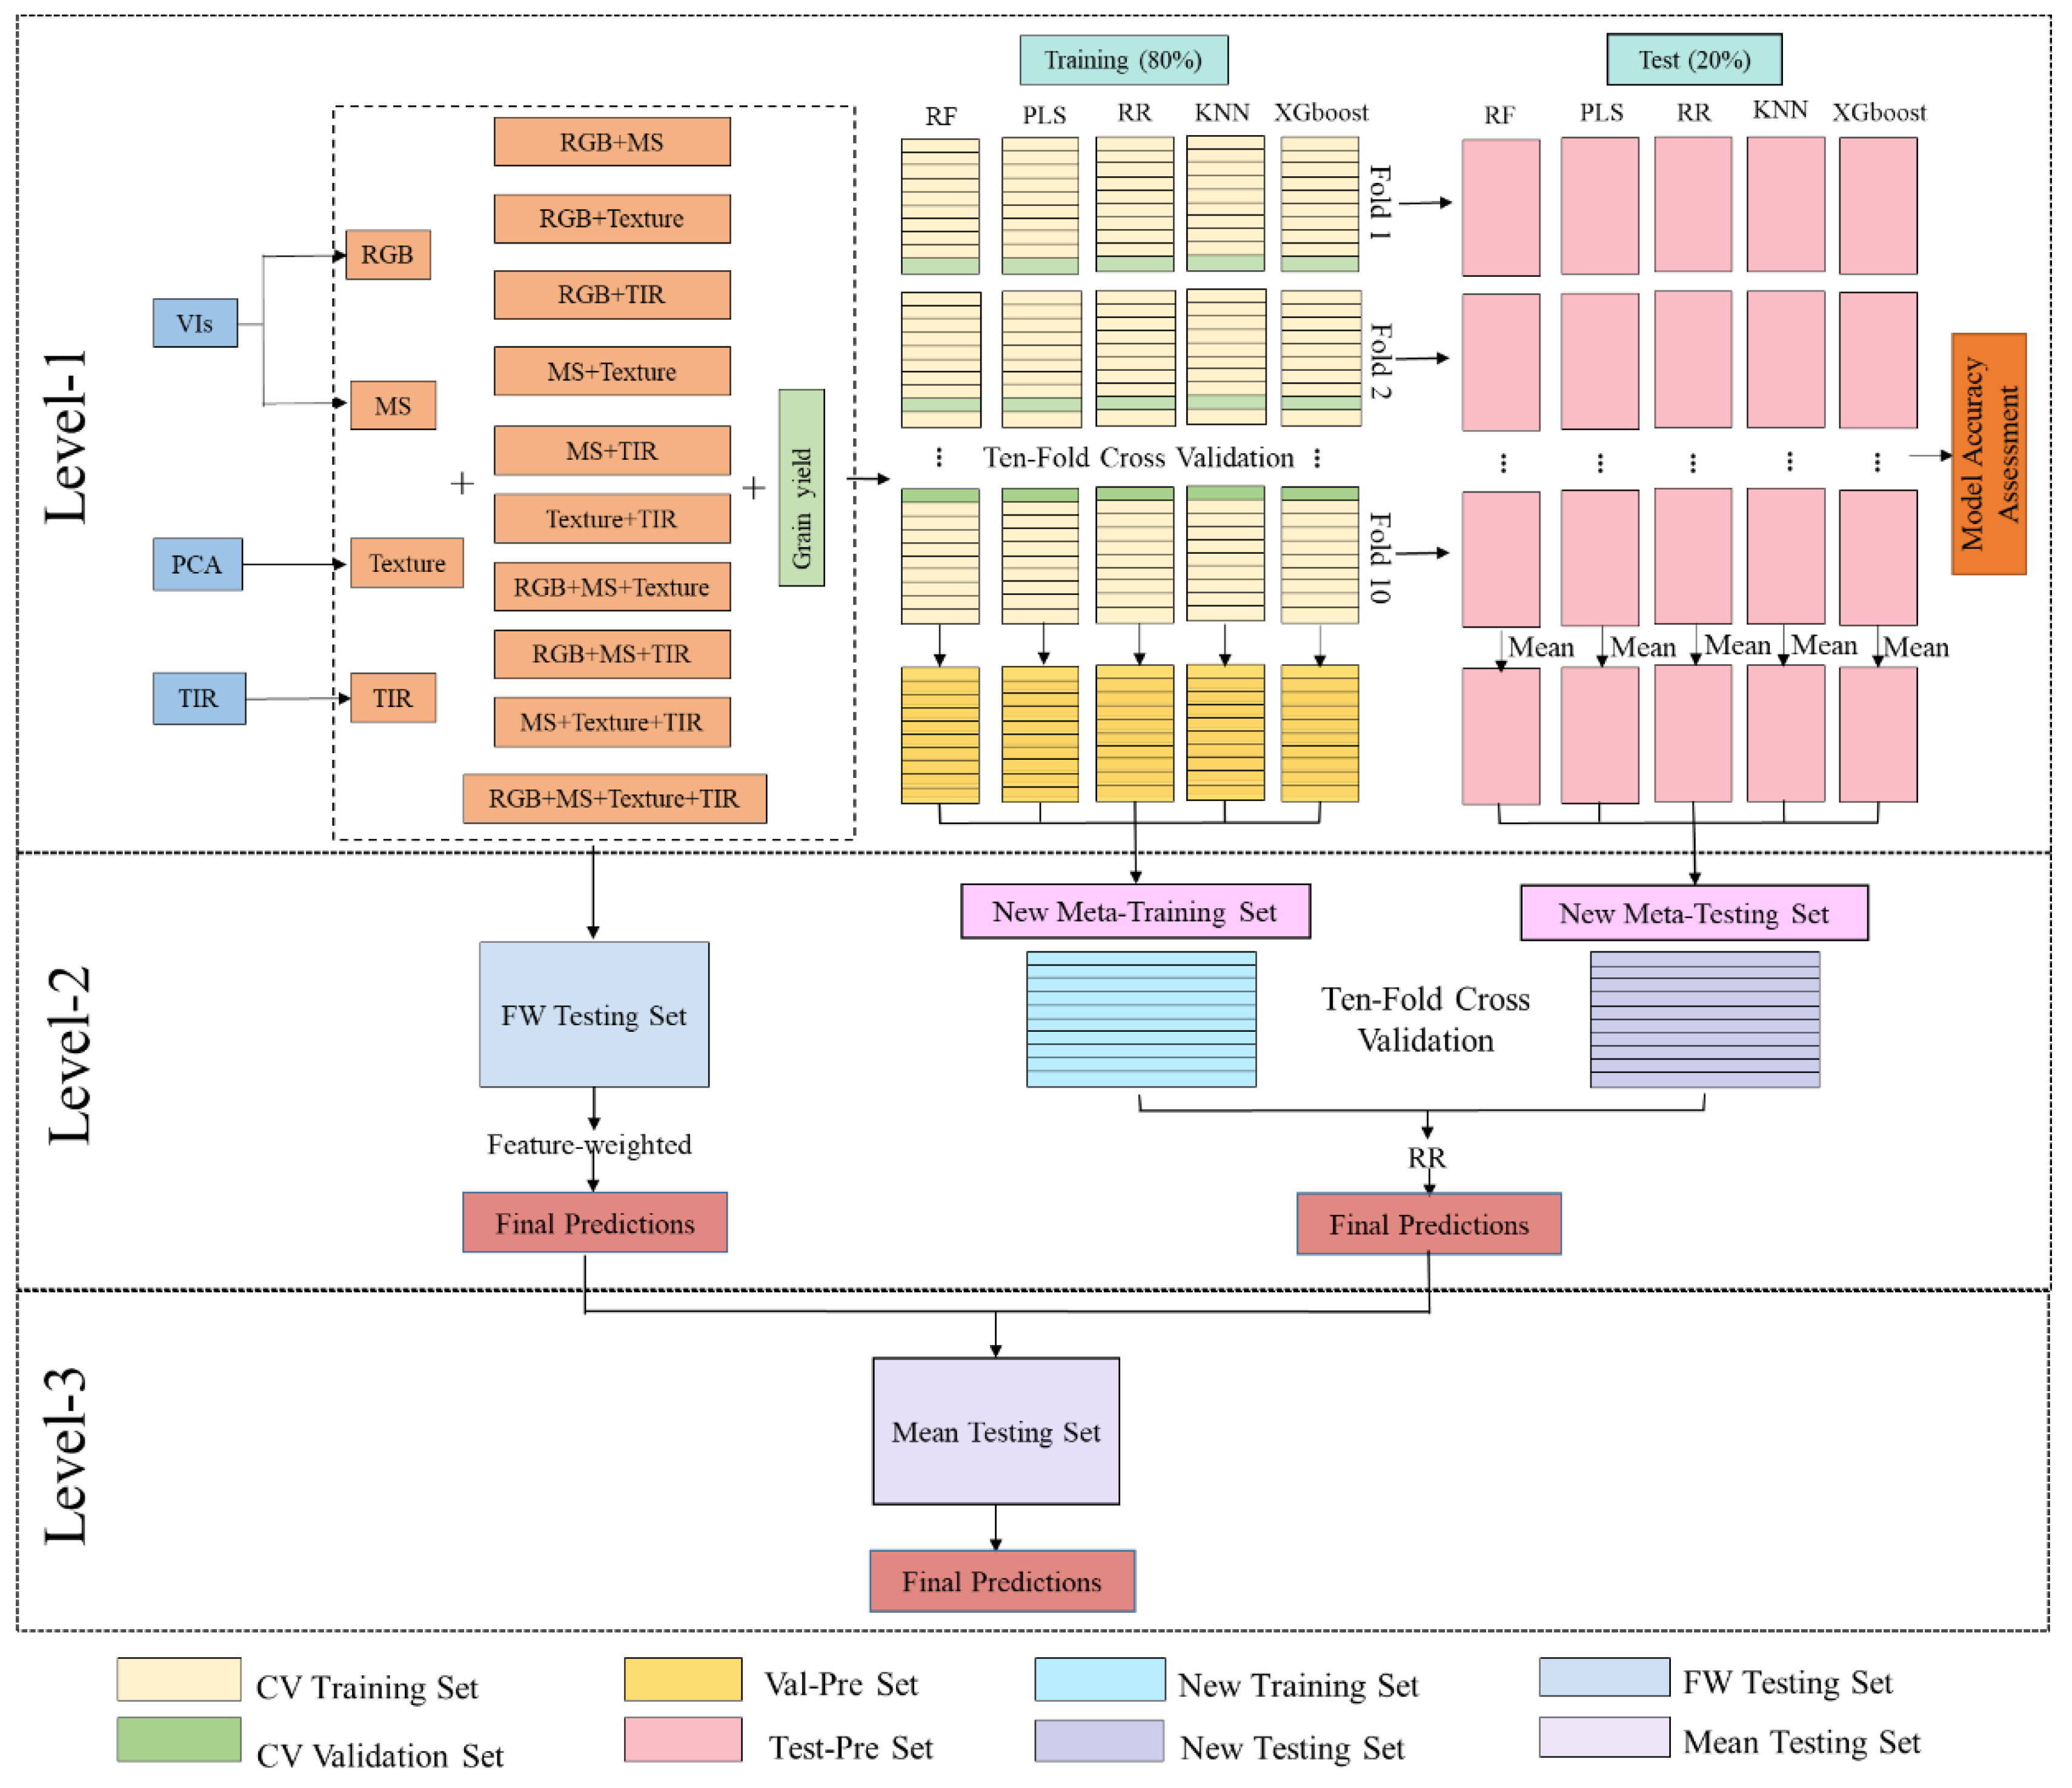
Figure 3.
Principal component analysis loading plots for different texture features.
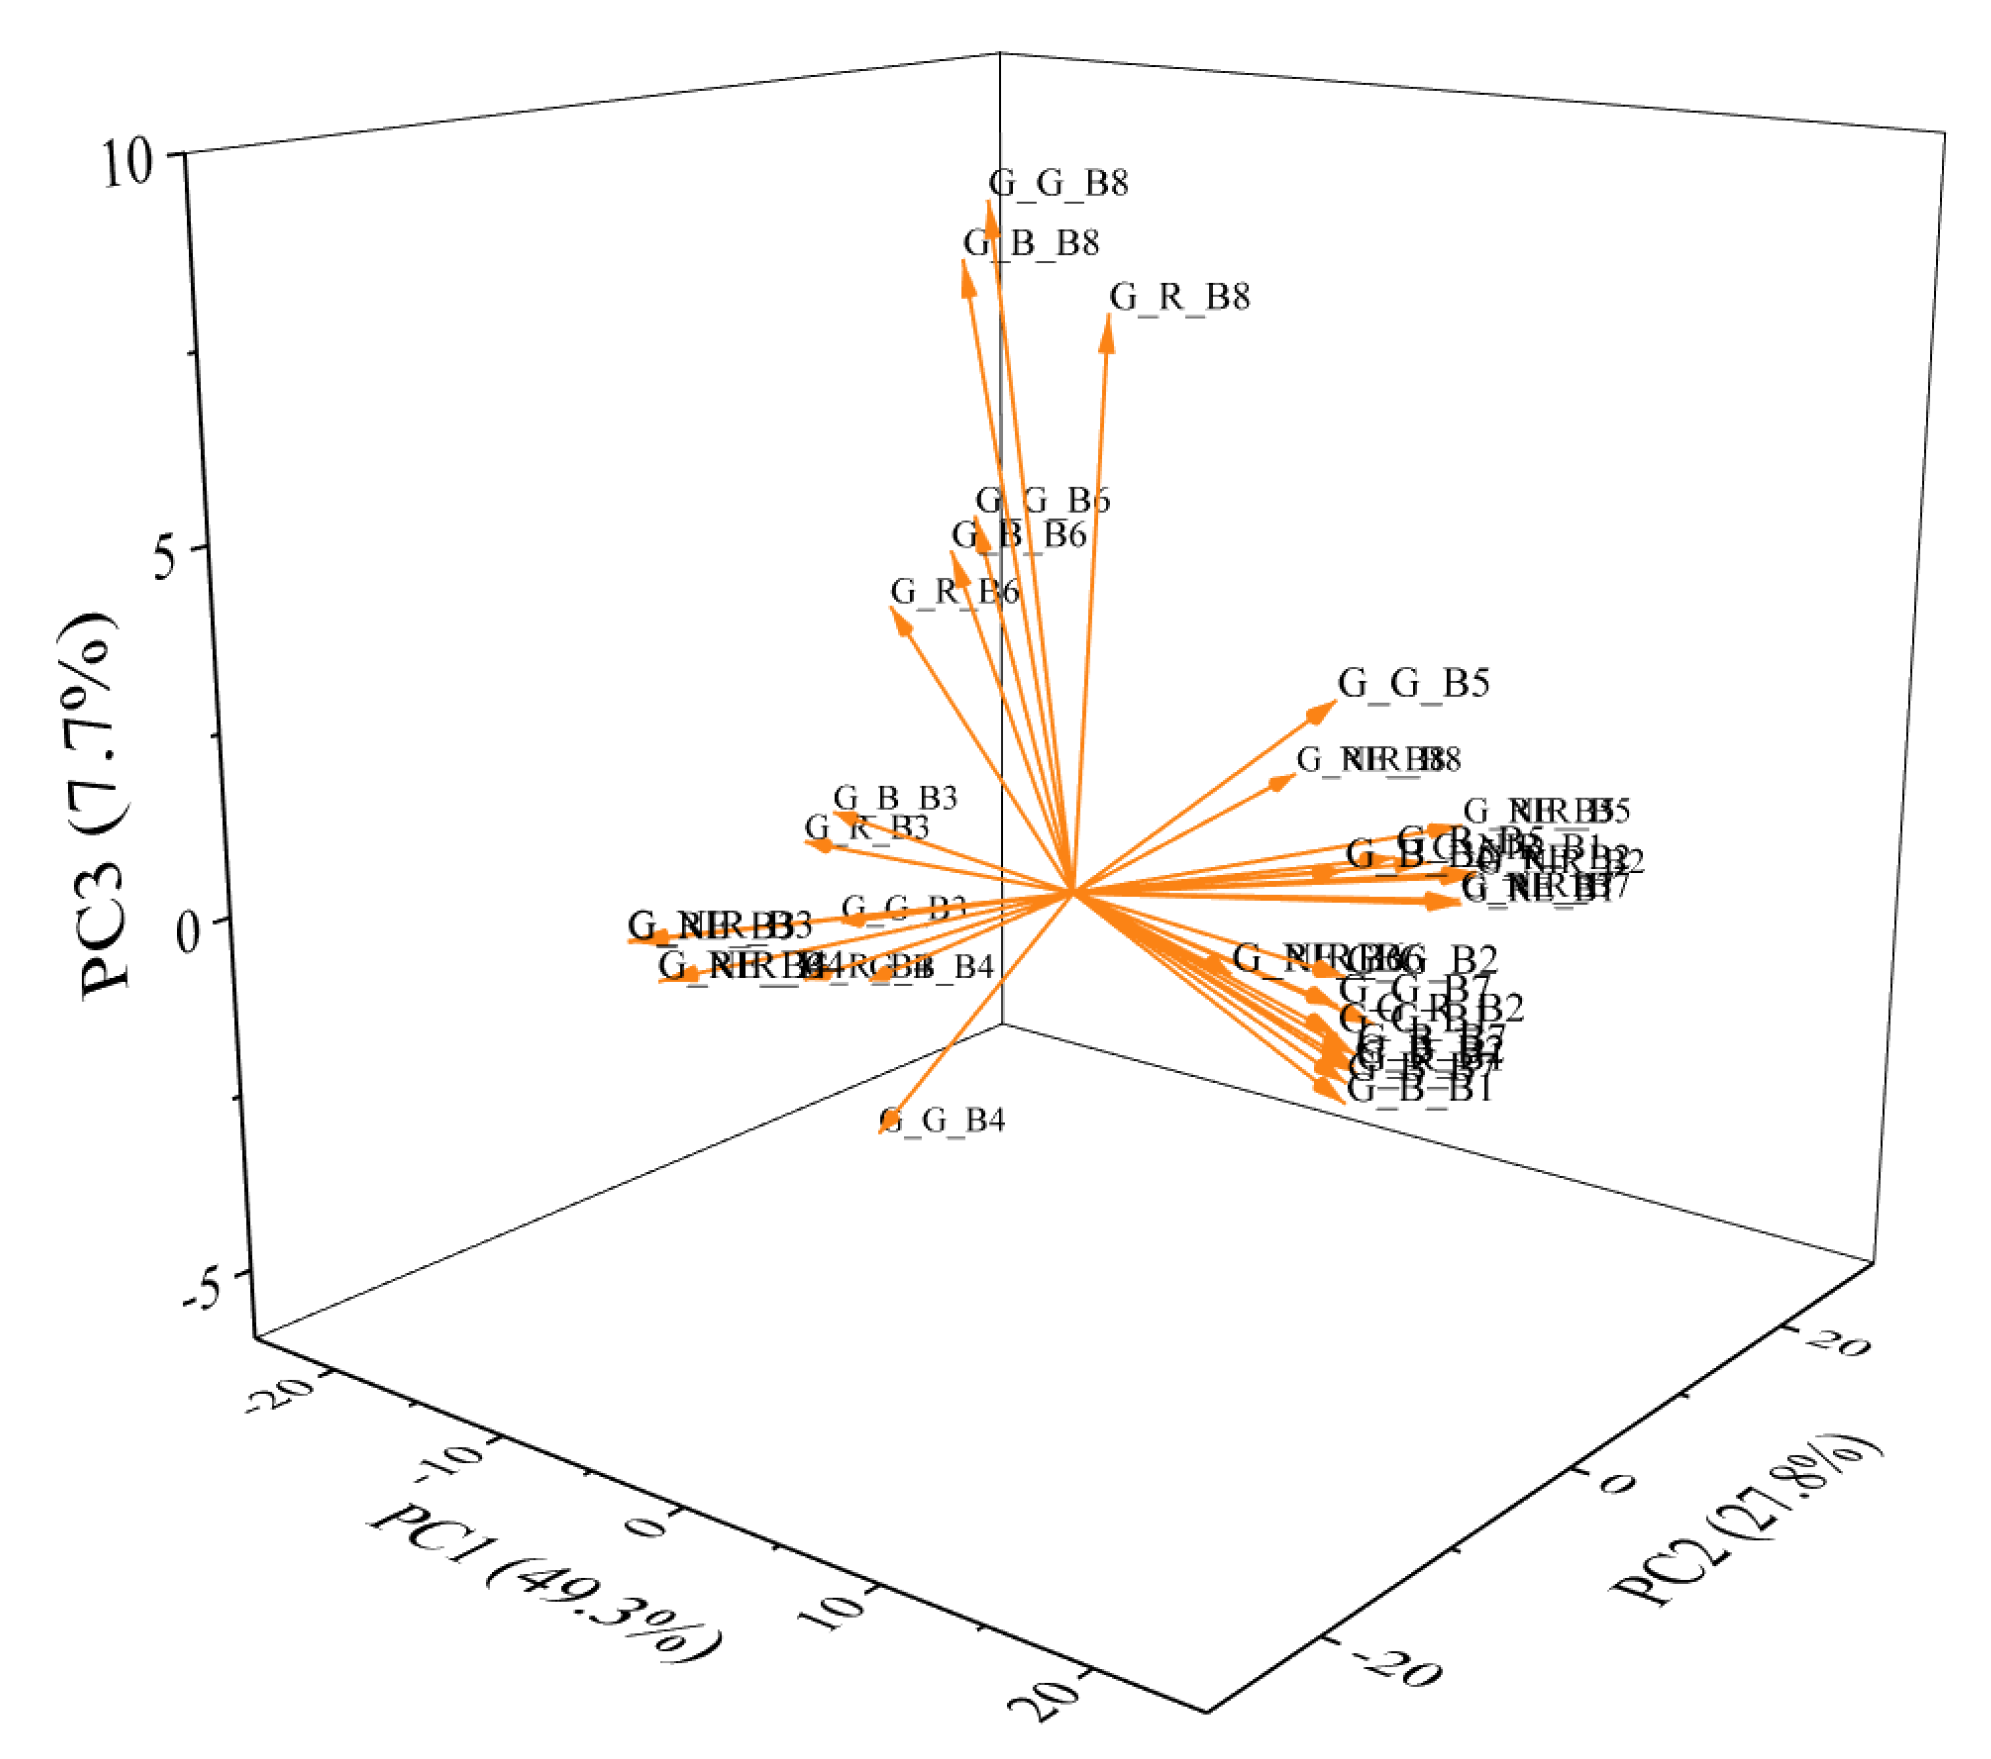
Figure 4.
Pearson’s correlation coefficient (r) between CI, VI, Texture features, TIR and wheat yield. (a) CIs; (b) VIs; (c) Texture features and TIR.
Figure 4.
Pearson’s correlation coefficient (r) between CI, VI, Texture features, TIR and wheat yield. (a) CIs; (b) VIs; (c) Texture features and TIR.
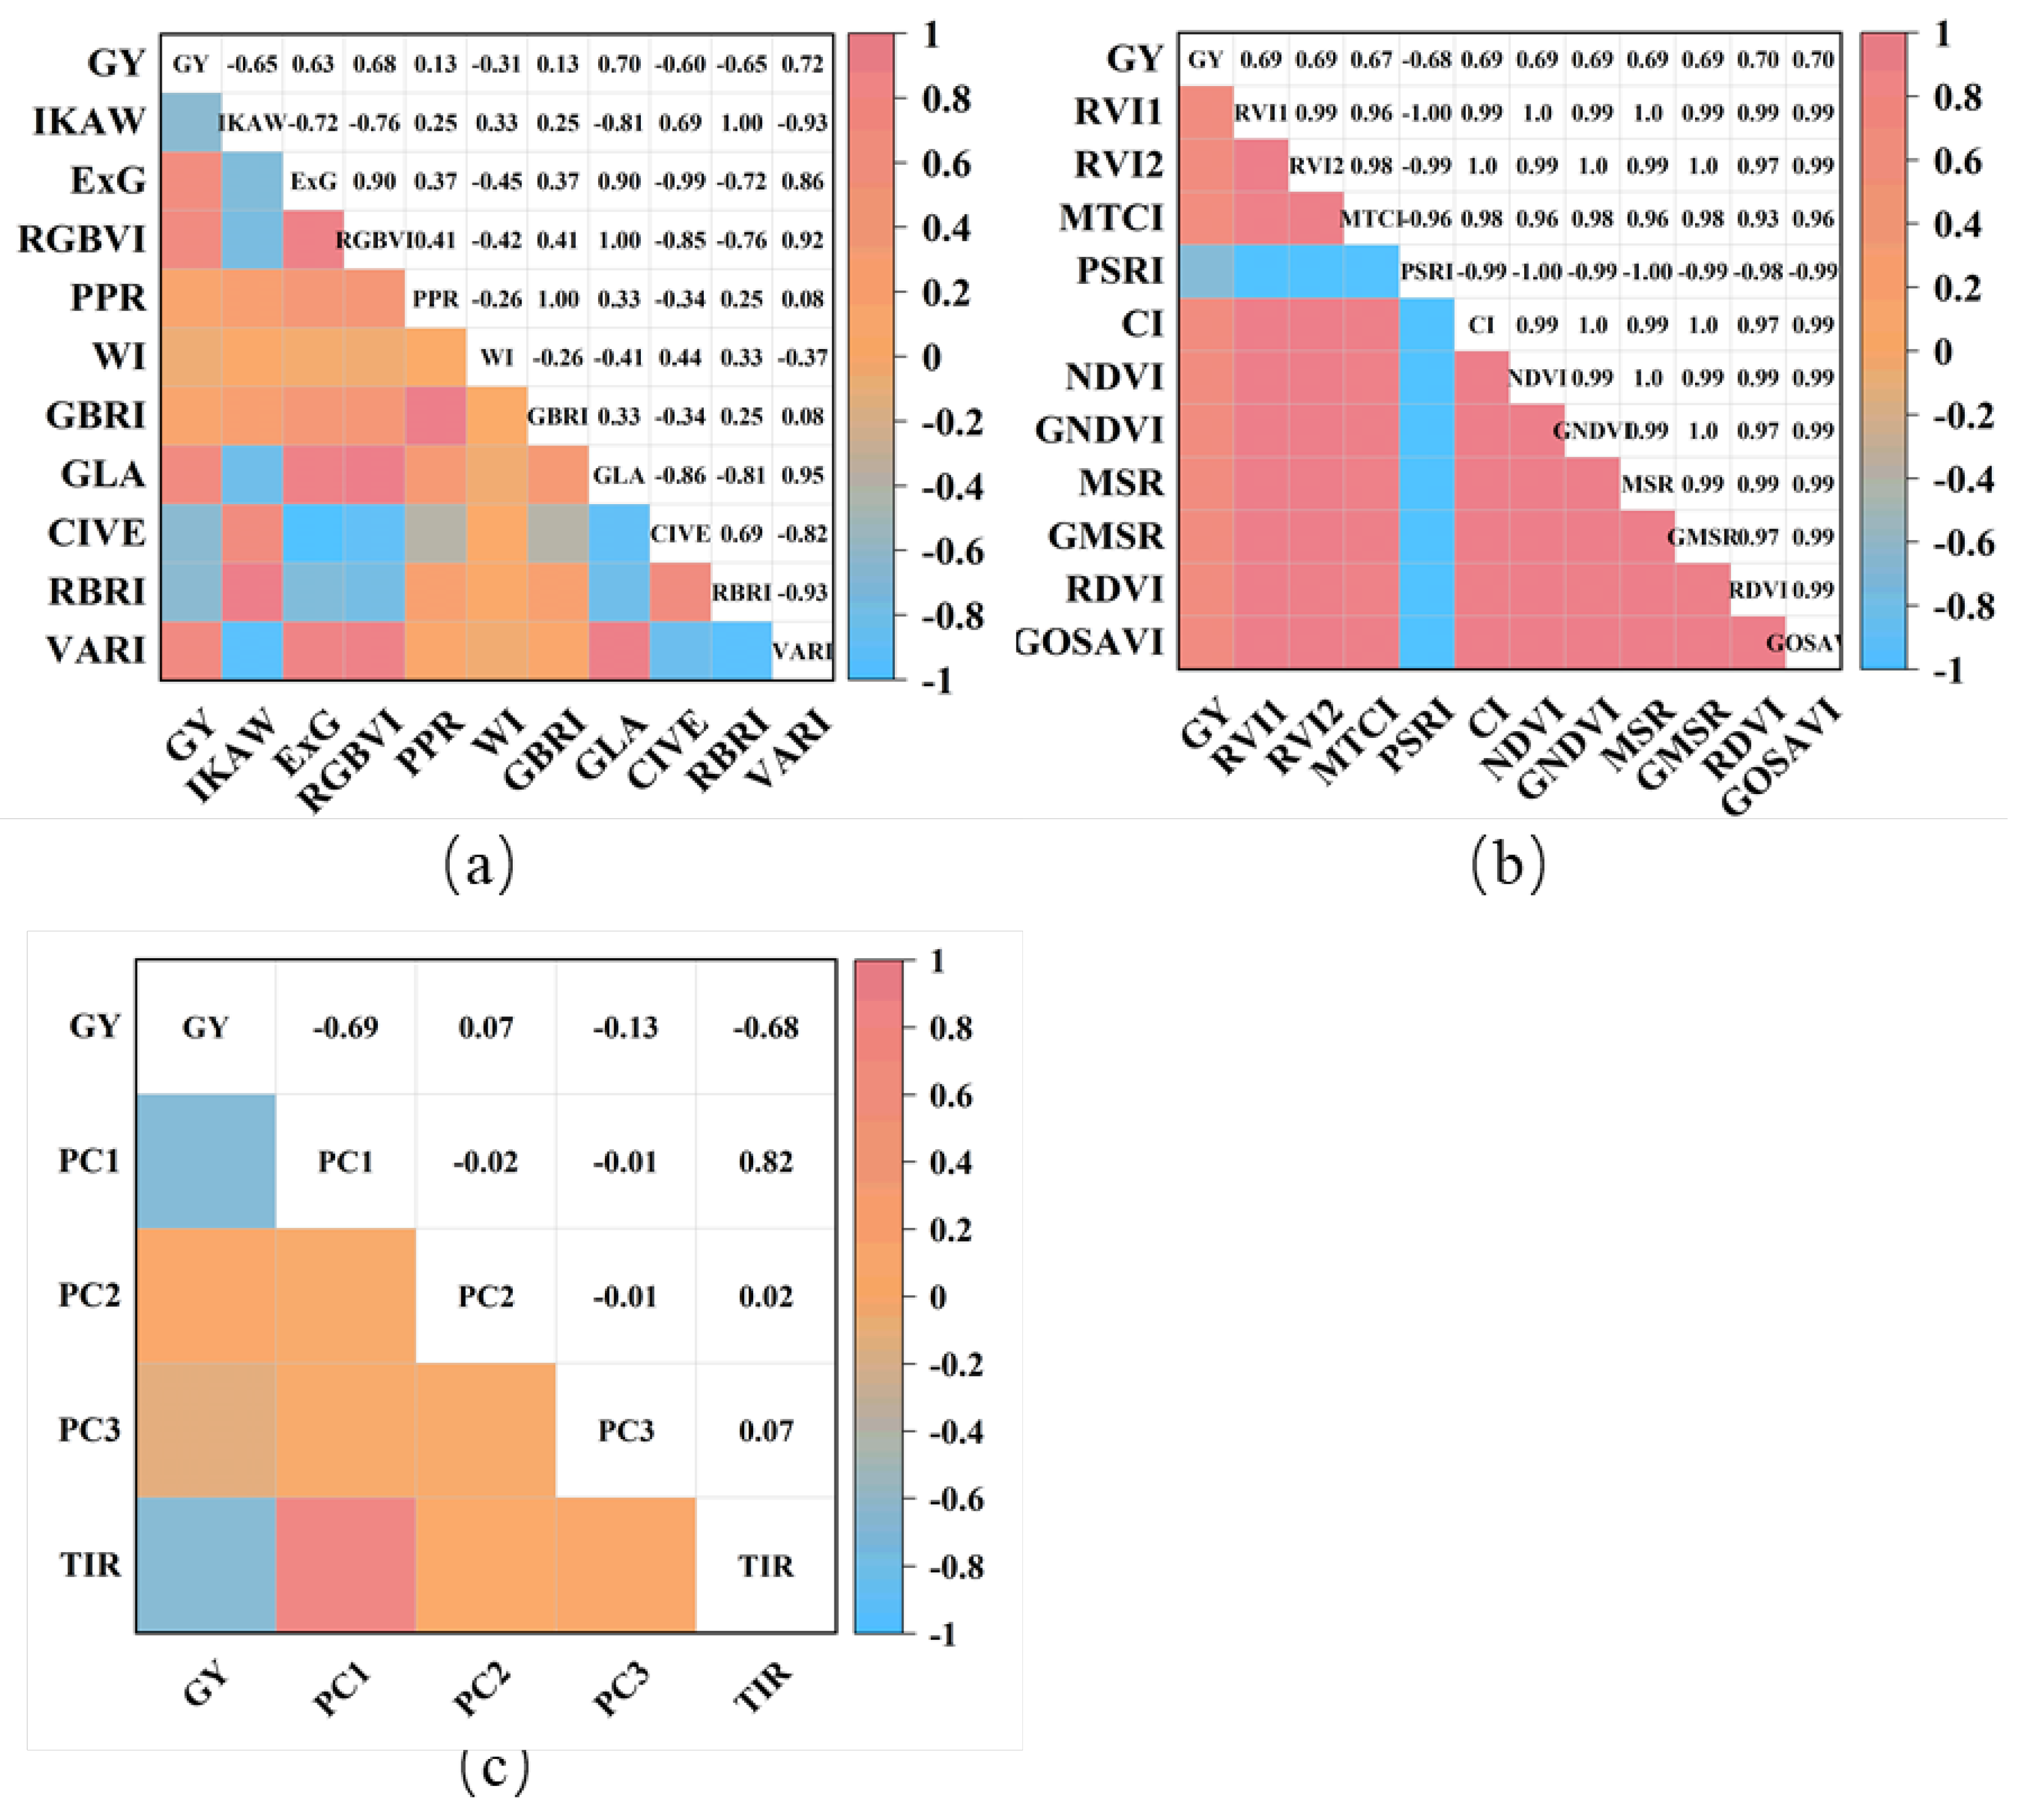
Figure 5.
Comparison of the estimation accuracies of models for different sensors and their combinations.
Figure 5.
Comparison of the estimation accuracies of models for different sensors and their combinations.
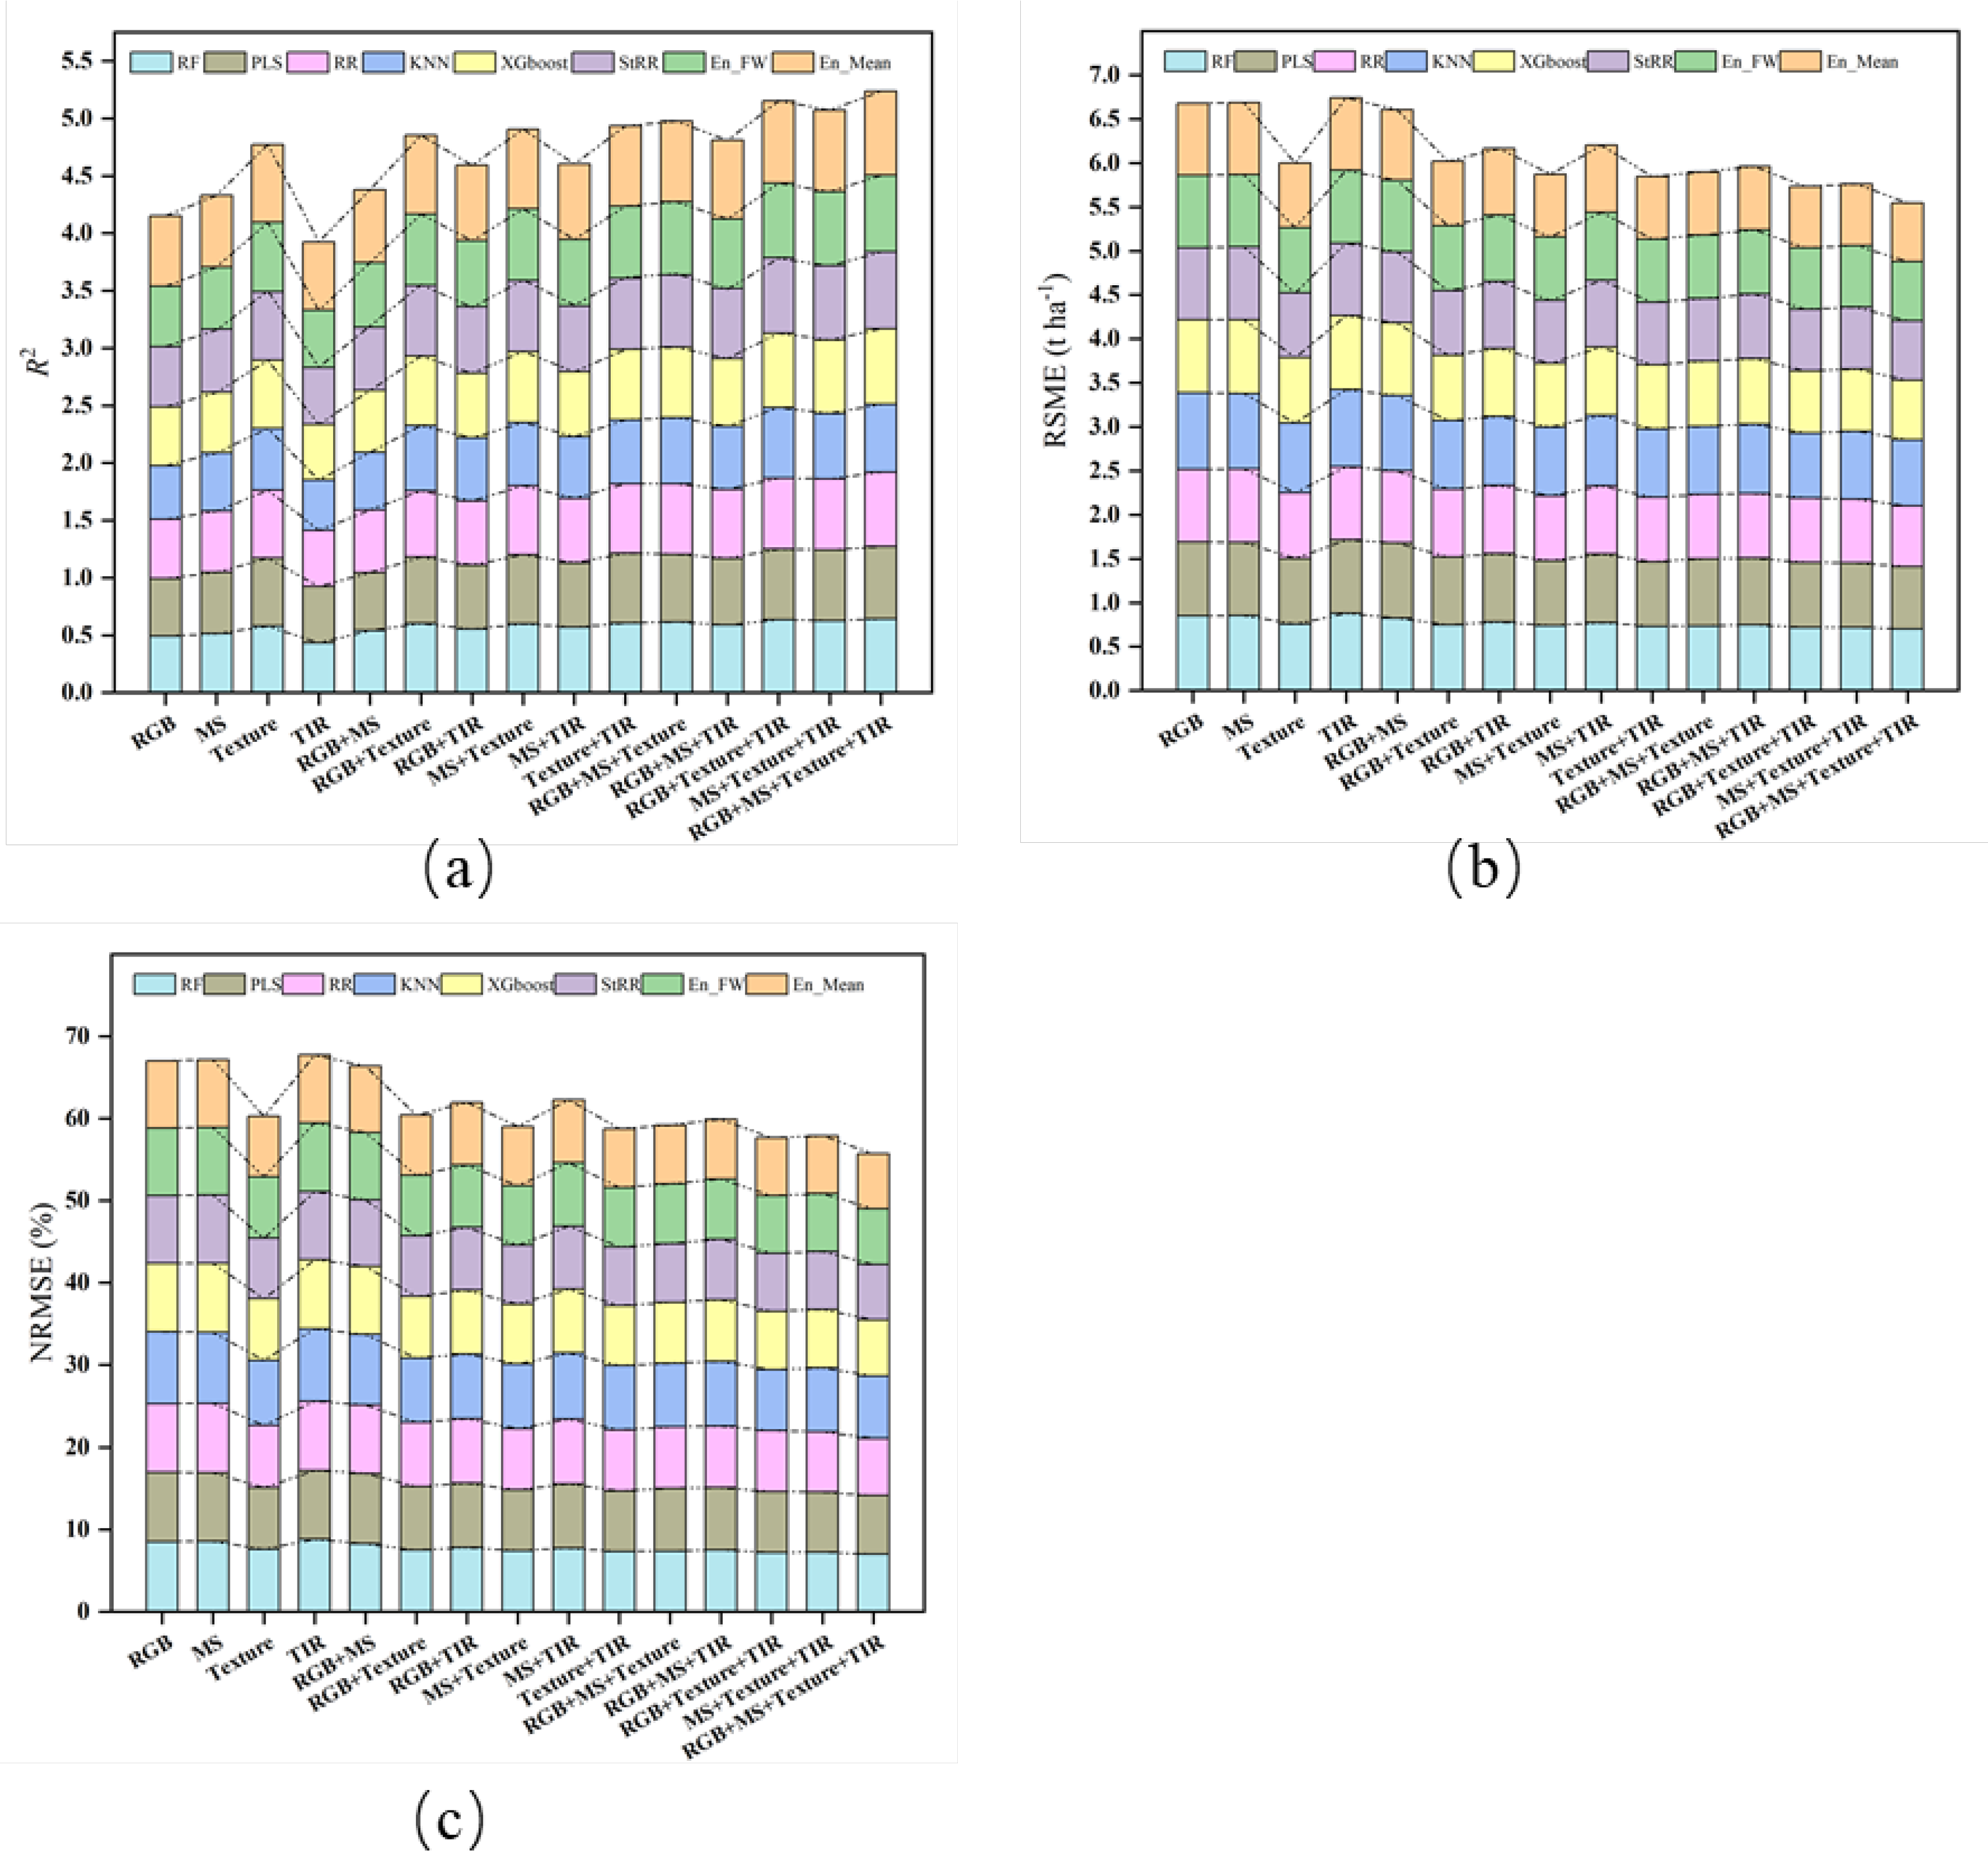
Figure 6.
Comparison of the estimation accuracies of different ML algorithms.
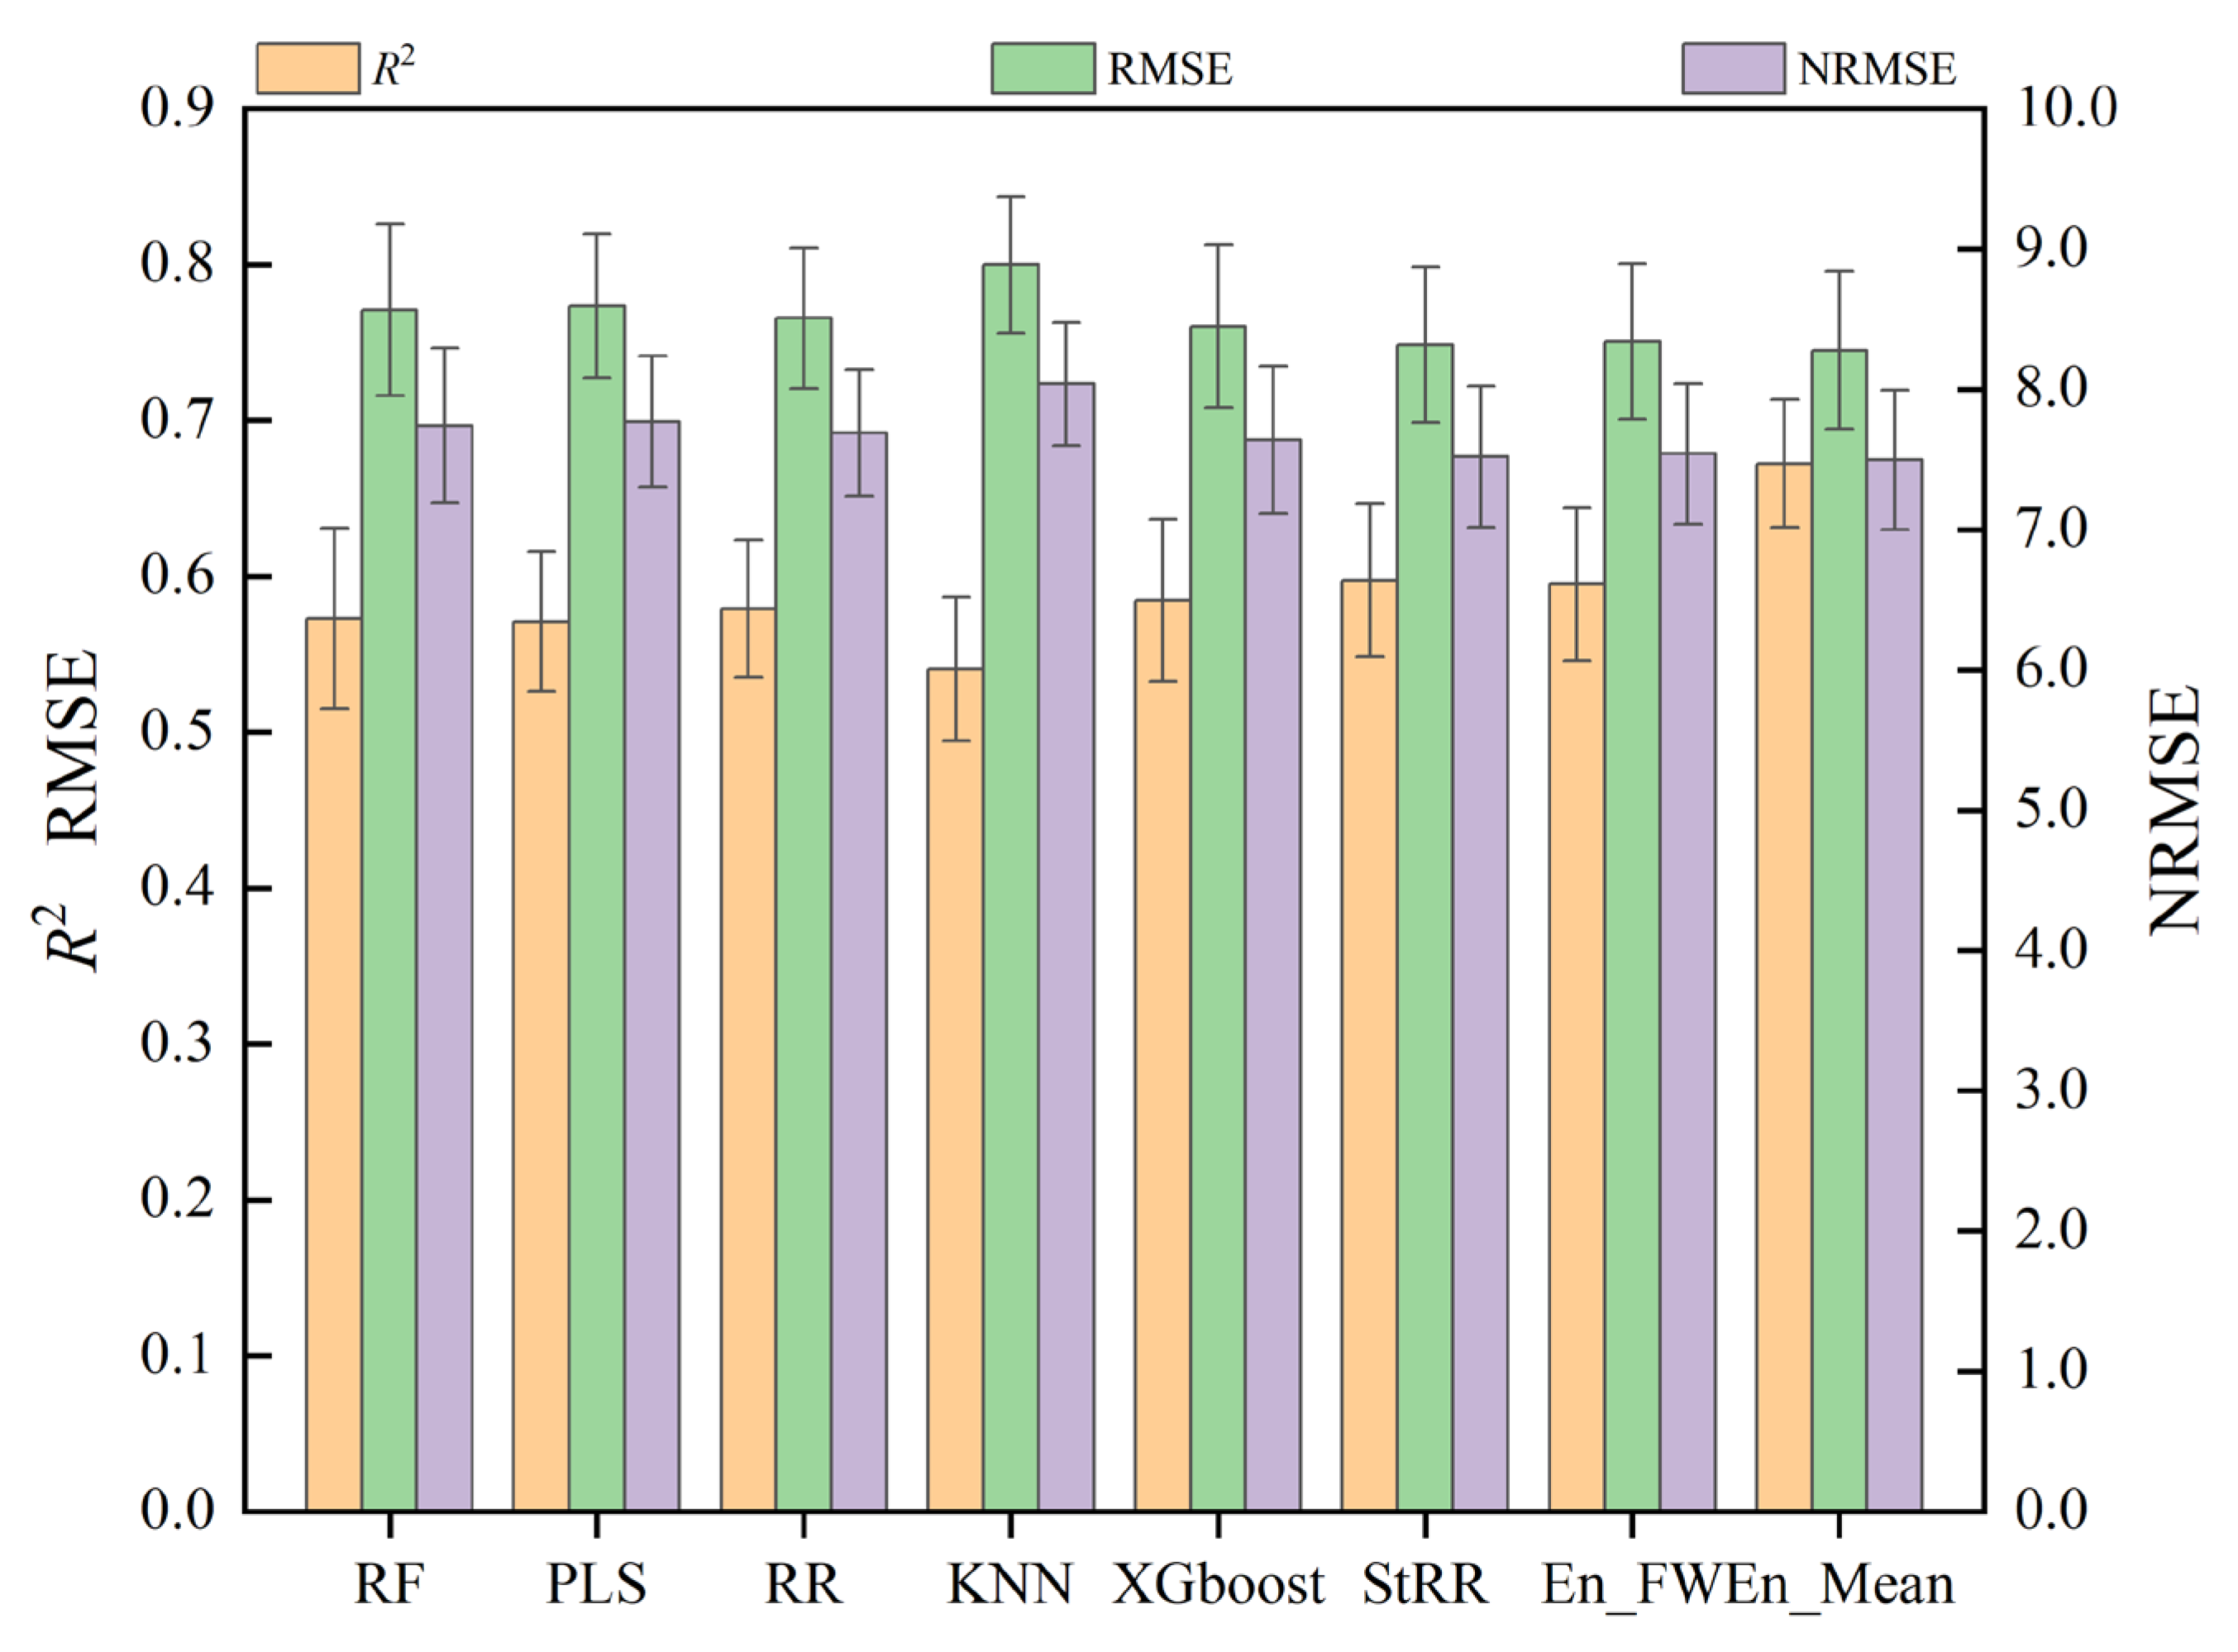
Figure 7.
Comparison of ensemble learning estimated and measured yields.
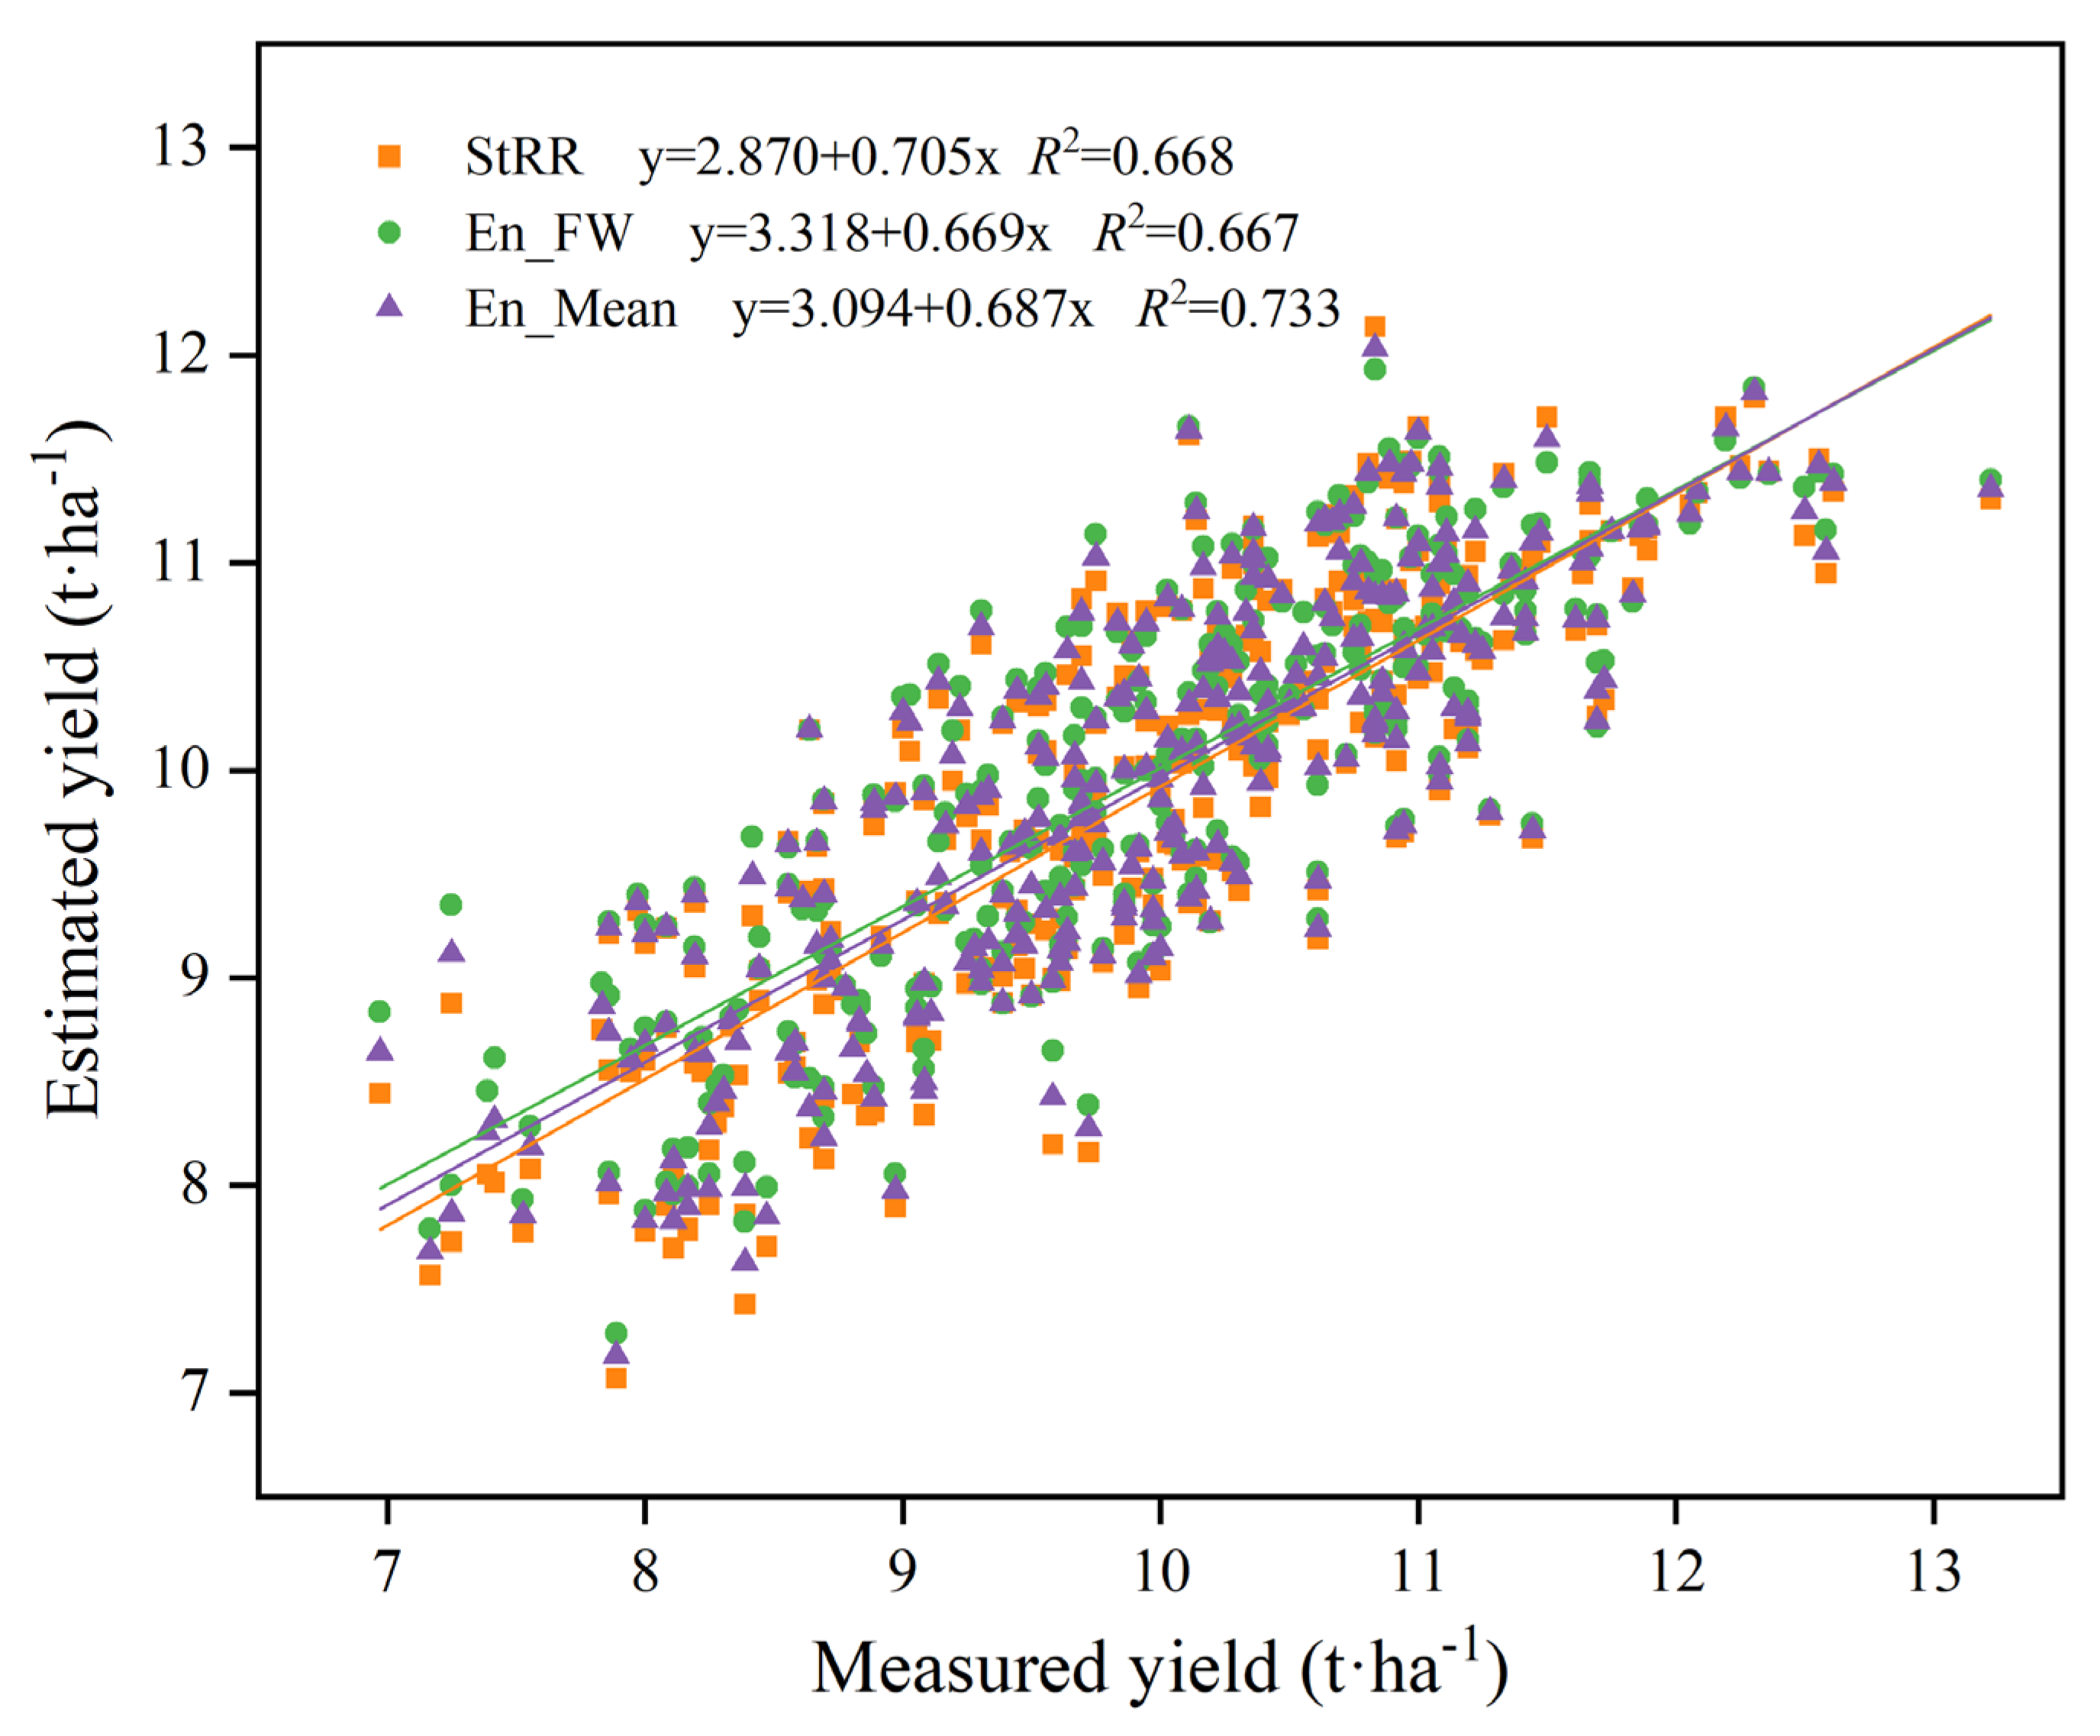

Table 1.
Vegetation index formula for UAV images.
| Sensor | Spectral Indices | Equation | References |
|---|---|---|---|
| RGB | Red Green Blue Vegetation Index | RGBVI=(G2 − B ∗ R)∕(G2 + B ∗ R) | Ji et al. (2023) |
| Plant Pigment Ratio | PPR= (G – B)/(G + B) | Peñuelas et al. (1994) | |
| Green Leaf Algorithm | GLA=(2*G-R-B)/(2*G+R+B) | Louhaichi et al. (2001) | |
| Excess Green Index | ExG=2*G-R-B | Woebbecke et al. (1995) | |
| Colour Index of Vegetation Extraction | CIVE=0.441*R-0.881*G+0.3856*B+18.78745 | Guijarro et al. (2011) | |
| Visible Atmospherically Resistant Index | VARI=(G-R)/(G+R-B) | Gitelson et al. (2002) | |
| Kawashima Index | IKAW=(R-B)/(R+B) | Kawashima (1998) | |
| Woebbecke Index | WI=(G-B)/(R-G) | Woebbecke et al. (1995) | |
| Green Blue Ratio Index | GBRI=G/B | Sellaro et al. (2010) | |
| Red Blue Ratio Index | RBRI=R/B | Sellaro et al. (2010) | |
| MS | Green-NDVI | GNDVI=(NIR-G)/(NIR+G) | Gitelson et al. (1996) |
| MERIS Terrestrial Chlorophyll Index | MTCI=(NIR-R)/(RE-R) | Zhang et al. (2014) | |
| Normalized Difference Vegetation Index | NDVI=(NIR-R)/(NIR+R) | Gitelson et al. (2002) | |
| Ratio Vegetation Index | RVI1=NIR/R | Pinter et al. (2003) | |
| Ratio Vegetation Index | RVI2=NIR/G | Xue et al. (2004) | |
| Modifed Simple Ratio Index | MSRI=(NIR/R-1)/(NIR/R+1)**0.5 | Chen (1996) | |
| Re-normalized Difference Vegetation Index | RDVI=(NIR-R)/(NIR+R)**0.5 | Roujean and Breon. (1995) | |
| Structure Insensitive Pigment Index | SIPI = (NIR-B)∕(NIR+B) | Penuelas et al. (1995) | |
| Colour Index | CI=NIR/G-1 | Gitelson et al. (2003) | |
| Generalized Soil-adjusted Vegetation Index | GOSAVI=(NIR-G)/(NIR+G+0.16) | Gilabert et al. (2002) | |
| Plant Senescence Refectance Index | PSRI=(R-B)/NIR | Merzlyak et al. (1999) |
Table 2.
Initial eigenvalues, contribution rates of variance and cumulative contribution rates of variance of texture feature principal components.
Table 2.
Initial eigenvalues, contribution rates of variance and cumulative contribution rates of variance of texture feature principal components.
| Principal Component | Initial Eigenvalues | ||
|---|---|---|---|
| Eigenvalue | Variance Contribution Ratio (%) | Cumulative Variance Contribution Ratio (%) | |
| 1 2 3 4 5 6 7 8 9 10 11 12 |
19.72 11.13 3.09 1.93 1.54 0.74 0.66 0.38 0.28 0.22 0.15 0.06 |
49.30 27.80 7.70 4.80 3.80 1.90 1.70 0.90 0.70 0.60 0.40 0.10 |
49.30 77.10 84.90 89.70 93.50 95.40 97.00 98.00 98.70 99.20 99.60 100.00 |
Table 3.
Test accuracy statistics of different models for wheat yield prediction.
| Sensor | Metric | Base learner | Secondary learner | Thirdary learner | ||||||
|---|---|---|---|---|---|---|---|---|---|---|
| RF | PLS | RR | KNN | XGboost | StRR | En_FW | En_Mean | |||
| RGB | R2 | 0.492 | 0.501 | 0.517 | 0.465 | 0.514 | 0.525 | 0.524 | 0.612 | |
| RMSE (t ha-1) | 0.848 | 0.841 | 0.827 | 0.871 | 0.830 | 0.820 | 0.821 | 0.818 | ||
| NRMSE (%) | 8.520 | 8.449 | 8.310 | 8.750 | 8.339 | 8.241 | 8.247 | 8.172 | ||
| MS | R2 | 0.513 | 0.534 | 0.534 | 0.507 | 0.528 | 0.542 | 0.548 | 0.625 | |
| RMSE (t ha-1) | 0.853 | 0.834 | 0.834 | 0.858 | 0.839 | 0.827 | 0.821 | 0.822 | ||
| NRMSE (%) | 8.565 | 8.378 | 8.383 | 8.619 | 8.433 | 8.304 | 8.249 | 8.243 | ||
| Texture | R2 | 0.579 | 0.592 | 0.592 | 0.539 | 0.593 | 0.605 | 0.596 | 0.678 | |
| RMSE (t ha-1) | 0.758 | 0.746 | 0.746 | 0.793 | 0.745 | 0.734 | 0.743 | 0.733 | ||
| NRMSE (%) | 7.617 | 7.498 | 7.498 | 7.963 | 7.487 | 7.374 | 7.459 | 7.384 | ||
| TIR | R2 | 0.434 | 0.490 | 0.490 | 0.439 | 0.482 | 0.500 | 0.495 | 0.594 | |
| RMSE (t ha-1) | 0.879 | 0.834 | 0.834 | 0.875 | 0.840 | 0.826 | 0.830 | 0.823 | ||
| NRMSE (%) | 8.825 | 8.382 | 8.382 | 8.791 | 8.443 | 8.295 | 8.335 | 8.292 | ||
| RGB+MS | R2 | 0.540 | 0.506 | 0.545 | 0.503 | 0.537 | 0.561 | 0.552 | 0.636 | |
| RMSE (t ha-1) | 0.825 | 0.854 | 0.820 | 0.857 | 0.827 | 0.806 | 0.814 | 0.805 | ||
| NRMSE (%) | 8.285 | 8.580 | 8.241 | 8.611 | 8.307 | 8.096 | 8.173 | 8.107 | ||
| RGB+Texture | R2 | 0.604 | 0.577 | 0.577 | 0.569 | 0.605 | 0.619 | 0.614 | 0.687 | |
| RMSE (t ha-1) | 0.747 | 0.772 | 0.772 | 0.779 | 0.746 | 0.733 | 0.737 | 0.733 | ||
| NRMSE (%) | 7.506 | 7.754 | 7.758 | 7.828 | 7.491 | 7.360 | 7.407 | 7.314 | ||
| Sensor | Metric | Base learner | ||||||||
| RF | PLS | RR | KNN | StRR | En_FW | |||||
| RGB+TIR | R2 | 0.554 | 0.557 | 0.560 | 0.548 | 0.561 | 0.575 | 0.580 | 0.657 | |
| RMSE (t ha-1) | 0.780 | 0.777 | 0.775 | 0.785 | 0.774 | 0.762 | 0.757 | 0.756 | ||
| NRMSE (%) | 7.839 | 7.806 | 7.786 | 7.889 | 7.772 | 7.650 | 7.602 | 7.620 | ||
| MS+Texture | R2 | 0.598 | 0.604 | 0.601 | 0.551 | 0.617 | 0.623 | 0.619 | 0.694 | |
| RMSE (t ha-1) | 0.741 | 0.735 | 0.738 | 0.782 | 0.723 | 0.718 | 0.721 | 0.714 | ||
| NRMSE (%) | 7.443 | 7.389 | 7.410 | 7.859 | 7.263 | 7.208 | 7.246 | 7.198 | ||
| MS+TIR | R2 | 0.569 | 0.561 | 0.563 | 0.536 | 0.566 | 0.581 | 0.571 | 0.656 | |
| RMSE (t ha-1) | 0.772 | 0.780 | 0.778 | 0.801 | 0.775 | 0.762 | 0.770 | 0.763 | ||
| NRMSE (%) | 7.760 | 7.833 | 7.811 | 8.049 | 7.789 | 7.654 | 7.739 | 7.660 | ||
| Texture+TIR | R2 | 0.607 | 0.607 | 0.607 | 0.555 | 0.614 | 0.628 | 0.620 | 0.697 | |
| RMSE (t ha-1) | 0.732 | 0.732 | 0.733 | 0.780 | 0.726 | 0.713 | 0.720 | 0.710 | ||
| NRMSE (%) | 7.357 | 7.358 | 7.359 | 7.831 | 7.290 | 7.161 | 7.235 | 7.157 | ||
| RGB+MS+Texture | R2 | 0.615 | 0.590 | 0.614 | 0.577 | 0.613 | 0.639 | 0.627 | 0.702 | |
| RMSE (t ha-1) | 0.736 | 0.760 | 0.738 | 0.772 | 0.739 | 0.713 | 0.725 | 0.716 | ||
| NRMSE (%) | 7.396 | 7.638 | 7.412 | 7.755 | 7.421 | 7.163 | 7.281 | 7.146 | ||
| RGB+MS+TIR | R2 | 0.588 | 0.582 | 0.602 | 0.547 | 0.591 | 0.603 | 0.612 | 0.686 | |
| RMSE (t ha-1) | 0.750 | 0.755 | 0.737 | 0.786 | 0.747 | 0.736 | 0.728 | 0.723 | ||
| NRMSE (%) | 7.532 | 7.589 | 7.405 | 7.897 | 7.508 | 7.389 | 7.310 | 7.287 | ||
| Sensor | Metric | Base learner | Thirdary learner | |||||||
| RF | PLS | RR | KNN | XGboost | StRR | En_FW | En_Mean | |||
| RGB+Texture+TIR | R2 | 0.636 | 0.614 | 0.620 | 0.615 | 0.647 | 0.652 | 0.655 | 0.717 | |
| RMSE (t ha-1) | 0.718 | 0.739 | 0.733 | 0.738 | 0.707 | 0.702 | 0.698 | 0.696 | ||
| NRMSE (%) | 7.210 | 7.424 | 7.367 | 7.415 | 7.098 | 7.051 | 7.014 | 7.061 | ||
| MS+Texture+TIR | R2 | 0.627 | 0.616 | 0.620 | 0.568 | 0.641 | 0.643 | 0.645 | 0.711 | |
| RMSE (t ha-1) | 0.720 | 0.730 | 0.726 | 0.774 | 0.706 | 0.704 | 0.702 | 0.699 | ||
| NRMSE (%) | 7.234 | 7.336 | 7.296 | 7.777 | 7.090 | 7.072 | 7.049 | 7.046 | ||
| RGB+MS+Texture+TIR | R2 | 0.640 | 0.631 | 0.649 | 0.589 | 0.660 | 0.668 | 0.667 | 0.733 | |
| RMSE (t ha-1) | 0.701 | 0.709 | 0.692 | 0.748 | 0.681 | 0.673 | 0.674 | 0.668 | ||
| NRMSE (%) | 7.038 | 7.127 | 6.949 | 7.519 | 6.842 | 6.760 | 6.771 | 6.727 | ||
MS multi-spectral features, TIR thermal infrared features, RF random forest, PLS partial least squares, RR ridge regression, KNN k-nearest neighbor, XGboost extreme gradient boosting decision tree, StRR stacking ensemble using ridge regression as a secondary learner, En_FW feature-weighted ensemble as a secondary learner, En_Mean simple mean ensemble as a thirdary learner.
Disclaimer/Publisher’s Note: The statements, opinions and data contained in all publications are solely those of the individual author(s) and contributor(s) and not of MDPI and/or the editor(s). MDPI and/or the editor(s) disclaim responsibility for any injury to people or property resulting from any ideas, methods, instructions or products referred to in the content. |
© 2024 by the authors. Licensee MDPI, Basel, Switzerland. This article is an open access article distributed under the terms and conditions of the Creative Commons Attribution (CC BY) license (http://creativecommons.org/licenses/by/4.0/).
Copyright: This open access article is published under a Creative Commons CC BY 4.0 license, which permit the free download, distribution, and reuse, provided that the author and preprint are cited in any reuse.


