
Submitted:
03 November 2025
Posted:
04 November 2025
You are already at the latest version
Abstract
This paper proposed a two-level hybrid stacking model for the classification of crops—wheat, soybean, and barley—based on multispectral orthomosaics obtained from uncrewed aerial vehicles. The proposed method unites gradient boosting algorithms: LightGBM, XGBoost, CatBoost, and tree ensembles: RandomForest, ExtraTrees, Attention-MLP deep neural network, whose predictions fuse at the meta-level using ExtraTreesClassifier. Spectral channels, along with a wide range of vegetation indices and their statistical characteristics, are used to construct the feature space. Experiments on an open dataset showed that the proposed model achieves high classification accuracy (Accuracy ≈ 95%, macro-F1 ≈ 0.95) and significantly outperforms individual algorithms across all key metrics. An analysis of the seasonal dynamics of vegetation indices confirmed the feasibility of monitoring phenological phases and early detection of stress factors. Furthermore, spatial segmentation of orthomosaics achieved approximately 99% accuracy in constructing crop maps, making the developed approach a promising tool for precision farming. The study's results showed the high potential of hybrid ensembles for scaling to other crops and regions, as well as for integrating them into digital agricultural information systems.
Keywords:
Unmanned Aerial Vehicles (UAV)
; multispectral orthomosaics
; crop classification
; vegetation indices
1. Introduction
Modern progress in precision farming would have been impossible without the introduction of uncrewed aerial vehicles, sophisticated multispectral optical sensors, and machine learning techniques, all of which have enabled the emerging possibility of high-precision crop identification and monitoring. Ultrahigh-resolution UAV-based orthophotography, obtained at sub-centimeter resolution, facilitates in-depth characterization and tracking of spatiotemporal variability in crop trends and physiological parameters. Such data forms the basis for intelligent systems supporting agricultural decisions, crop rotation optimization, and rational resource management [1,2,3]. However, despite significant progress in remote sensing data analysis, the problem of reliable crop classification under high spectral heterogeneity and variability in survey conditions remains open. Classical methods such as Random Forests and Support Vector Machines have proven effective for analyzing multispectral data. Still, their accuracy is limited in conditions of high intra-class variability and nonlinear dependencies [4,5,6]. Meanwhile, neural network architectures demonstrate a strong ability to extract complex features but require significant computational resources and large training samples, which limit their practical application to agricultural problems [7,8,9].
In these conditions, the development of hybrid ensemble models [10] that combine the advantages of boosting algorithms and deep neural networks while ensuring a balance between interpretability, accuracy, and robustness has become a relevant area of research. The novelty of this work lies in the development and experimental validation of a two-level hybrid stacking model that combines ensemble algorithms (LightGBM, XGBoost, CatBoost, RandomForest, ExtraTrees) with the Attention-MLP deep neural network, enabling consideration of both local and global dependencies between spectral and index features. Unlike existing studies, the proposed architecture integrates:
- An expanded feature space, including spectral channels and eight key vegetation indices (NDVI, NDRE, GNDVI, SAVI, MSR, EVI, SIPI, MSAVI) with their statistical characteristics (mean, std), generating 28 features per patch;
- An Out-Of-Fold meta-learning mechanism (OOF) that prevents data leakage and increases classifier robustness;
- An ExtraTreesClassifier meta-layer that optimally aggregates probabilistic predictions from base models, reducing the risk of overfitting and enhancing the system's generalization ability.
This architecture achieves high classification accuracy (Accuracy ≈ 95%, macro-F1 ≈ 0.95) while reducing LogLoss and MSE, outperforming the results of individual models. Furthermore, analysis of the seasonal dynamics of vegetation indices (NDVI, SAVI, MSR, etc.) confirmed the model's ability not only to classify crops but also to identify phenological stages of plant development and stress conditions.
2. Related Work
In recent years, the use of uncrewed aerial vehicles (UAVs) and multispectral sensors has become a key area of digitalization in agriculture. These technologies enable the acquisition of high-spatial- and spectral-resolution images, which are used to calculate vegetation indices to monitor plant physiological status, assess yield, and diagnose stress factors. Their integration with machine learning methods has opened up new possibilities for automatic crop classification and forecasting of agronomic performance [11].
Although classical machine learning with multispectral data – as implemented in the examples above – achieves sufficient classification accuracy, these algorithms are susceptible to spectral heterogeneity and noise. Therefore, ensemble approaches that combine multiple algorithms to improve classification and forecasting performance are actively being developed. For example, a study [12] demonstrated that optimizing stacking ensembles significantly improves the accuracy of forecasting natural and anthropogenic factors, including fire hazard.
One promising area is the use of hybrid ensembles and stacking in agricultural applications. For example, [13] proposed integrating optical and radar data at the feature level to build a U-Net model, which improved crop classification accuracy. Other studies [14,15] demonstrate the effectiveness of stacking in identifying plant diseases and predicting biophysical characteristics such as chlorophyll content. In particular, hybrid ensembles combining neural network models with boosting algorithms achieve higher accuracy and greater noise resilience than single models. Additional research highlights the importance of integrating ensemble approaches with temporal and multi-source data. [16] demonstrated that the use of stacking models to analyze water stress indices in winter wheat yields more stable forecasts than traditional methods. Systematic reviews in recent years [17,18] confirm the growing interest in UAV-based machine learning methods in agriculture, noting the need for hybrid architectures that account for the multifactorial nature and dynamics of agroecosystems.
In contrast to [19] and [20], where the proposed models are primarily focused on classifying individual crops or analyzing specific physiological parameters, the model developed in this study is universal and can be applied to classify a wide range of crops. Compared to the approaches [21] and [22], which primarily integrate individual features or CNN embeddings, our solution combines stacked predictions with an extended set of spectral and index features, thereby increasing the model's informativeness and robustness. In contrast to the study [23], which compares stacking with a one-dimensional convolutional network (1D CNN), our proposed approach combines multiple algorithms—gradient boosting, tree ensembles, and Attention-MLP—into a single hybrid architecture, achieving higher accuracy and generalization.
Our contributions include: (i) developing a two-level hybrid stacking approach that combines various machine learning algorithms and the Attention-MLP neural network model to improve the classification accuracy and robustness; (ii) forming an extended feature space that includes spectral channels, various vegetation indices, and their statistical characteristics, providing a more comprehensive understanding of crop conditions; (iii) demonstrating the practical applicability of the proposed approach, enabling the construction of crop distribution maps with an accuracy of approximately 99% and achieving high classification accuracy of approximately 95%. Thus, the presented work offers a universal solution for intelligent analysis of agricultural UAV orthomosaics, ensuring not only high classification accuracy but also functional flexibility for adaptation to new crops, regions, and survey conditions. This makes the developed hybrid stacking model a promising tool for automated agricultural monitoring and integration into future digital farming systems.
3. Materials and Methods
3.1. Dataset
The starting point was an openly available dataset [24] featuring multispectral orthomosaics of wheat, soybean, and barley plots collected with a DJI Phantom 4 UAV in eastern Kazakhstan in 2022. In all, 27 hectares were represented, divided into 27 experimental plots of 1 hectare each. Five survey sessions were completed for each plot, ensuring the coverage of crucial phenological phases. Figure 1 presents a multi-stage workflow that spans from the collection of multispectral data to the training of the final two-level stacking model. This diagram shows the primary processing and preparation stages for the input data, as well as the architecture of the computational pipeline responsible for high-quality crop classification.
The first section, "Remote Sensing Data Acquisition (UAV-Field Scanning)," demonstrates the process of aerial field surveying using a multispectral sensor mounted on a UAV. By simultaneously collecting Blue, Green, Red, RedEdge, and Near Infrared (NIR) bands, along with autonomously calculated NDVI, continuous spectral coverage of key vegetation reflectance ranges is ensured. The physical basis of this stage is the careful adjustment of flight altitude and camera parameters to achieve a spatial resolution of approximately 3 cm/pixel. The next stage, "Collecting Images and Preprocessing," involves converting georeferenced TIFF images into multiband matrices suitable for software processing. Using libraries such as rasterio and GDAL, it is possible to read each channel and convert it to a NumPy array. The resulting matrices are divided into overlapping patches of fixed size 64x64 pixels with a step size of 32 pixels. This allows for accounting for local spectral and spatial variations and significantly increases the size of the training sample without losing geometric context.
The "base dataset" block illustrates the composition of the initial feature set: six spectral channels (the first five are read directly from the device, the sixth—NDVI—is obtained "automatically" from the camera software, followed by eight additional indices calculated manually: NDVI (recalculated), NDRE, GNDVI, SAVI, MSR, EVI, SIPI, and MSAVI). These fourteen channels form the raw dataset, from which statistical characteristics are calculated in the next step. In the "Calculating 'mean' and 'std'" block, each 64×64×14 patch is transformed into a 28-dimensional vector: the mean and standard deviation are calculated for each channel and index, allowing us to capture not only the central tendency but also the degree of spectral heterogeneity within the window. The resulting feature set X is used for training. Next comes the "Preprocessing Pipeline":
1. Logarithm transformation (log1p) – reduces the skewness of intensity distributions, especially in the infrared channels.
2. Missing value imputation (mean) – fills missing pixels with the mean feature value, preventing discontinuities in the feature space.
3. Standardization (z-score) – normalizes the variances of all features, which is critical when training ensembles and neural networks that are sensitive to the scale of the input data.
The data is then split into training and test sets at an 80%:20% ratio ("Train/Test Split (X, y)"), with class stratification ensuring equal representation of barley, soybeans, and wheat in both sets. The final block, "Train Model," demonstrates the architecture of a two-tier stacking model that combines parallel training of six base algorithms (gradient boosting with LightGBM, XGBoost, and CatBoost; ensembles with RandomForest and ExtraTrees; and a deep Attention-MLP) and subsequent aggregation of their out-of-fold probabilities via the ExtraTreesClassifier meta-classifier. This design achieves a synergistic effect: first-level models identify local and global patterns in the spectral-spatial signal, while the meta-level optimally combines their predictions, accounting for correlated and uncorrelated errors, enabling high accuracy and robustness to data noise.
Taken together, this framework illustrates the whole workflow: from field measurements and the extraction of informative statistical features to the scalable training of a hybrid ensemble model capable of effectively classifying crops from multispectral UAV data.
3.2. Statistical Analysis of Spectral Channels and Vegetation Indices
For each crop, mean values and standard deviations were calculated for spectral channels. The results are presented in Table 1, Table 2, Table 3 and Table 4, where differences in reflectance between barley, soybeans, and wheat are clearly visible. Table 1 presents a comparative analysis of mean spectral channel values (Blue, Green, Red, RedEdge, NIR, NDVI) for three major crops—barley, soybeans, and wheat—based on multispectral patches extracted from UAV orthomosaics. This analysis allows us to identify features of plant reflectance in different ranges of the electromagnetic spectrum, which is critical for the development of automatic crop classification algorithms. For example, differences in the NIR and RedEdge channels may indicate differences in leaf structure, crop density, and crop maturity. The inclusion of NDVI as a basic vegetation index also characterizes photosynthetic activity and the overall health of vegetation, thereby increasing the informativeness of the sample for machine learning tasks.
A comparative analysis of the presented data shows that wheat exhibits the highest reflectance in the visible range (Blue, Green, Red, and RedEdge), with lower standard deviations than those of barley and soybeans, indicating greater homogeneity in its spectral characteristics. The highest value in the near infrared (NIR) range is observed in soybeans (35,456.46), which is 12.3% higher than that of barley (31,737.90) and 0.9% higher than that of wheat (35,132.80). This indicates a higher ability of soybeans to reflect in the NIR region and is associated with their physiological characteristics. NDVI analysis revealed that soybeans have the highest photosynthetic activity (0.1762), almost twice that of barley (0.0910) and significantly higher than that of wheat (0.1003). Moreover, soybean also exhibits the highest intraclass variability (std = 0.1228), reflecting crop heterogeneity and biomass heterogeneity. Thus, the results indicate that wheat exhibits stable spectral characteristics in the visible range, and soybean shows high photosynthetic activity and intense NIR reflectance. At the same time, barley occupies an intermediate position across most parameters. These differences are essential for developing algorithms for automatic crop classification based on multispectral data.
Table 2 shows the standard deviations of the mean spectral channel values for each crop class. This reflects the variability of spectral traits within each class. High standard deviation values may indicate considerable differences within a class. These differences can arise from biological characteristics, such as varieties and variations in growth stages, as well as the effects of farming practices. External factors, like lighting and weed presence, can also play a role. This parameter is necessary for quantitatively assessing the stability of the identified traits and for subsequently selecting optimal normalization and feature selection methods when constructing classification models.
In most channels, the maximum standard deviation values are characteristic of wheat, indicating its high spectral heterogeneity. For example, in the blue range (Blue, mean SD), wheat has a value of 10,217.45, which is 61% higher than barley (6,348.63) and 17% higher than soybeans (8,735.04). A similar situation is observed in the red channel (Red, mean SD), where wheat has 12,214.14, against 10,499.54 for soybeans and 6,860.20 for barley. In NIR (mean SD), wheat again has the highest value at 9,710.12, which is 34% higher than soybeans (7,226.45) and 102% higher than barley (4,807.80). This points to high NIR reflectance variability in wheat due to crop heterogeneity and differences in plant development stages. Further, for NDVI, the highest mean values were observed for soybeans (0.1668) and wheat (0.1632), whereas barley had a mean of only 0.1111. It confirms greater dispersal of photosynthetic activity levels in soybeans and wheat, which can result not only from biological factors but also from different agronomic conditions. Thus, the results in the Table show that wheat has the highest intra-class spectral variability, especially in the visible and NIR ranges, indicating its sensitivity to external and internal factors. Soybeans have pronounced NDVI heterogeneity, reflecting significant variability of photosynthetic activity. At the same time, barley shows relatively low feature dispersion, suggesting more stable spectral characteristics within the class.
Table 3 shows the average values of the following key vegetation indices: NDVI, NDRE, GNDVI, SAVI, MSR, EVI, SIPI, and MSAVI for each crop class. These indices represent different combinations of spectral channels proposed to characterize the physiological state of plants, their biomass, chlorophyll content, photosynthetic activity, stress levels, and other agro-ecological parameters. Comparative analysis of these indices allows us to identify distinguishing features between crops. It serves as an additional data source to improve the accuracy of automatic classification in machine learning models. Including standard deviations in the table allows us to assess the variability of index indicators within each class.
A comparative analysis of vegetation indices revealed significant differences between the crops. Soybean has the highest NDVI values at 0.1762. This is almost double the value for barley (0.0910) and significantly higher than wheat (0.1003). This shows that soybeans exhibit more intense photosynthetic activity and produce more biomass. The standard deviation of NDVI for soybean is 0.1228, which is higher than that of barley at 0.1079 and wheat at 0.0948. This indicates greater variability within the soybean class. The differences in NDVI among the crops are less noticeable. All crops show similar negative values, likely due to their growth-phase characteristics and the index's sensitivity to chlorophyll content. At the same time, the GNDVI values of soybeans (0.0655) are significantly higher than those of barley (0.0215) and wheat (0.0177), indicating a greater ability of soybeans to accumulate green reflective energy and reflect physiological differences. According to the SAVI index, which accounts for soil influence, soybeans also have the highest value (0.2644), which is 1.9 times that of barley (0.1364) and 76% higher than that of wheat (0.1504). A similar trend is observed for MSR, where soybeans have an average value of 0.3244, higher than those of barley (0.1612) and wheat (0.1918). Interesting results were obtained when analyzing the EVI index: the maximum value is observed for barley (21,243.96), while soybeans (18,984.23) and wheat (10,364.94) have lower values. This may be due to the crop's peculiar structure and differences in vegetation density. At the same time, the EVI standard deviations are considerable (ranging from 1.18 to 2.35 million), indicating high variability in the sample. According to the SIPI index, all crops show negative values. Still, the value of soybeans (-30,491.88) is closer to zero than those of barley (-105,925.40) and wheat (-98,746.84), suggesting a higher carotenoid-to-chlorophyll ratio in soybeans. According to the SIPI index, all crops have negative values. However, the value of soybeans, at -30,491.88, is closer to zero than those of barley (-105,925.40) and wheat (-98,746.84). This may suggest that soybeans have a higher carotenoid-to-chlorophyll ratio. The MSAVI, which accounts for soil and crop density, also puts soybeans in the lead with a value of 0.2301, outpacing barley at 0.1259 and wheat at 0.1215. This highlights their strong ability to accumulate biomass and their unique physiological traits.
Overall, the results indicate that soybeans score higher across most vegetation indices, including NDVI, GNDVI, SAVI, MSR, and MSAVI. This shows their high photosynthetic activity and significant biomass. Barley stands out for its high EVI values, reflecting the specific crop structure, while wheat occupies an intermediate position, demonstrating stability across most indices at moderate values.
Table 4 shows the standard deviations of the mean vegetation indices, which characterize the dispersion of indicators within crop classes. High levels of variability indicate heterogeneity in the spatial distribution of indices, possible local stress areas, soil characteristics, water regime, or agricultural practices. Accounting for this parameter is essential for building robust classification models and for considering intra-class variance when training algorithms and interpreting field experiment results.
A comparative analysis of vegetation index standard deviations revealed differences in intra-class variability of spectral traits across the three crops. For NDVI, the highest variance is observed in wheat (0.0552), while barley (0.0475) and soybeans (0.0506) have lower values. This indicates a more heterogeneous distribution of photosynthetic activity in wheat. NDRE analysis revealed that grain had the highest standard deviation (0.0103), compared with 0.0068 in barley and 0.0072 in soybeans, reflecting its greater sensitivity to differences in chlorophyll content. For GNDVI, the highest mean value and variability are characteristic of soybeans (0.1178; std = 0.0274), confirming its pronounced heterogeneity in the green spectral range. According to SAVI and MSR, the maximum variability values are also observed in wheat (0.0828 and 0.1009, respectively), indicating a greater influence of soil background factors and crop density. At the same time, soybeans have similar values (0.0759 and 0.0802), and barley has the lowest (0.0713 and 0.0897), indicating greater spectral stability for this crop. According to the EVI index, standard deviations across all crops are incredibly high, especially in barley (33,342,580.00), indicating substantial heterogeneity in the sample and a high sensitivity of the index to external conditions. A similar trend is seen for SIPI. Barley shows the highest variance at 24,517,450.00, while soybeans and wheat have lower values at 12,844,970.00 and 20,468,290.00, respectively. The MSAVI indicates the most variability for wheat at 0.2385. Soybeans follow with 0.1425, while barley has the lowest at 0.0886. This suggests greater spatial differences in wheat crops, possibly due to varying plant density and condition.
Overall, the analysis shows that wheat has the most variability across most indices. This reflects its differences and high sensitivity to agro-ecological factors. Soybeans have the highest average values for some indices, such as GNDVI, but exhibit moderate variability. Barley, on the other hand, has more stable features, making its spectral profile less affected by intraclass changes.
3.3. Post-Processing of Features
Correct feature preparation and normalization are key steps in building strong, reliable machine learning models. To maintain consistency in the feature space and reduce the effects of outliers and missing data, we used a multi-step preprocessing pipeline in the Python scikit-learn environment. The steps included the following transformations:
1. Log1p transformation. For all numerical features characterizing spectral channels and vegetation indices, the transformation was performed. The purpose of this step is to reduce the asymmetry (skewness) of distributions, which is often observed in spectral features and indices (e.g., NDVI, SAVI, SIPI). The use of a log transformation mitigated the impact of extreme values and made the distributions closer to normal, which has a positive impact on the performance of models sensitive to distribution scale and shape (e.g., linear models or methods using the Euclidean distance metric).
2. Imputation of missing values. The original data contained missing values due to imaging artifacts. This included localized missing information in multispectral patches due to light pollution, cloudiness, or sensor noise. To fill in these gaps, we used the SimpleImputer module with the "mean" strategy. This method replaces missing values with the average value of the relevant feature. It maintains the data structure without significantly changing the distributions and ensures the continuity of the feature space. For features used in ensemble methods like XGBoost or ExtraTrees, this strategy provided a good balance between ease of use and reliability.
3. Feature standardization. The final step involved applying StandardScaler, which transforms each feature so that its mean is zero and its standard deviation is one. Standardization is necessary for the correct operation of models based on linear algebra (e.g., neural networks or logistic regression). It eliminates the dominance of features with large scales (e.g., Blue or NIR band values, measured in tens of thousands, compared to normalized NDVI or MSAVI indices, which vary within the range [-1;1]). This step also accelerates the convergence of optimization algorithms and improves the stability of results when using ensembles.
These steps resulted in the formation of the final feature matrices and , which represent standardized and normalized samples without missing data points or outliers. This processing reduced the impact of noise and heterogeneity in the source data, ensuring more robust model performance during training and testing. Furthermore, the Pipeline mechanism in scikit-learn ensured reproducibility of experiments and automated integration of preprocessing steps into the overall cross-validation process. This eliminates the risk of data leakage, as all transformation steps were performed strictly within the training folds, and the test data underwent the same transformations as the training data.
3.4. Building a Two-Tier Stacking Model
Figure 2 shows the detailed design of the proposed two-layer hybrid stacking system. This system combines the benefits of different machine learning algorithms to classify crops using multispectral data.
At the beginning of the pipeline, the preprocessed features and obtained after logarithmic transformation, missingness imputation, and standardization are input. At Level 1, six baseline models are trained in parallel:
- LightGBMClassifier (lgb)
- XGBClassifier (xgb)
- CatBoostClassifier (cat)
- RandomForestClassifier (rf)
- ExtraTreesClassifier (et)
- Deep Attention-MLP (att)
Each of these models, within the framework of Stratified K-Fold (e.g., n_splits = 4), is sequentially trained on training and validation splits (Fold 1 ... Fold 4). During cross-validation, out-of-fold (OOF) probabilities for each of the three crop classes (barley, soybean, wheat) are collected for each patch. This means that each fold yields a matrix of dimensions , and for all four folds and six models, a set of OOF predictions of dimensions . The next step is aggregation of the OOF predictions, which results in a meta-feature matrix of the combined form (1):
Thus, each sample is described by the original 28 statistical features and 18 probabilities from the base models. At Level 2, the ExtraTreesClassifier is used as the meta-model, trained on this extended meta-feature matrix. This split of training into two levels allows:
- Avoiding data leakage through an out-of-band strategy: the probabilities of the base models for the meta-level are formed exclusively on validation folds.
- Integrating diverse data representations: gradient boosting reveals strong nonlinear dependencies, random forests and ExtraTrees stabilize predictions through averaging, and Attention-MLP takes into account complex correlations within vegetation indices.
Finally, the trained meta-model produces final class predictions, which are used to calculate standard quality metrics —Accuracy, log-loss, macro-F1 —as well as regression metrics based on probabilities (R², MSE, RMSE, MAE). The resulting architecture demonstrates strong generalization and robustness to noise in field multispectral data, as evidenced by improvements across all key performance indicators compared to single algorithms.
4. Results
The proposed two-level hybrid stacking model was tested on real multispectral UAV data to quantitatively evaluate its performance, robustness, and generalization ability for crop classification. This section presents the main results obtained during the model validation and interpretation stages. The analysis covers several aspects: (i) investigation of the seasonal dynamics of vegetation indices and identification of spectral-physiological patterns for three crops (wheat, soybean, and barley); (ii) quantitative assessment of the classification quality for individual algorithms and the developed hybrid architecture; (iii) spatial segmentation of orthomosaics and visual assessment of the accuracy of crop mapping. This comprehensive approach not only confirms the model’s high accuracy across key metrics (Accuracy, F1-score, LogLoss, R²) but also demonstrates its practical applicability for crop monitoring and digital management.
4.1. Analysis of Seasonal Dynamics of Vegetation Indices
To identify patterns in crop development over time, we calculated monthly values of key vegetation indices, including NDVI, NDRE, GNDVI, SAVI, MSR, EVI, SIPI, and MSAVI. Changes in these indices are essential for monitoring plant health, diagnosing stress conditions, and planning agricultural measures. The analysis focused on 64x64 pixel patches collected by month—specifically May, June, and July. For each patch, we calculated the mean values and standard deviations of the indices and then averaged these across the crop and the month of survey. This approach allowed us to create representative samples for examining seasonal growth patterns in barley, soybeans, and wheat.
Figure 3 shows seasonal changes in vegetation indices for the three crops from May to July. The analysis reveals that soybeans have higher NDVI, GNDVI, SAVI, and MSR values than both barley and wheat. This reflects their strong photosynthetic activity and greater biomass during this time. Wheat shows relatively stable values for most indices; however, there is significant variability, especially in EVI and MSAVI, which may stem from uneven maturation and crop density. Barley falls in an intermediate position overall, but for some indices, like NDRE, its values are lower, indicating less chlorophyll activity. Overall, the dynamics of the indices confirm that spectral indices highlight biological differences between crops and can act as useful indicators for crop classification and monitoring.
Violin plots in Figure 3 allow visualization of the distribution and variability of index values by crop and month. It is clearly visible that NDVI and SAVI show an increase in June and July, especially pronounced for soybeans. The MSR and GNDVI indices also show differentiation by crop, with higher values for soybeans at the peak of vegetation. The width of the violin plots reflects intraclass heterogeneity, which is important for building robust classification models. This form of analysis allows us to evaluate distributions, not just average values, providing a more complete understanding of the spectral heterogeneity of crops and potential local stresses. This is especially important for precision farming applications that require early detection of crop development abnormalities.
Figure 4 shows the average monthly trends of the indices by crop. A clear seasonal increase in NDVI, SAVI, and MSAVI is evident, corresponding to the phase of intensive plant growth in June and July. Moreover, soybeans exhibit more pronounced peaks for almost all indices, confirming their more active growth and high photosynthetic activity in summer. It is also noticeable that NDRE and GNDVI exhibit characteristic differences between crops in July, which can be attributed to differences in leaf structure and chlorophyll content. The EVI index exhibits significantly higher absolute values and a wide range, due to its high sensitivity to atmospheric conditions and soil reflectivity. SIPI shows specific negative values and trends that also differentiate crops and may serve as an indication of differences in pigment composition. These data highlight the informative value of a comprehensive set of indices for solving the classification problem.
Figure 4 shows that soybeans exhibit the most pronounced increases in NDVI, GNDVI, SAVI, and MSAVI, reflecting their intense biomass growth and high photosynthetic activity in June–July. Wheat and barley exhibit more consistent trends, with wheat demonstrating relatively stable values for most indices, while barley exhibits lower NDVI and GNDVI values, indicating lower planting density. The NDRE and SIPI indices reveal differences in chlorophyll activity and pigment composition between the crops, particularly in the July data. The dynamics of these indices reveal differences in crop physiological development and spectral characteristics. These differences can help create highly accurate classification models. The steps taken range from preparing the initial data and extracting spectral features to calculating vegetation indices. They also include analyzing statistical characteristics, normalizing and processing features, and constructing the experimental design. Together, these steps form a solid framework for the study. Consistent application of these procedures guarantees the reliability, reproducibility, and strength of the data collected. This creates a foundation for objectively evaluating the effectiveness of the proposed hybrid stacking model. Taken together, this allows us to consider the developed approach a universal solution for the automatic classification of crops from multispectral UAV data and for subsequent implementation in digital farming practices.
4.2. Evaluation of Model Results
The key objective of the experiment was to compare individual boosting algorithms (LightGBM, XGBoost, CatBoost) with the proposed two-layer hybrid stacking model, which combines the outputs of six baseline models (including Attention-MLP) through the ExtraTrees meta-classifier. The results showed a significant advantage for the hybrid model across all key metrics. This confirms the high efficiency of the stacking strategy for integrating heterogeneous features and out-of-fold probabilities in multispectral classification problems. Figure 5 compares the accuracy of the individual boosting algorithms (LightGBM, XGBoost, CatBoost) and the developed hybrid two-layer stacking model.
The baseline models achieve ~88–92% accuracy, with XGBoost performing best (91.8%). The hybrid model outperforms all baseline solutions, achieving ≈95.1% accuracy, demonstrating its ability to account better for spectral-spatial data heterogeneity and to integrate predictions from different algorithms synergistically. This increase confirms the effectiveness of the stacking architecture for crop classification with multispectral UAV data and its potential for practical application in agricultural crop-monitoring systems. To comprehensively evaluate the proposed hybrid model, a comparative analysis of its performance with individual boosting algorithms (LightGBM, XGBoost, CatBoost) was conducted (Figure 6). The metrics used were the coefficient of determination (R²), mean square error (MSE), root mean square error (RMSE), mean absolute error (MAE), and log loss (LogLoss). This set of metrics allows us to simultaneously characterize both the accuracy of the approximation of class probabilities and the robustness of models to prediction errors.
The results clearly show the benefits of the hybrid stacking model. It achieves the highest R² value at 0.83, which is much higher than the values for individual algorithms, which range from 0.57 to 0.70. The model also exhibits low error values across all other metrics: MSE is 0.16, RMSE is 0.40, MAE is 0.09, and LogLoss is 0.16. Among the baseline models, XGBoost performed the best, while LightGBM and CatBoost had lower accuracy and higher error rates. Therefore, combining several methods into a two-tier architecture improved the model's ability to generalize and increased its reliability on the test set. Table 5 presents the key performance metrics for three crop classes—barley, soybean, and wheat—along with macro-averages and overall accuracy. The basic algorithms—LightGBM, XGBoost, and CatBoost—deliver good results, but their F1 Scores and accuracy often range from 0.88 to 0.92. For instance, LightGBM has a Barley Recall of 0.89 and a Soybean Recall of 0.81, which suggests some instability in detecting soybeans.
The hybrid model significantly outperforms its competitors across all metrics: Barley Precision = 0.96, Soybean F1-score = 0.93, Wheat Recall = 0.96. Particularly impressive is the increase in the macro avg F1-score to 0.95 and the overall accuracy to 0.95, confirming the model's ability to classify all classes equally well without bias. This improvement is achieved through a stacking architecture that combines the probabilities and features of the base models at the second level, increasing generalization ability. High Recall values are essential for crop monitoring tasks, where missing a crop class can lead to errors in planning agricultural interventions. Thus, the hybrid model demonstrates high reliability and versatility for field application in precision farming systems. The experimental results convincingly demonstrate the advantages of the proposed two-level hybrid stacking model for automatic crop classification using multispectral UAV orthomosaics, by integrating the strengths of boosting algorithms (LightGBM, XGBoost, CatBoost), ensemble trees, and a deep Attention-MLP network at the first level, as well as ExtraTreesClassifier at the second level. Significant improvements are achieved across all key metrics. Overall accuracy (≈95%), a LogLoss reduction of up to 15.6%, and a steady increase in F1-score across all classes demonstrate the model's high generalizability and robust performance with heterogeneous field data. Analysis of seasonal changes in vegetation indices confirms their potential to track growth phases, detect early stress, and support agricultural decision-making. These results show that hybrid ensembles can be valuable in precision farming systems that require a balance of clarity, reliability, and strong predictive ability. This approach can be adjusted for new crops and areas, creating many opportunities for further growth and integration into practical digital agriculture solutions.
4.3. Spatial Segmentation and Visualization
To finalize the practical applicability of the developed hybrid two-level model, pixel-by-pixel segmentation of field plot orthomosaics was conducted. The main goal of the experiment was to test the classifier's ability not only to identify crops based on spectral-index features at the patch level but also to generate spatially continuous crop maps suitable for agronomic monitoring. The original multispectral TIFF orthomosaics were divided into overlapping 64x64 pixel patches. A 28-dimensional feature vector (mean and std for spectral channels and vegetation indices) was calculated for each patch. The predicted classes were reassembled into a single plot map while maintaining georeferencing, allowing the final classification map to be visualized alongside the original RGB layer. Each final map displays the predicted class (barley, soybean, wheat) and background/undefined areas. Color coding:
- yellow — barley,
- green — soybeans,
- purple — wheat,
- black — background/undefined areas.
This visualization format is critical for practical applications in precision agriculture: it allows agronomists to quickly interpret survey results, determine field boundaries by crop, and identify potential crop rotation errors. To demonstrate the practical applicability of the proposed hybrid model, crop spatial classification was performed using multispectral UAV orthomosaics. Figure 7 shows an example of a barley field plot. The original RGB image is on the left, and the model's prediction map with class extraction is on the right. The result demonstrates the algorithm's ability to accurately identify the crop and achieve high segmentation accuracy at the field level. This confirms its effectiveness in digital agriculture.
On the left is the original RGB orthomosaic image (UAV TIFF), on the right is the map of predicted classes with an accuracy of ≈99.9%. A large area is clearly classified as barley (yellow), with only a few interspersed unidentified pixels (black). This demonstrates the model's ability to segment a monoculture with minimal spectral heterogeneity correctly. A similar experiment was conducted for a section of a field sown with soybeans. Figure 8 compares the original RGB orthomosaic (left) with the hybrid model's prediction map (right). The model correctly identified the "soybean" area, achieving a classification accuracy of 99.9%. This result shows that the proposed approach performs well across different crops and demonstrates its robustness to variations in spectral features and crop characteristics.
On the left is the original RGB orthomosaic image, on the right is the model's prediction map (green = soybean). The map is highly homogeneous and exhibits a very low classification error rate, with a final accuracy of ≈99.9%. Soybean exhibits specific spectral features that the model clearly identifies, even in the presence of minor artifacts in the original imagery. A similar approach to that used for other crops was used to assess the quality of wheat classification. Figure 9 shows the original RGB orthomosaic of a field section (left) and the predicted class map (right). The hybrid model correctly identified wheat with high accuracy (99.2%), demonstrating only minor local segmentation errors, primarily at the field edges. These results demonstrate the algorithm's robustness and confirm its ability to effectively classify wheat crops under conditions of spectral and spatial heterogeneity.
On the left is the original RGB image of the plot; on the right is the map of predicted classes (purple = wheat). Segmentation accuracy is ≈99.2%. Slight inclusions of foreign classes and background (yellow, black) are visible along the edges and in local heterogeneous zones, which correspond to the more pronounced spectral variability of wheat fields. Despite this, the model maintains high confidence in identifying the main crop. These examples illustrate the capabilities of the hybrid stacking model for automated crop mapping based on multispectral UAV data. Visual interpretation of the results confirms that the proposed approach is suitable for practical implementation in precision farming systems, providing a convenient format for agronomic analysis and crop rotation planning.
5. Discussion
The results of the study demonstrate the high efficiency of the proposed two-level hybrid stacking model for automatic crop classification using multispectral UAV orthomosaics. The obtained values of Accuracy ≈ 95%, LogLoss ≈ 0.156, and macro avg F1-score ≈ 0.95 outperform the results of single boosting algorithms (LightGBM, XGBoost, CatBoost), which ranged from 88–92%. This highlights the key advantage of ensembling and multi-level architecture when working with high-dimensional, noisy, and spectrally and spatially heterogeneous data. Analysis of metrics such as RMSE, MAE, and LogLoss revealed a significant reduction in errors when moving from the baseline models to the hybrid ensemble. For example, a decrease in MSE from ~35–38% for the baseline models to 15.6% for the hybrid model indicates significantly more confident and reliable class prediction. This is particularly important for agronomic monitoring, where classification inaccuracies can lead to incorrect crop planning, errors in crop condition assessment, and irrational resource use.
Another significant result is the model's ability to account for intraclass variability in spectral features. As tables of mean values and standard deviations for bands and indices demonstrate, differences between crops are not always linear, and variability within a single class can be high due to varietal differences, phenological phases, agricultural practices, and environmental conditions. The hybrid model demonstrated the ability to extract these complex relationships by combining the outputs of gradient boosting, random forests, and a deep Attention-MLP at the first level, and using an ExtraTreesClassifier at the second level to integrate features and probabilities. Analysis of seasonal trends and vegetation index dynamics confirmed the additional contribution of these features to classification quality. Indices such as NDVI, SAVI, GNDVI, and MSR revealed characteristic differences between crops and their phenological phases. For example, higher NDVI and SAVI peaks in soybeans in June and July are consistent with their active growth phase, allowing these indices to be used for more accurate crop diagnostics and forecasting. Also noteworthy is the practical application of the developed model for spatial field segmentation. Examples (Figure 7, Figure 8 and Figure 9) demonstrate that the model can generate detailed classification maps with approximately 99% accuracy, preserve georeferencing, and enable agronomists to assess crop structure quickly. Despite minor artifacts and local errors at field edges, the resulting maps demonstrate high consistency and are suitable for integration into crop management geographic information systems.
Taken together, these results confirm the potential of hybrid ensemble strategies and multispectral UAV data for creating reliable precision farming tools. Such systems can significantly improve the efficiency of crop rotation planning, agricultural practice optimization, and crop health monitoring.
Limitations and Future Work. Despite the high performance achieved and broad application potential, the proposed two-level hybrid stacking model has several limitations related to the source data and its structure. First, training was done using data from a single region, Eastern Kazakhstan, and three crops: wheat, soybeans, and barley. This limits the model's applicability to other agroclimatic zones or crops with different spectral features. Second, the feature set was created from multispectral channels and derived indices, without considering other information sources such as soil, weather, or topographic data. These could enhance the accuracy and reliability of the classification.
Additionally, the model was trained with static images that do not capture the changing nature of crop development throughout the growing season. This limits its ability to model phenological changes. On the computational side, using Attention-MLP at the first level raises resource use and training time compared to purely boosted ensembles. This could be important when processing large areas or streaming data. Another potential issue is that the model has not been tested on data from other sensor types, such as hyperspectral or radar. This means it may need extra calibration when expanding the spectral range.
Plans include expanding the model by integrating time-series features describing crop phenological changes and incorporating additional data sources—weather, soil-hydrological, and relief characteristics. This will improve the model's adaptability to seasonal and regional differences. Furthermore, a promising direction is the use of model-interpretation mechanisms (e.g., SHAP, LIME) to analyze the contribution of individual features and improve the explainability of decisions, especially when implementing intelligent systems in agricultural production processes. An important step will also be the implementation of an online version of the classifier as part of a GIS platform for operational field monitoring, integrated with UAV and IoT sensor databases. Further research will therefore aim to expand the spatiotemporal coverage, improve the robustness and interpretability of the proposed model, and adapt it for comprehensive analysis of crop conditions in real-world production settings.
6. Conclusions
In this paper, we proposed and implemented a two-level hybrid stacking model for automatic crop classification from multispectral orthomosaics acquired from uncrewed aerial vehicles. The approach combines the strengths of gradient boosting algorithms (LightGBM, XGBoost, CatBoost), tree ensembles (RandomForest, ExtraTrees), and a deep Attention-MLP, integrating their predictions via an ExtraTreesClassifier at the second level. This enabled the efficient use of both the original spectral channels and the calculated vegetation indices (NDVI, NDRE, GNDVI, SAVI, MSR, EVI, SIPI, MSAVI), along with their statistics (mean, std), forming a feature space of 28 parameters per patch. Experiments demonstrated the hybrid model's significant superiority over baseline algorithms across all key metrics: Accuracy ≈ 95%, LogLoss ≈ 0.156, and macro avg F1-score ≈ 0.95. A substantial reduction in errors (MSE, RMSE, MAE) and an increase in the determination coefficient (R² ≈ 82.6%) confirm the model's ability to account for complex nonlinear relationships between features and reliably handle high-dimensional, spectrally and spatially heterogeneous data. Particular attention was paid to the analysis of seasonal patterns in vegetation indices. The resulting violin diagrams and trends demonstrated characteristic differences between crops and survey months, emphasizing the importance of phenological information for constructing more informative classification features. This opens the door to integrating temporal and phenological features into future versions of the models. Visualization of spatial segmentation of orthomosaics demonstrated high accuracy (≈99%) and consistency of the predicted crop field maps, making the approach practical for agronomists and precision agriculture specialists. The ability to obtain such maps with georeferencing provides a convenient tool for crop monitoring, crop rotation planning, and early detection of problem areas.
Overall, the approach shows great potential for expanding to other crops and regions. It can also fit into digital farming systems. Future research could examine adding time-series imagery, using more spectral bands, and integrating with weather and soil data. This will lead to better yield forecasting and improve farming practices.
Author Contributions
Conceptualization, Aisulu Ismailova and Moldir Yessenova; methodology, Moldir Yessenova; software, Gulden Murzabekova; validation, Moldir Yessenova, Gulden Murzabekova, and Jamalbek Tussupov; formal analysis, Aisulu Ismailova; investigation, Moldir Yessenova and Gulden Murzabekova; resources, Jamalbek Tussupov; data curation, Moldir Yessenova; writing—original draft preparation, Moldir Yessenova; writing—review and editing, Aisulu Ismailova and Gulden Murzabekova; visualization, Gulden Murzabekova; supervision, Jamalbek Tussupov; project administration, Moldir Yessenova; funding acquisition, Moldir Yessenova. All authors have read and agreed to the published version of the manuscript.
Funding
«This research has been/was/is funded by the Science Committee of the Ministry of Education and Science of the Republic of Kazakhstan (Grant No. AP25793889 - Development of a System for Identifying Agricultural Crop Diseases and Pests Based on Artificial Intelligence) ».
Acknowledgments
The authors would like to express their sincere gratitude to Dr. Gulzira Abdikerimova for her valuable advice and constructive comments that significantly improved the quality of this work.
Conflicts of Interest
The authors declare no conflicts of interest.
Abbreviations
The following abbreviations are used in this manuscript:
| UAV | Unmanned Aerial Vehicle |
| NDVI | Normalized Difference Vegetation Index |
| SAVI | Soil Adjusted Vegetation Index |
| MSAVI | Modified Soil Adjusted Vegetation Index |
| EVI | Enhanced Vegetation Index |
| MSR | Modified Simple Ratio |
| GNDVI | Green Normalized Difference Vegetation Index |
| NDRE | Normalized Difference Red Edge Index |
| NIR | Near Infrared |
| MLP | Multilayer Perceptron |
| OOF | Out-Of-Fold (cross-validation prediction mechanism) |
References
- Shu, M.; Fei, S.; Zhang, B.; Yang, X.; Guo, Y.; Li, B.; Ma, Y. Application of UAV Multisensor Data and Ensemble Approach for High-Throughput Estimation of Maize Phenotyping Traits. Plant Phenomics 2022, 2022, 9802585. [CrossRef]
- Huang, D.; Hong, Y.; Li, J. Integrating UAV-Based Remote Sensing and Machine Learning to Monitor Rice Growth in Large-Scale Fields. Field Crop 2025, 8.
- Pádua, L.; Marques, P.; Martins, L.; Sousa, A.; Peres, E.; Sousa, J.J. Monitoring of Chestnut Trees Using Machine Learning Techniques Applied to UAV-Based Multispectral Data. Remote Sens. 2020, 12(18), 3032. [CrossRef]
- Tan, J.; Ding, J.; Li, J.; Han, L.; Cui, K.; Li, Y.; Zhang, Z. Advanced Dynamic Monitoring and Precision Analysis of Soil Salinity in Cotton Fields Using CNN-Attention and UAV Multispectral Imaging Integration. Land Degrad. Dev. 2025, 36(4), 5578. [CrossRef]
- Deng, H.; Zhang, W.; Zheng, X.; Zhang, H. Crop Classification Combining Object-Oriented Method and Random Forest Model Using Unmanned Aerial Vehicle (UAV) Multispectral Image. Agriculture 2024, 14(4), 548. [CrossRef]
- Zhang, Y.; Fu, B.; Sun, X.; Yao, H.; Zhang, S.; Wu, Y.; Deng, T. Effects of Multi-Growth-Periods UAV Images on Classifying Karst Wetland Vegetation Communities Using Object-Based Optimization Stacking Algorithm. Remote Sens. 2023, 15(16), 4003. [CrossRef]
- Miller, T.; Mikiciuk, G.; Durlik, I.; Mikiciuk, M.; Łobodzińska, A.; Śnieg, M. The IoT and AI in Agriculture: The Time Is Now—A Systematic Review of Smart Sensing Technologies. Sensors 2025, 25(12), 3583. [CrossRef]
- Chang, B.; Li, F.; Hu, Y.; Yin, H.; Feng, Z.; Zhao, L. Application of UAV Remote Sensing for Vegetation Identification: A Review and Meta-Analysis. Front. Plant Sci. 2025, 16, 1452053. [CrossRef]
- Wang, J.; Wang, Y.; Li, G.; Qi, Z. Integration of Remote Sensing and Machine Learning for Precision Agriculture: A Comprehensive Perspective on Applications. Agronomy 2024, 14(9), 1975. [CrossRef]
- Li, Z.; Zhou, X.; Cheng, Q.; Fei, S.; Chen, Z. A Machine-Learning Model Based on the Fusion of Spectral and Textural Features from UAV Multi-Sensors to Analyse the Total Nitrogen Content in Winter Wheat. Remote Sens. 2023, 15(8), 2152. [CrossRef]
- Yang, H.; Hu, Y.; Zheng, Z.; Qiao, Y.; Zhang, K.; Guo, T.; Chen, J. Estimation of Potato Chlorophyll Content from UAV Multispectral Images with Stacking Ensemble Algorithm. Agronomy 2022, 12(10), 2318. [CrossRef]
- Dimyati, M.; Supriatna, S.; Nagasawa, R.; Pamungkas, F.D.; Pramayuda, R. A Comparison of Several UAV-Based Multispectral Imageries in Monitoring Rice Paddy (A Case Study in Paddy Fields in Tottori Prefecture, Japan). ISPRS Int. J. Geo-Inf. 2023, 12(2), 36. [CrossRef]
- de Santana Correia, A.; Colombini, E.L. Attention, Please! A Survey of Neural Attention Models in Deep Learning. Artif. Intell. Rev. 2022, 55(8), 6037–6124. [CrossRef]
- Luo, C.; Li, H.; Zhang, J.; Wang, Y. OBViT: A High-Resolution Remote Sensing Crop Classification Model Combining OBIA and Vision Transformer. In Proc. 2023 11th Int. Conf. Agro-Geoinformatics; IEEE: Piscataway, NJ, USA, 2023; pp. 1–6. [CrossRef]
- Yang, S.; Li, L.; Fei, S.; Yang, M.; Tao, Z.; Meng, Y.; Xiao, Y. Wheat Yield Prediction Using Machine Learning Method Based on UAV Remote Sensing Data. Drones 2024, 8(7), 284. [CrossRef]
- Acosta, M.; Visconti, F.; Quiñones, A.; Blasco, J.; de Paz, J.M. Estimation of Macro and Micronutrients in Persimmon (Diospyros kaki L.) cv. ‘Rojo Brillante’ Leaves through VIS-NIR Reflectance Spectroscopy. Agronomy 2023, 13(4), 1105. [CrossRef]
- Zhai, W.; Li, C.; Cheng, Q.; Ding, F.; Chen, Z. Exploring Multisource Feature Fusion and Stacking Ensemble Learning for Accurate Estimation of Maize Chlorophyll Content Using Unmanned Aerial Vehicle Remote Sensing. Remote Sens. 2023, 15(13), 3454. [CrossRef]
- Qiao, L.; Tang, W.; Gao, D.; Zhao, R.; An, L.; Li, M.; Song, D. UAV-Based Chlorophyll Content Estimation by Evaluating Vegetation Index Responses under Different Crop Coverages. Comput. Electron. Agric. 2022, 196, 106775. [CrossRef]
- Zhang, P.; Lu, B.; Shang, J.; Wang, X.; Hou, Z.; Jin, S.; Zeng, Z. Ensemble Learning for Oat Yield Prediction Using Multi-Growth Stage UAV Images. Remote Sens. 2024, 16(23), 4575. [CrossRef]
- Wang, C.; Xu, X.; Zhang, Y.; Cao, Z.; Ullah, I.; Zhang, Z.; Miao, M. A Stacking Ensemble Learning Model Combining a Crop Simulation Model with Machine Learning to Improve the Dry Matter Yield Estimation of Greenhouse Pakchoi. Agronomy 2024, 14(8), 1789. [CrossRef]
- Nguyen Van, L.; Lee, G. Optimizing Stacked Ensemble Machine Learning Models for Accurate Wildfire Severity Mapping. Remote Sens. 2025, 17(5), 854. [CrossRef]
- Zhu, Z.; Chen, Y.; Lu, C.; Yang, M.; Xia, Y.; Huang, D.; Lv, J. Research on Crop Classification Using U-Net Integrated with Multimodal Remote Sensing Temporal Features. Sensors 2025, 25(16), 5005. [CrossRef]
- Qaadan, S.; Alshare, A.; Ahmed, A.; Altartouri, H. Stacked Ensembles Powering Smart Farming for Imbalanced Sugarcane Disease Detection. Appl. Sci. 2025, 15(5), 2788. [CrossRef]
- Maulit, A.; Nugumanova, A.; Apayev, K.; Baiburin, Y.; Sutula, M. A Multispectral UAV Imagery Dataset of Wheat, Soybean and Barley Crops in East Kazakhstan. Data 2023, 8(5), 88. [CrossRef]
Figure 1.
Scheme for calculating statistical features from a multispectral patch.
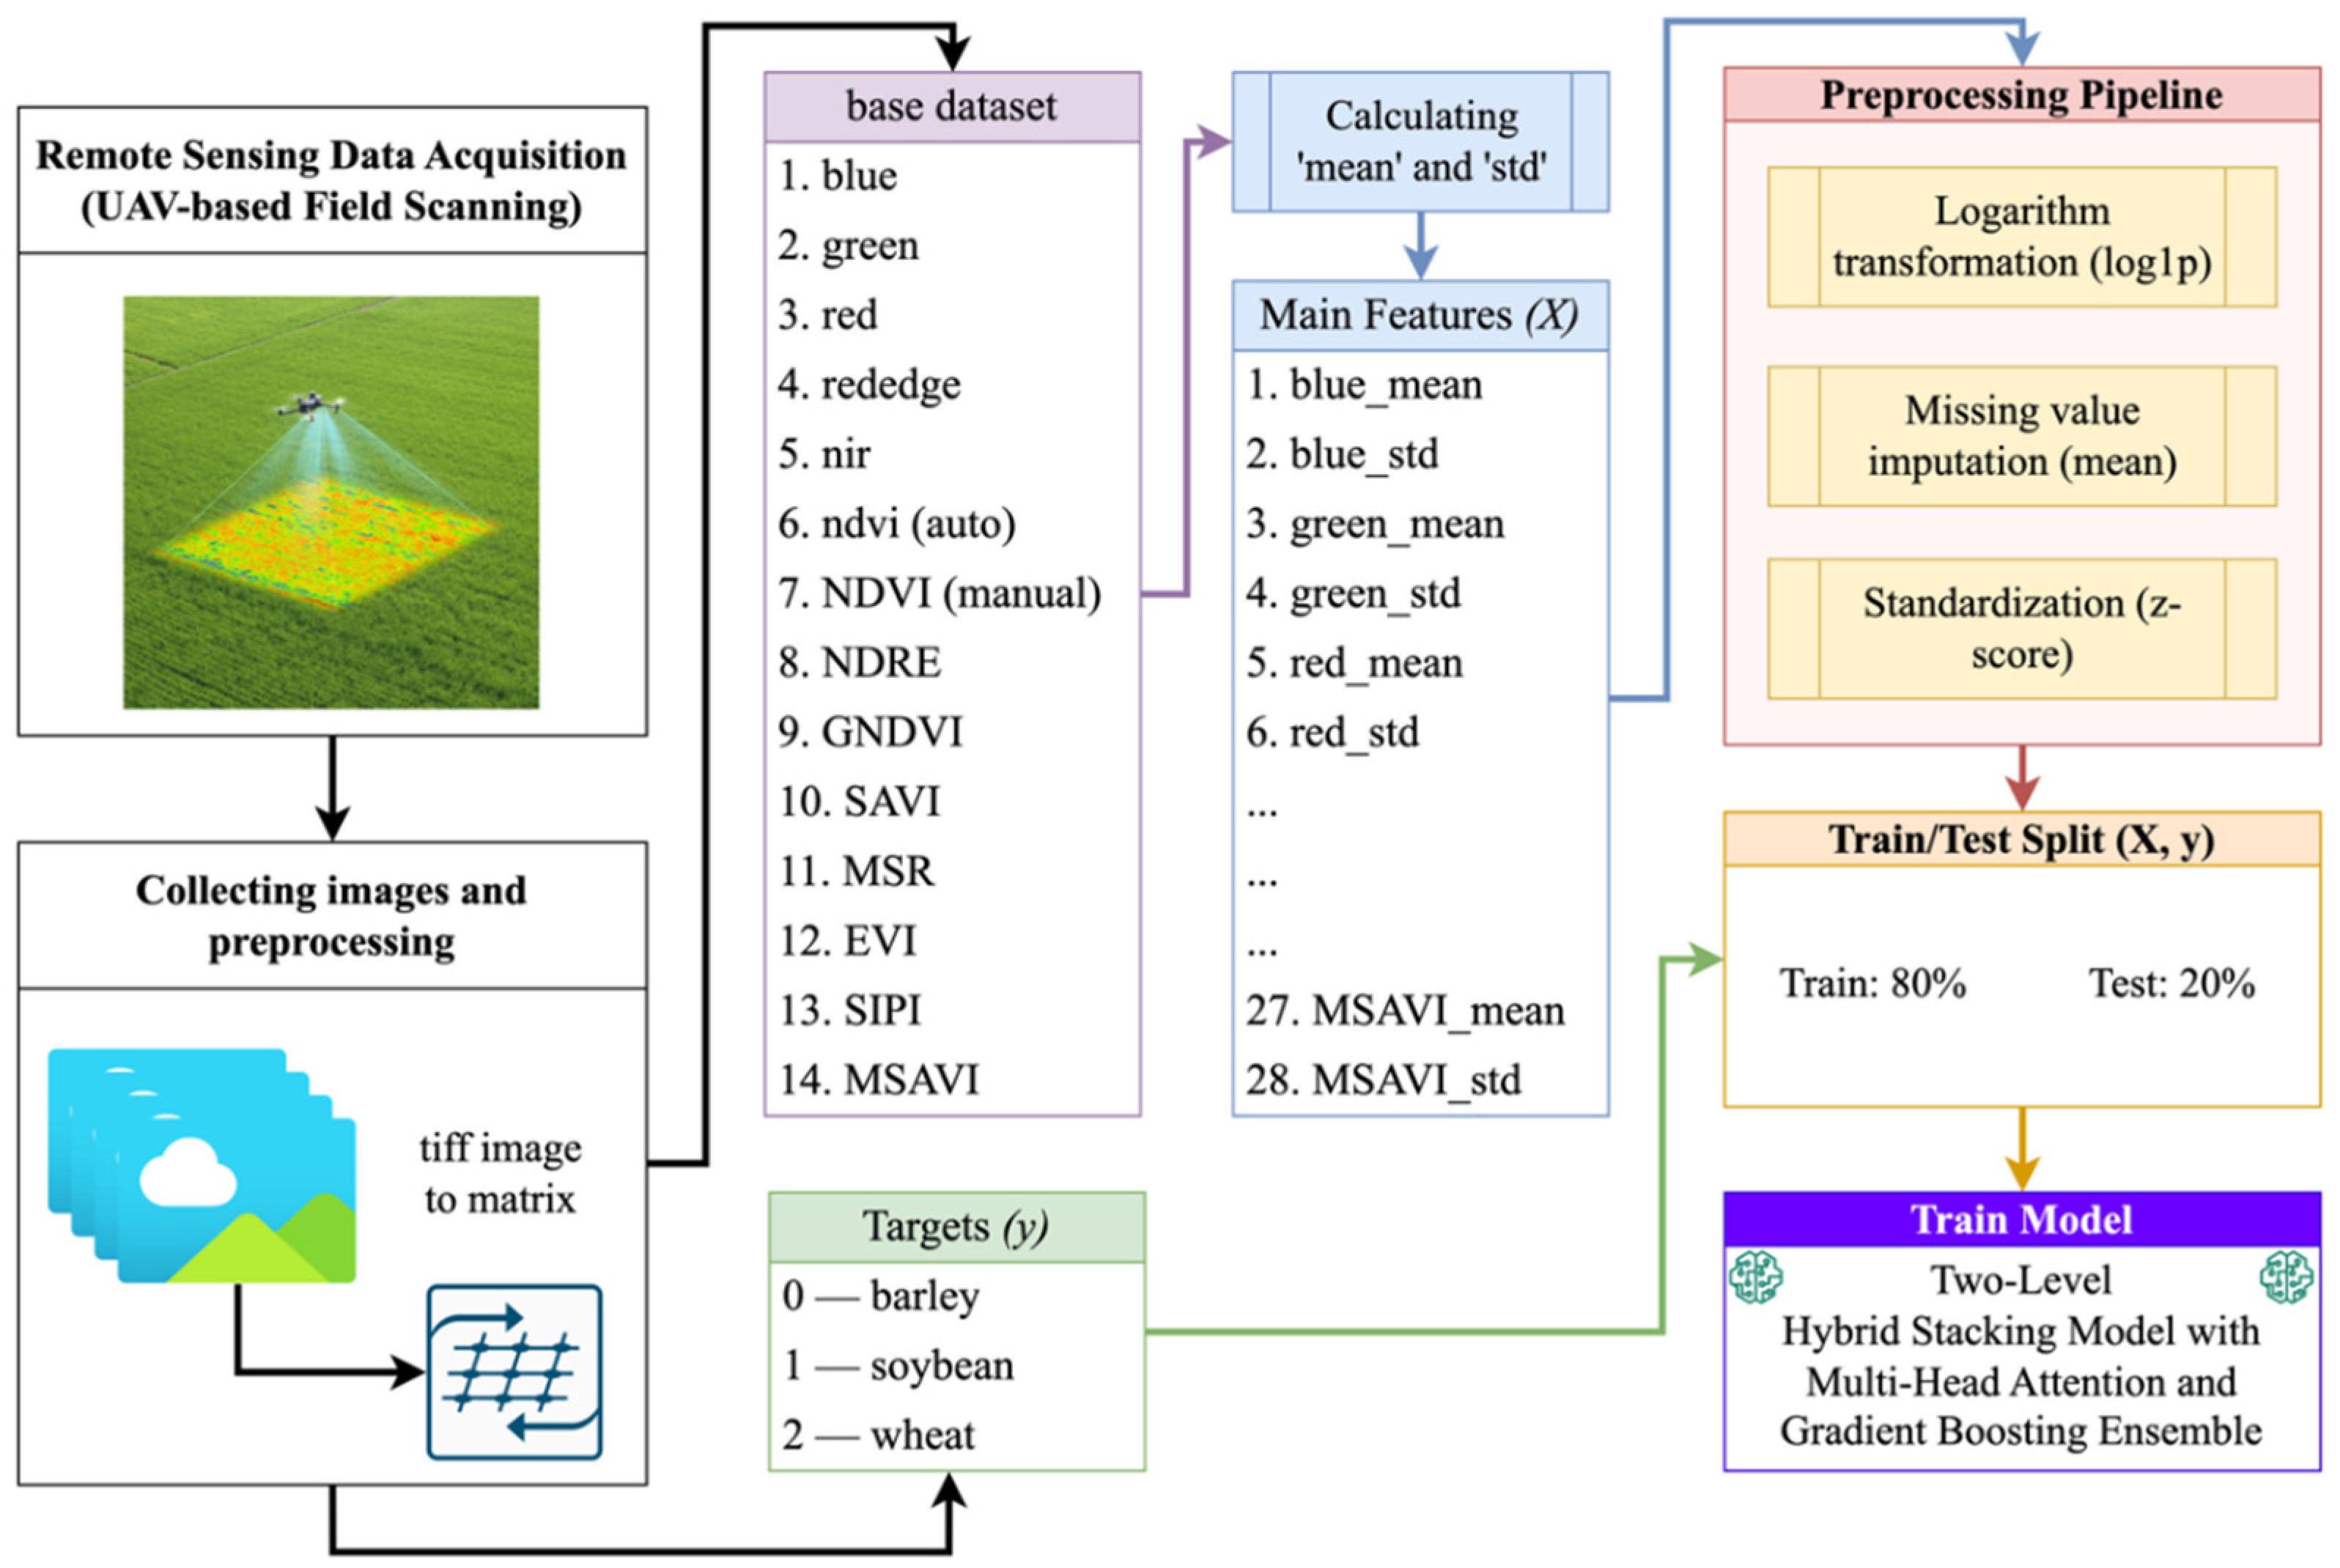
Figure 2.
Figure 2. Two-tier stacking architecture: base models → OOF generation → meta-model.

Figure 3.
Seasonal dynamics of vegetation indices for crops.
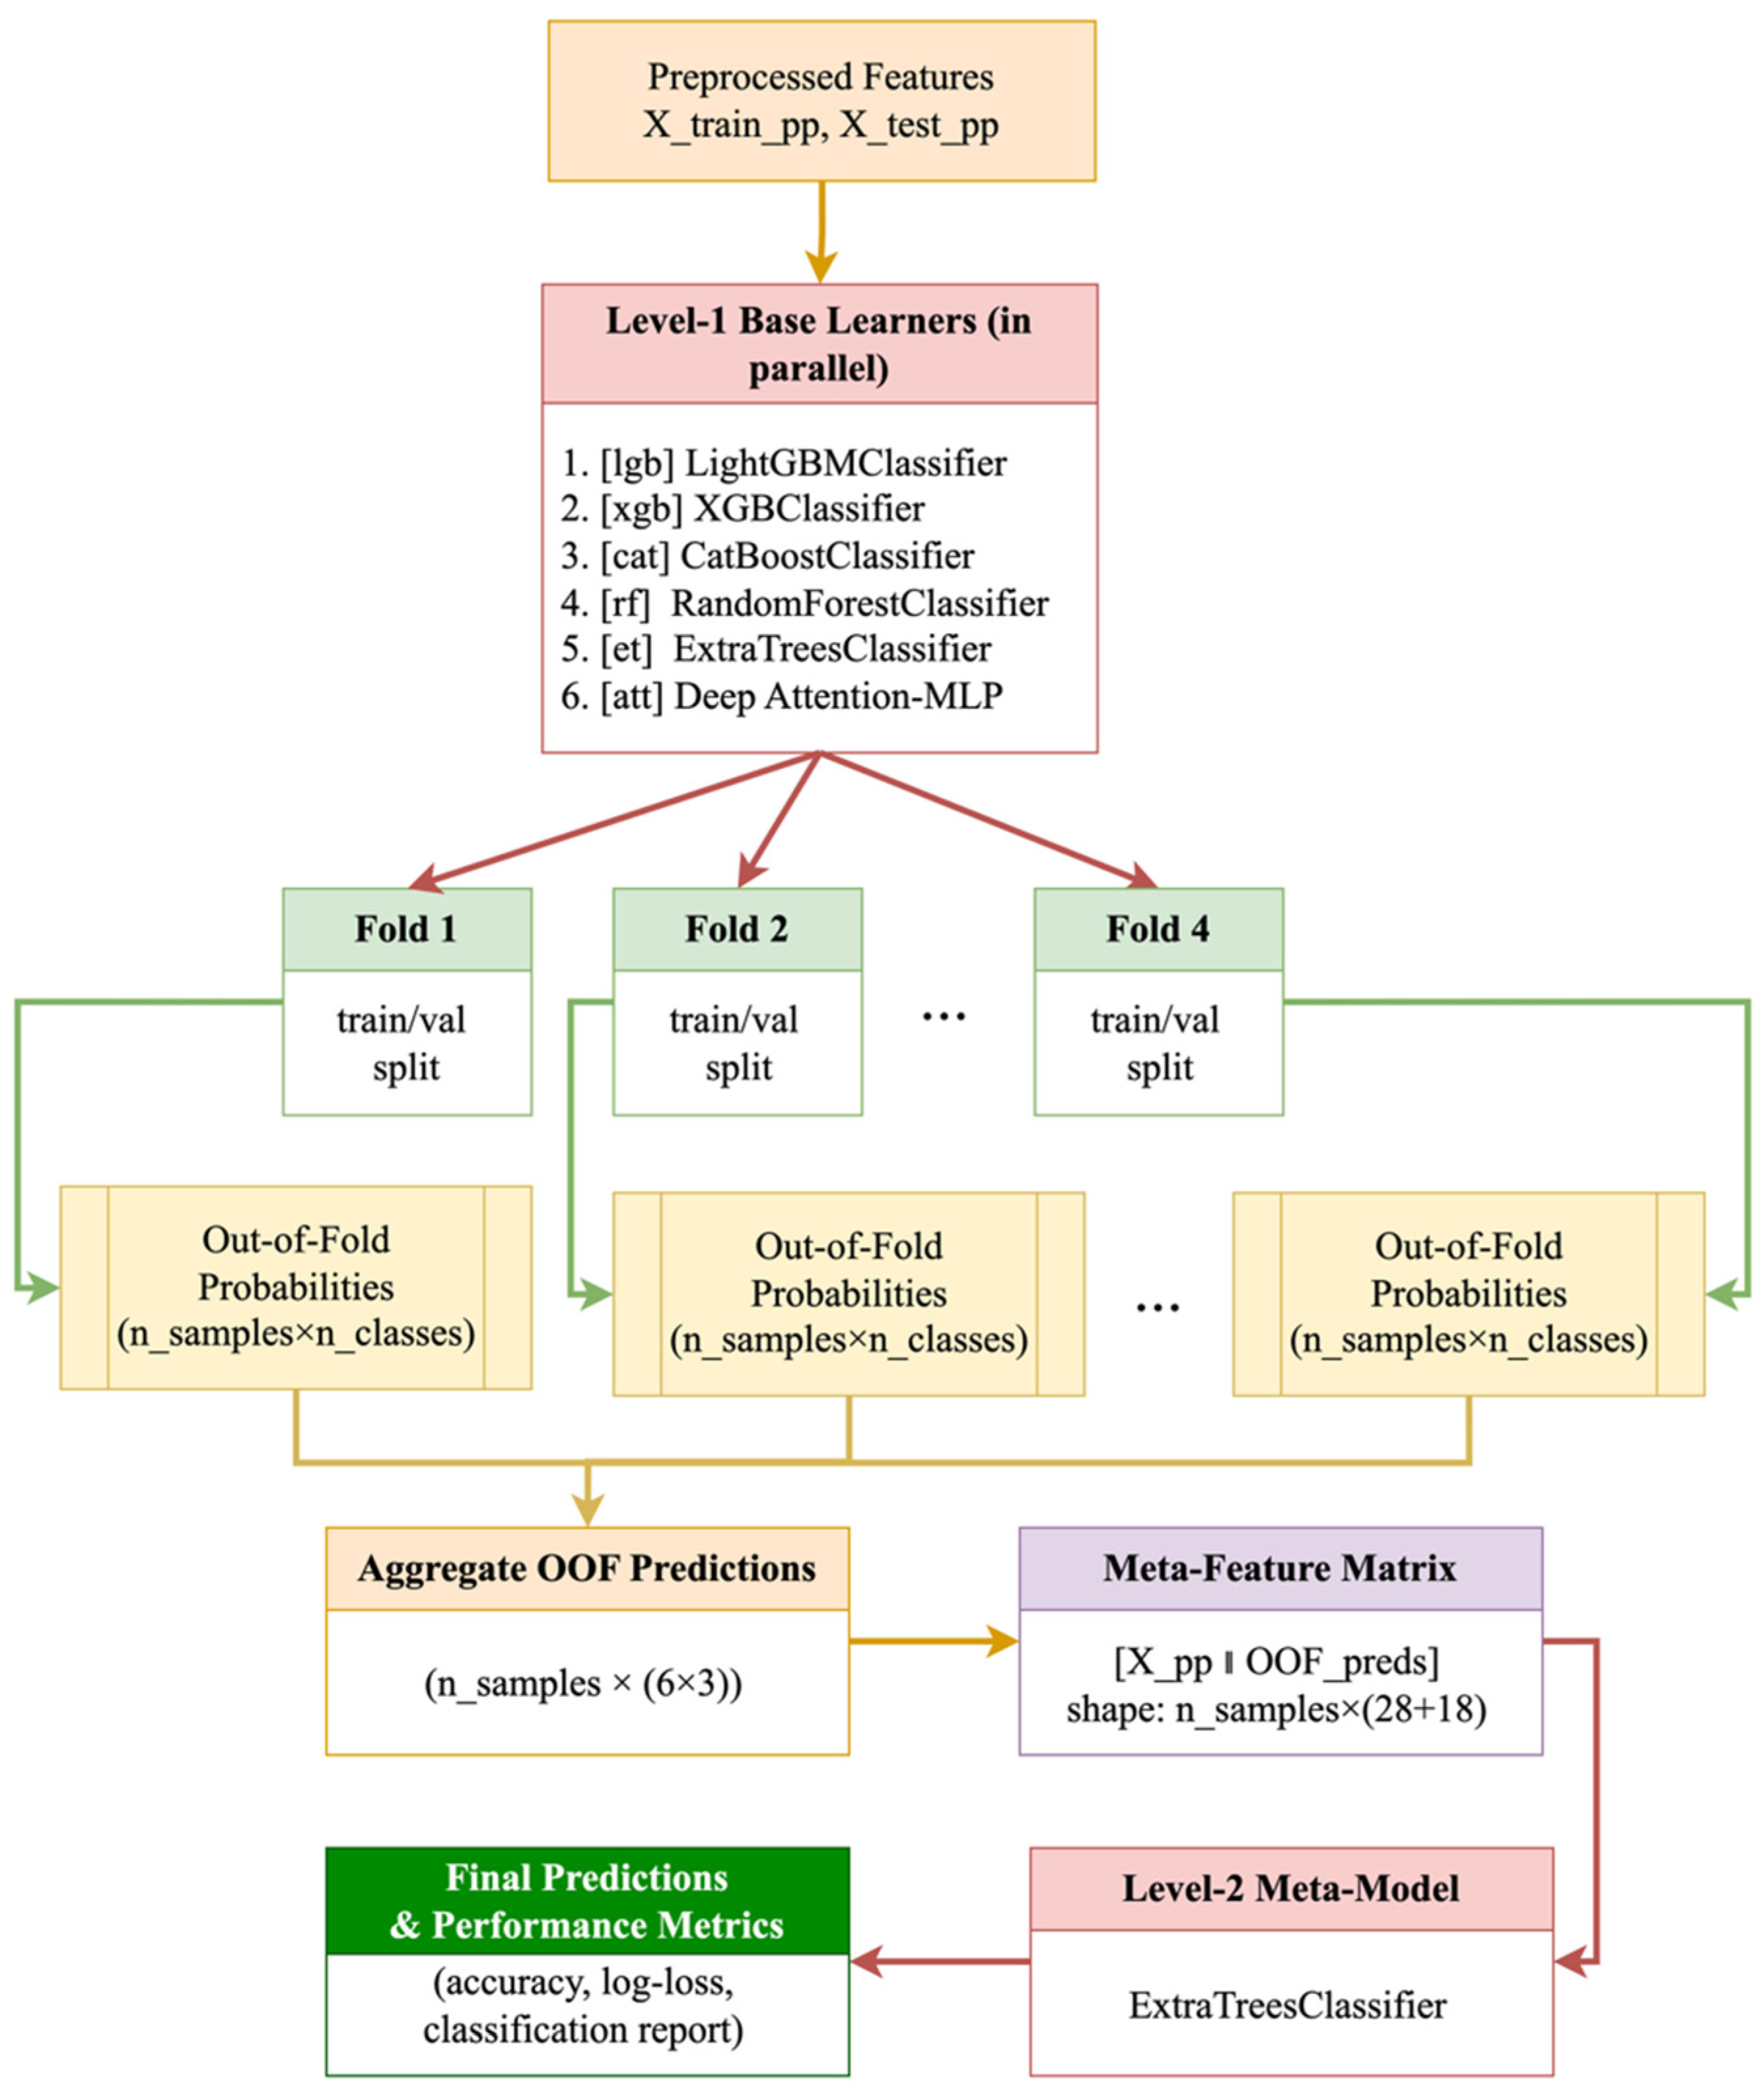
Figure 4.
Seasonal trends in vegetation indices by crop.
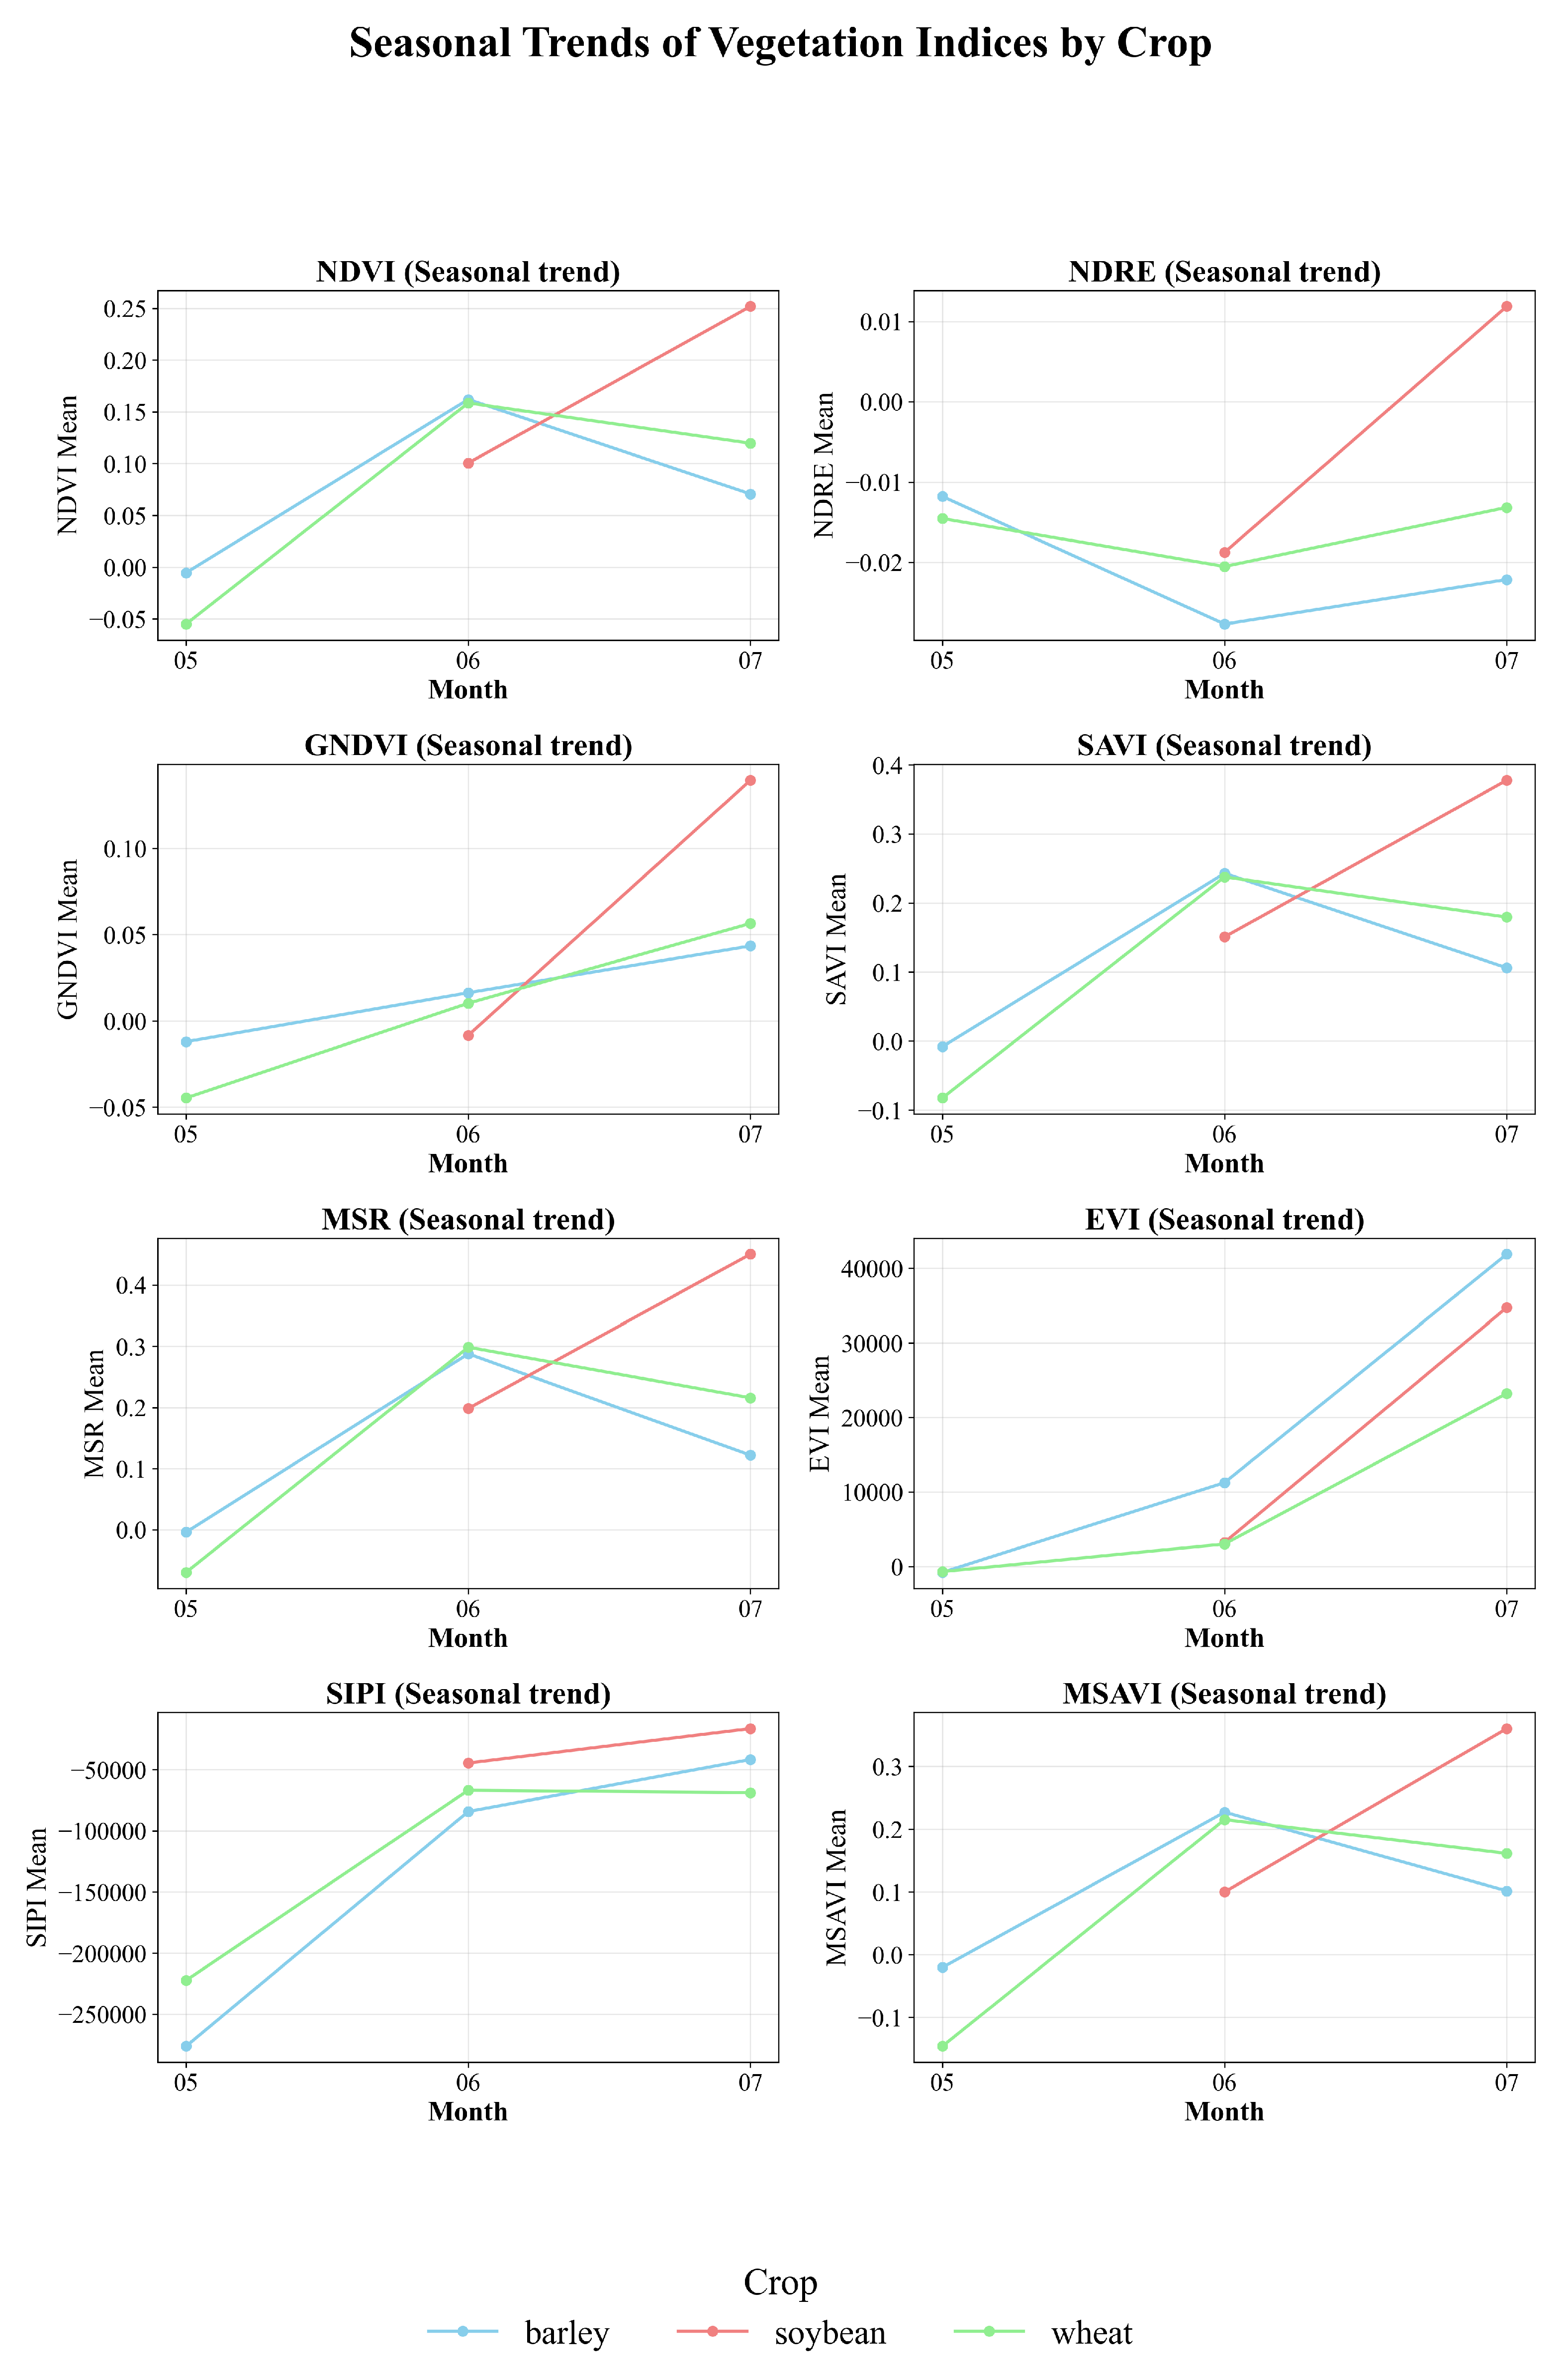
Figure 5.
Comparison of the Accuracy of the base models and the hybrid stacking model.
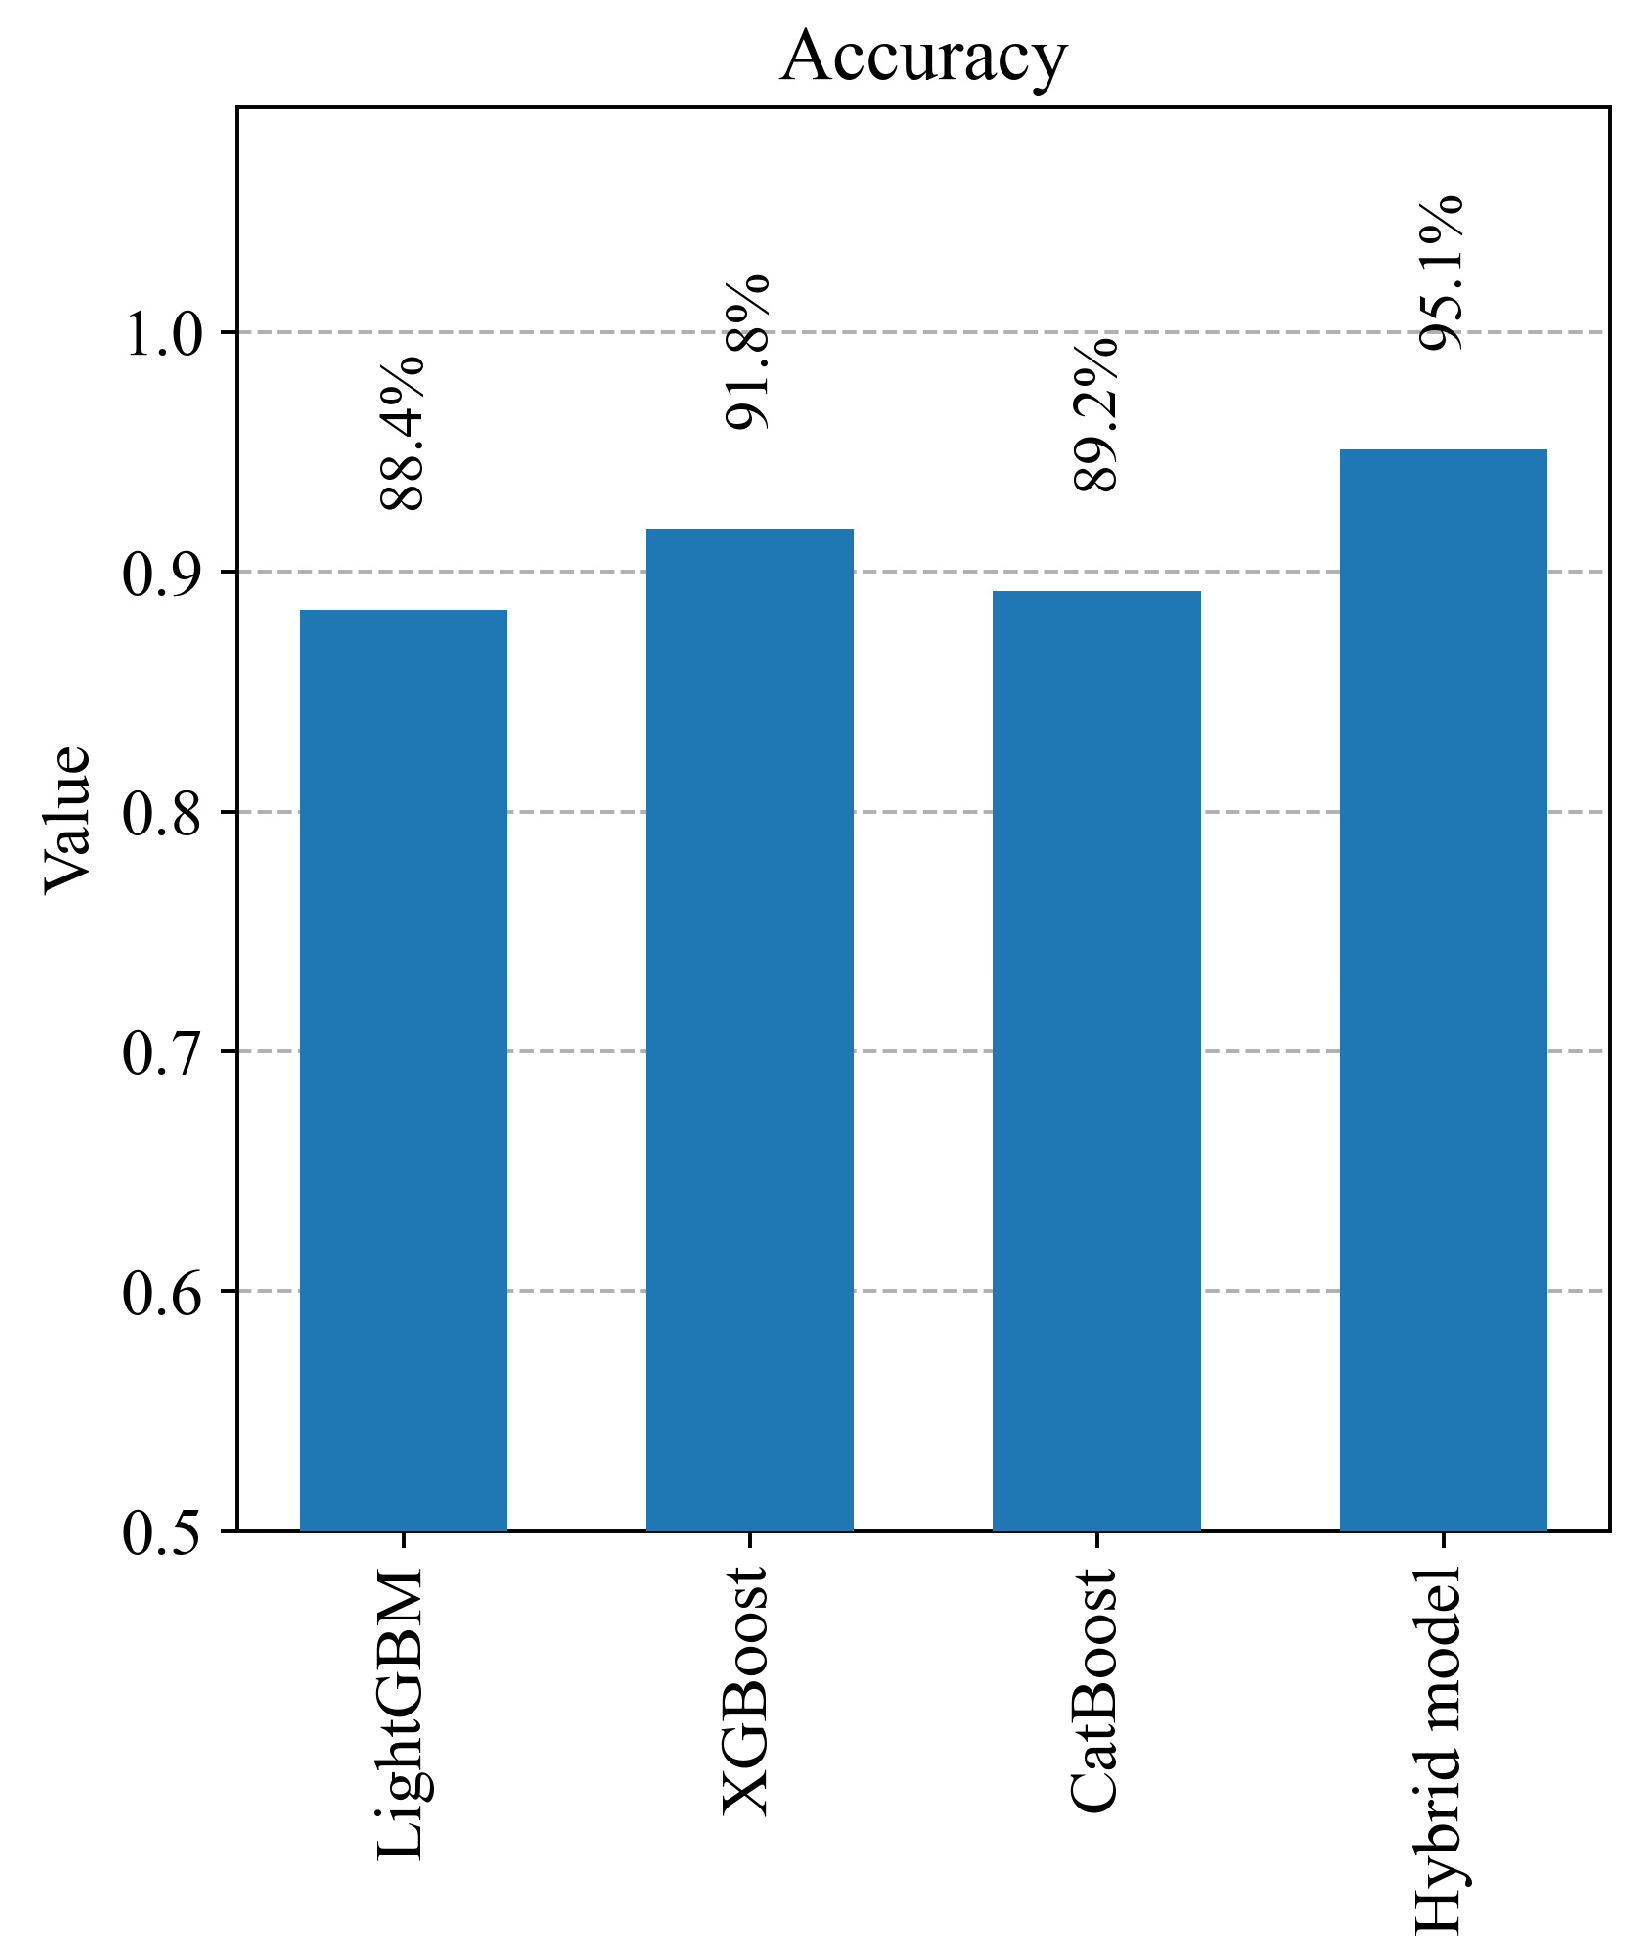
Figure 6.
Comparison of models by metrics.
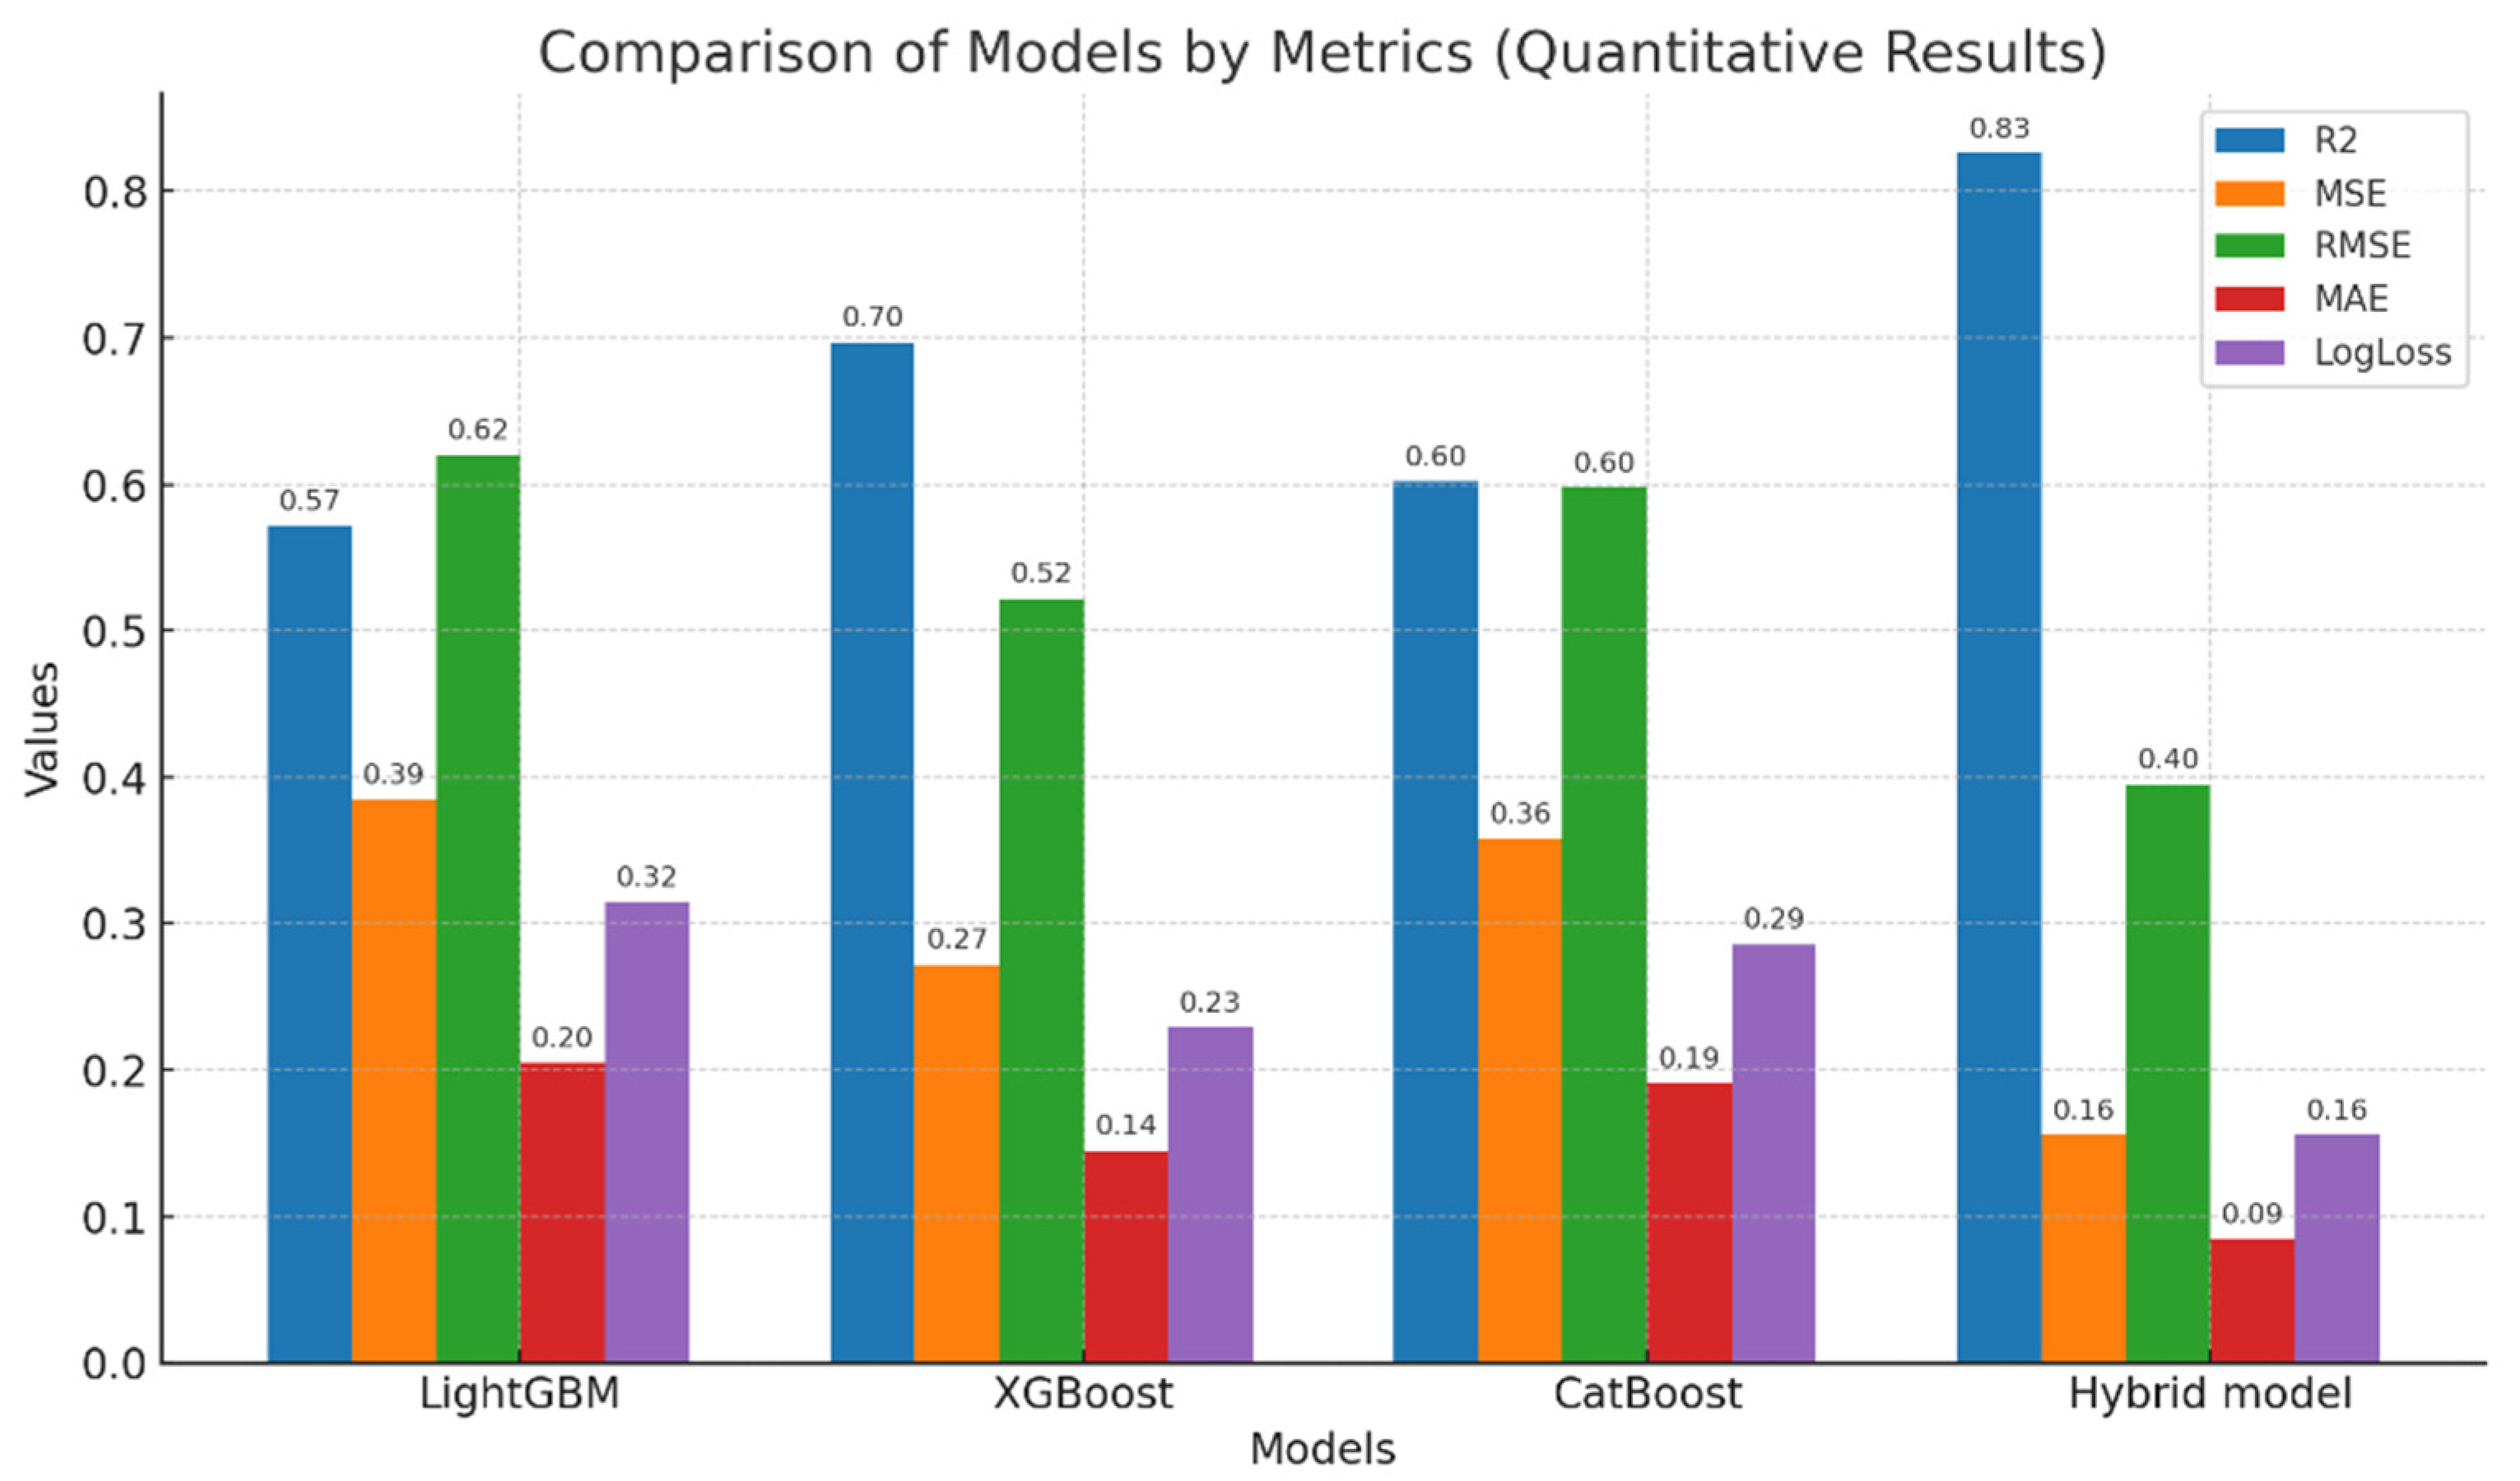
Figure 7.
Spatial segmentation of a barley crop plot.
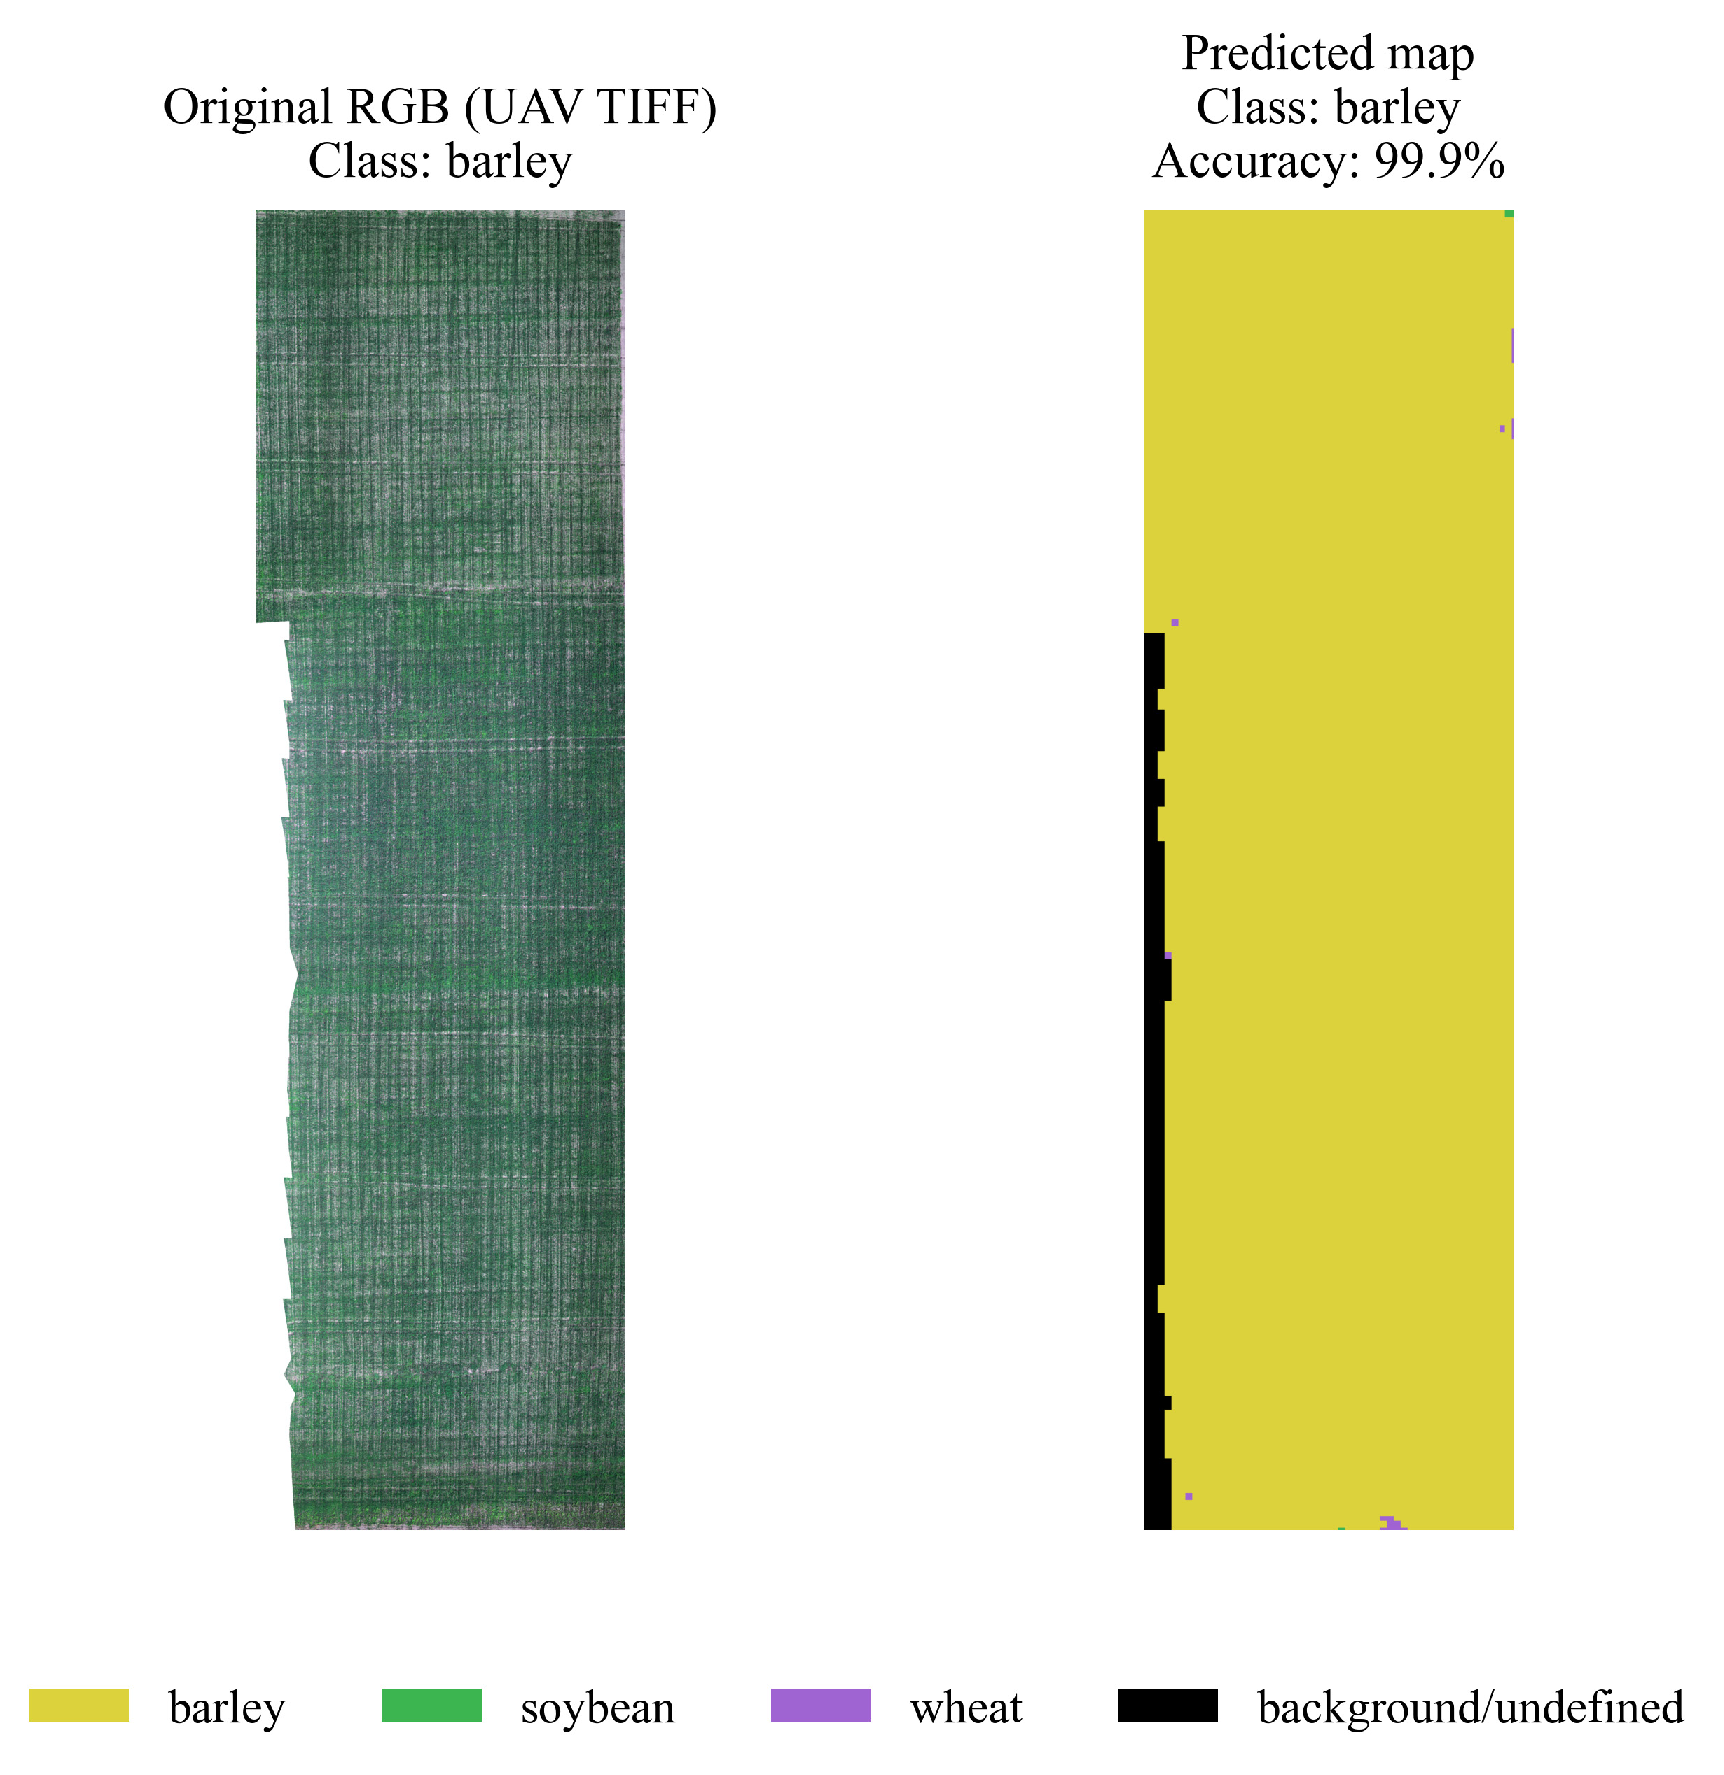
Figure 8.
Spatial segmentation of a barley crop plot.
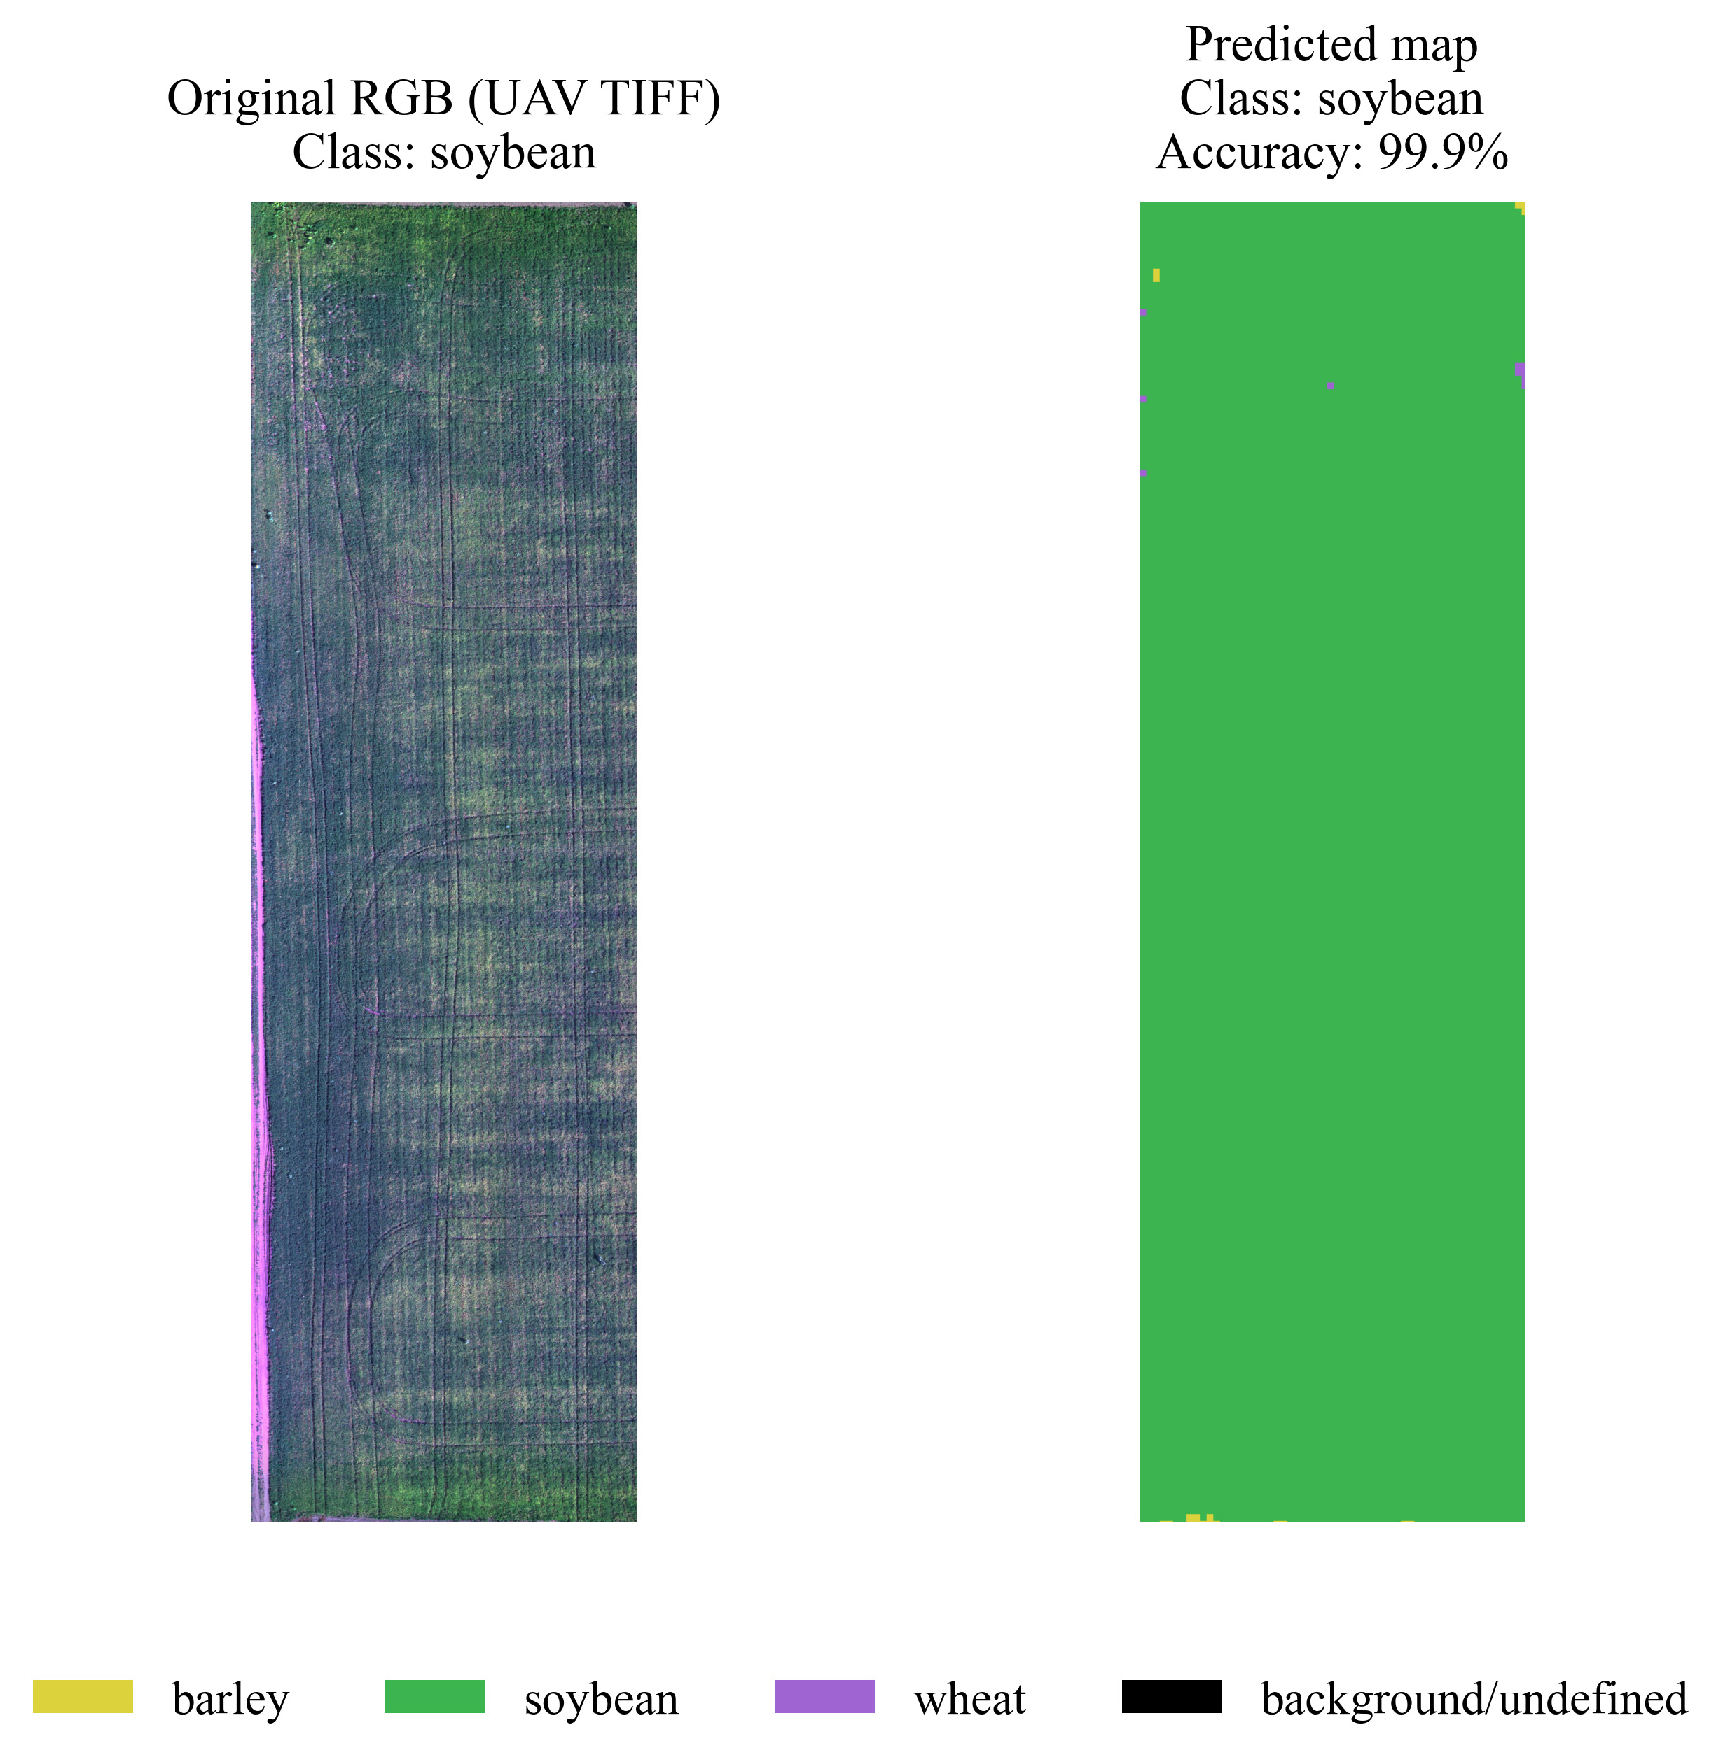
Figure 9.
Spatial segmentation of a plot with wheat crop.
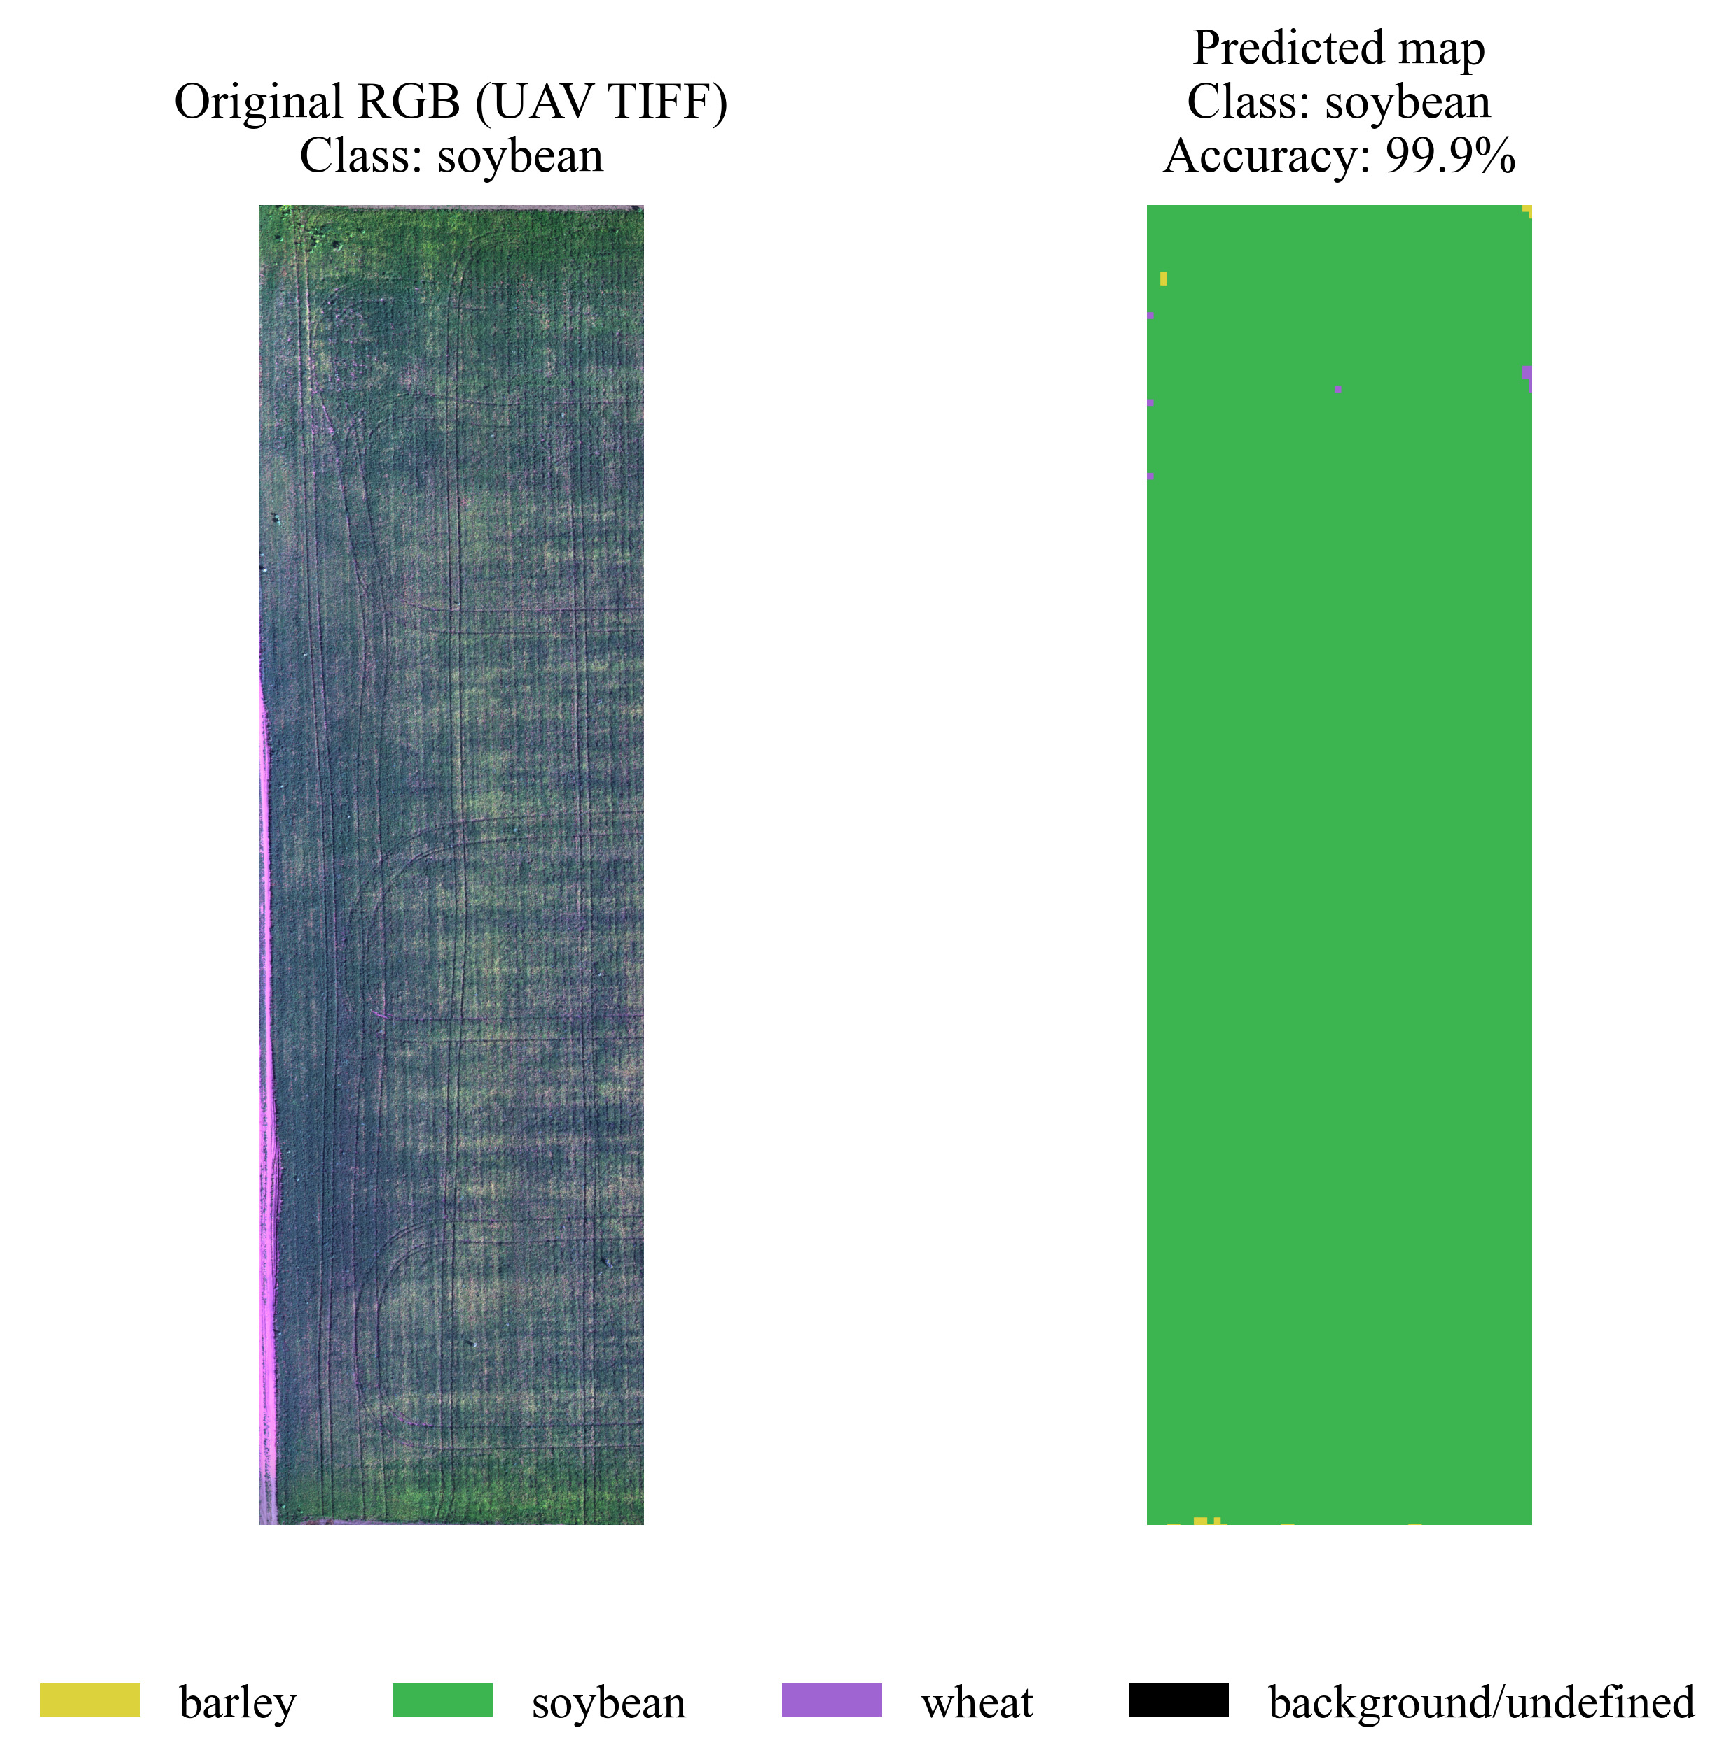

Table 1.
Average values of spectral channels by crops.
| Indicator | Barley | Soybean | Wheat |
| Blue, mean | 30294.74 | 31281.24 | 34236.00 |
| Blue, std | 5439.69 | 5634.40 | 4866.85 |
| Green, mean | 30626.37 | 31606.39 | 34063.71 |
| Green, std | 5785.33 | 6090.98 | 5120.80 |
| Red, mean | 27087.16 | 26084.46 | 29860.62 |
| Red, std | 6045.75 | 6157.13 | 5232.79 |
| RedEdge, mean | 33069.99 | 35576.38 | 36134.86 |
| RedEdge, std | 5402.41 | 5635.47 | 4580.95 |
| NIR, mean | 31737.90 | 35456.46 | 35132.80 |
| NIR, std | 5551.30 | 5691.14 | 4839.71 |
| NDVI, mean | 0.0910 | 0.1762 | 0.1003 |
| NDVI, std | 0.1079 | 0.1228 | 0.0948 |
Table 2.
Standard deviations of the mean values of spectral channels by crops.
| Indicator | Barley | Soybean | Wheat |
| Blue, mean (SD) | 6348.63 | 8735.04 | 10217.45 |
| Blue, std (SD) | 1700.65 | 2043.66 | 2235.90 |
| Green, mean (SD) | 5544.67 | 8419.40 | 10020.82 |
| Green, std (SD) | 1591.61 | 1801.59 | 2196.95 |
| Red, mean (SD) | 6860.20 | 10499.54 | 12214.14 |
| Red, std (SD) | 1953.69 | 2462.09 | 2602.48 |
| RedEdge, mean (SD) | 4630.23 | 6784.15 | 9465.18 |
| RedEdge, std (SD) | 1606.21 | 1942.92 | 2120.32 |
| NIR, mean (SD) | 4807.80 | 7226.45 | 9710.12 |
| NIR, std (SD) | 1661.03 | 1962.63 | 2152.67 |
| NDVI, mean (SD) | 0.1111 | 0.1668 | 0.1632 |
| NDVI, std (SD) | 0.0475 | 0.0506 | 0.0552 |
Table 3.
Average values of vegetation indices for crops.
| Index | Barley | Soybean | Wheat |
| NDVI, mean | 0.0910 | 0.1762 | 0.1003 |
| NDVI, std | 0.1079 | 0.1228 | 0.0948 |
| NDRE, mean | -0.0222 | -0.0034 | -0.0164 |
| NDRE, std | 0.0224 | 0.0223 | 0.0214 |
| GNDVI, mean | 0.0215 | 0.0655 | 0.0177 |
| GNDVI, std | 0.0700 | 0.0806 | 0.0640 |
| SAVI, mean | 0.1364 | 0.2644 | 0.1504 |
| SAVI, std | 0.1618 | 0.1843 | 0.1423 |
| MSR, mean | 0.1612 | 0.3244 | 0.1918 |
| MSR, std | 0.1822 | 0.2186 | 0.1637 |
| EVI, mean | 21243.96 | 18984.23 | 10364.94 |
| EVI, std | 2357625.00 | 1447696.00 | 1185393.00 |
| SIPI, mean | -105925.40 | -30491.88 | -98746.84 |
| SIPI, std | 8724567.00 | 2293828.00 | 6478547.00 |
| MSAVI, mean | 0.1259 | 0.2301 | 0.1215 |
| MSAVI, std | 0.1853 | 0.2124 | 0.1685 |
Table 4.
Standard deviations of the mean values of vegetation indices for crops.
| Index | Barley | Soybean | Wheat |
| NDVI, mean (SD) | 0.1111 | 0.1668 | 0.1632 |
| NDVI, std (SD) | 0.0475 | 0.0506 | 0.0552 |
| NDRE, mean (SD) | 0.0251 | 0.0291 | 0.0300 |
| NDRE, std (SD) | 0.0068 | 0.0072 | 0.0103 |
| GNDVI, mean (SD) | 0.0664 | 0.1178 | 0.0872 |
| GNDVI, std (SD) | 0.0273 | 0.0274 | 0.0335 |
| SAVI, mean (SD) | 0.1667 | 0.2502 | 0.2448 |
| SAVI, std (SD) | 0.0713 | 0.0759 | 0.0828 |
| MSR, mean (SD) | 0.1900 | 0.2877 | 0.3036 |
| MSR, std (SD) | 0.0897 | 0.0802 | 0.1009 |
| EVI, mean (SD) | 524423.20 | 499497.20 | 360916.60 |
| EVI, std (SD) | 33342580.00 | 31506620.00 | 22802270.00 |
| SIPI, mean (SD) | 455748.80 | 205095.20 | 383935.20 |
| SIPI, std (SD) | 24517450.00 | 12844970.00 | 20468290.00 |
| MSAVI, mean (SD) | 0.1955 | 0.3112 | 0.3350 |
| MSAVI, std (SD) | 0.0886 | 0.1425 | 0.2385 |
Table 5.
Key metrics for class and average classification.
| Metric | LightGBM | XGBoost | CatBoost | Hybrid model |
| Barley Precision | 0.88 | 0.92 | 0.89 | 0.96 |
| Barley Recall | 0.89 | 0.92 | 0.90 | 0.95 |
| Barley F1-score | 0.89 | 0.92 | 0.89 | 0.95 |
| Soybean Precision | 0.91 | 0.94 | 0.91 | 0.95 |
| Soybean Recall | 0.81 | 0.87 | 0.83 | 0.91 |
| Soybean F1-score | 0.86 | 0.90 | 0.87 | 0.93 |
| Wheat Precision | 0.88 | 0.92 | 0.89 | 0.95 |
| Wheat Recall | 0.89 | 0.92 | 0.90 | 0.96 |
| Wheat F1-score | 0.89 | 0.92 | 0.89 | 0.95 |
| Macro avg F1-score | 0.88 | 0.91 | 0.89 | 0.95 |
| Overall Accuracy | 0.88 | 0.92 | 0.89 | 0.95 |
Disclaimer/Publisher’s Note: The statements, opinions and data contained in all publications are solely those of the individual author(s) and contributor(s) and not of MDPI and/or the editor(s). MDPI and/or the editor(s) disclaim responsibility for any injury to people or property resulting from any ideas, methods, instructions or products referred to in the content. |
© 2025 by the authors. Licensee MDPI, Basel, Switzerland. This article is an open access article distributed under the terms and conditions of the Creative Commons Attribution (CC BY) license (http://creativecommons.org/licenses/by/4.0/).
Copyright: This open access article is published under a Creative Commons CC BY 4.0 license, which permit the free download, distribution, and reuse, provided that the author and preprint are cited in any reuse.


