
Submitted:
02 February 2025
Posted:
04 February 2025
You are already at the latest version
Abstract
Background: Human literature describes vascular patterns in various types of lung consolidations; however, these changes have not been analyzed in dogs and cats. This retrospective analysis of medical records aimed to describe vascular patterns observed in the airless subpleural lung tissue of dogs and cats and to compare these patterns to various lung consolidations and clinical diagnoses according to parenchymal and vascular criteria described in the human literature. Animals: 347 cats and 634 dogs. Methods: This was a retrospective study encompassing medical records obtained between 2018 and 2023. Lung ultrasound was performed in dogs and cats and cases with different sonographically identified airless subpleural lung tissue were selected. Lung consolidations were classified as shred, nodule, wedge sign, mass, and tissue sign. Further classification was based on the parenchymal criteria, the presence or absence of bronchograms and the vascular patterns identified within these regions. Bronchograms were classified as air bronchograms (dynamic and/or static), fluid bronchograms, mixed fluid and air bronchograms, and/or absence of bronchograms. Vascular patterns were classified as tree-like, residual, chaotic, “vascular sign,” and whether they were continuous with and extended from the chest wall or not. Conclusions and Clinical Importance: It is possible to identify and characterize airless subpleural lung tissue in cats and dogs based on the parenchymal and vascular characteristics.
Keywords:
Introduction
Materials and Methods
Study Population
Ultrasound Machine Settings and Probe Selection
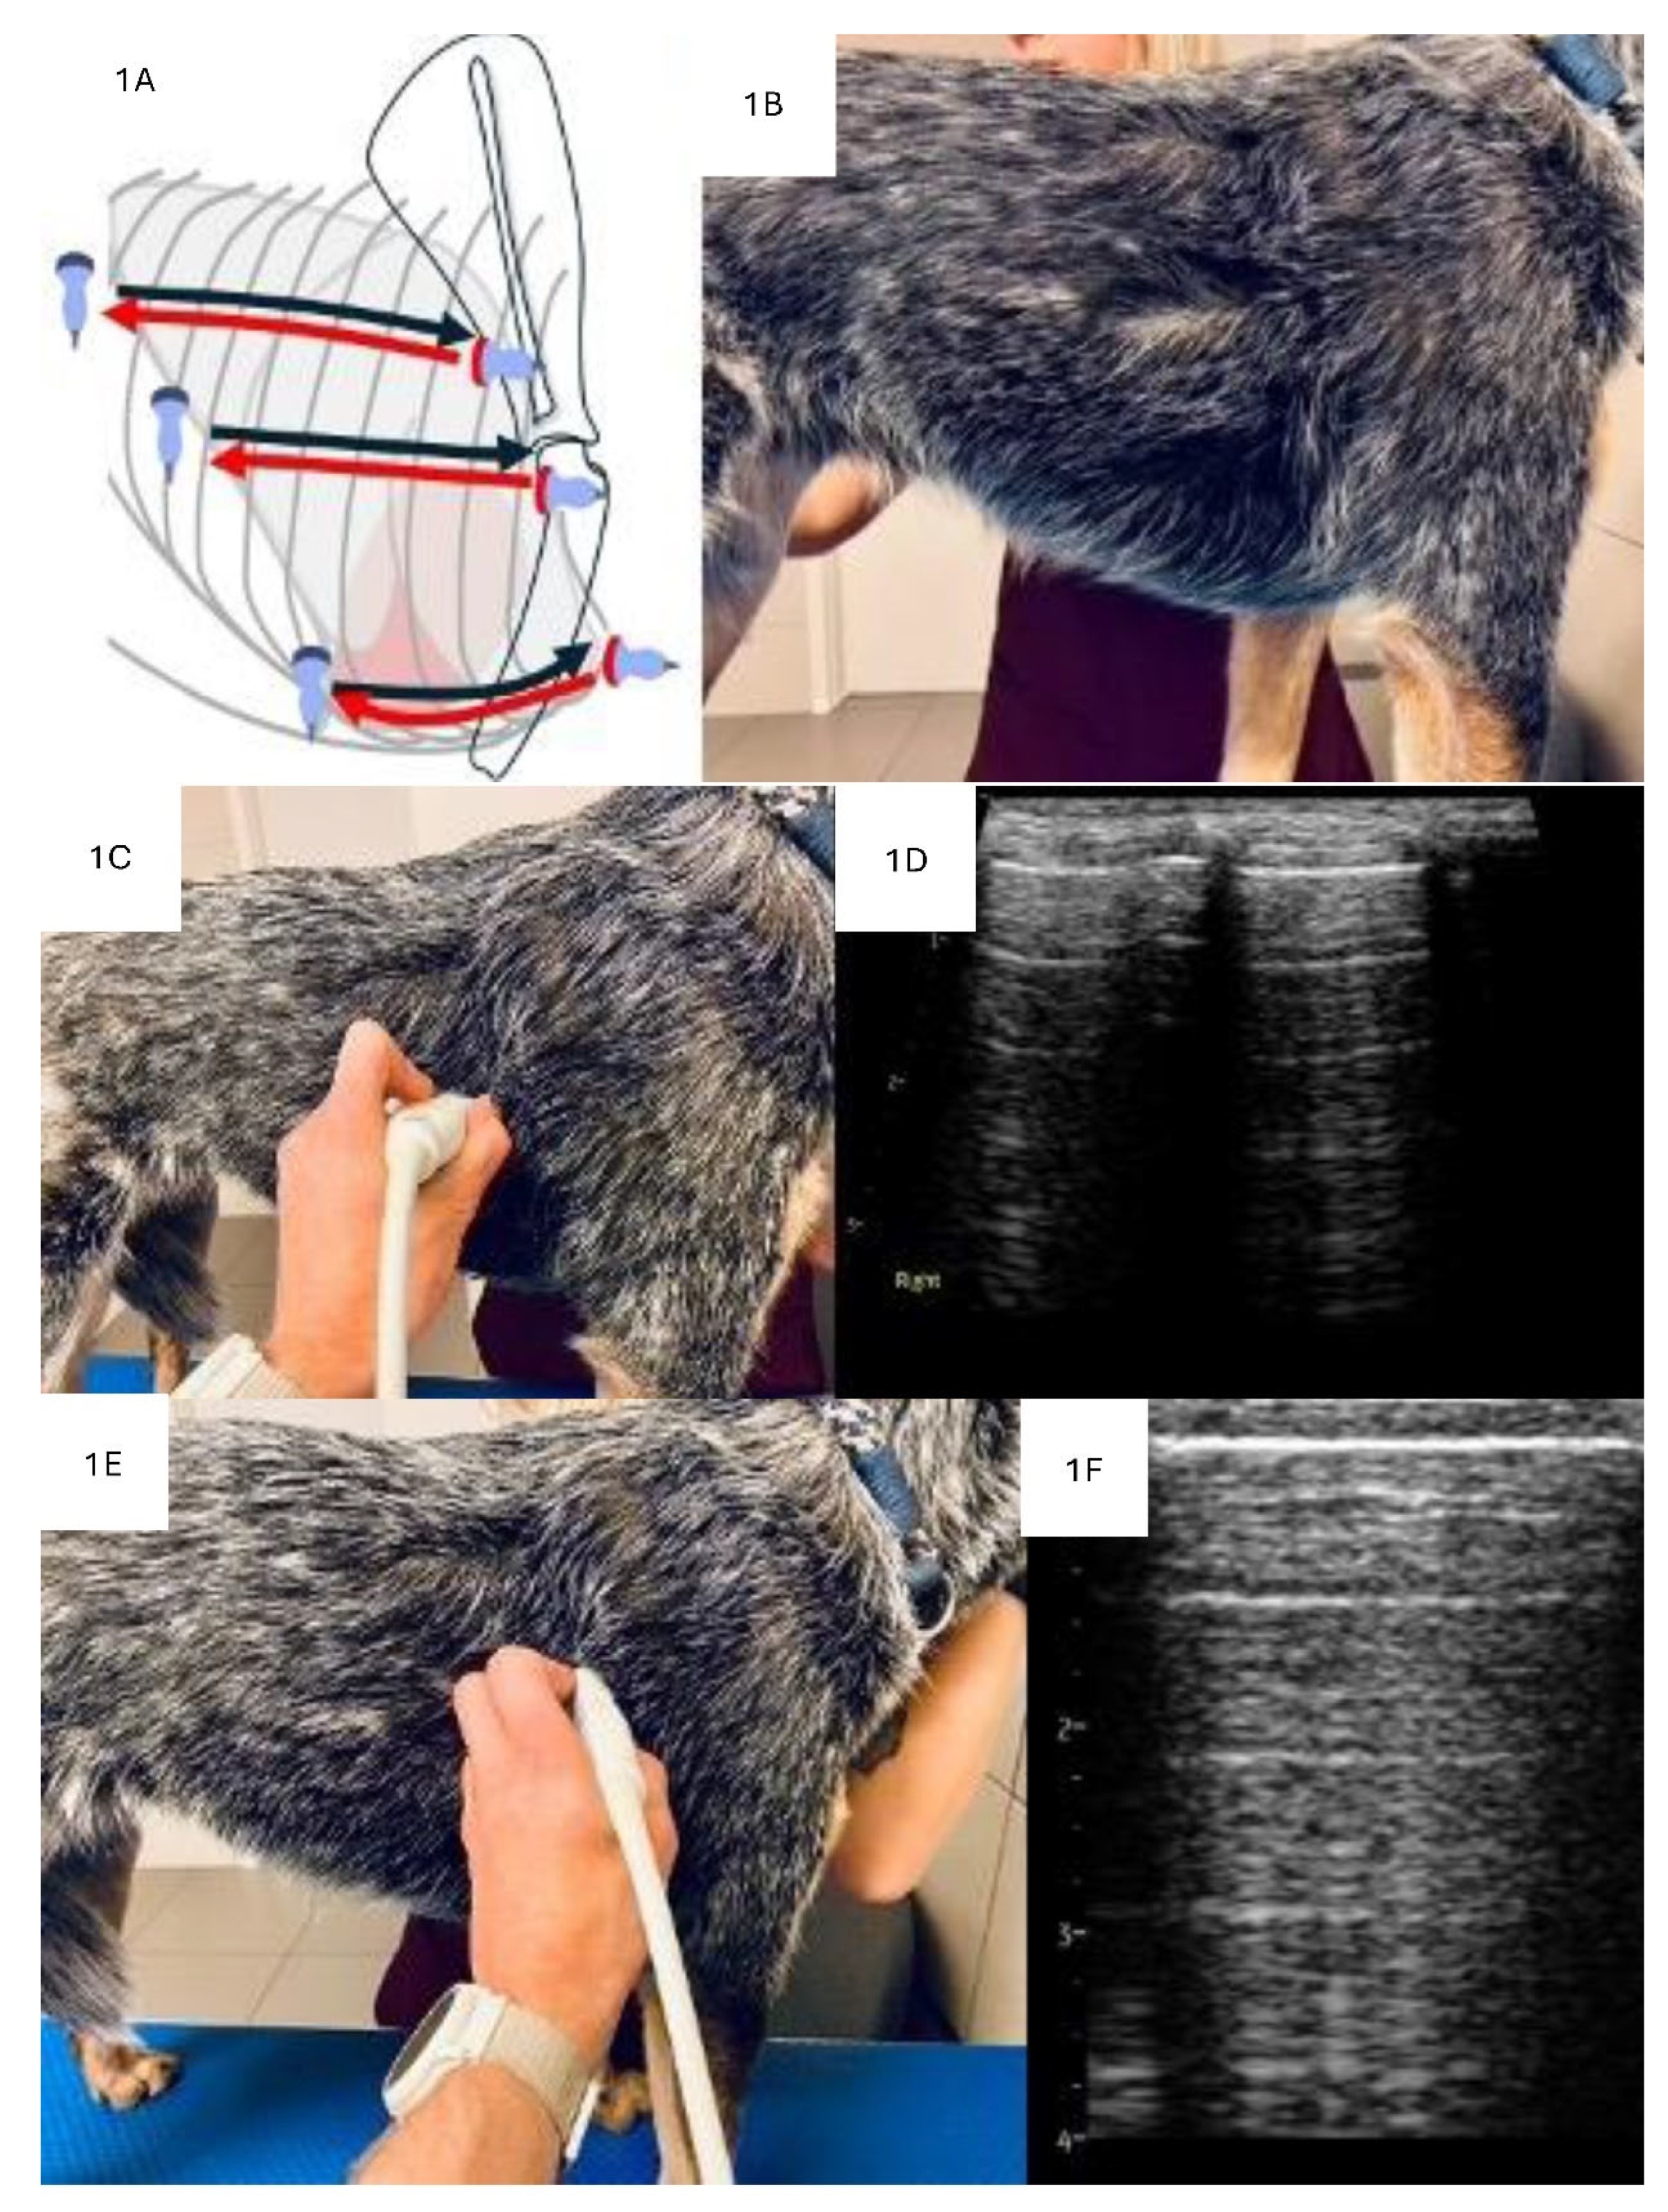
LUS Examination Technique
Analysis of Consolidations in 2D
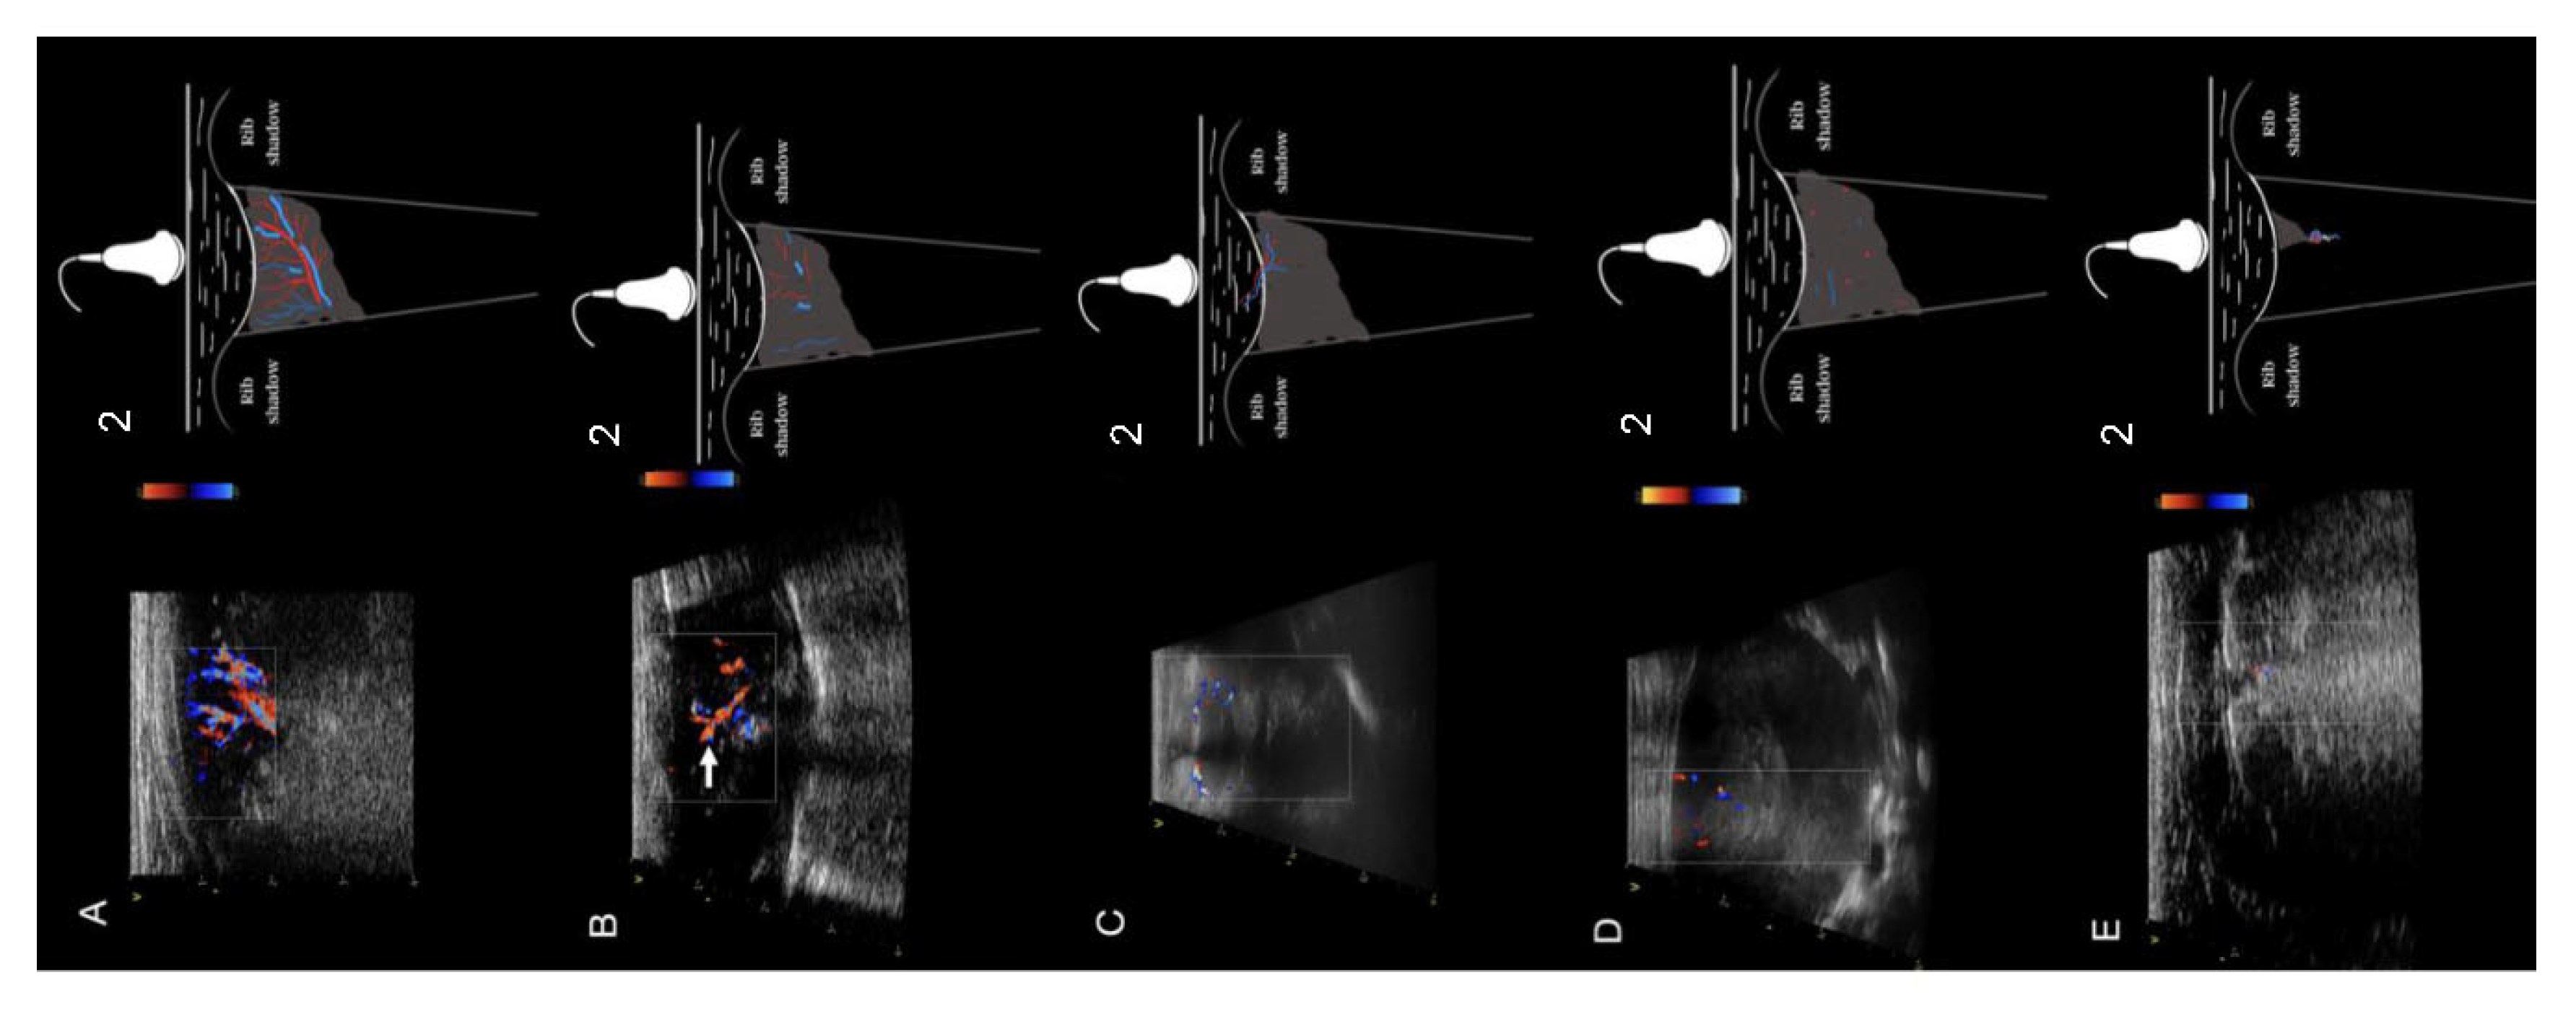
Analysis of Consolidations in Color/Power Doppler Mode
Diagnosis
Statistical Analysis
Results
Characteristics of the Study Group
Analysis of the Consolidations
Analysis of Bronchograms
Analysis of Vascularity
Analysis of Types of Consolidations in Terms of Diagnosis
Discussion
Conclusions
Supplementary Materials
Abbreviations
| ARDS | acute respiratory distress syndrome |
| BAL | bronchoalveolar lavage |
| CD | color doppler |
| CHF | congestive heart failure |
| CT | computed tomography |
| FNA | fine needle aspiration |
| LUS | lung ultrasound |
| M | mass |
| N | nodule type consolidation |
| PD | power doppler |
| PLD | parenchymal lung disease |
| PTE | pulmonary thromboembolism |
| TRX | thoracic radiograph |
| S | shred type consolidation |
| T | tissue type consolidation |
| W | wedge type consolidation |
References
- Pelchat, J.; Chalhoub, S.; Boysen, S.R. The use of veterinary point-of-care ultrasound by veterinarians: A nationwide Canadian survey. Can Vet J 2020, 61, 1278–1282. [Google Scholar] [PubMed]
- Ward, J.L.; DeFrancesco, T.C. The Role of Point-of-Care Ultrasound in Managing Cardiac Emergencies. Vet Clin North Am Small Anim Pract 2023. [Google Scholar] [CrossRef]
- Kraszewska K, G.M. , Boysen S. Case report: Application of color Doppler sonography for the assessment of pulmonary consolidations in a dog. Frontiers in Veterinary Science 2023, 10. [Google Scholar] [CrossRef] [PubMed]
- Fernandes Rodrigues, N.; Giraud, L.; Bolen, G.; Fastrès, A.; Clercx, C.; Boysen, S.; Billen, F.; Gommeren, K. Comparison of lung ultrasound, chest radiographs, C-reactive protein, and clinical findings in dogs treated for aspiration pneumonia. J Vet Intern Med 2022, 36, 743–752. [Google Scholar] [CrossRef] [PubMed]
- Venco, L.; Colaneri, G.; Formaggini, L.; De Franco, M.; Rishniw, M. Utility of thoracic ultrasonography in a rapid diagnosis of angiostrongylosis in young dogs presenting with respiratory distress. Vet J 2021, 271, 105649. [Google Scholar] [CrossRef]
- Łobaczewski, A.; Czopowicz, M.; Moroz, A.; Mickiewicz, M.; Sapierzyński, R.; Tarka, S.; Frymus, T.; Mądry, W.; Buczyński, M.; Szaluś-Jordanow, O. Integrated Basic Heart and Lung Ultrasound Examination for the Differentiation between Bacterial Pneumonia and Lung Neoplasm in Dogs-A New Diagnostic Algorithm. Animals (Basel) 2022, 12. [Google Scholar] [CrossRef]
- Lin, C.H.; Lo, P.Y.; Lam, M.C.; Wu, H.D. Usefulness of Chest Ultrasonography in Predicting Diagnosis in Non-emergency Small Animal Patients With Lung Parenchymal and Pleural Disease. Front Vet Sci 2020, 7, 616882. [Google Scholar] [CrossRef]
- Buda, N.; Kosiak, W.; Radzikowska, E.; Olszewski, R.; Jassem, E.; Grabczak, E.M.; Pomiecko, A.; Piotrkowski, J.; Piskunowicz, M.; Sołtysiak, M.; et al. Polish recommendations for lung ultrasound in internal medicine (POLLUS-IM). J Ultrason 2018, 18, 198–206. [Google Scholar] [CrossRef]
- Volpicelli, G.; Silva, F.; Radeos, M. Real-time lung ultrasound for the diagnosis of alveolar consolidation and interstitial syndrome in the emergency department. Eur J Emerg Med 2010, 17, 63–72. [Google Scholar] [CrossRef]
- Demi, L.; Wolfram, F.; Klersy, C.; De Silvestri, A.; Ferretti, V.V.; Muller, M.; Miller, D.; Feletti, F.; Welnicki, M.; Buda, N.; et al. New International Guidelines and Consensus on the Use of Lung Ultrasound. J Ultrasound Med 2023, 42, 309–344. [Google Scholar] [CrossRef]
- Copetti, R.; Soldati, G.; Copetti, P. Chest sonography: a useful tool to differentiate acute cardiogenic pulmonary edema from acute respiratory distress syndrome. Cardiovasc Ultrasound 2008, 6, 16. [Google Scholar] [CrossRef] [PubMed]
- Huang, D.; Ma, H.; Xiao, Z.; Blaivas, M.; Chen, Y.; Wen, J.; Guo, W.; Liang, J.; Liao, X.; Wang, Z.; et al. Diagnostic value of cardiopulmonary ultrasound in elderly patients with acute respiratory distress syndrome. BMC Pulm Med 2018, 18, 136. [Google Scholar] [CrossRef] [PubMed]
- Lichtenstein, D.A.; Mezière, G.A. Relevance of lung ultrasound in the diagnosis of acute respiratory failure: the BLUE protocol. Chest 2008, 134, 117–125. [Google Scholar] [CrossRef] [PubMed]
- Kameda, T.; Kamiyama, N.; Taniguchi, N. The Mechanisms Underlying Vertical Artifacts in Lung Ultrasound and Their Proper Utilization for the Evaluation of Cardiogenic Pulmonary Edema. Diagnostics (Basel) 2022, 12. [Google Scholar] [CrossRef]
- Schmickl, C.N.; Menon, A.A.; Dhokarh, R.; Seth, B.; Schembri, F. Optimizing B-lines on lung ultrasound: an in-vitro to in-vivo pilot study with clinical implications. J Clin Monit Comput 2020, 34, 277–284. [Google Scholar] [CrossRef]
- Matthias, I.; Panebianco, N.L.; Maltenfort, M.G.; Dean, A.J.; Baston, C. Effect of Machine Settings on Ultrasound Assessment of B-lines. J Ultrasound Med 2020, 40, 2039–2046. [Google Scholar] [CrossRef]
- Yuan, A.; Yang, P.C.; Lee, L.; Wu, H.D.; Kuo, S.H.; Luh, K.T.; Chen, W.J.; Lin, F.Y. Reactive pulmonary artery vasoconstriction in pulmonary consolidation evaluated by color Doppler ultrasonography. Ultrasound Med Biol 2000, 26, 49–56. [Google Scholar] [CrossRef]
- Luis Fuentes, V.; Abbott, J.; Chetboul, V.; Cote, E.; Fox, P.R.; Haggstrom, J.; Kittleson, M.D.; Schober, K.; Stern, J.A. ACVIM consensus statement guidelines for the classification, diagnosis, and management of cardiomyopathies in cats. J Vet Intern Med 2020, 34, 1062–1077. [Google Scholar] [CrossRef]
- Reinero, C.; Visser, L.C.; Kellihan, H.B.; Masseau, I.; Rozanski, E.; Clercx, C.; Williams, K.; Abbott, J.; Borgarelli, M.; Scansen, B.A. ACVIM consensus statement guidelines for the diagnosis, classification, treatment, and monitoring of pulmonary hypertension in dogs. J Vet Intern Med 2020, 34, 549–573. [Google Scholar] [CrossRef]
- Lichtenstein, D.A. Lung Ultrasound in the Critically III; Springer: London, UK, 2016; p. 376. [Google Scholar] [CrossRef]
- Lisciandro, G.R.; Lisciandro, S.C. Lung Ultrasound Fundamentals, "Wet Versus Dry" Lung, Signs of Consolidation in Dogs and Cats. Vet Clin North Am Small Anim Pract 2021, 51, 1125–1140. [Google Scholar] [CrossRef]
- Lisciandro, G.R.; Puchot, M.L.; Gambino, J.M.; Lisciandro, S.C. The wedge sign: A possible lung ultrasound sign for pulmonary thromboembolism. J Vet Emerg Crit Care (San Antonio) 2022. [Google Scholar] [CrossRef] [PubMed]
- Boysen, R.S.C., S. Gommeren, K. The Essentials of Veterinary Point of Care Ultrasound: Pleural Space and Lung; Edra Publishing 2022.
- Yang, P.C.; Luh, K.T.; Wu, H.D.; Chang, D.B.; Lee, L.N.; Kuo, S.H.; Yang, S.P. Lung tumors associated with obstructive pneumonitis: US studies. Radiology 1990, 174, 717–720. [Google Scholar] [CrossRef] [PubMed]
- Gorg, C.; Seifart, U.; Gorg, K.; Zugmaier, G. Color Doppler sonographic mapping of pulmonary lesions: evidence of dual arterial supply by spectral analysis. J Ultrasound Med 2003, 22, 1033–1039. [Google Scholar] [CrossRef] [PubMed]
- Yuan, A.; Yang, P.C.; Chang, D.B. Pulmonary infarction: use of color Doppler sonography for diagnosis and assessment of reperfusion of the lung. AJR Am J Roentgenol 1993, 160, 419–420. [Google Scholar] [CrossRef]
- Buda, N.; Kosiak, W. Is a linear probe helpful in diagnosing diseases of pulmonary interstitial spaces? J Ultrason 2017, 17, 136–141. [Google Scholar] [CrossRef]
- Sripathi, S.; Mahajan, A. Comparative study evaluating the role of color Doppler sonography and computed tomography in predicting chest wall invasion by lung tumors. J Ultrasound Med 2013, 32, 1539–1546. [Google Scholar] [CrossRef]
- Yuan, A.; Chang, D.B.; Yu, C.J.; Kuo, S.H.; Luh, K.T.; Yang, P.C. Color Doppler sonography of benign and malignant pulmonary masses. AJR Am J Roentgenol 1994, 163, 545–549. [Google Scholar] [CrossRef]
- Gorg, C.; Bert, T. Transcutaneous colour Doppler sonography of lung consolidations: review and pictorial essay. Part 1: pathophysiologic and colour Doppler sonographic basics of pulmonary vascularity. Ultraschall Med 2004, 25, 221–226. [Google Scholar] [CrossRef]
- Buda, N.; Kosiak, W.; Wełnicki, M.; Skoczylas, A.; Olszewski, R.; Piotrkowski, J.; Skoczyński, S.; Radzikowska, E.; Jassem, E.; Grabczak, E.M.; et al. Recommendations for Lung Ultrasound in Internal Medicine. Diagnostics (Basel) 2020, 10. [Google Scholar] [CrossRef]
- Rick, T.; Kleiter, M.; Schwendenwein, I.; Ludewig, E.; Reifinger, M.; Hittmair, K.M. Contrast-enhanced ultrasonography characteristics of intrathoracic mass lesions in 36 dogs and 24 cats. Vet Radiol Ultrasound 2019, 60, 56–64. [Google Scholar] [CrossRef]
- Linta, N.; Baron Toaldo, M.; Bettini, G.; Cordella, A.; Quinci, M.; Pey, P.; Galli, V.; Cipone, M.; Diana, A. The feasibility of contrast enhanced ultrasonography (CEUS) in the diagnosis of non-cardiac thoracic disorders of dogs and cats. BMC Vet Res 2017, 13, 141. [Google Scholar] [CrossRef] [PubMed]
- Yang, P.C. Color doppler ultrasound of pulmonary consolidation. European Journal of Ultrasound 1996, 3, 169–178. [Google Scholar] [CrossRef]
- Hsu, W.H.; Ikezoe, J.; Chen, C.Y.; Kwan, P.C.; Hsu, C.P.; Hsu, N.Y.; Chiang, C.D.; Ho, W.L. Color Doppler ultrasound signals of thoracic lesions. Correlation with resected histologic specimens. Am J Respir Crit Care Med 1996, 153, 1938–1951. [Google Scholar] [CrossRef] [PubMed]
- Mathis, G.; Gehmacher, O. Ultrasound-guided diagnostic and therapeutic interventions in peripheral pulmonary masses. Wien Klin Wochenschr 1999, 111, 230–235. [Google Scholar]
- Buda, N.; Kosiak, W.; Welnicki, M.; Skoczylas, A.; Olszewski, R.; Piotrkowski, J.; Skoczynski, S.; Radzikowska, E.; Jassem, E.; Grabczak, E.M.; et al. Recommendations for Lung Ultrasound in Internal Medicine. Diagnostics (Basel) 2020, 10. [Google Scholar] [CrossRef]
- Mathis, G. Thoraxsonography--Part II: Peripheral pulmonary consolidation. Ultrasound Med Biol 1997, 23, 1141–1153. [Google Scholar] [CrossRef]
- Pacholec, C.; Lisciandro, G.R.; Masseau, I.; Donnelly, L.; DeClue, A.; Reinero, C.R. Lung ultrasound nodule sign for detection of pulmonary nodule lesions in dogs: Comparison to thoracic radiography using computed tomography as the criterion standard. Vet J 2021, 275, 105727. [Google Scholar] [CrossRef]
- Johnson, V.S.; Ramsey, I.K.; Thompson, H.; Cave, T.A.; Barr, F.J.; Rudorf, H.; Williams, A.; Sullivan, M. Thoracic high-resolution computed tomography in the diagnosis of metastatic carcinoma. J Small Anim Pract 2004, 45, 134–143. [Google Scholar] [CrossRef]

| Type of airless lung tissue | Morphology | Types of bronchogram | Echogenicity | Margins |
| Nodule |  |
-No bronchogram | Hypoechoic | Smooth |
| Mass |  |
-No bronchogram | Varied | Smooth |
| Shred | 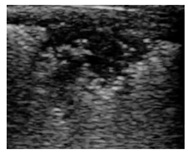 |
-Air dynamic -Air dynamic and static |
Hypoechoic | Irregular |
| Tissue | 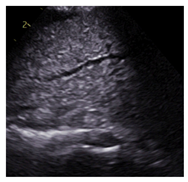 |
-Air static -Fluid -Air static and fluid |
Varied | Smooth |
| Wedge | 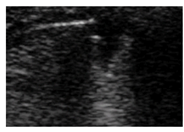 |
-No bronchogram | Hypoechoic | Smooth |
| Species | Breed | n | % |
| Canine | Mix breed | 179 | 28.20% |
| Yorkshire Terrier | 93 | 14.70% | |
| Cavalier King Charles Spaniel | 35 | 5.50% | |
| West Highland White Terrier | 29 | 4.60% | |
| Miniature Schnauzer | 23 | 3.60% | |
| French Bulldog | 21 | 3.30% | |
| Chihuahua | 20 | 3,20% | |
| Shih Tzu | 19 | 3.00% | |
| Dachshund | 18 | 2.80% | |
| Jack Russell Terrier | 17 | 2.70% | |
| Border Collie | 15 | 2.40% | |
| Maltese | 15 | 2.40% | |
| Beagle | 11 | 1.70% | |
| German Shepard | 11 | 1.70% | |
| Labrador Retriever | 10 | 1.60% | |
| Pug | 10 | 1.60% | |
| Maltipoo | 8 | 1.30% | |
| Miniature Pincher | 8 | 1.30% | |
| Other breeds | 92 | 14.5% | |
| Feline | DSH | 135 | 38.90% |
| Mix breed | 92 | 26.50% | |
| Maine Coon | 31 | 8.90% | |
| BSH | 24 | 6.90% | |
| Persian | 20 | 5.80% | |
| Syberian | 14 | 4.00% | |
| Oriental | 5 | 1.40% | |
| Ragdoll | 5 | 1.40% | |
| NFC | 5 | 1.40% | |
| Sphinx | 5 | 1.40% | |
| RBC | 4 | 1.20% | |
| Other breeds | 9 | 2.10% |
| Consolidation type | n | % |
| Shred | 460 | 47.10% |
| Shred/Tissue | 145 | 14.80% |
| Mass | 99 | 10.10% |
| Nodule | 82 | 8.40% |
| Tissue | 77 | 7.90% |
| Mass/Tissue | 32 | 3.30% |
| Wedge | 25 | 2.60% |
| Shred/Wedge | 19 | 1.90% |
| Mass/Nodule | 18 | 1.80% |
| Shred/Nodule | 13 | 1.30% |
| Nodule/Tissue | 4 | 0.30% |
| Tissue/Wedge | 4 | 0.30% |
| Nodule/Wedge | 2 | 0.10% |
| All | 981 | 100.0% |
| Consolidation type | ||||||||||||||
| Bronchogram classification | S | S/T | M | N | T | M/T | W | S/W | M/N | S/N | χ2 | p | Vc | |
| Absent (n = 219 | n | 3 | 1 | 89 | 76 | 0 | 11 | 17 | 4 | 15 | 3 | 2073.85 | <0.001 | 0.57 |
| % | 1.0% | 0.7% | 93.7% | 97.4% | 0.0% | 34.4% | 94.4 % | 30.8% | 93.8% | 27.3% | ||||
| Dynamic (n = 230) | n | 229 | 1 | 0 | 0 | 0 | 0 | 0 | 0 | 0 | 0 | |||
| % | 73.2% | 0.7% | 0.0% | 0.0% | 0.0% | 0.0% | 0.0% | 0.0% | 0.0% | 0.0% | ||||
| Static (n = 42) | n | 18 | 5 | 0 | 0 | 17 | 0 | 0 | 1 | 0 | 1 | |||
| % | 5.8% | 3.5% | 0.0% | 0.0% | 23.9% | 0.0% | 0.0% | 7.7% | 0.0% | 9.1% | ||||
| Fluid (n = 16) | n | 1 | 0 | 0 | 0 | 13 | 2 | 0 | 0 | 0 | 0 | |||
| % | 0.3% | 0.0% | 0.0% | 0.0% | 18.3% | 6.3% | 0.0% | 0.0% | 0.0% | 0.0% | ||||
| Dynamic and static (n = 137) | n | 59 | 73 | 1 | 0 | 1 | 1 | 0 | 0 | 0 | 2 | |||
| % | 18.8% | 50.7% | 1.1% | 0.0% | 1.4% | 3.1% | 0.0% | 0.0% | 0.0% | 18.2% | ||||
| Static and fluid (n = 52) | n | 3 | 11 | 0 | 0 | 38 | 0 | 0 | 0 | 0 | 0 | |||
| % | 1.0% | 7.6% | 0.0% | 0.0% | 53.5% | 0.0% | 0.0% | 0.0% | 0.0% | 0.0% | ||||
| Dynamic, Static and Fluid (n = 54) | n | 0 | 53 | 0 | 0 | 0 | 0 | 0 | 0 | 0 | 1 | |||
| % | 0.0% | 36.8% | 0.0% | 0.0% | 0.0% | 0.0% | 0.0% | 0.0% | 0.0% | 9.1% | ||||
| Dynamic and Absent (n = 11) | n | 0 | 0 | 0 | 1 | 0 | 1 | 1 | 5 | 0 | 3 | |||
| % | 0.0% | 0.0% | 0.0% | 1.3% | 0.0% | 3.1% | 5.6% | 38.5% | 0.0% | 27.3% | ||||
| Static and Absent (n = 30) | n | 0 | 0 | 5 | 1 | 2 | 17 | 0 | 3 | 1 | 1 | |||
| % | 0.0% | 0.0% | 5.3% | 1.3% | 2.8% | 53.1% | 0.0% | 23.1% | 6.3% | 9.1% | ||||
| Consolidation type | ||||||||||||||
| Vascularisation type | S | S/T | M | N | T | M/T | W | S/W | M/N | S/N | χ2 | p | Vc | |
| Tree (n = 173) | n | 146 | 24 | 0 | 0 | 1 | 0 | 0 | 0 | 0 | 2 | 1011.32 | <0.001 | 0.69 |
| % | 88.0% | 30.0% | 0.0% | 0.0% | 2.7% | 0.0% | 0.0% | 0.0% | 0.0% | 33.3% | ||||
| Residual (n = 119) | n | 19 | 56 | 0 | 1 | 35 | 3 | 0 | 0 | 1 | 4 | |||
| % | 11.4% | 70.0% | 0.0% | 14.3% | 94.6% | 13.0% | 0.0% | 0.0% | 9.1% | 66.7% | ||||
| Chaotic (n = 91) | n | 0 | 0 | 59 | 6 | 0 | 16 | 0 | 0 | 10 | 0 | |||
| % | 0.0% | 0.0% | 86.8% | 85.7% | 0.0% | 69.6% | 0.0% | 0.0% | 90.9% | 0.0% | ||||
| Chaotic and penetrating (n = 8) | n | 0 | 0 | 6 | 0 | 0 | 2 | 0 | 0 | 0 | 0 | |||
| % | 0.0% | 0.0% | 8.8% | 0.0% | 0.0% | 8.7% | 0.0% | 0.0% | 0.0% | 0.0% | ||||
| Penetrating (n = 5) | n | 0 | 0 | 3 | 0 | 0 | 2 | 0 | 0 | 0 | 0 | |||
| % | 0.0% | 0.0% | 4.4% | 0.0% | 0.0% | 8.7% | 0.0% | 0.0% | 0.0% | 0.0% | ||||
| Vascular sign (n = 31) | n | 1 | 0 | 0 | 0 | 1 | 0 | 17 | 12 | 0 | 0 | |||
| % | 0.6% | 0.0% | 0.0% | 0.0% | 2.7% | 0.0% | 100.0% | 100.0% | 0.0% | 0.0% | ||||
| Consolidation type | ||||||||||||||
| Diagnosis | S | S/T | M | N | T | M/T | W | S/W | M/N | S/N | χ2 | p | Vc | |
| ARDS (n = 32) | n | 29 | 0 | 0 | 0 | 2 | 0 | 1 | 0 | 0 | 0 | 5040.92 | <0.001 | 0.76 |
| % | 6.3% | 0.0% | 0.0% | 0.0% | 2.6% | 0.0% | 4.0% | 0.0% | 0.0% | 0.0% | ||||
| PLD (n = 36) | n | 33 | 2 | 0 | 0 | 0 | 0 | 1 | 0 | 0 | 0 | |||
| % | 7.2% | 1.4% | 0.0% | 0.0% | 0.0% | 0.0% | 4.0% | 0.0% | 0.0% | 0.0% | ||||
| Tumor (n = 94) | n | 1 | 0 | 80 | 5 | 2 | 4 | 0 | 0 | 1 | 1 | |||
| % | 0.2% | 0.0% | 81.6% | 6.1% | 2.6% | 12.9% | 0.0% | 0.0% | 5.6% | 7.7% | ||||
| Tumor/Atelectasis (n = 42) | n | 0 | 1 | 11 | 1 | 3 | 25 | 0 | 0 | 1 | 0 | |||
| % | 0.0% | 0.7% | 11.2% | 1.2% | 3.9% | 80.6% | 0.0% | 0.0% | 5.6% | 0.0% | ||||
| Tumor/Metastasis (n = 24) | n | 0 | 0 | 3 | 5 | 0 | 0 | 0 | 0 | 16 | 2 | |||
| % | 0.0% | 0.0% | 3.1% | 6.1% | 0.0% | 0.0% | 0.0% | 0.0% | 88.9% | 15.4% | ||||
| Tumor/Granuloma (n = 1) | n | 0 | 0 | 0 | 1 | 0 | 0 | 0 | 0 | 0 | 0 | |||
| % | 0.0% | 0.0% | 0.0% | 1.2% | 0.0% | 0.0% | 0.0% | 0.0% | 0.0% | 0.0% | ||||
| Tumor/CHF (n = 3) | n | 0 | 0 | 2 | 0 | 0 | 1 | 0 | 0 | 0 | 0 | |||
| % | 0.0% | 0.0% | 2.0% | 0.0% | 0.0% | 3.2% | 0.0% | 0.0% | 0.0% | 0.0% | ||||
| Atelectasis (n = 41) | n | 1 | 8 | 0 | 0 | 30 | 0 | 0 | 0 | 0 | 1 | |||
| % | 0.2% | 5.5% | 0.0% | 0.0% | 39.0% | 0.0% | 0.0% | 0.0% | 0.0% | 7.7% | ||||
| Atelectasis/HF (n = 24) | n | 0 | 1 | 0 | 0 | 23 | 0 | 0 | 0 | 0 | 0 | |||
| % | 0.0% | 0.7% | 0.0% | 0.0% | 29.9% | 0.0% | 0.0% | 0.0% | 0.0% | 0.0% | ||||
| Atelectasis/CHF/Parenchymal lung disease (n = 1) | n | 0 | 1 | 0 | 0 | 0 | 0 | 0 | 0 | 0 | 0 | |||
| % | 0.0% | 0.7% | 0.0% | 0.0% | 0.0% | 0.0% | 0.0% | 0.0% | 0.0% | 0.0% | ||||
| Pulmonary edema (n = 1) | n | 1 | 0 | 0 | 0 | 0 | 0 | 0 | 0 | 0 | 0 | |||
| % | 0.2% | 0.0% | 0.0% | 0.0% | 0.0% | 0.0% | 0.0% | 0.0% | 0.0% | 0.0% | ||||
| Metastases (n = 65) | n | 0 | 0 | 0 | 64 | 0 | 0 | 0 | 0 | 0 | 1 | |||
| % | 0.0% | 0.0% | 0.0% | 78.0% | 0.0% | 0.0% | 0.0% | 0.0% | 0.0% | 7.7% | ||||
| Metastases/Atelectasis (n = 5) | n | 0 | 0 | 0 | 2 | 0 | 0 | 0 | 0 | 0 | 3 | |||
| % | 0.0% | 0.0% | 0.0% | 2.4% | 0.0% | 0.0% | 0.0% | 0.0% | 0.0% | 23.1% | ||||
| Pneumonia/ARDS (n = 15) | n | 10 | 3 | 0 | 0 | 0 | 0 | 1 | 1 | 0 | 0 | |||
| % | 2.2% | 2.1% | 0.0% | 0.0% | 0.0% | 0.0% | 4.0% | 5.3% | 0.0% | 0.0% | ||||
| Pneumonia (n = 281) | n | 248 | 30 | 0 | 0 | 2 | 0 | 0 | 0 | 0 | 1 | |||
| % | 53.9% | 20.7% | 0.0% | 0.0% | 2.6% | 0.0% | 0.0% | 0.0% | 0.0% | 7.7% | ||||
| Pneumonia/PLD (n = 23) | n | 19 | 4 | 0 | 0 | 0 | 0 | 0 | 0 | 0 | 0 | |||
| % | 4.1% | 2.8% | 0.0% | 0.0% | 0.0% | 0.0% | 0.0% | 0.0% | 0.0% | 0.0% | ||||
| Pneumonia/Atelectasis (n = 111) | n | 17 | 84 | 1 | 0 | 6 | 1 | 0 | 0 | 0 | 2 | |||
| % | 3.7% | 57.9% | 1.0% | 0.0% | 7.8% | 3.2% | 0.0% | 0.0% | 0.0% | 15.4% | ||||
| Pneumonia/Atelectasis/CHF (n = 2) | n | 0 | 8 | 0 | 0 | 2 | 0 | 0 | 0 | 0 | 0 | |||
| % | 0.0% | 5.5% | 0.0% | 0.0% | 2.6% | 0.0% | 0.0% | 0.0% | 0.0% | 0.0% | ||||
| Pneumonia/Abscess (n = 3) | n | 0 | 0 | 1 | 0 | 1 | 0 | 0 | 0 | 0 | 1 | |||
| % | 0.0% | 0.0% | 1.0% | 0.0% | 1.3% | 0.0% | 0.0% | 0.0% | 0.0% | 7.7% | ||||
| Pneumonia/PTE (n = 15) | n | 0 | 0 | 0 | 0 | 0 | 0 | 3 | 12 | 0 | 0 | |||
| % | 0.0% | 0.0% | 0.0% | 0.0% | 0.0% | 0.0% | 12.0% | 63.2% | 0.0% | 0.0% | ||||
| Pneumonia/ PTE /ARDS (n = 2) | n | 0 | 0 | 0 | 0 | 0 | 0 | 0 | 2 | 0 | 0 | |||
| % | 0.0% | 0.0% | 0.0% | 0.0% | 0.0% | 0.0% | 0.0% | 10.5% | 0.0% | 0.0% | ||||
| Pneumonia/Granuloma (n = 1) | n | 0 | 0 | 0 | 0 | 0 | 0 | 0 | 0 | 0 | 1 | |||
| % | 0.0% | 0.0% | 0.0% | 0.0% | 0.0% | 0.0% | 0.0% | 0.0% | 0.0% | 7.7% | ||||
| Pneumonia/CHF (n = 103) | n | 98 | 3 | 0 | 0 | 2 | 0 | 0 | 0 | 0 | 0 | |||
| % | 21.3% | 2.1% | 0.0% | 0.0% | 2.6% | 0.0% | 0.0% | 0.0% | 0.0% | 0.0% | ||||
| Pneumonia/ CHF/tracheal collapse (n = 1) | n | 1 | 0 | 0 | 0 | 0 | 0 | 0 | 0 | 0 | 0 | |||
| % | 0.2% | 0.0% | 0.0% | 0.0% | 0.0% | 0.0% | 0.0% | 0.0% | 0.0% | 0.0% | ||||
| PTE (n = 18) | n | 1 | 0 | 0 | 0 | 0 | 0 | 14 | 3 | 0 | 0 | |||
| % | 0.2% | 0.0% | 0.0% | 0.0% | 0.0% | 0.0% | 56.0% | 15.8% | 0.0% | 0.0% | ||||
| Metastases/ARDS (n = 5) | n | 0 | 0 | 0 | 0 | 1 | 0 | 4 | 0 | 0 | 0 | |||
| % | 0.0% | 0.0% | 0.0% | 0.0% | 1.3% | 0.0% | 16.0% | 0.0% | 0.0% | 0.0% | ||||
| PTE/Metastasis (n = 0) | n | 0 | 0 | 0 | 0 | 0 | 0 | 0 | 0 | 0 | 0 | |||
| % | 0.0% | 0.0% | 0.0% | 0.0% | 0.0% | 0.0% | 0.0% | 0.0% | 0.0% | 0.0% | ||||
| PTE/CHF (n = 2) | n | 0 | 0 | 0 | 0 | 0 | 0 | 1 | 1 | 0 | 0 | |||
| % | 0.0% | 0.0% | 0.0% | 0.0% | 0.0% | 0.0% | 4.0% | 5.3% | 0.0% | 0.0% | ||||
| Granuloma (n = 4) | n | 0 | 0 | 0 | 4 | 0 | 0 | 0 | 0 | 0 | 0 | |||
| % | 0.0% | 0.0% | 0.0% | 4.9% | 0.0% | 0.0% | 0.0% | 0.0% | 0.0% | 0.0% | ||||
| CHF (n = 4) | n | 1 | 0 | 0 | 0 | 3 | 0 | 0 | 0 | 0 | 0 | |||
| % | 0.2% | 0.0% | 0.0% | 0.0% | 3.9% | 0.0% | 0.0% | 0.0% | 0.0% | 0.0% | ||||
Disclaimer/Publisher’s Note: The statements, opinions and data contained in all publications are solely those of the individual author(s) and contributor(s) and not of MDPI and/or the editor(s). MDPI and/or the editor(s) disclaim responsibility for any injury to people or property resulting from any ideas, methods, instructions or products referred to in the content. |
© 2025 by the authors. Licensee MDPI, Basel, Switzerland. This article is an open access article distributed under the terms and conditions of the Creative Commons Attribution (CC BY) license (http://creativecommons.org/licenses/by/4.0/).


