Submitted:
18 April 2024
Posted:
19 April 2024
You are already at the latest version
Abstract
Transcription factors (TFs) are crucial in modulating gene expression and sculpting cellular and organismal phenotypes. The identification of TF-target gene interactions is pivotal for comprehending molecular pathways and disease etiologies but has been hindered by the demanding nature of traditional experimental approaches. This paper introduces a novel web application, utilizing the R programming language, which predicts TF-target gene relationships and vice versa. Our application integrates the predictive power of various bioinformatic tools, leveraging their combined strengths to provide robust predictions. It merges databases for enhanced precision, incorporates gene expression correlation for accuracy, and employs pan-tissue correlation analysis for context-specific insights. The application also enables the integration of user data with established resources to analyze TF-target gene networks. Despite its current limitation to human data, it provides a platform for exploring gene regulatory mechanisms comprehensively. This integrated, systematic approach offers researchers an invaluable tool for dissecting the complexities of gene regulation, with the potential for future expansions to include a broader range of species.
Keywords:
transcription factors
; gene regulatory networks
; bioinformatics
; TF-target prediction
; Shiny app
1. Introduction
Transcription factors (TFs) are pivotal regulatory proteins that modulate gene expression by binding to specific DNA sequences, thus orchestrating cellular function and organismal development. Unraveling the complex interactions between TFs and their target genes is crucial for understanding the molecular underpinnings of biological processes and disease states [1,2]. Traditionally, the identification of interactions between transcription factors (TFs) and their target genes has relied on labor-intensive and time-consuming experimental methods. However, with the rapid advancement of high-throughput analytical techniques, particularly chromatin immunoprecipitation sequencing (ChIP-seq) and RNA sequencing (RNA-seq), it has become possible to predict TF target genes on a genomic scale [3]. ChIP-seq maps the associations between TFs and DNA, while RNA-seq identifies changes in RNA levels associated with perturbations in TF activity [4]. In recent years, the rise of computational biology has led to the development of various web-based tools that predict TF-target gene relationships using unique algorithms and databases. The JASPAR database offers a collection of high-quality transcription factor DNA binding motifs, providing core data for bioinformatics analysis and a powerful predictive tool for experimental design [5,6]. Based on transcription factor knockout experiments, the KnockTF database systematically compiles data on the effects of knockouts on gene expression, providing valuable experimental evidence for TF function studies [7,8]. Here, we introduce a novel web application developed using the R programming language, designed to predict target genes of transcription factors and vice versa. Our application synergizes the predictive capacities of multiple web tools by intersecting their results to enhance reliability. Additionally, it incorporates gene expression correlation analysis as a filter to refine the predictions. This integrative approach offers a comprehensive and efficient strategy for the elucidation of transcriptional networks, providing a valuable resource for the research community to advance the field of gene regulatory mechanisms.
2. Materials and Methods
2.1. Transcription Factor Databases
This Shiny application has incorporated seven major transcription factor databases (Table 1), namely MotifMap [9,10], hTFtarget [11], KnockTF [7,8], TRRUST [12,13], Cistrome DB [14], ENCODE [15], and JASPAR [6]. For MotifMap, hTFtarget, TRRUST, and Cistrome, we utilized the R packages “httr,” “rvest,” “curl,” and “xml2” to simulate web page access for retrieving transcription factor-target gene data. For JASPAR and ENCODE, we acquired pre-processed datasets from Harmonizome [16] (https://maayanlab.cloud/Harmonizome/) and uploaded them to the server’s MySQL database. For KnockTF, we downloaded the entire dataset of differential expression results available from the KnockTF2.0 website and uploaded it to the MySQL database for accessibility.
2.2. Transcription Factor Databases
To explore the correlation between TFs and target genes expression, this Shiny app integrates analyses using The Genotype-Tissue Expression (GTEx), The Cancer Genome Atlas Program (TCGA), and Cancer Cell Line Encyclopedia (CCLE) databases. Here is their basic introduction:
- The GTEx (Genotype-Tissue Expression) project database provides extensive reference data for gene expression and its variability in different normal human tissues, enabling researchers to understand how gene expression is influenced by genetic background on a broader scale [17].
- The TCGA (The Cancer Genome Atlas) database collects multidimensional cancer genomic data including gene expression, mutations, copy number variations, and epigenetic data, offering strong support for the discovery of cancer biomarkers and therapeutic targets [18].
- The CCLE (Cancer Cell Line Encyclopedia) database provides a wealth of gene expression, mutation, and epigenetic characteristic data for numerous cancer cell lines, serving as a crucial resource for studying cell line-specific responses and drug screening [19].
These resources provide extensive transcriptomic data from healthy and cancerous tissues or cells, essential for predicting TF-target interactions. We apply the correlation analysis between the expression of TFs and targets based on these datasets to enhance the predictive property. The analyses are performed using R and results are dynamically presented in the app, offering users a clear view of the TF-gene expression relationships.
2.3. Software
Our Shiny application was exclusively developed using R (version 4.3.0) and encompasses all stages of development from data extraction and correlation analysis to data visualization and user interface (UI) design. Here is the link of this Shiny application: https://jingle.shinyapps.io/TF_Target_Finder/. The key R packages employed in the construction of this application are summarized in the table below, indicating their specific uses such as UI construction, web data retrieval, XENA database (https://xena.ucsc.edu/) [20] data extraction, MySQL database access and visualization (Table 2).
3. Results
3.1. Module 1: Procedures for the Prediction of the Target Genes of TF
This systematic approach enables a thorough analysis of TF-target gene interactions, bolstering the robustness of predictions by harnessing the combined strength of multiple dataset intersections. The procedural steps are as follows:
- 1)
- Input a TF name: Users initiated the process by selecting a TF of interest from a dropdown list.
- 2)
- Select datasets: Participants then chose the predictive tools to include in the analysis. Notably, if “KnockTF” was selected, an additional interface element appeared: a slider for setting the log2 fold-change (Log2FC) threshold, along with a checkbox to include only downregulated genes. This specification is necessary as KnockTF predictions are based on differential gene expression data following TF knockdown or knockout.
- 3)
- Initiate prediction: By clicking the “Go” button, users commenced the predictive analysis.
- 4)
- View results: After a short wait, the prediction outcomes were displayed on the “All results” tab, which encompassed individual tool results and the intersected findings.
- 5)
- Intersection selection: Given that some tools may yield sparse predictions or lack data, we provided an option box to select well-predicted datasets for intersection analysis, which is visualized through a Venn diagram.
- 6)
- Visualize intersections: The “Venn diagram” tab allowed for the visualization of overlapping predictions across multiple tools using Venn or petal diagrams.
- 7)
- Individual dataset review: The “Individual dataset” tab enabled viewing and downloading detailed information for each tool’s predictive results.
Herein, we demonstrate the predictive workflow and outcomes using STAT3 as an example within this module. The integration analysis for prediction was conducted using four tools: hTFtarget, MotifMap, Jaspar, and KnockTF. For KnockTF, a log2 fold change (log2FC) threshold of 0.5 was set, including only downregulated genes (Figure 1A). The results indicated that we identified 6358, 3485, 2740, and 3730 putative target genes from each tool respectively (Supplementary file 1), while the intersection of these tools yielded only 42 target genes (Figure 1B). Furthermore, the prediction results from each tool can be further viewed and downloaded in the Individual dataset section (Figure 1C).
3.2. Module 2: Procedures for the Prediction of Upstream TFs of Target Genes
This integrated approach, combining gene expression correlation analysis with multi-dataset intersection, was designed to ensure a comprehensive and reliable prediction of TF-target gene interactions. The operational steps are detailed below:
- 1)
- Input a target gene symbol: Such as GAPDH.
- 2)
- Select datasets: Participants then chose the predictive tools to include in the analysis. Notably, if “KnockTF” was selected, an additional interface element appeared: a slider for setting the log2 fold-change (Log2FC) threshold, along with a checkbox to include only downregulated genes. This specification is necessary as KnockTF predictions are based on differential gene expression data following TF knockdown or knockout.
- 3)
- Correlation analysis: Researchers began by choosing the data type for correlation analysis through the “Correlation” selection box, with options including data from TCGA, GTEx, or a combination of both.
- 4)
- Tissue type selection: Users selected specific cancer types from the TCGA database and/or normal tissue types from the GTEx database to tailor the correlation analysis to their research interests.
- 5)
- Correlation parameter setting: The method of correlation analysis and the cutoff for the correlation coefficient were set, allowing for the customization of the stringency of the correlation criteria.
- 6)
- Initiate prediction: The “Go” button was clicked to start the prediction analysis, incorporating the correlation parameters specified.
- 7)
- Results display: After a brief processing period, the predictive results, including the outcomes from individual tools and the intersected data, were displayed on the “All results” tab.
- 8)
- Intersection selection: Similar to Module 1, we provided the option to select datasets with robust predictions for intersection analysis, with the results visualization through a Venn diagram.
- 9)
- Visualization of Intersections: By navigating to the “Venn diagram” tab, users could visualize the intersection results between different datasets.
- 10)
- Dataset Details: Detailed information regarding the predictive results from each tool could be viewed and downloaded from the “Individual dataset” tab.
Using GAPDH as another exemplar, we incorporated five tools—hTFtarget, ENCODE, Jaspar, Cistrome, and KnockTF—alongside correlation analysis with GTEx lung tissue and TCGA lung adenocarcinoma data (correlation method: Pearson, correlation coefficient threshold: 0.3) (Figure 2A). The combined prediction analysis of these five tools and two datasets yielded 627, 137, 13, 1000, 45, 1223, and 243 transcription factors, respectively (Supplementary file 2). Unfortunately, no intersecting transcription factors were identified across these seven datasets (Figure 2B). However, upon removing Cistrome and Jaspar from the “Select datasets to get intersection” dropdown, an intersection of the remaining five datasets revealed two TFs: FOXM1 and YY1 (Figure 2C). Similarly, individual dataset results can be viewed and downloaded from the Individual dataset section (Figure 2D).
3.3. Module 3: Pan-Tissue Correlation Analysis between the Expression of Predicted TF-Target Pair
In this module, we utilized data from three publicly available databases to analyze the expression correlation of TF-target pairs across various tissue types. The integration of these analyses enables a comprehensive assessment of the expression relationship between the TFs and their potential target genes in a context-specific manner. The methodological steps are detailed as follows:
- 1)
- TF and target gene input: The user begins by selecting a transcription factor and entering the symbol for the target gene.
- 2)
- Database selection: The database(s) for analysis are chosen from among TCGA, GTEx, and CCLE. Notably, upon selecting TCGA, a popup menu appears, offering the user the option to include tumor data exclusively.
- 3)
- Correlation analysis parameters: Parameters for correlation analysis are set, including the selection of the analysis method and the establishment of thresholds for the correlation coefficient and p-value.
- 4)
- Initiate analysis: Data retrieval and correlation analysis are initiated by clicking the “Go” button.
- 5)
- Correlation results and scatter plot: Subsequently, the results of the correlation analysis are presented, along with a scatter plot illustrating the expression correlation.
- 6)
- Plotting parameter: Options are provided to adjust parameters relevant to the scatter plot visualization.
- 7)
- Detailed scatter plot: Clicking on a row within the results table prompts a popup window that displays a detailed scatter plot for the expression of the two genes within a single tissue type.
We evaluated the correlation between FOXM1 and GAPDH across pan-cancer samples in the TCGA database, using a Pearson correlation method with a coefficient threshold of 0.3 and a P-value threshold of 0.05 (Figure 3A). The results indicated a significant positive correlation between FOXM1 and GAPDH expression in the majority of cancers (Figure 3A-B, Supplementary file 3). Upon selecting LUAD, we obtained the interface as shown in Figure 3C, where the scatter plot demonstrates the correlation between these two genes in TCGA-LUAD (correlation coefficient = 0.676).
3.4. Module 4: TF-Targets Regulation Network Analysis
The module was designed to predict the target genes of transcription factors (TFs) of interest based on gene differential expression analysis results uploaded by the user, utilizing multiple TF prediction databases, and to visualize the regulatory network. This module thus facilitates the elucidation of potential regulatory relationships by integrating user data with established TF prediction resources, supporting the discovery of novel insights into gene regulatory networks. The steps for utilizing this module are as follows:
- 1)
- Data upload: Users upload their gene expression differential analysis results. It is important to ensure that the column names in the uploaded file are consistent with those in the example data provided.
- 2)
- Differential gene selection criteria: Set the thresholds for selecting differentially expressed genes, specifically the log2 fold change (log2FC) and p-value.
- 3)
- Tool selection: Choose the predictive tools to be included in the analysis for identifying TF-target gene relationships.
- 4)
- TF List Update: Upon input completion, the ‘TF to analysis’ input field automatically updates with a list of TFs. This list is generated based on the intersection of differentially expressed genes from the uploaded results and the TFs contained within the chosen predictive tools.
- 5)
- TF different expression result: The ‘TF result’ page will exhibit the differential analysis results of TFs extracted from the user’s uploaded data.
- 6)
- Initiate Prediction Analysis: Clicking the ‘Go’ button starts the predictive analysis process.
- 7)
- Network Visualization: After the analysis is complete, a network diagram is generated. Note that some TFs may not display target genes in the network diagram if no target genes are identified after intersecting the results from multiple tools. In such cases, it may be beneficial to reduce the number of tools included in the analysis to obtain more extensive information.
- 8)
- Plotting Data Interface: The ‘Plotting data’ interface will present the predicted results for TF-target genes.
Taking the differential analysis results from the GSE17025 dataset as an instance (Supplementary file 4), we uploaded these results and set the thresholds for differentially expressed genes at log2FC = 1 and P value < 0.05. The TF results interface within the app then displays the differential analysis outcomes for all TFs extracted from the uploaded data (Figure 4A). In this analysis, we predicted TF target genes based on the hTFtarget and MotifMap tools. The TF to analysis dropdown was automatically updated with TFs included in these two databases, and we selected all for analysis. The network visualization resulting from the intersection of the predicted outcomes and differentially expressed genes is as illustrated in Figure 4B. The predictive outcomes and data for plotting can be viewed and downloaded in the Plotting data section (Figure 4C).
4. Discussion
In the application developed in this study, we have crafted a suite of modular tools aimed at accurately predicting the interactions between transcription factors (TFs) and their target genes, while taking into consideration the strengths and limitations of existing bioinformatic resources. Among the primary predictive resources, hTFtarget is known for its rich information on TF binding sites supported by high-throughput ChIP-seq data, yet its predictive results are constrained by specific experimental conditions and cell types [11]. The ENCODE project, with its foundation of extensive experimentally validated data, provides solid evidence for TF-target gene associations, though the universal applicability of this data can sometimes be limited [15,22]. Cistrome, by integrating a variety of bioinformatics tools and a vast collection of ChIP-seq datasets, offers more comprehensive predictions, but its accuracy may still be affected by the frequency of data updates and methodologies of data processing [14]. KnockTF, relying on data from gene knockout experiments, intuitively demonstrates TF functionality, but often fails to adequately reflect the diversity of TFs across different biological settings [7,8].
Module 1 of our application enhances the precision and reliability of target gene predictions by merging data from various databases, using the intersection of datasets to fill gaps that reliance on a single database might miss. Module 2 improves the accuracy of upstream TF predictions by combining gene expression correlation analysis with dataset integration, ensuring the biological relevance of the results. Module 3, through pan-tissue correlation analysis, empowers researchers to evaluate the expression relationships between TFs and their potential target genes in specific biological contexts. Biological networks elucidate the intricate interplay between various molecular entities within cells, interactions that are crucial in determining cellular behavior [23]. At the initial stage of constructing transcription regulatory networks, it is imperative to establish accurate associations between transcription factors (TFs) and their target genes, which involves identifying their regulatory activities, determining whether they function as activators or repressors. Advanced experimental techniques like chromatin immunoprecipitation (ChIP), in conjunction with high-throughput sequencing technologies, enable us to identify TF binding sites on a genome-wide scale. This capability lays the foundation for revealing and constructing sophisticated transcription regulatory networks [24,25]. Finally, Module 4 of this app fuses user data with established TF prediction resources to analyze the TF-target gene regulatory network, offering new perspectives for exploring gene regulatory networks.
5. Conclusions
In conclusion, this application not only effectively utilizes the advantages of existing database resources, but its modular design also enhances the comprehensiveness and precision of target gene predictions, which is crucial for revealing the role of TFs in diverse biological contexts. This integrated and systematic approach will greatly strengthen the ability of researchers to understand and explore the complexities of gene regulatory networks. However, it is important to note that the current version of the application only supports the prediction of human TF-target gene interactions and has not yet been expanded to include other species. This limitation restricts its application in broader biological research and cross-species comparative analyses. With future enrichment of databases and refinement of algorithms, we anticipate that the application will gradually extend support to the transcription regulatory network analysis of more species, thereby deepening our understanding of complex biological networks.
Supplementary Materials
The following supporting information can be downloaded at the website of this paper posted on Preprints.org, Supplementary file 1, Supplementary file 2, Supplementary file 3.
Author Contributions
Conceptualization, J.W.; methodology, J.W.; software, J.W.; validation, J.W.; formal analysis, X.X.; investigation, J.W.; resources, J.W.; data curation, J.W.; writing—original draft preparation, J.W.; visualization, J.W.; project administration, J.W.; funding acquisition, J.W. J.W. has read and agreed to the published version of the manuscript.
Funding
This study was funded by from China Postdoctoral Science Foundation (No.: 2023M732527) and the National Natural Science Foundation of China (No. 82304184).
Conflicts of Interest
The authors declare no conflicts of interest.
References
- He, H.; Yang, M.; Li, S.; Zhang, G.; Ding, Z.; Zhang, L.; Shi, G.; Li, Y. Mechanisms and biotechnological applications of transcription factors. Synthetic and Systems Biotechnology 2023, 8, 565–577. [Google Scholar] [CrossRef] [PubMed]
- Weidemüller, P.; Kholmatov, M.; Petsalaki, E.; Zaugg, J.B. Transcription factors: Bridge between cell signaling and gene regulation. Proteomics 2021, 21, e2000034. [Google Scholar] [CrossRef] [PubMed]
- Wade, J.T. Mapping Transcription Regulatory Networks with ChIP-seq and RNA-seq. In Prokaryotic Systems Biology; Krogan, P.N.J., Babu, P.M., Eds.; Springer International Publishing: Cham, 2015; pp. 119–134. [Google Scholar] [CrossRef]
- Mundade, R.; Ozer, H.G.; Wei, H.; Prabhu, L.; Lu, T. Role of ChIP-seq in the discovery of transcription factor binding sites, differential gene regulation mechanism, epigenetic marks and beyond. Cell Cycle 2014, 13, 2847–2852. [Google Scholar] [CrossRef] [PubMed]
- Castro-Mondragon, J.A.; Riudavets-Puig, R.; Rauluseviciute, I.; Lemma, R.B.; Turchi, L.; Blanc-Mathieu, R.; Lucas, J.; Boddie, P.; Khan, A.; Manosalva Pérez, N. , et al. JASPAR 2022: the 9th release of the open-access database of transcription factor binding profiles. Nucleic Acids Res 2022, 50, D165–d173. [Google Scholar] [CrossRef] [PubMed]
- Rauluseviciute, I.; Riudavets-Puig, R.; Blanc-Mathieu, R.; Castro-Mondragon, J.A.; Ferenc, K.; Kumar, V.; Lemma, R.B.; Lucas, J.; Chèneby, J.; Baranasic, D. , et al. JASPAR 2024: 20th anniversary of the open-access database of transcription factor binding profiles. Nucleic Acids Res 2024, 52, D174–d182. [Google Scholar] [CrossRef]
- Feng, C.; Song, C.; Liu, Y.; Qian, F.; Gao, Y.; Ning, Z.; Wang, Q.; Jiang, Y.; Li, Y.; Li, M. , et al. KnockTF: a comprehensive human gene expression profile database with knockdown/knockout of transcription factors. Nucleic Acids Res 2020, 48, D93–d100. [Google Scholar] [CrossRef] [PubMed]
- Feng, C.; Song, C.; Song, S.; Zhang, G.; Yin, M.; Zhang, Y.; Qian, F.; Wang, Q.; Guo, M.; Li, C. KnockTF 2.0: a comprehensive gene expression profile database with knockdown/knockout of transcription (co-)factors in multiple species. Nucleic Acids Res 2024, 52, D183–d193. [Google Scholar] [CrossRef] [PubMed]
- Daily, K.; Patel, V.R.; Rigor, P.; Xie, X.; Baldi, P. MotifMap: integrative genome-wide maps of regulatory motif sites for model species. BMC Bioinformatics 2011, 12, 495. [Google Scholar] [CrossRef] [PubMed]
- Xie, X.; Rigor, P.; Baldi, P. MotifMap: a human genome-wide map of candidate regulatory motif sites. Bioinformatics 2009, 25, 167–174. [Google Scholar] [CrossRef]
- Zhang, Q.; Liu, W.; Zhang, H.M.; Xie, G.Y.; Miao, Y.R.; Xia, M.; Guo, A.Y. hTFtarget: A Comprehensive Database for Regulations of Human Transcription Factors and Their Targets. Genomics Proteomics Bioinformatics 2020, 18, 120–128. [Google Scholar] [CrossRef]
- Han, H.; Shim, H.; Shin, D.; Shim, J.E.; Ko, Y.; Shin, J.; Kim, H.; Cho, A.; Kim, E.; Lee, T. , et al. TRRUST: a reference database of human transcriptional regulatory interactions. Sci Rep 2015, 5, 11432. [Google Scholar] [CrossRef]
- Han, H.; Cho, J.W.; Lee, S.; Yun, A.; Kim, H.; Bae, D.; Yang, S.; Kim, C.Y.; Lee, M.; Kim, E. , et al. TRRUST v2: an expanded reference database of human and mouse transcriptional regulatory interactions. Nucleic Acids Res 2018, 46, D380–d386. [Google Scholar] [CrossRef]
- Zheng, R.; Wan, C.; Mei, S.; Qin, Q.; Wu, Q.; Sun, H.; Chen, C.H.; Brown, M.; Zhang, X.; Meyer, C.A. , et al. Cistrome Data Browser: expanded datasets and new tools for gene regulatory analysis. Nucleic Acids Res 2019, 47, D729–d735. [Google Scholar] [CrossRef]
- An integrated encyclopedia of DNA elements in the human genome. Nature 2012, 489, 57–74. [CrossRef]
- Rouillard, A.D.; Gundersen, G.W.; Fernandez, N.F.; Wang, Z.; Monteiro, C.D.; McDermott, M.G.; Ma’ayan, A. The harmonizome: a collection of processed datasets gathered to serve and mine knowledge about genes and proteins. Database 2016, 2016, baw100. [Google Scholar] [CrossRef]
- The Genotype-Tissue Expression (GTEx) project. Nat Genet 2013, 45, 580–585. [CrossRef]
- Tomczak, K.; Czerwińska, P.; Wiznerowicz, M. The Cancer Genome Atlas (TCGA): an immeasurable source of knowledge. Contemp Oncol (Pozn) 2015, 19, A68–77. [Google Scholar] [CrossRef]
- Barretina, J.; Caponigro, G.; Stransky, N.; Venkatesan, K.; Margolin, A.A.; Kim, S.; Wilson, C.J.; Lehár, J.; Kryukov, G.V.; Sonkin, D. , et al. The Cancer Cell Line Encyclopedia enables predictive modelling of anticancer drug sensitivity. Nature 2012, 483, 603–607. [Google Scholar] [CrossRef]
- Goldman, M.J.; Craft, B.; Hastie, M.; Repečka, K.; McDade, F.; Kamath, A.; Banerjee, A.; Luo, Y.; Rogers, D.; Brooks, A.N. , et al. Visualizing and interpreting cancer genomics data via the Xena platform. Nature Biotechnology 2020, 38, 675–678. [Google Scholar] [CrossRef]
- Wang, S.; Xiong, Y.; Zhao, L.; Gu, K.; Li, Y.; Zhao, F.; Li, J.; Wang, M.; Wang, H.; Tao, Z. , et al. UCSCXenaShiny: an R/CRAN package for interactive analysis of UCSC Xena data. Bioinformatics 2022, 38, 527–529. [Google Scholar] [CrossRef]
- Luo, Y.; Hitz, B.C.; Gabdank, I.; Hilton, J.A.; Kagda, M.S.; Lam, B.; Myers, Z.; Sud, P.; Jou, J.; Lin, K. , et al. New developments on the Encyclopedia of DNA Elements (ENCODE) data portal. Nucleic Acids Res 2020, 48, D882–d889. [Google Scholar] [CrossRef] [PubMed]
- Blais, A.; Dynlacht, B.D. Constructing transcriptional regulatory networks. Genes Dev 2005, 19, 1499–1511. [Google Scholar] [CrossRef] [PubMed]
- Pavesi, G. ChIP-Seq Data Analysis to Define Transcriptional Regulatory Networks. Adv Biochem Eng Biotechnol 2017, 160, 1–14. [Google Scholar] [CrossRef]
- Levine, M.; Tjian, R. Transcription regulation and animal diversity. Nature 2003, 424, 147–151. [Google Scholar] [CrossRef]
Figure 1.
Visualization of STAT3 target prediction results utilizing the TF-Target Finder Shiny app. (A) Parameter setting and display of predictive outcomes; (B) A Venn diagram depicting the intersections of predicted results from four tools; (C) The Individual dataset interface showing results from a single dataset, exemplified by hTFtarget predictions. TF, transcription factor.
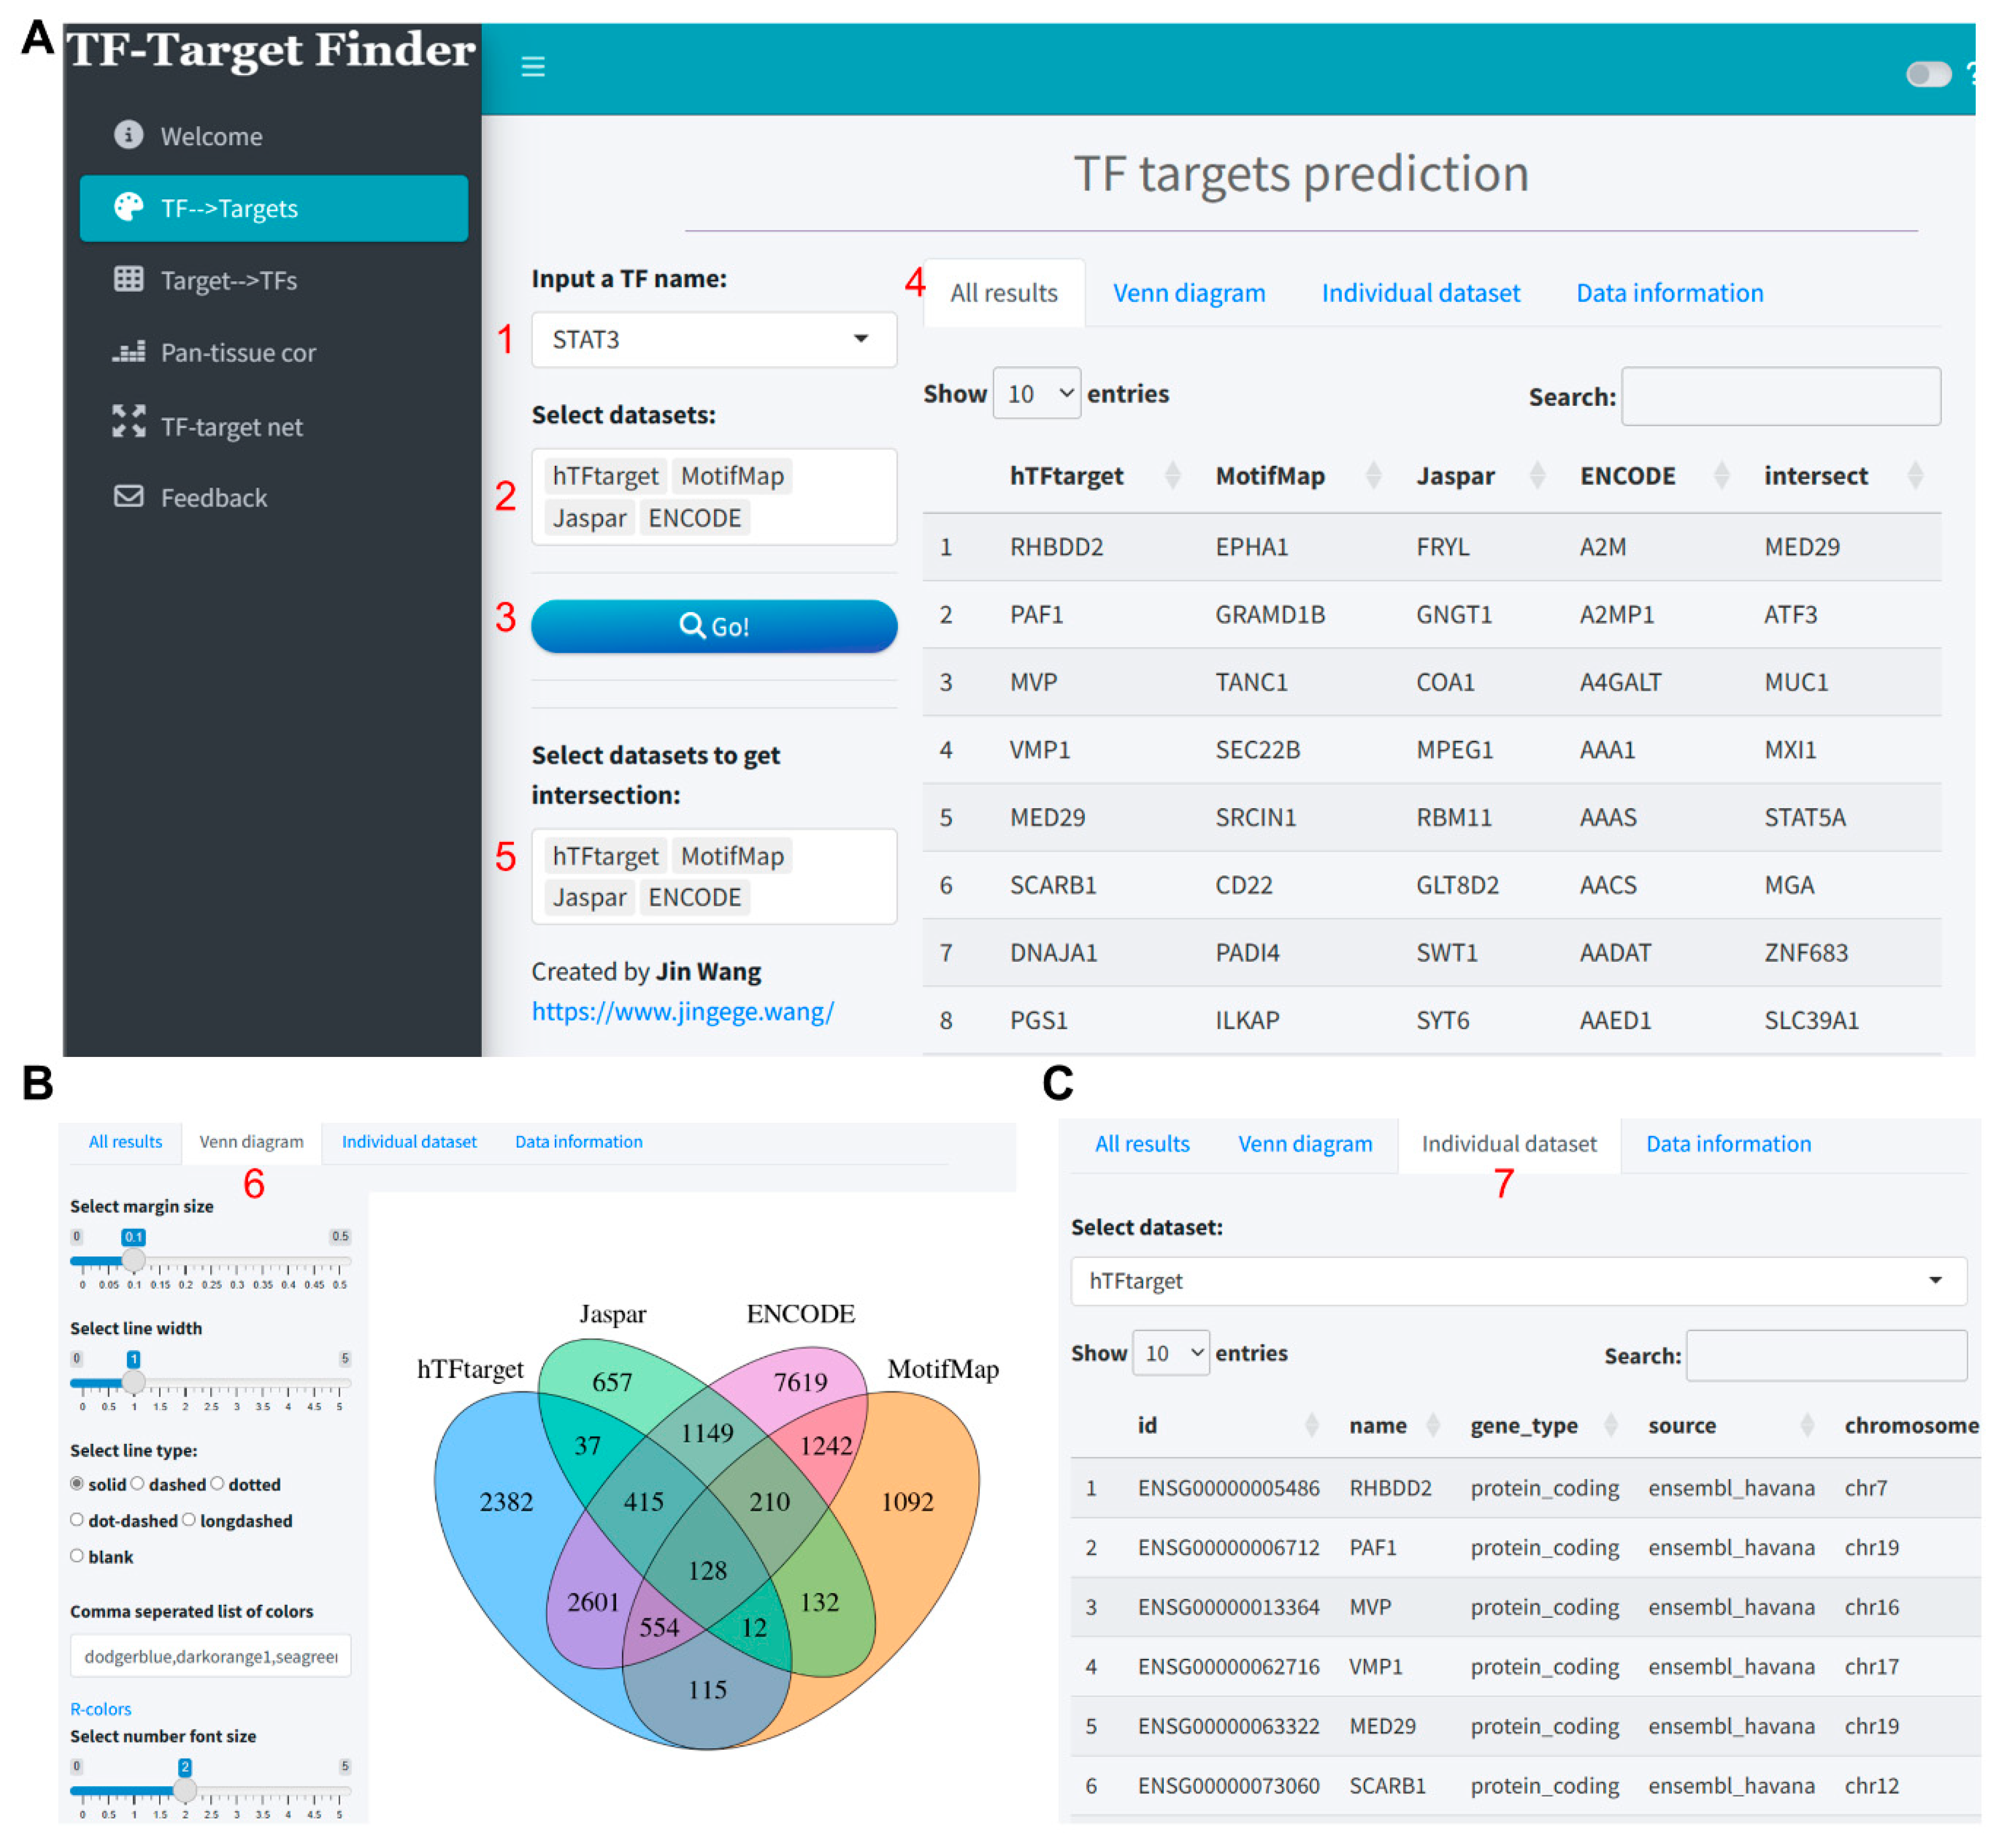
Figure 2.
Predictive analysis of TFs regulating GAPDH using the TF-Target Finder Shiny app. (A) Parameter setting and display of predictive results; (B) A petal diagram illustrating the outcomes of five predictive tools and two correlation analyses, along with their intersections; (C) A Venn diagram showing the intersections of predictions from three tools and two correlation analyses; (D) The Individual dataset interface with KnockTF predictions exemplifying results from a single dataset. TF, transcription factor.
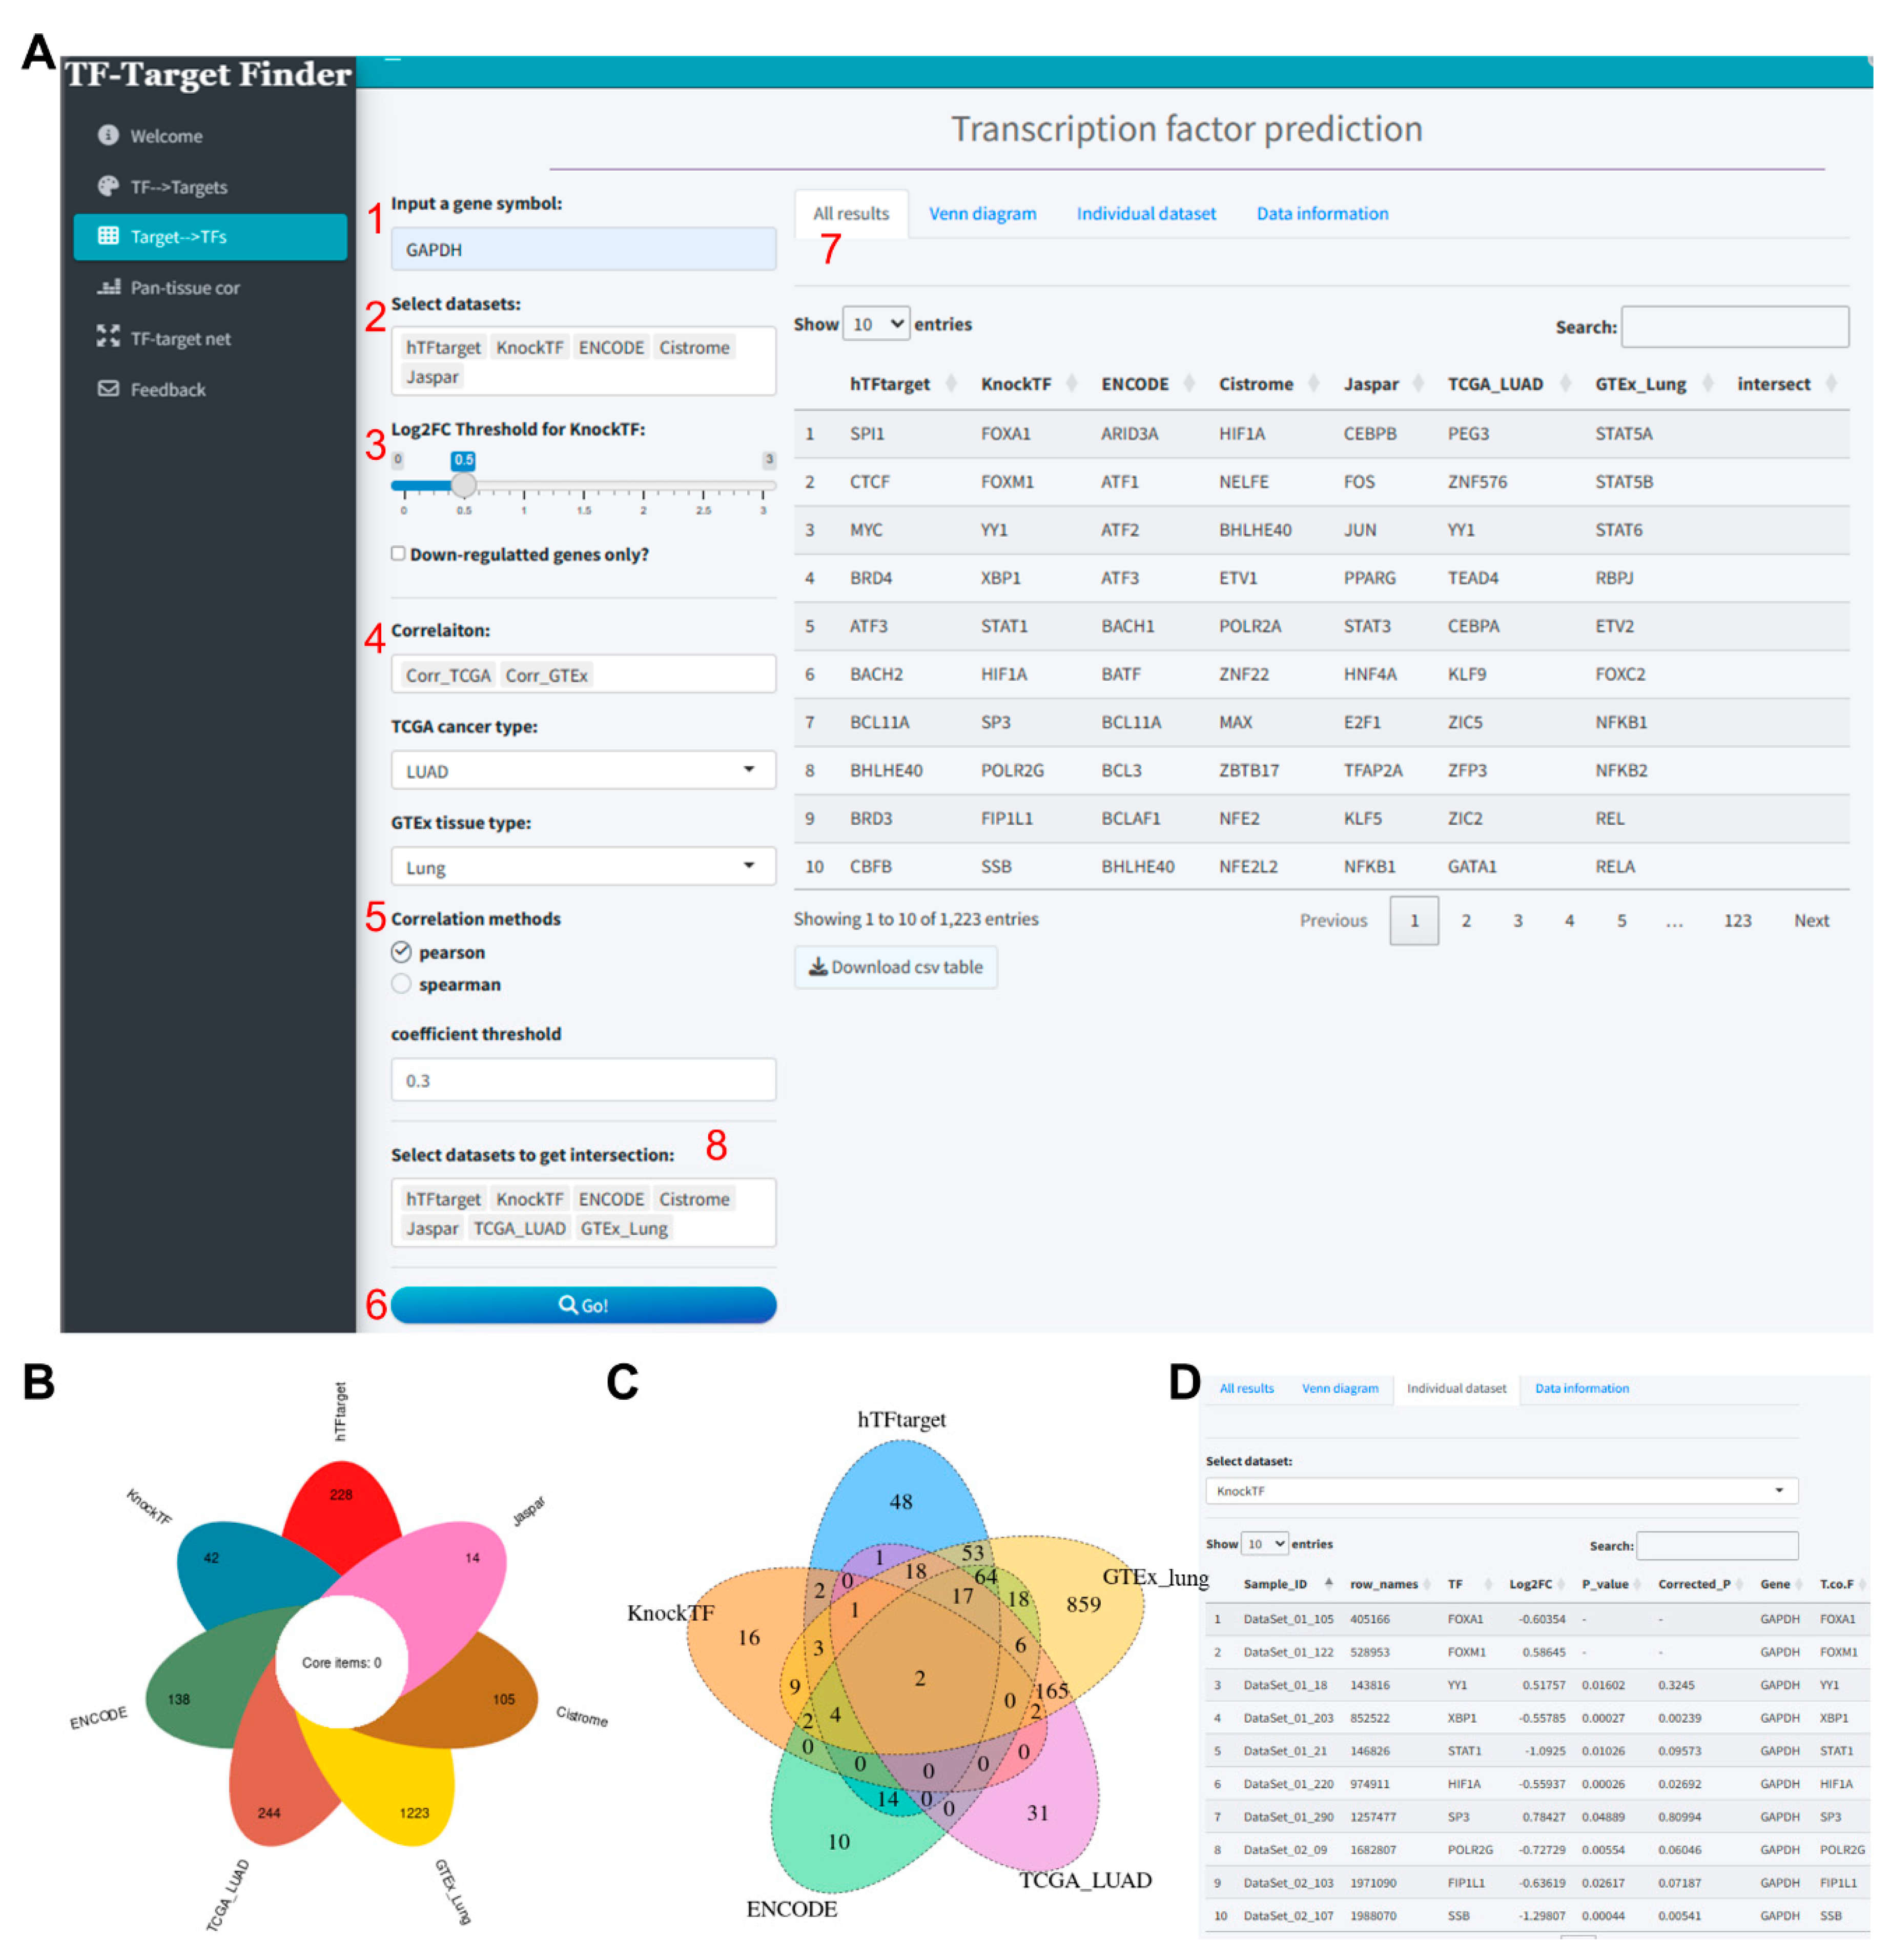
Figure 3.
Correlation analysis of FOXM1 and GAPDH expression in TCGA pan-cancer samples using the TF-Target Finder Shiny app. (A-B) Parameter setting and display of predictive results; (C) Scatter plot illustrating the correlation between GAPDH and FOXM1 in the TCGA-LUAD dataset. TF, transcription factor. TCGA, The Cancer Genome Atlas. LUAD, lung adenocarcinoma.
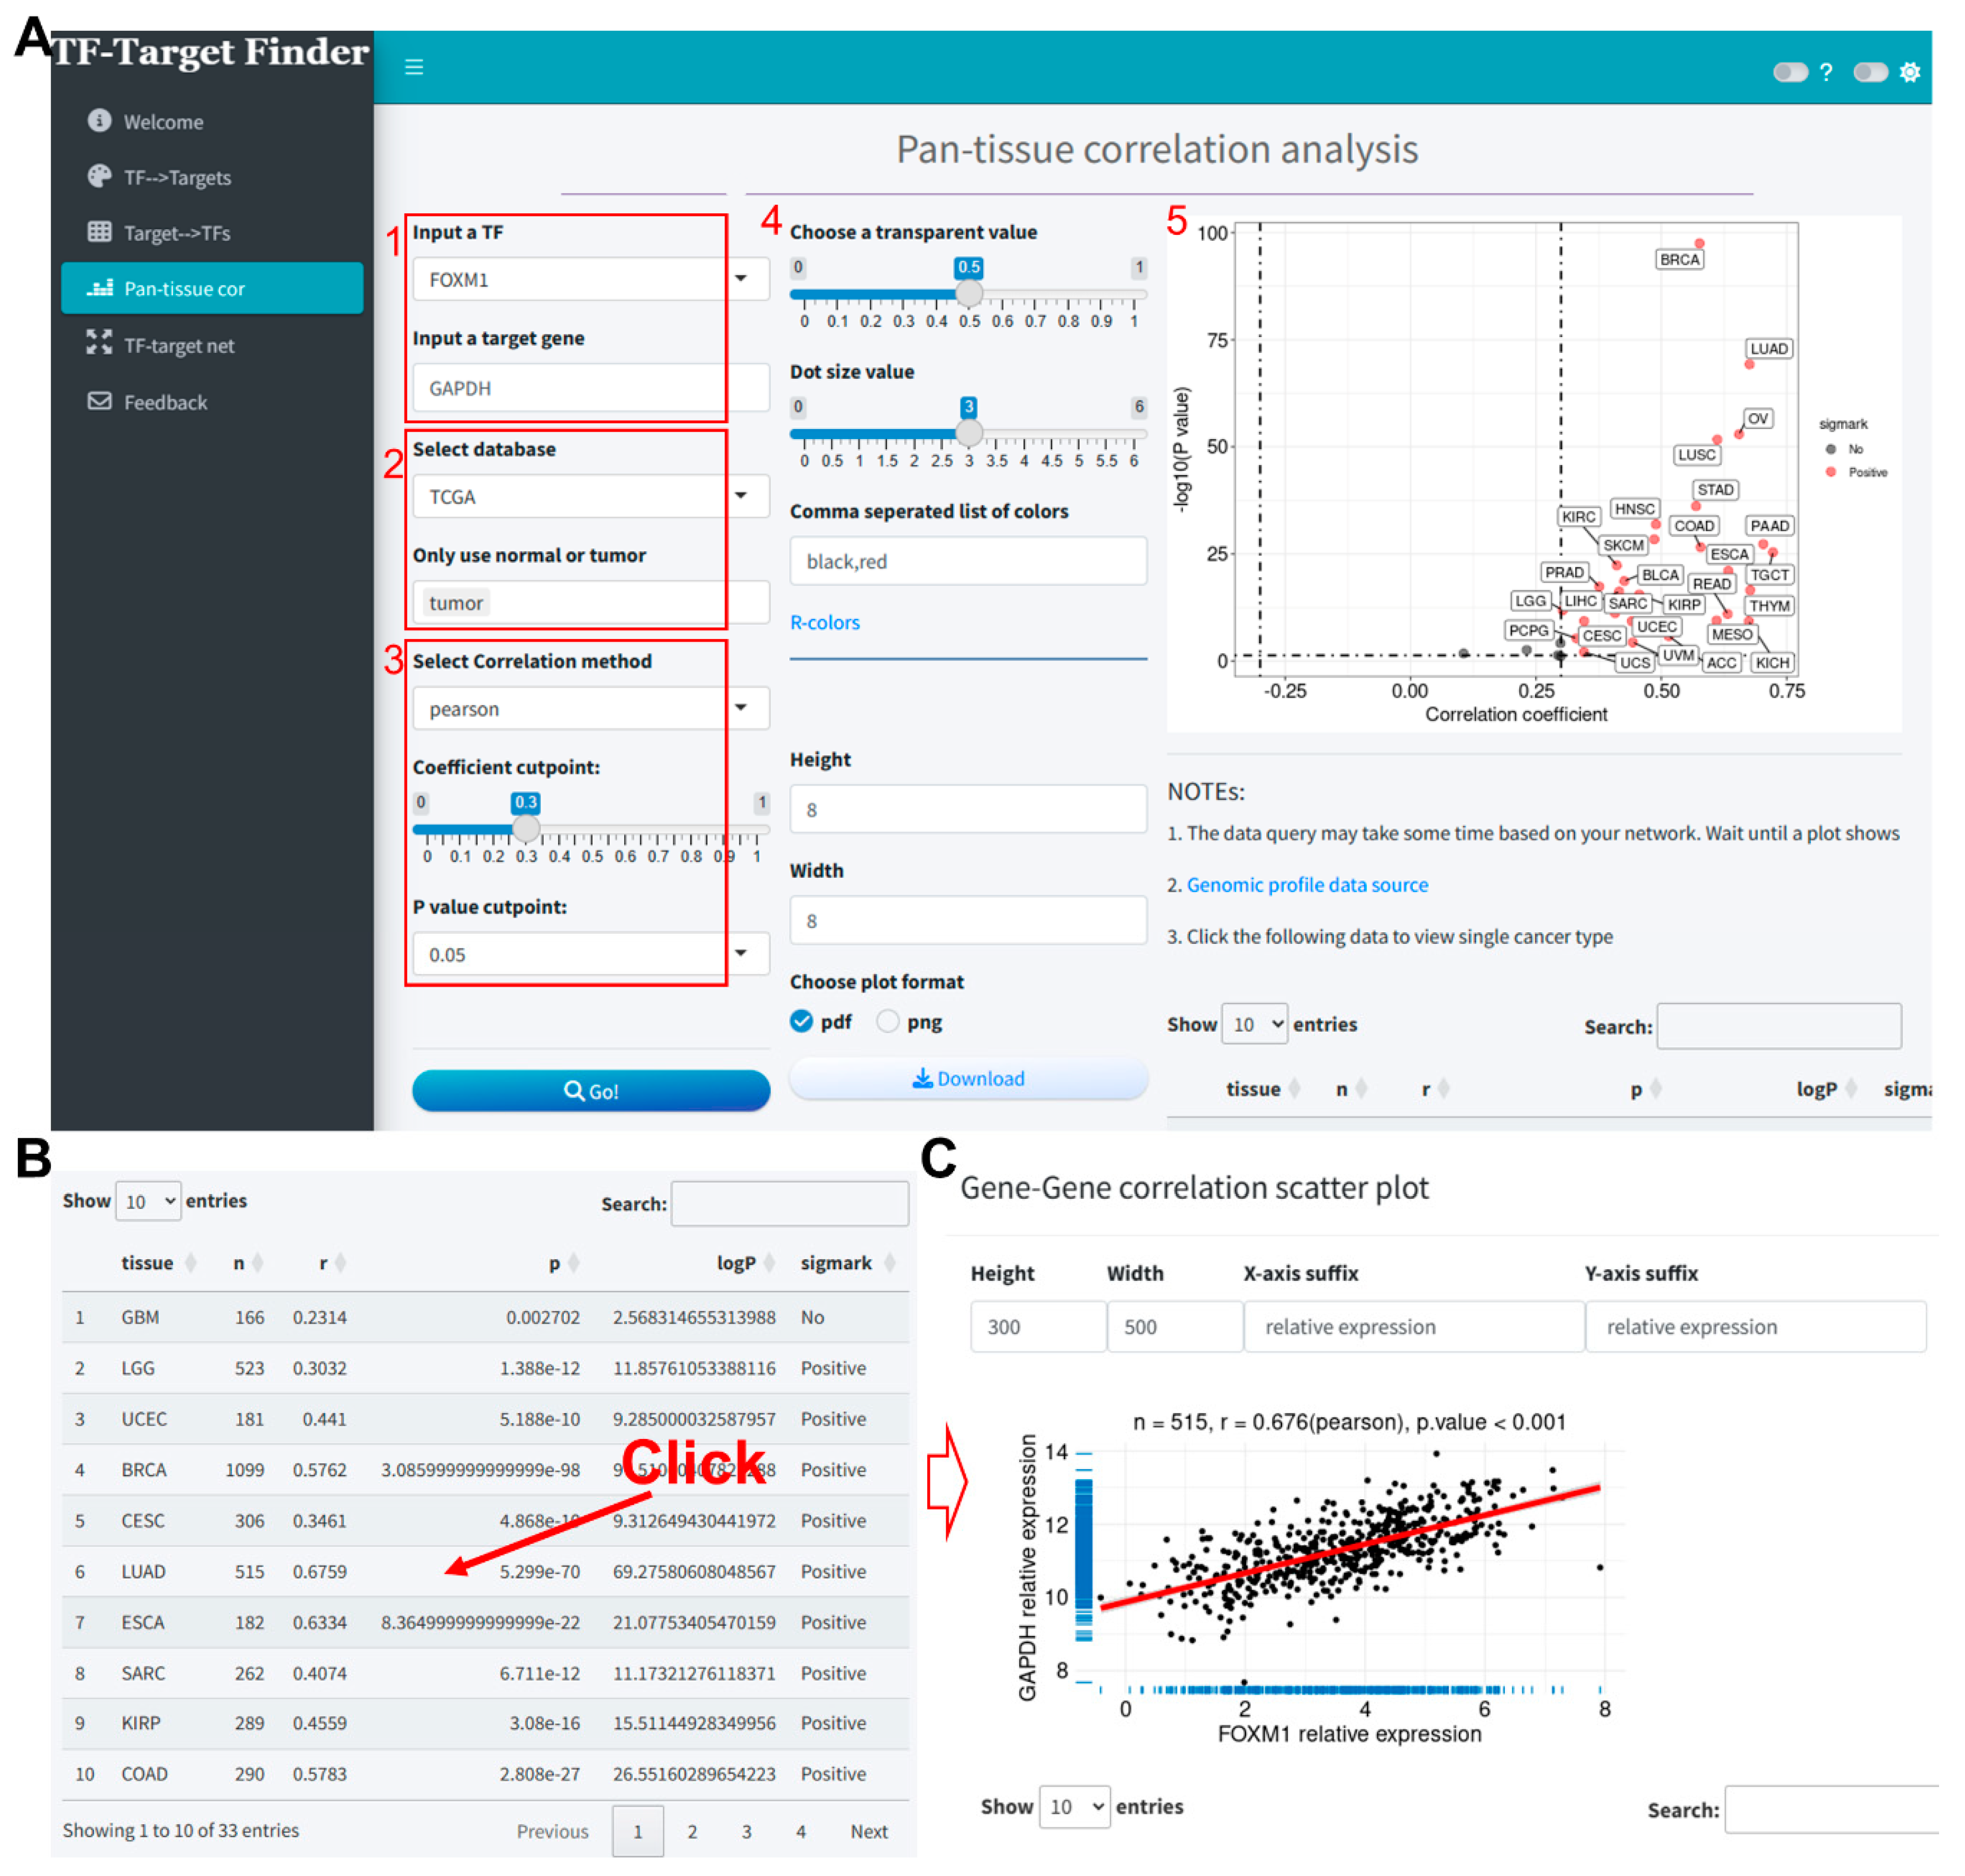
Figure 4.
TF-targets regulation network analysis based on differential gene expression analysis results using the TF-Target Finder Shiny app. (A) Parameter setting and display of differential expression results for TFs extracted from uploaded data; (B) Visualization of the TF-targets regulation network; (C) Viewing and downloading prediction results in Plotting data tab. TF, transcription factor.
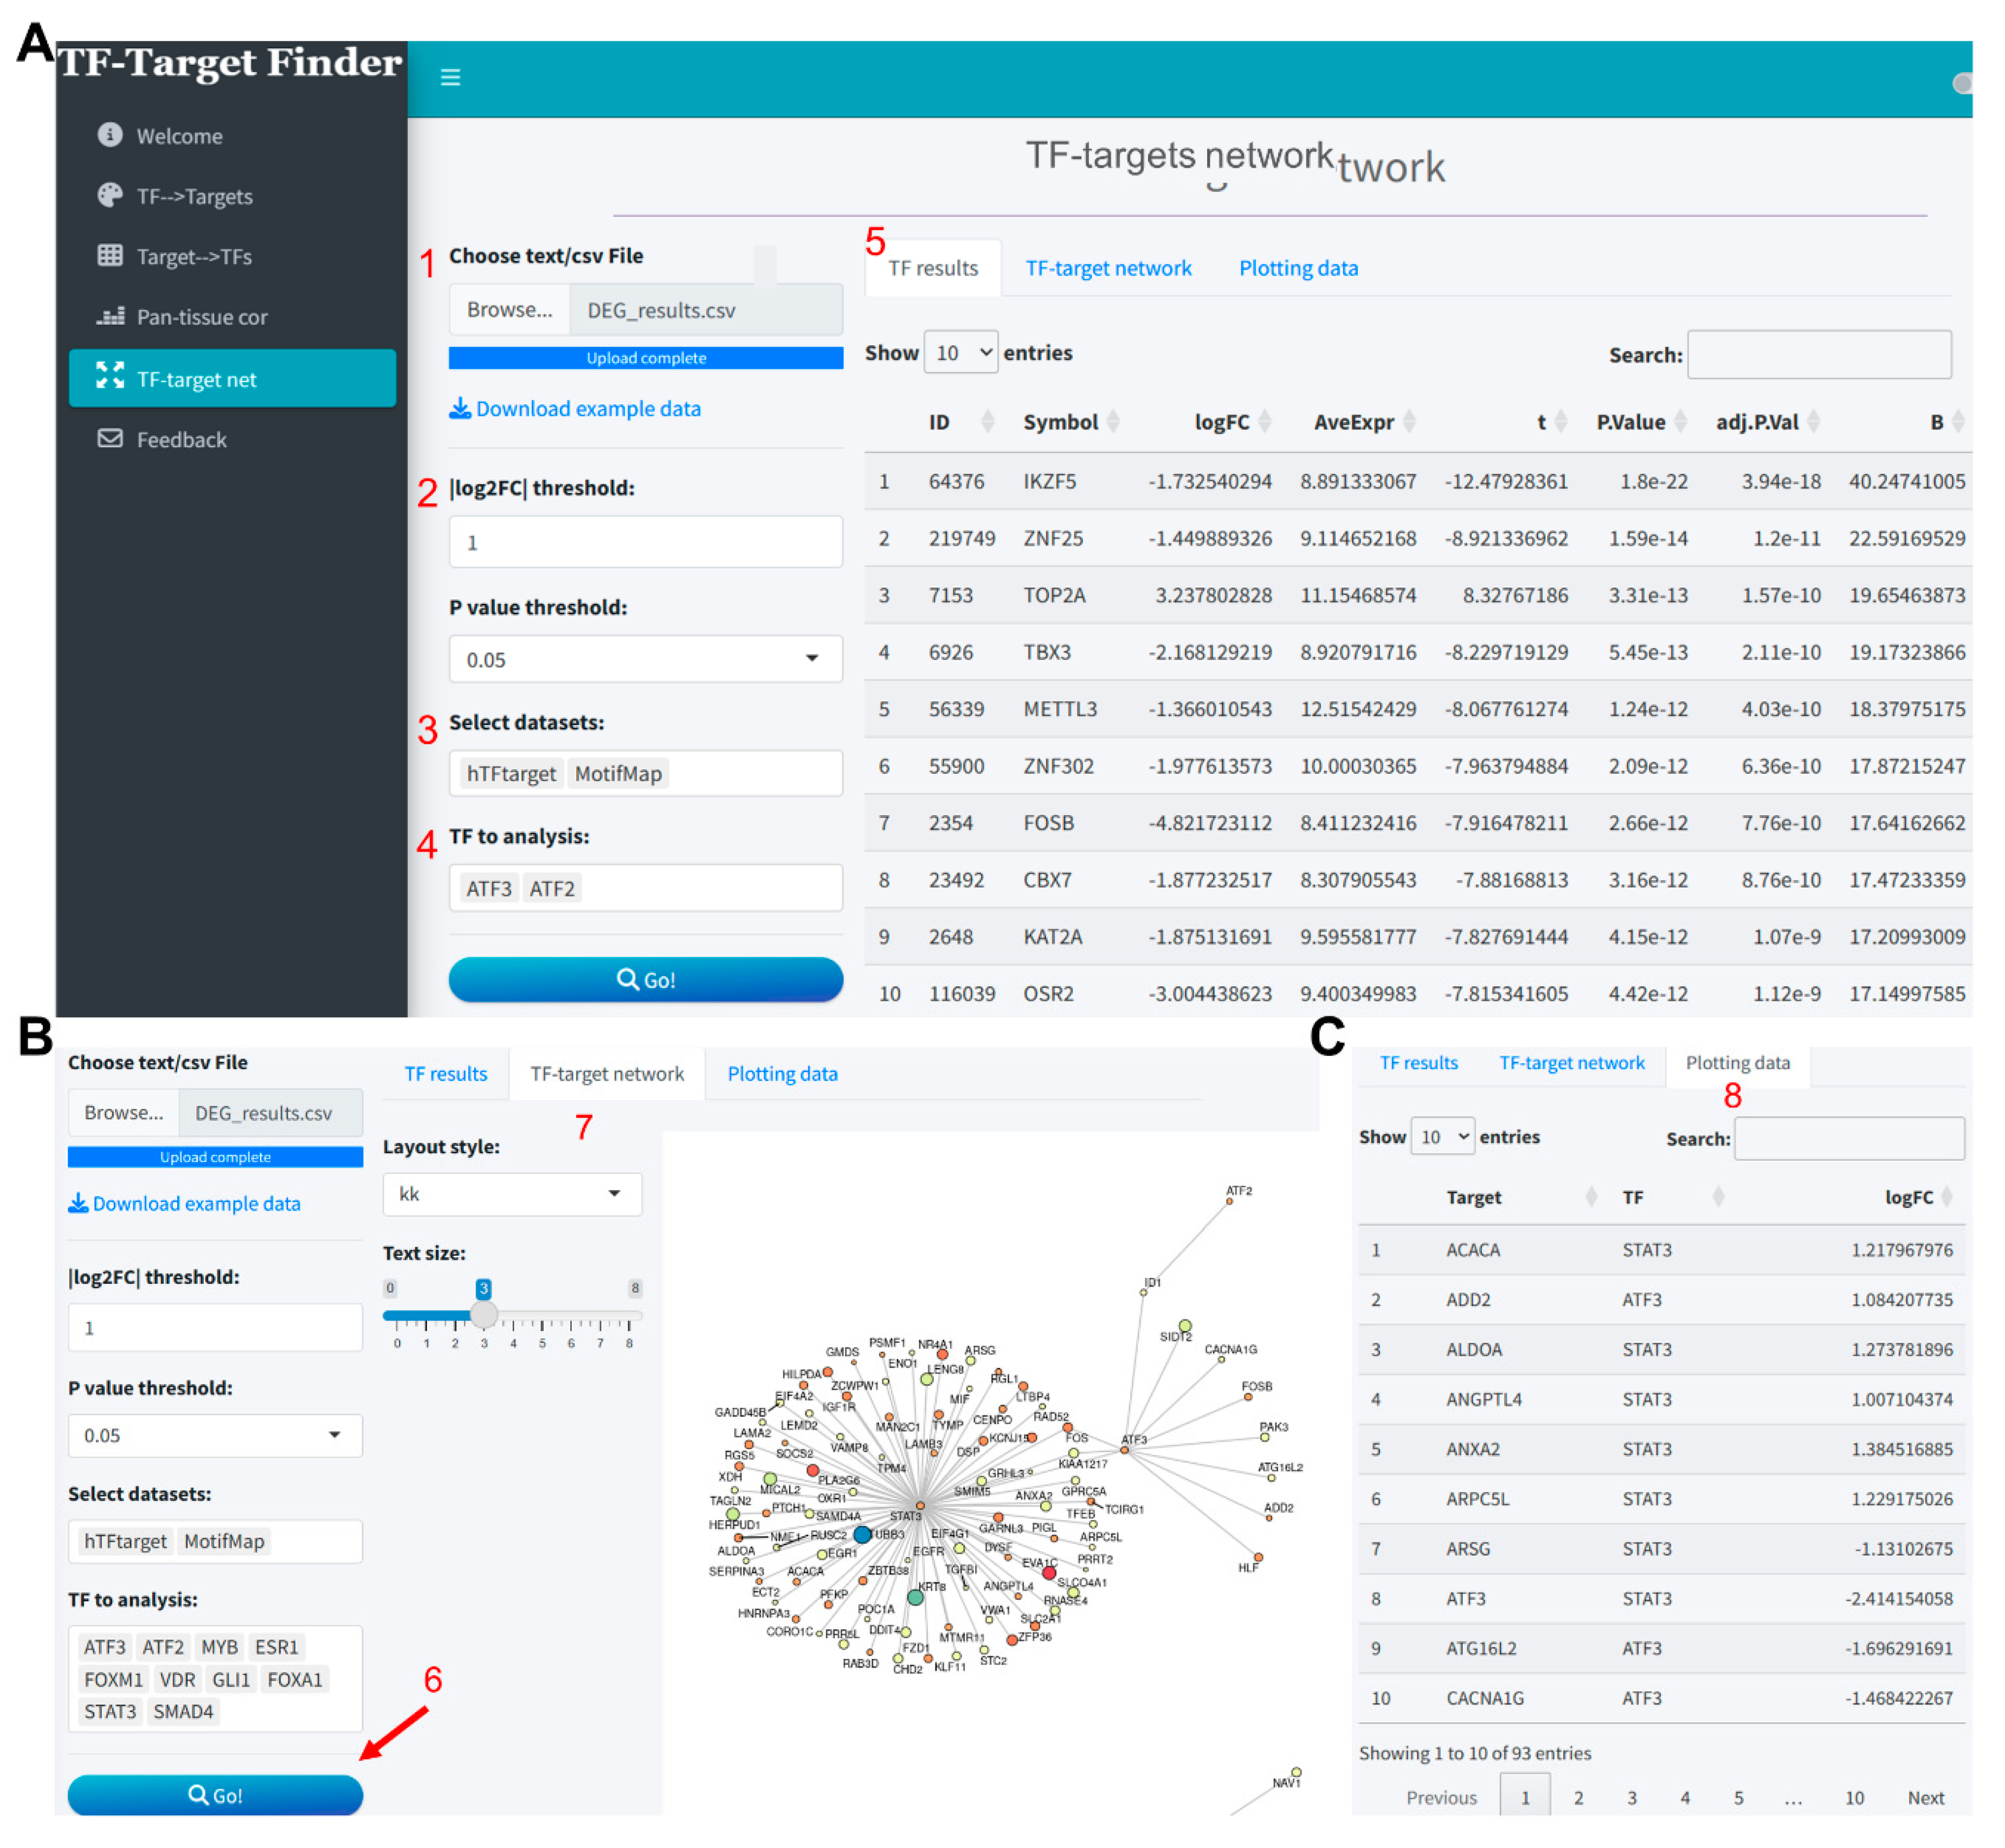

Table 1.
Information of databases used in this shiny application.
| Data type | Datasets | DB link | Data source | Evidence |
|---|---|---|---|---|
| TF database | MotifMap [9,10] | http://motifmap.ics.uci.edu/ | http://motifmap.ics.uci.edu/ | motifs |
| hTFtarget [11] | https://guolab.wchscu.cn/hTFtarget/#!/ | http://bioinfo.life.hust.edu.cn/hTFtarget#!/ | ChIP-Seq data | |
| KnockTF [7,8] | https://bio.liclab.net/KnockTFv1/ | https://bio.liclab.net/KnockTF/index.php | Knockdown/knockout | |
| TRRUST [12,13] | https://www.grnpedia.org/trrust/ | https://www.grnpedia.org/trrust/ | Pubmed | |
| Cistrome DB [14] | http://cistrome.org/db/ | http://cistrome.org/db/#/ | ChIP-Seq and DNase-Seq | |
| ENCODE [15] | https://www.encodeproject.org/ | https://maayanlab.cloud/Harmonizome/dataset/ENCODE+Transcription+Factor+Targets | ChIP-Seq data | |
| JASPAR [6] | https://jaspar.elixir.no/ | https://maayanlab.cloud/Harmonizome/dataset/JASPAR+Predicted+Transcription+Factor+Targets | motifs | |
| Gene expression database | GTEx [17] | https://www.genome.gov/Funded-Programs-Projects/Genotype-Tissue-Expression-Project | https://xenabrowser.net/datapages/?dataset=gtex_rsem_isoform_tpm&host=https%3A%2F%2Ftoil.xenahubs.net | gene expression RNAseq |
| TCGA [18] | https://portal.gdc.cancer.gov/ | https://xenabrowser.net/datapages/?dataset=tcga_RSEM_gene_tpm&host=https%3A%2F%2Ftoil.xenahubs.net | gene expression RNAseq | |
| CCLE [19] | https://sites.broadinstitute.org/ccle/ | https://xenabrowser.net/datapages/?dataset=ccle%2FCCLE_DepMap_18Q2_RNAseq_RPKM_20180502&host=https%3A%2F%2Fucscpublic.xenahubs.net | gene expression RNAseq |
Table 2.
Key R packages and their functions in shiny application development.
| R Package | Function |
|---|---|
| shiny | Building interactive web application UI |
| bs4Dash | Advanced UI design with Bootstrap 4 integration |
| httr | Handling HTTP requests for web data retrieval |
| rvest | Web scraping functionalities |
| curl | Data transfer with URL syntax |
| jsonlite | Parsing JSON data |
| UCSCXenaShiny [21] | Extracting gene expression data from XENA database |
| RMySQL | Accessing and extracting database data |
| VennDiagram | Venn diagram visualization |
Disclaimer/Publisher’s Note: The statements, opinions and data contained in all publications are solely those of the individual author(s) and contributor(s) and not of MDPI and/or the editor(s). MDPI and/or the editor(s) disclaim responsibility for any injury to people or property resulting from any ideas, methods, instructions or products referred to in the content. |
© 2024 by the authors. Licensee MDPI, Basel, Switzerland. This article is an open access article distributed under the terms and conditions of the Creative Commons Attribution (CC BY) license (http://creativecommons.org/licenses/by/4.0/).
Copyright: This open access article is published under a Creative Commons CC BY 4.0 license, which permit the free download, distribution, and reuse, provided that the author and preprint are cited in any reuse.


