
Submitted:
11 June 2025
Posted:
12 June 2025
You are already at the latest version
Abstract
Previous high throughput screening studies indicated trans-eQTLs tend to be tissue specific. In this study, I probed if this feature can be used to find tissue-specific gene regulatory networks. eQTL data for 19,960 genes were obtained from the eQTLGen study. Next, eQTLs that display both cis and trans regulatory effects (P<5e-8) were selected and the association between their corresponding genes were examined by Mendelian randomization. The findings were once more validated using eQTL data from the INTERVAL study. The trans-regulatory impact of 138 genes on 342 genes were detected (P≤5e-8). Majority of the identified gene-pairs aggregated into networks with scale free topology. Examining the function of genes indicated they are involved in immune processes. The hub genes mainly shared transcription regulation activity. On average a gene in the network was under the regulatory control of 34 cis-eQTLs and 6 trans-eQTLs and genes with higher heritability tended to exert higher regulatory impact. This study indicates tissue-specific gene-regulatory networks can be detected by investigating their genomic underpinnings. The identified networks displayed scale-free topology indicating hub genes of a network could be targeted to correct abnormalities at cellular level.
Keywords:
trans-eQTLs
; tissue specificity
; gene regulatory network
; scale-free network
; Mendelian randomization
Introduction
The combination of active genes and the
interactions between them within a cell generates a gene regulatory network
(GRN) that enables a cell to specialize in fulfilling its function. Therefore,
an improved understanding of GRNs paves the way to use such information not
only as a means to understand the principles of gene regulation but also as a
tool to drive cell fate for purposes such as cellular engineering, or to
prevent disease outcome 1. There are several approaches to infer
GRNs from omics data 1–3. These approaches rely on a combination of
biological and statistical information to identify pairs of related genes for
the construction of GRNs. Approaches such as co-expression network analysis aim
to build a network by identifying genes whose expression profiles are
correlated. While these approaches systematically examine the genome and as
such are hypothesize-free, the retrieved network is undirected due to the
symmetrical nature of correlations. Other methods try to resolve this issue by
including biological information. Notably, they use data from CHIP-seq and
cis-regulatory elements to identify transcription factors that bind to target
genes and as such turn the undirected network into a network that its edges
indicate causality. The gene regulatory network obtained from such approaches
does not comprehensively cover the interactions among gene products, (e.g.
functional interaction at pathway level). They assign transcription factors to
their target genes based on genomic proximity which could introduce bias in the
presence of distal regulatory effects 1–3. They are not shielded
against environmental factors that influence daily level of a transcript.
Finally, current approaches rely on individual level data and as such cannot be
used in situation that sharing the data is not possible. In this study, I describe
a method based on eQTLs that can address the aforementioned issues.
An eQTL or an expression quantitative trait locus
is a site on DNA that variation in its sequence impacts the expression of a
gene. If an eQTL is located near the gene it acts upon, it is referred to as a
cis-eQTL; however, if it is located distant from its gene of origin, sometimes
on a different chromosome, it is referred to as a trans-eQTL. Over the past
decades, high throughput studies have been conducted to map the eQTLs. Results
from these studies which basically summarize the magnitudes and the natures of
associations between genomic variants (eQTLs) and genes then are considered
collectively to investigate the genetics of transcriptome. An insight from
these studies is the evidence that trans-eQTLs tend to be tissue specific 4–6.
A new development in this field is the advent of statistical methods that can
leverage publicly available GWAS summary statistics including eQTLs to
investigate the nature of relation between two biological entities (e.g. two
genes) 7,8. A prominent method in this regard is Mendelian
randomization that can not only test the association between two genes, but
also differentiate between causation and correlation 9,10; moreover,
because Mendelian randomization uses a set of independent SNPs for association
testing, the results are immune to the bias that could be introduced by the
environmental (non-genetic) factors. Building upon these progresses, in this
study, I devised a workflow based on Mendelian randomization that can
complement the previous approaches for constructing tissue-specific GRNs.
Methods
Discovery Step
Previously,
the eQTLGen consortium 11 has investigated the genetic architecture
of blood gene expression. The data in the eQTLGen Consortium consist of 31,684
blood and PBMC samples (19.6% of samples) obtained mainly from studies
conducted in European populations. Gene expression profiling of samples was
carried out using expression arrays and RNA-sequencing (20.3% of samples). By conducting a meta-analysis, the authors combined the
eQTL summary association statistics for 19,960 genes from 37 studies 11. The outcome of the
meta-analysis revealed cis-eQTLs for 16,987 genes (FDR<0.05); furthermore,
by selecting 10,317 trait-associated SNPs, the authors identified trans-eQTL
for 6,298 genes.
Validation Step
To replicate the findings from the discovery step,
I obtained eQTL data from the INTERVAL study12 in which the authors
have recently conducted eQTL mapping in blood samples obtained from 4,732
participants of European origin. The INTERVAL study is a randomized trial of
around 50,000 healthy blood donors, who were recruited at 25 centres of
England’s National Health Service Blood and Transplant and aged 18 years or
older at recruitment. Gene expression profiling of samples in this study was
achieved by RNA-sequencing. After processing the generated data, I obtained
eQTLs for 17,362 transcripts.
Mendelian Randomization
I used the procedure outlined in to identify
gene(s) through which a trans-eQTL exerts its impact.
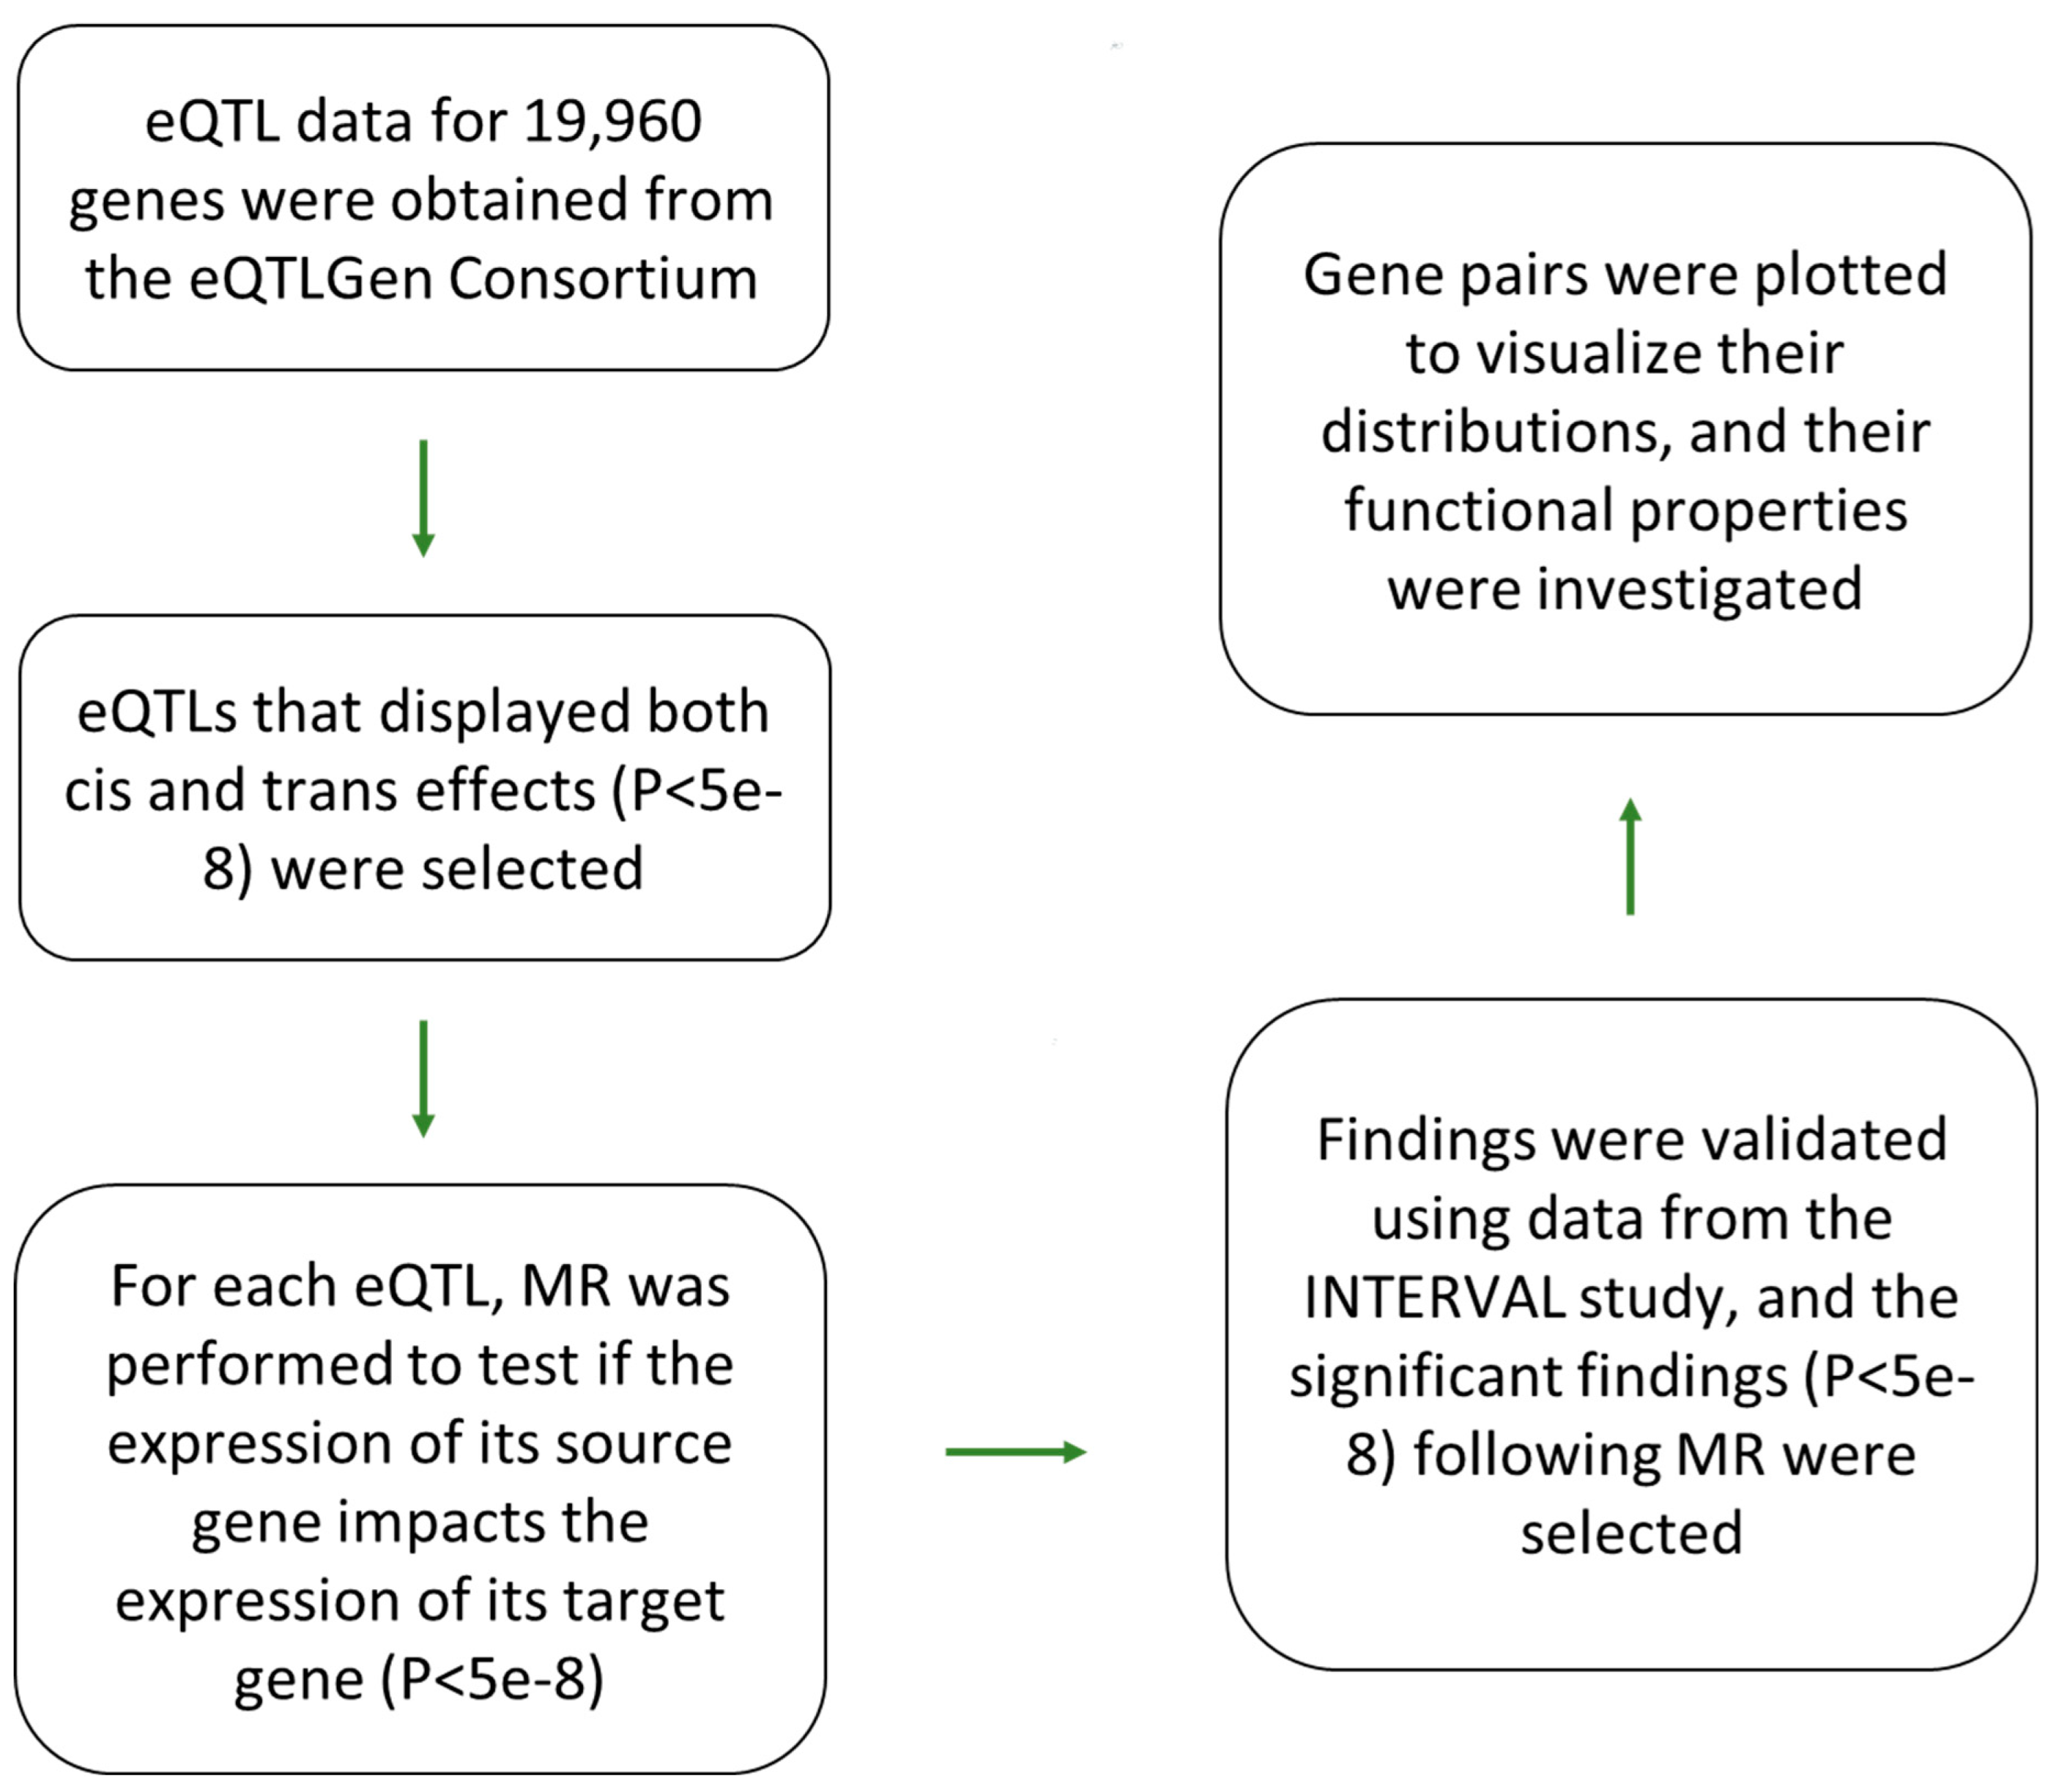
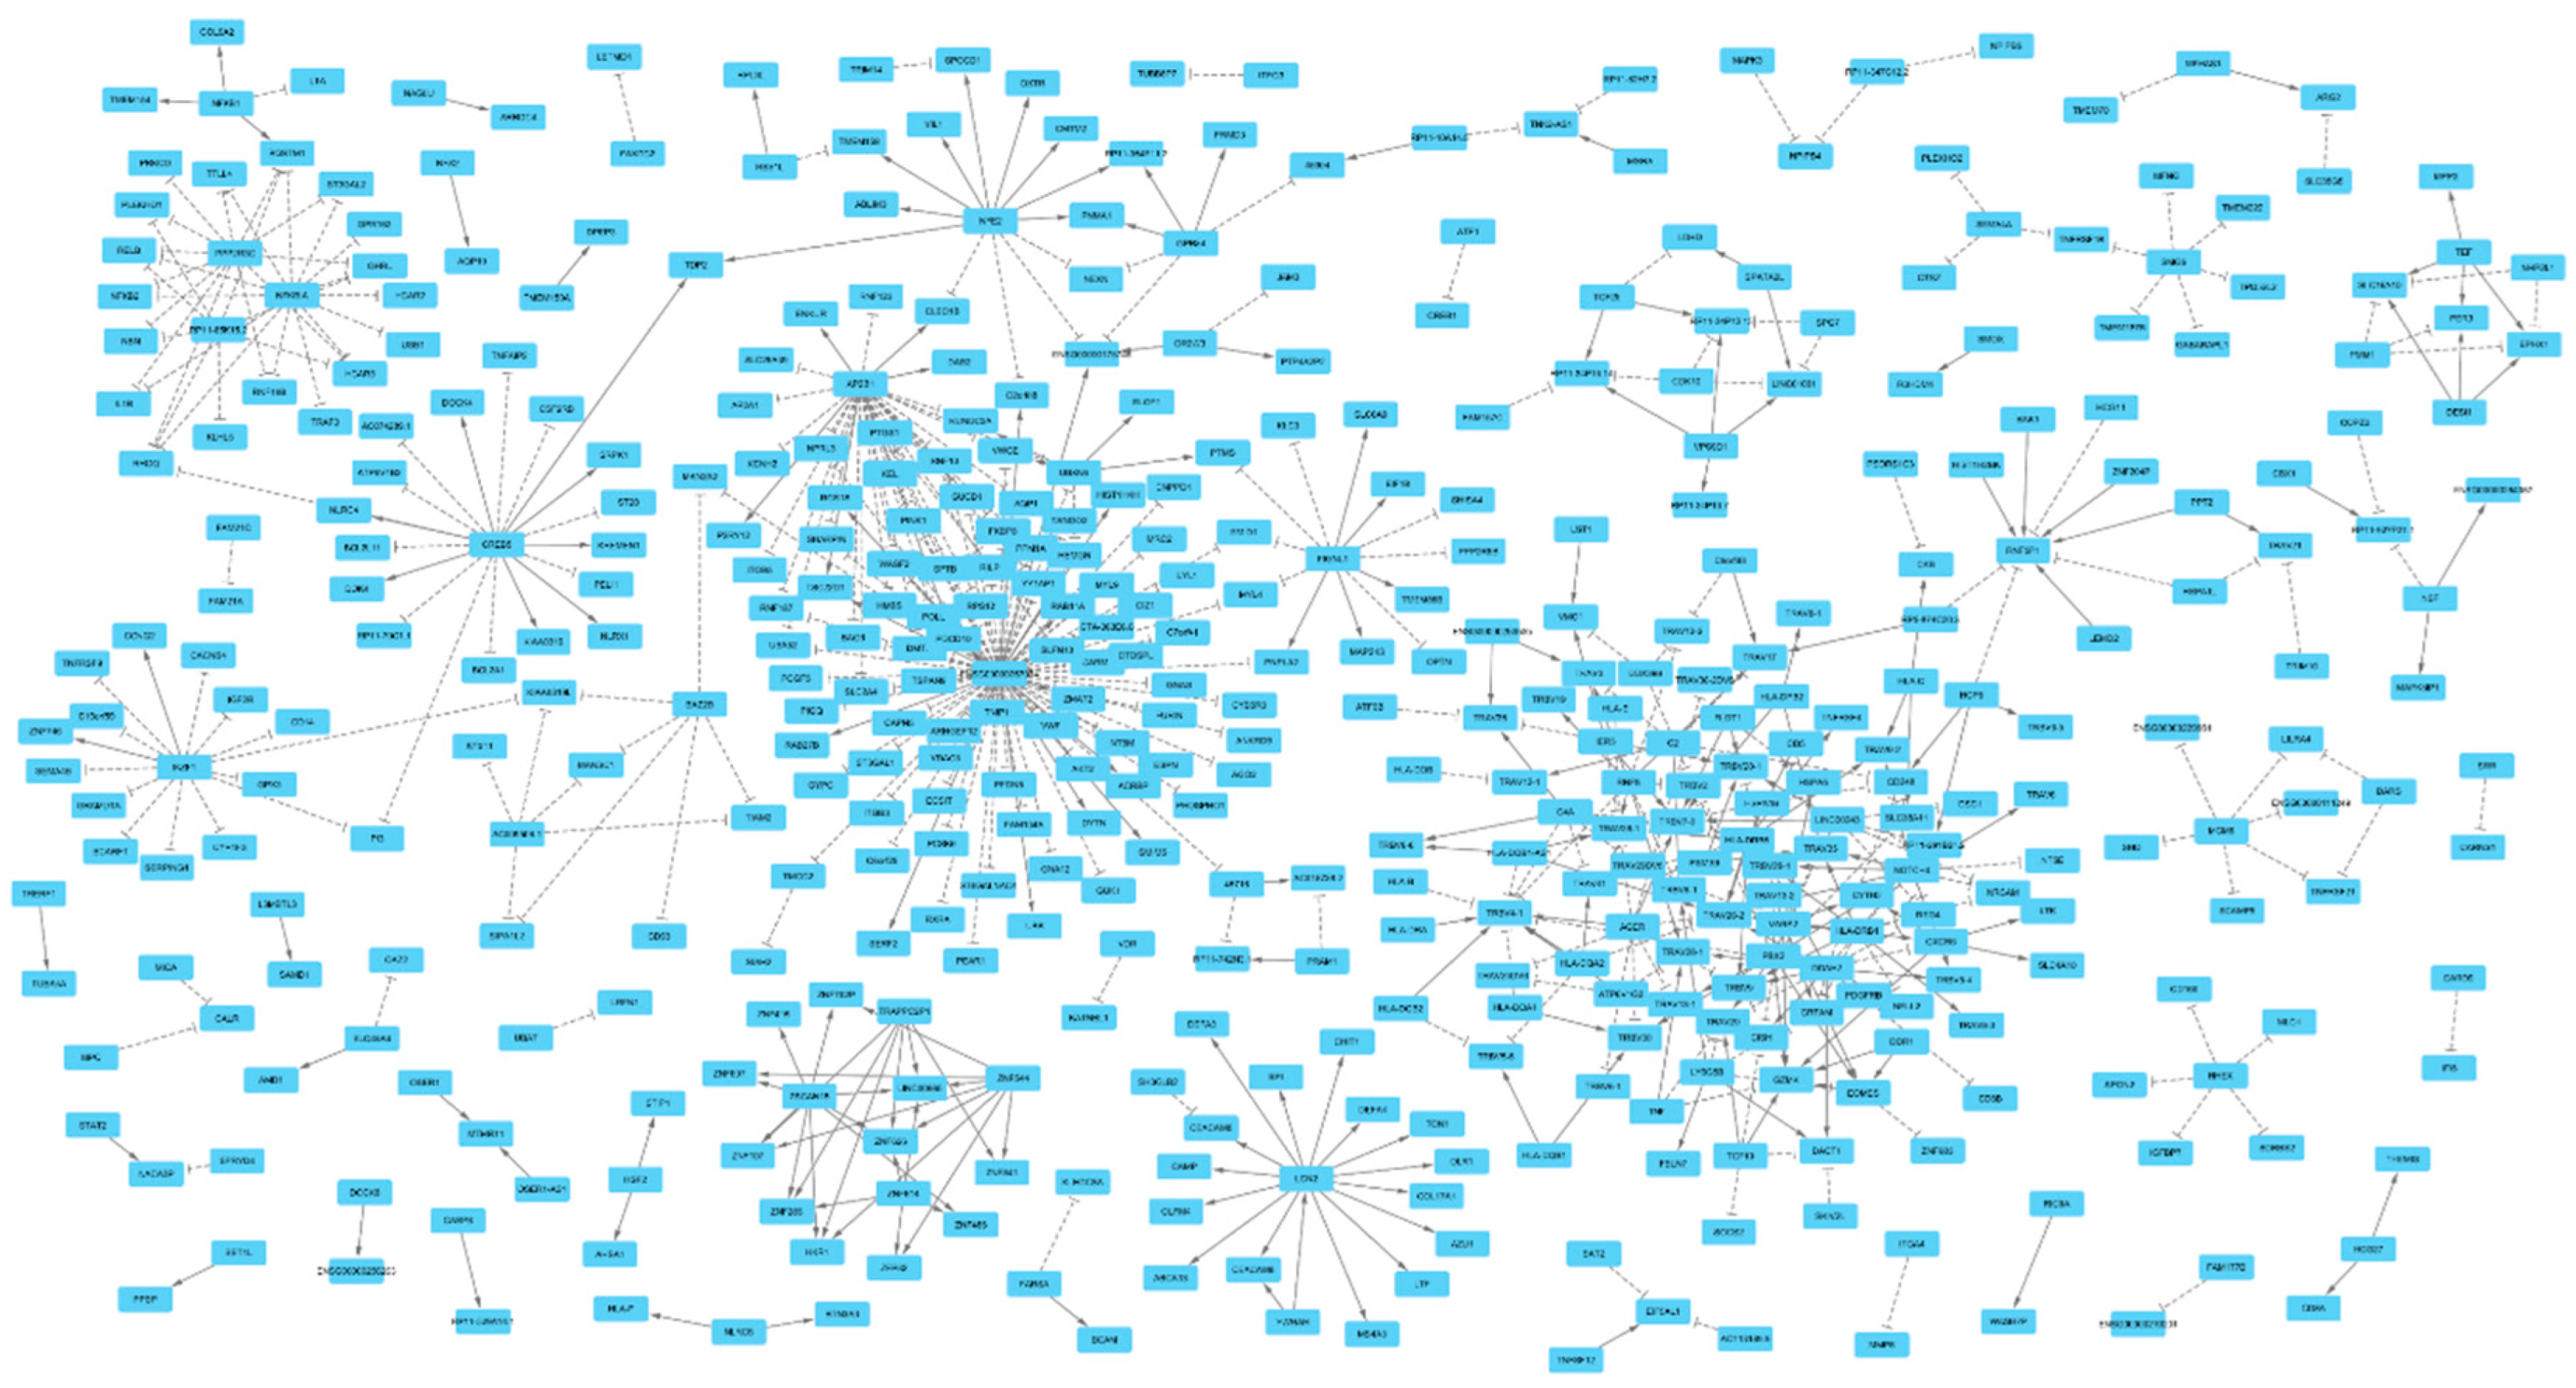
Figure 1.
eQTL-based analytical pipeline that was used to identify and characterize gene-regulatory networks in blood. Initially, eQTLs (P<5e-8) that display both trans and cis effects were selected from the eQTLGen study. Next, Mendelian randomization was performed to examine if change in the expression of the source gene (associated with the cis effect) impacts (P<5e-8) the expression of the target gene (associated with the trans effect). The gene pairs obtained from this step, were once more validated using the eQTL data from the INTERVAL study. Significant gene-pairs were selected and plotted to view the nature of relation between them. Functional analysis was performed on the generated network to identify significantly enriched biological processes. The properties of eQTLs underlying the network were investigated for molecular insight.
Figure 2.
Overview of the gene network identified in this study. Mendelian randomization revealed 597 gene-pairs (P<5e-8) that aggregated into networks with scale-free topology (S1 Figure). An edge with an arrow end indicates as the expression of the source gene increases, the expression of the target gene increases as well; whereas, an edge with a T end indicates an inverse association. Statistical details on the nature of association between gene pairs are provided in Table S1.
Mendelian randomization is a statistical method
that can investigate the nature of relation between two biological entities by
comparing their magnitudes of association to several genetic markers. The test
typically uses a set of independent (in linkage equilibrium) SNPs that are
associated with the predictor (e.g. the expression of the source gene) to
investigate the impact of change in the level of the predictor on the outcome
(expression of the target gene). For the purpose of
this study, I used the GSMR program to conduct the Mendelian randomization 13.
By comparing the files containing eQTL summary statistics for the source gene
and the target gene, the program finds a set of shared SNPs that are in linkage
equilibrium (r2<0.2) and significantly associated (P<5e-8)
with the expression of the source gene. It then uses the set of SNPs to
investigate if change in the expression of the source gene impacts the
expression of the target gene. The program achieves this
purpose by plotting SNPs on a scatter plot based on their effect sizes (β
regression coefficients) on the source gene (x-axis) and the target gene
(y-axis) and calculating the statistical parameters of the regression line
(line of best fit). As compared to other methods for Mendelian
randomization, GSMR accounts for the sampling variance in β estimates and the
linkage disequilibrium (LD) among SNPs, as such it has higher statistical
power.
Given that eQTL data obtained from samples of
European origin, I used the genotype data from the 1000 Genomes-European
population to compute the degree of linkage disequilibrium (LD) among SNPs.
Gene pairs that showed significant (P<5e-8) and
concordant direction of association in the discovery and the validation step
were selected and plotted using the Cytoscape software (version 3.10.1 ) 14
in order to find if they form a network. DAVID functional tool (version 2023q4)
15 was used to identify biological processes that are overrepresented among the identified genes.
eQTL Pruning
To understand the properties of eQTLs underlying
the genes of the network, I generated a list of independent (r2<0.2)
eQTLs per gene using the clump algorithm implemented in PLINK (v.1.9) 16.
In summary, the algorithm takes a list of eQTLs and their P-values, conducts LD
pruning, and returns a list of eQTLs in linkage equilibrium and prioritized by
P-values. Following the LD pruning, the phenotypic variance (, proportion of variation in a gene expression)
attributed to an eQTL was calculated using the equation:
where is the frequency of minor allele and is it’s the regression coefficient derived from
the association model 17. eQTLGen consortium reported Z-scores
instead of regression coefficients. As such, a conversion was made using the
equation:
where represents Z-score, is the frequency of effect allele and is the sample size 8.
Results
By following the analytical pipeline, described in Figure 1, trans-eQTLs and cis-eQTLs were initially matched to identify eQTLs that
display both cis and trans regulatory effects. Through this procedure, I
identified 55,884 gene pairs that shared at least an eQTL (P<5e-8) in the
eQTLGen dataset. The retrieved gene list was once more investigated in the
validation study. A total of 15,522 gene pairs were identified that also shared
an eQTL (P<5e-8) in the INTERVAL dataset (validation study). Next, Mendelian
randomization was performed separately in the discovery and validation dataset
and the findings were compared. A total of 617 gene-pairs were identified that
showed significant causal association (P<5e-8) following MR analysis in both
the discovery and the validation step. Majority of gene-pairs (N=587) showed
concordant direction of associations in the discovery and the validation step
and were selected for the post-hoc analysis (S1 Table). They consist of
138 genes that exerted trans-regulatory impact on 342 genes (a total of 474
genes, 6 genes acted as both source and target gene). Next, gene ontology (GO)
enrichment analysis was conducted to find if the identified genes are
functionally related. The outcome revealed the genes are involved in immune
processes (Table
1). To investigate the
robustness of findings, 1000 random gene-sets of the same size (N=474 genes)
were drawn from the eQTLGen database and their functions were investigated. The
analysis was done in the R environment (version 4.2.2) using the gprofiler2 18
that systematically performs GO enrichment analysis on inputs of gene lists.
The outcome of analyses was mainly null and revealed a few unrelated biological
processes (S2 Table).
To investigate the possibility of bias in the results, due to the presence of the HLA region. Genes located within this region (coordinates: chr6:28,477,797-33,448,354, based on GRCh37) were excluded and the remaining gene-pairs were subjected to functional enrichment analysis. The findings once more confirmed the identified gene-pairs share immune function (GO Term:0045087, innate immune response, Bonferroni corrected P=0.003).
To investigate the distribution of the identified gene-pairs, next, I entered them into the Cytoscape software that from a list of gene-pairs attempts to generate a network by joining pairs that share a gene. The outcome of analysis revealed majority of gene-pairs aggregated into networks with scale free topology (Figure 1) and distribution of the number of genes by frequency of the edges also indicated a power law distribution (S1 Figure). While 77% of genes (N=361) had on average 1.3 edges, a group of 10 genes (ENSG00000267074, AP2B1, CREB5, DDAH2, LCN2, IKZF1, NFKBIA, NFE2, and PPP2R3C) have an average 24 edges and accounted for 20% of interactions. These hub genes had high regulatory impact on the network. Notably, among them was ENSG00000267074 that exerted trans-regulatory impact on 85 genes. Examining the function of these genes indicates they are involved in blood coagulation processes. ENSG00000267074 is a long non-coding RNA (lncRNA) gene, therefore, its trans-regulatory function could be attribute to its role in transcription regulation. CREB5, IKZF1, NFKBIA, NFE2 and PPP2R3C were other hub genes that also had transcription regulation functions. Examining the impact of the hub genes on the phenome, in dictates they are mainly involved in regulating blood cell traits (S3 Table).
In contrast to the hub genes, I identified genes that were the target of several genes. Notably, TRBV4-1, RNF5P1, TRAV26-2, TRBV7-3, TRAV35, GZMK, TRAV20, TRAV38-1, TRBV20-1, CD248 were under the regulatory impact of ≥ 5 genes. Examining the function of these genes indicated they share immune function and were mainly under the regulatory impact of genes in the HLA region. TRAV20, TRAV26-2, TRAV35, TRAV38-1, TRBV20-1, TRBV4-1, TRBV7-3 are T cell receptors; moreover, CD248 and GZMK also have immune functions.
Next, I examined the properties of eQTLs underpinning the identified genes. In average, a gene was under the regulatory impact of 34 cis-eQTLs (SE=1.7, Median=23) and 6 tran-eQTLs (SE=0.3, Median=4). This indicates Mendelian randomization is well-suited to identify functional interactions. In average, a cis-eQTL explained 1% of phenotypic variance in expression of a gene, while this value was 0.6% for a trans-eQTL.
I found genes in the network that tend to act as source genes display higher gene expression heritability as compared to those acting as target genes (P=5.9e-6). Furthermore, these genes had higher centrality measures, including betweenness centrality (P=0.03), and closeness centrality (P=2.2e-16).
Discussion
Gene regulatory network (GRN) enables a cell to specialize in carrying out its function. There are various cell types in the body and identification of their GRNs are important for various biological purposes including to better diagnose and treat diseases. There are currently several approaches that can investigate such networks by analyzing the raw data available at individual levels. This hinders the possibility of collaboration among researchers due to privacy and logistical considerations in sharing the raw data. Furthermore, as indicated in the introduction, the existing methods make a number of assumptions for generating GRNs; however, such assumptions could introduce bias in the presence of alternative scenarios. The method proposed in this study provides several benefits. First, it can scan the genome systematically (hypothesis-free) and identify genes whose transcripts are related. Second, because it uses SNPs (eQTLs) to test the association between two gene transcripts, it is undisturbed by the impact of confounding environmental factors that cause fluctuations in daily level of a transcript. Finally, it relies on summary association statistics that are publicly available, as such it provides a convenient path for researchers who wish to combine data from several studies to identify GRNs with higher statistical power.
By applying the devised workflow to eQTL data for blood, through the discovery and validation step, I detected 597 gene-pairs that aggregated into gene-regulatory networks. Examining the function of the genes indicated they share immune function which is expected considering that eQTL data were obtained from studies that used blood samples. The topology of the network indicated a scale free network 19. A core of 10 genes accounted for 20% of the interactions and the distribution of interactions per gene followed a power law distribution (S1 Figure). If this happens to be the case in other cell types then this provides a convenient path for therapeutic interventions, because a scale free network is manageable by targeting its hub genes. Findings from this study, support the results of Li et al. 20 in which based on ChIA-PET data, the authors reported interactions between proximal and distal regulatory regions interweave into organized network communities that are enriched in specific biological functions.
In this study, I noted that a gene in the network is under the regulatory impact of about 39 eQTLs as such, mendelian randomization is a well-suited tool to detect functional interactions; however, to fairly examine the association between two genes, access to full GWAS summary statistics data is required. This is important considering that two genes could be on different chromosomes and under the influence of different trans-regulatory elements. Access to full GWAS summary statistics is also important to compute gene expression heritability estimates. In this study, I noted a positive correlation between higher values of gene expression heritability and likelihood of a gene exerting regulatory impact on the network. Furthemore, trans-eQTLs underlying the network displayed small effect sizes as such, to construct a GRN using eQTLs, it is important to obtain data from studies with decent sample size.
This study is not without limitations, although eQTLGen consortium has a large sample size and as such well-powered for detecting eQTLs; however, the authors did not provide full eQTL summary association statistics, this limits the application of the current data for genome-wide studies. With regard to trans-eQTLs, the authors provided summary association statistics for 10,317 SNPs that previously showed association with the phenome. This could introduce a selection bias if SNPs are selected with regard to a specific category of traits; however, as summarized in S4 Table, this was not the case in the eQTLGen study, namely, the selection of SNPs for trans-eQTL mapping was not with regard to a specific category of traits (S4 Table). Furthermore, the INTERVAL study reported their trans-eQTLs without considering their associations with traits. Therefore, by selecting SNPs that display both cis and trans-eQTL effects and conducting Mendelian randomization. I investigated biological processes among gene-pairs from the INTERVAL study that showed significant association (P<5e-8) following Mendelian randomization. The outcome of GO-BP enrichment analysis indicated the identified genes mainly share immune function (S5 Table), therefore the selection procedure applied to trans-eQTL data at the eQTLGen study is unlikely to be a major issue.
In summary, this study provides a workflow based on eQTLs to identify tissue-specific gene-regulatory networks. The identified network displayed scale-free topology, if further research substantiate this finding, then in each network, targeting the hub genes could provide a solution to treat abnormalities at cellular level. Furthermore, considering that the current well-powered studies for trans-eQTL mapping are limited to blood, it is important to extend such efforts to other tissues.
Supplementary Materials
The following supporting information can be downloaded at the website of this paper posted on Preprints.org.
Funding
This research received no external funding.
Institutional Review Board Statement
Not applicable
Informed Consent Statement
Not applicable
Data Availability Statement
eQTL summary association statistics were obtained from the eQTLGen (https://www.eqtlgen.org/phase1.html) and INTERVAL study (https://www.omicspred.org/downloads). 1000 Genomes genotype data (phase 3) were obtained from https://www.cog-genomics.org/plink/2.0/resources#phase3_1kg.
Acknowledgments
This research work was enabled in part by computational resources and support provided by the Compute Ontario and the Digital Research Alliance of Canada.
Conflicts of Interest
The author declares no competing interests.
References
- Badia-i-Mompel, P.; et al. Gene regulatory network inference in the era of single-cell multi-omics. Nature Reviews Genetics 2023, 1–16. [Google Scholar] [CrossRef] [PubMed]
- McCalla, S. G.; et al. Identifying strengths and weaknesses of methods for computational network inference from single-cell RNA-seq data. G3 Genes|Genomes|Genetics 2023, 13. [Google Scholar] [CrossRef] [PubMed]
- Mercatelli, D., Scalambra. Gene regulatory network inference resources: A practical overview. Biochimica et Biophysica Acta (BBA) - Gene Regulatory Mechanisms 2020, 1863, 194430. [Google Scholar] [CrossRef] [PubMed]
- Consortium, Gte. The GTEx Consortium atlas of genetic regulatory effects across human tissues. Science 2020, 369, 1318–1330. [Google Scholar] [CrossRef] [PubMed]
- Price, A. L.; et al. Single-tissue and cross-tissue heritability of gene expression via identity-by-descent in related or unrelated individuals. PLoS Genet 2011, 7, e1001317. [Google Scholar] [CrossRef] [PubMed]
- Nica, A. C. & Dermitzakis, E. T. Expression quantitative trait loci: present and future. Philosophical Transactions of the Royal Society B: Biological Sciences 2013, 368, 20120362.
- Pasaniuc, B. & Price, A. L. Dissecting the genetics of complex traits using summary association statistics. Nature Reviews Genetics 2017, 18, 117–127.
- Zhu, Z.; et al. Integration of summary data from GWAS and eQTL studies predicts complex trait gene targets. Nat Genet 2016, 48, 481–487. [Google Scholar] [CrossRef] [PubMed]
- Davey Smith, G. & Hemani, G. Mendelian randomization: genetic anchors for causal inference in epidemiological studies. Human molecular genetics 2014, 23, R89–R98.
- Zhu, Z.; et al. Causal associations between risk factors and common diseases inferred from GWAS summary data. Nat Commun 2018, 9, 224. [Google Scholar] [CrossRef] [PubMed]
- Võsa, U.; et al. Unraveling the polygenic architecture of complex traits using blood eQTL metaanalysis. bioRxiv 2018, 447367. [Google Scholar] [CrossRef]
- Xu, Y.; et al. An atlas of genetic scores to predict multi-omic traits. Nature 2023, 616, 123–131. [Google Scholar] [CrossRef]
- Zhu, Z.; et al. Causal associations between risk factors and common diseases inferred from GWAS summary data. Nat Commun 2018, 9, 224. [Google Scholar] [CrossRef] [PubMed]
- Shannon, P.; et al. Cytoscape: a software environment for integrated models of biomolecular interaction networks. Genome research 2003, 13, 2498–2504. [Google Scholar] [CrossRef]
- Huang, D. W., Sherman, B. T. & Lempicki, R. A. Systematic and integrative analysis of large gene lists using DAVID bioinformatics resources. Nature protocols 2009, 4, 44–57.
- Chang, C. C.; et al. Second-generation PLINK: rising to the challenge of larger and richer datasets. GigaScience 2015, 4. [Google Scholar] [CrossRef] [PubMed]
- Park, J.-H.; et al. Estimation of effect size distribution from genome-wide association studies and implications for future discoveries. Nat Genet 2010, 42, 570–575. [Google Scholar] [CrossRef] [PubMed]
- Kolberg, L.; et al. g:Profiler—interoperable web service for functional enrichment analysis and gene identifier mapping (2023 update). Nucleic Acids Research 2023, 51, W207–W212. [Google Scholar] [CrossRef] [PubMed]
- Barabási, A.-L. & Albert, R. Emergence of scaling in random networks. Science 1999, 286, 509–512.
- Li, E.; et al. Long-range interactions between proximal and distal regulatory regions in maize. Nat Commun 2019, 10, 2633. [Google Scholar] [CrossRef] [PubMed]

Table 1.
Biological processes that are overrepresented in genes of the main network.
| GO-BP ID | Description | P | Corrected P * |
|---|---|---|---|
| 0002250 | Adaptive immune response | 1.0E-25 | 2.3E-22 |
| 0002504 | Antigen processing and presentation of peptide or polysaccharide antigen via MHC class II | 3.2E-09 | 7.2E-06 |
| 0002376 | Immune system process | 1.5E-08 | 3.4E-05 |
| 0002503 | Peptide antigen assembly with MHC class II protein complex | 1.5E-08 | 3.4E-05 |
| 0009617 | Response to bacterium | 1.7E-08 | 3.9E-05 |
| 0019882 | Antigen processing and presentation | 2.2E-08 | 4.9E-05 |
| 0007166 | Cell surface receptor signaling pathway | 2.8E-07 | 6.4E-04 |
| 0045087 | Innate immune response | 3.6E-07 | 8.1E-04 |
| 0019886 | Antigen processing and presentation of exogenous peptide antigen via MHC class II | 2.6E-06 | 5.9E-03 |
| 0006955 | Immune response | 2.8E-06 | 6.2E-03 |
* Corrected for the Bonferroni procedure.
Disclaimer/Publisher’s Note: The statements, opinions and data contained in all publications are solely those of the individual author(s) and contributor(s) and not of MDPI and/or the editor(s). MDPI and/or the editor(s) disclaim responsibility for any injury to people or property resulting from any ideas, methods, instructions or products referred to in the content. |
© 2025 by the authors. Licensee MDPI, Basel, Switzerland. This article is an open access article distributed under the terms and conditions of the Creative Commons Attribution (CC BY) license (http://creativecommons.org/licenses/by/4.0/).
Copyright: This open access article is published under a Creative Commons CC BY 4.0 license, which permit the free download, distribution, and reuse, provided that the author and preprint are cited in any reuse.


