
Submitted:
12 July 2024
Posted:
15 July 2024
You are already at the latest version
Abstract
Recent technological advancements in conservation genetics and genomics have resulted in diverse tools for aiding conservation of species. The precision and resolution of high throughput sequencing technologies provide valuable insights to aid conservation decisions, but these technologies are often financially unfeasible or unavailable in resource constrained countries. Inter-Simple Sequence Repeat (ISSR) markers, when combined with sensitive automated detection systems, provide a simple, cheap means to investigate genetic diversity and discriminate closely related species. Here we apply this technology to assess genetic diversity and taxonomic delimitation in the Encephalartos eugene-maraisii species complex, a highly threatened, taxonomically dubious group of cycads in South Africa. Our analyses support taxonomic singularity of E. dyerianus, E. dolomiticus and E. eugene-maraisii. Relationships between E. nubimontanus and E. cupidus remain uncertain. E. middelburgensis samples showed no clustering but had poor amplification success. This study demonstrates the suitability of automated ISSR fingerprinting as a method for plant conservation studies, especially in resource-constrained countries, and we make recommendations as to how this methodology can be effectively implemented.
Keywords:
cycad
; ISSR
; conservation genetics
; species complex
; developing countries
; technological impediment
1. Introduction
The field of genetics and genomics has evolved greatly in the wake of ongoing technological advancements [1,2,3]. Consequently, diverse methods have arisen to investigate genetic diversity. Some of these methods gain popularity and momentum only to be replaced by subsequent more effective and faster techniques, e.g. allozymes [4], Restriction Fragment Length Polymorphisms (RFLPs [5]) while some methods such as microsatellites endure the tests of time [6,7]. The development and subsequent availability of high-throughput sequencing methods (“next generation sequencing”- NGS) has once again changed the game for conservation genetics, providing highly informative and precise genetic information for diverse applications [1,3]. These methods such as SNP’s, genotyping-by sequencing (GBS), Restriction-site associated DNA sequencing (RADseq [8]), Multiplexed ISSR genotyping-by-sequencing (MIG-seq [9]) etc. provide invaluable insights into aspects such as population diversity, dynamics and viability, identifying taxonomic and management units, detecting local adaptation, predicting genetic effects, all of which can greatly inform conservation decisions [1,3,10].
However, these high throughput NGS methods are often prohibitively expensive in developing countries due to a lack of infrastructure, skill and resources, as well as unfavourable exchange rates for equipment and consumables [2,11,12]. Consequently, these countries have to resort to cheaper genetic markers [7]. These countries are coincidentally also often biodiverse, containing disproportionately high levels of rare taxa, and experience great human or climate related pressures, further increasing extinction risks of endemic or rare species in these countries [13].
Because of this financial and skills inequity, conservation research is not performed in areas where it is most needed [11,12]. Conservation spending (and budgets) correlate to the level of research performed and reduction in the rate of biodiversity loss in these countries [12,14]. It is thus imperative to provide support for these countries, while also investigating and implementing simpler and more cost-effective genetic methods more accessible to local researchers and institutions [2,12].
One such method is Inter Simple Sequence Repeats (ISSRs [15,16]). ISSR markers are generated from PCR reactions using flanking microsatellite regions as priming sites [15,16]. The ubiquity and variability of microsatellites in eukaryotes mean many priming sites are available throughout the genome leading to increased resolution and almost full genome coverage, all whilst requiring no a priori sequence information [15,16,17,18,19,20,21,22]. The main benefits of ISSRs are their cost, speed and simplicity compared to other methods [6,17,23,24]. Moreover, the use of PCR allows the rapid generation of large volumes of markers from only a small amount of DNA [20,24]. ISSRs are also highly sensitive markers suitable for discriminating closely related species and investigating intraspecies variation [21,25,26]. ISSRs thus offer a higher degree of resolution compared to other “fingerprinting” molecular methods [21]. Compared to RFLPs and RAPDs, ISSR markers give similar results but produce more extensive and informative datasets for less cost, time, and labour [17,24]. In contrast, methods, such as AFLP markers, although more reproducible and accurate, are more costly and complicated [17]. ISSRs are also more reproducible than RAPD markers [17], but are less reproducible than RFLPs [24]. ISSRs are thus very useful molecular markers in ecological, genetic diversity and even systematic studies due to their hypervariable nature and low cost [20]. As a consequence of these factors, ISSR’s are used widely in developing countries for a range of purposes. A search of the SCOPUS data base (11 March 2024) using the search terms (“inter AND simple AND sequence AND repeat*) OR ISSR*” found 7852 publications. An analysis of the author affiliations of these papers using VOSViewer ver. 1.6.15 [27] indicated that the vast majority of these authors or co-authors are from developing countries, many of which are also mega-biodiverse (Table 1).
ISSRs have proven valuable in a wide range of applications including hybridisation and taxonomic studies [21,25], phylogeny reconstruction [28], population genetic studies [29,30,31,32], demographics [33], the investigation of the mating systems and reproduction of plants [34], sex determination [35,36], distinguishing ecotypes [37], as well as studies on crops and crop relatives and medicinal plants [38,39,40,41] and identifying markers for traits such as toxin production or phenotypes [35,36,42]. Of particular relevance to our study, this method has also been applied to rare and endangered or endemic species [29,31,43,44,45] as well as widespread and common species [46].
The vast majority of ISSR studies utilise conventional agarose gel visualisation of banding patterns, a very cheap and readily available technology, which perhaps explains the extensive use of this method in developing countries. However, another benefit to ISSR fingerprinting is that the primers can be modified by labelling with fluorescent dyes that allow for the automated detection of bands using DNA sequencing machines [47]. This modification of the primers and use of slightly more costly automated detection systems provides greater sensitivity and resolution of bands coupled with the ability to accurately size much larger ISSR fragments, resulting in larger datasets and more accurate fragment sizing potentially able to differentiate fragments with as little difference as a single nucleotide [48,49]. Owing to the higher sensitivity of the automated process, much larger datasets are produced, but possibly with lower marker informativeness [37]. However, despite these advantages, it has not been widely used. Automated ISSR fingerprinting has, however, been used effectively in plantains (Musa L. sp. [37]), cotton (Gossypium L. [50]), Vachellia karroo (Hayne) Banfi & Galasso [51], the endemic and widespread species within Tolpis Adans. (Asteraceae [47]) and endangered Faucaria tigrina Schwantes (Aizoaceae [45]).
Based on the above considerations and the merits of ISSR’s, this study employs automated ISSR fingerprinting to determine the genetic diversity of the African cycad Encephalartos eugene-maraisii I. Verd. species complex and to ascertain whether genetic diversity corresponds to currently defined taxonomic groups in this complex. Of relevance to this study is the fact that ISSRs have previously been used in cycads for a wide range of applications (Table S1), but their use along with automated fragment detection has yet to be applied to cycads.
1.1.The conservation status of cycads in Africa – Encephalartos as a case study.
The African cycad genus Encephalartos Lehm. is considered the most threatened cycad genus globally and the most threatened group of organisms in South Africa, with 12 of 37 (32%) species in South Africa listed as Critically Endangered (compared to the global average of 17% in cycads), and an additional four which are endangered [52,53]. Moreover, the five cycad species that are listed as Extinct in the Wild by the IUCN are from the genus Encephalartos, all of which once occurred within the borders of South Africa (E. brevifoliolatus Vorster, E. nubimontanus P.J.H.Hurter, E. woodii Sander., and E. heenanii R. A. Dyer) or landlocked Eswatini (= Swaziland, E. relictus P.J.H.Hurter,). Additionally, South Africa is an important cycad diversity hotspot and site of endemism containing 58% of Encephalartos species, of which 80% are endemics [54,55,56].
This South African cycad extinction crisis [55,57,58] may result in South Africa losing 50% of its species within 2-10 years [59]. This extinction is driven by poaching for the ornamental plant trade, the harvest of specimens for medicinal, recreational, and magical purposes [52,53,54,59,60,61,62,63], as well as pathogens [64], herbivory [65], and pollinator extinction [56,66]. Moreover climate change, leading to greater environmental stochasticity and subsequent susceptibility to pests and pathogens [13,65,67] also poses a threat, as well as habitat fragmentation and destruction, the spread of alien invasive species and reproductive failure [54,55,68]. Conservation of this group has thus never been more urgent.
Despite much activity in South African cycad conservation and research [52,55,60,62,69,70], there remains limited knowledge about even the most basic aspects of cycad biology or population size and trends for many species [54,71,72,73]. In addition, research directed at assessing the genetic diversity of South African cycads is required, as little work has been done on these taxa [74,75]. Moreover, the taxonomic relationships between some species, especially among closely related taxa, need to be resolved, thereby allowing the correct designation of conservation status for these taxonomic units [54,71,76,77,78]. Much of the taxonomically unresolved portions of the genus occur within species complexes containing recently diverged taxa [54,55].
Species complexes comprise groups of closely related species which often co-occur or have close geographical proximity. Owing to morphological and genetic similarities, members of these complexes are often difficult to distinguish, which can lead to unclear or biased species delimitation or incorrect designation of conservation units [78]. These complexes are additionally enigmatic in that morphological distinctness does not necessarily correlate with genetic differentiation of species, with the opposite occasionally true [79]. Several examples of cycad species complexes exist [80,81,82]. In the genus Encephalartos, such complexes include the E. hildebrandtii A.Braun & C.D.Bouché species complex of East Africa [83], as well as a group of mostly glaucous Encephalartos species in the Eastern Cape Province of South Africa [79], and the glaucous cycads comprising the Encephalartos eugene-maraisii I. Verd. complex occurring in the northern escarpment of South Africa, comprising six species [84].
1.1.1. The Encephalartos eugene-maraisii complex
The Encephalartos eugene-maraisii complex is a group of closely related cycads with glaucous foliage occurring mainly in the Limpopo and Mpumulanga provinces of South Africa (Figure 1). Members of the complex comprise E. eugene-maraisii, E. dolomiticus Lavranos & D.L.Goode, E. middelburgensis Vorster, Robbertse & S.van der Westh., E. dyerianus Lavranos & D.L.Goode, E. cupidus R.A. Dyer, E. nubimontanus P.J.H.Hurter, and potentially E. hirsutus P.J.H.Hurter (Table S2). In this complex, the taxonomic relationships are uncertain and there is considerable morphological variation within the complex, with some species having as many as eleven different variants recognised (formally and informally) by collectors and growers [85, Table S2]. Within this pool of variation, there may lie undescribed species, or alternatively, species which require merging. Given the tendency among cycad taxonomists for excessive subdivision of species [86,87], many taxa in such complexes may be possible artefacts of over-ambitious taxonomy.
Broad taxonomic and phylogenetic studies on Encephalartos place the E. eugene-maraisii complex into a single clade with little to no resolution and weak support between the member species [76,88,89]. The morpho-geographical classification of Encephalartos proposed by Vorster (2004) [84] places the complex, with the possible inclusion of E. hirsutus, in the same grouping. Molecular studies by Stewart et al. (2023) [89] and Mankga et al. (2020) [88] supported the exclusion of E. hirsutus from the E. eugene-maraisii complex, but provided no further insight into the molecular or taxonomic relationships between members of the complex. Species members of this complex were not well represented in these studies comprising singletons, pairs, or being absent entirely. This likely had consequences for phylogenetic resolution for this group, particularly since these taxa are closely related [90].
2. Materials and Methods
2.1. Sampling
Young, but hardened off leaflets from the six Encephalartos species of the E. eugene-maraisii complex, as well as two samples of E. hirsutus were sourced from a private cycad collection in White River in the Mpumalanga province of South Africa and at the cycad gene bank of the South African National Biodiversity Institute’s (SANBI) Lowveld Botanical Gardens (Mbombela, Mpumalanga, South Africa) on 30 September and 1 October 2021. Additional samples from University of Pretoria cycad collection, and several private collections in Pretoria were collected on 11 May 2022. It was decided to include E. hirsutus in the study as a reference point to better conceptualise whether observed differences in genetic diversity between members of the complex were substantial when compared to a related but obviously different species. To ensure correct species identification, selected plants were cross-referenced with specimen records from each of the gardens and species identity was confirmed visually by Mr A. W. Frisby (curator of the University of Pretoria’s cycad collection). Care was taken to sample plants originating from as many disjunct localities as possible (where locality data for the individuals were available). Suspected hybrids were omitted from the study. Collected leaflets were temporarily stored in paper envelopes and refrigerated until they could be transferred to individual ziplock bags containing silica gel for desiccation.
2.2. DNA extraction
Approximately 30 mg of silica-dried material per sample was ground with metal beads using the Geno/Grinder 2010 (Spex Sample Prep) and extracted in two batches of 96 samples using Sbeadex Maxi Plant kit and the Oktopure robot (LGC Biosearch Technologies) in the labs of the Forest Molecular Genetics, Forestry and Agricultural Biotechnology Institute (FABI), University of Pretoria. These runs additionally included duplicate sample pairs representing material of the same plant, but extracted in both batches to test for consistency in extraction runs. DNA purity and contamination was determined spectrophotometrically by calculating the ratio of absorbance at 260 nm to that of 280 nm, and the ratio of absorbance at 260nm to that of 230nm (Nanodrop, Thermofischer Scientific).
2.3. PCR optimisation and Selection of ISSR-PCR Primers
Six ISSR primers manufactured with 5’ fluorescent labels were screened for their suitability in amplifying cycad DNA (Table 2). Primers in the trial PCR runs which consistently produced mostly bright, clear bands for a wide range of samples when viewed under UV on 1% agarose gel, were selected for this study (Supplementary Gels). Selected primers were also optimised under different MgCl2 concentrations.
2.4. PCR Reaction Conditions
Following primer selection, bulk amplification of sets of 96 samples was performed in a Bio-Rad T100 thermal cycler under the following reaction conditions: The 25μl reaction mixture constituted 4μl DNA (approximately 1200 ng), 1μL of 25μM ISSR primer, 12.5μl 2x Ampliqon Master mix (Ampliqon Taq DNA polymerase, 0.4mM each dNTP, Tris-HCl pH 8.5, (NH4)2SO4, 3mM MgCl2, 0.2% Tween™ 20, inert red dye and stabilizer) and 4μl distilled water. It must be noted that the amount of DNA template used is higher than generally recommended, but as a very high annealing temperature was used in the PCR cycling, the effects of this increased template quantity is offset by the very stringent PCR conditions. The PCR reaction was performed with an initial denaturation phase at 96˚C for 2.5 minutes, followed by 30 cycles of 96˚C denaturation for 30 seconds, 52˚C annealing for 30 seconds and 72˚C extension for 2 minutes, and ending with a 2-minute extension at 72˚C. It must be noted that the annealing temperature (Ta) for the PCR conditions used was higher than the primers melting temperatures (Tm). This was done in order to ensure stringent amplification of PCR amplicons and avoid spurious primer annealing thereby increasing PCR specificity. Using a Ta higher than Tm will however reduce the yield of PCR products, but as a very sensitive detection system is used in our study, this is not considered to be a limitation [91].
PCR products of each sample using each selected primer were visualised under UV on 1 % agarose stained with ethidium bromide to discern amplification success, and samples with no visible bands for any of the selected primers were omitted from subsequent analyses (Figure S2, Table S3). If a sample yielded adequate bands for at least one of the selected primers, all PCR products of this sample (comprising each of the selected primers) were retained in the study. These PCR products were sent to Central Analytical Facility, Stellenbosch University for capillary electrophoresis and automated detection using an ABI 3500XL sequencer equipped with fragment profiling software. The 1200LIZ size standard was used allowing fragment size estimation between 20 and 1200 base pairs. The electropherogram from each sample was analysed using Genemapper software Version 5 (Applied Biosystems).
2.5. Construction of Data Sets for Analysis
Three datasets per primer were produced using Genemapper, which was used to select bands based on the user-defined fluorescence cut-off values of 50, 100 and 200 relative fluorescence units (rfu). These datasets represent varying levels of sensitivity to band intensity with 50rfu cut-off being the most sensitive, scoring faint to bright bands, and potentially including spurious bands, and the least sensitive, 200rfu, which scored only bright bands. Bands brighter than the cut-off values were scored “1” for presence and “0” for absence and invariant alleles were omitted from subsequent analyses. The resultant binary datasets were saved as spreadsheets for further analysis. Pooled datasets at each cut-off level containing the binary data for all primers were then created. These data were examined for the distribution range of band number (considered to an indicator of amplification success). Based on these analyses, a quarter (25%) of the samples which had the lowest number of detected bands were excluded from the subsequent analyses, as the PCR was deemed to be only partially successful or unsuccessful.
2.6. Methods to assess genetic similarity and diversity.
Four different methods were chosen to analyse the data. These were cluster analysis (also called numerical taxonomy or phenetics [92]), median-joining network analysis [93] and STRUCTURE analysis [94] using Bayesian Markov chain Monte Carlo (MCMC) estimation, as well as statistical analysis employing Analysis of Molecular Variance (AMOVA) and Tajima’s D statistic [95].
2.6.1. Cluster Analysis
Genetic distance matrices were computed using various distance coefficients in NTSYS-PC version 2.02k [94] using the SIMQUAL option (Table S4). Distance matrices were clustered using the Unweighted Pair Group method with Arithmetic Averages (UPGMA), and the Neighbor joining (NJ) method. To determine the appropriate clustering method and distance coefficient for the data, dendrograms were compared visually for the “logical” clustering of samples (i.e., the somewhat subjective assessment of grouping of samples as species clusters) as well as computationally through cophenetic correlation analysis and normalised Mantel test [95].
2.6.2. Statistical Analysis
Analysis of Molecular Variance (AMOVA) was also performed with PopART to assess the distribution of observed genotype variation and ΦST values calculated for 1000 permutations of ISSR haplotypes among populations. Species were also grouped into pairs, to determine variation between and within species pairs, namely E. cupidus and E. dolomiticus; E. dyerianus and E. eugene-maraisii; E. middelburgensis and E. nubimontanus, while E. hirsutus was assigned its own group. Tajima’s D statistic was also computed in PopART to detect the presence of non-random evolution in the gene pool [95].
2.6.3. STRUCTURE Analysis (Bayesian MCMC).
The Bayesian clustering of the populations was assessed using STRUCTURE software version 2.3.2.1 [95] for each of the three pooled datasets. Ten independent runs with a 10 000 iteration burn-in and MCMC chain of 100 000 generations, were run with the number of populations (K) ranging from one to ten. Alleles were treated as haploid and the allele frequencies were set to be correlated, using the admixture protocol. Another ten independent runs were performed on these K-values using the LOCPRIOR model in STRUCTURE which accounts for locality data prior to the commencement of the run. For the sake of this study and due to a lack of precise locality information for all samples, each species was considered to be a single locality. All runs were performed with the admixture model setting and with allele frequencies correlated. The optimal K-value, generally considered the smallest K for which the probability of the observed data is maximised, was determined using STRUCTURE HARVESTER [98] based on the method developed by Evanno et al. (2005) [99].
2.6.4. Network Analysis
Haplotype network analysis was performed in PopART software (http://popart.otago.ac.nz; [100]) using the Median Joining method with epsilon set to zero [93].
3. Results
3.1. Sampling and ISSR Amplification Success
A total of 187 plants were sampled and sent for automated DNA extraction (Table S7). Three out of six ISSR primers were selected that produced clear, distinguishable bands on agarose gel (Table 3, S3, Figure S2). PCR reaction mixtures containing no more than 1.5 mM MgCl2 were found to best amplify the ISSR fragments. Following the omission of poorly amplified samples and further reduction of the dataset by removing the lowest 25% of poorly amplified samples, a total of 92 samples were used in the final analysis. Nanodrop readings revealed undesirable levels of protein and polysaccharide contaminants and variable DNA concentrations in DNA extracts (Table 4), but there appeared to be no link between these levels and percentage PCR success, nor the exclusion of samples from the study (Figure 2, Table S3). Amplification success, however, appeared to be linked to species, which two species having less than 50% amplification success (Table 4).
Of the three data sets, the 50rfu set (which had the most alleles) was the most informative across all analyses having better grouping of species and less noise than analyses using 100- and 200rfu datasets (Figure S3–S5; S7–S12) and the results summarized below thus focus on the analyses of this data set.
3.2. Statistical Analysis
The Tajima’s D statistic was negative for all datasets but not statistically significant (p > 0.05, Table 5). The most negative D -statistic was obtained with the 100rfu dataset with a value of -0.84998. The AMOVA analysis indicated a significant difference in variation between species pairs within groups for all datasets (ΦSC ≈ 0.4; p < 0.001, Table 6), and a significant variation among species (ΦST ≈ 0.4; p < 0.001, Table 6). Variation among groups, however, was not significant.
3.3. STRUCTURE Analysis
The Evanno Method through the tool STRUCTURE Harvester [98,99] showed the optimal value of K for the Standard STRUCTURE model to be three, followed by four and two for the 50rfu dataset. When preassigned species groups are accounted for (the LOCPRIOR model) the optimal K was four, followed by three and two (Table 7). Optimum K-values for the 100rfu dataset was two for the Standard and three for the LOCPRIOR model. For the 200rfu dataset an optimum K of two was obtained for both models (Table 7).
When using its optimal K-value (K = 3), the Standard STRUCTURE model using the 50rfu dataset was unable to separate samples into species groups based on their allele frequencies (Figure 3). However, at higher K- values (e.g. K = 7), E. cupidus, E. dyerianus and E. hirsutus are distinguished as unique groups. The LOCPRIOR model was able to distinguish species groups more clearly than the Standard model based on its optimal K (K = 4). E. nubimontanus samples appeared to have considerable variation but tended towards two discrete groups, especially apparent at higher K-values. They also appeared to share alleles with E. cupidus and E. eugene-maraisii. E. dolomiticus samples also appeared to share a large proportion of their alleles with E. eugene-maraisii samples. The apparent genetic similarity between E. nubimontanus and E. cupidus, and between eugene-maraisii and E. dolomiticus were more conspicuous in 100rfu dataset. The 200rfu dataset showed no distinguishable grouping for both models at K = 2 except for E. cupidus and E. nubimontanus samples, which were assigned to one unique group.
At higher K-values (E.g. K = 7, Figure S5) the 100rfu dataset produced much noisier bar charts for each species compared to the 50rfu dataset at K = 7, and fewer distinguishable groups (Figure S3). Bar plots based on the 200rfu datasets (Figure S4, S5) showed indistinct grouping and noisy results. LOCPRIOR models at K = 7 also produced cleaner species groupings (Figure S5).
3.4. Cluster Analysis
The cophenetic correlation analysis for all datasets revealed that the UPGMA tree based on Russel Rao similarity measures best represented the similarity matrix as seen by the highest cophenetic coefficient (Table S4). However, trees based on DICE coefficient, although having lower cophenetic correlation values, produced the most plausible clustering of taxa corresponding to current taxonomic views. In the NJ analysis based on the 50rfu dataset (Figure 4), E. nubimontanus and E. cupidus (green and purple respectively) formed overlapping groups while E. eugene-maraisii, E. dyerianus and E. dolomiticus each formed distinct clusters (blue, pink and yellow respectively). Fragmented groups of E. nubimontanus samples did not appear to group according to locality or morphology. E. hirsutus (red) branched from the rest of the species in the most basal position on the dendrogram. Three E. middelburgensis samples (grey) clustered together whilst one duplicate sample did not cluster with its duplicate partner (Figure 4). In the UPGMA dendrogram (Figure S6) E. nubimontanus formed approximately two groups and overlapped with E. cupidus. E. eugene-maraisii formed a distinct group with E. dolomiticus appearing to be a nested group within E. eugene-maraisii. E. dyerianus formed a distinct cluster (Figure S6). Some individual samples showed unexpected grouping with different species.
The UPGMA dendrogram using the 100rfu dataset (Figure S8) displayed similar grouping of taxa to the NJ analysis using the 50rfu dataset but was most successful in clustering duplicate genotypes together. E. eugene-maraisii (blue) overlapped somewhat with E. dolomiticus and E. nubimontanus (yellow and green respectively), with the latter failing to form a distinct cluster. E. dyerianus, E. cupidus and E. hirsutus (colours pink, purple and red respectively) each formed separate clusters, while E. middelburgensis samples did not cluster together (Figure S8). Trees based on the 200rfu dataset (Figure S9, S10) showed the least grouping of taxa, where species groupings were more homogenous.
General findings from the cluster analyses were that E. dyerianus formed a distinct cluster, as well as E. hirsutus. E. middelburgensis samples did not cluster together but occurred sporadically throughout the tree. E. hirsutus formed a distinct group, branching first from the rest of the samples (Figure 4, S8). The lowermost samples flanking E. hirsutus samples on trees (Figure S6, S8). comprised several species which appear to be individuals with fewer bands. E. nubimontanus formed two separate groups in most trees, often overlapping with E. cupidus samples. The results from the STRUCTURE analysis (Figure 3) revealed a similar disparity within E. nubimontanus and similarity to E. cupidus as well as the similarity between E. eugene-maraisii and E. dolomiticus samples (Figure S6).
3.5. Network Analysis
The network analysis based on the 50rfu dataset revealed that E. dolomiticus, E. cupidus and E. dyerianus each formed separate branches which appeared to branch from a cluster of E. eugene-maraisii samples. E. hirsutus formed its own discrete branch. The network analysis showed two branches of E. nubimontanus, congruent with STRUCTURE and cluster analyses. Some samples which did not branch with their conspecifics were situated close to E. hirsutus or were unexpectedly branched with other species. Individuals described above as having more genetic similarity to E. hirsutus than their conspecifics, shared a branch with E. hirsutus (Figure 5). These seemingly misplaced samples also appear to have fewer band numbers (approximately 50), and likely had missing alleles preventing them from being correctly clustered with conspecifics. Similar to the above analyses, E. middelburgensis samples did not appear to cluster discretely, with samples present mostly along branches of E. nubimontanus samples. The network analysis based on the 100rfu and 200rfu datasets resulted in a network with more noise and unexpected groupings of samples (Figure S11, S12).
4. Discussion
4.1. Species Delimitation of the E. Eugene-Maraisii Complex
Our analyses provide clear support for the taxonomic singularity of E. hirsutus and its exclusion from the E. eugene-maraisii complex, concurrent with other studies [77,89,107]. Within the E. eugene-maraisii complex, however, although analyses were able to partially distinguish species groups in most cases, it is uncertain whether all species delimitations are justified. This sheds a more skeptical light on the potentially overzealous subdivision of this complex into species.
4.1.1. Statistical Analysis
The Tajima’s D statistic was negative for all datasets, although not significant. Negative D statistics are sometimes associated with populations which underwent recent population expansion following a bottleneck, or populations with numerous rare alleles [96]. In this case, however, it may indicate that this complex is a recently diversified group. This concurs with molecular clock data on Encephalartos indicating a recent radiation of this group [88,101,102]. This may also explain the genetic similarity amongst species groups observed in the STRUCTURE analyses.
The AMOVA analysis revealed higher intraspecific than interspecific variation, and nonsignificant variation between groups of species pairs. This, too, may indicate that not all species delimitations in this species complex are valid. High within population variation is also reported in other species of cycads [103,104,105]. The ΦST and ΦSC of approximately 0.3 indicates moderate genetic isolation of the species. This, however, is unsurprising since ΦST is commonly used for intraspecific variation, thus, genetic differentiation between these species is presumed. Lower genetic differentiation is reported in other closely related Encephalartos species. For instance, a value of 0.1 (FST) was reported among E. horridus (Jacquin) Lehmann; E. latifrons Lehmann; E. lehmannii Lehmann; E. longifolius; E. princeps R. A. Dyer; and E. trispinosus (Hooker) R. A. Dyer [79].
4.1.2. E. Eugene-Maraisii, E. Dolomiticus and E. Dyerianus
E. dyerianus and E. dolomiticus were originally thought to be ecotypes of E. eugene-maraisii receiving infraspecific ranks following a morphological and anatomical study [114], but eventually were raised to species rank in subsequent taxonomic revisions [110,115]. In our STRUCTURE and cluster analyses, E. eugene-maraisii was closely associated with E. dolomiticus, which frequently formed a discrete cluster nested within the E. eugene-maraisii cluster. This suggests E. dolomiticus’ origin as a subpopulation of E. eugene-maraisii which later underwent genetic isolation. These species do, moreover, share some morphological characteristics, further supporting this theory. Assigning subspecies rank to E. dolomiticus may, however, be unsuitable, as E. dolomiticus is restrictively adapted to very specific soil conditions [111] as well as it comprising a single, highly isolated population [54,110]. This may disqualify E. dolomiticus from being a subspecies of E. eugene-maraisii in the context of the Ecological Species Concept [116]. Moreover, the species may be legitimately delimited through the Unified Species Concept [117,118], which is similar to the Genealogical Species Concept [119], but whose only criteria is that populations are presently evolving independently from one another regardless of historical associations. This concept therefore acknowledges the possibility of species merging and separating through time, [120] which may have occurred in cycad species given their ability to hybridise [76,79,84,121,122].
Conversely, throughout most of the analyses E. dyerianus samples formed a distinct cluster and did not appear to be closely associated with other species groups. This further justifies the designation of this group as a species. E. dyerianus, moreover comprises a single population situated on a remote outcrop despite growing in soils of similar geography to other cycads in the E. eugene-maraisii complex [54,110]. The cohesion of this group may indicate a long history of isolation and genetic differentiation, in contrast to E. dolomiticus. The sample representing the “Levubuensis” variant (dye11Lb) also frequently grouped with members of E. dyerianus, suggesting these taxa are a disjunct population of E. dyerianus. “Levubuensis” specimens are reported to be almost indistinguishable from E. dyerianus, despite their large geographical separation, but are also speculated to be an undescribed species (A. W. Frisby pers. comm.). In contrast, the sample 16Lb, which may have been recorded as a “Levubuensis” sample in error, did not consistently group with any species group. It is thus uncertain to which species group this sample belongs.
4.1.3. E. Nubimontanus and E. Cupidus
Our analyses call into question the validity of E. nubimontanus and E. cupidus as distinct species. In the STRUCTURE analyses E. nubimontanus, although distinctive, formed two groups, one of which showed similarity to E. cupidus. This was also evident in the cluster analysis where E. cupidus often grouped within, or had groups alternating with, the E. nubimontanus clusters. The network analysis, however, did not reflect a close association with these species and instead formed discrete branches of species groups. The considerable genetic variation observed in E. nubimontanus may explain its morphological diversity. However, this may also be a product of historical hybridisation with E. cupidus, with which it historically co-occurred in habitat [78,79]. These species, indeed, show morphological overlap evident in the frequent misidentification the two. Moreover, among E. nubimontanus’ many morphological variants [85], some, such as “Robusta”, were contested to instead be forms of E. cupidus [106,111]. These species may also represent incompletely separated lineages, which might warrant subspecific rank [113]. Other authors have also speculated a history of hybridisation or reticulation in other South African Encephalartos species [76,79].
Curiously, although E. nubimontanus samples tended to separate into two or more discrete clusters, samples representing the same morphological variant of E. nubimontanus did not group together consistently. A possible explanation for this is inconsistent amplification success of E. nubimontanus samples, or incorrect data capture of cycads by private owners. Since the samples used in our study were procured from garden specimens and not from habitat, we have relied on records of these plants maintained by the cycad owners which were often brief, ambiguous, or incomplete. So-called distinguishing characteristics of some of these E. nubimontanus variants may also be exaggerated or represent morphological extremes of E. nubimontanus. To date, previous molecular studies have been unsuccessful in grouping E. nubimontanus individuals together with conspecifics within the complex [76,89]. Alternatively, these results may reflect the presence of a cryptic lineage within E. nubimontanus or hybridisation with extinct lineages, generating variation in some populations [112].
4.1.4. E. Middelburgensis
Conversely, E. middelburgensis samples did not cluster at all in our analyses, but were dispersed sporadically throughout the other species groups, while having a slight affinity to E. nubimontanus and E. dyerianus samples. Although the absence of grouping in E. middelburgensis could be accredited to their poor amplification rate (Table 3), these samples may be insufficiently distinct, morphologically or genetically, or to warrant their specific rank. It has been proposed that E. middelburgensis is a subspecies or merely a cline of E. eugene-maraisii since morphological characters that distinguish E. middelburgensis from E. eugene-maraisii are not as conspicuous as those distinguishing E. dyerianus or E. dolomiticus from E. eugene-maraisii [110]. Our study, however, revealed no affinity between E. middelburgensis and E. eugene-maraisii samples. The vast geographical distance between these two taxa relative to other members (Figure 1) further supports this finding. Further investigation is nonetheless required to elucidate the taxonomic singularity of E. middelburgensis.
4.1.5. Unexpectedly Placed Samples
Although most individuals possessed allele frequencies typically corresponding to that of conspecifics, there were exceptions where isolated samples had allele frequencies more closely corresponding to that of other species groups. Allele frequencies of some members of E. dolomiticus and E. cupidus, for instance, closely resemble that of E. hirsutus samples. These individual samples were also unexpectedly clustered with their other species groups in the dendrograms and network analyses (Figure 5; Figure S6). Although the results suggest that these species are genetically indistinguishable from E. hirsutus, this is unlikely since E. hirsutus is phylogenetically distinct from the E. eugene-maraisii complex [88,107]. The behaviour of these samples may instead reflect missing alleles or numerous spurious bands since samples deemed genetically similar to E. hirsutus samples all possess approximately 50 bands, whereas E. hirsutus samples possessed 83 and 73 bands respectively.
4.2. Comparison of Analyses and Datasets
In our study we have utilised several different analysis methods and three different datasets resulting in various outcomes. These are discussed below.
4.2.1. Datasets
Analyses based on the 50rfu dataset proved the most informative for our sample taxa, with the exception of AMOVA and cluster analysis where results obtained from 50rfu and 100rfu dataset were comparable. STRUCTURE and network analyses were less informative at higher -rfu cut-off values, being apparently sensitive to the loss of fainter bands present in the 50rfu dataset (Figure S5, S11, S12). In addition, the exclusion of the lower 25% of samples with the fewest amplified bands further reduced the occurrence of noise and unexpected clustering of data. In our study, the placement of duplicate samples provided insight into the variability of extraction and amplification success of samples and additionally, through seeing if duplicates clustered together, they assisted in identifying effective and ineffective clustering methods. Duplicate pairs were observed to cluster closest to one another in the 100rfu dataset in the cluster and network analyses, and some STRUCTURE analyses. Curiously, duplicates were observed to be most separated in 50rfu datasets, performing slightly worse than 200rfu datasets. Analyses based on the 100rfu dataset, however, produced less discrete species groupings than the 50rfu dataset, suggesting that potentially spurious bands in the latter dataset affected fine scale resolution of the analysis, but not broader species groupings. This may additionally suggest that selection of an intermediate -rfu cut-off between 50- and 100rfu may produce a dataset which is a more accurate representation of both the broad- and fine-scale variation in this species complex. What these results indicate is that the automated DNA detection method allows for a far more nuanced analysis of ISRR data.
4.2.2. Notable Differences among Analyses
STRUCTURE provided robust and easy-to-visualise Bayesian analyses that produced results comparable to that of the cluster analyses. However, it required samples with high band number and needed moderate setup related to model selection and model settings. Selection of appropriate parameters for STRUCTURE runs is important (especially with unbalanced sample sizes) to minimise errors in assigning individuals to incorrect population clusters and to avoid overinterpretation of results by the researcher [123,124]. Another consideration not to be overlooked is a limitation of STRUCTURE analyses in that it assumes Hardy-Weinberg equilibrium and no inbreeding [94,109]. Due to these cycads’ historical isolation and present cultivation in ex-situ populations, panmixia of these individuals cannot be assumed. In our analyses, using the 50rfu dataset and LOCPRIOR model resulted in a higher optimal K-value and better grouping of species compared to the Standard model. This model, however, is not necessarily the better model for this data as it makes oversimplified assumptions about sample localities, potentially introducing bias to these analyses [124].
The cluster analysis proved an effective method for grouping samples, requiring fewer bands per sample than STRUCTURE and network analyses to produce meaningful results. Careful selection of suitable similarity coefficients for the data, however, is necessary since this can greatly alter the topology of the dendrograms for other taxa. Therefore, an understanding of how each similarity coefficient weighs apparent similarities in data, such as band absences, is required [22]. In our analyses the choice of either NJ or UPGMA clustering methods did not appear to affect tree topology dramatically. NJ analysis allows varying rates of evolution between species, while UPGMAs assume fixed rates of evolution [23]. Mankga et al. (2020) suggest evolutionary rates among Encephalartos are constant and that a constant-rate-diversification model may be most suitable for analyses [88]. This may explain why little difference was observed between trees using each clustering method. Authors such as Archibald et al. (2006) [47] opted for NJ analyses using the Dice coefficient [110], an approach we have chosen to follow here. Notable differences in our analyses between NJ and UPGMA include the clustering of E. eugene-maraisii samples together into one group in NJ dendrograms, while in UPGMAs E. dolomiticus formed a nested group within E. eugene-maraisii. Moreover, in the NJ analysis, E. hirsutus formed a solitary cluster branched from all other samples compared to the more central position of E. hirsutus samples in the UPGMA. The positions of E. nubimontanus and E. cupidus in NJ dendrograms also differ from the UPGMA trees in that they clustered together as overlapping groups.
Network analysis, while also requiring datasets with high band number per sample, were easy to set up and produced an easy to visualise graphic output, where sample groups could be quickly discerned. When using the 50rfu dataset, the Median joining network was most successful in distinguishing species groups compared to STRUCTURE and cluster analyses. Networks may prove extremely useful for initial visualisation of a new dataset, and in identifying poorly amplified samples. It is also a valuable supplement to other analyses like STRUCTURE. The network analysis differed notably from the cluster and STRUCTURE analysis in its placement of E. cupidus and E. nubimontanus, where networks show more dissimilarity between these groups. Moreover, species clusters of E. cupidus, E. dyerianus and E. dolomiticus branched from the cluster of E. eugene-maraisii, suggesting genetic similarity between these species. However, network analyses such as these merely provide insights into the genetic similarity of individuals and should not be used to infer phylogeny [100].
4.3. Methodological Critique
This study has demonstrated the value and utility of automated ISSR fingerprinting for investigating genetic variation among closely related Encephalartos species. The use of fluorescently tagged ISSR markers and automated detection by a genetic analyser allowed successful and rapid identification and scoring of hundreds of amplified bands with minimal setup. While not as cheap as using conventional agarose gel electrophoresis for band visualisation, the accurate band sizing and increased sensitivity of band detection makes the additional expense of automated detection worthwhile [22]. Other studies also reported approximately three times the number of loci or bands per primer than conventional agarose or capillary electrophoresis methods [37,47]. For our study it generated well over the recommended band number (200 bands recommended for a ΦST exceeding 0.1 [126]) for STRUCTURE analysis (Table 3). Given the dominant nature of ISSR markers and the lower information content of these markers relative to codominant markers, ISSRs may be less reliable for discerning genetic diversity. Therefore, having numerous bands is especially important to generate sufficient resolution for distinguishing taxa [37,90,127]. Moreover, using markers based on noncoding DNA, such as ISSRs, as a source of variation can be more informative than coding DNA markers. Coding regions, being more conserved than the more rapidly-evolving noncoding regions may not contain sufficient information to discern closely related taxa [128]. Given cycads’ slow evolutionary rate and divergence [128], this may explain why previous molecular studies relying on coding DNA often suffered from low resolution [59,76,89,107]. Obtaining DNA from multiple sources in the genome also reduces bias introduced by using DNA from a single source, such as nuclear DNA [22,120].
Despite the promise of these methods, we have identified several improvements that may make future applications of these methods even more reliable and rigorous.
4.3.1. Spurious Bands and Reproducibility
One of the main challenges of ISSR analysis relates to a lack of reproducibility due to spurious bands, making transfer of results between labs difficult [6,126]. Issues of reproducibility can be addressed through the comparison of replicates and keeping only common bands [49], while disregarding fainter bands which are likely spurious [126]. In this study, the use of the Oktopure DNA extraction robot to do DNA extractions in bulk helped to reduce variability in the DNA extraction process. This method proved reliable, rapid, and consistent for extracting cycad DNA, producing higher concentration DNA than traditional CTAB methods [125]. Nonetheless, it may benefit from further optimisation to improve DNA purity and reduce contamination.
The use of clean PCR products, as well as the same thermal cycler and settings is recommended for best reproducibility [49]. Cycad leaves contain high levels of polysaccharides, proteins and secondary metabolites which can co-precipitate with DNA and interfere with PCR [129,130,131]. Removal of some of these contaminants can be achieved using commercially available purification columns or the use of reagents such as polyvinylpolypyrrolidone (PVPP) to eliminate polyphenols as well as NaCl to remove polysaccharides [132].
Since there appeared to be a species-specific link to amplification success with the various primers (Table 4), individually optimised PCR reactions for each species, or increased the number of primers used, may be necessary. Individual primers additionally showed differing suitability for each species further justifying the use of additional primers in the study. Although not done in this study, the standardisation of DNA concentrations [126] might have improved the success of PCR amplification of some of our samples.
Finally, the use of a Ta higher than the Tm of the primers was used to ensure stringent PCR conditions, but may have resulted in “fainter” bands being produced. While this may be a problem when using agarose gels for visualisation, the automated detection system used here is sensitive enough to outweigh this trade-off between PCR specificity and PCR yield. An alternative approach to balancing PCR specificity and PCR yield could the application of the “touchdown” PCR technique [133].
4.3.2. Sampling Effort and Cost Reduction Strategies
Additional improvements to our study can be made through optimisation of sampling effort [134]. In our study, 180 plants were sampled, but over half of these were excluded from the study due to poor amplification of ISSRs, resulting in wasted costs on reagents and sampling time (Table S5). Improvement of DNA extraction and PCR amplification of our samples will likely offset these costs by improving the success rate of amplification and reducing the need for sampling in excess. In addition, multiplexing primers marked with two different dyes in wells in the genetic analyser is another way to reduce costs while potentially resulting in the generation of greater bands than the sum of bands in two separate wells [50]. Another potentially important consideration is screening for epiphyte or endophyte contamination of samples [22], which influence the banding patterns of target DNA and may exaggerate genetic diversity [135].
With modification to the ISSR method, high throughput sequencing technologies may also be employed to sequence ISSR fragments in Multiplexed ISSR Genotype-by-sequencing (MIG-seq, [9]). This method has been successfully employed on Dioon Lindl [136,137]. As high throughput sequencing continues to reduce in cost it may become available to more modest budgets [1,2]. A potential setback to these methods is the requirement of high molecular weight DNA and greater methodological complexity, however, the method can be modified to address these issues [138].
4.4. Taxonomic Implications
In this study we have provided evidence substantiating the taxonomic singularity of some species within the E. eugene-maraisii complex, for example E. dyerianus, which showed good genetic segregation from other samples. However, genetic boundaries between other species, such as E. nubimontanus and E. cupidus are more unclear, with genetic variation within E. nubimontanus even putting to question the integrity of the taxonomic validity of this entity. This may be another testament to the over-splitting tendencies amongst cycad taxonomists, mentioned previously [86,87]. Instead, given their morphological and genetic overlap, and shared historical distribution ranges, variation exibited by E. nubimontanus and E. cupidus may be clinal [139]. As such, ecotypes may be a more appropriate designation of these taxa. Other species such as E. dolomiticus and E. eugene-maraisii, although clustering distinctly, appear closely linked, but also show highly disparate ecological requirements. This, once again, raises questions about the applicable species concepts for cycads and a need standardise them for meaningful taxonomic divisions [140].
5. Conclusions
Using the automated ISSR detection method and a range of analytical approaches, we were able to distinguish some of the species within the E. eugene-maraisii complex as distinct lineages. However, we recommend additional sampling, and further optimisation of DNA extraction and PCR amplification procedures, for some of the currently recognised species, as these taxa may not warrant recognition at this rank. In addition, the use of additional primers may be necessary to improve resolution and elucidate the relationships among E. nubimontanus and E. cupidus; and the taxonomic validity of E. middelburgensis.
Our study has, moreover, highlighted the importance of using a variety of datasets and analytical methods to explore the signal in the data and to determine which datasets best suit each analysis.
Finally, we demonstrate the suitability of automated ISSR fingerprinting as a rapid, simple, and cost-effective method to investigate genetic diversity and taxonomic limits in closely related and range restricted Encephalartos species, and potentially many other taxa. This method thus holds great potential in the application of conservation genetics and taxonomy of all taxa, for scientists in developing countries.
Supplementary Materials
The following supporting information can be downloaded at the website of this paper posted on Preprints.org. Table S1: ISSR studies on cycads; Table S2: Variants within the E. eugene-maraisii complex; Table S3: Amplification success of samples; Table S4: Correlation coefficients; Table S5: List of cycad samples; Figure S1: Gels primer selection; Figure S2: Gels all samples; Figure S3: STRUCTURE analysis 100rfu; Figure S4: STRUCTURE analysis 200rfu; Figure S5: STRUCTURE K = 7 plots; Figure S6: UPGMA 50rfu; Figure S7: NJ 100rfu; Figure S8: UPGMA 100rfu; Figure S9: UPGMA 200rfu; Figure S10: NJ 200rfu; Figure S11: Network 100rfu; Figure S12: Network 200rfu.
Author Contributions
For research articles with several authors, a short paragraph specifying their individual contributions must be provided. Conceptualization, N.P.B; methodology, D.M and N.P.B; software, D.M.; validation, A.W.F., D.M. and N.P.B.; formal analysis, D.M.; investigation, D.M.; resources, A.W.F. and N.P.B..; data curation, D.M.; writing—original draft preparation, D.M.; writing—review and editing, A.W.F. and N.P.B.; visualization, D.M.; supervision, N.P.B. and A.W.F.; project administration, A.W.F. and N.P.B.; funding acquisition, D.M and N.P.B. All authors have read and agreed to the published version of the manuscript.
Funding
This work is based on the research supported wholly by the National Research Foundation of South Africa (Grant Numbers 129185) through the Foundational Biodiversity Information Program funding of the Waterberg Biodiversity Project.
Acknowledgments
We thank the owners of private cycad collections (kept anonymous due to the rarity of these species) for permitting the collection and use of cycad material on their premises, which were used in this study. In addition, we extend thanks to the Manie van der Schijff Botanical Garden of the University of Pretoria, and Lowveld Botanical Garden of the South African Biodiversity Institute for providing access to their cycad collections.
Conflicts of Interest
The authors declare no conflicts of interest. The funders had no role in the design of the study; in the collection, analyses, or interpretation of data; in the writing of the manuscript; or in the decision to publish the results.
References
- Allendorf, F.W.; Hohenlohe, P.A.; Luikart, G. Genomics and the Future of Conservation Genetics. Nature Reviews Genetics 2010, 11, 697–709. [Google Scholar] [CrossRef] [PubMed]
- Frankham, R. Challenges and Opportunities of Genetic Approaches to Biological Conservation. Biological Conservation 2010, 143, 1919–1927. [Google Scholar] [CrossRef]
- Hohenlohe, P.A.; Funk, W.C.; Rajora, O.P. Population Genomics for Wildlife Conservation and Management. Molecular Ecology 2021, 30, 62–82. [Google Scholar] [CrossRef] [PubMed]
- Lewontin, R.C.; Hubby, J.L. A Molecular Approach to the Study of Genic Heterozygosity in Natural Populations. II. Amount of Variation and Degree of Heterozygosity in Natural Populations of Drosophila pseudoobscura. Genetics 1966, 54, 595–609. [Google Scholar] [CrossRef] [PubMed]
- Botstein, D.; White, R.L.; Skolnick, M.; Davis, R.W. Construction of a Genetic Linkage Map in Man Using Restriction Fragment Length Polymorphisms. American Society of Human Genetics 1980, 32, 314–331. [Google Scholar]
- Schlötterer, C. The Evolution of Molecular Markers — Just a Matter of Fashion? Nature Reviews Genetics 2004, 5, 63–69. [Google Scholar] [CrossRef] [PubMed]
- Torres-Florez, J.P.; Johnson, W.E.; Nery, M.F.; Eizirik, E.; Oliveira-Miranda, M.A.; Galetti, P.M. The Coming of Age of Conservation Genetics in Latin America: What Has Been Achieved and What Needs to Be Done. Conservation Genetics 2018, 19, 0. [Google Scholar] [CrossRef]
- Davey, J.W.; Blaxter, M.L. RADSeq: Next-Generation Population Genetics. Briefings in Functional Genomics 2010, 9, 416–423. [Google Scholar] [CrossRef] [PubMed]
- Suyama, Y.; Matsuki, Y. MIG-Seq: An Effective PCR-Based Method for Genome-Wide Single-Nucleotide Polymorphism Genotyping Using the next-Generation Sequencing Platform. Scientific Reports 2015, 5, 1–12. [Google Scholar] [CrossRef]
- Alves, F.; Banks, S.C.; Edworthy, M.; Stojanovic, D.; Langmore, N.E.; Heinsohn, R. Using Conservation Genetics to Prioritise Management Options for an Endangered Songbird. Heredity 2023, 130, 289–301. [Google Scholar] [CrossRef]
- Mafiana, C.F.; Jayeola, O.A.; Iduseri, E.O. Impact of Environmental Degradation on Biodiversity Conservation in Nigeria. The Zoologist 2022, 20, 41–50. [Google Scholar] [CrossRef]
- Wilson, K.A.; Auerbach, N.A.; Sam, K.; Magini, A.G.; Moss, A.S.L.; Langhans, S.D.; Budiharta, S.; Terzano, D.; Meijaard, E. Conservation Research Is Not Happening Where It Is Most Needed. PLoS Biology 2016, 14, 1–5. [Google Scholar] [CrossRef]
- Enquist, B.J.; Feng, X.; Boyle, B.; Maitner, B.; Newman, E.A.; Jørgensen, P.M.; Roehrdanz, P.R.; Thiers, B.M.; Burger, J.R.; Corlett, R.T.; et al. The Commonness of Rarity: Global and Future Distribution of Rarity across Land Plants. Science Advances 2019, 5, 1–13. [Google Scholar] [CrossRef]
- Waldron, A.; Miller, D.C.; Redding, D.; Mooers, A.; Kuhn, T.S.; Nibbelink, N.; Roberts, J.T.; Tobias, J.A.; Gittleman, J.L. Reductions in Global Biodiversity Loss Predicted from Conservation Spending. Nature 2017, 551, 364–367. [Google Scholar] [CrossRef]
- Zietkiewicz, E.; Rafalski, A.; Labuda, D. Genome Fingerprinting by Simple Sequence Repeat (SSR)-Anchored Polymerase Chain Reaction Amplification. Genomics 1994, 20, 176–183. [Google Scholar] [CrossRef]
- Gupta, M.; Chyi, Y.S.; Romero-Severson, J.; Owen, J.L. Amplification of DNA Markers from Evolutionarily Diverse Genomes Using Single Primers of Simple-Sequence Repeats. Theoretical and Applied Genetics 1994, 89, 998–1006. [Google Scholar] [CrossRef]
- Marri, P.R.; Neelamraju, S.; Siddiq, E.A. Inter Simple Sequence Repeat (ISSR) Polymorphism and Its Application in Plant Breeding. Euphytica 2002, 128, 9–17. [Google Scholar]
- Hayden, M.J. Targeted Development of Informative Microsatellite (SSR) Markers. Nucleic Acids Research 2001, 29, 44e–44. [Google Scholar] [CrossRef]
- Lagercrantz, U.; Ellegren, H.; Andersson, L. The Abundance of Various Polymorphic Microsatellite Motifs Differs between Plants and Vertebrates. Nucleic Acids research 1993, 1, 1111–1115. [Google Scholar] [CrossRef]
- Wolfe, A.D. ISSR Techniques for Evolutionary Biology. Methods in Enzymology 2005, 395, 134–144. [Google Scholar]
- Wolfe, A.D.; Xiang, Q.-Y.; Kephart, S.R. Assessing Hybridization in Natural Populations of Penstemon (Scrophulariaceae) Using Hypervariable Intersimple Sequence Repeat (ISSR) Bands. Molecular Ecology 1998, 7, 1107–1125. [Google Scholar] [CrossRef]
- Gemmill, C.E.C.; Grierson, E.R.P. Inter-Simple Sequence Repeats (ISSR), Microsatellite-Primed Genomic Profiling Using Universal Primers. In Methods in Molecular Biology; Besse, P., Ed.; 2021; Vol. 2222, pp. 249–262 ISBN 9781071609965.
- Weisling, K.; Nybom, H.; Wolff, K.; Kahl, G. DNA Fingerprinting in Plants. Principles, Methods, and Applications, Second Edition; Taylor & Francis Group, 2005; Vol. 60; ISBN 9780849314889.
- Yang, W.; Oliveira, A.C.; Godwin, I.; Schertz, K.; Bennetzen, J.L. Comparison of DNA Marker Technologies in Characterizing Plant Genome Diversity: Variability in Chinese Sorghums. Crop Science 1996, 36, 1669–1676. [Google Scholar] [CrossRef]
- Akhavan, A.; Saeidi, H.; Rahiminejad, M.R.; Zarre, S.; Blattner, F.R. Interspecific Relationships in Allium Subgenus Melanocrommyum Sections Acanthoprason and Asteroprason (Amaryllidaceae) Revealed Using ISSR Markers. Systematic Botany 2015, 40, 706–715. [Google Scholar] [CrossRef]
- Long-Qian, X.; Xue-Jun, G.; Gong. , X.U.N.; Gang, H.; Zheng, S. ISSR Variation in the Endemic and Endangered Plant Cycas guizhouensis (Cycadaceae). Annals of Botany 2004, 94, 133–138. [Google Scholar]
- van Eck, N.J.; Waltman, L. Citation-Based Clustering of Publications Using CitNetExplorer and VOSviewer. Scientometrics 2017, 111, 1053–1070. [Google Scholar] [CrossRef]
- Hodkinson, T.R.; Chase, M.W.; Renvoize, S.A. Characterization of a Genetic Resource Collection for Miscanthus (Saccharinae, Andropogoneae, Poaceae) Using AFLP and ISSR PCR. Annals of Botany 2002, 89, 627–636. [Google Scholar] [CrossRef]
- Pinheiro, L.R.; Rabbani, A.R.C.; da Silva, A.V.C.; da Silva Lédo, A.; Pereira, K.L.G.; Diniz, L.E.C. Genetic Diversity and Population Structure in the Brazilian Cattleya labiata (Orchidaceae) Using RAPD and ISSR Markers. Plant Systematics and Evolution 2012, 298, 1815–1825. [Google Scholar] [CrossRef]
- Ge, X.-J.; Yu, Y.; Yuan, Y.-M.; Huang, H.-W.; Yan, C. Genetic Diversity and Geographic Differentiation in Endangered Ammopiptanthus (Leguminosae) Populations in Desert Regions of Northwest China as Revealed by ISSR Analysis. Annals of Botany 2005, 95, 843–851. [Google Scholar] [CrossRef]
- Xue, D.-W.; Ge, X.-J.; Hao, G.; Zhang, C.-Q. High Genetic Diversity in a Rare, Narrowly Endemic Primrose Species: Primula interjacens by ISSR Analysis. Acta Botanica Sinica 2004, 46, 1163–1169. [Google Scholar]
- Wang, X.M.; Lai, Y.L.; Xu, X.M.; Ying, Z.M.; Su, Y.J.; Li, Y.B.; Liao, W.B. Genetic Variation in the Endemic Plant Cycas fairylakea (Cycadaceae) from Meilin Forest Park in Shenzhen on the Basis of ISSR Analysis. Acta Scientiarum Naturalium Universitatis Sunyatseni 2006, 45, 82–85. [Google Scholar]
- Octavio-Aguilar, P.; Iglesias-Andreu, L.G.; Núñez de Cáceres-González, F.F.; Galván-Hernández, D.M. Fine-Scale Genetic Structure of Zamia furfuracea : Variation with Life-Cycle Stages. International Journal of Plant Sciences 2017, 178, 57–66. [Google Scholar] [CrossRef]
- Ge, X.-J.; Sun, M. Reproductive Biology and Genetic Diversity of a Cryptoviviparous Mangrove Aegiceras corniculatum (Myrsinaceae) Using Allozyme and Intersimple Sequence Repeat (ISSR) Analysis. Molecular Ecology 1999, 8, 2061–2069. [Google Scholar] [CrossRef]
- Gangopadhyay, G.; Roy, S.K.; Ghose, K.; Podda, R.; Bandyopadhya, T.; Basu, D.; Mukherjee, K.K. Sex Detection of Carica papaya and Cycas circinalis in Pre Flowering Stage by ISSR and RAPD. Current Science 2007, 92, 524–526. [Google Scholar]
- Iglesias-Andreu, L.G.; Favian-Vega, E. Identification of Sex in Zamia inermis Using ISSR Markers. Journal of Plant Development 2021, 28, 33–40. [Google Scholar] [CrossRef]
- Marimuthu Somasundaram, S.; Subbaraya, U.; Durairajan, S.G.; Rajendran, S.; Gopalakrishnan, J.; Shahul Hameed, B.; Palani, D.; Suthanthiram, B. Comparison of Two Different Electrophoretic Methods in Studying the Genetic Diversity among Plantains (Musa Spp.) Using ISSR Markers. Electrophoresis 2019, 40, 1265–1272. [Google Scholar] [CrossRef]
- Dos Santos, L.F.; De Oliveira, E.J.; Dos Santos Silva, A.; De Carvalho, F.M.; Costa, J.L.; Pádua, J.G. ISSR Markers as a Tool for the Assessment of Genetic Diversity in Passiflora. Biochemical Genetics 2011, 49, 540–554. [Google Scholar] [CrossRef]
- Kumar, V.; Roy, B.K. Population Authentication of the Traditional Medicinal Plant Cassia tora L. Based on ISSR Markers and FTIR Analysis. Scientific Reports 2018, 8, 1–11. [Google Scholar] [CrossRef]
- Qian, W.; Ge, X.-J.; Hong, D.Y. Genetic Variation within and among Populations of a Wild Rice Oryza granulata from China Detected by RAPD and ISSR Markers. Theoretical and Applied Genetics 2001, 102, 440–449. [Google Scholar] [CrossRef]
- Wang, X.M. Optimization of DNA Isolation, ISSR-PCR System and Primers Screening of Genuine Species of Rhubarb, an Important Herbal Medicine in China. Journal of Medicinal Plants Research 2010, 4, 904–908. [Google Scholar] [CrossRef]
- Marwa, E.; Abeer, M.; Mona, H. Cytotoxicity and Chromatographic Analysis of Dioon spinulosum, Family Zamiaceae. Journal of Applied Pharmaceutical Science 2020, 10, 075–082. [Google Scholar] [CrossRef]
- Tian, H.Z.; Han, L.X.; Zhang, J.L.; Li, X.L.; Kawahara, T.; Yukawa, T.; López-Pujol, J.; Kumar, P.; Chung, M.G.; Chung, M.Y. Genetic Diversity in the Endangered Terrestrial Orchid Cypripedium Japonicum in East Asia: Insights into Population History and Implications for Conservation. Scientific Reports 2018, 8, 1–13. [Google Scholar] [CrossRef]
- Liu, J.; Shi, S.; Chang, E.; Yang, W.; Jiang, Z. Genetic Diversity of the Critically Endangered Thuja sutchuenensis Revealed by ISSR Markers and the Implications for Conservation. International Journal of Molecular Sciences 2013, 14, 14860–14871. [Google Scholar] [CrossRef]
- Bentley, L.; Barker, N.P.; Dold, A.P. Genetic Diversity of the Endangered Faucaria tigrina (Aizoaceae) through ISSR “Fingerprinting” Using Automated Fragment Detection. Biochemical Systematics and Ecology 2015, 58, 156–161. [Google Scholar] [CrossRef]
- Abdelaziz, S.M.; Medraoui, L.; Alami, M.; Pakhrou, O.; Makkaoui, M.; Boukhary, A.O.M.S.; Filali-Maltouf, A. Inter Simple Sequence Repeat Markers to Assess Genetic Diversity of the Desert Date (Balanites aegyptiaca Del.) for Sahelian Ecosystem Restoration. Scientific Reports 2020, 10, 1–8. [Google Scholar] [CrossRef]
- Archibald, J.K.; Crawford, D.J.; Santos-Guerra, A.; Mort, M.E. The Utility of Automated Analysis of Inter-Simple Sequence Repeat (ISSR) Loci for Resolving Relationships in the Canary Island Species of Tolpis (Asteraceae). American Journal of Botany 2006, 93, 1154–1162. [Google Scholar] [CrossRef]
- Crawford, D.J.; Mort, M.E. Single-Locus Molecular Markers for Inferring Relationships at Lower Taxonomic Levels: Observations and Comments. Taxon 2004, 53, 631–635. [Google Scholar] [CrossRef]
- Prince, L.M. Plant Genotyping Using Fluorescently Tagged Inter-Simple Sequence Repeats (ISSRs): Basic Principles and Methodology. In Methods in Molecular Biology; 2015; Vol. 1245, pp. 63–75 ISBN 9781493919659.
- Liu, B.; Wendel, J.F. Intersimple Sequence Repeat (ISSR) Polymorphisms as a Genetic Marker System in Cotton. Molecular Ecology Notes 2001, 1, 205–208. [Google Scholar] [CrossRef]
- Taylor, C.L.; Barker, N.P. Species Limits in Vachellia (Acacia) karroo (Mimosoideae: Leguminoseae): Evidence from Automated ISSR DNA “Fingerprinting. ” South African Journal of Botany 2012, 83, 36–43. [Google Scholar] [CrossRef]
- NEM:BA Notice 317 Biodiversity Management Plan for Eleven Critically Endangered and Four Endangered Encephalartos Cycad Species. National Environmental Management: Biodiversity Act, 2004 (Act No.10 of 2004) 2017, Notice 315.
- IUCN The IUCN Red List of Threatened Species. Version 2023-1. Available online: https://www.iucnredlist.org (accessed on 3 November 2023).
- Donaldson, J.S. Cycads: A Status Survey and Conservation Action Plan. IUCN/SSC Cycad Specialist Group, Gland 2003, ix + 86 pp.
- Cousins, S.R.; Witkowski, E.T.F. African Cycad Ecology, Ethnobotany and Conservation: A Synthesis. Botanical Review 2017, 83, 152–194. [Google Scholar] [CrossRef]
- Golding, J.S.; Hurter, P.J.H. A Red List Account of Africa’s Cycads and Implications of Considering Life-History and Threats. Biodiversity and Conservation 2003, 12, 507–528. [Google Scholar] [CrossRef]
- Donaldson, J.S. South African Encephalartos Species. NDF Workshop case studies. WG3 - Succulents and Cycads 2008, 1–20.
- Cousins, S.R.; Williams, V.L.; Witkowski, E.T.F. Uncovering the Cycad Taxa (Encephalartos Species) Traded for Traditional Medicine in Johannesburg and Durban, South Africa. South African Journal of Botany 2012, 78, 129–138. [Google Scholar] [CrossRef]
- Williamson, J.; Maurin, O.; Shiba, S.N.S.; van der Bank, H.F.; Pfab, M.; Pilusa, M.; Kabongo, R.M.; van der Bank, M. Exposing the Illegal Trade in Cycad Species (Cycadophyta: Encephalartos) at Two Traditional Medicine Markets in South Africa Using DNA Barcoding. Genome 2016, 59, 771–781. [Google Scholar] [CrossRef]
- Okubamichael, D.Y.; Jack, S.; De Wet Bösenberg, J.; Timm Hoffman, M.; Donaldson, J.S. Repeat Photography Confirms Alarming Decline in South African Cycads. Biodiversity and Conservation 2016, 25, 2153–2170. [Google Scholar] [CrossRef]
- Bamigboye, S.O.; Tshisikhawe Peter, M.; Bonta, M. Review of Extinction Risks in South African Cycads Used for Traditional Medicine. South African Journal of Botany 2018, 115, 279. [Google Scholar] [CrossRef]
- Bamigboye, S.O.; Tshisikhawe, P.M.; Taylor, P.J. Review of Extinction Risk in African Cycads. Phyton-International Journal of Experimental Botany 2016, 85, 333–336. [Google Scholar] [CrossRef]
- Bonta, M.A.; Bamigboye, S.O. Use of Cycads as Ritual and Recreational Narcotics. South African Journal of Botany 2018, 115, 280–281. [Google Scholar] [CrossRef]
- Nesamari, R.; Coutinho, T.A.; Roux, J. Investigations into Encephalartos Insect Pests and Diseases in South Africa and Identification of Phytophthora cinnamomi as a Pathogen of the Modjadji Cycad. Plant Pathilogy 2017, 66, 612–622. [Google Scholar] [CrossRef]
- Janse van Rensburg, P.D.; Bezuidenhout, H.; Van den Berg, J. Impact of Herbivory by Zerenopsis lepida (Lepidoptera: Geometridae) on the Endangered Encephalartos eugene-maraisii under Field Conditions. Biodiversity and Conservation 2023, 32, 2451–2468. [Google Scholar] [CrossRef]
- Toon, A.; Terry, L.I.; Tang, W.; Walter, G.H.; Cook, L.G. Insect Pollination of Cycads. Austral Ecology 2020, 45, 1033–1058. [Google Scholar] [CrossRef]
- Swart, C.; Rowswell, R.; Donaldson, J.S.; Barker, N.P. Population Structure and Survival of the Critically Endangered Cycad Encephalartos latifrons in South Africa. South African Journal of Botany 2019, 127, 80–90. [Google Scholar] [CrossRef]
- Mankga, L.T.; Yessoufou, K. Factors Driving the Global Decline of Cycad Diversity. AoB PLANTS 2017, 9. [Google Scholar] [CrossRef]
- Osborne, R. The World Cycad Census and a Proposed Revision of the Threatened Species Status for Cycad Taxa. Biological Conservation 1995, 71, 1–12. [Google Scholar] [CrossRef]
- Raimondo, D.C.; von Staden, L.; Foden, W. Victor, J.E.; Helme, N..; Turner, R.C.; Kamundi, D.A.; Manyama, P.A. Red List of South African Plants; Raimondo, D. von Staden, L. Foden, W. Victor, J.E. Helme, N.A Turner, R.C. Kamundi, D.A. Manyama, P.A., Ed.; Strelitzia 25: Pretoria, 2013;
- Segalla, R.; Telles, F.J.; Pinheiro, F.; Morellato, P. A Review of Current Knowledge of Zamiaceae, With Emphasis on Zamia From South America. Tropical Conservation Science 2019, 12, 1–21. [Google Scholar] [CrossRef]
- Donaldson, J.S. Encephalartos eugene-maraisii. The IUCN Red List of Threatened Species 2010 2010, e.T41904A1, 1–7. [CrossRef]
- Bösenberg, J.D. Encephalartos eugene-maraisii. The IUCN Red List of Threatened Species2022, 8235. [CrossRef]
- Roodt, D.; Lohaus, R.; Sterck, L.; Swanepoel, R.L.; Van De Peer, Y.; Mizrachi, E. Evidence for an Ancient Whole Genome Duplication in the Cycad Lineage. PLoS ONE 2017, 12, 1–8. [Google Scholar] [CrossRef]
- Liu, Y.; Wang, S.; Li, L.; Yang, T.; Dong, S.; Wei, T.; Wu, S.; Liu, Y.; Gong, Y.; Feng, X.; et al. The Cycas Genome and the Early Evolution of Seed Plants. Nature Plants 2022, 11. [Google Scholar] [CrossRef]
- Treutlein, J.; Vorster, P.; Wink, M. Molecular Relationships in Encephalartos (Zamiaceae, Cycadales) Based on Nucleotide Sequences of Nuclear ITS 1&2, Rbcl, and Genomic ISSR Fingerprinting. Plant Biology 2005, 7, 79–90. [Google Scholar] [CrossRef]
- Williamson, J. Molecular Phylogeny and DNA Barcoding of the African Endemic Cycad Genus Encephalartos Lehm., University of Johannesburg, 2021.
- Bradbury, D.; Binks, R.M.; Webb, A.; Byrne, M. Defining Conservation Units in a Species Complex with Genomic-Taxonomic Discordance: A Case Study of Conospermum caeruleum (Proteaceae). Biodiversity and Conservation 2023, 32, 1949–1975. [Google Scholar] [CrossRef]
- van der Bank, H.F.; Wink, M.; Vorster, P.; Treutlein, J.; Brand, L.; van der Bank, M.; Hurter, J. Allozyme and DNA Sequence Comparisons of Nine Species of Encephalartos (Zamiaceae). Biochemical Systematics and Ecology 2001, 29, 241–266. [Google Scholar] [CrossRef]
- Xiao, L.Q.; Gong, X.; Xiao, L.Q. and Gong, X.U.N. Genetic Differentiation and Relationships of Populations in the Cycas balansae Complex (Cycadaceae) and Its Conservation Implications. Annals of Botany 2006, 97, 807–812. [Google Scholar] [CrossRef]
- Sharma, I.K.; Jones, D.L.; Forster, P.I. Genetic Differentiation and Phenetic Relatedness among Seven Species of the Macrozamia plurinervia Complex (Zamiaceae). Biochemical Systematics and Ecology 2004, 32, 313–327. [Google Scholar] [CrossRef]
- Vovides, A.P.; González, D.; Pérez-Farrera, M.A.; Avendaño, S.; Bárcenas, C. A Review of Research on the Cycad Genus Ceratozamia Brongn. (Zamiaceae) in Mexico. TAXON 2004, 53, 291–297. [Google Scholar] [CrossRef]
- Moretti, A.; De Luca, P.; Sclavo, J.P.; Stevenson, D.W. m. Encephalartos voiensis (Zamiaceae), a New East Central African Species in the E. hildebrandtii Complex. Annals of the Missouri Botanical Garden 1989, 76, 934–938. [Google Scholar] [CrossRef]
- Vorster, P. Classification Concepts in Encephalartos (Zamiaceae). In Cycad classification: concepts and recommendations; Walters, T., Osborne, R., Eds.; 2004; 69–83.
- de Klerk, D. Encephalartos nubimontanus A Distinction between 11 Variants; de Klerk, 2004.
- Domínguez, L. , Nicolalde-Morejón, F., Vergara-Silva, F. and Stevenson, D.W. A Review of Taxonomic Concepts and Species Delimitation in Cycadales. The Botanical Review 2024, 90, 33–66. [Google Scholar] [CrossRef]
- Bonneuil, C. "The Manufacture of Species: Kew Gardens, the Empire and the Standardisation of Taxonomic Practices in late 19th century Botany", in M.-N. Bourguet, C. Licoppe et O. Sibum, dir., Instruments, Travel and Science. Itineraries of precision from the 17th to the 20th century, Routledge, 2002, 189–215.
- Mankga, L.T.; Yessoufou, K.; Chitakira, M. On the Origin and Diversification History of the African Genus Encephalartos. South African Journal of Botany 2020, 130, 231–239. [Google Scholar] [CrossRef]
- Stewart, R.D.; Clugston, J.A.R.; Williamson, J.; Niemann, H.J.; Little, D.P.; van der Bank, M. Species Relationships and Phylogenetic Diversity of the African Genus Encephalartos Lehm. (Zamiaceae). South African Journal of Botany 2023, 152, 165–173. [Google Scholar] [CrossRef]
- Nei, M. Estimation of Average Heterozygosity and Genetic Distance from a Small Number of Individuals. Genetics 1978, 89, 583–590. [Google Scholar] [CrossRef]
- Innis, M.A., Gelfand, D.H., Sninsky, J.J. and White, T.J. Eds., PCR protocols: a guide to methods and applications. Academic press. 2012.
- Sneath, P.H.; Sokal, R.R. Numerical Taxonomy. The Principles and Practice of Numerical Classification; 1973;
- Bandelt, H.J.; Forster, P.; Rohl, A. Median-Joining Networks for Inferring Intraspecific Phylogenies. Molecular Biology and Evolution 1999, 16, 37–48. [Google Scholar] [CrossRef]
- Pritchard, J.K.; Stephens, M.; Donnelly, P. Inference of Population Structure Using Multilocus Genotype Data. Genetics 2000, 155, 945–959. [Google Scholar] [CrossRef]
- Tajima, F. Statistical Method for Testing the Neutral Mutation Hypothesis by DNA Polymorphism. Genetics 1989, 123, 585–595. [Google Scholar] [CrossRef] [PubMed]
- Rohlf, F.J. NTSYS-Pc Numerical Taxon- Omy and Multivariate Analysis System. 1998.
- Sokal, R.R.; Rohlf, F.J. The Comparison of Dendrograms by Objective Methods. Taxon 1962, 11, 33–40. [Google Scholar] [CrossRef]
- Earl, D.A.; VonHoldt, B.M. STRUCTURE HARVESTER: A Website and Program for Visualizing STRUCTURE Output and Implementing the Evanno Method. Conservation Genetics Resources 2012, 4, 359–361. [Google Scholar] [CrossRef]
- Evanno, G.; Regnaut, S.; Goudet, J. Detecting the number of clusters of individuals using the software STRUCTURE: a simulation study. Molecular Ecology 2611. [Google Scholar] [CrossRef] [PubMed]
- Leigh, J.W.; Bryant, D. POPART: Full-Feature Software for Haplotype Network Construction. Methods in Ecology and Evolution 2015, 6, 1110–1116. [Google Scholar] [CrossRef]
- Salas-Leiva, D.E.; Meerow, A.W.; Calonje, M.; Griffith, M.P.; Francisco-Ortega, J.; Nakamura, K.; Stevenson, D.W.; Lewis, C.E.; Namoff, S. Phylogeny of the Cycads Based on Multiple Single-Copy Nuclear Genes: Congruence of Concatenated Parsimony, Likelihood and Species Tree Inference Methods. Annals of Botany 2013, 112, 1263–1278. [Google Scholar] [CrossRef]
- Coiro, M.; Allio, R.; Mazet, N.; Seyfullah, L.J.; Condamine, F.L. Reconciling Fossils with Phylogenies Reveals the Origin and Macroevolutionary Processes Explaining the Global Cycad Biodiversity. New Phytologist 2023. [Google Scholar] [CrossRef]
- Calonje, M.; Meerow, A.W.; Knowles, L.; Knowles, D.; Griffith, M.P.; Nakamura, K.; Francisco-Ortega, J. Cycad Biodiversity in the Bahamas Archipelago and Conservation Genetics of the Threatened Zamia lucayana (Zamiaceae). Oryx 2013, 47, 190–198. [Google Scholar] [CrossRef]
- Ekue, M.R.M.; Gailing, O.; Holscher, D.; Sinsin, B.; Finkeldey, R. Population Genetics of the Cycad Encephalartos barteri Ssp. Barteri (Zamiaceae) in Benin with Notes on Leaflet Morphology and Implications for Conservation. Belguian Journal of Botany 2008, 141, 78–94. [Google Scholar]
- He, Z.; Yao, Z.; Wang, K.; Li, Y.; Liu, Y. Genetic Structure and Differentiation of Endangered Cycas Species Indicate a Southward Migration Associated with Historical Cooling Events. Diversity 2023, 15. [Google Scholar] [CrossRef]
- Goode, D. Cycads of Africa; Linscott, G., Ed.; 1st ed.; D & E Cycads of Africa Publishers: Gallomanor, 2001.
- Rousseau, P. A Molecular Systematic Study of the African Endemic Cycads, University of Johannesburg, 2012.
- Falush, D.; Stephens, M.; Pritchard, J.K. Inference of Population Structure Using Multilocus Genotype Data: Dominant Markers and Null Alleles. Molecular Ecology Notes 2007, 7, 574–578. [Google Scholar] [CrossRef] [PubMed]
- Dice, L.R. Measures of the Amount of Ecologic Association Between Species. Ecology 1945, 26, 297–302. [Google Scholar] [CrossRef]
- Lavranos, J.J.; Goode, D.L. Notes on Southern African Cycadales. Bulletin du Jardin botanique National de Belgique 1988, 58, 219–224. [Google Scholar] [CrossRef]
- Grobbelaar, N. Cycads with Special Reference to the Southern African Species; Author: Pretoria, 2002;
- Chang, J.T.; Nakamura, K.; Chao, C.T.; Luo, M.X.; Liao, P.C. Ghost Introgression Facilitates Genomic Divergence of a Sympatric Cryptic Lineage in Cycas revoluta. Ecology and Evolution 2023, 13, 1–17. [Google Scholar] [CrossRef] [PubMed]
- De Queiroz, K. An Updated Concept of Subspecies Resolves a Dispute about the Taxonomy of Incompletely Separated Lineages. Herpetological Review 2020, 51, 459–461. [Google Scholar]
- van der Westhuizen, S. ’n Morfologiese Studie van Encephalartos eugene-maraisii Verdoorn, University of Pretoria, 1976.
- Robbertse, P.J.; van der Westhuizen, S.; Vorster, P. Encephalartos middelburgensis (Zamiaceae): A New Species from the Transvaal. South African Journal of Botany 1989, 55, 122–126. [Google Scholar] [CrossRef]
- Van Valen, L. Ecological Species, Multispecies, and Oaks. Taxon 1976, 25, 233–239. [Google Scholar] [CrossRef]
- de Queiroz, K. A Unified Concept of Species and Its Consequences for the Future of Taxonomy. Proceedings of the California Academy of Sciences 2005, 56, 196–215. [Google Scholar]
- de Queiroz, K. The General Lineage Concept of Species, Species Criteria, and the Process of Speciation: A Conceptual Unification and Terminological Recommendations. In Endless Forms: Species and Speciation; Howard, D.J., Berlocher, S.H., Eds.; Oxford University Press: New York, 1998; pp. 57–75. [Google Scholar]
- Baum, D.A.; Shaw, K.L. Genealogical Perspectives on the Species Problem. In Experimental and molecular approaches to plant biosystematics; Hoch, P.C., Stephenson, A.G., Eds.; Missouri Botanical Garden: St. Louis, 1995; pp. 289–303. [Google Scholar]
- Stull, G.W.; Pham, K.K.; Soltis, P.S.; Soltis, D.E. Deep Reticulation: The Long Legacy of Hybridization in Vascular Plant Evolution. Plant Journal 2023, 114, 743–766. [Google Scholar] [CrossRef]
- Vorster, P. Hybridization in Encephalartos. Excelsa 1896, 12, 101–106. [Google Scholar]
- Tao, Y.; Chen, B.; Kang, M.; Liu, Y.; Wang, J. Genome-Wide Evidence for Complex Hybridization and Demographic History in a Group of Cycas From China. Frontiers in Genetics 2021, 12. [Google Scholar] [CrossRef]
- Wang, J. The computer program structure for assigning individuals to populations: easy to use but easier to misuse. Molecular ecology resources 2017, 17, 981–990. [Google Scholar] [CrossRef] [PubMed]
- Lawson, D.J.; van Dorp, L.; Falush, D. A tutorial on how not to over-interpret STRUCTURE and ADMIXTURE bar plots. Nature Communications 2018, 9, 3258. [Google Scholar] [CrossRef] [PubMed]
- Doyle, J.J.; Doyle, J.L. A Rapid DNA Isolation Procedure for Small Quantities of Fresh Leaf Tissue. Phytochemical bulletin 1987. [Google Scholar]
- Ng, W.L.; Tan, S.G. Inter-Simple Sequence Repeat (ISSR) Markers: Are We Doing It Right? ASM Science Journal 2015, 9, 30–39. [Google Scholar]
- Nelson, M.F.; Anderson, N.O. How Many Marker Loci Are Necessary? Analysis of Dominant Marker Data Sets Using Two Popular Population Genetic Algorithms. Ecology and Evolution 2013, 3, 3455–3470. [Google Scholar] [CrossRef] [PubMed]
- Chang, A.C.G.; Lai, Q.; Chen, T.; Tu, T.; Wang, Y.; Agoo, E.M.G.; Duan, J.; Li, N. The Complete Chloroplast Genome of Microcycas calocoma ( Miq.) A. DC. (Zamiaceae, Cycadales) and Evolution in Cycadales. PeerJ 2020, 8, 1–22. [Google Scholar] [CrossRef] [PubMed]
- Schrader, C.; Schielke, A.; Ellerbroek, L.; Johne, R. PCR Inhibitors - Occurrence, Properties and Removal. Journal of Applied Microbiology 2012, 113, 1014–1026. [Google Scholar] [CrossRef] [PubMed]
- Katterman, F.R.H.; Shattuck, V.I. An Effective Method of DNA Isolation from the Mature Leaves of Gossypium Species That Contain Large Amounts of Phenolic Terpenoids and Tannins. Preparative Biochemistry 1983, 13, 347–359. [Google Scholar] [CrossRef] [PubMed]
- Guadalupe Sánchez-Coello, N.; Luna-Rodríguez, M.; Vázquez-Torres, M.; Sánchez-Velásquez, L.R.; Santana-Buzzy, N.; Octavio-Aguilar, P.; Iglesias-Andreu, L.G. Optimisation of DNA Isolation and ISSR-PCR System of Ceratozamia mexicana Brongn. (Zamiaceae). Revista Chapingo Serie Ciencias Forestales y del Ambiente 2012, 18, 123–133. [Google Scholar] [CrossRef]
- Lodhi, M.A.; Ye, G.N.; Weeden, N.F.; Reisch, B.I. A Simple and Efficient Method for DNA Extraction from Grapevine Cultivars and Vitis Species. Plant Molecular Biology Reporter 1994, 12, 6–13. [Google Scholar] [CrossRef]
- Korbie, D.J.; Mattick, J.S. Touchdown PCR for increased specificity and sensitivity in PCR amplification. Nature protocols 2008, 3, 1452–1456. [Google Scholar] [CrossRef] [PubMed]
- Cavers, S.; Degen, B.; Caron, H.; Lemes, M.R.; Margis, R.; Salgueiro, F.; Lowe, A.J. Optimal Sampling Strategy for Estimation of Spatial Genetic Structure in Tree Populations. Heredity 2005, 95, 281–289. [Google Scholar] [CrossRef] [PubMed]
- Stevens, M.I.; Hunger, S.A.; Hills, S.F.K.; Gemmill, C.E.C. Phantom Hitch-Hikers Mislead Estimates of Genetic Variation in Antarctic Mosses. Plant Systematics and Evolution 2007, 263, 191–201. [Google Scholar] [CrossRef]
- Gutiérrez-Ortega, J.S.; Jiménez-Cedillo, K.; Pérez-Farrera, M.A.; Vovides, A.P.; Martínez, J.F.; Molina-Freaner, F.; Imai, R.; Tsuda, Y.; Matsuki, Y.; Suyama, Y.; et al. Considering Evolutionary Processes in Cycad Conservation: Identification of Evolutionarily Significant Units within Dioon sonorense (Zamiaceae) in Northwestern Mexico. Conservation Genetics 2018, 19, 1069–1081. [Google Scholar] [CrossRef]
- Gutiérrez-Ortega, J.S.; Salinas-Rodr-Guez, M.M.; Martínez, J.F.; Molina-Freaner, F.; Pérez-Farrera, M.A.; Vovides, A.P.; Matsuki, Y.; Suyama, Y.; Ohsawa, T.A.; Watano, Y.; et al. The Phylogeography of the Cycad Genus Dioon (Zamiaceae) Clarifies Its Cenozoic Expansion and Diversification in the Mexican Transition Zone. Annals of Botany 2018, 121, 535–548. [Google Scholar] [CrossRef]
- Singh, B.D.; Singh, A.K. High-Throughput SNP Genotyping. In Marker-Assisted Plant Breeding: Principles and Practices 2015, 367–400 ISBN 9788132223160.
- Böcher, T.W. Continuous Variation and Taxonomy. Taxon 1967, 16, 255–258. [Google Scholar] [CrossRef]
- Christenhusz, M.J. On species concepts, phylogenetics and the science of natural history–three current issues facing taxonomy. Megataxa 1, 67–72. [CrossRef]
- Calonje, M.; Stevenson, D.W.; Osborne, R. The World List of Cycads, Online Edition.
Figure 1.
Map of the Limpopo province of South Africa showing the approximate location of the six members of the Encephalartos eugene-maraisii complex as well as E. hirsutus.
Figure 1.
Map of the Limpopo province of South Africa showing the approximate location of the six members of the Encephalartos eugene-maraisii complex as well as E. hirsutus.
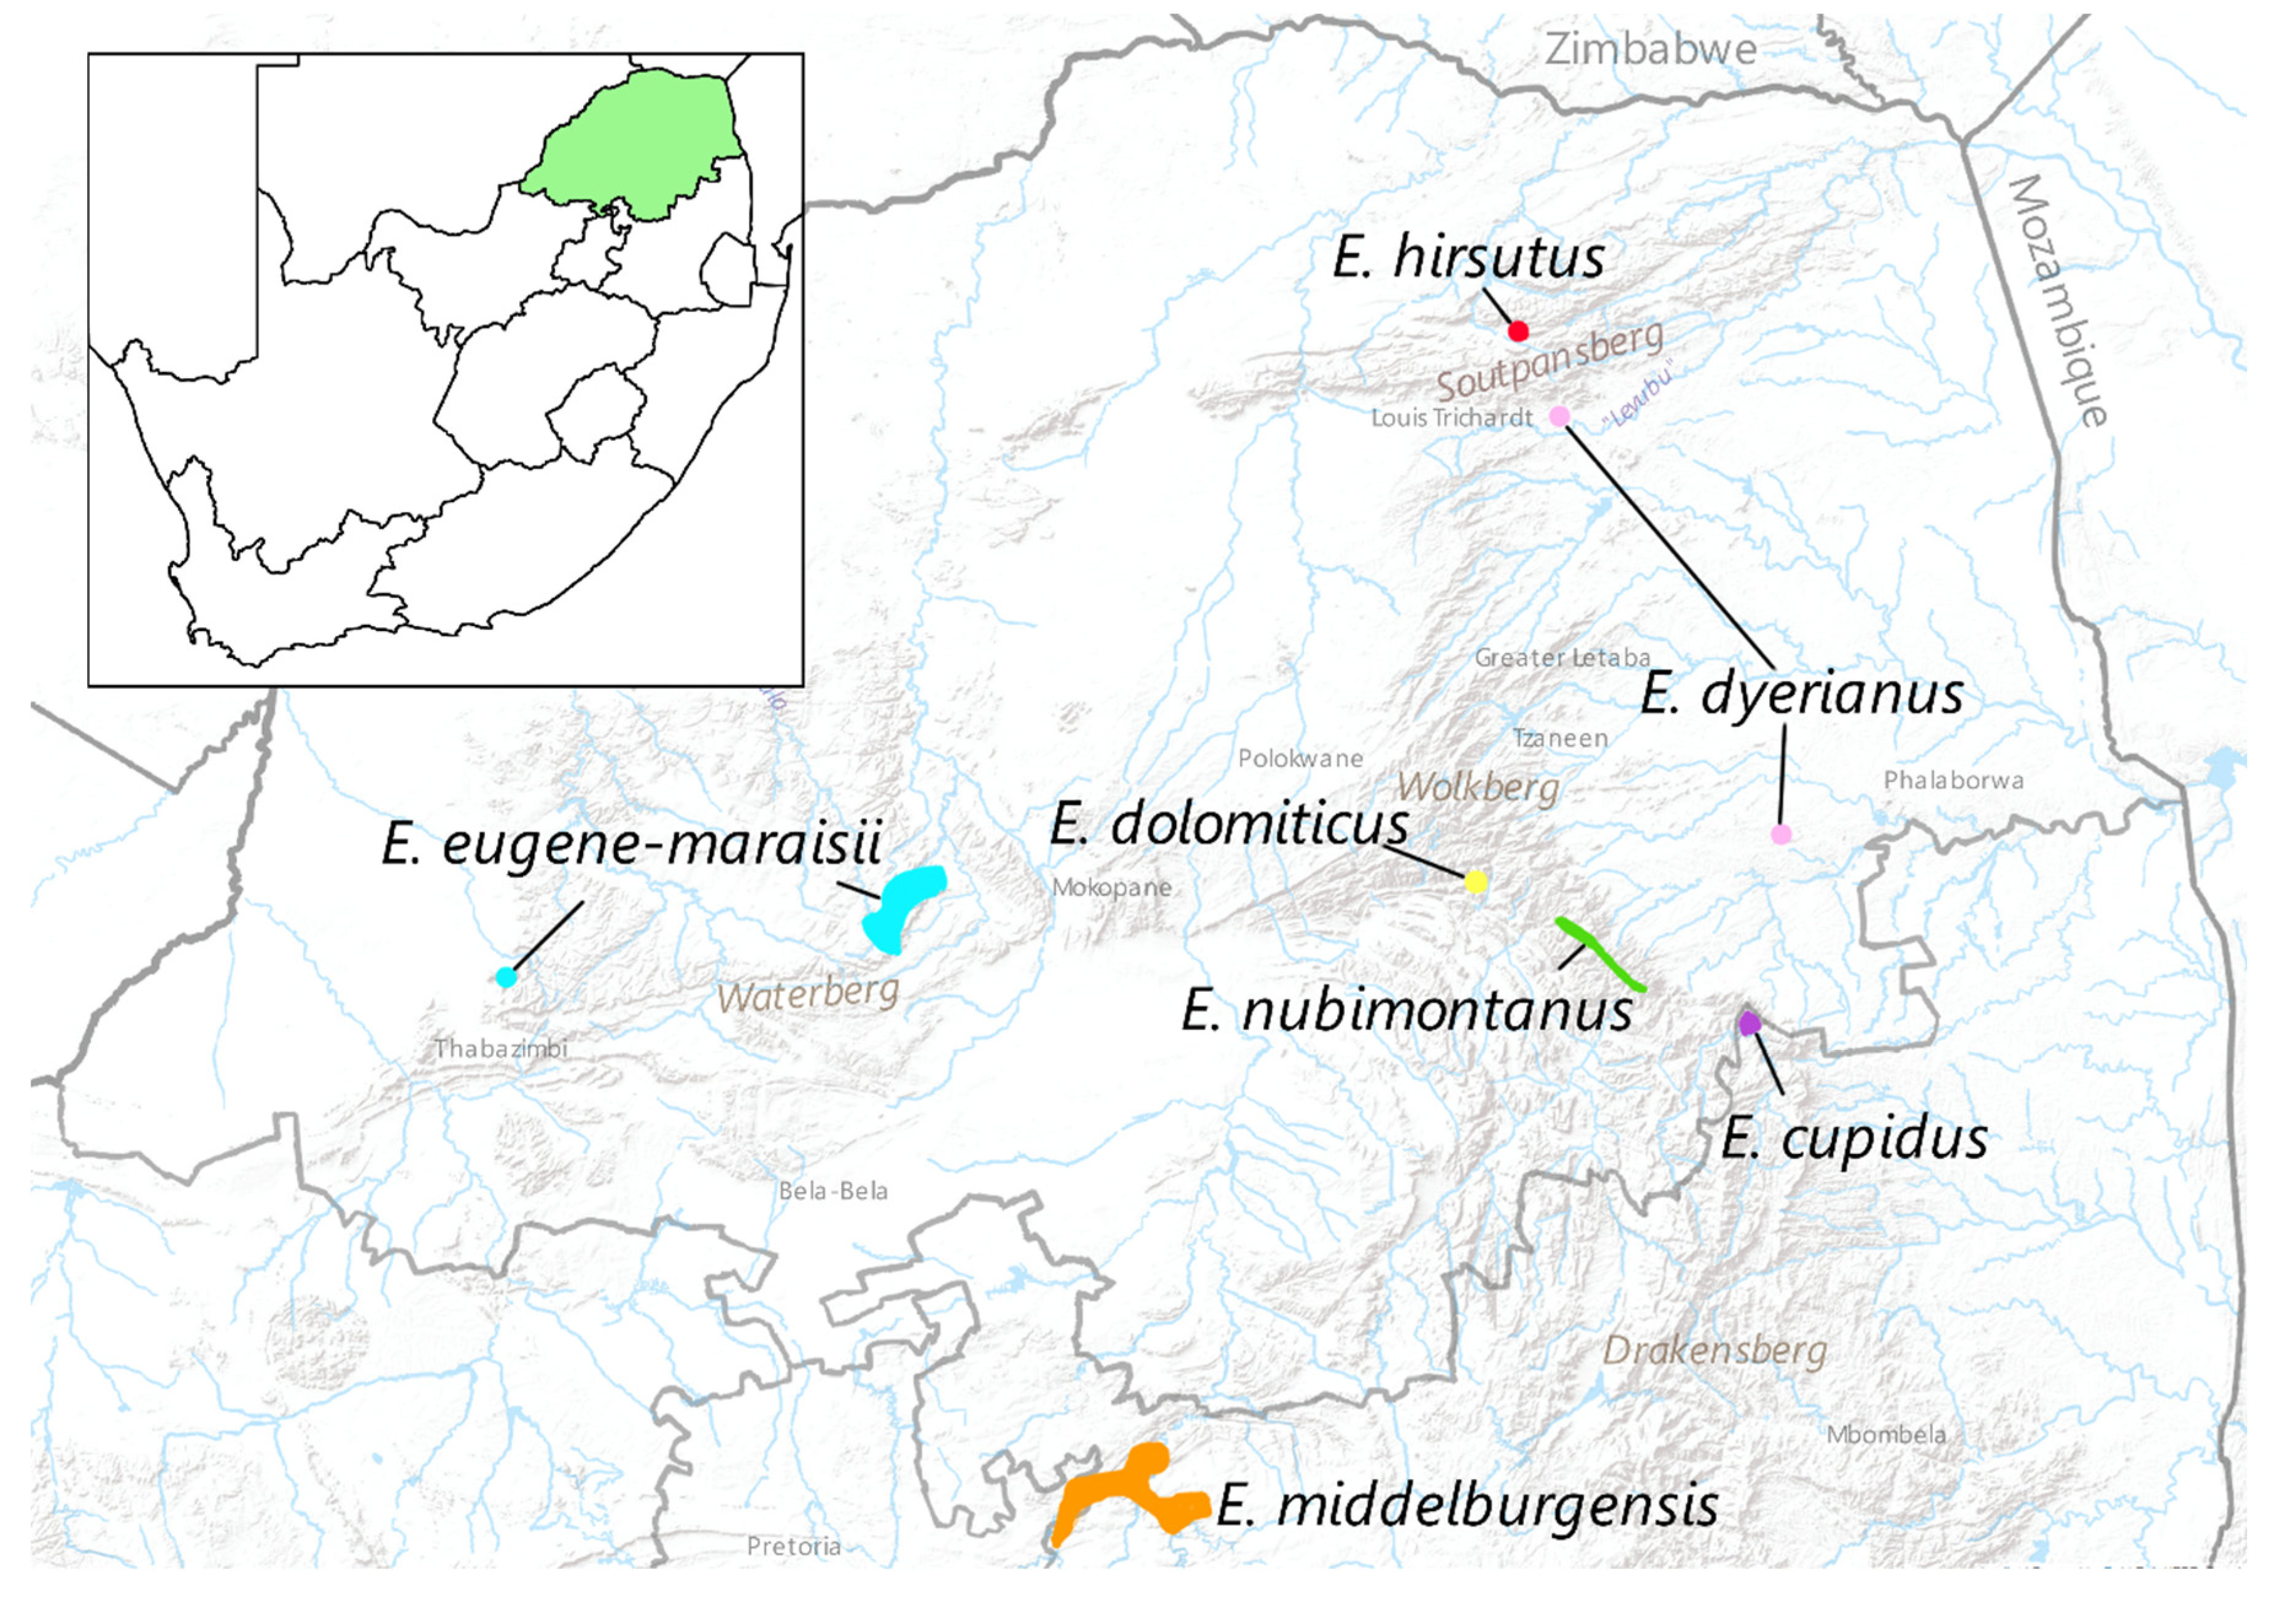
Figure 2.
Boxplots showing the Nanodrop readings for DNA concentration in ng/µl (a) and DNA fluorescence ratios indicating purity (b), in samples which were included in the study (blue plots) and those excluded (orange plots) due to unsuccessful PCR amplification. Means are denoted by X and medians by horizontal lines inside the boxes. Outliers are denoted by dots.
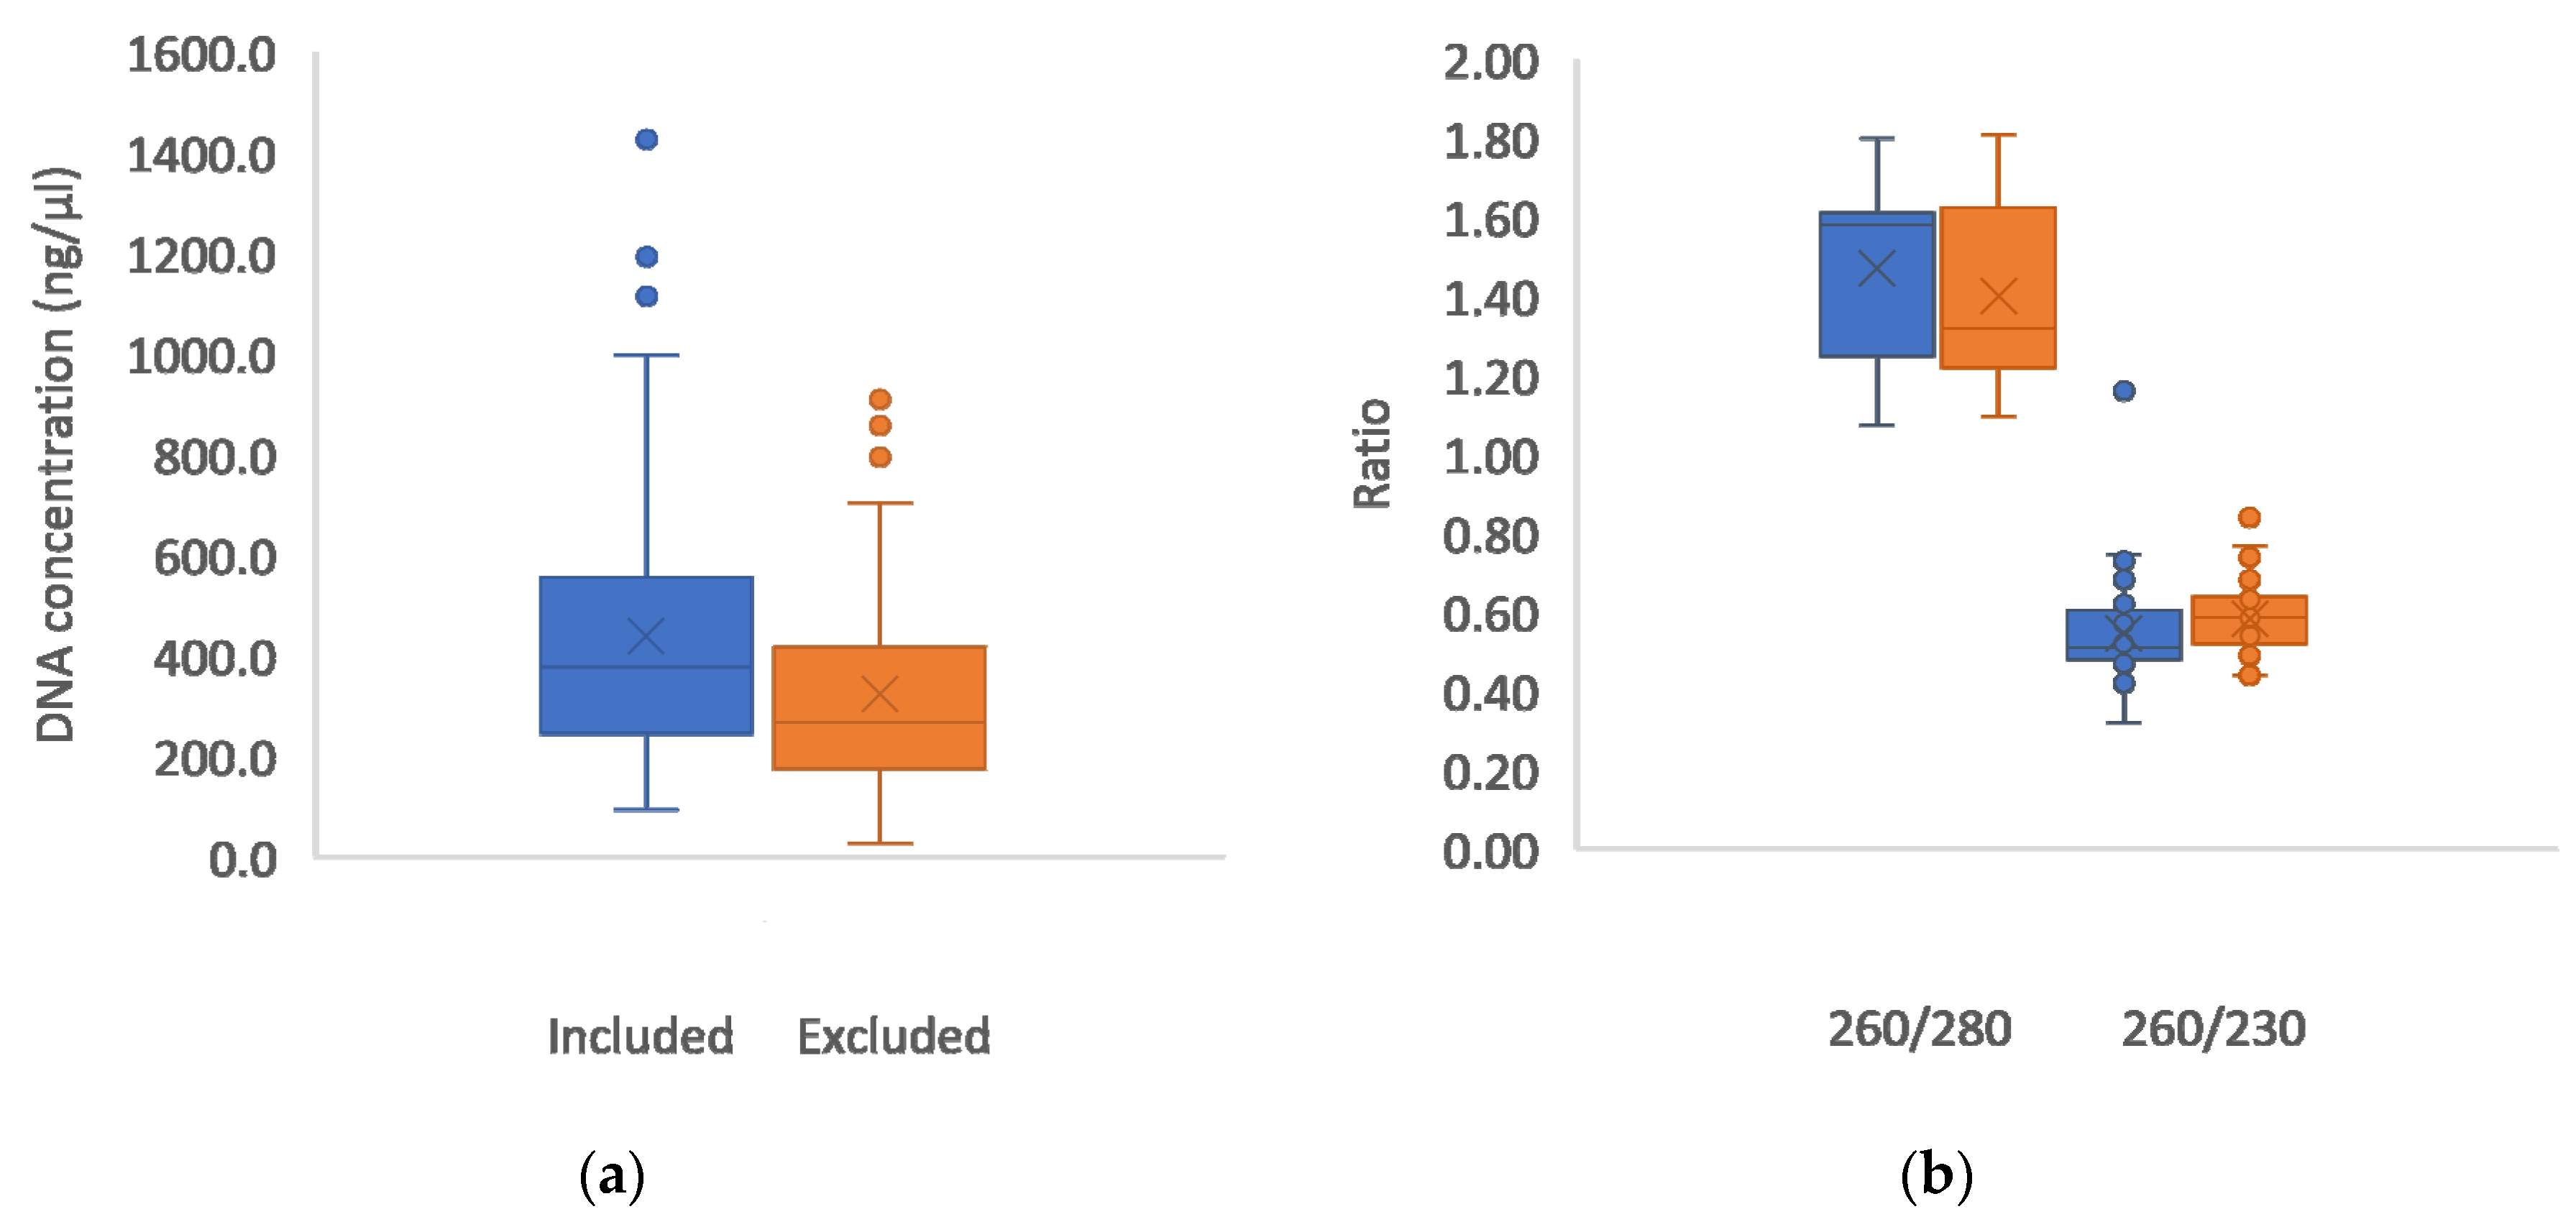
Figure 3.
STRUCTURE bar plots showing the proportion of membership of samples assigned to the optimum K within the Encephalartos eugene-maraisii complex. Results are based on ISSR fragments scored at a 50 relative fluorescence unit (rfu) cut-off value. The dataset was assessed using the Standard STRUCTURE model (a) and the LOCPRIOR model (b) that accounts for known locality data prior to the run. Colours represent each of the predefined clusters to which each sample is assigned.
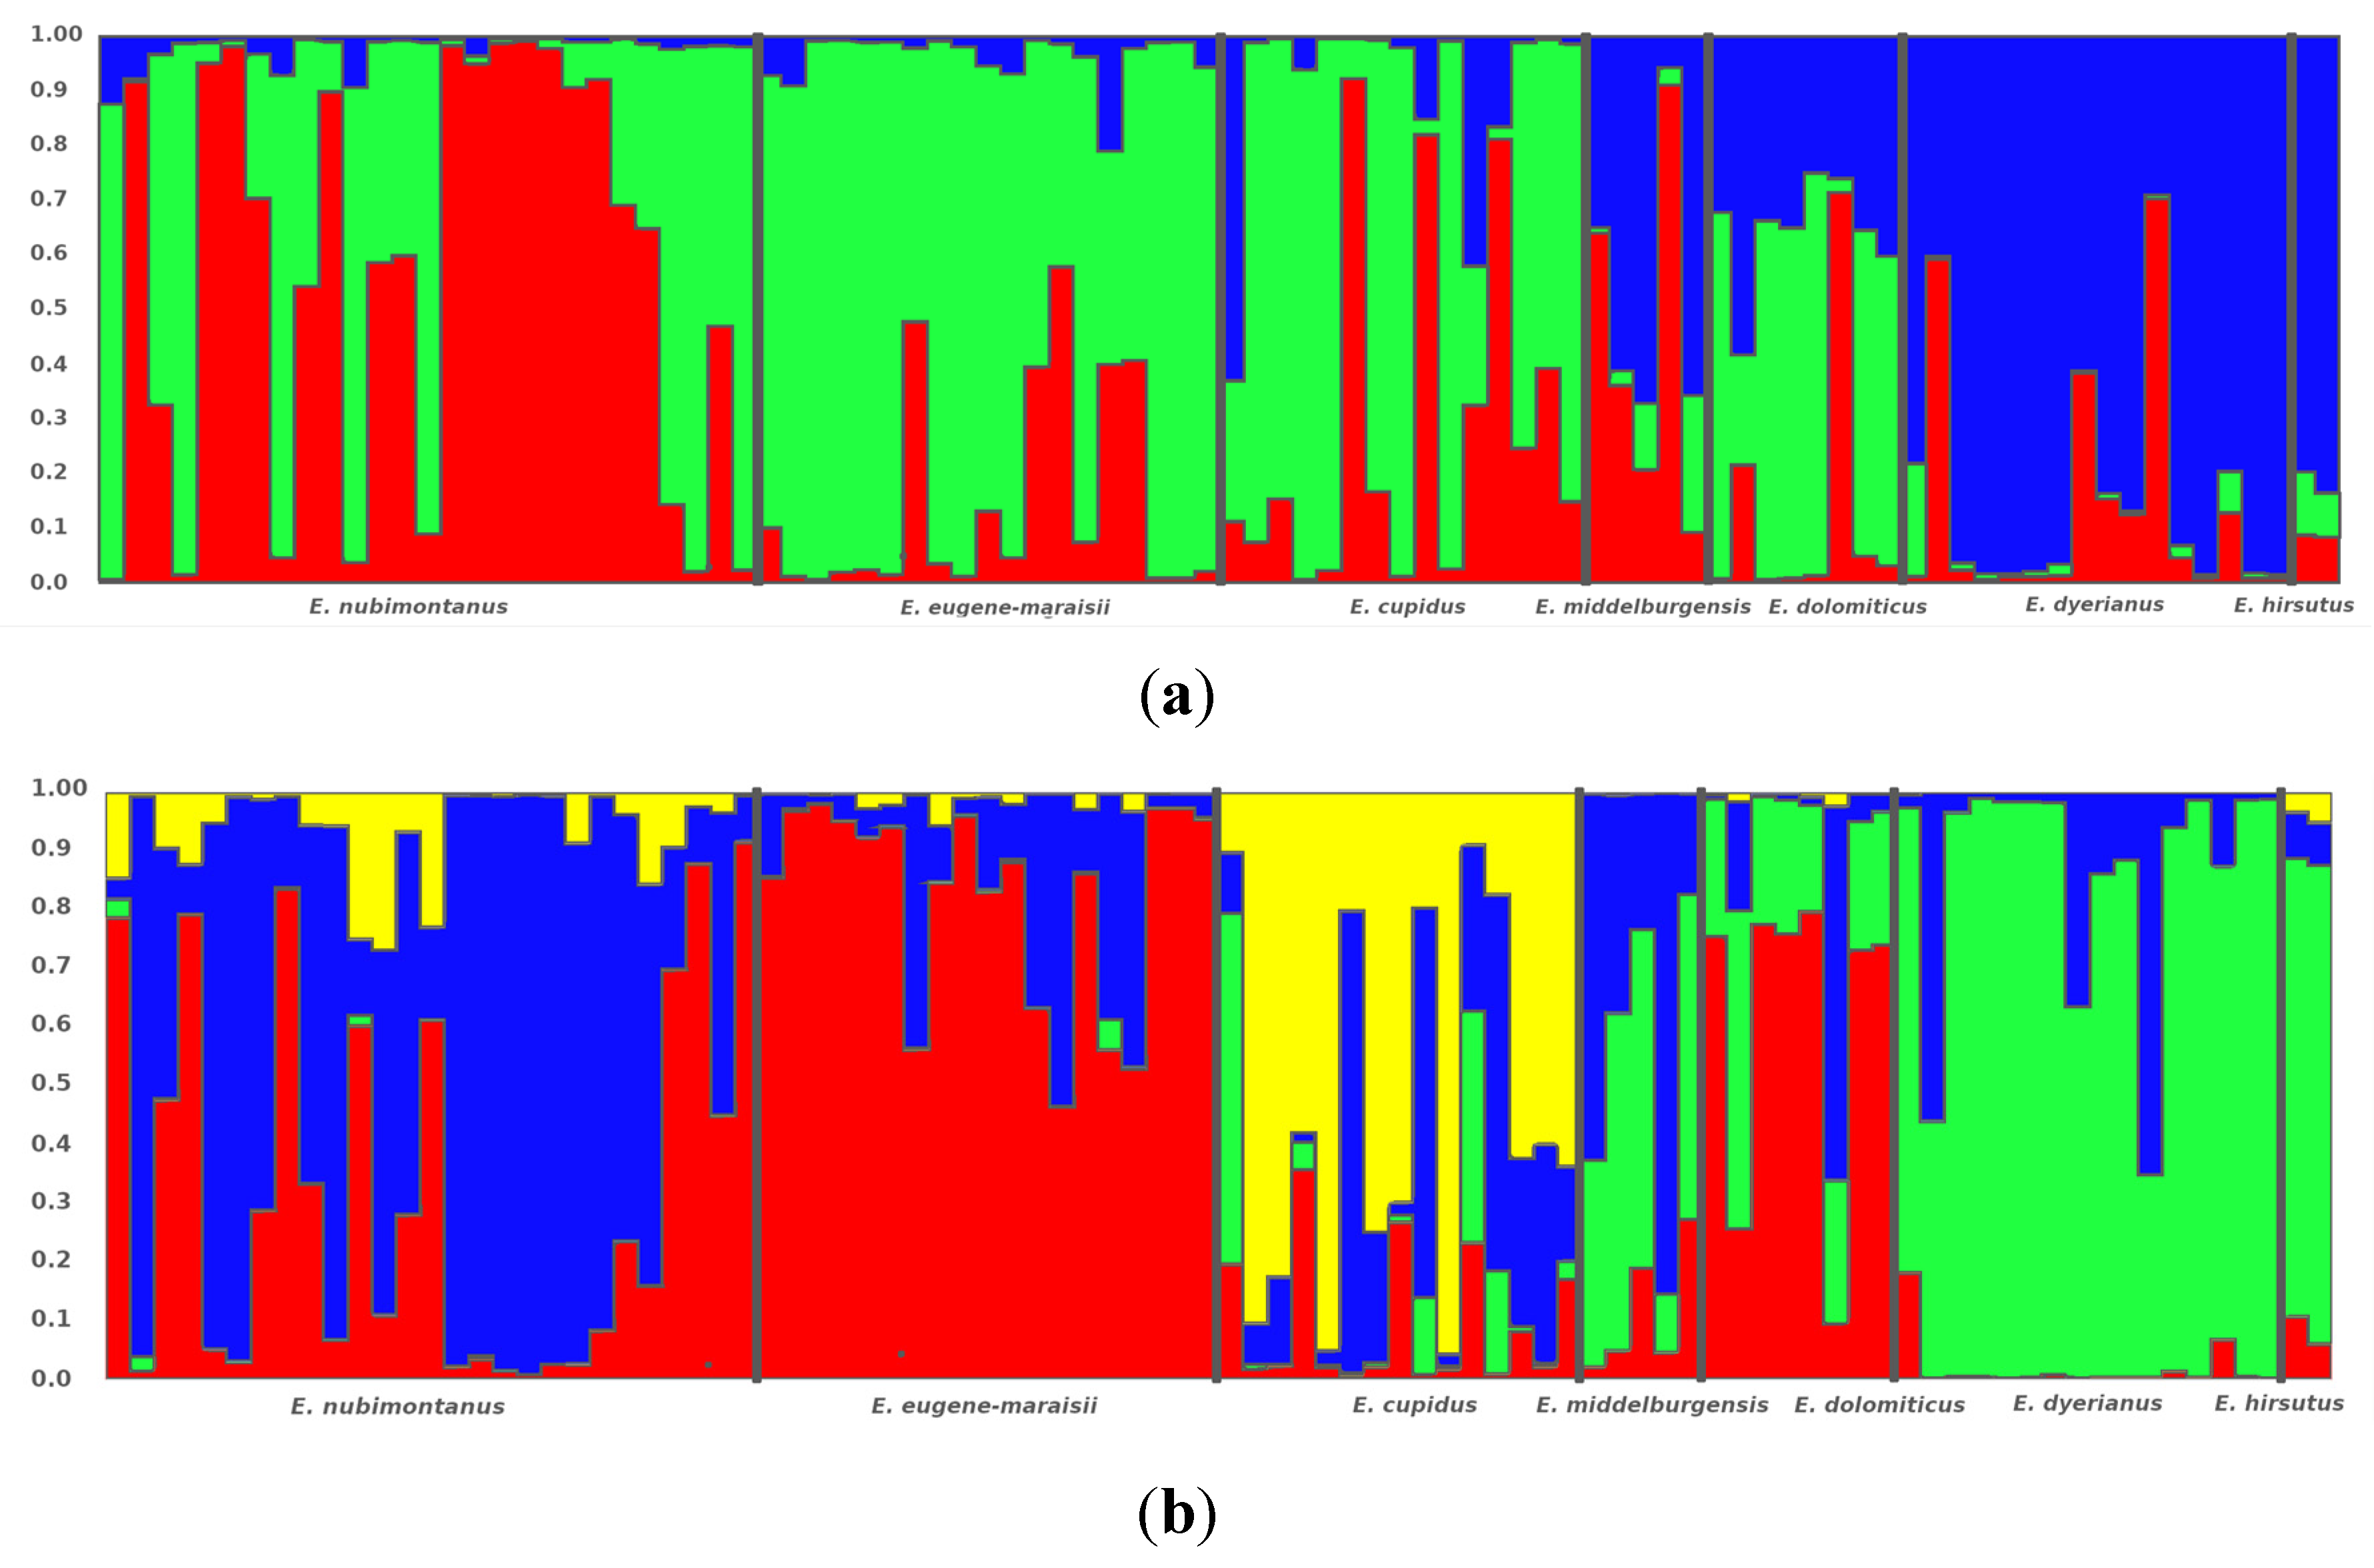
Figure 4.
Neighbor joining analysis of the Encephalartos eugene-maraisii complex based on ISSR markers with a minimum band intensity of 50 relative fluorescence units (rfu). The colour of each sample corresponds to its species and sample names are represented by the first three letters of their species epithet, corresponding to Table S5. Sample duplicates, representing material obtained from the same plant, but extracted in a different DNA extraction batch, are indicated by the coloured rectangles. Genetic distances were computed using the DICE coefficient. Band presence and absence was used to compute genetic distances using the DICE coefficient.
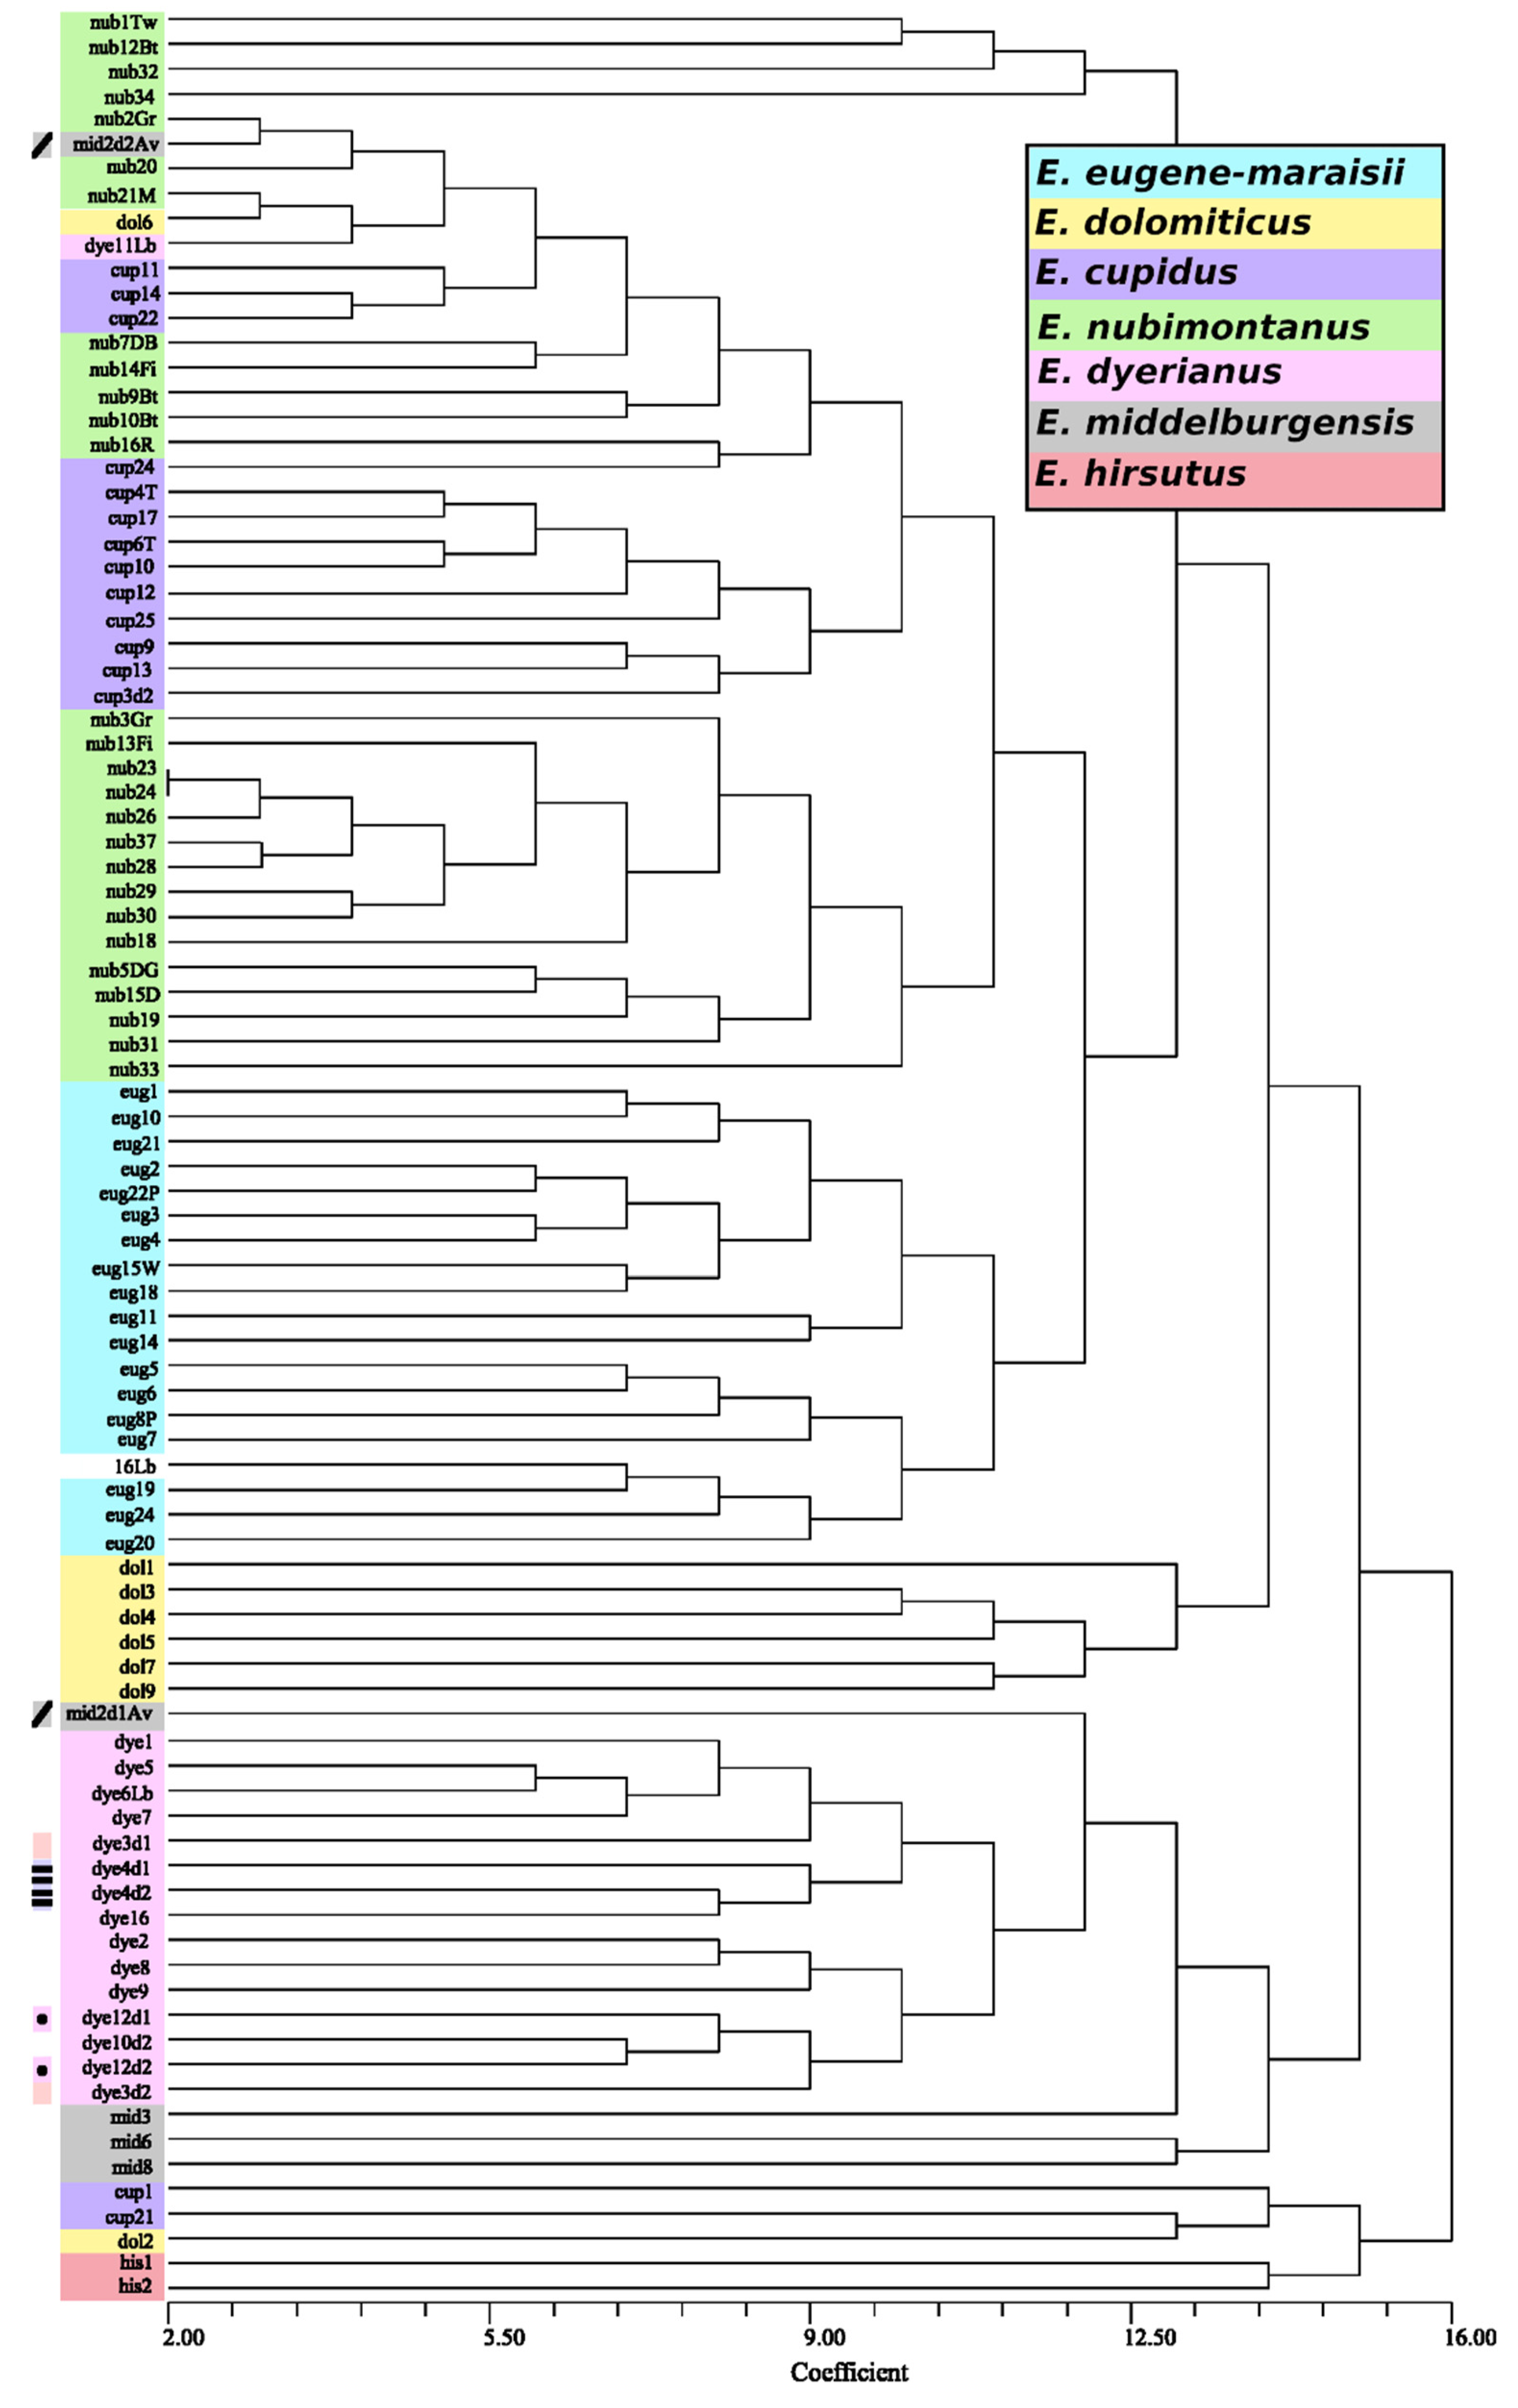
Figure 5.
Median joining network of the Encephalartos eugene-maraisii complex based on ISSR markers with a minimum band intensity of 50 relative fluorescent units. Colours denote the species of each sample in this study.
Figure 5.
Median joining network of the Encephalartos eugene-maraisii complex based on ISSR markers with a minimum band intensity of 50 relative fluorescent units. Colours denote the species of each sample in this study.
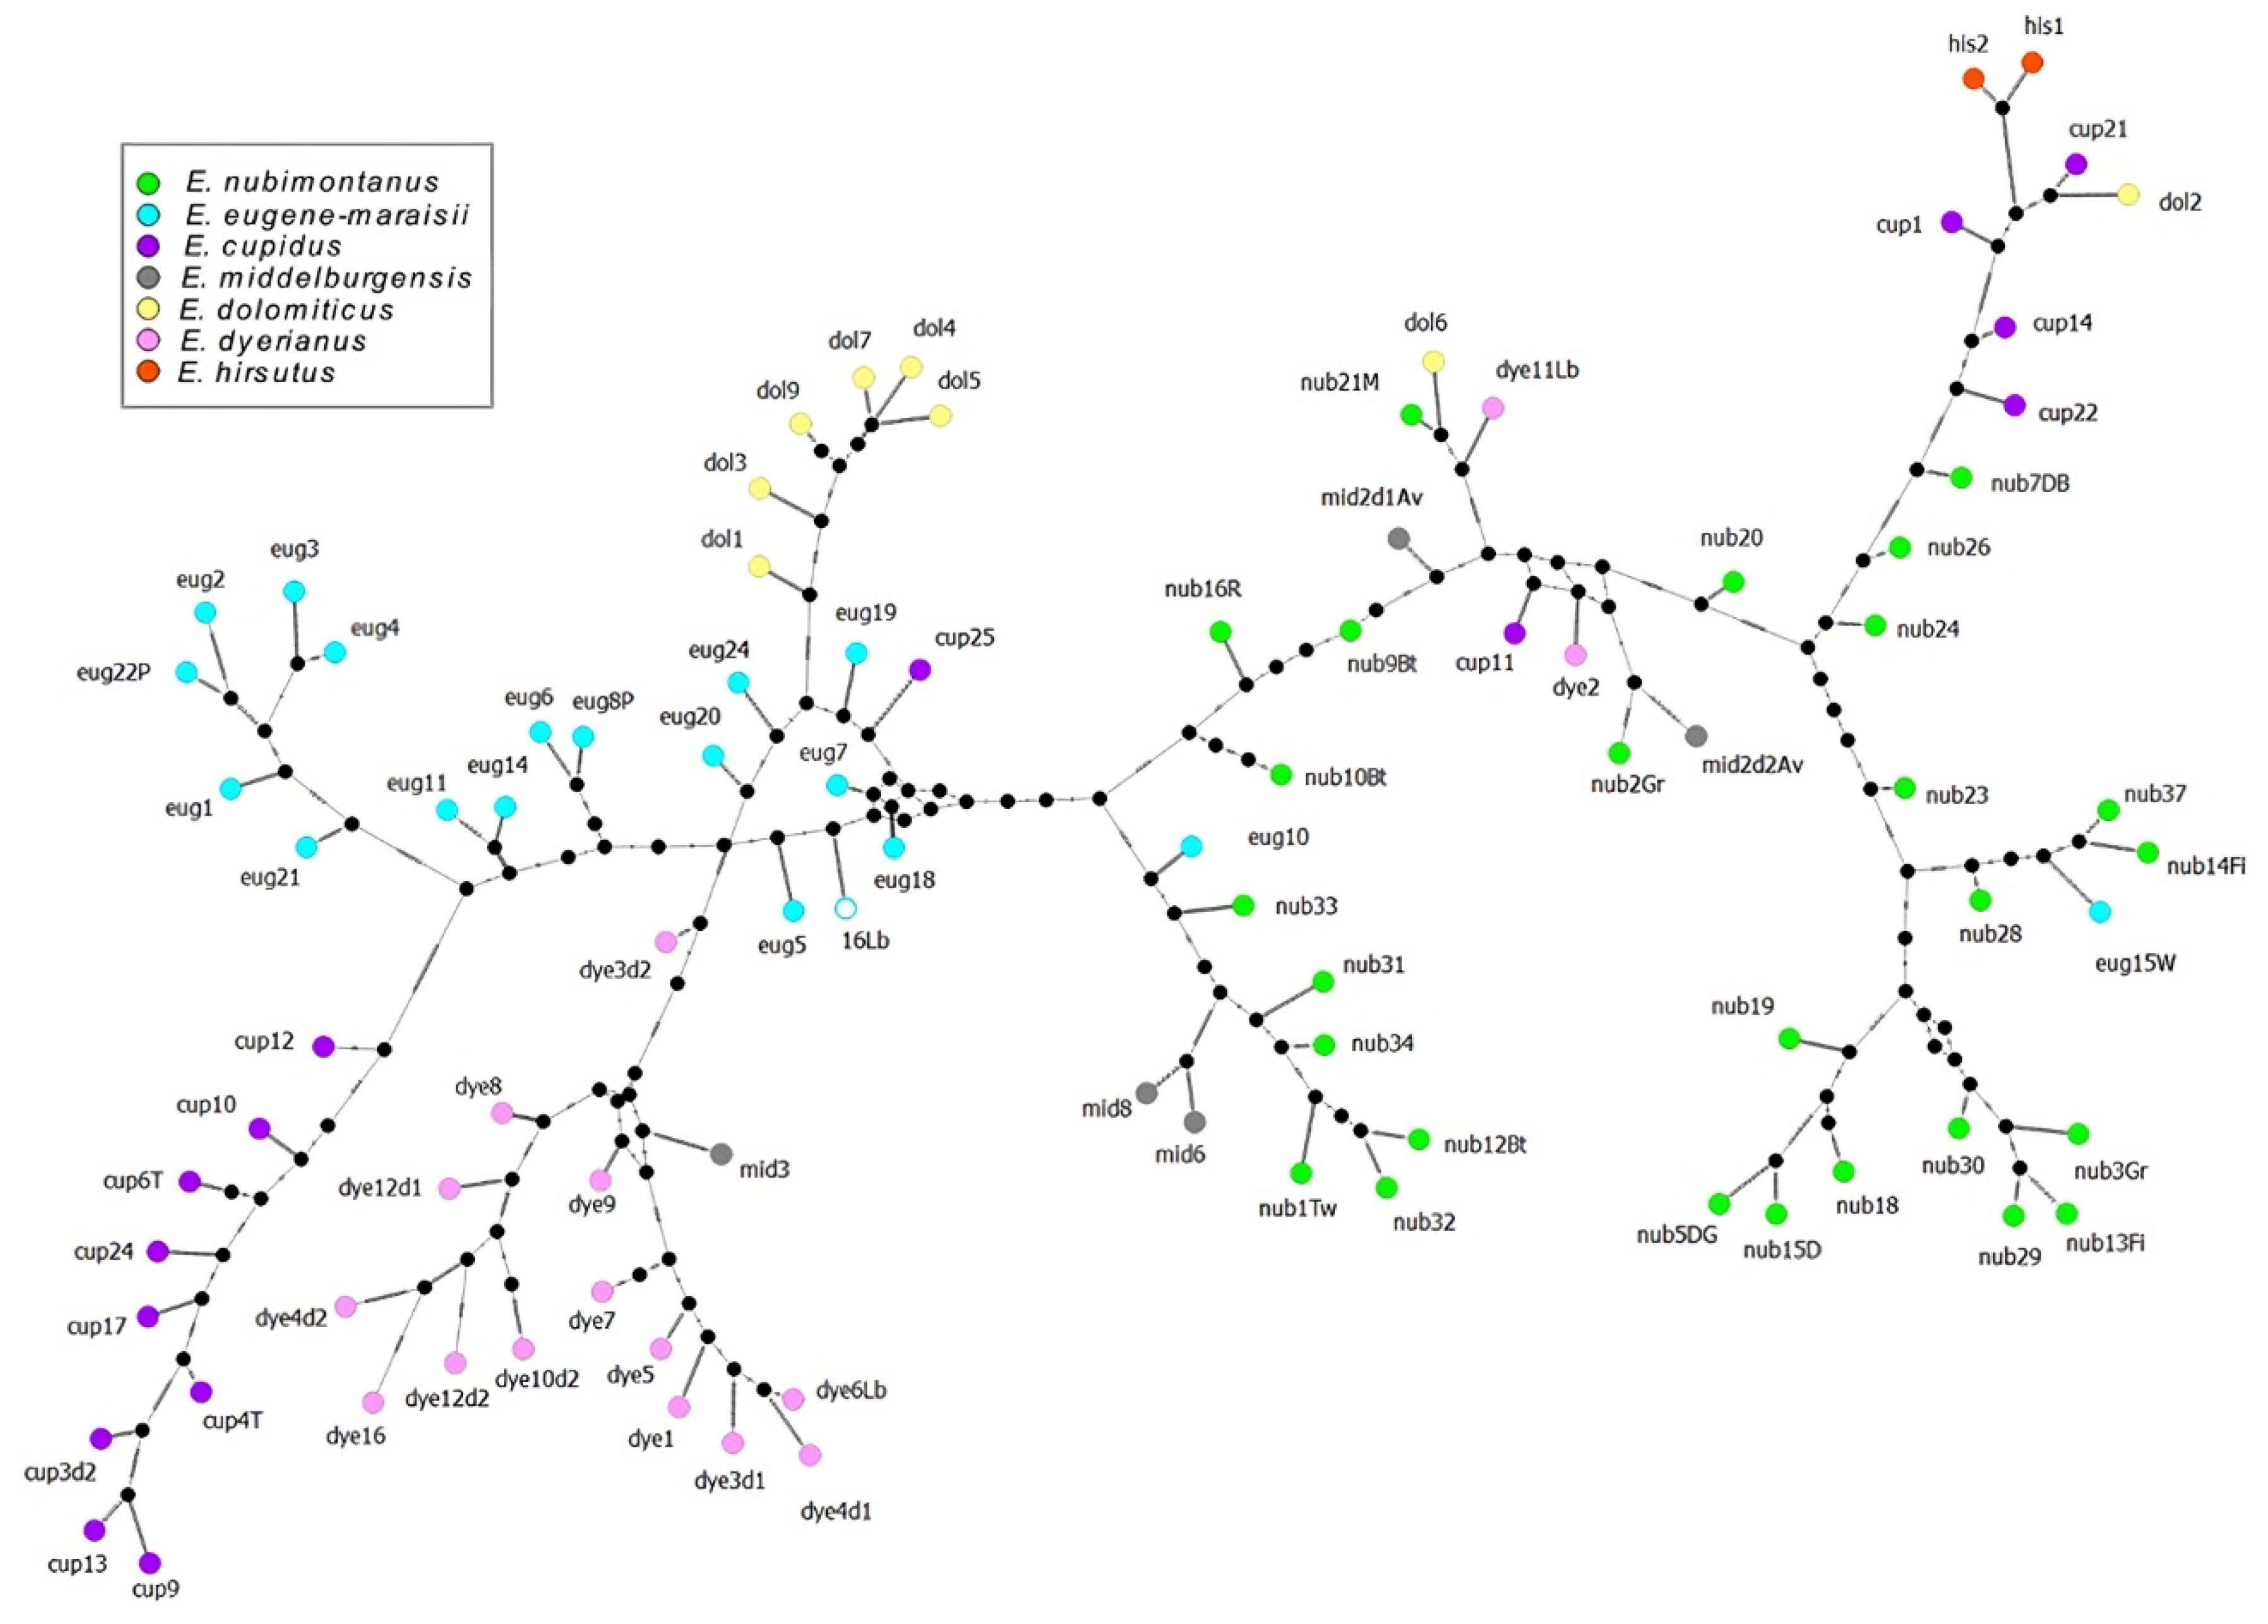

Table 1.
Top thirty countries from which authors of publications using ISSR’s emanate based on VOSViewer analysis of data from SCOPUS. Countries in bold are listed as developing nations (as from https://www.worlddata.info/developing-countries.php). Numbers in parentheses behind country names indicate ranking according to Biodiversity Index (https://en.wikipedia.org/wiki/Megadiverse_countries). Note that the total number of publications listed sums to a number greater than the 7852 publications extracted from SCOPUS as a consequence of multi-author papers by authors from multiple countries.
| Rank | Country | Number of publications | % of total publications |
|---|---|---|---|
| 1 | India (8) | 1591 | 17.4 |
| 2 | China (4) | 1493 | 16.4 |
| 3 | United States of America (10) | 625 | 6.8 |
| 4 | Iran | 504 | 5.5 |
| 5 | Brazil (1) | 447 | 4.9 |
| 6 | Egypt | 384 | 4.2 |
| 7 | Türkiye | 275 | 3.0 |
| 8 | Italy | 246 | 2.7 |
| 9 | Saudi Arabia | 244 | 2.7 |
| 10 | Russian Federation | 225 | 2.5 |
| 11 | Poland | 186 | 2.0 |
| 12 | Spain | 181 | 2.0 |
| 13 | Germany | 179 | 2.0 |
| 14 | Japan | 164 | 1.8 |
| 15 | Mexico (5) | 153 | 1.7 |
| 16 | United Kingdom | 150 | 1.6 |
| 17 | France | 140 | 1.5 |
| 18 | Canada | 133 | 1.5 |
| 19 | Australia (6) | 129 | 1.4 |
| 20 | Portugal | 118 | 1.3 |
| 21 | Malaysia (15) | 109 | 1.2 |
| 22 | Thailand (20) | 102 | 1.1 |
| 23 | Indonesia (2) | 94 | 1.0 |
| 24 | South Korea | 86 | 0.9 |
| 25 | Argentina | 83 | 0.9 |
| 26 | Tunisia | 76 | 0.8 |
| 27 | Greece | 64 | 0.7 |
| 28 | Pakistan | 59 | 0.6 |
| 29 | South Africa (19) | 54 | 0.6 |
| 30 | Czech Republic | 52 | 0.6 |
Table 2.
ISSR primers screened in this study. The primers are manufactured by Inqaba Biotechnical Industries
Table 2.
ISSR primers screened in this study. The primers are manufactured by Inqaba Biotechnical Industries
| ISSR Primer Name | 5’ Fluorescent marker | Sequence |
|---|---|---|
| Manny | 6-FAM | CACCACCACCACRC |
| 812 | HEX | GAGAGAGAGAGAGAGAA |
| Mao | TET | CTCCTCCTCCTCRC |
| Omar | HEX | GAGGAGGAGGAGRC |
| 864 | 6-FAM | ATGATGATGATGATGATG |
| 856 | TET | ACACACACACACACACYA |
Table 3.
Comparison of twelve datasets for different ISSR primers at three relative fluorescence unit (rfu) cut-offs. Datasets were generated using GeneMapper Software Version 5 (Applied Biosystems, USA) and based on electropherogram outputs obtained from the ABI3130 genetic analyser. Bands were scored “1” for presence if above the -rfu threshold and “0” for absence if below this threshold.
| Primer | Minimum fluorescence (rfu) | Total number of bands obtained from all samples | Mean bands per sample | Private bands |
|---|---|---|---|---|
| ISSR Mao (TET) | 50 | 111 | 12 | 32 |
| ISSR Mao (TET) | 100 | 83 | 7 | 22 |
| ISSR Mao (TET) | 200 | 30 | 4 | 6 |
| ISSR 864 (6-FAM) | 50 | 459 | 44 | 68 |
| ISSR 864 (6-FAM) | 100 | 327 | 19 | 32 |
| ISSR 864 (6-FAM) | 200 | 73 | 12 | 28 |
| ISSR 856 (TET) | 50 | 93 | 11 | 21 |
| ISSR 856 (TET) | 100 | 29 | 3 | 5 |
| ISSR 856 (TET) | 200 | 10 | 1 | 1 |
| Combined | 50 | 663 | 22 | 121 |
| Combined | 100 | 439 | 10 | 59 |
| Combined | 200 | 113 | 5 | 35 |
Table 4.
An analysis of DNA purity as determined by Nanodrop as relating to the success of DNA extractions and subsequent PCR amplification success. Percentage successful amplification was calculated based on the number of PCR amplifications which produced clear, distinguishable bands as a percentage of the total PCR amplifications performed with the three selected primers. DNA extracts of samples which did not form bands on agarose gel for any of the primers and were subsequently omitted from the study are shown for the first and second batches of automated DNA extraction.
| Species | Mean DNA concentration (ng/μl) | Mean 260/280 | Mean 260/230 | Number of samples | Percentage successful amplification |
|---|---|---|---|---|---|
| E. eugene-maraisii | 302.6 | 1.64 | 0.5 | 35 | 55.5% |
| E. nubimontanus | 373.1 | 1.34 | 0.58 | 48 | 54.1% |
| E. hirsutus | 328.2 | 1.65 | 0.53 | 2 | 100% |
| E. dyerianus | 286.5 | 1.4 | 0.6 | 27 | 56% |
| E. middelburgensis | 294.4 | 1.45 | 0.55 | 23 | 24.6% |
| E. cupidus | 491.8 | 1.3 | 0.62 | 46 | 36.2% |
| E. dolomiticus | 344.3 | 1.6 | 0.49 | 13 | 60% |
| Omitted samples Batch 1 | 350.3 | 1.61 | 0.51 | 46 | 0% |
| Omitted samples Batch 2 | 610.4 | 1.20 | 0.62 | 23 | 0% |
Table 5.
Statistics used in calculating Tajima’s D statistic for genetic isolation between species of the Encephalartos eugene-maraisii complex computed in PopART software, based on ISSR fragments.
Table 5.
Statistics used in calculating Tajima’s D statistic for genetic isolation between species of the Encephalartos eugene-maraisii complex computed in PopART software, based on ISSR fragments.
| -rfu cut-off dataset | |||
|---|---|---|---|
| 50 | 100 | 200 | |
| Nucleotide diversity (π) | 0.111362 | 0.06931 | 0.154567 |
| Segregating sites | 474 | 207 | 105 |
| Tajima's D statistic | -0.70597 | -0.84998 | -0.50775 |
| Significance (p) | 0.743371 | 0.79021 | 0.673339 |
Table 6.
AMOVA of taxa in the Encephalartos eugene-maraisii complex computed in PopART Software, based on ISSR fragments. Species were grouped into pairs, namely E. cupidus and E. dolomiticus; E. dyerianus and E. eugene-maraisii; E. middelburgensis and E. nubimontanus, while E. hirsutus was assigned its own group.
| -rfu cut-off dataset | |||
| 50 | 100 | 200 | |
| Variation among groups (%) | -1.89289 | -7.46642 | -2.86349 |
| Fixation index ΦCT | -0.01893 | -0.07466 | -0.02863 |
| Significance (1000 permutations): | 0.378 | 0.42957 | 0.529 |
| Variation among species within groups (%) | 37.31296 | 46.16488 | 34.46871 |
| Fixation index ΦSC | 0.3662 | 0.42957 | 0.33509 |
| Significance (1000 permutations): | <0.001 | < 0.001 | < 0.001 |
| Variation among species among groups (%) | 64.57993 | 61.30154 | 68.39479 |
| Fixation index ΦST | 0.3542 | 0.38698 | 0.31605 |
| Significance (1000 permutations): | < 0.001 | < 0.001 | < 0.001 |
Table 7.
Results from the Evanno method generated from STRUCTURE Harvester used to determine the optimal value of K. Ten independent runs of each model were run in STRUCTURE software using a 10 000 iteration burn in and 100 000 MCMC iterations. The table shows entries of the runs with the top three delta K values for each STRUCTURE model used. It is assumed that runs with the largest Delta K indicate the optimal K value.
| STRUCTURE model | K | Reps | Mean LnP(K) | Stdev LnP(K) | Ln'(K) | |Ln''(K)| | Delta K | |
|---|---|---|---|---|---|---|---|---|
| 50rfu dataset | ||||||||
| Standard | 3 | 10 | -10285.48 | 2.26019 | 673.2 | 300.53 | 132.96688 | |
| 4 | 10 | -9912.81 | 68.14371 | 372.67 | 4205.43 | 61.71413 | ||
| 2 | 10 | -10958.68 | 24.08724 | 762.99 | 89.79 | 3.7277 | ||
| LOCPRIOR | 4 | 10 | -9890.92 | 11.29796 | 394.28 | 2663.47 | 235.74778 | |
| 3 | 10 | -10285.2 | 5.27952 | 673.84 | 279.56 | 52.95178 | ||
| 2 | 10 | -10959.04 | 55.6032 | 762.26 | 88.42 | 1.5902 | ||
| 100rfu dataset | ||||||||
| Standard | 2 | 10 | -4331.6 | 0.80139 | 481.21 | 176.68 | 220.46758 | |
| 3 | 10 | -4027.07 | 2.03909 | 304.53 | 323.73 | 158.76198 | ||
| 4 | 10 | -4046.27 | 408.31331 | -19.2 | 387.34 | 0.94863 | ||
| LOCPRIOR | 3 | 10 | -4051.01 | 6.14138 | 318.47 | 1845.36 | 300.47967 | |
| 2 | 10 | -4369.48 | 17.8674 | 443.28 | 124.81 | 6.98535 | ||
| 7 | 10 | -4022.16 | 418.53457 | 976.32 | 1844.54 | 4.40714 | ||
| 200rfu dataset | ||||||||
| Standard | 2 | 10 | -2499.8 | 2.28619 | 214.9 | 118.48 | 51.8242 | |
| 5 | 10 | -2209.93 | 11.79426 | 144.62 | 115.61 | 9.80223 | ||
| 6 | 10 | -2180.92 | 18.74145 | 29.01 | 96.91 | 5.17089 | ||
| LOCPRIOR | 2 | 10 | -2487.96 | 1.1462 | 226.58 | 125 | 109.05587 | |
| 3 | 10 | -2386.38 | 2.85299 | 101.58 | 44.26 | 15.51355 | ||
| 4 | 10 | -2240.54 | 23.62359 | 145.84 | 191.7 | 8.11477 | ||
Disclaimer/Publisher’s Note: The statements, opinions and data contained in all publications are solely those of the individual author(s) and contributor(s) and not of MDPI and/or the editor(s). MDPI and/or the editor(s) disclaim responsibility for any injury to people or property resulting from any ideas, methods, instructions or products referred to in the content. |
© 2024 by the authors. Licensee MDPI, Basel, Switzerland. This article is an open access article distributed under the terms and conditions of the Creative Commons Attribution (CC BY) license (http://creativecommons.org/licenses/by/4.0/).
Copyright: This open access article is published under a Creative Commons CC BY 4.0 license, which permit the free download, distribution, and reuse, provided that the author and preprint are cited in any reuse.


