
Submitted:
16 April 2024
Posted:
17 April 2024
You are already at the latest version
Abstract
Cumulus parameterization schemes model the subgrid-scale effects of moist convection, affecting the prognostic of cloud formation, rainfall, energy levels reaching the surface, and air quality. Working with a spatial resolution of 1 km, we studied the influence of cumulus parameterization schemes coded in the Weather Research & Forecasting with Chemistry Version 3.2 (WRF-Chem 3.2) for atmospheric modeling in Cuenca, an Andean city of Southern Ecuador (2500 masl), during September 2014. For assessing the performance, we used meteorological records from the urban area and stations located mainly over the Cordillera, with heights above 3000 masl, and air quality records from the urban area. Firstly, we did not use any cumulus parameterization (0 No Cumulus). Then we considered four schemes: 1 Kain-Fritsch, 2 Betts-Miller-Janjic, 3 Grell-Devenyi, and 4 Grell-3 Ensemble. On average, the 0 No Cumulus option was better for modeling meteorological variables over the urban area, capturing 66.5% of records and being the best for precipitation (77.8%). However, 1 Kaint-Fritsch was better for temperature (78.7%) and 3 Grell-Devenyi for wind speed (77.0%) and wind direction (37.9%). All the options provided acceptable and comparable performances for modeling short-term and long-term air quality variables. The results suggested that using no cumulus scheme could be beneficial for holistically modeling meteorological and air quality variables in the urban area. However, all the options, including deactivating the cumulus scheme, overestimated the total amount of precipitation over the Cordillera, implying that its modeling needs to be improved, particularly for studies on water supply and hydrological management. New WRF-Chem versions and microphysics parameterization, the other component directly related to cloud and rainfall processes, must be assessed.
Keywords:
Cuenca
; convective parameterization
; cumulus convective
; rainfall
1. Introduction
Air quality results from a complex interaction between atmospheric emissions and meteorology [1]. For atmospheric modeling purposes, cumulus convection is a component typically parameterized. It is directly related to cloud formation and, therefore, to solar radiation and temperature at the surface, affecting other variables such as the planetary boundary layer depth and atmospheric stability.
Complex topography and land-use heterogeneity, as in the Andean Region of Ecuador, directly affect the atmospheric dynamic [2], implying atmospheric modeling is challenging. For these cases, modeling with a spatial resolution of 1 km improves the topography and land-use representation. Atmospheric modeling was done in Cuenca, an Andean city in the southern of Ecuador (2500 masl, Figure 1), using this spatial resolution for studying the influence of planetary boundary layer schemes [3], for assessing the impact on air quality due to the shift from diesel to electric buses [4] and the influence of feedback between aerosols and meteorology [5]. Recently, schemes for modeling the interaction near the land–atmosphere interface were assessed through land surface schemes [6]. These contributions identified options for improving the atmospheric modeling in this region, and although acceptable performances were achieved, other components, such as the cumulus options, deserve dedicated studies [7].
Cumulus schemes model the sub-grid-scale effects of convective and shallow clouds. They represent the vertical fluxes due to unresolved updrafts and downdrafts and compensate for motion outside the clouds. Operating on individual columns, they provide vertical heating and moistening profiles. Some schemes offer column cloud and precipitation field tendencies [8].
Cumulus parameterizations are theoretically only valid for coarser grid sizes (e.g., greater than 10 km), which are necessary to properly release latent heat on a realistic time scale in the convective columns. While the assumptions about the convective eddies being entirely sub-grid-scale break down for finer grid sizes, sometimes these schemes have been found to help trigger convection in 5–10 km grid applications. It is considered that generally, on a high-resolution grid, cumulus schemes should not be used when the model can resolve the convective eddies itself (e.g., ≤ 5 km grid) [9]. The horizontal resolution of 1 km corresponds to the “grey zone,” a range that might not require modeling with cumulus convective parameterization [10]. Modeling in the grey zone allows addressing whether working with higher resolution is always better [11], and currently, it is a line of active research in atmospheric science. Chow et al. (2019) reviewed the limitations of convective schemes in reproducing observed precipitation [2].
For modeling cumulus effects, the Weather Research and Forecasting with Chemistry model (WRF-Chem V3.2) offers four schemes (Table 1) [8]. Cumulus schemes use different approaches and perform best when the assumptions are better satisfied [9].
The Kain-Fritsch scheme [12] uses a simple cloud model with moist updrafts and downdrafts, including the effects of detrainment and entrainment and relatively simple microphysics.
The Betts-Miller-Janjic option [13,14] considers as variable the deep convection profiles and the relaxation time, depending on the cloud efficiency, which is a function of the entropy change, precipitation, and mean temperature of the cloud. The shallow convection moisture profile is based on the entropy change, which must be small and nonnegative.
The Grell-Devenyi option [15] is an ensemble scheme using multiple cumulus models and variants within each grid box. The results are averaged to give feedback to the model. All the schemes are mass-flux types but have different updraft and downdraft entrainment and detrainment parameters and precipitation efficiencies. The dynamic control closures are based on the convective available potential energy, low-level vertical velocity, or moisture convergence.
The Grell-3 scheme [15,16] has features in common with the Grell and Devenyi scheme, in the same way, based on an ensemble approach, but the quasi-equilibrium approach is not included among the scheme members. The scheme allows the subsidence effects to spread to neighboring grid columns, making the method more suitable for smaller grid sizes than 10 km. It can also be used at larger grid sizes where subsidence occurs within the same grid column as the updraft.
Cloud microphysics is the other component in which clouds occur on the scales of the cloud droplets and hydrometeors [9], modeling precipitation on the grid scale, which plays an essential role in modeling moist convection [17]. Due to its scale, microphysical processes are always parameterized
The atmospheric modeling coupling meteorology and air quality within one integrated approach evolved over the last years, recognizing that meteorology strongly influences air quality, and weather and climate are affected by changes in atmospheric composition [18]. Therefore, this contribution addresses the following questions:
• What cumulus parameterization scheme from WRF-Chem V3.2 provides the best performance for modeling meteorological and air quality variables in Cuenca?
• What is the effect of modeling without cumulus parameterization?
• What is the recommended option for holistically modeling meteorological and air quality variables?
2. Methods
2.1. The Air Quality Network
Since 2012, the air quality network of Cuenca has operated an automatic station located in the historic center (MUN station, Figure 1) at coordinates 2.89° S and 79.0° W. Between 2012 and 2022, this station measured fine particulate matter (PM2.5) yearly mean concentrations between 5.7 to 14.5 µg m−3 [19], which were more significant than the current World Health Organization (WHO) guideline (5.0 µg m−3) [20]. Moreover, during 116 days from 2022, the PM2.5 24 h mean levels were higher than the current WHO guideline (15 µg m−3). In addition, during the 7 days of 2022, the ozone (O3) levels were higher than the corresponding WHO guideline (100 µg m−3, maximum 8 h daily mean) [19]. In September, higher O3 concentrations in Cuenca occur, partly due to the high levels of solar radiation reaching the Ecuadorian region at the surface, promoting photochemical O3 production [4]. Carbon monoxide (CO) is another pollutant measured at the MUN station.
The air quality network also has twenty passive stations for measuring, according to the national regulation, monthly mean concentrations of nitrogen dioxide (NO2) and O3 (Figure 1d).
EMOV EP, a municipal entity in charge of traffic and mobility activities, operates the air quality network.
Records from the MUN and passive stations were used to assess the air quality modeling performance.
2.2. Meteorological Stations
Apart from air quality parameters, the MUN station measures the following meteorological variables: surface temperature, global solar radiation, wind speed, wind direction, and rainfall. These records were used to assess the modeling performance over the urban area.
In addition, we used records from five meteorological stations located west of the urban area, mainly over the Cordillera (Figure 1c). These stations are operated by the municipal entity (ETAPA EP, due to its nomenclature in Spanish) in charge of the water supply and wastewater management. Four of these stations are located at heights over 3000 masl. Table 2 summarizes their main features and the parameters used in this study.
All the meteorological stations are located in the hydrological basin of the Paute River (Figure 1c), which is affluent of the Santiago River in the Amazonian region.
2.3. Emission Inventory of Cuenca
Speciated hourly emissions maps generated from the emission inventory 2014 [21] were used for atmospheric studies [3,6,22]. These emissions were used in studies that identified parameterization options for getting acceptable modeling performances in Cuenca. To complement these studies, other components, such as the cumulus options and related processes, require improvement and deserve a dedicated assessment.
2.4. Modeling Approach
Consistent with previous studies, we used the WRF-ChemV3.2 to model atmospheric variables in Cuenca during September 2014. The WRF-Chem is an Eulerian 3-D model used for atmospheric research and operatively for forecasting purposes [23]. It can simulate the chemical transport of pollutants and the dynamic of atmospheric variables simultaneously, also allowing the activation of an online approach for modeling interactions between aerosols and meteorological variables.
A master domain and two nested subdomains were used for modeling meteorological variables (Figure 1). A third and inner subdomain formed by a grid of 100 × 82 cells, 1 km on each side, covering the territory of Cuenca (Figure 1c), was used to model meteorological and air quality variables. To generate the initial and boundary conditions, we selected the FNL Global Operational Analysis (Final), provided by the National Centers for Environmental Prediction (NCEP) [24]. The Carbon Bond Mechanism Z (CBMZ) [25] and the MOSAIC [26] were selected to speciate and represent, respectively, the corresponding hourly speciated emissions. Table 3 shows the schemes and options chosen for this contribution.
2.5. Modeling Performance
The performance for modeling surface temperature was assessed by the gross error (GE), mean (MB), and index of agreement (IOA) (Table 4). The performance for modeling wind speed was assessed by the root mean square error (RMSA), MB, and IOA. GE and MB were used to assess wind direction. The expressions of these metrics are described in the EEA (2011) [33] and in Simon et al. (2012) [34]. The performance for rainfall modeling was assessed through the Equation (1) metric.
Pdcm: Percentage of days captured by modeling.
Ndr: Number of days with rainfall (≥ 0.2 mm d-1) captured by modeling.
Ndwr: Number of days without rainfall (< 0.2 mm d-1) captured by modeling.
Tmd: Total modeled days
The intensity of 0.2 mm d-1 corresponds to a day with measurable precipitation [35]. We considered that the model captured the corresponding record for days without rainfall if both were < 0.2 mm d-1. We considered that the model captured the corresponding record for days with rain if both were ≥ 0.2 mm d-1.
The WRF-Chem outputs obtained total modeled precipitation as the contribution of the cumulus parameterization (RAINC variable) and the cloud microphysics scheme (RAINNC variable). The total rainfall during the study period provided by the cumulus options was compared to the corresponding records.
In addition, for the variables of Table 2, we obtained the percentages of records captured by modeling based on the maximum allowed deviation between the observed and modeled values of Table 4.
Finally, we compared the cloud coverage provided by the Terra satellite over Cuenca (10:30 LT) [36] with the global solar radiation at the surface to deduce the modeling’s performance in capturing changes in solar radiation under the influence of clouds.
For short-term air quality, we used the records from the MUN station (Figure 1c,d) to assess the performance for modeling the CO (maximum mean in 1-h and 8-h per day), PM2.5 (mean in 24-h), and O3 (maximum mean in 8-h daily) concentrations during periods consistent with the national regulation and the WHO guidelines [20,34,37], using the MB, RMSE, the fractional bias (FB), the mean normalized bias (MNB), and the correlation coefficient (r) [34].
For long-term air quality, the modeling performance was assessed by the percentage of the passive stations (Figure 1d), with a maximum difference of 30% between the modeled concentration and the records.
3. Results
3.1. Meteorology
Although overestimating between 13:00 to 17:00 (LT), all the cumulus options got similar performances for modeling surface temperature (Table 5), receiving the GE (1.3 °C), MB (0.1 – 0.2 °C), and IOA (0.9) metrics into the corresponding value benchmark ranges, and capturing the behavior of the mean daily profile (Figure 2a). The 3 Grell–Devenyi and 4 Grell-3 options reproduced the temperature better during the afternoon (Figure 2a), showing the lowest value of the MB (0.1 °C). In addition, the IOA (0.9) indicated a strong relationship between records and modeled temperatures for all the options. The 1 Kain-Fritsch scheme captured the highest percentage (78.7%) of the hourly temperature records (Table 7).
Although all the options’ metrics were in the benchmark ranges for modeling wind speed, the 3 Grell–Devenyi and 4 Grell-3 options achieved the best performance (Table 7). While all the options overestimated the wind surface during the afternoon, these two schemes were the best (Figure 2c). The 3 Grell–Devenyi scheme captured the highest percentage (77.0 %) of the hourly wind speed records (Table 5).
Although the 3 Grell-Devenyi was better in terms of GE (61.7°), none of the options provided values for wind direction into the benchmark range (<30°). On average, the wind direction was adequately modeled for all the options between 09:00 and 21:00 LT (Figure 2d). The 3 Grell–Devenyi captured only 37.9% of the hourly wind speed records.
At the MUN station, the 0 No Cumulus option was the best for rainfall, providing the highest percentage (77.8%) of records captured by modeling, followed by 1 Kain-Fritsch (70.4%). No unique option was the best for modeling each of the four assessed meteorological parameters over the urban area. However, on average, the 0 No Cumulus option got the best percentage (66.5%), followed by the 1 Kain-Fritsch (65.1%)(Table 7).
At the MUN station, from 1 to 27 September 2014, 20 days showed no rainfall or intensities lower or equal to 0.2 mm d-1 (Figure 3). Five days showed records between 0.4 to 7.5 mm d-1 (11, 12, 16, 22, and 24 Sep 2014). On 13 September 2014 and 15 September 2014, rainfall intensities were recorded at 11.7 and 13.6 mm d-1, respectively. Figure 4c indicates that 0 No Cumulus and 1 Kain-Fritsch were better for modeling daily rainfall. The 3 Grell–Devenyi and 4 Grell-3 modeled more days with rain, although the corresponding records indicated the absence of precipitation (e.g., 18, 19, 20, 21, 23 Sep 2014, rainfall between 7.4 to 23.4 mm d-1).
Figure 4 depicts the modeled rainfall maps for 20-Sep-2014. As expected, the computed cumulus contribution to rainfall for the 0 No Cumulus option was null (Figure 4a). For the 1 Kain-Fritsch and 2 Betts-Miller-Janjic, the cumulus contribution reached up to 12 mm d-1, mainly in places at the W of the urban area (Figure 4d,e). However, for the 3 Grell–Devenyi and 4 Grell-3, this contribution was up to 50 mm d-1, mainly at W, over the Cordillera (Figure 4j,m), where the convective contribution was higher compared to the 1 Kain-Fritsch and 2 Betts-Miller-Janjic schemes.
Figure 5 depicts the modeled rainfall maps for 22-Sep-2014. For the 1 Kain-Fritsch and 2 Betts-Miller-Janjic, the cumulus contribution reached up to 8 mm d-1, mainly in places at the S and SW of the urban area (Figure 5d,e). However, for the 3 Grell–Devenyi and 4 Grell-3, this contribution was up to 20 mm d-1, mainly at W, N, and S (Figure 5j,m). Over the Cordillera, the convective contribution was lower than the microphysics component for all the cumulus options.
The hourly temperature was adequately modeled at SAY, VEN, and IZH stations (GE <2 °C, Table 6). In all the stations out of the urban area, there was a strong relationship between records and modeled temperatures (IOA ≥0.8). Over the Cordillera, no unique cumulus option provided the best performance for modeling temperature.
No unique option was best for modeling daily rainfall outside the urban area (Table 8). At three stations located over the Cordillera (VEN, IZH, SOL), all the cumulus options overestimated the total precipitation during the study period, with differences between 41.6 and 210.4% compared with records (Table 9).
Imageries provided by the Terra satellite over Cuenca (10:30 LT) [36] suggested that during the study period, 5 days were cloudless, 13 were partially cloudy, and 4 were cloudy (Figures A1–A3). Table A1 shows the cloud conditions inferred from the remote-sensing data and each option’s corresponding qualitative performance for modeling solar radiation. All the options, on average, overestimated the global solar radiation at the surface (Figure 2b).
3.2. Air Quality
Although there were slight differences, the 2 Betts-Miller-Janjic received better metrics for modeling the maximum CO daily 1 h mean, followed by the 0 No Cumulus option (Table 10). Similarly, the 0 No Cumulus, 3 Grell-Devenyi, and 4 Grell-3 presented better performance modeling the CO daily 8 h mean concentrations. However, all the options showed no solid linear relationship between the recorded and modeled values (r = 0.38 to 0.47 for the maximum CO daily 1 h mean and r = 0.38 to 0.45 for the maximum CO daily 8 h mean, respectively). All the options provided consistent mean daily profiles of hourly concentrations (Figure 6f). The 0 No Cumulus (96.3%) and 1 Kain-Fritsch (96.3%) presented the highest percentages of captured records for the maximum CO daily 1 h mean (Table 11).
Similarly, with slight differences, the 2 Betts-Miller-Janjic received better metrics for modeling the 24 h PM2.5 mean concentrations, followed by the 0 No Cumulus option (Table 10). All the options captured 63.0 % of records (Table 11), providing similar mean daily profiles (Figure 7f), although showing a weak linear correlation between the recorded and modeled values (r = 0.01 to 0.07).
For modeling the maximum 8 h O3 daily mean, the 4 Grell-3 and 3 Grell-Devenyi options performed better, followed by the 0 No Cumulus (Table 10). All the options showed no solid linear relationship between the recorded and modeled values (r between 0.19 and 0.28). The 3 Grell-Devenyi and 4 Grell-3 captured 85.2% of records (Table 11). On average, all the options overestimated the mean O3 daily profile at midday and afternoon (Figure 8f).
4. Discussion and Conclusions
Applying the online approach, we used the WRF-Chem V3.2, a state-of-the-art atmospheric tool for modeling meteorological (surface temperature, wind speed, wind direction, rainfall) and air quality parameters (short-term: CO, PM2.5, and O3; long-term: NO2 and O3) in Cuenca, an Andean city of Southern Ecuador, in September of 2014, the month when typically the tropospheric O3 concentrations are higher in the region. We made numerical experiments to assess the influence on the performance of the cumulus schemes coded in this model (Kain-Fritsch, Betts-Miller-Janjic, Grell–Devenyi, and Grell-3) and the option of modeling without cumulus parameterization, working with a spatial resolution of 1 km. This resolution corresponds to the grey zone, a range of 1 to 10 km for moist convection [11], whose length scale can be similar in size and potentially without the need for convective parameterization.
The results indicated that no unique cumulus option was the best for modeling each of the assessed variables over the entire inner domain, suggesting that using no cumulus scheme could be beneficial for holistically modeling meteorological and air quality variables in the urban area of Cuenca, where rainfall modeling improved through the deactivation of a cumulus scheme. Over the urban area, cumulus schemes provided better performances for temperature, wind speed, and wind direction compared to modeling without cumulus schemes. On the contrary, all the options overestimated the total amount of modeled rainfall over the Cordillera during the simulation period. All options provided comparable modeling performances for short- and long-term simulations regarding air quality.
Published assessments about the influence of cumulus schemes at the grey zone mainly focused on precipitation modeling. We did not find studies covering meteorological and air quality variables for comparison purposes. Our finding over the urban area was consistent with Zhang et al. (2021) [38] (Table 12), who reported a clear improvement in modeling precipitation in the Central Great Plains of the United States without using a cumulus scheme at a 4 km resolution.
Similarly, Liang et al. (2019) [39] assessed the sensitivity for modeling rainfall in Jiangsu, China, to model configurations of grid nesting and convection treatment, using grid spacings from 30, 15, 9, 5, 3 to 1 km, concluding that convective parameterization in 30–9 km grids is required to represent organized cumuli, while explicitly resolving convections in cloud-permitting grids around 1 km is necessary to improve forecasts.
Amirudin et al. (2022) [40] performed simulations of precipitation over Peninsular Malaysia from 2013 to 2018 for assessing cumulus schemes at resolutions of 25, 5, and 1.6 km, reporting that at 5 km, the best performing scheme was the Betts–Miller–Janjic. The finest resolution at 1.6 km simulation showed significant added value as it was the only simulation to capture the high precipitation intensity in the morning and a precipitation peak during the evening. The authors indicated that cumulus schemes became less significant in a higher-resolution simulation.
Castorina et al. (2021) performed WRF’s simulations for modeling precipitation in Sicily (Italy) on 24 and 25 Nov 2016, working at 5 km. The authors reported that using no cumulus schemes provided the most reliable and accurate solution with the highest accuracy.

Table 12.
Comparison with other assessments on the influence of cumulus schemes.
| Region | Period | Model | Resolution and Parameters | Main Results | Reference |
|---|---|---|---|---|---|
| Andean Region of Ecuador (Cuenca) | Sep 2014 | WRF-Chem V3.2 | 1 km. Temperature, wind speed, wind direction, solar radiation, precipitation, air quality | No unique cumulus option was the best for modeling each of the assessed meteorological parameters. All the options provided comparable performances for modeling air quality variables. Deactivating the cumulus scheme could be beneficial for holistically modeling meteorological and air quality variables in the urban area of Cuenca. | This contribution |
| Central Great Plains, Eastern Kansas and western Missouri region (USA) | Three summers, from 2002 to 2004 | NU-WRF | 4 km. Precipitation | There was a clear improvement without using a cumulus scheme, which should become more evident with finer resolutions such as 1 km. | Zhang et al. (2021) [37] |
| Jiangsu, China | 19 Jun to 20 Jul 2016 | WRF-3.9 | 30, 15, 9, 5, 3, 1 km. Precipitation | Parameterization in 30–9 km grids is required to represent organized cumuli, while explicitly resolving convections in cloud-permitting grids around 1 km is necessary to improve forecasts. | Liang et al. (2019) [38] |
| Peninsular Malaysia | 2013 to 2018 | WRF | 25, 5, 1.6 km. Precipitation | At 5 km, the best-performing scheme was the Betts–Miller—Janjic. The 1.6 km simulation showed significant added value as it was the only simulation that captured the high precipitation intensity in the morning and a precipitation peak during the evening. The role of cumulus schemes became less significant in a higher-resolution simulation. | Amirudin et al. (2022) [39] |
| Andean Region of Ecuador (Cuenca) | 1 to 11 November 2020 | WRF-4.0.3 | 1 km.Temperature, wind speed, solar radiation | None of the cumulus options, including the deactivation of the cumulus scheme, adequately modeled the drop in temperature and solar radiation on 9 November 2020. | Parra (2022) [41] |
| Shanghai | 25 May 2018, 10 June 2017 | WRF | 27, 15, 9, 5, 3, 1 km. Extreme precipitation | The primary rainfall peak at noon was best reproduced when the 1 km grid with explicit convection was nested directly into their outermost 15-km or 9-km grids using the Kain-Fritsch scheme. However, a secondary peak with a weak forcing was not detected. | Wang et al. (2021) [42] |
| Sicily (Italy) | 24 to 25 November 2016 | WRF | 5 km. Precipitation | Using no cumulus schemes provided the most reliable and accurate solution with the highest accuracy. | Castorina et al. (2021) [43] |
| The Netherlands | 23 to 24 June 2016 | WRF 3.7.1 | 4, 2 km. Precipitation | The Betts–Miller–Janjic scheme was activated too early and did not predict any convective system over the region of interest. The Grell–Freitas and Kain–Fritsch schemes predicted a convective system, but its intensity was underestimated. With the explicit convection (without cumulus scheme), the model resolved the storm, although with a delay and an overestimated intensity. | Steeneveld and Peerlings (2020) [44] |
| South Korea | 15 to 16 July 2017 | WRF | 4km. Extreme precipitation | Simulating convection processes in the grey zone without the convective parameterization scheme is inadequate. | Park et al. (2022) [45] |
| South Korea | 26 to 27 July 2011 | WRF | 27, 9, 3, 1 km. Extreme precipitation | Multiple spurious cores occurred when the cumulus parameterization scheme was removed at 3 and 1 km of resolution. | Kwon and Hong (2017) [46] |
Steeneveld and Peerlings (2020) [44] modeled a severe summer thunderstorm in The Netherlands, which took place on 3 June 2016, working at 4 and 2 km of resolution. They found that the Betts–Miller–Janjic scheme was activated too early and did not predict any convective system over the region of interest. The Grell–Freitas and Kain–Fritsch schemes predicted a convective system, but its intensity was underestimated. With the explicit convection, the model was able to resolve the storm. The authors indicated that modeling with the explicit convection (without cumulus scheme), the model captured the storm, although with a delay and an overestimated intensity.
On the contrary, other studies concluded that modeling in the grey zone without cumulus parameterization is inadequate. In this sense, Park et al. (2022) [45] performed WRF simulations with cumulus schemes and explicit convection (no convective parameterization) in South Korea, concluding that simulating convection processes using explicitly resolved convection leads to overestimations and erroneous precipitation locations.
Kwon and Hong (2017) [46] modeled a heavy rain event in South Korea using an updated version of a cumulus scheme and performed simulations with 3 and 1 km resolution without the cumulus option. They reported that an updated cumulus scheme outperformed the original version, and at 3 and 1 km, the precipitation core was well reproduced. On the contrary, multiple spurious cores occurred when the cumulus scheme was removed at those resolutions.
Other contributions as by Wang et al. (2021) [42], who studied convection representation across the grey zone in forecasting warm-season extreme precipitation over Shanghai, reported that the use of cumulus schemes is beneficial at the 5 km grid resolution in simulating both powerful intensity and diurnal variations, although with mixed effects at 3 km. The primary rainfall peak at noon was best reproduced when the 1 km grid with explicit convection was nested directly into their outermost 15-km or 9-km grids using the Kain-Fritsch scheme. However, a secondary peak with a weak forcing was not detected.
Our findings and the literature cited highlight the importance of dedicated studies to assess the effects of deactivating the cumulus parameterization on atmospheric modeling in the grey zone.
On average, CO levels were adequately modeled regarding air quality, especially from 06:00 to 10:00, suggesting that emissions and parameters involved in air dispersion, such as planetary boundary layer depth and atmospheric stability, were acceptably modeled during peak CO emissions. For other hours, CO levels were underestimated by about 0.5 mg m-3. The overestimation of surface solar radiation and temperature around midday implies an overestimation of the planetary boundary layer depth during these hours and, therefore, the underestimation of CO concentrations.
On average, the hourly peak level of PM2.5 was modeled at 08:00, two hours earlier than the records, which implies that the estimation of the hourly PM2.5 emissions, especially from diesel cars, needs to be reviewed.
The overestimation of surface solar radiation implies a higher level of photochemical reactions that promote and partly explain the overestimation of the peak O3. However, the generation and behavior of O3 are more complex due to the participation of emissions of nitrogen oxides and volatile organic compounds under the influence of solar radiation. Overestimation of O3 can also be contributed to by an inadequate estimation of emissions.
Based on the findings of the present contribution and from previous studies, we recommend the following configuration for modeling the meteorology and air quality over the urban area of Cuenca:
- Land use categories: Based on the USGS dataset and categories [6];
- Global atmospheric dataset: FNL [21];
- Spatial resolution: 1 km (as per this contribution);
- Cumulus scheme: No cumulus option (as per this contribution);
- Land surface scheme: Noah [6];
- Urban Canopy Model: None [6];
- Planetary Boundary Layer: Yonsei University option [20];
The proposed configuration needs to be assessed for days with significant changes in meteorological conditions, such as a sudden drop in temperature and solar radiation, as of 9 November 2020, which was not adequately modeled by any of the cumulus options, including the deactivation of the cumulus scheme [41] (Table 12).
As all the options, including the deactivation of the cumulus scheme, overestimated the total amount of precipitation over the Cordillera, its modeling needs to be improved, particularly for studies on water supply, hydrological management, extreme rainfall events, and the influence of climate change. Hydropower energy is a critical component of the Ecuadorian mix generation and needs to be assessed correctly in terms of the influence of climate change [47,48]. Although all the options provided acceptable performances for air quality, the impact of modeled rainfall over the Cordillera and the overestimation of global solar radiation at the surface needs to be assessed, considering that the emission inventory data has high uncertainties.
Atmospheric modeling is particularly challenging in the Andean Region of Ecuador [49] due to the influence of the Cordillera chain, the dynamic of the intertropical converge zone, the breezes coming from the Coast and Amazonian regions, which promote convective movements with complex cloud dynamics, with division between the Pacific area west of the western Cordillera, which shows lower and more stratiform clouds, and the eastern parts with an increased average cloud-top height towards the Amazon region [50].
Performance for modeling rainfall was done in this contribution, based on daily intensities, through the ability of the model to capture days without and with rain. A more comprehensive assessment can incorporate a comparison between computed precipitation and records per precipitation ranges based on hourly intensities.
Although the availability of atmospheric records is low in the Andean Region of Ecuador [51,52], new assessments should include measurements from stations, such as from the western part of the urban area over the Cordillera chain, where the computed precipitation indicated that both convective (cumulus) and the microphysics components can be relevant. The Paute River basin, which is partially located in our study region, shows a high spatial variability of rainfall and temperature [53,54]. In complex topography, numerical models have shortcomings in capturing the distribution of rain with altitude [55]. Physics parameterization schemes have been developed and tested mainly for the Northern Hemisphere. The features of the Tropical Andean Region could demand the proposal of dedicated physics schemes to improve atmospheric modeling.
This contribution provided insights for atmospheric modeling in the grey zone of spatial resolution over the Andean Region of Ecuador, improving our understanding of the influence of cumulus schemes and options for modeling, at the same time, meteorological and air quality variables, which is a valuable feature, considering that in most of the studies, we found that mainly precipitation was assessed.
The activation of indirect effects between meteorology and aerosols for modeling in the Andean Region is a component that deserves future research. Other elements need to be assessed, such as the microphysics parameterization, which determines the cloud life cycle and interaction between clouds and aerosols, affecting the solar radiation levels at the surface and rainfall processes. In addition, assessments of recent versions of WRF-Chem, other periods of dry and wet seasons, the data assimilation of records and remote sensing monitoring, and even the combination with artificial intelligence approaches are necessary.
Funding
This research was funded by the USFQ Poli-Grants 2024 program.
Data Availability Statement
Not applicable.
Acknowledgments
This research is part of the “Emisiones atmosféricas y Calidad del Aire en el Ecuador 2024” project. Simulations were done at the High-Performance Computing system at the Universidad San Francisco de Quito. The publication of this article was funded by the Universidad San Francisco de Quito USFQ Research Publication Fund. We thank EMOV EP and ETAPA EP, municipal entities that provided the meteorological and quality records.
Conflicts of Interest
The author declares no conflict of interest.
References
- Baklanov, A.; Schlünzen, K.; Suppan, P.; Baldasano, J.; Brunner, D.; Aksoyoglu, S.; Carmichael, G.; Douros, J.; Flemming, J.; Forkel, R.; Galmarini, S.; Gauss, M.; Grell, G.; Hirtl, M.; Joffre, S.; Jorba, O.; Kaas, E.; Kaasik, M.; Kallos, G.; Kong, X.; Korsholm, U.; Kurganskiy, A.; Kushta, J.; Lohmann, U.; Mahura, A.; Manders-Groot, A.; Maurizi, A.; Moussiopoulos, N.; Rao, S. T.; Savage, N.; Seigneur, C.; Sokhi, R. S.; Solazzo, E.; Solomos, S.; Sørensen, B.; Tsegas, G.; Vignati, E.; Vogel, B.; Zhang, Y. Online Coupled Regional Meteorology Chemistry Models in Europe: Current Status and Prospects. Atmospheric Chemistry and Physics 2014, 14(1), 317–398. [Google Scholar] [CrossRef]
- Atmosphere | Free Full-Text | Crossing Multiple Gray Zones in the Transition from Mesoscale to Microscale Simulation over Complex Terrain. https://www.mdpi.com/2073-4433/10/5/274 (accessed 2023-10-15).
- Parra, R. Performance Studies of Planetary Boundary Layer Schemes in WRF-Chem for the Andean Region of Southern Ecuador. Atmospheric Pollution Research 2018, 9(3), 411–428. [Google Scholar] [CrossRef]
- Parra, R.; Espinoza, C. Insights for Air Quality Management from Modeling and Record Studies in Cuenca, Ecuador. Atmosphere 2020, 11(9), 998. [Google Scholar] [CrossRef]
- Parra, R. EFFECTS OF AEROSOLS FEEDBACKS IN MODELING METEOROLOGY AND AIR QUALITY IN THE ANDEAN REGION OF SOUTHERN ECUADOR; Santiago de Compostela, Spain, 2021; pp 39–50. [CrossRef]
- Parra, R. Assessment of Land Surface Schemes from the WRF-Chem for Atmospheric Modeling in the Andean Region of Ecuador. Atmosphere 2023, 14(3), 508. [Google Scholar] [CrossRef]
- Jeworrek, J.; West, G.; Stull, R. Evaluation of Cumulus and Microphysics Parameterizations in WRF across the Convective Gray Zone. Weather and Forecasting 2019, 34(4), 1097–1115. [Google Scholar] [CrossRef]
- Skamarock, W. C.; Klemp, J. B.; Dudhia, J.; Gill, D. O.; Barker, D. M.; Duda, M. G.; Huang, X.-Y.; Wang, W.; Powers, J. G. A Description of the Advanced Research WRF Version 3.
- Warner, T. T. Numerical Weather and Climate Prediction; Cambridge University Press: Cambridge, 2010. [Google Scholar] [CrossRef]
- Grey Zone Project for model parameterizations. Met Office. https://www.metoffice.gov.uk/research/approach/collaboration/grey-zone-project (accessed 2023-11-18).
- Kealy, J. C. Probing the ‘Grey Zone’ of NWP – Is Higher Resolution Always Better? Weather 2019, 74(7), 246–249. [Google Scholar] [CrossRef]
- Kain, J. S. The Kain–Fritsch Convective Parameterization: An Update. Journal of Applied Meteorology and Climatology 2004, 43(1), 170–181. [Google Scholar] [CrossRef]
- Janjić, Z. I. The Step-Mountain Eta Coordinate Model: Further Developments of the Convection, Viscous Sublayer, and Turbulence Closure Schemes. Monthly Weather Review 1994, 122(5), 927–945. [Google Scholar] [CrossRef]
- Janjić, Z. I. Comments on “Development and Evaluation of a Convection Scheme for Use in Climate Models.”. Journal of the Atmospheric Sciences 2000, 57(21), 3686–3686. [Google Scholar] [CrossRef]
- Grell, G. A.; Dévényi, D. A Generalized Approach to Parameterizing Convection Combining Ensemble and Data Assimilation Techniques. Geophysical Research Letters 2002, 29(14), 38-1–38-4. [Google Scholar] [CrossRef]
- Grell, G. A. Prognostic Evaluation of Assumptions Used by Cumulus Parameterizations. Mon. Wea. Rev. 1993, 121(3), 764–787. [Google Scholar] [CrossRef]
- Stensrud, D. Parameterization Schemes: Keys to Understanding Numerical Weather Prediction Models; Cambridge University Press: New York, NY, 2009. [Google Scholar]
- Baklanov, A.; Brunner, D.; Carmichael, G.; Flemming, J.; Freitas, S.; Gauss, M.; Hov, Ø.; Mathur, R.; Schlünzen, K. H.; Seigneur, C.; Vogel, B. Key Issues for Seamless Integrated Chemistry–Meteorology Modeling. Bulletin of the American Meteorological Society 2017, 98(11), 2285–2292. [Google Scholar] [CrossRef]
- Molina, C.; Caguana, C.; Heredia, E.; Parra, R. Informe de La Calidad Aire Cuenca 2022; 2023. [Google Scholar]
- World Health Organization. WHO Global Air Quality Guidelines: Particulate Matter (PM2.5 and PM10), Ozone, Nitrogen Dioxide, Sulfur Dioxide and Carbon Monoxide; World Health Organization, 2021.
- Parra, R. Inventario de Emisiones Atmosféricas Del Cantón Cuenca 2014, 2016. [CrossRef]
- Parra, R. Effect of Global Atmospheric Datasets in Modeling Meteorology and Air Quality in the Andean Region of Ecuador. Aerosol Air Qual. Res. 2022, 22(11), 210292. [Google Scholar] [CrossRef]
- WRF Model Users Site. https://www2.mmm.ucar.edu/wrf/users/ (accessed 2022-12-30).
- CISL RDA: NCEP FNL Operational Model Global Tropospheric Analyses, continuing from July 1999. https://rda.ucar.edu/datasets/ds083.2/ (accessed 2022-12-30).
- Zaveri, R. A.; Peters, L. K. A New Lumped Structure Photochemical Mechanism for Large-Scale Applications. J. Geophys. Res. 1999, 104(D23), 30387–30415. [Google Scholar] [CrossRef]
- Zaveri, R. A.; Easter, R. C.; Fast, J. D.; Peters, L. K. Model for Simulating Aerosol Interactions and Chemistry (MOSAIC). J. Geophys. Res. 2008, 113(D13), D13204. [Google Scholar] [CrossRef]
- Hong, S.-Y.; Dudhia, J.; Chen, S.-H. A Revised Approach to Ice Microphysical Processes for the Bulk Parameterization of Clouds and Precipitation. Mon. Wea. Rev. 2004, 132(1), 103–120. [Google Scholar] [CrossRef]
- Mlawer, E. J.; Taubman, S. J.; Brown, P. D.; Iacono, M. J.; Clough, S. A. Radiative Transfer for Inhomogeneous Atmospheres: RRTM, a Validated Correlated-k Model for the Longwave. J. Geophys. Res. 1997, 102(D14), 16663–16682. [Google Scholar] [CrossRef]
- Chou, M.-D.; Suarez, M. J. A Solar Radiation Parameterization for Atmospheric Studies, NASA/TM-1999-104606/VOL15. 1999. https://ntrs.nasa.gov/citations/19990060930 (accessed 2022-12-30).
- Paulson, C. A. The Mathematical Representation of Wind Speed and Temperature Profiles in the Unstable Atmospheric Surface Layer. J. Appl. Meteor. 1970, 9(6), 857–861. [Google Scholar] [CrossRef]
- Hong, S.-Y.; Noh, Y.; Dudhia, J. A New Vertical Diffusion Package with an Explicit Treatment of Entrainment Processes. Monthly Weather Review 2006, 134(9), 2318–2341. [Google Scholar] [CrossRef]
- Chen, F.; Dudhia, J. Coupling an Advanced Land Surface–Hydrology Model with the Penn State–NCAR MM5 Modeling System. Part II: Preliminary Model Validation. Mon. Wea. Rev. 2001, 129(4), 587–604. [Google Scholar] [CrossRef]
- The application of models under the European Union’s Air Quality Directive: A technical reference guide — European Environment Agency. https://www.eea.europa.eu/publications/fairmode(accessed 2022-12-30).
- Simon, H.; Baker, K. R.; Phillips, S. Compilation and Interpretation of Photochemical Model Performance Statistics Published between 2006 and 2012. Atmospheric Environment 2012, 61, 124–139. [Google Scholar] [CrossRef]
- Rain day - Glossary of Meteorology. https://glossary.ametsoc.org/wiki/Rain_day (accessed 2023-11-21).
- EOSDIS Worldview. https://worldview.earthdata.nasa.gov/?lg=false&t=2023-12-04-T23%3A48%3A40Z (accessed 2023-12-04).
- World Health Organization. Regional Office for Europe. Air Quality Guidelines for Europe, World Health Organization. Regional Office for Europe, 2000.
- Zhang, Y.; Roundy, J. K.; Santanello, J. A. Evaluating the Impact of Model Resolutions and Cumulus Parameterization on Precipitation in NU-WRF: A Case Study in the Central Great Plains. Environmental Modelling & Software 2021, 145, 105184. [Google Scholar] [CrossRef]
- Liang, X.-Z.; Li, Q.; Mei, H.; Zeng, M. Multi-Grid Nesting Ability to Represent Convections Across the Gray Zone. Journal of Advances in Modeling Earth Systems 2019, 11(12), 4352–4376. [Google Scholar] [CrossRef]
- Amirudin, A. A.; Salimun, E.; Zuhairi, M.; Tangang, F.; Juneng, L.; Mohd, M. S. F.; Chung, J. X. The Importance of Cumulus Parameterization and Resolution in Simulating Rainfall over Peninsular Malaysia. Atmosphere 2022, 13(10), 1557. [Google Scholar] [CrossRef]
- Parra, R. ASSESSMENT OF CUMULUS PARAMETERIZATION SCHEMES IN MODELING METEOROLOGY ASSOCIATED WITH AN AIR POLLUTION EVENT IN THE ANDEAN REGION OF ECUADOR; Milan, Italy, 2022; pp 3–14. [CrossRef]
- Wang, R.; Qiao, F.; Liang, X.-Z.; Zhu, Y.; Zhang, H.; Li, Q.; Ding, Y. Role of Convection Representation across the Gray Zone in Forecasting Warm Season Extreme Precipitation over Shanghai from Two Typical Cases. Atmospheric Research 2021, 253, 105370. [Google Scholar] [CrossRef]
- Castorina, G.; Caccamo, M. T.; Colombo, F.; Magazù, S. The Role of Physical Parameterizations on the Numerical Weather Prediction: Impact of Different Cumulus Schemes on Weather Forecasting on Complex Orographic Areas. Atmosphere 2021, 12(5), 616. [Google Scholar] [CrossRef]
- Steeneveld, G.-J.; Peerlings, E. E. M. Mesoscale Model Simulation of a Severe Summer Thunderstorm in The Netherlands: Performance and Uncertainty Assessment for Parameterised and Resolved Convection. Atmosphere 2020, 11(8), 811. [Google Scholar] [CrossRef]
- Park, H.; Kim, G.; Cha, D.-H.; Chang, E.-C.; Kim, J.; Park, S.-H.; Lee, D.-K. Effect of a Scale-Aware Convective Parameterization Scheme on the Simulation of Convective Cells-Related Heavy Rainfall in South Korea. Journal of Advances in Modeling Earth Systems 2022, 14(6), e2021MS002696. [Google Scholar] [CrossRef]
- Kwon, Y. C.; Hong, S.-Y. A Mass-Flux Cumulus Parameterization Scheme across Gray-Zone Resolutions. Monthly Weather Review 2017, 145(2), 583–598. [Google Scholar] [CrossRef]
- Parra, R. CONTRIBUTION OF NON-RENEWABLE SOURCES FOR LIMITING THE ELECTRICAL CO 2 EMISSION FACTOR IN ECUADOR; 2020; pp 65–77. [CrossRef]
- Naranjo-Silva, S. A Hydropower Development Perspective in Ecuador: Past, Present, and Future. La Granja 2024, 39(1), 63–77. [Google Scholar] [CrossRef]
- Seasonal rainfall patterns classification, relationship to ENSO and rainfall trends in Ecuador - Tobar - 2018 - International Journal of Climatology - Wiley Online Library. https://rmets.onlinelibrary.wiley.com/doi/abs/10.1002/joc.5297 (accessed 2023-12-21).
- Bendix, J.; Rollenbeck, R.; Göttlicher, D.; Cermak, J. Cloud Occurrence and Cloud Properties in Ecuador. Climate Research 2006, 30(2), 133–147. [Google Scholar] [CrossRef]
- Cazorla, M.; Parra, R.; Herrera, E.; da Silva, F. R. Characterizing Ozone throughout the Atmospheric Column over the Tropical Andes from in Situ and Remote Sensing Observations. Elementa: Science of the Anthropocene 2021, 9(1), 00019. [Google Scholar] [CrossRef]
- Rainfall and Cloud Dynamics in the Andes: A Southern Ecuador Case Study. https://www.hindawi.com/journals/amete/2016/3192765/ (accessed 2023-12-21).
- Celleri, R.; Willems, P.; Buytaert, W.; Feyen, J. Space–Time Rainfall Variability in the Paute Basin, Ecuadorian Andes. Hydrological Processes 2007, 21(24), 3316–3327. [Google Scholar] [CrossRef]
- Mora, D. E.; Willems, P. Decadal Oscillations in Rainfall and Air Temperature in the Paute River Basin—Southern Andes of Ecuador. Theor Appl Climatol 2012, 108(1), 267–282. [Google Scholar] [CrossRef]
- Ban, N.; Schmidli, J.; Schär, C. Evaluation of the Convection-Resolving Regional Climate Modeling Approach in Decade-Long Simulations. Journal of Geophysical Research: Atmospheres 2014, 119(13), 7889–7907. [Google Scholar] [CrossRef]
Figure 1.
Location of: (a) Ecuador and (b,c) Cantón Cuenca. (d) The urban area of Cuenca (blue border) and the air quality network (white dots). Orange dots (northwest) indicate the artisanal brick producers. Black dots indicate meteorological stations. Grey dots indicate industries. MUN is the automatic station located at the historic center. White dots indicate passive stations. Black dots ic (c) indicate the location of meteorological stations.
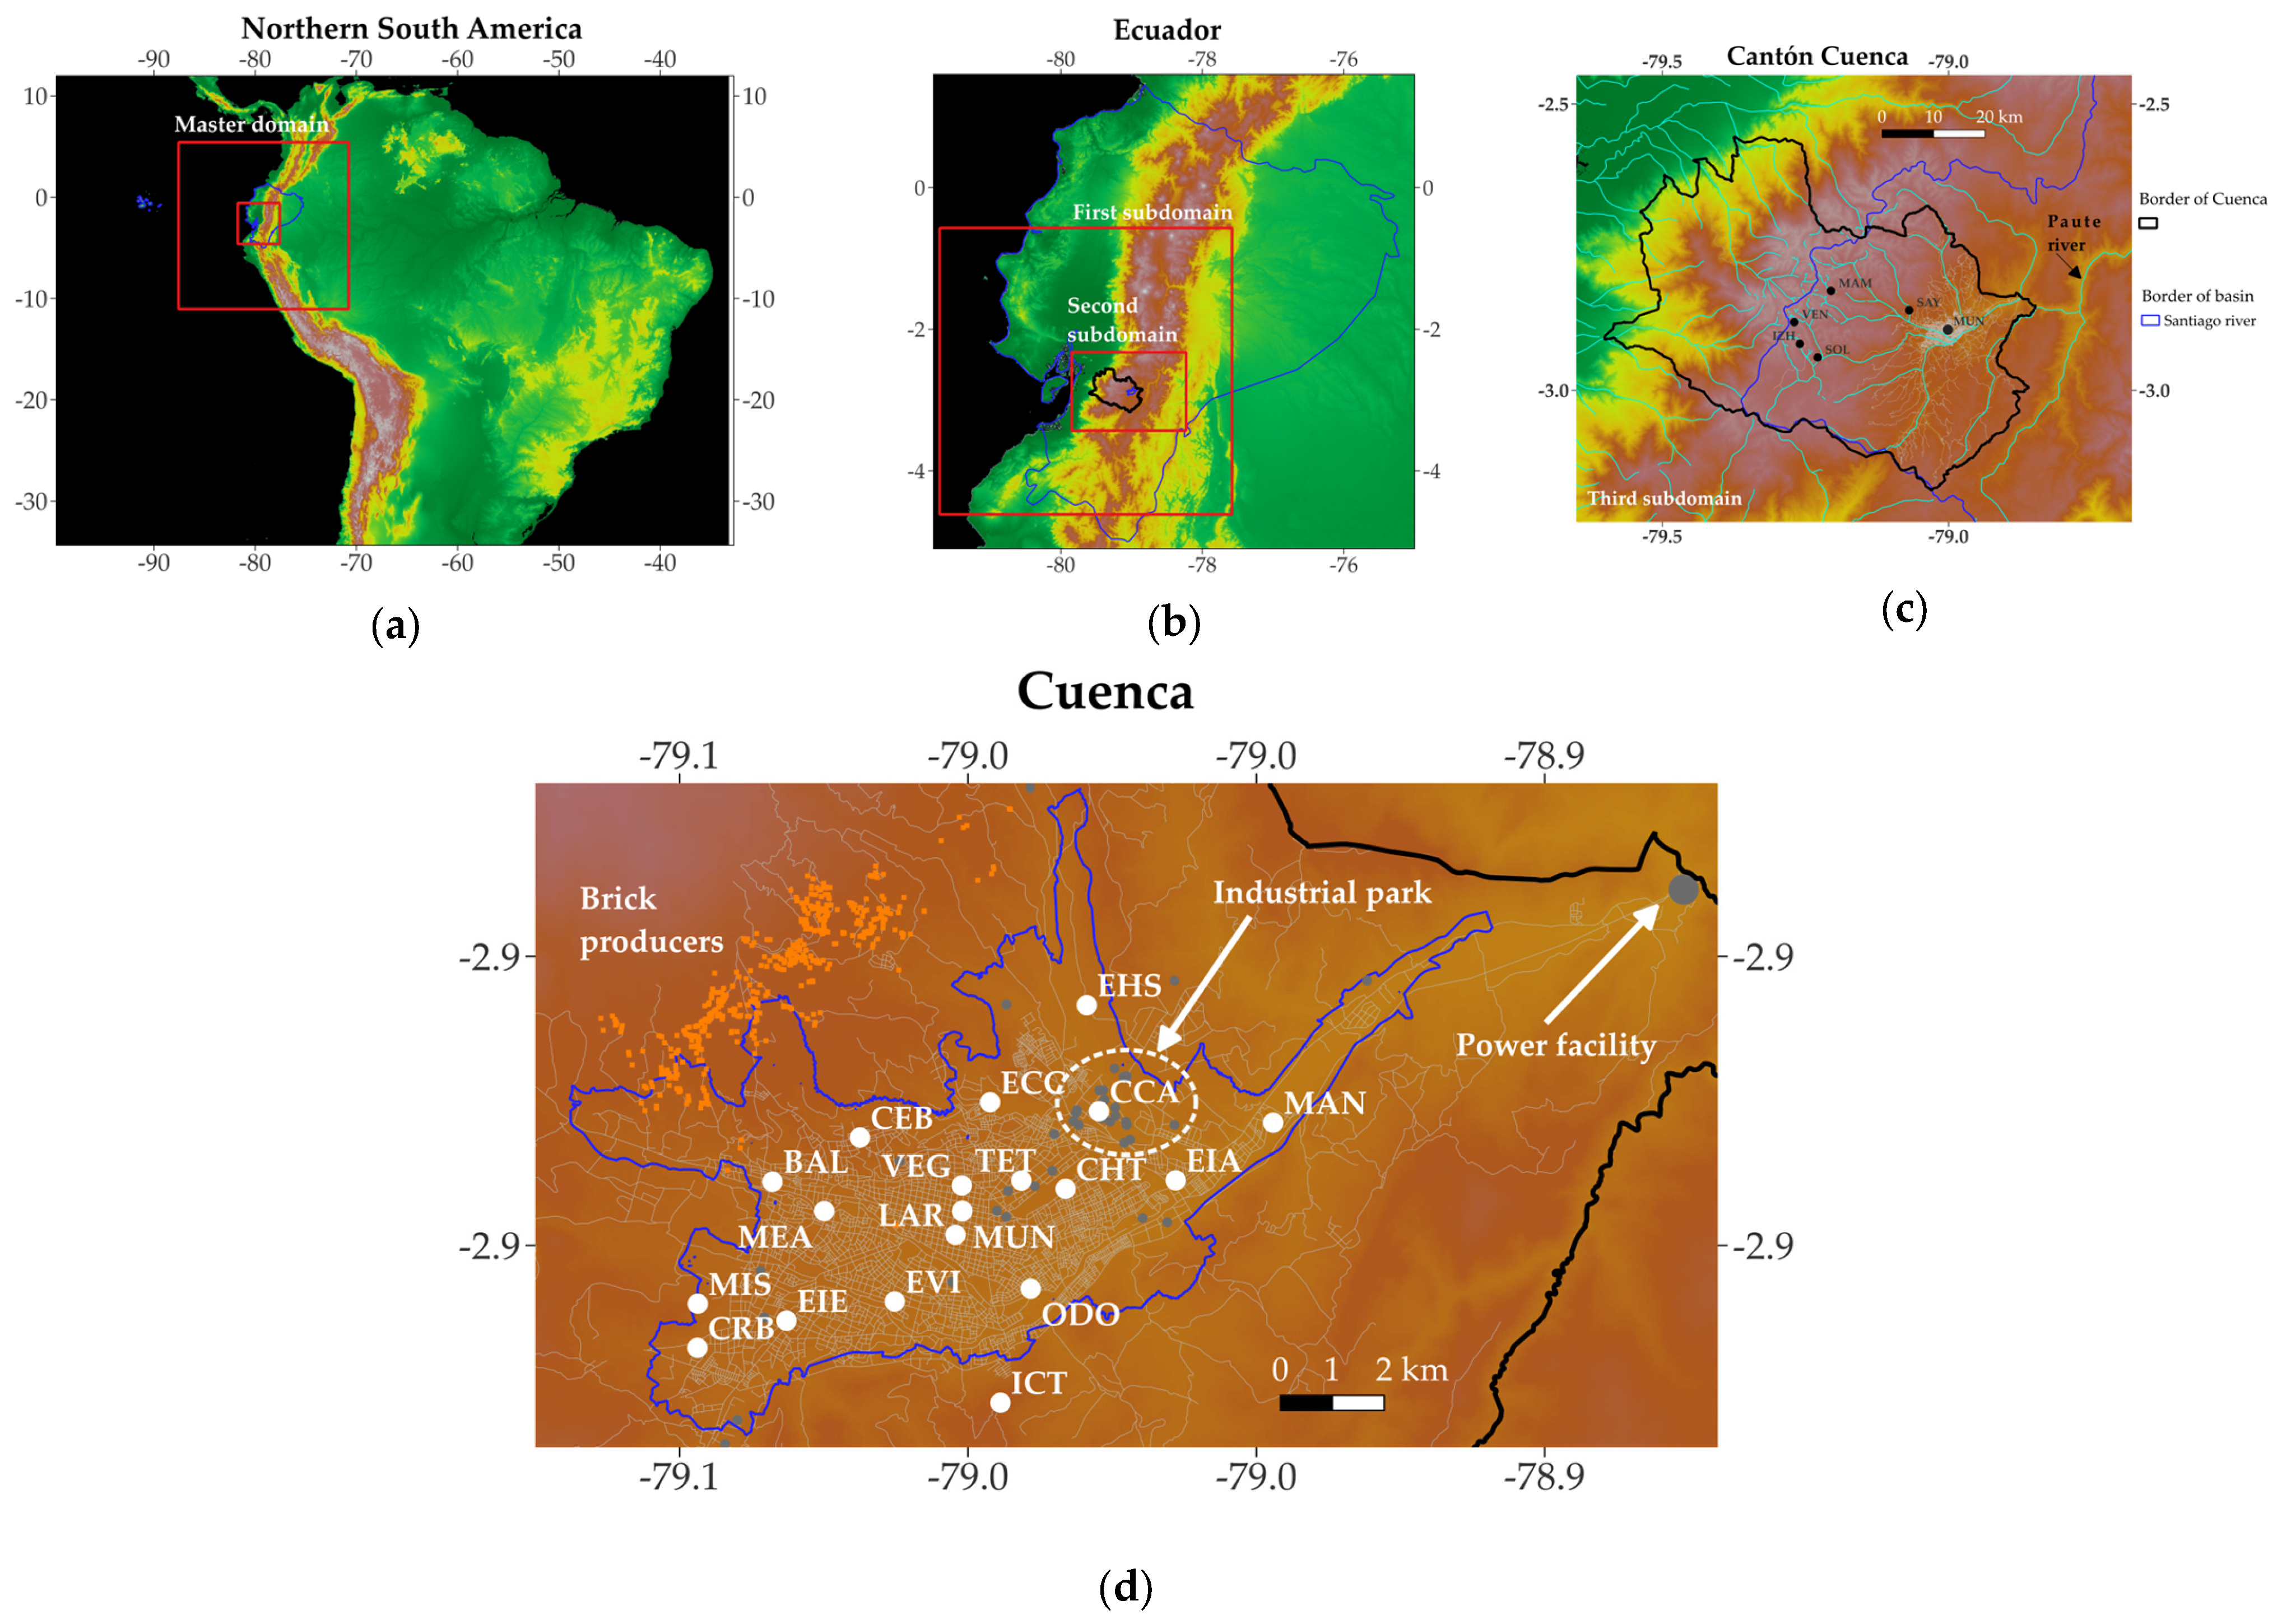
Figure 2.
MUN station. Daily mean profiles during September 2014: (a) Temperature. (b) Global solar radiation. (c) Wind speed. (d) Wind direction.
Figure 2.
MUN station. Daily mean profiles during September 2014: (a) Temperature. (b) Global solar radiation. (c) Wind speed. (d) Wind direction.
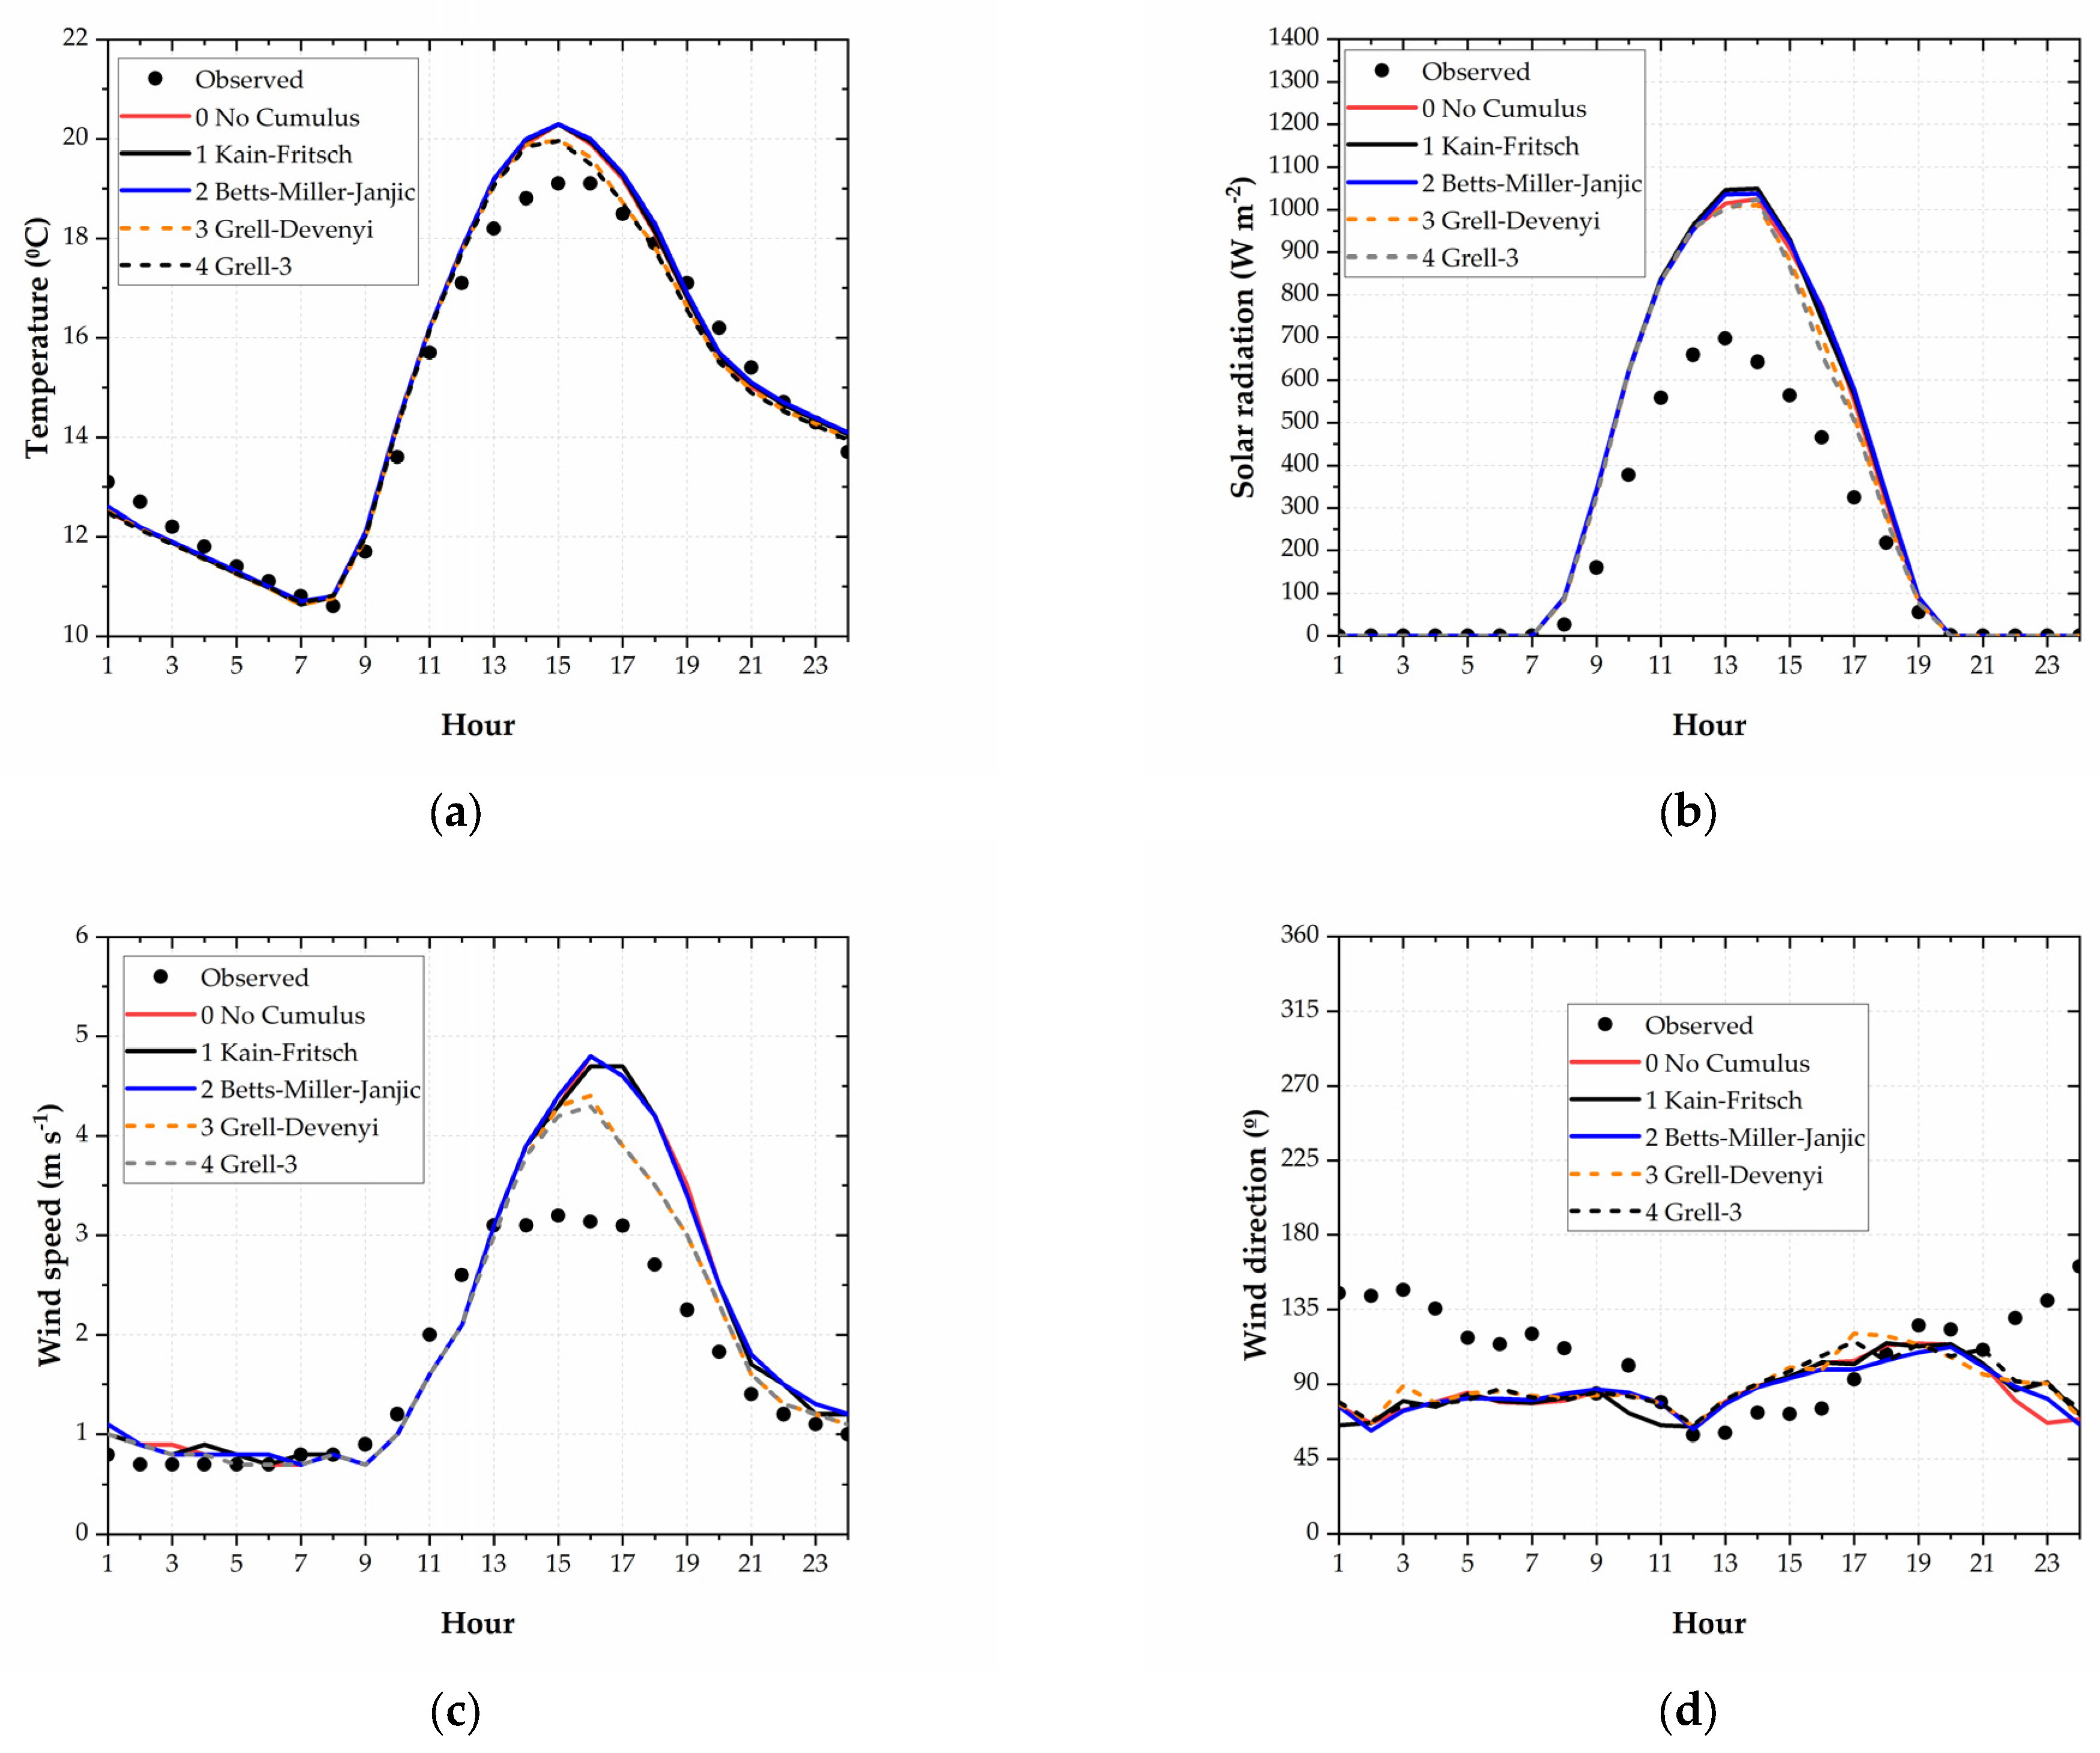
Figure 3.
Rainfall records at the MUN station and modeled values (mm d-1): (a) contribution of cumulus parameterization (RAINC variable from WRF-Chem), (b) contribution of microphysics (RAINNC variable from WRF-Chem), (c) cumulus and microphysics (RAINC and RAINNC).
Figure 3.
Rainfall records at the MUN station and modeled values (mm d-1): (a) contribution of cumulus parameterization (RAINC variable from WRF-Chem), (b) contribution of microphysics (RAINNC variable from WRF-Chem), (c) cumulus and microphysics (RAINC and RAINNC).
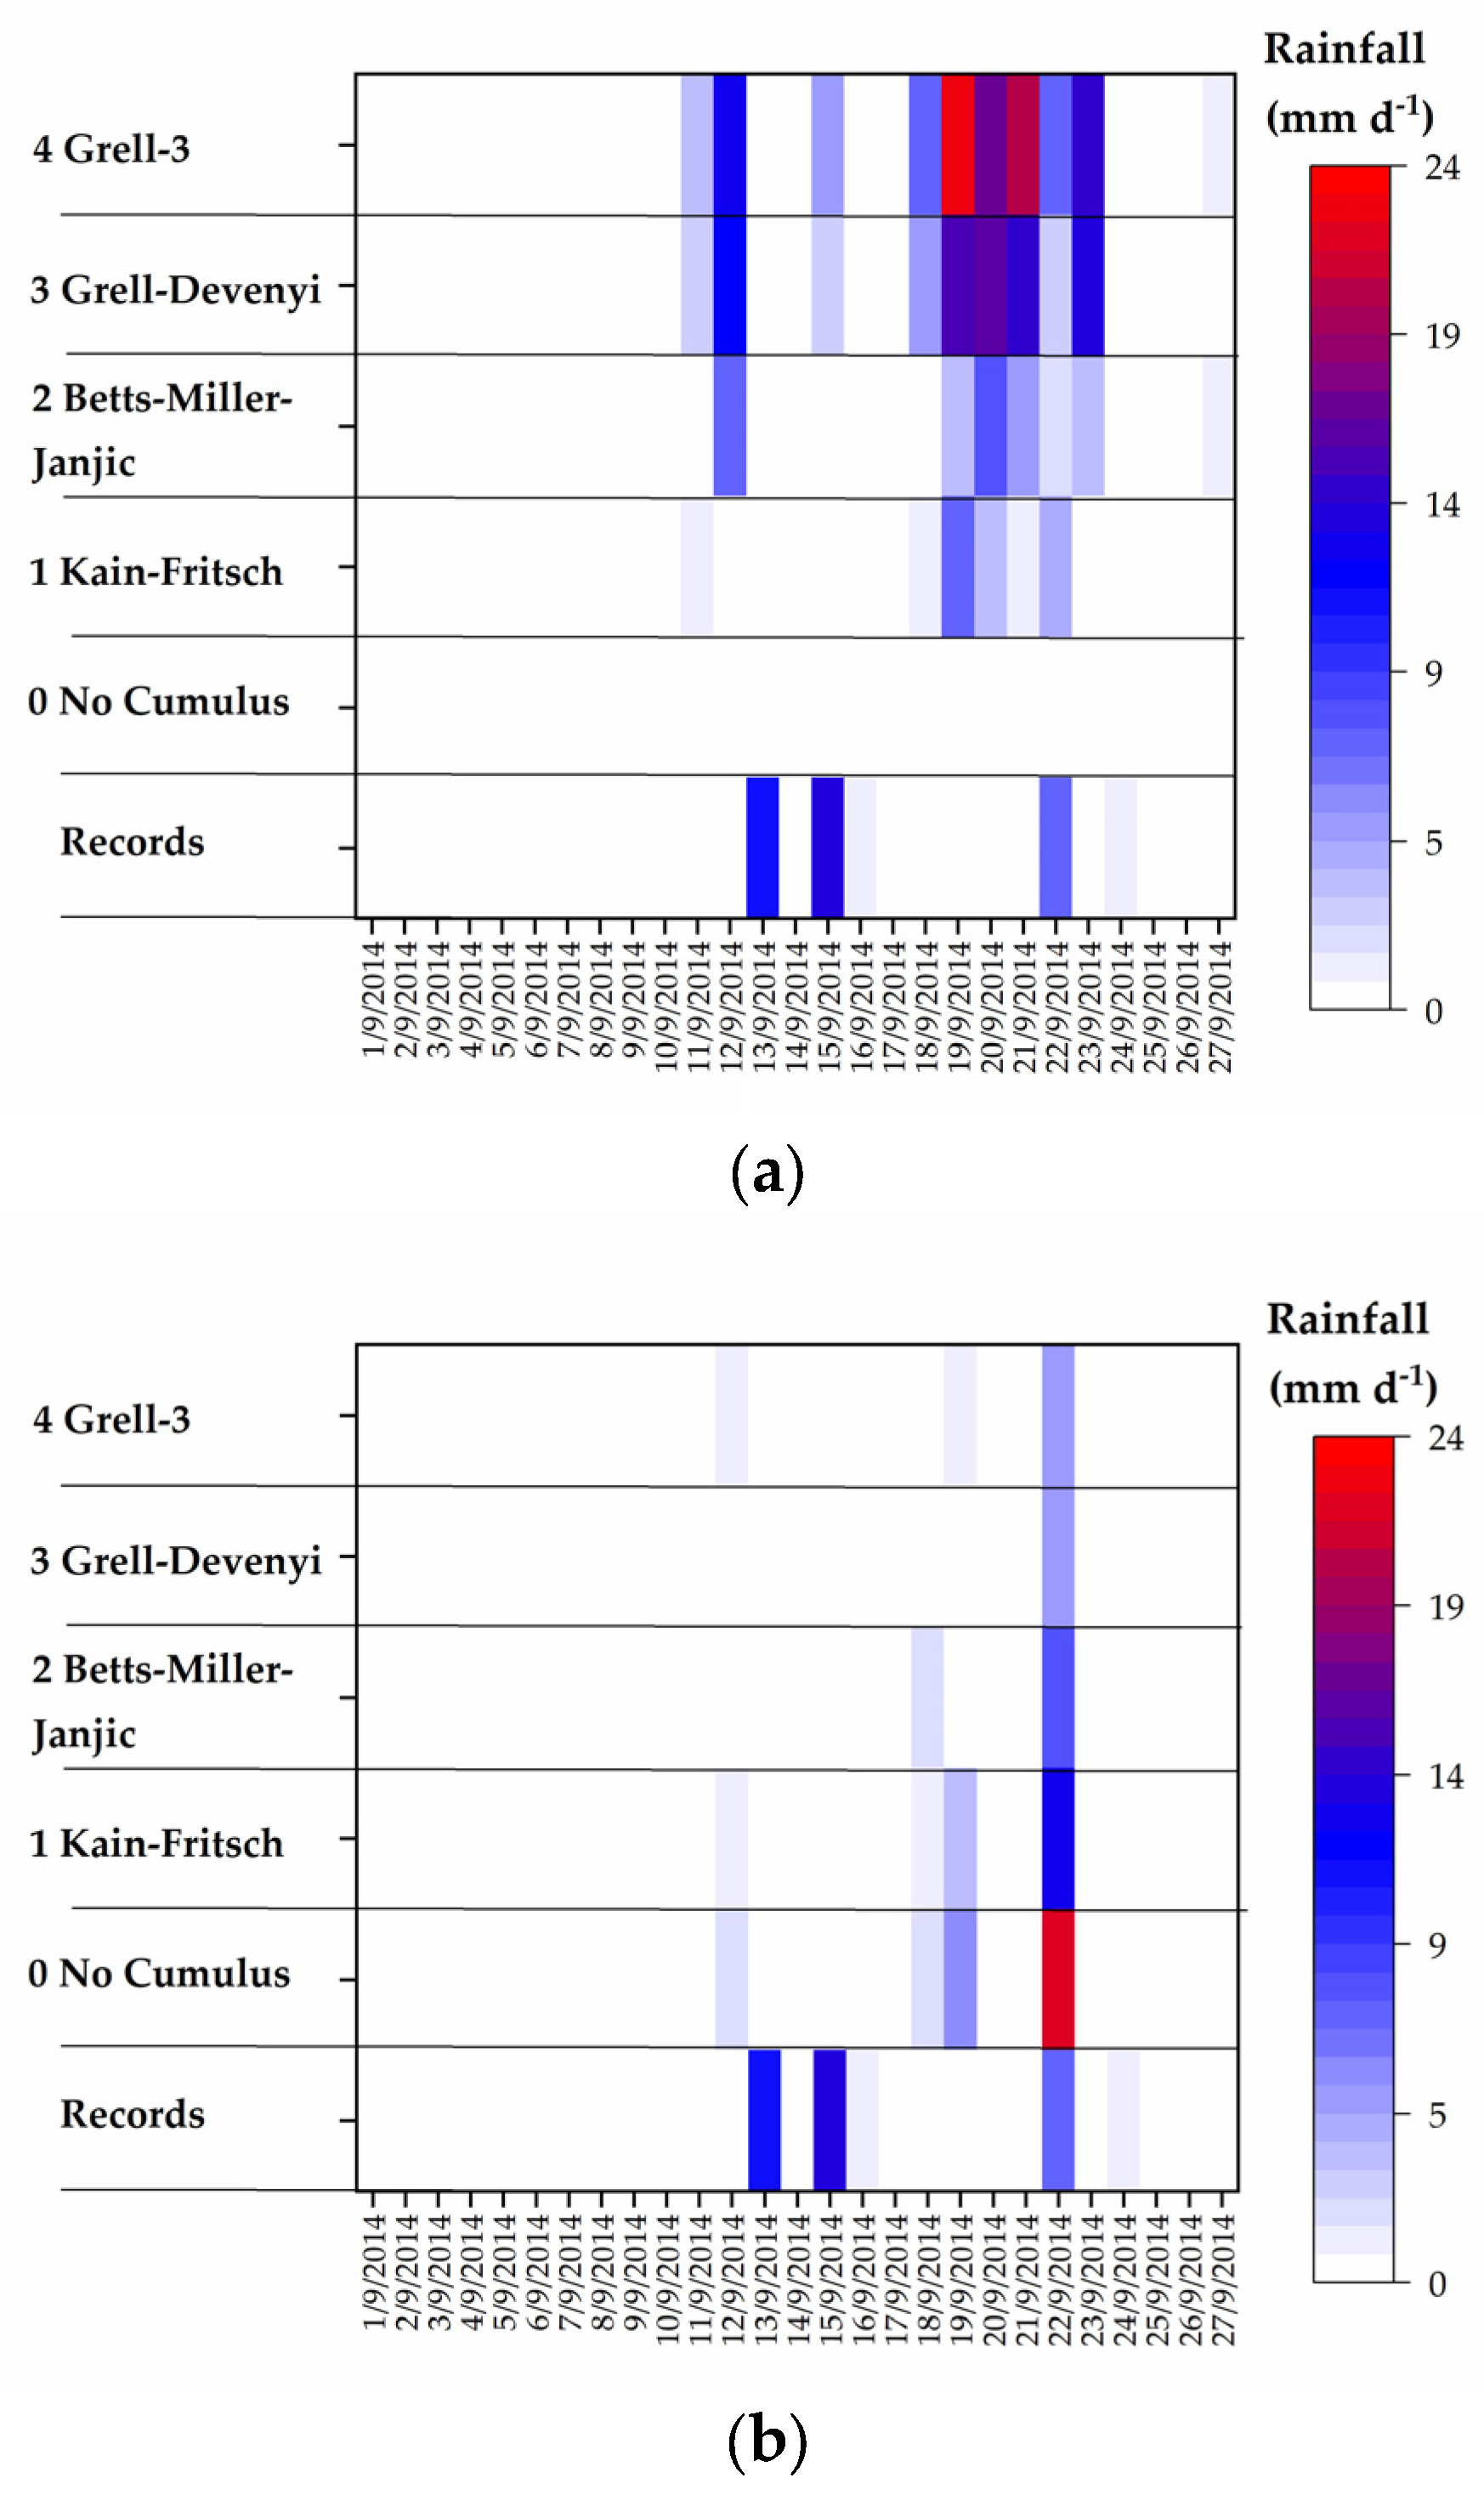
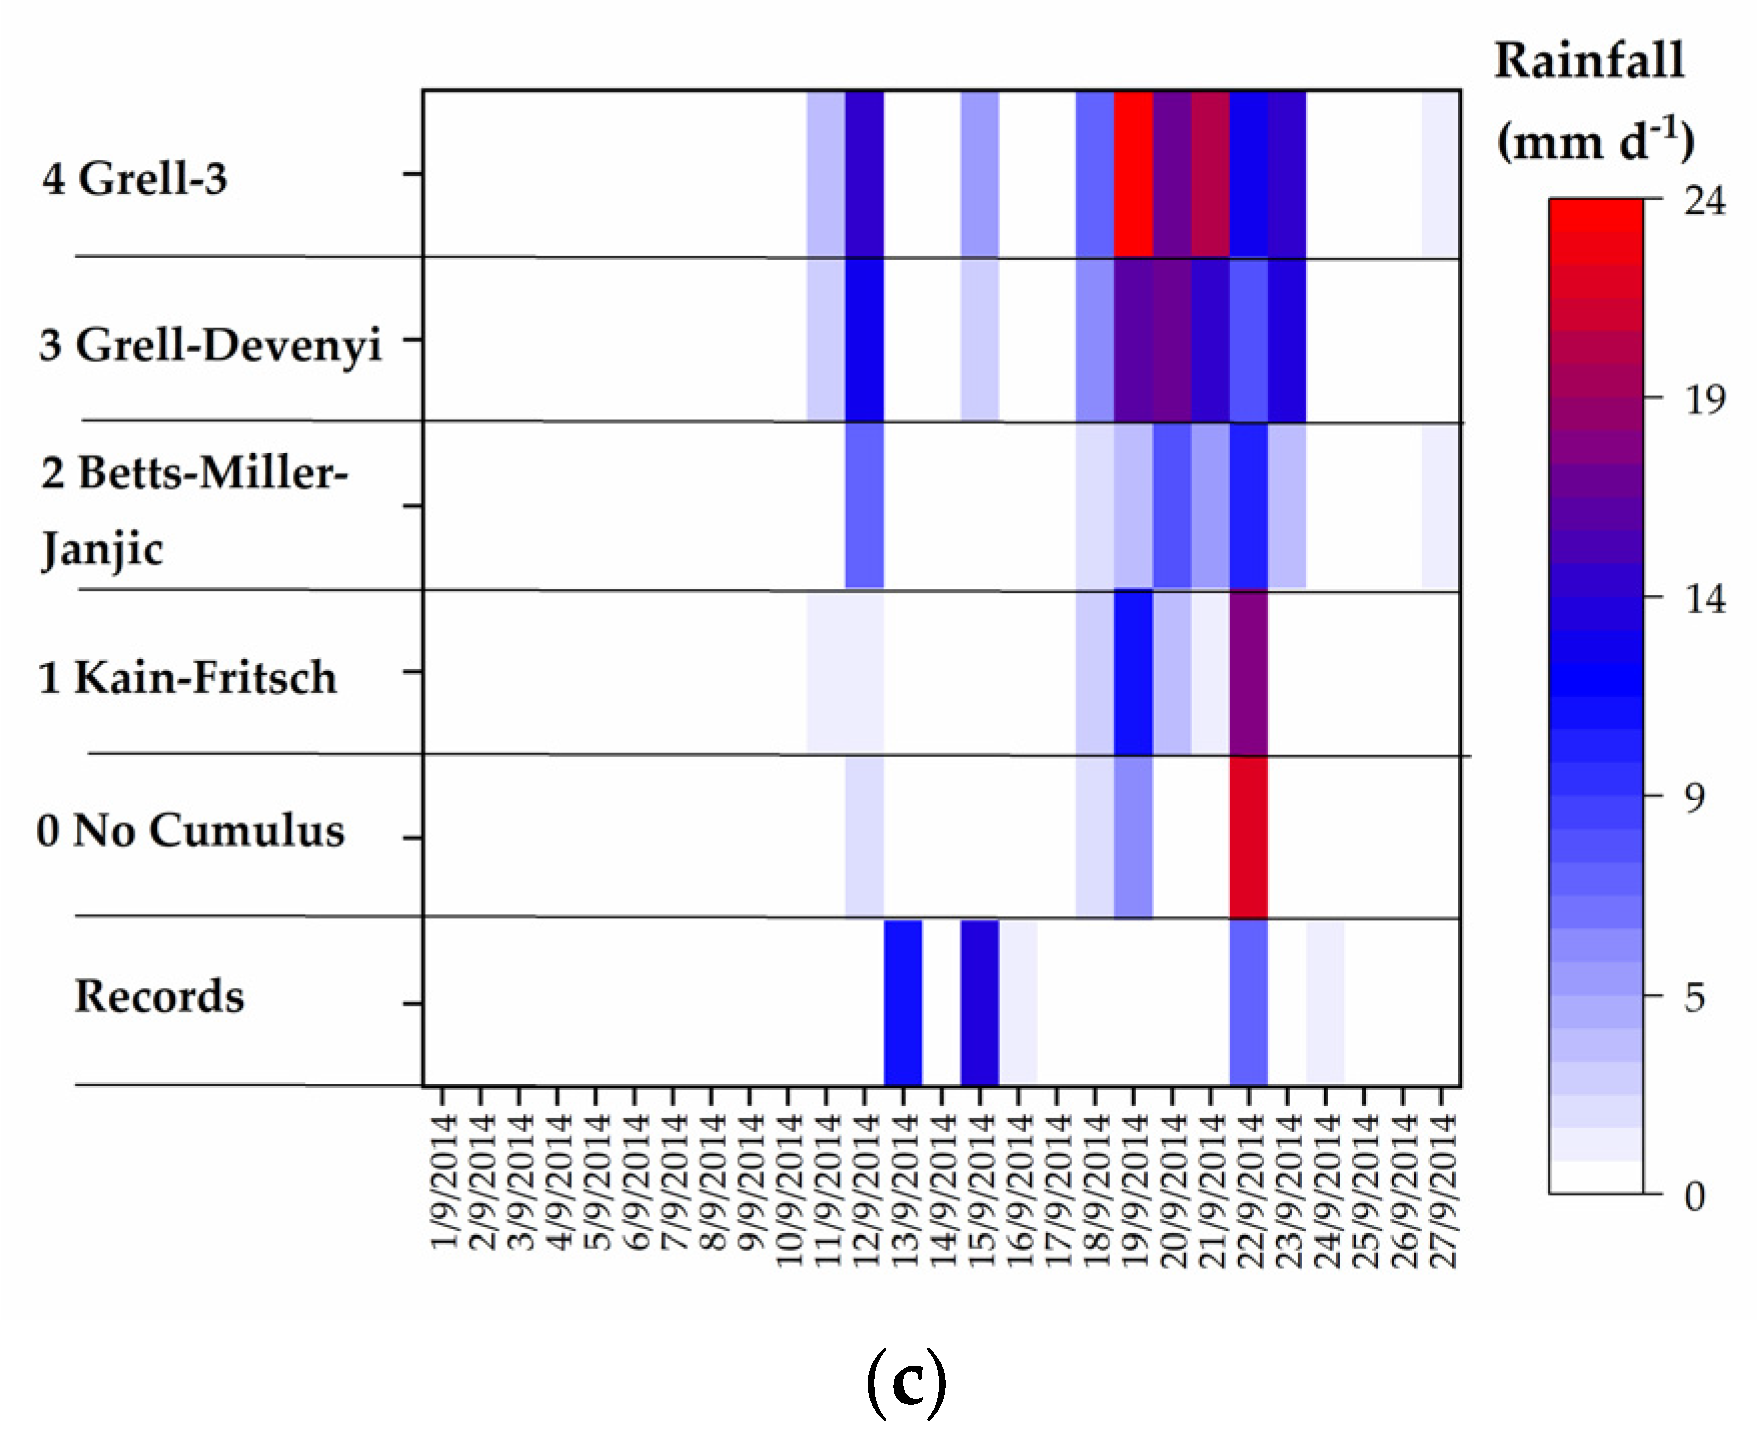
Figure 4.
Modeled rainfall (mm d-1) contribution from cumulus parameterization (RAINC), microphysics (RAINNC), and total (RAINC+RAINNC) for 20-Sep-2014: (a–c) 0 No Cumulus, (d–f) 1 Kaint-Fritsch, (g–i) 2 Betts-Miller-Janjic, (j–l) 3 Grell-Devenyi, (m–o) 4 Grell-3.
Figure 4.
Modeled rainfall (mm d-1) contribution from cumulus parameterization (RAINC), microphysics (RAINNC), and total (RAINC+RAINNC) for 20-Sep-2014: (a–c) 0 No Cumulus, (d–f) 1 Kaint-Fritsch, (g–i) 2 Betts-Miller-Janjic, (j–l) 3 Grell-Devenyi, (m–o) 4 Grell-3.
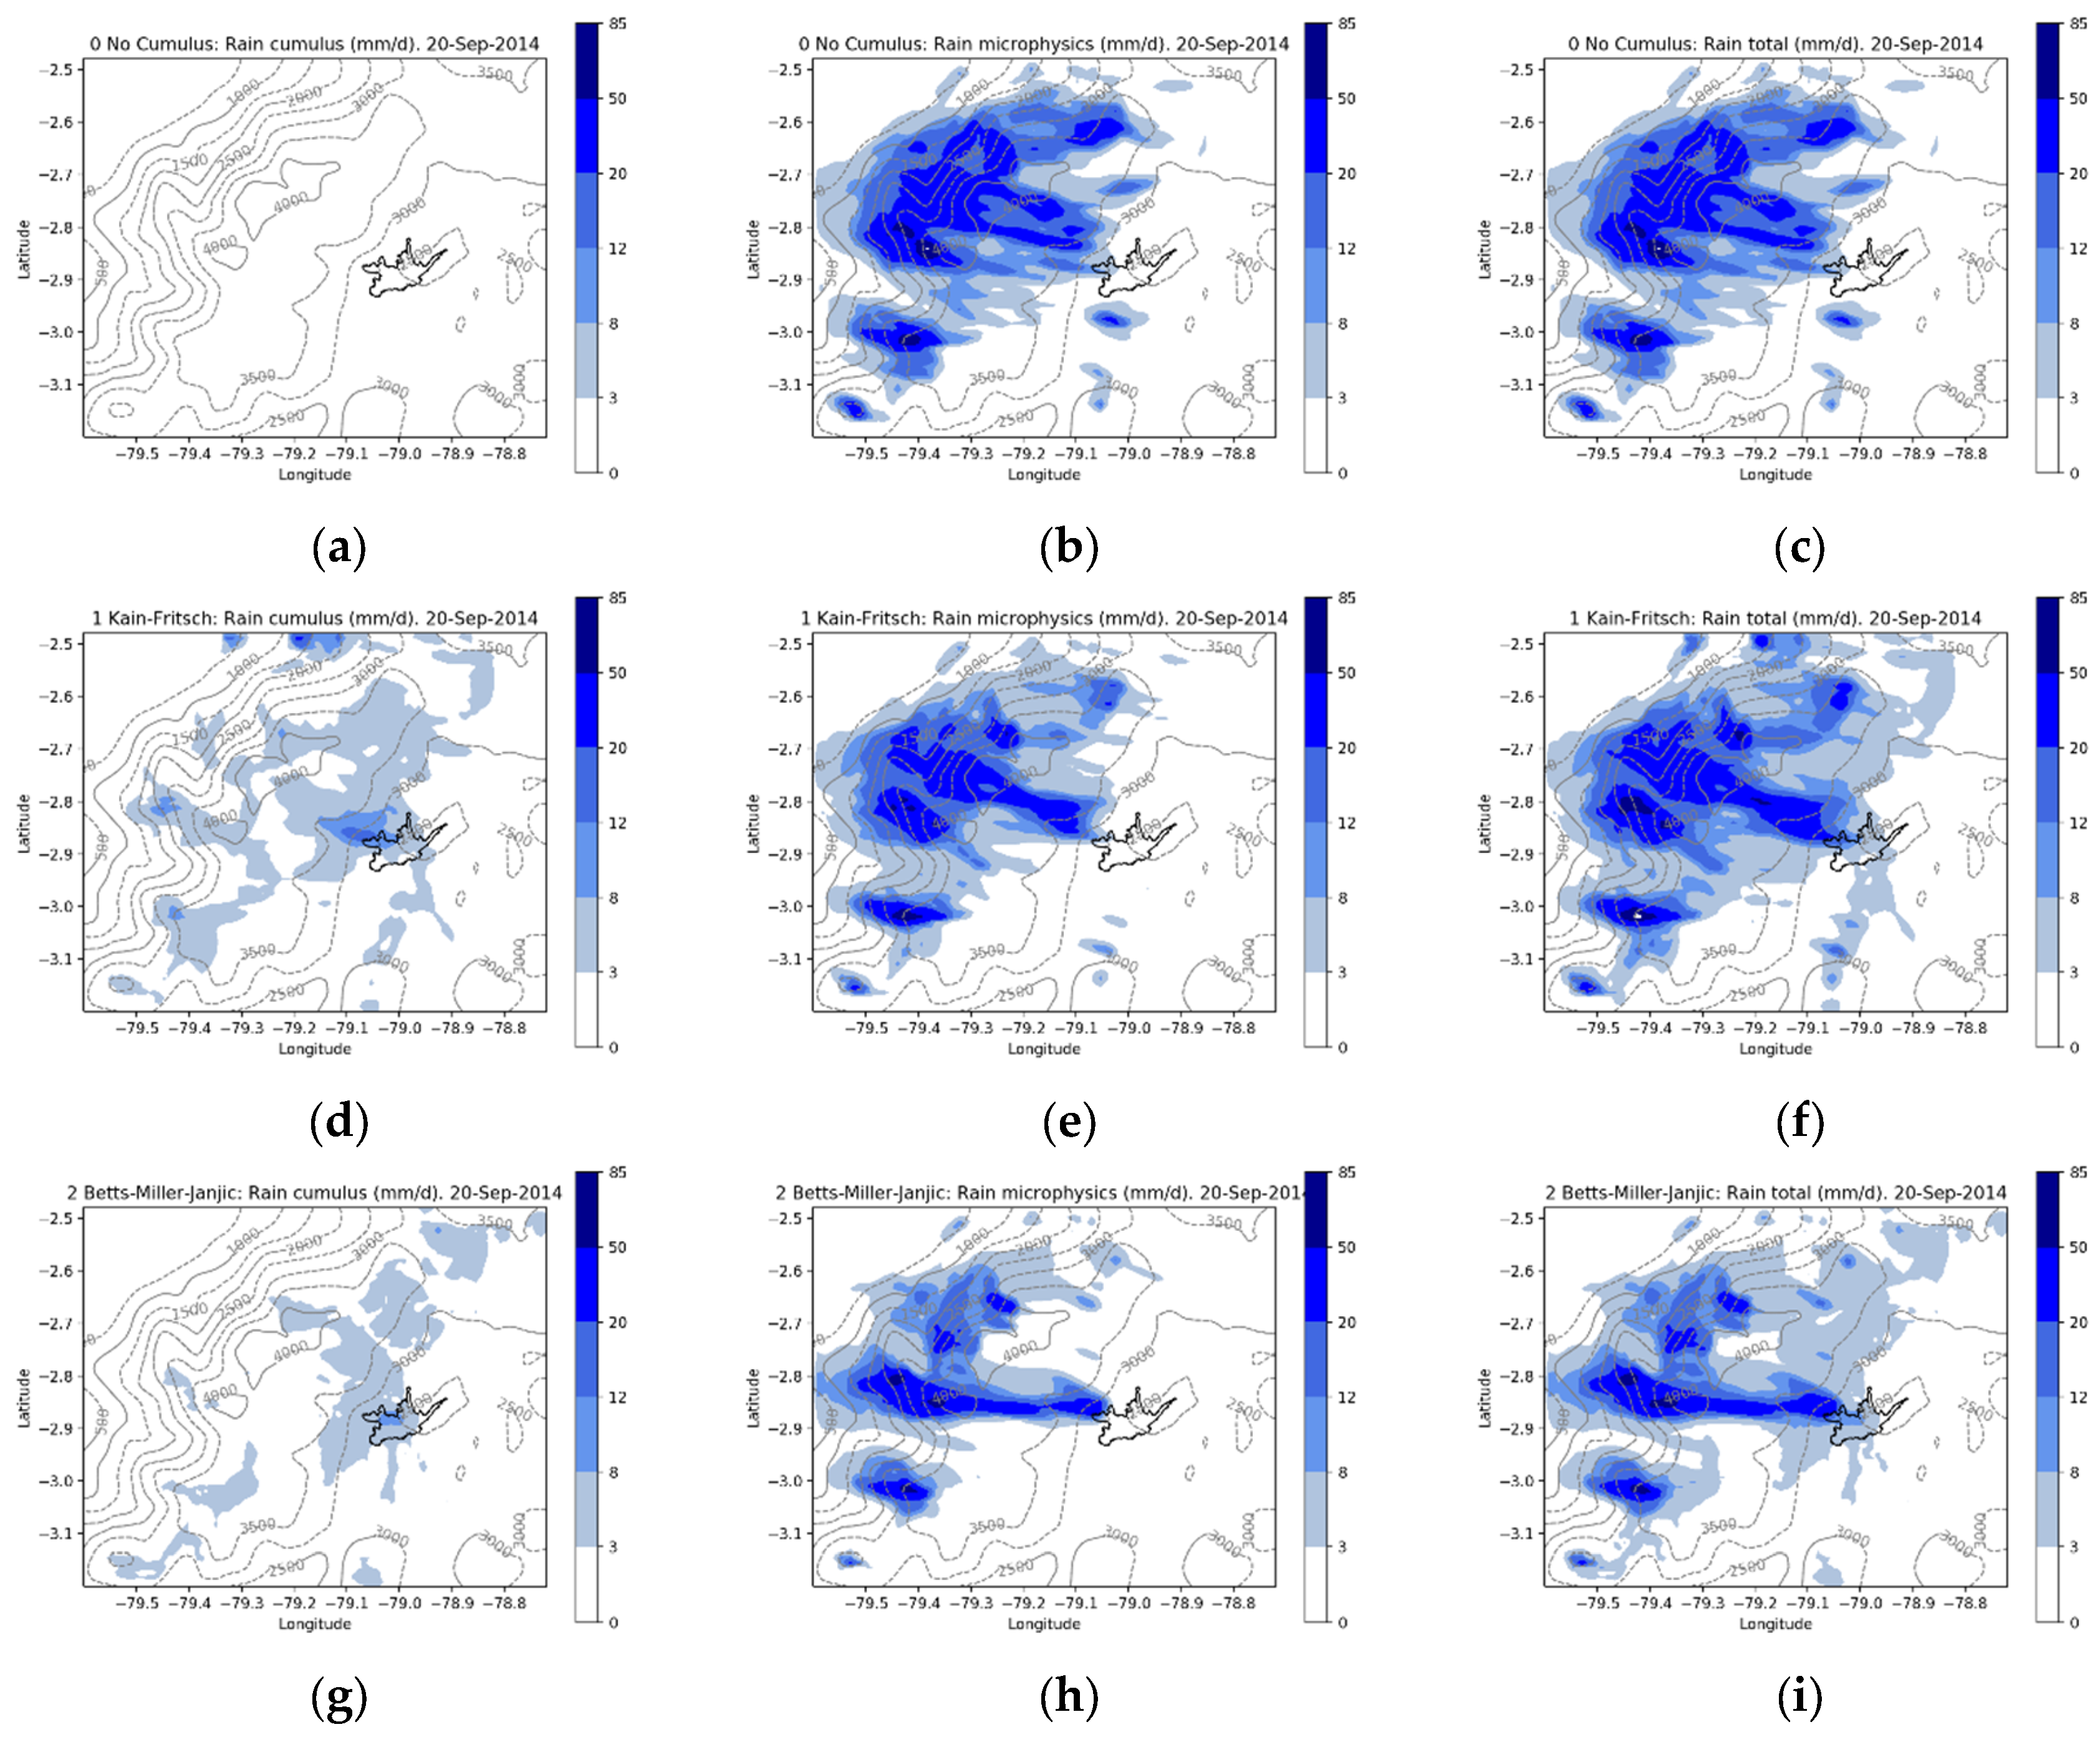
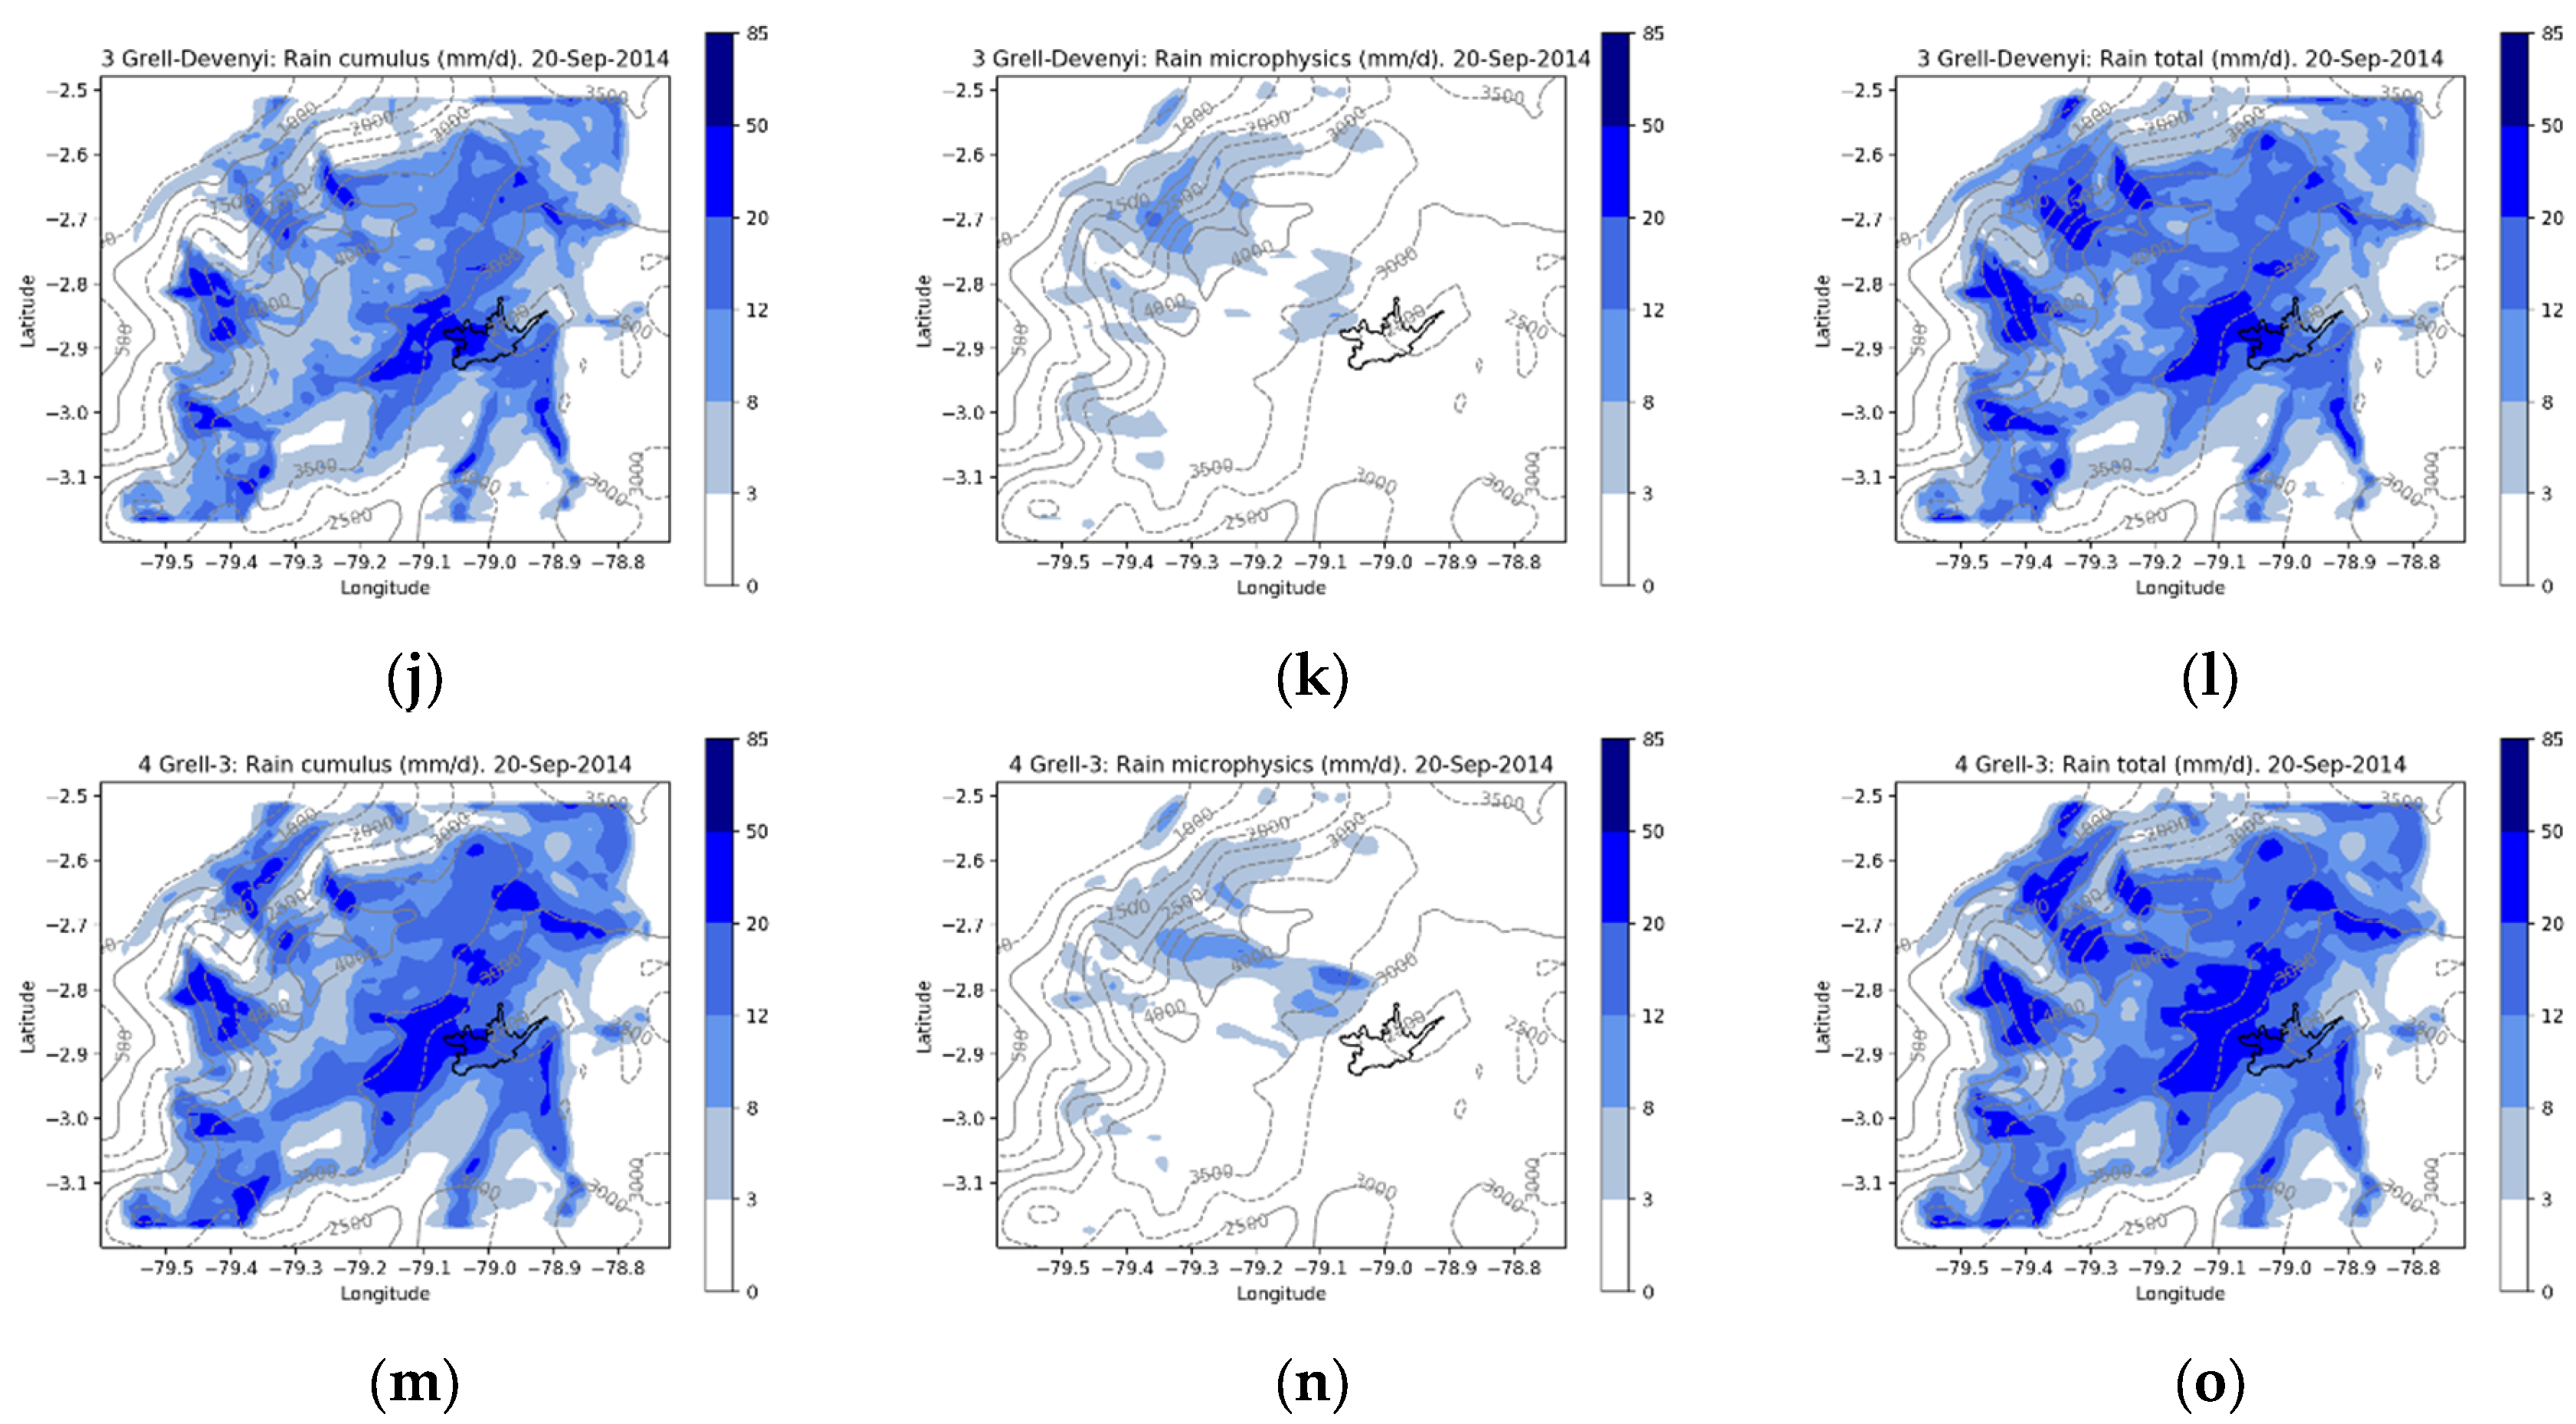
Figure 5.
Modeled rainfall (mm d-1) contribution from cumulus parameterization (RAINC), microphysics (RAINNC), and total (RAINC+RAINNC) for 22-Sep-2014: (a–c) 0 No Cumulus, (d–f) 1 Kaint-Fritsch, (g–i) 2 Betts-Miller-Janjic, (j–l) 3 Grell-Devenyi, (m–o) 4 Grell-3.
Figure 5.
Modeled rainfall (mm d-1) contribution from cumulus parameterization (RAINC), microphysics (RAINNC), and total (RAINC+RAINNC) for 22-Sep-2014: (a–c) 0 No Cumulus, (d–f) 1 Kaint-Fritsch, (g–i) 2 Betts-Miller-Janjic, (j–l) 3 Grell-Devenyi, (m–o) 4 Grell-3.
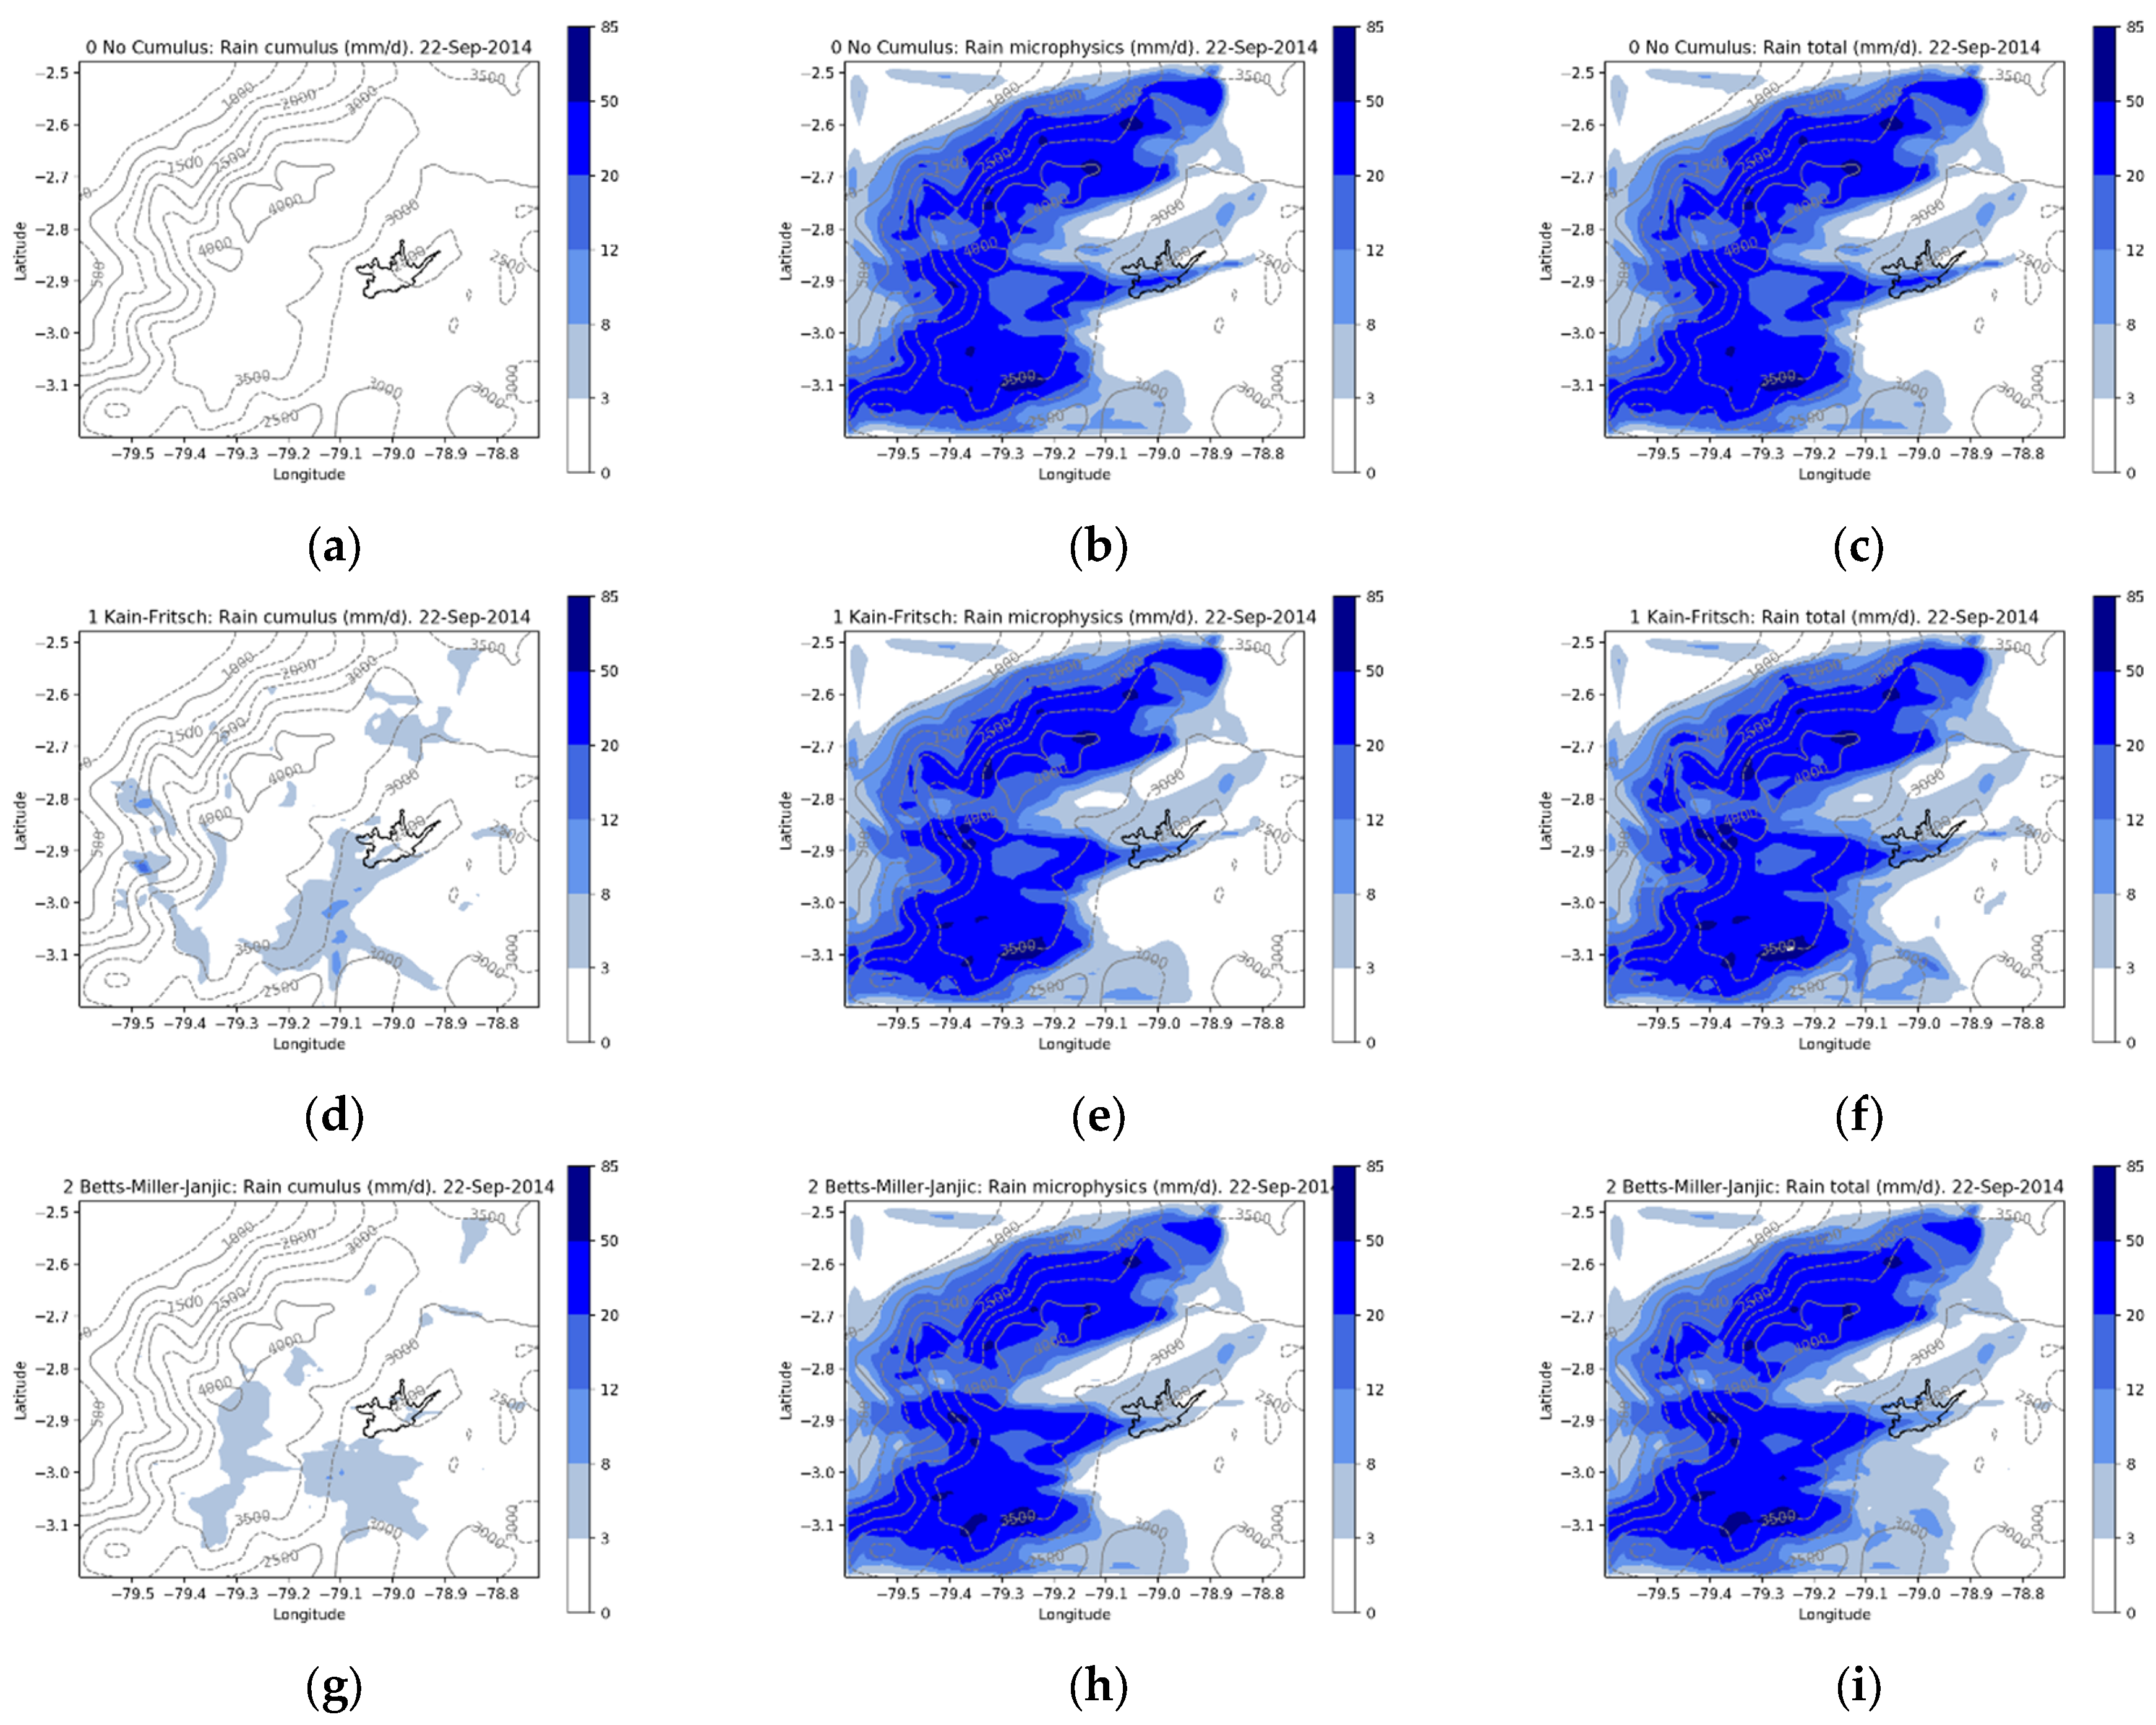
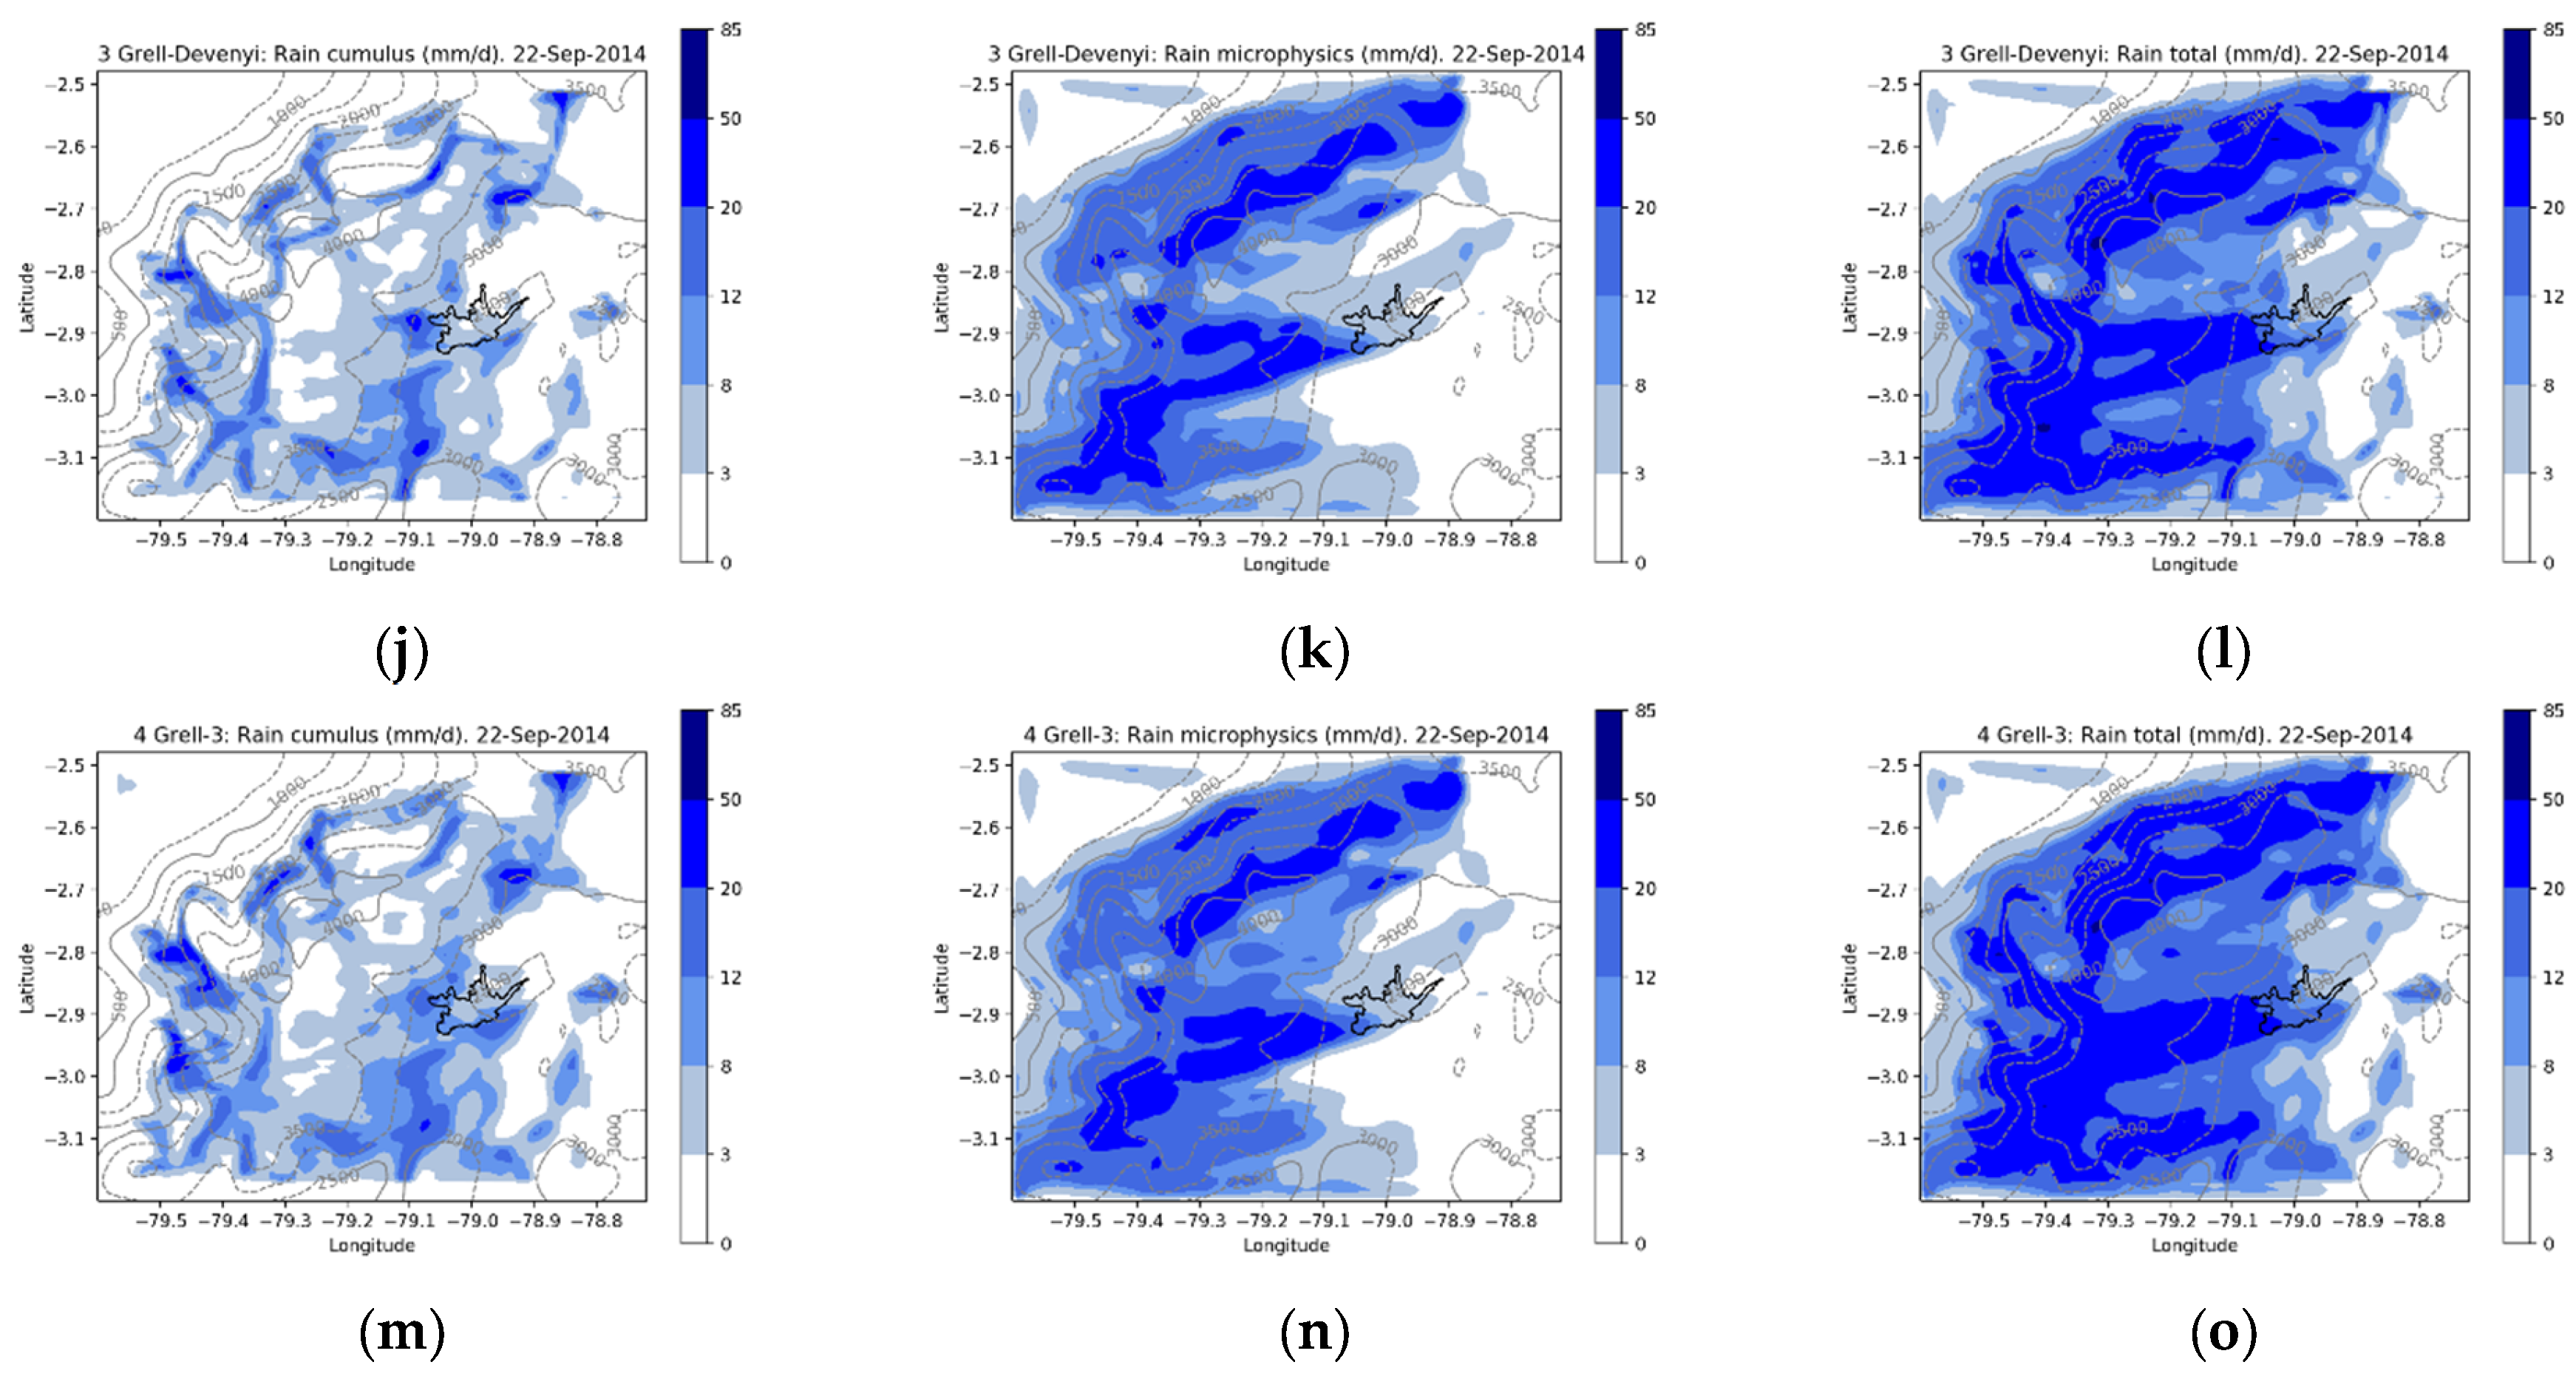
Figure 6.
Observed versus modeled daily CO 8 h maximum: (a) 0 No Cumulus; (b) 1 Kain-Fritsch; (c) 2 Betts-Miller-Janjic; (d) 3 Grell-Devenyi; (e) 4 Grell-3. (f) Mean daily profiles of hourly CO concentrations.
Figure 6.
Observed versus modeled daily CO 8 h maximum: (a) 0 No Cumulus; (b) 1 Kain-Fritsch; (c) 2 Betts-Miller-Janjic; (d) 3 Grell-Devenyi; (e) 4 Grell-3. (f) Mean daily profiles of hourly CO concentrations.
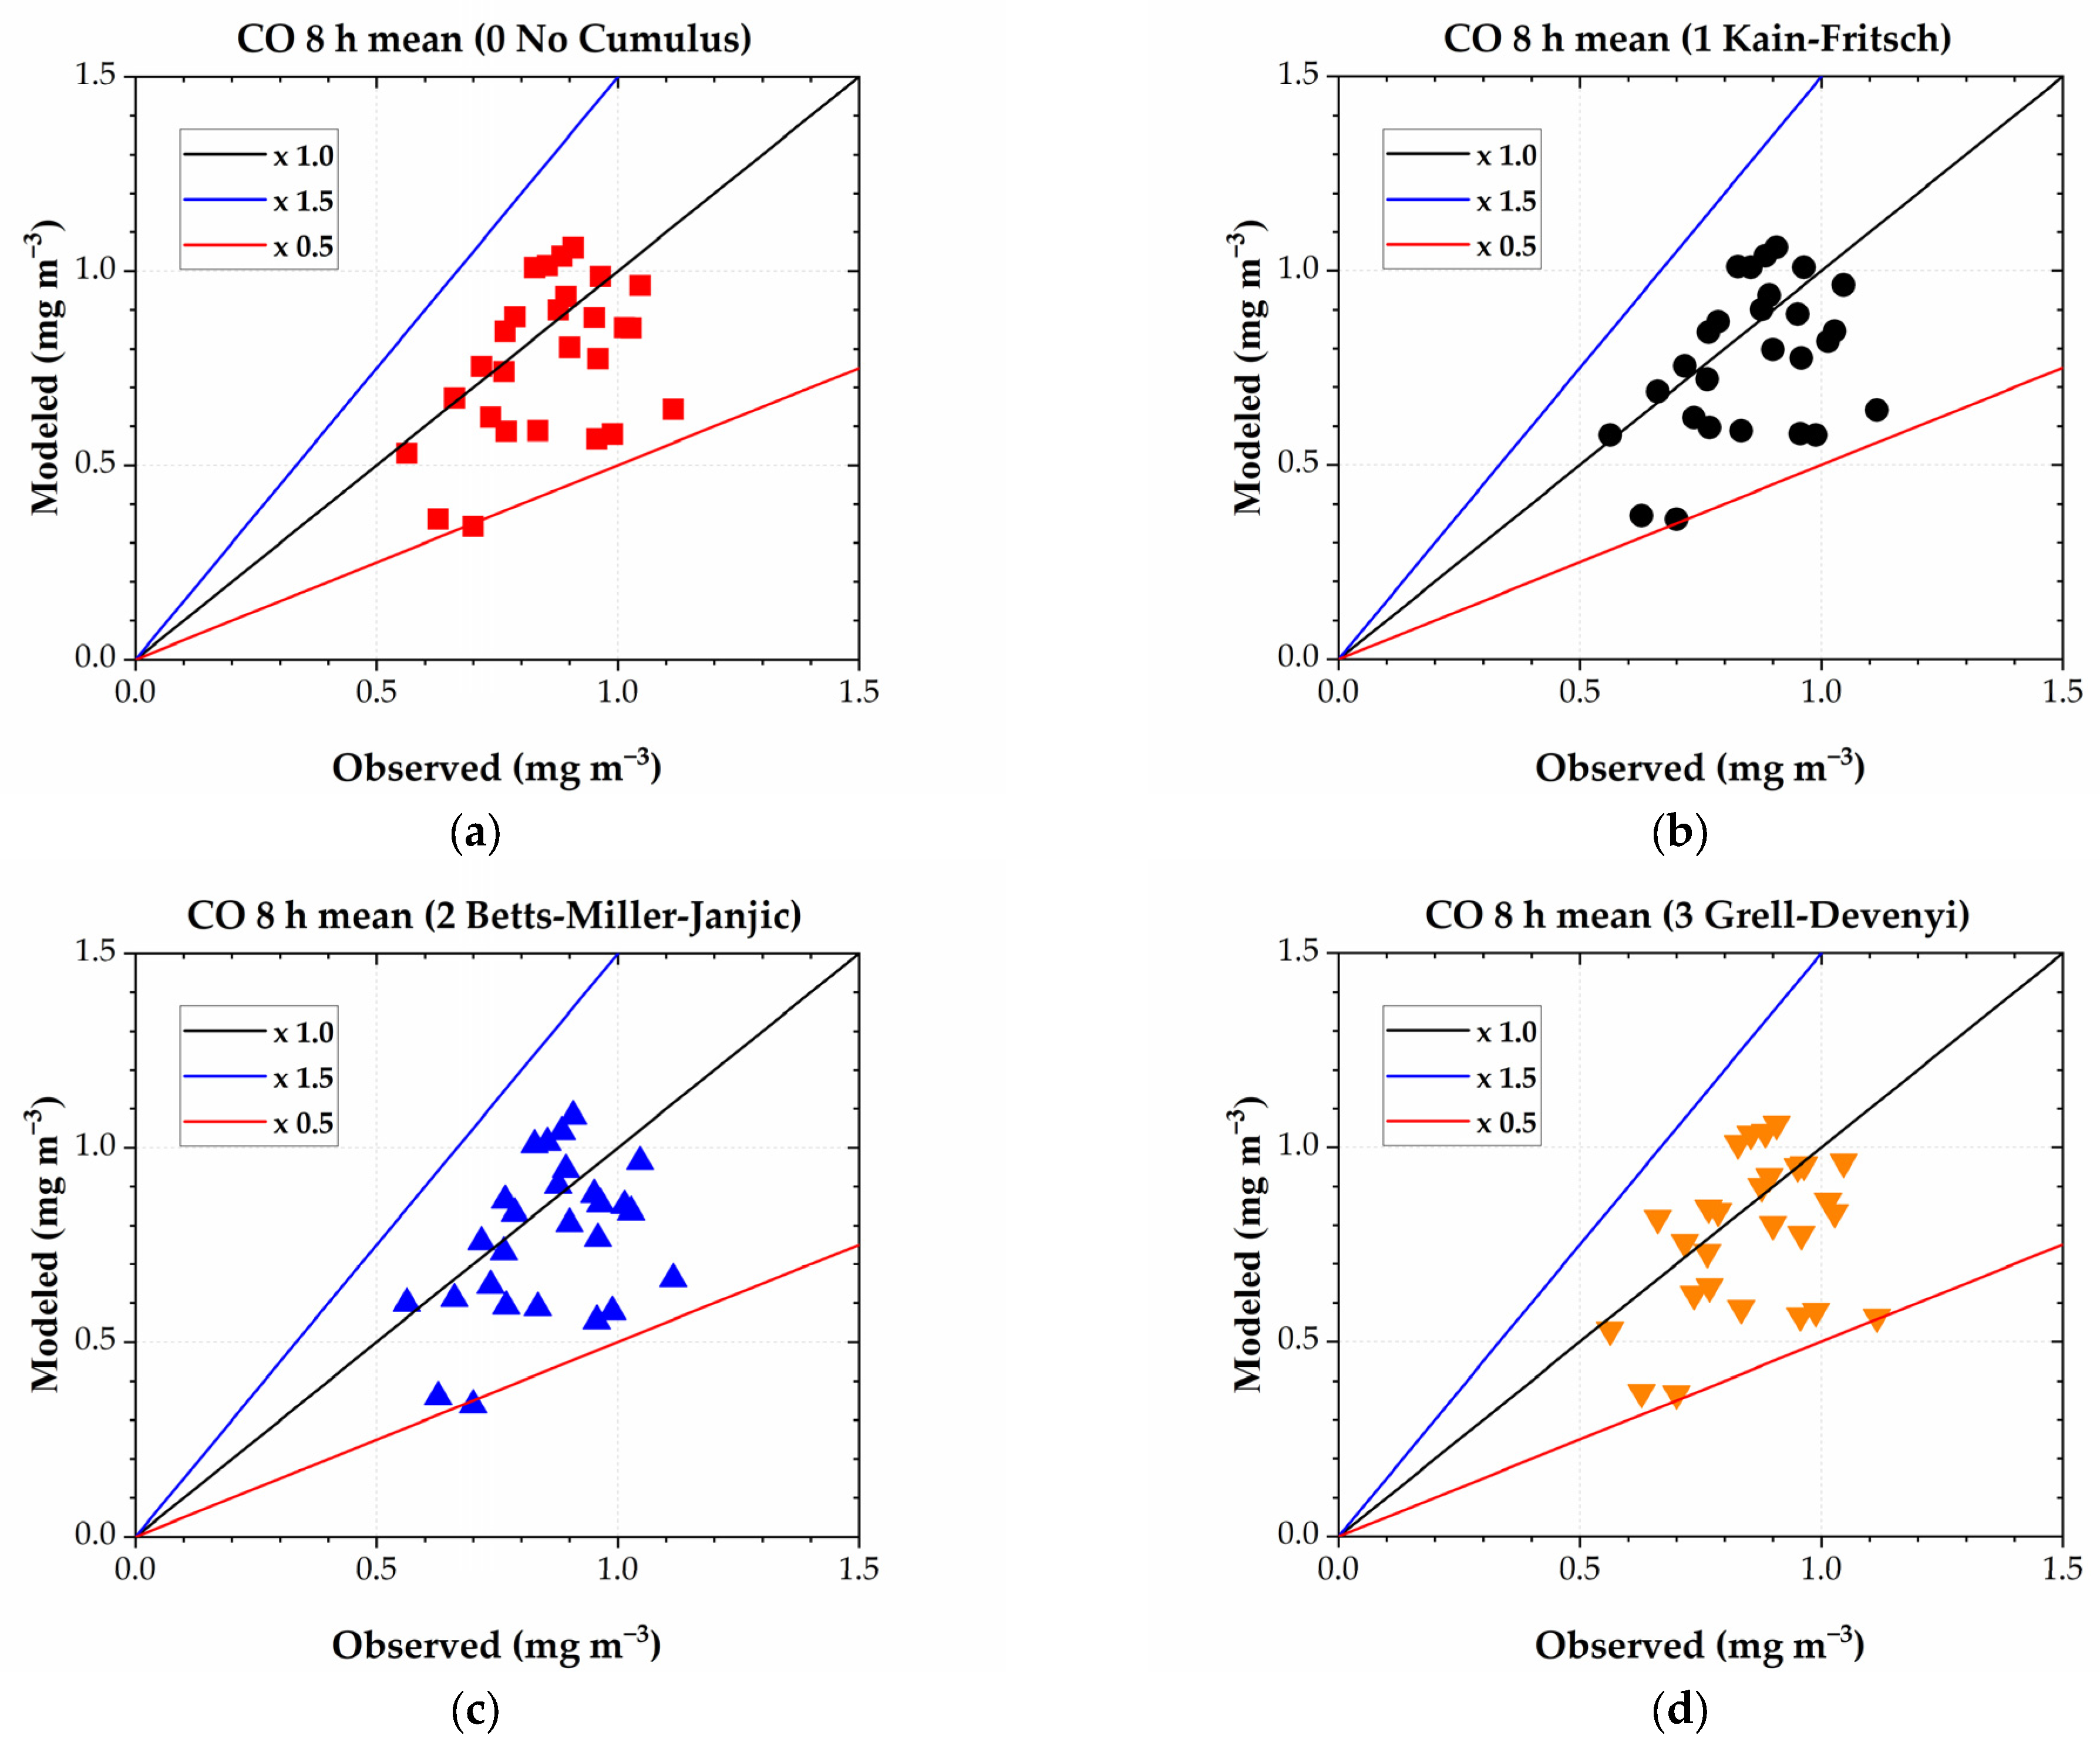
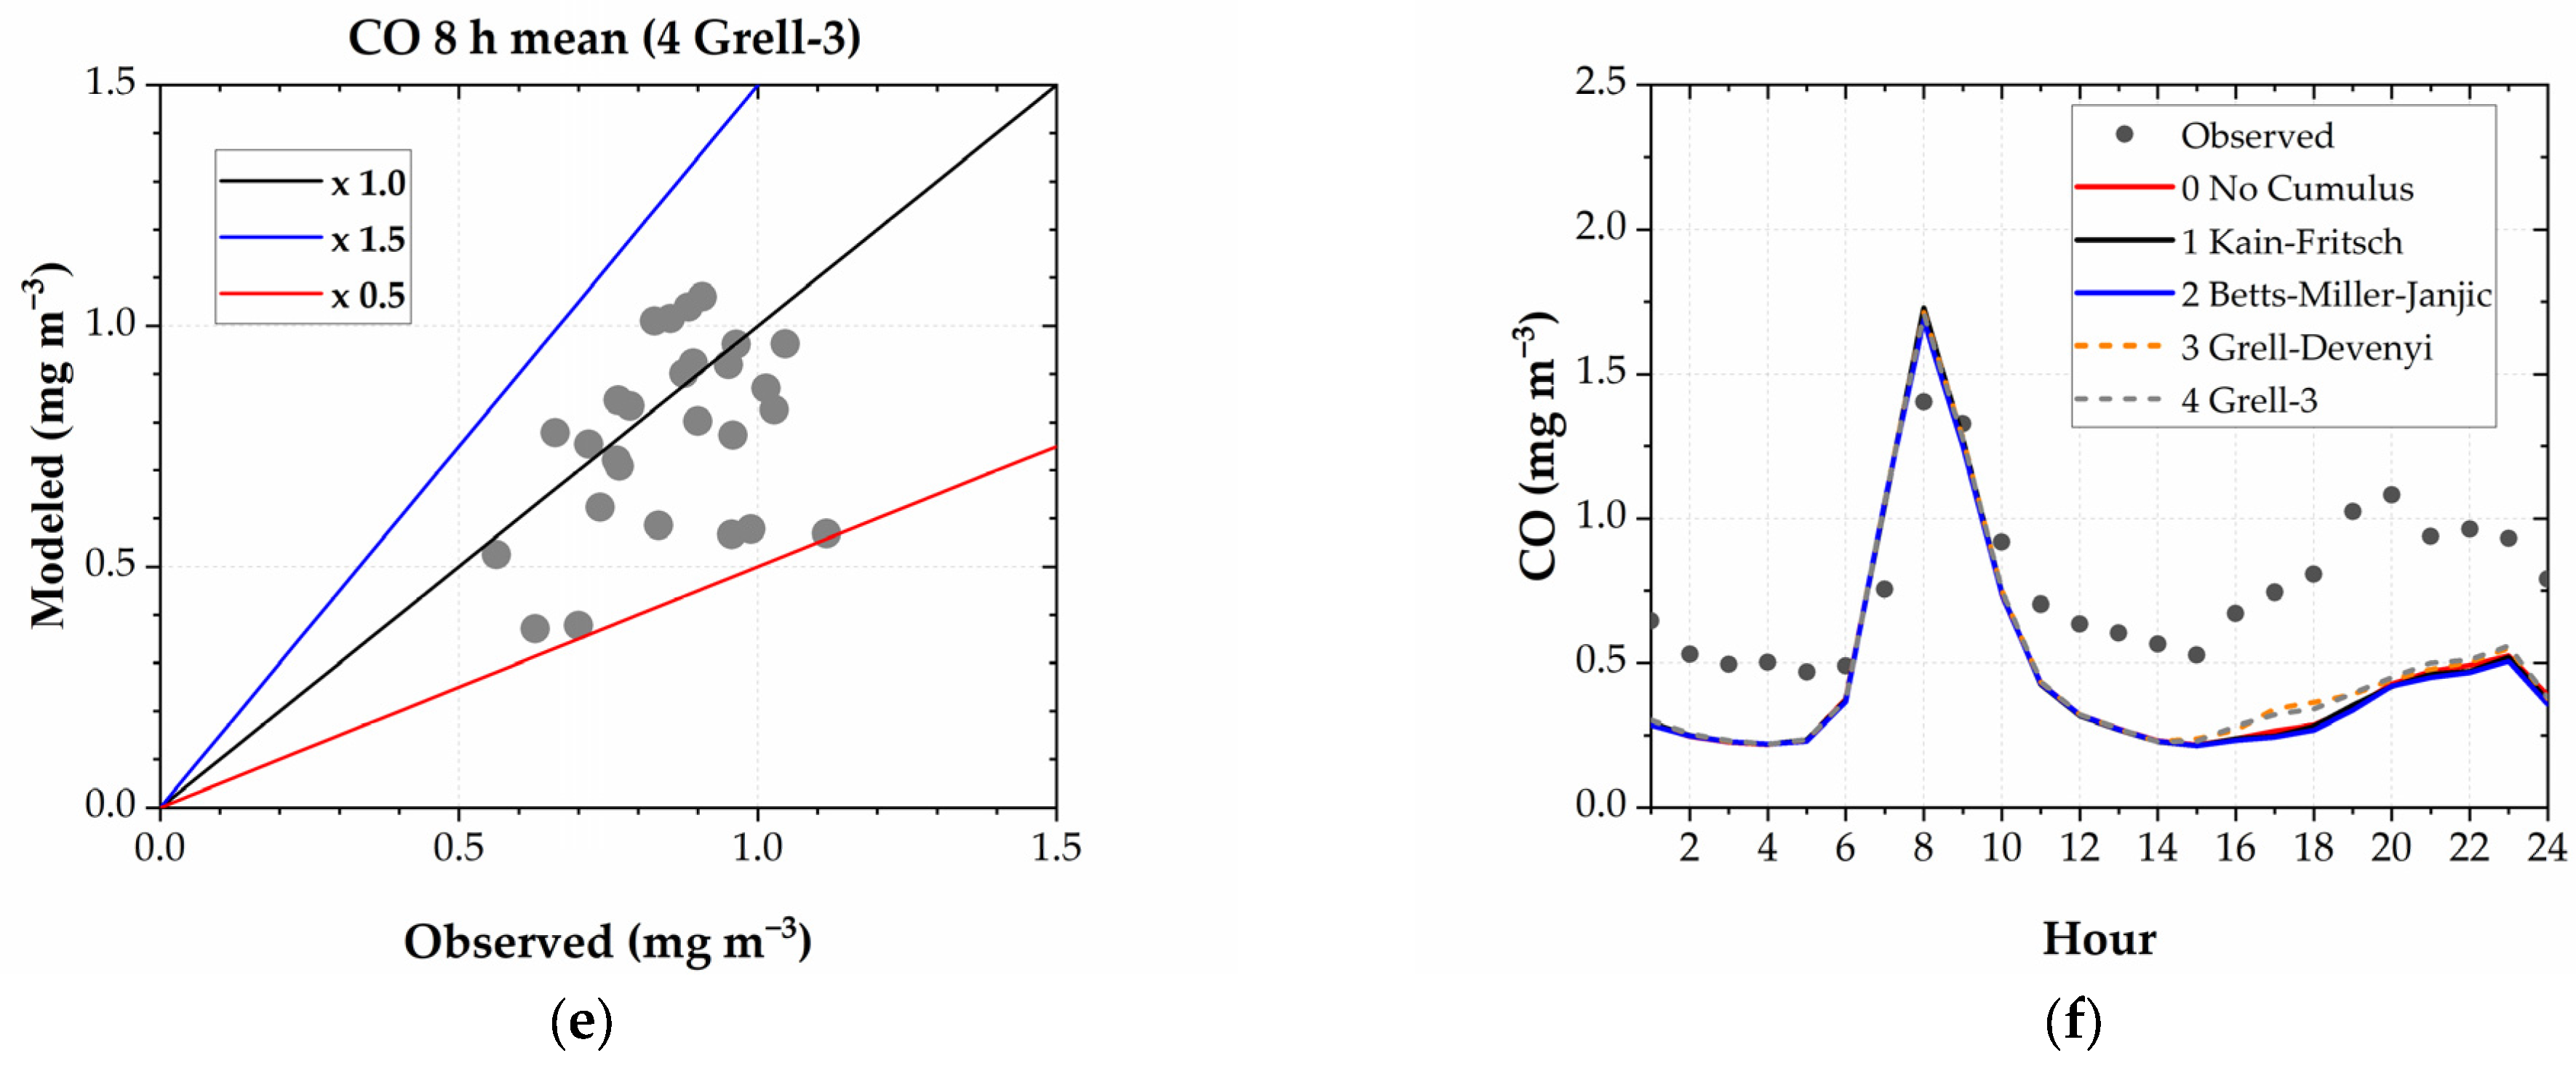
Figure 7.
Observed versus modeled daily PM2.5 24 h mean: (a) 0 No Cumulus; (b) 1 Kain-Fritsch; (c) 2 Betts-Miller-Janjic; (d) 3 Grell-Devenyi; (e) 4 Grell-3. (f) Mean daily profiles of hourly PM2.5 concentrations.
Figure 7.
Observed versus modeled daily PM2.5 24 h mean: (a) 0 No Cumulus; (b) 1 Kain-Fritsch; (c) 2 Betts-Miller-Janjic; (d) 3 Grell-Devenyi; (e) 4 Grell-3. (f) Mean daily profiles of hourly PM2.5 concentrations.
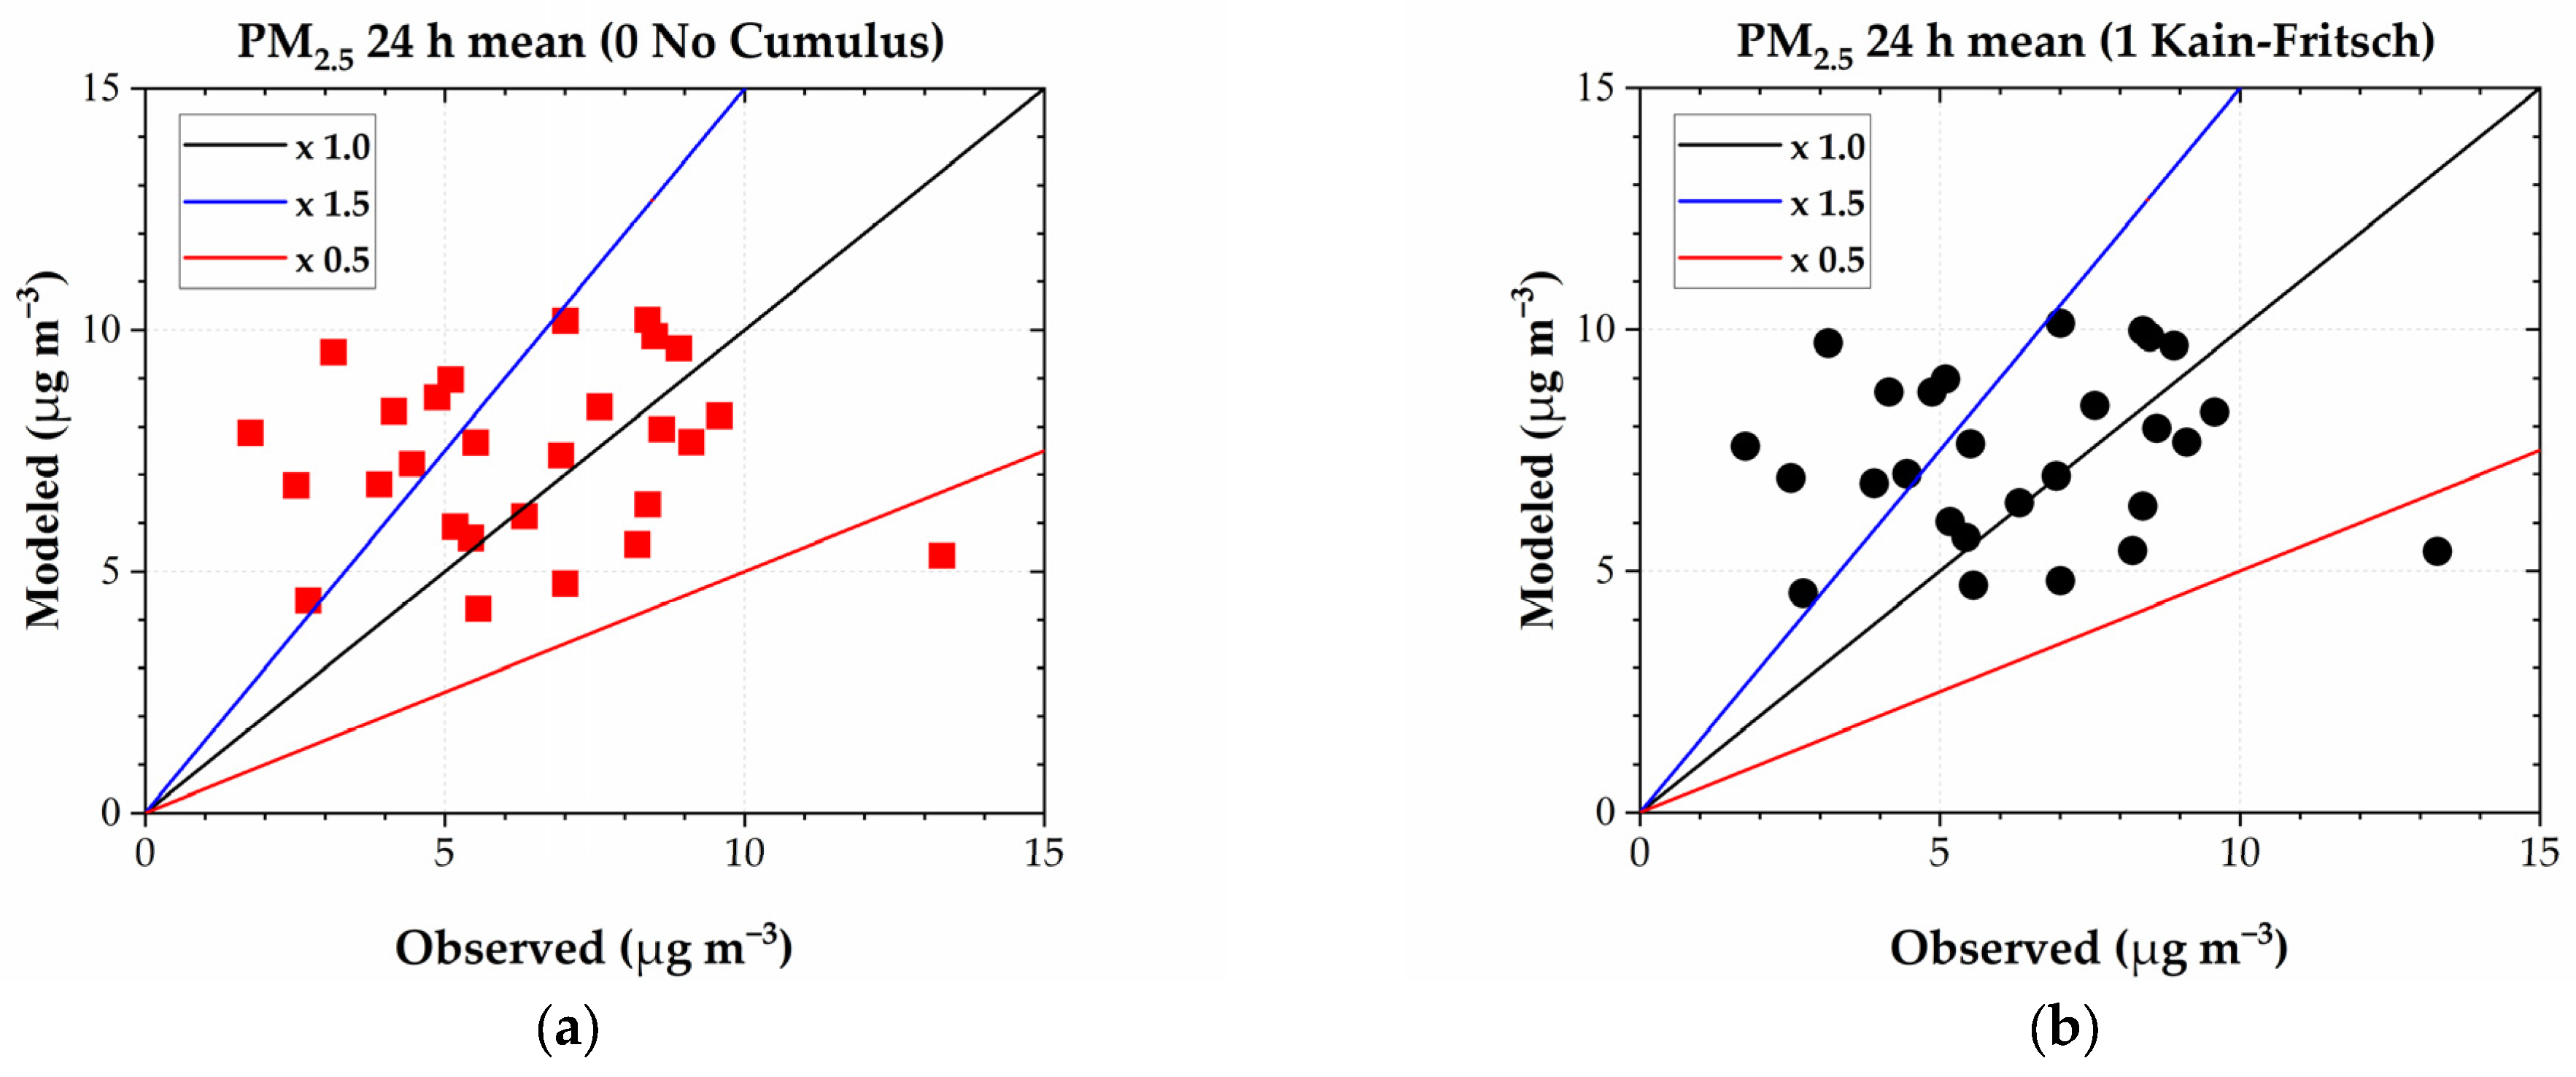
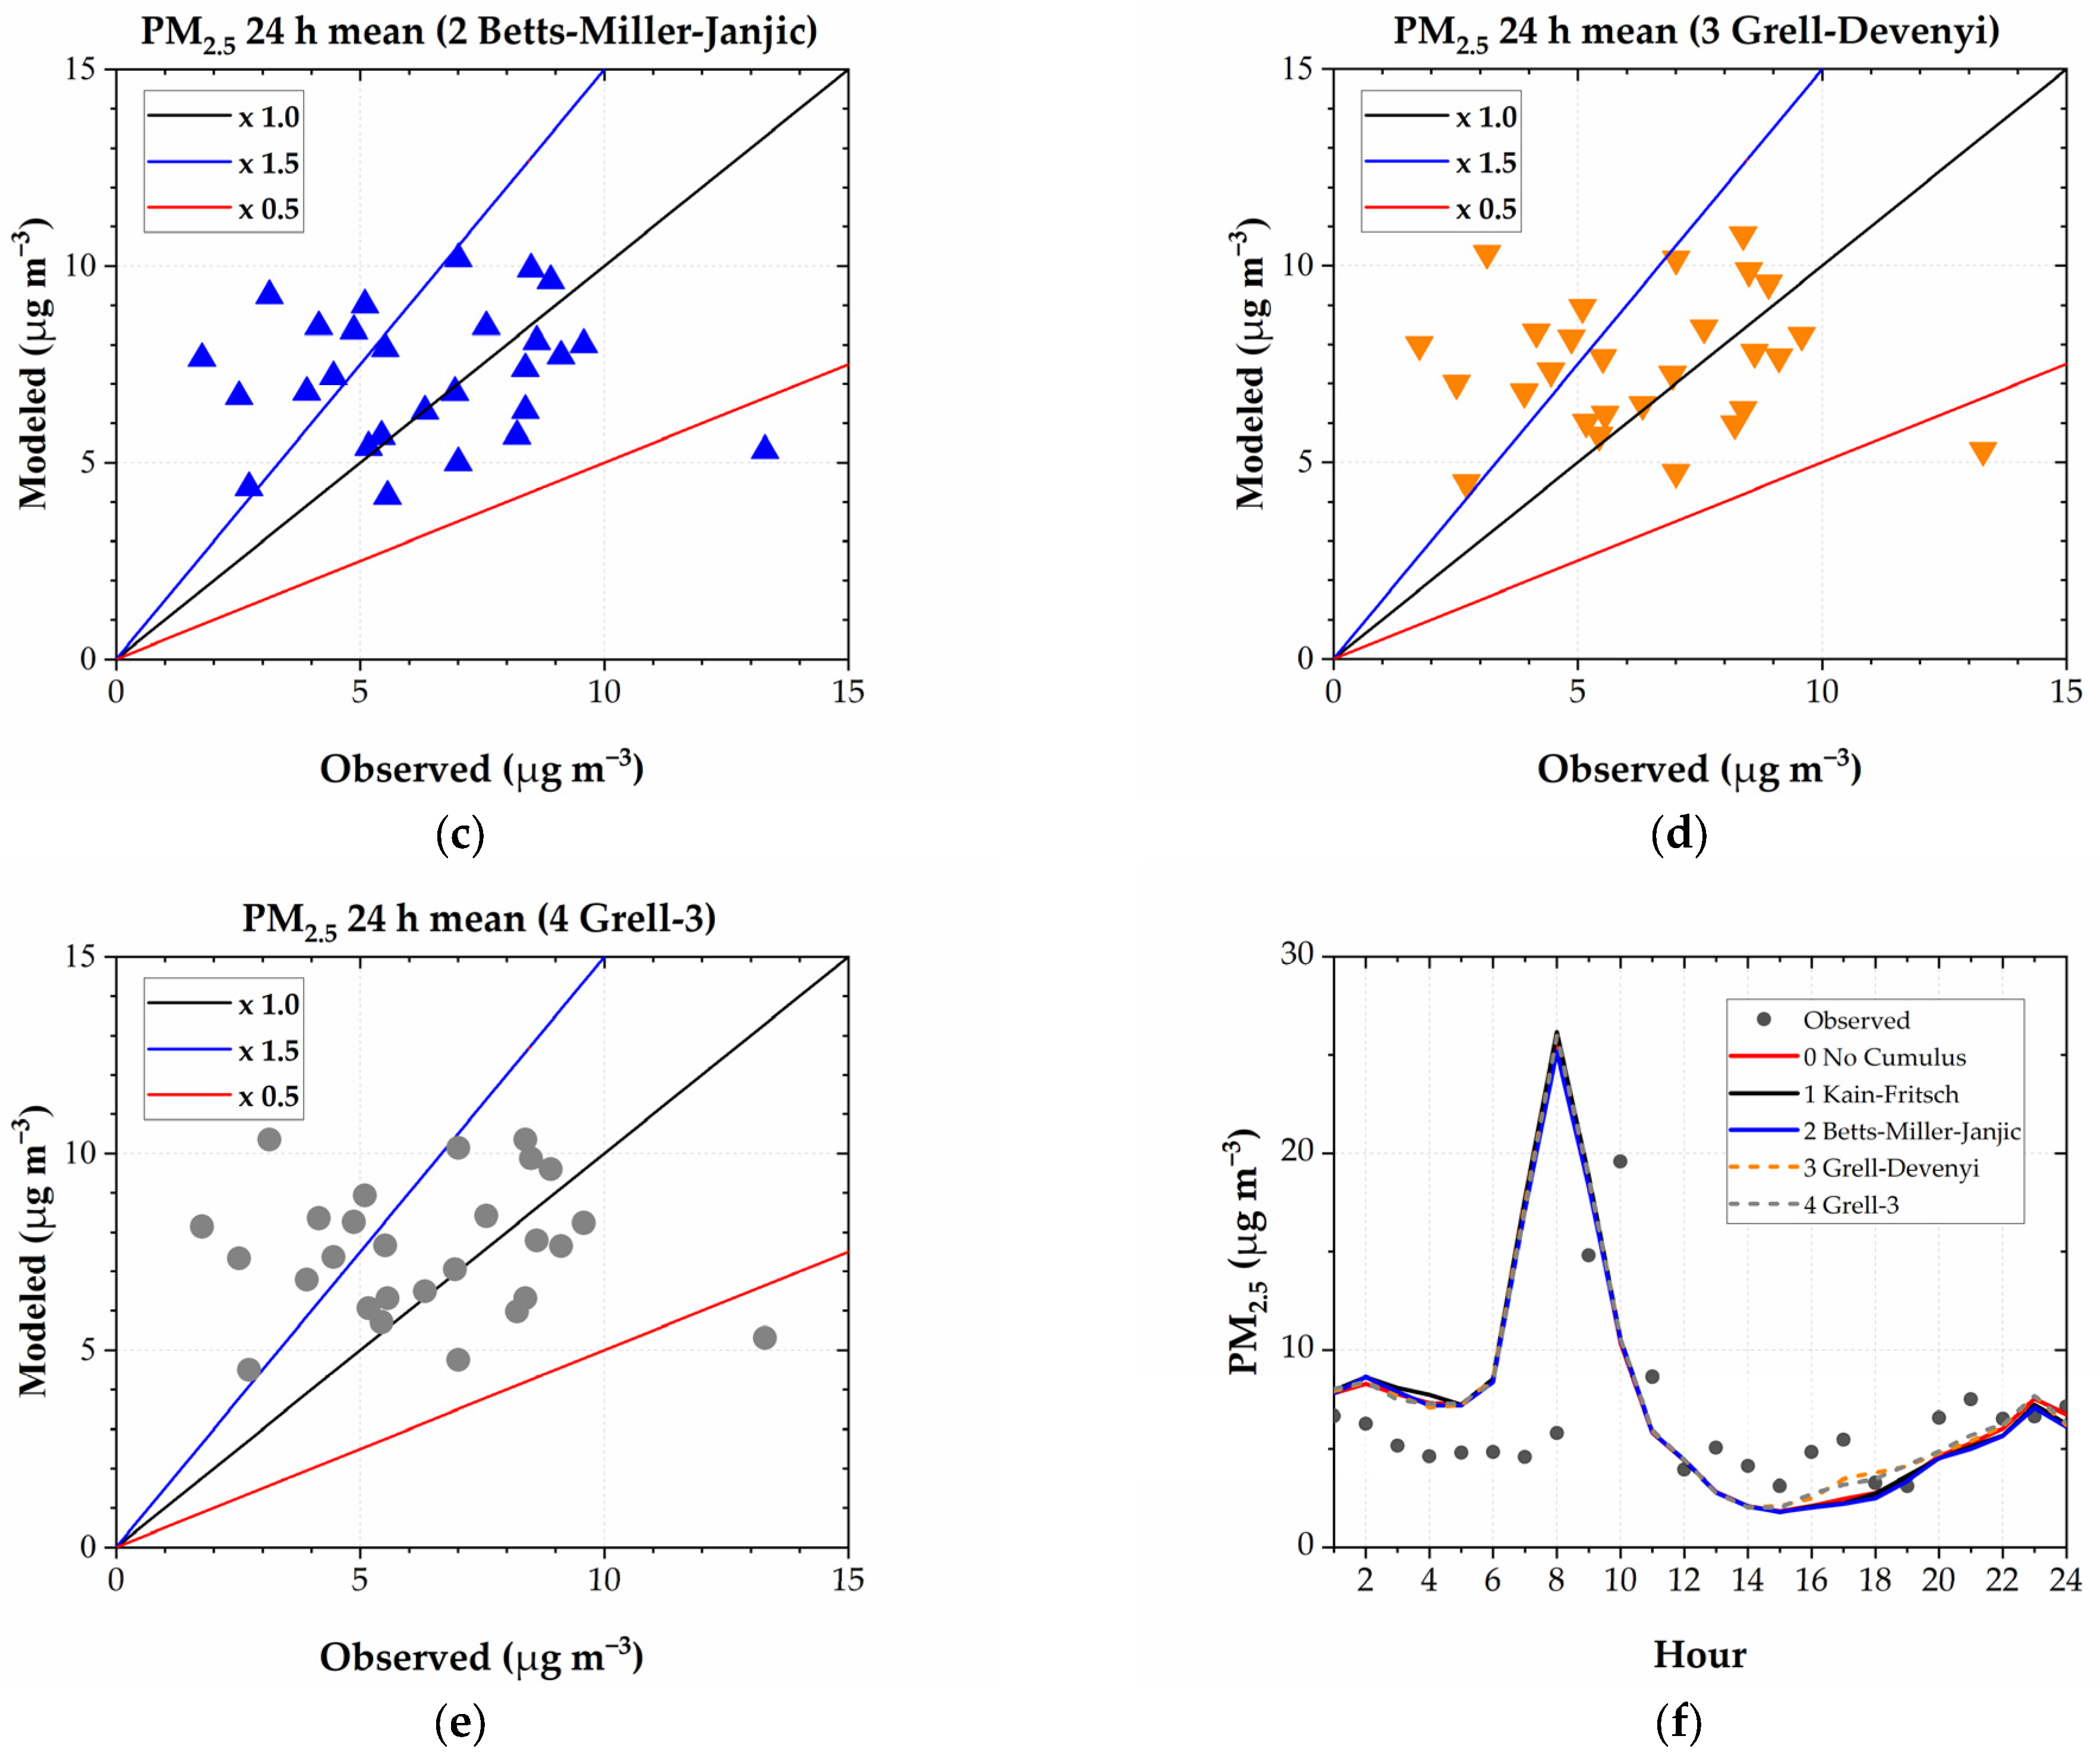
Figure 8.
Observed versus modeled daily O3 8 h maximum mean: (a) 0 No Cumulus; (b) 1 Kain-Fritsch; (c) 2 Betts-Miller-Janjic; (d) 3 Grell-Devenyi; (e) 4 Grell-3. (f) Mean daily profiles of hourly O3 concentrations.
Figure 8.
Observed versus modeled daily O3 8 h maximum mean: (a) 0 No Cumulus; (b) 1 Kain-Fritsch; (c) 2 Betts-Miller-Janjic; (d) 3 Grell-Devenyi; (e) 4 Grell-3. (f) Mean daily profiles of hourly O3 concentrations.
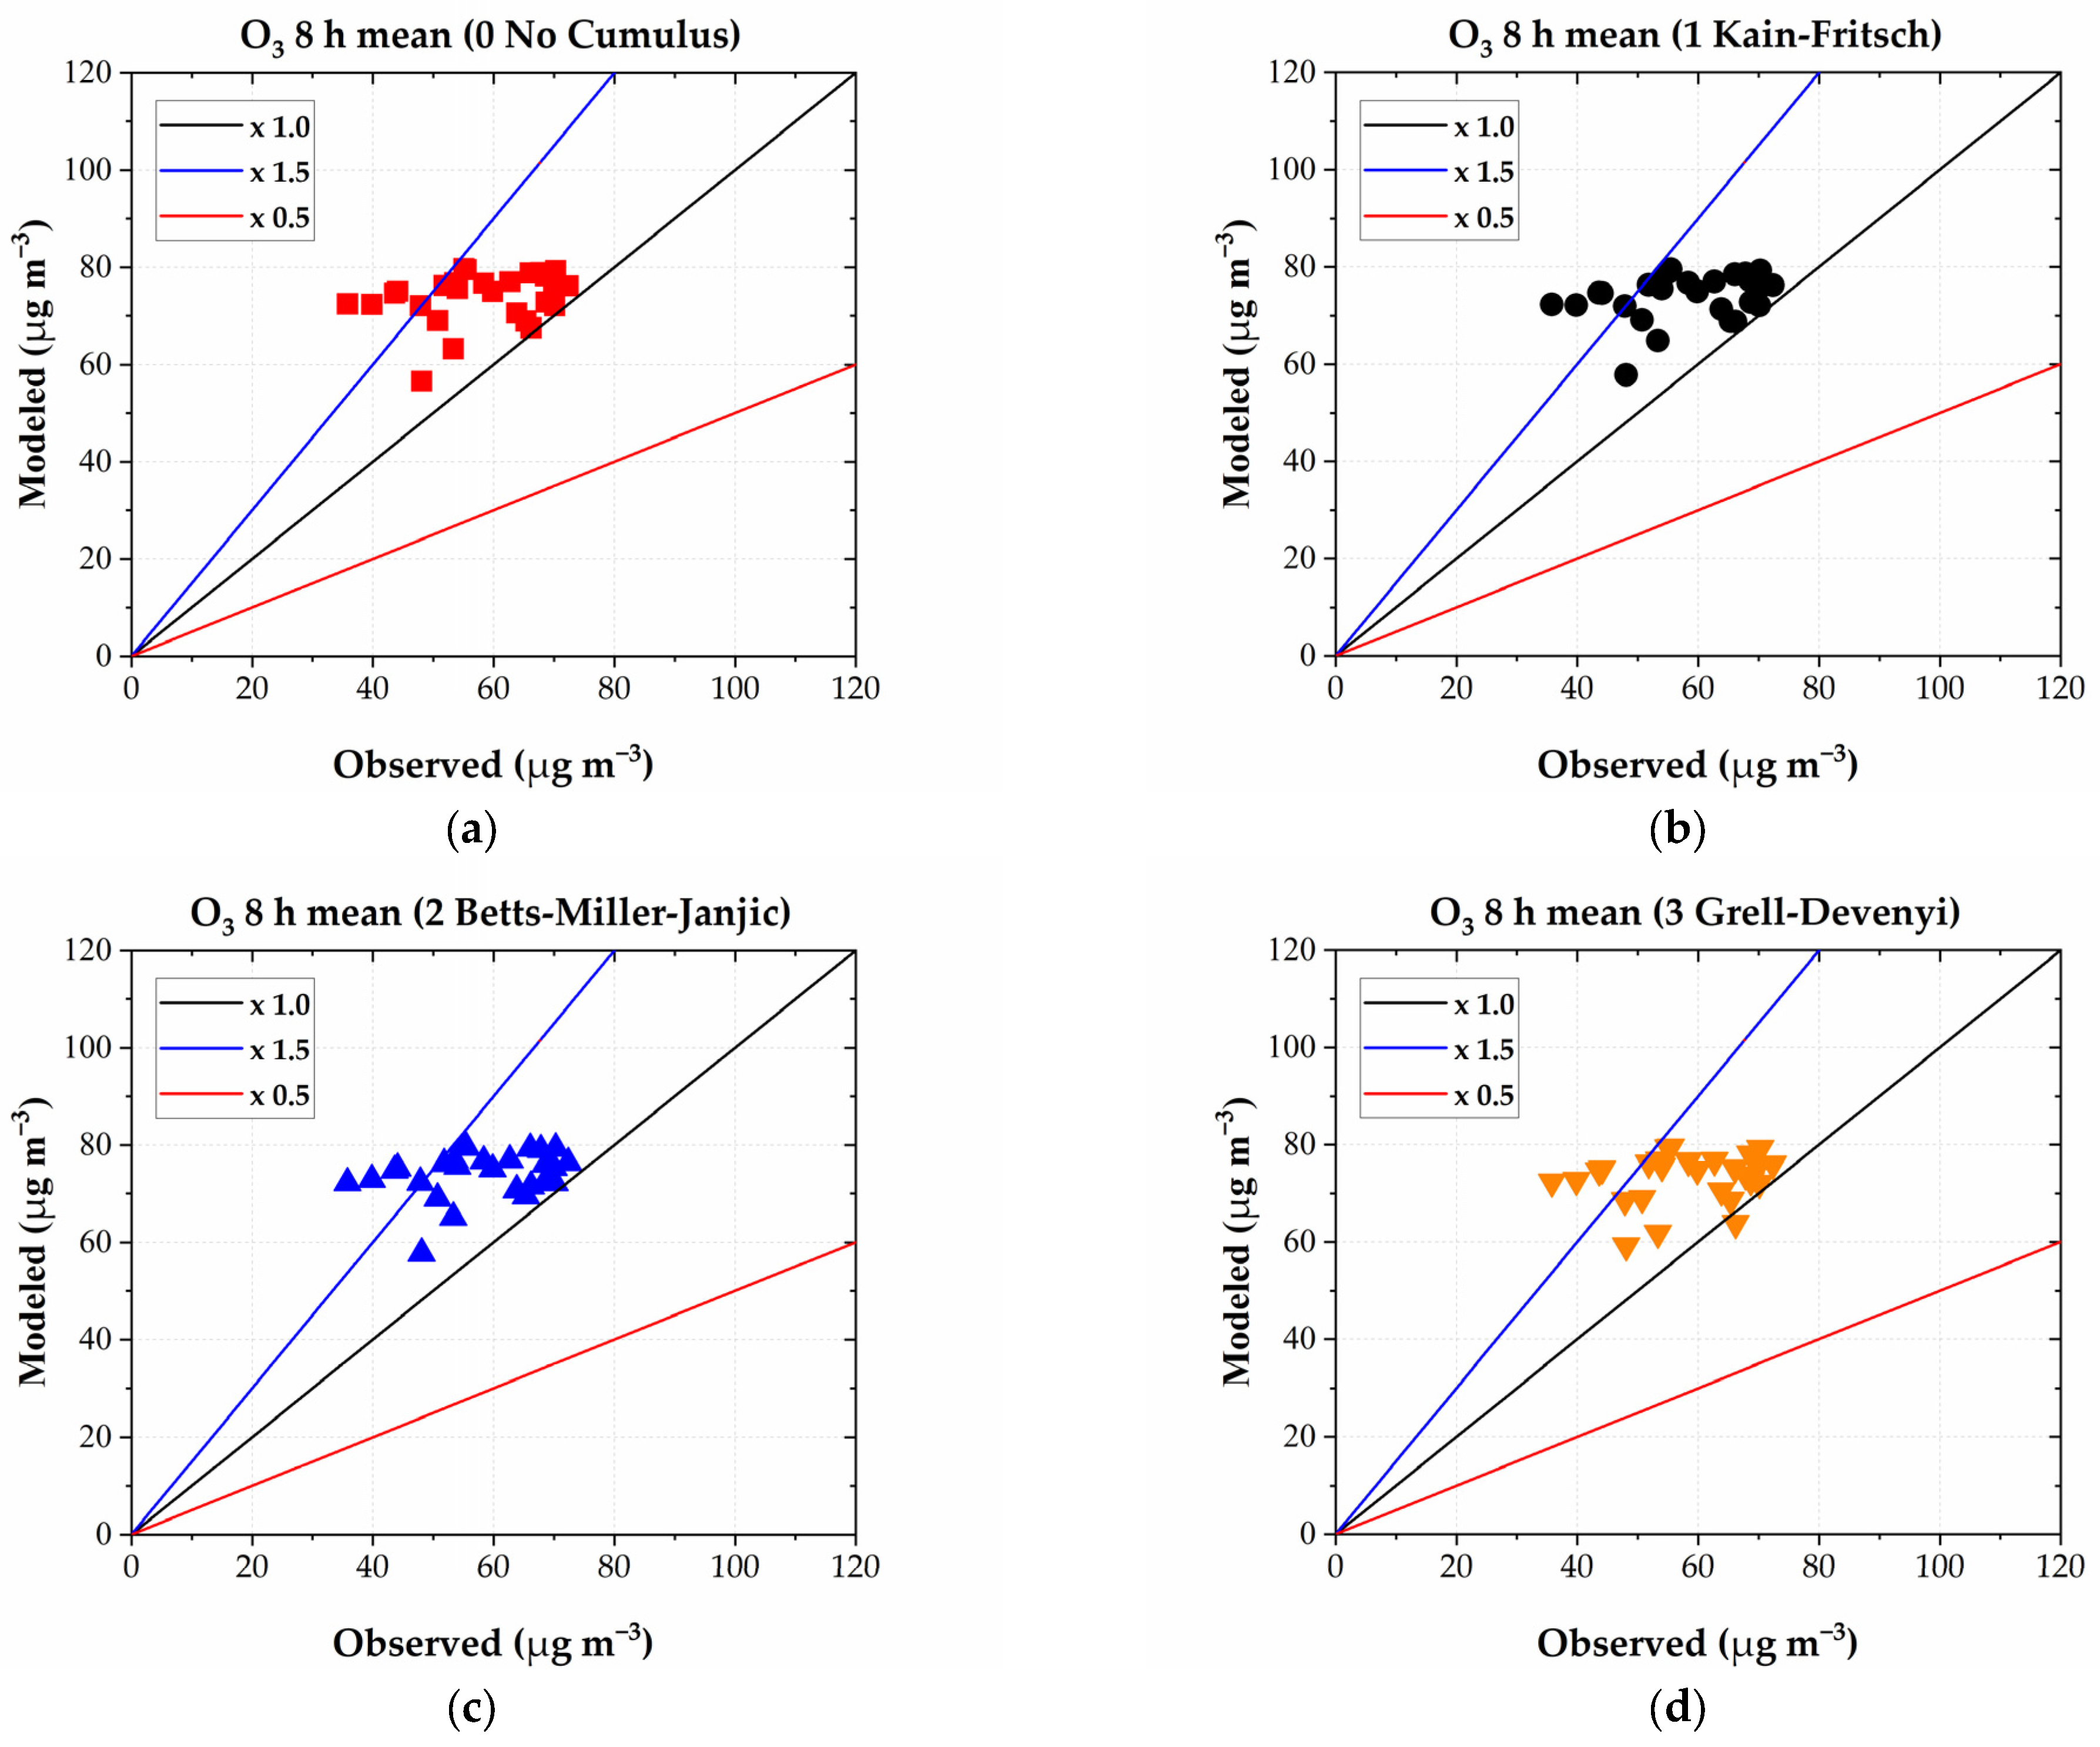
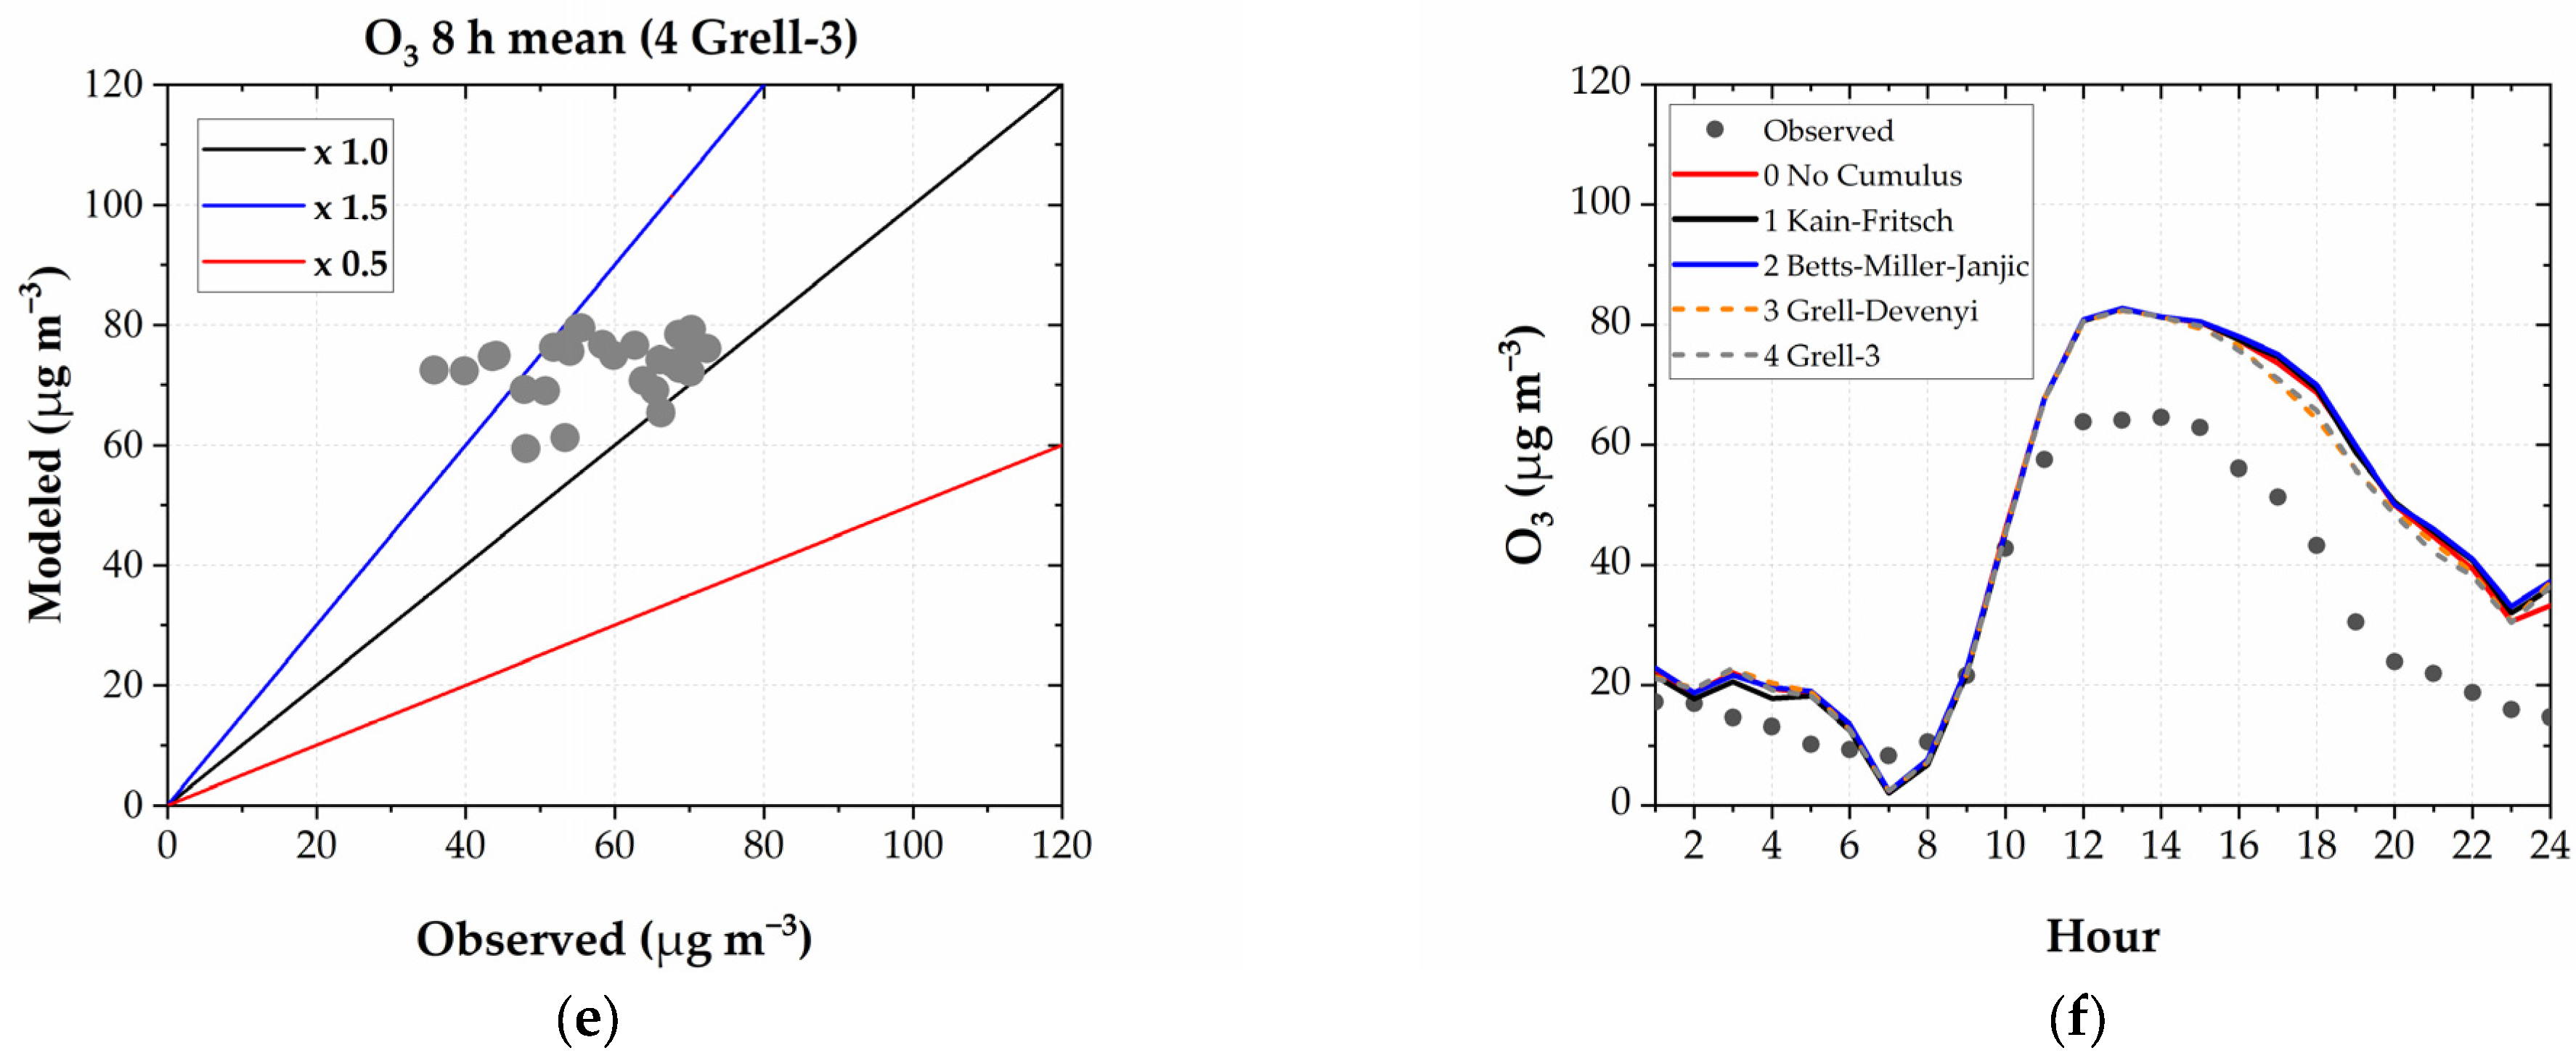
Figure 9.
Passive stations: Observed versus modeled monthly means concentrations: (a) NO2 and (b) O3.
Figure 9.
Passive stations: Observed versus modeled monthly means concentrations: (a) NO2 and (b) O3.
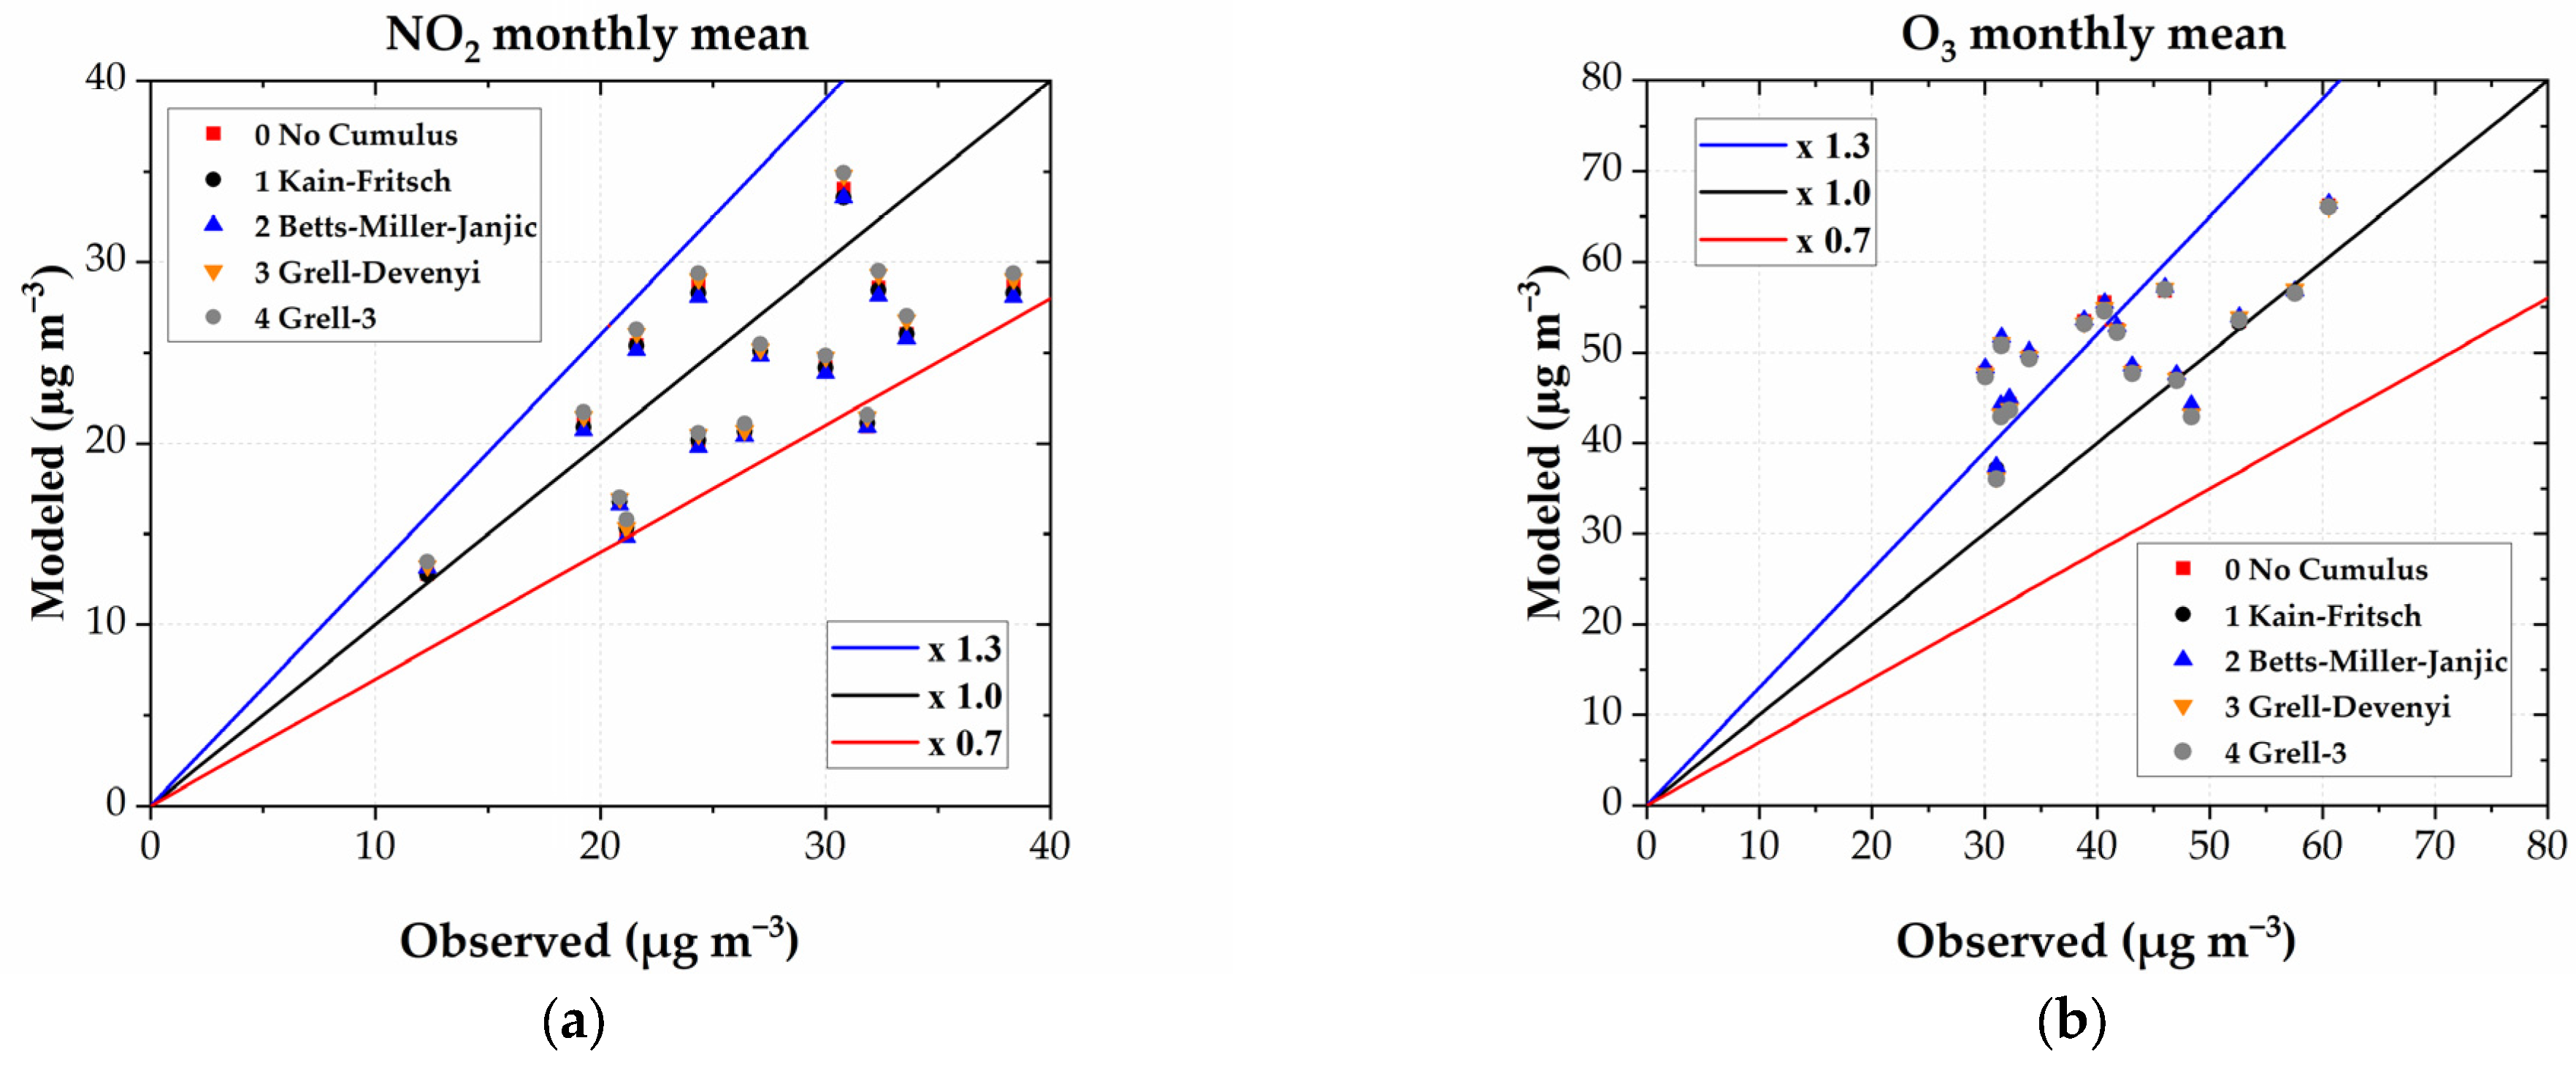
Table 1.
Cumulus options in the WRF-Chem V3.2, based on [8].
Table 1.
Cumulus options in the WRF-Chem V3.2, based on [8].
| Option | Nomenclature | Cloud Detrainment | Type | Closure |
|---|---|---|---|---|
| 0 | 0 No Cumulus | |||
| 1 | 1 Kain-Fritsch | Yes | Mass flux | Convective Available Potential Energy (CAPE) removal |
| 2 | 2 Betts-Miller-Janjic | No | Adjustment | Sounding adjustment |
| 3 | 3 Grell-Devenyi | Yes | Mass flux | Various |
| 5 | 4 Grell-3 | Yes | Mass flux | Various |
Table 2.
Meteorological stations and parameters used in this study.
| Station | Nomenclature | Entity | masl | Parameters |
|---|---|---|---|---|
| Municipio | MUN | EMOV EP | 2582 | Temperature, wind speed and direction, solar radiation, rainfall |
| Sayausí | SAY | ETAPA EP | 2622 | Temperature, rainfall |
| Mamamag | MAM | ETAPA EP | 3609 | Temperature, rainfall |
| Ventanas | VEN | ETAPA EP | 3944 | Temperature, rainfall |
| Izhcairrumi | IZH | ETAPA EP | 3018 | Temperature, rainfall |
| Soldados | SOL | ETAPA EP | 3466 | Temperature, rainfall |
Table 3.
Schemes and options selected for atmospheric modeling in Cuenca (WRF-Chem V3.2).
| Component and WRF-Chem Option Nomenclature | WRF-Chem Option | Model, Description, and References |
|---|---|---|
| Microphysics (mp_physics) | 4 | WRF Single–moment 5–class (Hong et al., 2004) [27] |
| Longwave Radiation (ra_lw_physics) | 1 | RRTM (Mlawer et al., 1997) [28] |
| Shortwave Radiation (ra_sw_physics) | 2 | Goddard (Chou and Suarez, 1999) [29] |
| Surface Layer (sf_clay_physics) | 1 | MM5 similarity (Paulson, 1970) [30] |
| Planetary Boundary Layer (bl_pbl_physics) | 1 | Yonsei University (Hong et al., 2006) [31] |
| Cumulus Parameterization (cu_physics) |
0 | 0 No Cumulus |
| 1 | 1 Kain-Fritsch [12] | |
| 2 | 2 Betts-Miller-Janjic [13,14] | |
| 3 | 3 Grell-Devenyi [15] | |
| 5 | 4 Grell-3 [15,16] | |
| Options of chemical mechanisms and aerosol modules (chem_opt) | 7 | CBMZ (Zaveri and Peters, 1999) and MOSAIC (4 sectional aerosol bins) (Zaveri et al., 2008) [25,26] |
| Land Surface (sf_surface_physics) | 2 | (Chen and Dudhia, 2001) [32] |
| Urban surface (sf_urban_physics) | 0 | No urban physics |
| Variable | Metric | Benchmark or Ideal Value |
Accuracy |
|---|---|---|---|
| Hourly surface temperature | GE | <2 °C | ±2 °C |
| MB | <±0.5 °C | ||
| IOA | ≥0.8 | ||
| Hourly wind speed (10 mas) | RMSE | <2 m s−1 | ±1 m s−1 |
| MB | <±0.5 m s−1 | ||
| IOA | ≥0.6 | ||
| Hourly wind direction (10 mas) | GE | <30° | ±30° |
| MB | <±10° | ||
| Short-term air quality: Maximum 1 h CO mean, maximum 8 h CO mean, 24 h PM2.5 mean, maximum 8 h O3 mean | MB | 0 | ±50% |
| RMSE | 0 | ||
| FB | 0 | ||
| MNB | 0 | ||
| r | 1 | ||
| Long-term air quality: NO2 and O3 | ±30% |
Table 5.
Metrics for the meteorological modeling. Bold numbers indicate values in the benchmark ranges. MUN station.
Table 5.
Metrics for the meteorological modeling. Bold numbers indicate values in the benchmark ranges. MUN station.
| Cumulus Option: |
0 No Cumulus | 1 Kain-Fritsch | 2 Betts-Miller-Janjic | 3 Grell–Devenyi | 4 Grell-3 | Benchmark |
|---|---|---|---|---|---|---|
| Hourly surface temperature: | ||||||
| GE | 1.3 | 1.3 | 1.3 | 1.3 | 1.3 | <2 °C |
| MB | 0.2 | 0.2 | 0.2 | 0.1 | 0.1 | <±0.5 °C |
| IOA | 0.9 | 0.9 | 0.9 | 0.9 | 0.9 | ≥0.8 |
| Hourly wind speed: | ||||||
| RMSE | 1.0 | 1.0 | 1.0 | 0.9 | 0.9 | <2 m s−1 |
| MB | 0.4 | 0.4 | 0.4 | 0.2 | 0.2 | <±0.5 m s−1 |
| IOA | 0.8 | 0.8 | 0.8 | 0.9 | 0.9 | ≥0.6 |
| Hourly wind direction: | ||||||
| GE | 63.5 | 62.2 | 62.4 | 61.7 | 61.9 | <30° |
| MB | -23.5 | -23.5 | -23.9 | -20.5 | -20.8 | <±10° |
Table 6.
Metrics for the meteorological modeling. Bold numbers indicate values in the benchmark ranges—other stations.
Table 6.
Metrics for the meteorological modeling. Bold numbers indicate values in the benchmark ranges—other stations.
| Cumulus Option: |
0 No Cumulus | 1 Kain-Fritsch | 2 Betts-Miller-Janjic | 3 Grell–Devenyi | 4 Grell-3 | Benchmark |
|---|---|---|---|---|---|---|
| Hourly surface temperature: SAY station | ||||||
| GE | 1.8 | 1.7 | 1.7 | 1.8 | 1.8 | <2 °C |
| MB | -1.2 | -1.2 | -1.2 | -1.3 | -1.3 | <±0.5 °C |
| IOA | 0.9 | 0.9 | 0.9 | 0.9 | 0.9 | ≥0.8 |
| Hourly surface temperature: MAM station | ||||||
| GE | 2.0 | 2.0 | 2.0 | 2.0 | 2.0 | <2 °C |
| MB | -1.8 | -1.7 | -1.7 | -1.7 | -1.7 | <±0.5 °C |
| IOA | 0.8 | 0.8 | 0.8 | 0.8 | 0.8 | ≥0.8 |
| Hourly surface temperature: VEN station | ||||||
| GE | 1.1 | 1.1 | 1.1 | 1.1 | 1.1 | <2 °C |
| MB | 0.0 | 0.1 | 0.1 | 0.0 | 0.0 | <±0.5 °C |
| IOA | 0.9 | 0.9 | 0.9 | 0.9 | 0.9 | ≥0.8 |
| Hourly surface temperature: IZH station | ||||||
| GE | 1.2 | 1.2 | 1.2 | 1.2 | 1.2 | <2 °C |
| MB | -0.2 | -0.2 | -0.1 | -0.2 | -0.2 | <±0.5 °C |
| IOA | 0.9 | 0.9 | 0.9 | 0.9 | 0.9 | ≥0.8 |
| Hourly surface temperature: SOL station | ||||||
| GE | 2.3 | 2.3 | 2.3 | 2.3 | 2.3 | <2 °C |
| MB | -1.7 | -1.7 | -1.7 | -1.8 | -1.8 | <±0.5 °C |
| IOA | 0.8 | 0.8 | 0.8 | 0.8 | 0.8 | ≥0.8 |
Table 7.
Percentages of the records captured by modeling. Meteorological variables. Bold numbers highlight the schemes with the best performances. MUN station.
Table 7.
Percentages of the records captured by modeling. Meteorological variables. Bold numbers highlight the schemes with the best performances. MUN station.
| Cumulus Option: | 0 No Cumulus | 1 Kain-Fritsch | 2 Betts-Miller-Janjic | 3 Grell–Devenyi | 4 Grell-3 | Records |
|---|---|---|---|---|---|---|
| Hourly surface temperature | 77.8 | 78.7 | 78.1 | 77.0 | 78.0 | 644 |
| Hourly wind speed | 73.9 | 74.1 | 73.8 | 77.0 | 76.9 | 644 |
| Hourly wind direction | 36.6 | 37.1 | 37.0 | 37.9 | 37.1 | 644 |
| Daily rainfall | 77.8 | 70.4 | 63.0 | 66.7 | 63.0 | 27 |
| Average | 66.5 | 65.1 | 62.9 | 64.6 | 63.7 |
Table 8.
Percentages of hourly temperature and daily precipitation records captured by modeling. Bold numbers highlight the schemes with the best performances.
Table 8.
Percentages of hourly temperature and daily precipitation records captured by modeling. Bold numbers highlight the schemes with the best performances.
| Station | 0 No Cumulus | 1 Kain-Fritsch | 2 Betts-Miller-Janjic | 3 Grell–Devenyi | 4 Grell-3 | Records |
|---|---|---|---|---|---|---|
| Hourly surface temperature | ||||||
| SAY | 62.7 | 63.2 | 63.0 | 62.3 | 61.8 | 644 |
| MAM | 58.1 | 60.1 | 59.8 | 58.2 | 57.3 | 644 |
| VEN | 83.2 | 83.9 | 83.2 | 85.4 | 85.2 | 644 |
| IZH | 81.4 | 81.2 | 81.1 | 82.0 | 80.9 | 644 |
| SOL | 43.8 | 43.3 | 46.1 | 42.7 | 43.5 | 644 |
| Daily rainfall | ||||||
| SAY | 63.0 | 59.3 | 55.6 | 63.0 | 63.0 | 27 |
| MAM | 59.3 | 74.1 | 63.0 | 55.6 | 63.0 | 27 |
| VEN | 70.4 | 70.4 | 63.0 | 66.7 | 66.7 | 27 |
| IZH | 59.3 | 55.6 | 48.1 | 63.0 | 63.0 | 27 |
| SOL | 74.1 | 66.7 | 77.8 | 74.1 | 66.7 | 27 |
Table 9.
Rainfall records and modeled values from 1 to 27 Sep 2014. Bold numbers indicate the options with differences lower than 50%.
Table 9.
Rainfall records and modeled values from 1 to 27 Sep 2014. Bold numbers indicate the options with differences lower than 50%.
| Station | Records | 0 No Cumulus | 1 Kain-Fritsch | 2 Betts-Miller-Janjic | 3 Grell–Devenyi | 4 Grell-3 |
|---|---|---|---|---|---|---|
| Total rainfall (records, mm) | ||||||
| MUN | 36.7 | 31.9 | 39.4 | 42.7 | 94.2 | 119.8 |
| SAY | 55.8 | 39.7 | 103.1 | 100.3 | 160.4 | 186.8 |
| MAM | 77.8 | 108.5 | 128.9 | 81.8 | 110.5 | 127.5 |
| VEN | 49.9 | 154.9 | 141.5 | 105.5 | 80.2 | 85.5 |
| IZH | 56.7 | 135.2 | 147.0 | 119.8 | 112.4 | 124.0 |
| SOL | 54.7 | 106.2 | 113.2 | 77.4 | 86.4 | 104.8 |
| (Total modeled rainfall – Total rainfall)/(Total rainfall)*100 | ||||||
| MUN | -13.2 | 7.3 | 16.3 | 156.6 | 226.3 | |
| SAY | -28.8 | 84.8 | 79.7 | 187.5 | 234.7 | |
| MAM | 39.4 | 65.7 | 5.2 | 42.0 | 63.9 | |
| VEN | 210.4 | 183.6 | 111.3 | 60.6 | 71.4 | |
| IZH | 138.5 | 159.2 | 111.4 | 98.3 | 118.7 | |
| SOL | 94.1 | 107.0 | 41.6 | 58.0 | 91.5 | |
Table 10.
Metrics for short-term air quality modeling. Bold numbers highlight the schemes with the best performances.
Table 10.
Metrics for short-term air quality modeling. Bold numbers highlight the schemes with the best performances.
| Cumulus Option: | 0 No Cumulus | 1 Kain-Fritsch | 2 Betts-Miller-Janjic | 3 Grell–Devenyi | 4 Grell-3 | Ideal Value |
|---|---|---|---|---|---|---|
| Maximum 1 h CO mean: | ||||||
| MB | 0.10 | 0.11 | 0.08 | 0.11 | 0.10 | 0 |
| RMSE | 0.55 | 0.55 | 0.54 | 0.57 | 0.56 | 0 |
| FB | 5.6 | 6.5 | 4.6 | 6.5 | 6.1 | 0 |
| MNB | 7.09 | 8.55 | 6.35 | 9.11 | 8.42 | 0 |
| r | 0.47 | 0.45 | 0.46 | 0.38 | 0.41 | 1 |
| Maximum 8 h CO mean: | ||||||
| MB | -0.08 | -0.08 | -0.09 | -0.08 | -0.08 | 0 |
| RMSE | 0.20 | 0.20 | 0.20 | 0.21 | 0.20 | 0 |
| FB | -10.4 | -10.2 | -11.1 | -9.8 | -9.9 | 0 |
| MNB | -9.56 | -9.20 | -10.04 | -8.67 | -8.81 | 0 |
| r | 0.45 | 0.43 | 0.43 | 0.38 | 0.39 | 1 |
| 24 h PM2.5 mean: | ||||||
| MB | 1.02 | 1.05 | 0.87 | 1.17 | 1.17 | 0 |
| RMSE | 3.16 | 3.16 | 3.10 | 3.22 | 3.25 | 0 |
| FB | 14.9 | 15.2 | 12.8 | 16.8 | 16.8 | 0 |
| MNB | 41.76 | 42.19 | 39.08 | 44.95 | 45.73 | 0 |
| r | 0.07 | 0.06 | 0.05 | 0.04 | 0.01 | 1 |
| Maximum 8 h O3 mean: | ||||||
| MB | 15.86 | 15.92 | 16.09 | 15.29 | 15.29 | 0 |
| RMSE | 18.83 | 18.80 | 18.93 | 18.54 | 18.51 | 0 |
| FB | 24.1 | 24.2 | 24.4 | 23.3 | 23.3 | 0 |
| MNB | 31.50 | 31.61 | 31.92 | 30.61 | 30.61 | 0 |
| r | 0.26 | 0.28 | 0.28 | 0.19 | 0.20 | 1 |
Table 11.
Percentages of the records that were captured by modeling. Air quality variables. Bold numbers highlight the schemes with the best performances.
Table 11.
Percentages of the records that were captured by modeling. Air quality variables. Bold numbers highlight the schemes with the best performances.
| Cumulus Option: | 0 No Cumulus | 1 Kain-Fritsch | 2 Betts-Miller-Janjic | 3 Grell–Devenyi | 4 Grell-3 | Records |
|---|---|---|---|---|---|---|
| Short-term air quality: | ||||||
| Max. 1 h CO mean | 96.3 | 96.3 | 88.9 | 92.6 | 92.6 | 27 |
| Max. 8 h CO mean | 96.3 | 100.0 | 96.3 | 100.0 | 100.0 | 27 |
| 24 h PM2.5 mean | 63.0 | 63.0 | 63.0 | 63.0 | 63.0 | 27 |
| Max. 8 h O3 mean | 81.5 | 81.5 | 81.5 | 85.2 | 85.2 | 27 |
| Average: | 84.3 | 85.2 | 82.4 | 85.2 | 85.2 | |
| Long-term air quality: | ||||||
| NO2, monthly mean | 93.3 | 93.3 | 93.3 | 93.3 | 93.3 | 15 |
| O3, monthly mean | 56.3 | 56.3 | 56.3 | 56.3 | 56.3 | 16 |
| Average: | 74.8 | 74.8 | 74.8 | 74.8 | 74.8 | |
Disclaimer/Publisher’s Note: The statements, opinions and data contained in all publications are solely those of the individual author(s) and contributor(s) and not of MDPI and/or the editor(s). MDPI and/or the editor(s) disclaim responsibility for any injury to people or property resulting from any ideas, methods, instructions or products referred to in the content. |
© 2024 by the authors. Licensee MDPI, Basel, Switzerland. This article is an open access article distributed under the terms and conditions of the Creative Commons Attribution (CC BY) license (http://creativecommons.org/licenses/by/4.0/).
Copyright: This open access article is published under a Creative Commons CC BY 4.0 license, which permit the free download, distribution, and reuse, provided that the author and preprint are cited in any reuse.


