
Submitted:
20 September 2024
Posted:
23 September 2024
You are already at the latest version
Abstract
We assessed machine learning techniques (MLTs) for downscaling global climate model’s precipitation to local level in Bolivia. The skill, assumptions and uncertainty of the process are analyzed. Additionally, future projections are delivered. For that, an ensemble of 20 global climate models (GCMs) from CMIP6, with random forest (RF) and support vector machines (SVM), is used on four zones (highlands, Andean slopes, Amazon lowlands and Chaco lowlands). The downscaled series’ skill is evaluated in terms of relative errors. The uncertainty is analyzed through variance decomposition. MLTs’ skill is adequate in most cases, especially for the highlands and the Andean slopes. Moreover, RF tends to outperform SVM. Stationary assumptions are robust in the highlands and Andean slopes. Perfect prognosis assumption is poor in the highlands and Andean slopes; topographical complexity appears to be the reason. Regarding uncertainties, MLTs are the dominant source. In future projections, the highlands show shorter dry spell lengths with more frequent but less intense high rainfall events and higher annual rainfall. The Andean slopes exhibit an increased annual rainfall with a reduction in the high precipitation intensities but an increased frequency. The Amazon lowlands present a decrease in annual rainfall, and the Chaco lowlands an increase.
Keywords:
Climate Change
; Precipitation
; Statistical Downscaling
; Machine Learning
; Uncertainty
; The Andes
1. Introduction
It is not new that climate variability affects human and natural ecosystems, which are believed to be altered by climate change [1]. These changes, especially in climatic extremes, will translate into societal risks. It is widely known that precipitation directly influences drought and flood episodes. The examples of recent disaster events around the world, e.g., the bushfires in Australia caused partially as a consequence of severe droughts [2] or the mudslides due to high precipitation extremes in Brazil [3], are some of the warnings about our vulnerability as societies regarding climatic extremes.
The focus region of this study, Bolivia, is no exception. Bolivia is a country that depends highly on agriculture. Hence, how climate change will affect droughts is crucial. Moreover, around 66% of the region is prone to flooding [4], and the biggest cities do not have robust infrastructure to cope with flooding episodes. The most recent notorious flood and drought events were in 2002, 2006-2007, 2007-2008 and 2009-2010, with estimated economic consequences of around 1244 million American dollars [4]. Besides that, the World Bank [5] noted Bolivia as highly vulnerable to climate change. In their study, the estimated disaster deficit index (DDI), a ratio of the potential economic loss caused by a natural disaster to the country’s economic resilience, is about 1.47. The latter number can be translated into a lack of ability to cope with extremes [6]. In this sense, natural hazards enhanced by climate change would significantly impact ecological systems and socio-economic sectors. Therefore, investigating the possible changes in flood and drought events at the local level is required.
The primary information to study the impacts of climate change is provided by global climate models, commonly known as GCMs [7,8]. However, an increased resolution is required for studies at the local level. One possibility is to perform statistical downscaling by establishing relations between the large-scale climate and local observations. Its use has many advantages, for instance, low computational costs and large climate model ensembles. The latter takes importance as considering climate model ensembles is advised to account for the uncertainties [9,10]. However, one has to consider that the statistical downscaling methods (SDMs) contain drawbacks and assumptions that need to be studied before their application for impact studies. These generally depend on the type of SDM used. In the literature, various types of SDM have been tested, including machine learning methodologies. Machine learning is known for its good performance on complex non-linear problems, and it has been proven that they can work in climate change context [11,12,13,14,15,16] and in studying extremes for satellite estimates [17,18]. However, it remains unclear if they can be used for assessing extremes in climate change context.
The problem is that the architectures cannot be calibrated directly for the GCMs; hence, they must be calibrated between observations (local scale) and re-analysis (large scale). Then, a bias correction is performed by comparing GCMs and re-analysis to apply the derived architecture to the GCMs. This represents a drawback: the prior correction of the GCMs will enlarge the uncertainties due to the addition of another step in the cascade [19]. There are some ways to gap this, for instance, constructing a machine learning methodology that performs an advanced bias correction technique. In this sense, we avoid enlarging the cascade of uncertainties since the advance bias correction will function as a downscaling technique.
Moreover, no matter how we build the methodologies, they will have two important assumptions: The statistical relations are invariant in time and under different forcing conditions. These are crucial, and many studies have demonstrated violations of these assumptions. For instance, violations of the stationary assumptions by implementing a perfect model experimental design on empirical statistical downscaling (ESD) methods were found [20]. However, this was demonstrated to depend on the season and geographical location. Vrac et al. [8] used a nonhomogeneous stochastic weather typing (NSWT) method and regional climate models as pseudo-reality to evaluate the stationary assumptions. They found that the relations are affected by the forcing conditions, i.e., the relations might not remain invariant under different forcing conditions. Besides the fact that these assumptions are difficult to investigate as future observations are unavailable, the studies that performed this evaluation using machine learning techniques are rare.
This work aims to evaluate the skill and assumptions of two machine learning techniques, dividing the observations into two large periods. Then, significant changes in impact-related research indicators (RIs) are projected to understand how future climate might shape floods and droughts in the region. RIs representing the climate conditions for floods and drought are used for that. Moreover, four future scenarios from the state of art GCMs (CMIP6) are analysed in the projections. The uncertainty share from the SDMs is also investigated to obtain insights in the relative contribution to the total uncertainty in the study.
The paper is structured as follows: Section 2 describes the study area, the data, the extreme indices, the downscaling methods and the methodologies used for the evaluation of the downscaling methods; in Section 3, the results are presented; Section 4 discusses the results; finally, Section 5 presents the conclusions.
2. Materials and Methods
2.1. Study Area
Located in the centre of South America, Bolivia is a country with large variations in topography. Some regions are as high as 6500 MSL, contrasted with others with less than 800 MSL (Figure 1). It also contains much diversity in ecosystems and landscapes. These factors shape the temperature and precipitation of the different regions in the country. A standard classification of the different zones in the country in terms of altitudes is [21]: the lowlands (<800 MSL), the Andean slopes (between 800 to 3200 MSL) and the highlands (between more than 3200 to 6500 MSL). Although the climatic conditions can be highly different within each zone, some common characteristics exist.
The lowlands contain high humidity percentages with medium to high temperatures, and the precipitations range from 1000 to 2000 mm per year. Note that this is a generalization as the lowlands system is highly complex. For instance, the zone contains two different climates, with some important differences: the Amazon in the north and the Chaco y Pantanal in the south, with tropical and steppe climates, respectively. The Andean slopes represent the zones between the Andean valleys and the transitions from the Andes to the lowlands. The temperatures tend to be moderate, and the precipitation varies from low precipitation rates up to more than 2000 mm per year. The highlands are characterized by low temperatures (10 °C mean annual temperature) and perpetual snow in the highest points. The solar radiation is intense but does not increase the temperatures as there is little moisture to carry the energy through the air. The precipitation varies from 200 to 500 mm per year, but the southwest part of the highlands contains precipitation lower than 200 mm per year [22].
This heterogeneity makes the analysis of climate change more challenging but also interesting. The different zones required a specific investigation as the analysis in one of the zones might not be valid in the others. Therefore, we analyzed the SDMs in 13 locations in Bolivia (Figure 1). These locations are contained within each zone: (i) the Amazon lowlands, represented with five stations, (ii) the Chaco lowlands, with two stations, (iii) the Andean slopes, with three stations and (iv) the highlands, with three stations. Table 1 shows the stations and their coordinates. The stations from this work are used to monitor meteorological conditions in the airports of different cities and small towns, making the stations’ data highly reliable.
2.2. Observed Series and Re-Analysis
This work uses 13 stations representing each zone (Amazon lowlands, Chaco lowlands, Andean slopes and highlands). The stations belong to the Bolivian national service of meteorology and hydrology (SENAMHI). Moreover, these are summaries of the data from nearby airports monitoring meteorological conditions. Two periods are used: (i) 1981-2010 for calibration of the downscaling methods and (ii) 1961-1980 for validating the methodologies in terms of relative error and the analysis of their assumptions.
The re-analysis datasets used in this study are the latest product of the European Centre for Medium-Range Weather Forecasts (ECMWF). This version (ERA5) replaces the previously widely known ERA-Interim. The 30 years 1981-2010 are used to calibrate the relations. The re-analysis dataset contains 26 variables on different pressure levels. However, only the most correlated variables are used: total precipitation, specific humidity at 500 hPa, 850 hPa and 1000 hPa. The correlation matrices for each station’s precipitation and the 26 variables (at 500, 850 and 1000 hPa) of ERA5 are presented in the Supplementary Material. The calibration of the relations with re-analysis to later use them on bias-corrected GCMs is common in statistical downscaling studies that use perfect prognosis methodologies [23].
2.3. Global Climate Models
An ensemble of 20 global climate models from the CMIP6 era is used. The variables are precipitation and specific humidity at 500 hPa, 850 hPa and 1000 hPa. These variables are chosen since they contain the highest correlation with the study area stations and are the same variables used in the re-analysis dataset. The correlation matrices for each station are presented in the Supplementary Material. Table 2 presents the climate models used in this study.
2.4. Research Indicators
This work uses the Expert Team on Climate Change Detection and Indices (ETCCDI) indices, regarded here as research indicators (RIs), to address the analysis of the methodologies and the associated Climate Change Signal (CCS). The indices are known worldwide and are commonly applied in the community. Not all the indices are used, but the ones we consider suitable for impact analysis on hydrological extremes. More precisely, the RIs considered are: the summer precipitation (R1), the spring precipitation (R2), the autumn precipitation (R3), the winter precipitation (R4), the maximum length of the dry spells (R5), the annual precipitation (R6), the maximum daily precipitation of a 30-year return period (R7), the maximum daily precipitation of a 10-year return period (R8), the annual number of days with precipitation greater than 10 mm (R9), the annual number of days with precipitation greater than 20 mm (R10) and the annual number of days with precipitation greater than 30 mm (R11). Note that R1, R2, R3, R4 and R6 denote only precipitation accumulation; however, they are important for drought analysis, especially R6. By including this set of impact-related indicators, one can have an idea about the local impacts of climate change on the hydrological extremes. Table 3 presents a summary of these indices and some important characteristics.
2.5. Machine Learning Techniques
Two machine learning methodologies were chosen to perform statistical downscaling: random forest and support vector machines. This work refers to random forest and support vector machines as SD-ML-4 and SD-ML-5, respectively. The main reason for investigating machine learning rather than more conventional techniques is the high capacity of the methodologies to learn non-linear relations, a key feature when downscaling precipitation from GCMs. The characteristics of each methodology are presented in this section. Moreover, some general features of the architectures considered for this work and the motivation of the choice is presented.
2.5.1. Random Forest (SD-ML-4)
The use of tree ensemble methods in statistical downscaling is interesting as the choice of the best model or architecture is not “pre-defined”; instead, many well-estimated (data-driven) architectures are built from random samples of the data, and later, the average of all these estimations is regarded as the model architecture. The method proposed by Breiman [24], called random forests, is adopted in this work. The reason for the choice of this specific method among the other “tree ensemble methods” (e.g., Adaboost) is that the methodology is less demanding in computer resources, and at the same time, it helps in determining (data-driven) the important variables for the regression [17]. To build the architecture of the method, the python library “Scikit-learn” [25] is used.
The balance between model complexity and regularization in random forest architectures can be controlled by adjusting five hyperparameters [26]: (i) the number of trees in the forest (), (ii) the maximum depth or levels of each tree (), (iii) the minimum number of data points required to split an internal node (), (iv) the minimum number of data points required to be a leaf node (), and (v) the maximum number of features considered for the best split in the node (). The optimal combination of the parameters is determined with GridSearchCV from sklearn python library. However, we left out since a sensitivity analysis is carried out to determine this parameter. A trial and error procedure is performed, varying from 1 to 50. The outcome of this analysis can be found in the Supplementary Material.
It is important to note that the methodology is designed to converge (in terms of error optimization) with the increase in the number of trees [24]. Hence, the more trees are defined (larger value), the better the model. The only problem with increasing the number of trees is computational time [17]. With all the parameters as default, the change in accuracy from 1 to 500 number of trees was checked. We noticed that after 100, going to a larger number increases the computational time but not the accuracy. Therefore, the range of is limited to 100.
2.5.2. Support Vector Machines (SD-ML-5)
The implementation of this method follows the spirit of quantile mapping parametric approaches but with a modification in the derivation of the transformation functions. Instead of assuming a specific transformation to correct the precipitation quantiles of the coarse scale (global climate models) to the local scale (observations), we construct an architecture with support vector machines to derive the most suitable relation to correct the quantiles. This way, a prior assumption on how the transformation function might look is avoided. The R library “kernlab” is used for this purpose [27].
The kernel-based neural networks, formally called support vector machines (SVMs), were developed to overcome the weaknesses of traditional machine learning implementations [15,28], such as the commonly applied artificial neural networks (ANN). One of the limitations of traditional implementations is that the models tend to find the optimal local solution, not the global one, whereas this limitation is not present in SVMs [28]. Moreover, according to Tripathi et al. [15], SVMs’ model architecture is automatically derived, avoiding the subjectivity that is present in more traditional methodologies (e.g., artificial neural networks). The study also mentions that more flexibility is involved since SVMs can use many kernel functions. A kernel function helps to overcome the problem of high dimensionality, i.e., it is a simple way to translate relations derived in higher dimensions.
There is no consensus on the most suitable kernel for downscaling rainfall; however, previous implementations of this methodology (e.g., [15]) demonstrated that the Gaussian radial basis kernel works fine in downscaling studies. Moreover, the Gaussian radial basis is a general-purpose kernel typically used in works without in-depth prior knowledge about the data [27]. The Gaussian radial basis kernel has two important hyperparameters: the kernel’s width (sigma) and the cost of the error minimisation function (C). Sigma shapes the transfer function, while C helps to prevent a result with the local minima in the optimisation. A sensitivity analysis is done to select the values of the hyperparameters for each station. Different combinations in the range of [0.0001,0.1] and [1,120] for sigma and C, respectively, are tested. Then, the results’ empirical cumulative distribution function (ECDF) is contrasted with the raw GCM series and the observations. The values that give the closest ECDF with respect to the observations are chosen as optimal. The sensitivity analysis is presented in the Supplementary Material.
2.6. Variance Decomposition
The variance decomposition procedure quantifies the different elements and their interactions contributing to the overall uncertainties. For that, the total variance is split into the fractions associated with the GCMs, SSP scenarios and downscaling techniques:
Where is the total variance, is the variance associated to the GCM ensemble, to the different future SSP scenarios, to the different downscaling methods, and , , and to the interactions between the three contributors. Note that if the full variability of all the contributors is summed, the actual result will be larger than the total variance because each contributor contains interactions. Since the focus of this work is the statistical downscaling methodologies, the total contribution from the different techniques is quantified as:
To calculate the terms in Equations (1) and (2), we rely on the analysis of their variance. The procedure must be implemented on all research indicators to analyze the behavior of the uncertainty share under different situations. First, the variance due to only each contributor’s variability is obtained:
Second, the variance due to the interaction between two contributors is calculated:
Lastly, the variance due to the interaction between the three contributors is calculated:
Where the dots represent the averages with respect to the indices they are substituting, i represents the GCMs (i models), j represents the SSP scenarios (j scenarios), and k represents the downscaling methods (k methods); and represent the number of GCMs (20), future scenarios (4) and SDMs (2) used in a downscaling study, respectively. For more information about the procedure, the reader is referred to [29,30,31].
2.7. Significance of the Signal
It is important to study the climate change signal together with its significance. In impact studies, we are interested in how much climate might change and how significant that change is. For that, Tabari et al. [32] propose an interesting approach to compare the derived signal against the natural variability of the climate as seen in the global climate models. More specifically, 25 different runs from CanESM5 (r1i1f1p1, r2 i1f1p1, r3 i1f1p1,…, r25 i1f1p1) are considered to account for the analysis of natural variability (signal-to-noise ratio, S2NR). The several historical experiments of CanESM5 are regarded as a “historical ensemble”. Each run is initialised using different starting conditions (points in the preindustrial historical run). One can assume that the “historical ensemble” represents the model’s internal variability. Therefore, one can calculate the research indicators involved in the analysis with all the runs in the historical period and attribute the differences (noise) to the internal variability of the climate system of CanESM5. This noise is considered “natural variability”.
In this procedure, the climate change signal (), calculated for each relevant statistic, i.e., research indicator () as divided by , is said to be significant if it is sufficiently large compared to the natural variability (S2NR). For that, the null hypothesis () of the Z test considers no significant change or that the S2NR is greater than the change, i.e., the mean of is equal to one. Accepting the null hypothesis will mean that the change is not significant, while rejecting it (accepting the alternative hypothesis ) will mean that the change is significant. The critical value Z from a standard normal distribution corresponding to a significance level of 5% (95% of confidence) is used to test the hypothesis. Hence, if a is greater than 1.96 (critical Z value) the null hypothesis is rejected.
3. Results
3.1. Relative Errors
The results are summarised per zone in order to uncover local behaviour patterns. The (i) highlands, represented by El Alto, Oruro and Potosi stations. (ii) The Andean slopes, represented by Cochabamba, Sucre and Tarija. The (iii) Amazon lowlands are represented by Cobija, Guayaramerin, Rurrenabaque, Trinidad and Trompillo, and (iv) Camiri and Yacuiba represent the Chaco lowlands. The relative errors (a measure of the skill) are obtained by comparing the observations and the downscaled series research indicators obtained from 1961 to 1980. The results are shown as percentages for practical purposes.
3.1.1. The Highlands
Figure 2 shows large relative errors from the GCMs. SDMs’ added value is seen on the three stations and the precipitation amount indicators (R1, R2, R3, and R6) as they reduce the coarse-scale relative error, in many cases below 25%. The small added value seen on R4 is probably due to the low precipitation artifacts in the dry season. The winter precipitation in the zone (dry season) is characterized by a strong water deficit (almost no rain). Hence, the corrections of the SDMs might not be too effective.
Regarding the intensities of high extremes (R8), the GCMs reasonably capture the events and added value from the SDMs is seen only on El Alto and Oruro stations. For the case of high extreme event occurrence (R9 and R10), the methodologies correct the values to less than 25% in most cases. SD-ML-5 seems to outperform SD-ML-4 in correcting the occurrence of the highest events. As a summary, the relative errors of the downscaled results (medians) in all the research indicators except R4 (winter precipitation) and R11(annual count of days with precipitation greater than 30 mm) are less than 50%. Since most of the time the GCMs contain errors larger than 50%, this is clear evidence of added value (good skill) from both methodologies.
3.1.2. The Andean Slopes
Figure 3 shows the relative errors in the stations of the Andean slopes. Again, similar patterns are seen in the relative errors of the coarse scale (raw GCM outputs), except for Cochabamba, in which the relative errors are larger than 200% for R2, R3, R4 and R6. In the mentioned indicators, the correction of the SDMs brings the indicators to less than 50% of relative error except for R4 (winter precipitation). However, despite the large relative error in R4, the added value of the methodologies is clear. Tarija station shows slightly different patterns, with larger relative error and a larger interquartile range (more variability). Compared to Cochabamba and Sucre stations (where in most cases, the relative errors are below 25%), many indicators show relative errors larger than 50%. The zone stations generally show small relative errors (less than 50%) in R5 and R8, with smaller variability (smaller interquartile range) compared to the raw outputs except for SD-ML-5 for R8 in Tarija. This is important to emphasise since R5 and R8 denote the maximum length of the dry spells and the daily precipitation intensity for a 10-year return period, respectively, which are the most representative indicators for droughts and floods in this work.
3.1.3. The Amazon Lowlands
The GCMs generally show good skill in this zone (Figure 4). The majority of the relative errors for the indicators are below 50%. Hence, the added value from the SDMs is more difficult to investigate, and sometimes there is none (raw GCM data has a similar skill or is a better predictor). However, looking in detail at Figure 4, one can notice that the SDMs perform well in R8 by reducing the relative error of the GCMs to less than 25%. For the mentioned indicator, SD-ML-4 shows a better downscaling in Guayaramerin, Rurrenabaque, Trinidad and Trompillo, while SD-ML-5 in Cobija. Regarding winter precipitation (R4), the results show poor skill (no added value) in Cobija, Rurrenabaque and Guayaramerin, while in Trinidad and Trompillo SD-ML-4 contain reliable downscaled results with a median relative error of around 25%. Except for Cobija, SD-ML-4 outperforms SD-ML-5 in R5 (maximum length of the dry spells). Interestingly in Cobija, the opposite happens in R8 (10-year return period precipitation). In all cases of high precipitation occurrence (R9, R10 and R11), both methodologies reduce the median relative error to less than 50%.
3.1.4. The Chaco Lowlands
The Chaco lowlands present a non-clear pattern for the zone (Figure 5). For instance, the GCMs in Yacuiba seem to have better skills than those in Camiri. Moreover, the added value of the methodologies (reduction of the coarse-scale relative error) seems more clear in Camiri than in Yacuiba. In fact, there are large coarse-scale relative error reductions in Camiri (in many cases, even the IQR is below 25% of relative error). However, regarding the more extreme events, the added value is only evident in Yacuiba for R5 with SD-ML-5 and R8 with SD-ML-4. In the occurrence of high events, both methodologies show added value in Camiri. R2 (spring precipitation) is the indicator with the largest coarse-scale relative error in both stations in the zone. For this case, specially SD-ML-4 shows added value.
3.2. Uncertainty Contribution from the SDMs
The work of Räty et al. [33] suggested that reliable downscaling studies must include the SDMs’ uncertainty contribution and many downscaling methods. Following that line, the uncertainty contribution from the downscaling methodologies is quantified by variance decomposition. Moreover, similar to the relative errors (skill) of the SDMs, the results are presented per zone. The uncertainty is calculated with all research indicators and the four future scenarios. Note that the SDMs’ uncertainty share results and relative errors must be combined to analyse the robustness of future projections.
In the highlands, the uncertainty share of the SDMs is dominant (Figure 6). The contribution from the GCMs rise in Oruro, especially for R10 and R11 (indicators of occurrence of high extreme events) to about 20.4% and 41.8%, respectively, but the contribution remains small compared to the SDMs. Moreover, the future scenarios are the second largest contributors.
The Andean slopes, especially Sucre and Tarija stations, show a similar pattern to the previous zone (Figure 7). One can see a notorious increase in the GCMs’ uncertainty share for Cochabamba station, up to 80.8% in R1. Differently from Sucre and Tarija, Cochabamba shows a large increase in R7-R9, which are indicators of extreme intensities. It is interesting to notice that the increase in the GCMs’ uncertainty share is attached to the high precipitation intensities because one would expect the highest contribution of the SDMs where large corrections have been made. Hence, in Sucre and Tarija, the SDMs’ corrections in high precipitation intensities seem larger than in Cochabamba. Apart from the mentioned indicators, the highest contributor to the uncertainties in the zone seems the SDMs. Another common feature of the stations is that R3 indicator has a large GCM´s share. This might be due to the poor Autumn precipitation representation of the GCMs in the zone.
Compared to the highlands and Andean slopes, the Amazon lowlands contain a heterogeneous pattern (Figure 8). Although the SDMs have the highest uncertainty share in most cases, there are important contributions of the GCMs. Moreover, in some locations and indicators, the GCMs take over (e.g., R7 in Trompillo). Note that in Trinidad, the uncertainty share of the GCM-SDM interaction takes over in most cases. The change in the pattern of the uncertainty contribution in Trinidad must be elaborated further as this increase in the interaction´s share could mean that in this zone, the use of a certain SDM method can give large differences in the results.
Similar to the other regions, the uncertainty share of the SDMs in the Chaco lowlands is dominant (Figure 9), however, there is a consistent increase in the share of the future scenarios. Note that in the indicators of high extremes intensities (R7 and R8), the single contribution (not total) of only the SDMs is not necessarily the largest. Moreover, in Yacuiba and, the 10-year and 30-year return period precipitation (R8 and R7), the SDMs are close in share (76.1% and 72.4%. Hence, the uncertainty contribution from the SDMs in high extreme precipitation events is evident in this area.
3.3. Projections
For each future scenario (SSP1-2.6, SSP2-4.5, SSP3-7.0 and SSP5-8.5), tables with summaries from the downscaled results of the SDMs used in this work, random forest (SD-ML-4) and support vector machines (SD-ML-5), are presented. The projections are handed in terms of change factors. Note that not all changes are reliable. First, the added value of the SDMs (skill) needs to be adequate. Secondly, the SDMs must agree on the direction of change. Finally, the change has to be significant. Here we present the changes for the future scenarios SSP1-2.6 and SSP5-8.5 as the low and high scenarios, respectively (Table 4 and Table 5). The other scenarios (SSP2-4.5 and SSP3-7.0) can be found in the supplementary Material.
The future scenario SSP1-2.6 is less perturbed regarding greenhouse gas emissions (i.e., most similar to historical conditions). More generalised results are observed by considering stations in the same zone. Regarding the projections for low extremes (R5), El Alto is projected to decrease by 32%, while the other stations in the highlands zone show no significant change. On the Andean slopes, Cochabamba is projected to decrease by 37% and Tarija with no significant change. Guayaramerin, Trinidad and Trompillo are projected on the Amazon lowlands with no significant changes, while Cobija and Rurrenabaque present unreliable changes. On the Chaco lowlands, a 22% and 30% decrease is projected for Camiri and Yacuiba, respectively.
The projections for high extreme intensities (R7 and R8) in the highlands generally show no significant or unreliable changes. Only El Alto shows a decrease of about 24% in R7. The Andean slopes show a similar situation except for Tarija, which is projected for a 21% decrease in R7. More clear changes can be found in the Amazon lowlands. For R7, a 34%, 35%, 36%, and 46% decrease is projected for Cobija, Guayaramerin, Rurrenabaque and Trinidad, respectively. For R8, a 30% and 23% decrease is projected in Rurrenabaque and Trinidad, respectively.
The high extreme precipitation occurrence (R9, R10 and R11) has more significant changes than the intensities. El Alto and Potosi project increases up to 63% and 33% in the highlands, respectively. In the Andean slopes, increases up to 47%, 25% and 64% are projected for Cochabamba, Sucre and Tarija, respectively. In the Amazon lowlands, increases up to 30% and 82% are projected in Guayaramerin and Trompillo, respectively. Also, a decrease of 14% for R9 and R10 is noted in Trinidad. Only Camiri projects an increase (up to 30%) in the Chaco lowlands.
The changes in annual rainfall (R6) have a clear pattern in each zone. The highlands, the Andean slopes and the Chaco lowlands have increases of 12%, 12%, 5%, 15%, 51% and 18% in El Alto, Oruro, Potosi, Cochabamba, Tarija and Camiri, respectively. The decreases are projected in the Amazon lowlands, with 8% and 8% in Rurrenabaque and Trinidad, respectively. Moreover, Cobija projects no change in R6.
The future scenario SSP5-8.5 has the same pattern (direction of change) with more pronounced changes in general. Moreover, the SSP5-8.5 scenario has the highest forcing of all future scenarios in this work; hence, it is regarded as the high-end scenario. In the low extremes (R5), decreases are projected in all the zones, with 32%, 45%, 39% and 31% in El Alto, Oruro, Cochabamba and Yacuiba, respectively.
In the high extreme intensities, decreases are projected in the highlands, Andean slopes and Amazon lowlands (up to 24, 30%, 17%, 21%, 35% and 26% in El Alto, Oruro, Cochabamba, Tarija, Guayaramerin and Trinidad), while increases in the Chaco lowlands (13% in Yacuiba). For the case of the frequency of high extremes, increases are projected in all zones except the Amazon lowlands. The significant increases found are up to 47%, 49%, 17% 28% and 62% in El Alto, Potosi, Cochabamba, Sucre and Tarija, respectively. For the Amazon lowlands, there is no pattern since decreases (Cobija, Rurrenabaque and Trinidad) and increases (Guayaramerin and Trompillo) are found.
Similar to the previous future scenario, the annual rainfall changes (R6) contain a strong spatial pattern. The highlands, Andean slopes and Chaco lowlands are projected with increases of 59%, 60%, 8%, 31%, 8%, 50% and 90% in El Alto, Oruro, Potosi, Cochabamba, Sucre, Tarija and Camiri, respectively. The Amazon lowlands might face a decrease in annual rainfall by about 6%, 31% and 14% in Cobija, Rurrenabaque and Trinidad.
4. Discussion
4.1. Skill and Uncertainty
To discuss the skill and the uncertainty of the results, one must notice that it is better to discuss the outcomes based on the zone to which the stations belong. In this work, four zones in Bolivia are analyzed: (i) the highlands, (ii) the Andean slopes, (iii) the Amazon lowlands and (iv) the Chaco lowlands. It is interesting that, to some extent, the behavior of the SDMs is related to the zone in which they are applied.
4.1.1. Highlands
There is no confidence in the projections of winter precipitation according to the relative errors. This happens because the winter precipitation is entirely in the dry season. The dry season in the Andean region is characterized by almost no rain [34,35]. Hence, errors in small precipitation amounts are highly probable. Since the wrong estimations in low precipitation amounts can be very high due to the low values, some artifacts tend to appear. For instance, let us assume the total rainfall for a random month in the winter season is around 2 mm, and the estimations from a modeled source are around 11 mm; the relative error is 450%. This example might seem unplausible at first sight; however, one must notice that GCMs tend to have a wet bias in the Andean region [36]. This wet bias in the dry season could easily introduce a difference similar to the example presented, causing large errors in the estimations and masking the added value of the methodologies.
Another feature common in the stations of the highlands zone is that the SDMs are the dominant source of uncertainty. This feature seems common in downscaling studies on many locations (e.g., [37]). There are some increases in the GCMs’contribution in the Oruro station; however, even in the highest increases (R10 and R11, see Section 3.2), the GCMs’ uncertainty share remains small compared to the SDMs. Since the main source of uncertainties in the studies for the highlands zone will be dominated by the SDMs, one has to ensure the validity of the SDMs used in the study to avoid non-reliable projections.
4.1.2. Andean Slopes
In general, the SDMs show added value (reduction of the relative error of the coarse scale) in the zone, which is usually true for both methodologies. The exception was Tarija, in which SD-ML-4 better downscales the intensities and occurrences of high extremes. The large relative errors in the coarse scale (e.g., Cochabamba station) and the good improvements shown by both methodologies make the SDMs important in this zone for local projections.
A feature common in all the stations in the zone is the dominant SDMs’ uncertainty share except for Cochabamba. It seems strange because Sucre and Tarija Stations are located in places with large similarities in topography and climate compared to Cochabamba. By looking at Figure 3, one can argue that since the coarse scale is performing better in Cochabamba, the SDMs make smaller corrections. As a consequence, the differences on the corrected values are not too large. However, the better GCMs’ performances in Cochabamba remains unclear and should be studied in more detail.
The large reduction of relative errors that the SDMs achieve in the zone and the reduction in the SDMs’ uncertainty share in Cochabamba, makes the studied SDMs good candidates for local analysis of the Andean slopes.
4.1.3. Amazon Lowlands
The Amazon lowlands are characterised by a more humid climate compared to the Chaco lowlands, even though they are close and have similar altitudinal gradients [22]. According to the relative errors, a general feature of the zone is that R4 projections (winter precipitation) might only be reliable in Trinidad and Trompillo and with SD-ML-4. Another clear feature is that the impact assessment of droughts might be better assessed with SD-ML-4 in all stations but Cobija due to the results for R5 (maximum length of the dry spells). On the other side of extremes, both methodologies might adequately describe the local series for the impacts of floods (intensity and occurrence). Note that in Cobija, SD-ML-5 appears to be more reliable according to the relative error estimation of high extremes indicators (R7, R8, R9, R10 and R11).
The uncertainty share of the GCMs becomes more important in this zone. The share of GCM-SDM interaction seems to increase, e.g., Trinidad station. A similar feature was found for other regions as well (e.g., [38]). Interestingly, the GCMs’ skill in this zone is also better compared to the highlands and the Andean slopes. It seems that where the GCMs’ skill is good, the variability in the coarse-scale values (GCMs) can have important contribution in the outcomes.
4.1.4. Chaco Lowlands
The results for the Amazon Chaco zone showed that both methodologies might add value to the GCMs’ outputs while assessing droughts. However, SD-ML-5 outperforms SD-ML-4 on this matter as the performance is better in R5. For assessing the intensities of high extremes in the zone, only SD-ML-4 shows adequate results for Yacuiba. However, for the case of the occurrence in high extremes, both methodologies show added value in Camiri while none in Yacuiba. Similar to other zones in the study (highlands and Andean slopes), R4 (winter precipitation) shows no added value, probably for the same reason as in the highlands and the Andean slopes.
The SDMs are the dominant source of uncertainty. Interestingly, the coarse-scale relative error in R8 in Camiri is low, and no added value is seen from the SDMs. At the same time, the SDM’ share is reducing and the GCMs’ share seems to increase. As stated for the Amazon lowlands, it seems that in some situations, the coarse-scale climate might have important impacts in the variability of the results.
4.2. Assumptions of the SDMs
More information can be obtained if one analyses the relative errors in more detail. The reference period (historical) contain relations calibrated from 1981 to 2010, and the relative errors were calculated with the downscaled results from 1961 to 1980. Thus, (i) the time invariance of the architectures can be investigated. Moreover, since the historical period (1981-2010) might have different forcings than 1961-1980, the assumption that (ii) the calibrated relations work under different forcing conditions might be partially assessed. Note that bias correction is embedded in the downscaling procedures; hence, the time invariance of the bias follows the conclusions of (i) and (ii). The methodologies base their corrections on the assumption that (iii) the GCMs are accurate enough and the errors appear only due to the low spatial resolution. Therefore, the magnitudes of the coarse-scale relative errors might give information on this matter. Lastly, the machine learning methodologies assume (iv) the wet/dry day frequency correction and dry spell length accuracy. We rely on the relative error results for indicator R5 (maximum length of the dry spells) for this. In this way, one can investigate whether the wet/dry day frequency correction is adequate and suitable for tackling dry spell lengths.
(i) Time invariance of the architecture. By analysing the relative errors (skill), one can see that the time invariance of the architectures is highly dependent on the location rather than the methodologies. Nevertheless, the methodologies generally seem to work fine outside the calibration period. The latter can be seen because the added value of both methodologies is clear in many cases and the 20-year period in which the relative errors are defined (1961-1980) is completely independent to the 30-year period (1981-2010) in which the relations were obtained.
(ii) Relations work under different forcing conditions. Evidence shows that the climate after 2000 is already perturbed by a higher increased warming trend (O’Neill et al., 2016). Hence, the calibration period (1981-2010) might have slightly different forcings compared to the period 1961-1980. A small relative error might be an indication that the relations are robust enough to be used under different forcing conditions. The results show that the latter is highly related to the zone because the added value (skill) in the stations in the lowlands is less clear.
(iii) Accurate predictors. In the highlands and Andean slopes, this assumption seems to be weak. Especially for Cochabamba, in which the GCMs are performing poorly. The reason might be the topography and precipitation complexity of the zones. In the lowlands, this assumption seems to hold. While many reasons might happen, the most clear one (since this assumption on the highlands and Andean slopes is not robust) is the topography. The lowlands contain lower complexity in the topography as the region is generally flat, and processes like orography rainfall could not happen. A similar feature can be seen in Rivera and Arnould [36], who showed that the CMIP6 GCMs tend to have less skill in the Andean mountainous regions with low precipitation rates, while the skill seems better closer to the zones with low altitudes.
(iii) Accuracy of the wet/dry day frequency correction and dry spell length. Not all of the times but most, the results regarding the maximum length of the dry spells (R5) were quite robust. This means that the methodologies used in this work can cope with the dry/wet day frequency correction and the correction of the spell lengths. The latter is essential to test as Boé et al. [39] showed that the dry/wet day frequency correction does not necessarily imply accuracy in the length of the dry spells. However, the wet spells were not tested in this work; hence, the finding is only valid for the dry spell lengths. The wet/dry day frequency and their duration is highly attached to the occurrence of droughts. Therefore, the methodologies presented here seem to be valid for such studies. Additionally, note that the dry frequency correction in SD-ML-5 (which is, in principle, a hybrid machine learning - bias correction procedure) does not assume a wet bias as other studies with bias correction procedures (e.g., [40]). Finally, we must notice that the SDMs did not show added value in the winter precipitation (dry season). Therefore, the use of these methodologies for drought studies needs to be studied further.
4.3. Expected Projections for the Region
The discussion on the projected changes follows a particular criterion. Since reliable projections need to be investigated, one must establish whether the projected change is uncertain (non-reliable), significant or non-significant. A significant change happens when the projection agrees in the direction of change in both methodologies (SD-ML-4 and SD-ML-5), and one of the SDMs or both show a significant change. An uncertain change appears when both SDMs project significant changes and disagree on the change’s direction. When the SDMs do not project significant changes, the projection is considered non-significant. Note that the relative errors also drive the discussion. When the methodology has poor skill on a specific research indicator (no added value according to the relative errors), the projections are considered non-reliable. Finally, the future scenarios SSP1-2.6 and SSP5-8.5 are considered the most and the least optimistic scenarios (lower and high-end scenarios), respectively.
As a general feature for all future scenarios in the highlands, the projections for the winter precipitation could be regarded as unreliable. According to SSP1-2.6, the zone could face a decline in the dry spell lengths due to the decrease shown by El Alto. This feature is more pronounced in the SSP5-8.5 scenario, as more stations (El Alto and Oruro) show the reduction. On the one hand, the stations have a disagreement in the SSP1-2.6 projections for the intensities of high precipitation events, but the dominant feature is that no significant change might happen. However, an increase in the high precipitation events frequency is noted as dominant in this zone. On the other hand, scenario SSP5-8.5 have a more clear projected decrease in the intensities while the projected increase in the frequencies becomes less clear. Regarding the annual rainfall, the governing feature of SSP1-2.6 is the increased precipitation amounts (up to 12%). The scenario SSP5-8.5 has a similar pattern but with enhanced increases (up to 60%).
The projected increase in annual precipitation of the highlands is in disagreement compared to the ensemble mean in Meehl et al. [41] or the dynamically downscaled precipitation in Nuñez et al. [42]. However, one must notice that the mentioned studies contain old-generation models with different future scenarios. Moreover, both studies do not contain projections for local scale stations, a feature that might be causing the disagreements. Additionally, some studies noted that a future increase in annual rainfall in these Andes locations is possible [43]. Oppositely to Abadi et al. [44], the dry spell length is projected with a reduction in the highlands. However, the study analysed Bolivia with five GCMs and the CMIP5 generation. The ensemble studied here is larger (20 GCMs) and belongs to the CMIP6 generation. Moreover, this present work performed an analysis at a local daily scale, a feature missing in the last mentioned study, which could be the cause of the disagreement.
In the Andean slopes, the future scenario SSP1-2.6 tends to project a higher frequency of high rainfall events (up to 64%). The SSP5-8.5 scenario shows a similar behaviour but remains uncertain to what extent (larger or smaller projections) as there is no general feature. There is no zonal feature on the low extremes (R5). However, Cochabamba is projected by a decrease in the dry spell length in both future scenarios (SSP1-2.6 and SSP5-8.5). Regarding annual rainfall, the zone’s dominant feature is the future increase. SSP1-2.6 project and increase up to 51% and SSP5-8.5 up to 50%. Hence, the increase is similar for both future scenarios even though SSP5-8.5 is the high-end scenario.
In the Amazon lowlands, the projections for both future scenarios in the low extremes of the zone remain uncertain. Some stations projected no change, while others showed non-reliable changes. The pattern is also unclear on the high precipitation events frequency as some stations project an increase (e.g., Guayaramerin) and others a decrease (e.g., Trinidad). Note that while the decreases are in the same order in both future scenarios, the increases tend to become larger in SSP5-8.5. A more clear trend (decrease) is found in the intensities of high precipitation events, which is in the same order for both future scenarios (up to 46% in SSP1-2.6). Finally, the zone’s projected decrease in annual rainfall for all stations is noticeable, which is more pronounced in SSP5-8 (up to 31%).
Some results in the Amazon lowlands agree with Cabré et al. [45], while others disagree (depending on the stations). Nevertheless, one must notice that the dynamical downscaled ensemble in the mentioned study is limited to one model, and the outputs depend on an old generation of models (CMIP3). Furthermore, the results in this work are intended for the local level, while Cabré et al. [45] present the projections at the regional level.
In the Chaco lowlands, the future scenarios project a decrease of the dry spells lengths in a similar order. Regarding high extremes, there is a notorious increase in frequency (Camiri) and intensity (Yacuiba). These increases seem more pronounced for SSP5-8.5 in the frequency of the events. On cumulated precipitation amounts, an increase is noted for annual rainfall. This feature is in agreement with the eastern Andean projections in Cabré et al. [45]) and Meehl et al. [41].
5. Conclusions
This work used an ensemble of 20 global climate models, four future scenarios from CMIP6 generation and two machine learning techniques for downscaling precipitation to a local scale on 13 stations in Bolivia. The focus of the work is the high and low precipitation extremes. The precipitation values are used to calculate research indicators related to local impact analysis on flooding and droughts. Moreover, the results are analyzed in detail to investigate the assumptions made by the methodologies. The relative errors, primarily aimed at validating the methodologies, are also used for the analysis of the assumptions. The variance decomposition procedure quantifies the contribution to the uncertainties of the SDMs for more detailed investigations. The changes are analyzed in terms of their significance. Later, the projections on research indicators are made for future scenarios.
In general, both downscaling methods used in this study are able to add value (reduce the coarse-scale error). Moreover, there is a better general performance of SD-ML-4 compared to SD-ML-5 as it downscales the GCMs adequately in more situations. Nevertheless, SD-ML-4 does not necessarily outperform SD-ML-5 as the latter also performs well where SD-ML-4 has no added value. More specific findings reveal that both methods add more value (have a better skill) in the highlands and Andean slopes compared to the lowlands. Furthermore, in the Amazon and Chaco lowlands, where the GCMs have good skill on several occasions, there is a noticeable drop in the SDMs’ performance compared to the other zones. It seems that the more complex the zone, the more value the SDMs add due to the poor skill of the GCMs. A good example is Cochabamba station, where the spatial resolution of the GCMs is not able to capture the changes, and large added value from both methodologies is seen on all research indicators (except R4, winter precipitation). With this, we argue that rather than searching for the best-performing method for a downscaling study, one has to investigate the most suitable ensemble of methods.
The stationary assumptions seem to hold for the highlands and Andean slopes, while the lowlands remain uncertain. The accurate predictors’ assumption was weak in the highlands and Andean slopes, especially for the Cochabamba station. In the lowlands, this assumption seems to hold. We attributed this to the topography complexity of the zones because the GCMs’ spatial resolution does not allow for the correct representation of the local processes. The wet/dry day frequency correction and dry spell length accuracy seem robust in most locations. This finding is interesting as it means that the correction of the wet/dry day frequencies of both methodologies is adequate. Note that SD-ML-5 (in principle, a hybrid machine learning - bias correction method) does not assume a wet bias, resulting in a better performance in the wet/dry day frequencies and dry spell length corrections than its counterparts (e.g., [40]).
The dominant source of uncertainty throughout the region is the SDMs. This is especially true for the highlands and the Andean slopes (except for Cochabamba). In the lowlands (Amazon and Chaco), the GCMs increase their contribution to the total uncertainty. However, the SDMs’ uncertainty share remains the largest in most cases, which seems to cause disagreements in the direction of the CCS. It is important to note that, in some locations in the high extreme rainfall events (e.g., R7 and R8), the GCMs could become the dominant sources. It seems that in locations where the GCMs’ skill is good for high extremes, the GCM contribution to the uncertainties increases because the downscaling process does not add value to the coarse-scale results.
All the stations in this study are located where water availability in the dry season is problematic. We rely on the annual precipitation and the dry spells’ maximum length to investigate whether this might impose a problem in the future. According to the projections of annual rainfall, only the Amazon lowlands might face a reduction. Moreover, this reduction becomes more evident in the SSP5-8.5 scenario. For the case of the length of the dry spells, all the stations with significant changes showed decreased lengths. However, no significant or non-reliable changes in the maximum length of the dry spells characterize the stations in the Amazon lowlands. Hence a reduction in annual precipitation might bring risk in the future to this zone. A recurrent pattern in the projections is the increased frequency of high precipitation events. This was true throughout the zones and future scenarios except for the Amazon lowlands stations’ Cobija, Rurrenabaque and Trinidad. Note that this imposes a problem as all the stations are located in urban zones that do not have an appropriate infrastructure to cope with flooding. The problem might aggravate on stations also projected with increased intensity in high extremes. However, the station that projects an increase in high precipitation intensities (Yacuiba) has non-reliable projections on the frequency. Hence it remains unclear whether the station or the Chaco lowlands will have an increased risk of flooding compared to the other locations.
Some limitations need to be acknowledged. (i) Not all the stations in Bolivia are used; a higher station density is needed for clearer patterns and robust results. (ii) Stations from other countries in the region (South America) need to be used to generalize and confirm the findings. (iii) GCMs have particular problems in the Andean valleys, probably due to the topographical complexity in the zone. The use of regional models might be better to represent the lost processes in the GCMs. However, this is contradictory for Cochabamba station, and therefore, it must be studied in more detail (iv) The investigation that the relations remain the same under different forcing conditions is limited. Hence, a pseudo-reality study (e.g., [8,40]) might be interesting for more robust findings.
Supplementary Materials
The following supporting information can be downloaded at: https://zenodo.org/doi/10.5281/zenodo.13797149
Author Contributions
Conceptualization, Santiago Mendoza Paz, Patrick Willems and Mauricio F. Villazón Gómez; Formal analysis, Santiago Mendoza Paz; Methodology, Santiago Mendoza Paz, Patrick Willems and Mauricio F. Villazón Gómez; Software, Santiago Mendoza Paz; Supervision, Patrick Willems; Validation, Santiago Mendoza Paz; Writing – original draft, Santiago Mendoza Paz; Writing – review & editing, Patrick Willems and Mauricio F. Villazón Gómez.
Funding
This research did not receive any specific grant from funding agencies in the public, commercial, or not-for-profit sectors.
Data Availability Statement
CMIP6 GCM outputs are freely available at the ESGF website (https://esgf-data.dkrz.de). The meteorological datasets of the airports were provided by the Bolivian National Services of Meteorology and Hydrology (SENAMHI), website: (https://senamhi.gob.bo/index.php/inicio).
Acknowledgments
We are grateful to the Bolivian National Services of Meteorology and Hydrology (SENAMHI) as their data was crucial to develop this work.
Conflicts of Interest
The authors declare that they have no conflict of interest.
Abbreviations
The following abbreviations are used in this manuscript:
| CCS | Climate Change Signal |
| CMIP6 | Coupled Model Intercomparison Project Phase 6 |
| ECMWF | European Centre for Medium-Range Weather Forecasts |
| ESD | Empirical Statistical Downscaling |
| ETCCDI | Expert Team on Climate Change Detection and Indices |
| GCM | Global Climate Model |
| MLT | Machine Learning Technique |
| MSL | Meters above Sea Level |
| NSWT | Nonhomogeneous Stochastic Weather Typing |
| RF | Random Forest |
| SDM | Statistical Downscaling Method |
| SENAMHI | Servicio Nacional de Hidrometeorología |
| S2NR | Signal To Noise Ratio |
| SVM | Support Vector Machines |
References
- Smithers, J.; Smit, B. Human adaptation to climatic variability and change. Global Environmental Change 1997, 7, 129–146. [Google Scholar] [CrossRef]
- Phillips, S.; Wallis, K.; Lane, A. Quantifying the impacts of bushfire on populations of wild koalas ( Phascolarctos cinereus ): Insights from the 2019/20 fire season. Ecological Management and Restoration 2021, 22, 80–88. [Google Scholar] [CrossRef]
- BBC, N. Brazil floods: Dozens dead in severe Minas Gerais rainstorms 2020. [Online; accessed 2023-06-01].
- Gonzales-Iwanciw, J.; Salamanca, L.; Condori, B.; Ontiveros, M. Tras las huellas del cambio climático en Bolivia. Estado del arte del conocimiento sobre adaptación al cambio climático. Technical report, Bolivia, 2011.
- Bank, W. Adaptation to climate change - Vulnerability assessment and economic aspects: Plurinational State of Bolivia. Technical report, Washington, DC, 2010.
- Cardona, O.; Carreño, M. Updating the Indicators of Disaster Risk and Risk Management for the Americas. Journal of Integrated Disaster Risk Management 2011, 1, 27–47. [Google Scholar] [CrossRef]
- Knutti, R.; Sedláček, J. Robustness and uncertainties in the new CMIP5 climate model projections. Nature Climate Change 2013, 3, 369–373. [Google Scholar] [CrossRef]
- Vrac, M.; Stein, M.L.; Hayhoe, K.; Liang, X.Z. A general method for validating statistical downscaling methods under future climate change. Geophysical Research Letters 2007, 34. [Online; accessed 2020-02-14]. [Google Scholar] [CrossRef]
- Benestad, R.; Sillmann, J.; Thorarinsdottir, T.L.; Guttorp, P.; Mesquita, M.d.S.; Tye, M.R.; Uotila, P.; Maule, C.F.; Thejll, P.; Drews, M.; Parding, K.M. New vigour involving statisticians to overcome ensemble fatigue. Nature Climate Change 2017, 7, 697–703. [Google Scholar] [CrossRef]
- Maraun, D.; Wetterhall, F.; Ireson, A.M.; Chandler, R.E.; Kendon, E.J.; Widmann, M.; Brienen, S.; Rust, H.W.; Sauter, T.; Themeßl, M.; Venema, V.K.C.; Chun, K.P.; Goodess, C.M.; Jones, R.G.; Onof, C.; Vrac, M.; Thiele-Eich, I. Precipitation downscaling under climate change: Recent developments to bridge the gap between dynamical models and the end user. Reviews of Geophysics 2010, 48. [Online; accessed 2019-01-10]. [Google Scholar] [CrossRef]
- Chadwick, R.; Coppola, E.; Giorgi, F. An artificial neural network technique for downscaling GCM outputs to RCM spatial scale. Nonlinear Processes in Geophysics 2011, 18, 1013–1028. [Google Scholar] [CrossRef]
- Das, J.; Nanduri, U.V. Assessment and evaluation of potential climate change impact on monsoon flows using machine learning technique over Wainganga River basin, India. Hydrological Sciences Journal 2018, 63, 1020–1046. [Google Scholar] [CrossRef]
- Hewitson, B.; Crane, R. Climate downscaling: techniques and application. Climate Research 1996, 7, 85–95. [Google Scholar] [CrossRef]
- Jebeile, J.; Lam, V.; Räz, T. Understanding climate change with statistical downscaling and machine learning. Synthese 2021, 199, 1877–1897. [Google Scholar] [CrossRef]
- Tripathi, S.; Srinivas, V.; Nanjundiah, R.S. Downscaling of precipitation for climate change scenarios: A support vector machine approach. Journal of Hydrology 2006, 330, 621–640. [Google Scholar] [CrossRef]
- Vu, M.T.; Aribarg, T.; Supratid, S.; Raghavan, S.V.; Liong, S.Y. Statistical downscaling rainfall using artificial neural network: significantly wetter Bangkok? Theoretical and Applied Climatology 2016, 126, 453–467. [Google Scholar] [CrossRef]
- Kühnlein, M.; Appelhans, T.; Thies, B.; Nauss, T. Improving the accuracy of rainfall rates from optical satellite sensors with machine learning — A random forests-based approach applied to MSG SEVIRI. Remote Sensing of Environment 2014, 141, 129–143. [Google Scholar] [CrossRef]
- Salimi, A.H.; Masoompour Samakosh, J.; Sharifi, E.; Hassanvand, M.R.; Noori, A.; von Rautenkranz, H. Optimized Artificial Neural Networks-Based Methods for Statistical Downscaling of Gridded Precipitation Data. Water 2019, 11, 1653. [Google Scholar] [CrossRef]
- Wilby, R.L.; Dessai, S. Robust adaptation to climate change. Weather 2010, 65, 180–185. [Google Scholar] [CrossRef]
- Dixon, K.W.; Lanzante, J.R.; Nath, M.J.; Hayhoe, K.; Stoner, A.; Radhakrishnan, A.; Balaji, V.; Gaitán, C.F. Evaluating the stationarity assumption in statistically downscaled climate projections: is past performance an indicator of future results? Climatic Change 2016, 135, 395–408. [Google Scholar] [CrossRef]
- Seiler, C.; Hutjes, R.W.A.; Kabat, P. Climate Variability and Trends in Bolivia. Journal of Applied Meteorology and Climatology 2013, 52, 130–146. [Google Scholar] [CrossRef]
- of Water, M.; of Bolivia, E. (Eds.) Balance hídrico superficial de Bolivia: documento de difusión; Ministerio de Medio Ambiente y Agua: La Paz, Bolivia, 2016. [Google Scholar]
- Araya-Osses, D.; Casanueva, A.; Román-Figueroa, C.; Uribe, J.M.; Paneque, M. Climate change projections of temperature and precipitation in Chile based on statistical downscaling. Climate Dynamics 2020, 54, 4309–4330. [Google Scholar] [CrossRef]
- Breiman, L. Random Forests. Kluwer Academic Publishers 2001, 45, 5–32. [Google Scholar]
- Pedregosa, F.; Varoquaux, G.; Gramfort, A.; Michel, V.; Thirion, B.; Grisel, O.; Blondel, M.; Prettenhofer, P.; Weiss, R.; Dubourg, V.; Vanderplas, J.; Passos, A.; Cournapeau, D. Scikit-learn: Machine Learning in Python. Journal of Machine Learning Research 2011, 12, 2825–2830. [Google Scholar]
- Bjerre, E.; Fienen, M.N.; Schneider, R.; Koch, J.; Højberg, A.L. Assessing spatial transferability of a random forest metamodel for predicting drainage fraction. Journal of Hydrology 2022, 612, 128177. [Google Scholar] [CrossRef]
- Karatzoglou, A.; Smola, A.; Hornik, K.; Zeileis, A. kernlab – An S4 Package for Kernel Methods in R. Journal of Statistical Software 2004, 11, 2022-01–21]. [Google Scholar] [CrossRef]
- Haykin, S. Neural Networks: A comprehensive foundation, ninth indian reprint ed.; Pearson Education: India, 2005. [Google Scholar]
- Déqué, M.; Somot, S.; Sanchez-Gomez, E.; Goodess, C.M.; Jacob, D.; Lenderink, G.; Christensen, O.B. The spread amongst ENSEMBLES regional scenarios: regional climate models, driving general circulation models and interannual variability. Climate Dynamics 2012, 38, 951–964. [Google Scholar] [CrossRef]
- Déqué, M.; Rowell, D.P.; Lüthi, D.; Giorgi, F.; Christensen, J.H.; Rockel, B.; Jacob, D.; Kjellström, E.; de Castro, M.; van den Hurk, B. An intercomparison of regional climate simulations for Europe: assessing uncertainties in model projections. Climatic Change 2007, 81, 53–70. [Google Scholar] [CrossRef]
- Hosseinzadehtalaei, P.; Tabari, H.; Willems, P. Precipitation intensity–duration–frequency curves for central Belgium with an ensemble of EURO-CORDEX simulations, and associated uncertainties. Atmospheric Research 2018, 200, 1–12. [Google Scholar] [CrossRef]
- Tabari, H.; Hosseinzadehtalaei, P.; AghaKouchak, A.; Willems, P. Latitudinal heterogeneity and hotspots of uncertainty in projected extreme precipitation. Environmental Research Letters 2019, 14, 124032. [Google Scholar] [CrossRef]
- Räty, O.; Räisänen, J.; Ylhäisi, J.S. Evaluation of delta change and bias correction methods for future daily precipitation: intermodel cross-validation using ENSEMBLES simulations. Climate Dynamics 2014, 42, 2287–2303. [Google Scholar] [CrossRef]
- Campozano, L.; Célleri, R.; Trachte, K.; Bendix, J.; Samaniego, E. Rainfall and Cloud Dynamics in the Andes: A Southern Ecuador Case Study. Advances in Meteorology 2016, 2016, 1–15. [Google Scholar] [CrossRef]
- Ruiz-Hernández, J.C.; Condom, T.; Ribstein, P.; Le Moine, N.; Espinoza, J.C.; Junquas, C.; Villacís, M.; Vera, A.; Muñoz, T.; Maisincho, L.; Campozano, L.; Rabatel, A.; Sicart, J.E. Spatial variability of diurnal to seasonal cycles of precipitation from a high-altitude equatorial Andean valley to the Amazon Basin. Journal of Hydrology: Regional Studies 2021, 38, 100924. [Google Scholar] [CrossRef]
- Rivera, J.A.; Arnould, G. Evaluation of the ability of CMIP6 models to simulate precipitation over Southwestern South America: Climatic features and long-term trends (1901–2014). Atmospheric Research 2020, 241, 104953. [Google Scholar] [CrossRef]
- Mandal, S.; Breach, P.A.; Simonovic, S.P. Uncertainty in Precipitation Projection under Changing Climate Conditions: A Regional Case Study. American Journal of Climate Change 2016, 05, 116–132. [Google Scholar] [CrossRef]
- Lafaysse, M.; Hingray, B.; Mezghani, A.; Gailhard, J.; Terray, L. Internal variability and model uncertainty components in future hydrometeorological projections: The Alpine Durance basin. Water Resources Research 2014, 50, 3317–3341. [Google Scholar] [CrossRef]
- Boé, J.; Terray, L.; Habets, F.; Martin, E. Statistical and dynamical downscaling of the Seine basin climate for hydro-meteorological studies. International Journal of Climatology 2007, 27, 1643–1655. [Google Scholar] [CrossRef]
- Mendoza Paz, S.; Willems, P. Uncovering the strengths and weaknesses of an ensemble of quantile mapping methods for downscaling precipitation change in Southern Africa. Journal of Hydrology: Regional Studies 2022, 41, 101104. [Google Scholar] [CrossRef]
- Meehl, G.; Stocker, T.; Collins, W.; Friedlingstein, P.; Gaye, A.; Gregory, J.; Kitoh, A.; Knutti, R.; Murphy, J.; Noda, A.; Raper, S.; Watterson, I.; Weaver, A.; Zhao, Z. Global Climate Projections. In: Climate Change 2007: The Physical Science Basis. Contribution of Working Group I to the Fourth Assessment Report of the Intergovernmental Panel on Climate Change [Solomon, S., D. Qin, M. Manning, Z. Chen, M. Marquis, K.B. Averyt, M. Tignor and H.L. Miller (eds.)]. Cambridge University Press, Cambridge, United Kingdom and New York, NY, USA, 2007.
- Nuñez, M.N.; Solman, S.A.; Cabré, M.F. Regional climate change experiments over southern South America. II: Climate change scenarios in the late twenty-first century. Climate Dynamics 2009, 32, 1081–1095. [Google Scholar] [CrossRef]
- Urrutia, R.; Vuille, M. Climate change projections for the tropical Andes using a regional climate model: Temperature and precipitation simulations for the end of the 21st century. Journal of Geophysical Research 2009, 114, D02108. [Google Scholar] [CrossRef]
- Abadi, A.M.; Oglesby, R.; Rowe, C.; Mawalagedara, R. Evaluation of GCMs historical simulations of monthly and seasonal climatology over Bolivia. Climate Dynamics 2018, 51, 733–754. [Google Scholar] [CrossRef]
- Cabré, M.F.; Solman, S.; Núñez, M. Regional climate change scenarios over southern South America for future climate (2080-2099) using the MM5 Model. Mean, interannual variability and uncertainties. Atmósfera, 2016; [Online; accessed 2023-03-27]. [Google Scholar] [CrossRef]
Figure 1.
Location of the study area. In red is the geographical position of the precipitation stations (observations) of the Amazon lowlands, in purple the Chaco lowlands, in blue the Andean slopes and in green the highlands. The graph presents the topography as differences in altitudes above sea level. The numbers represent the ID of the stations (see Table 1).
Figure 2.
Relative errors in the highlands. The RIs obtained from the downscaled results of both SDMs are compared against the observations in 1961-1980. Moreover, the relative errors of the RIs derived from the coarse-scale values (GCM raw outputs) are also presented. X-axis shows the different research indicators except R7 (maximum daily precipitation of a 30-year return period). Y-axis represents the relative error in percentage.
Figure 3.
Relative errors in the Andean slopes. The RIs obtained from the downscaled results of both SDMs are compared against the observations in the period 1961-1980. Moreover, the relative errors of the RIs derived from the coarse-scale values (GCM raw outputs) are also presented. X-axis shows the different research indicators except R7 (maximum daily precipitation of a 30-year return period). Y-axis represents the relative error in percentage.
Figure 4.
Relative errors in the Amazon lowlands. The RIs obtained from the downscaled results of both SDMs are compared against the observations in 1961-1980. Moreover, the relative errors of the RIs derived from the coarse-scale values (GCM raw outputs) are also presented. X-axis shows the different research indicators except R7 (maximum daily precipitation of a 30-year return period). Y-axis represents the relative error in percentage.
Figure 5.
Relative errors in the Chaco lowlands. The RIs obtained from the downscaled results of both SDMs are compared against the observations in 1961-1980. Moreover, the relative errors of the RIs derived from the coarse-scale values (GCM raw outputs) are also presented. X-axis shows the different research indicators except R7 (maximum daily precipitation of a 30-year return period). Y-axis represents the relative error in percentage.
Figure 6.
Uncertainty contribution from the different sources in the highlands. Each colour represents the individual contribution to the total variance by the GCMs, SDMs, SSPs, and the different second and third-term interactions. R1, R2, …, and R11 denote the research indicators (see Table 3).
Figure 6.
Uncertainty contribution from the different sources in the highlands. Each colour represents the individual contribution to the total variance by the GCMs, SDMs, SSPs, and the different second and third-term interactions. R1, R2, …, and R11 denote the research indicators (see Table 3).
Figure 7.
Uncertainty contribution from the different sources in the Andean slopes. Each colour represents the individual contribution to the total variance by the GCMs, SDMs, SSPs, and the different second and third-term interactions. R1, R2, …, and R11 denote the research indicators (see Table 3).
Figure 8.
Uncertainty contribution from the different sources in the Amazon lowlands. Each colour represents the individual contribution to the total variance by the GCMs, SDMs, SSPs, and the different second and third-term interactions. R1, R2, …, and R11 denote the research indicators (see Table 3).
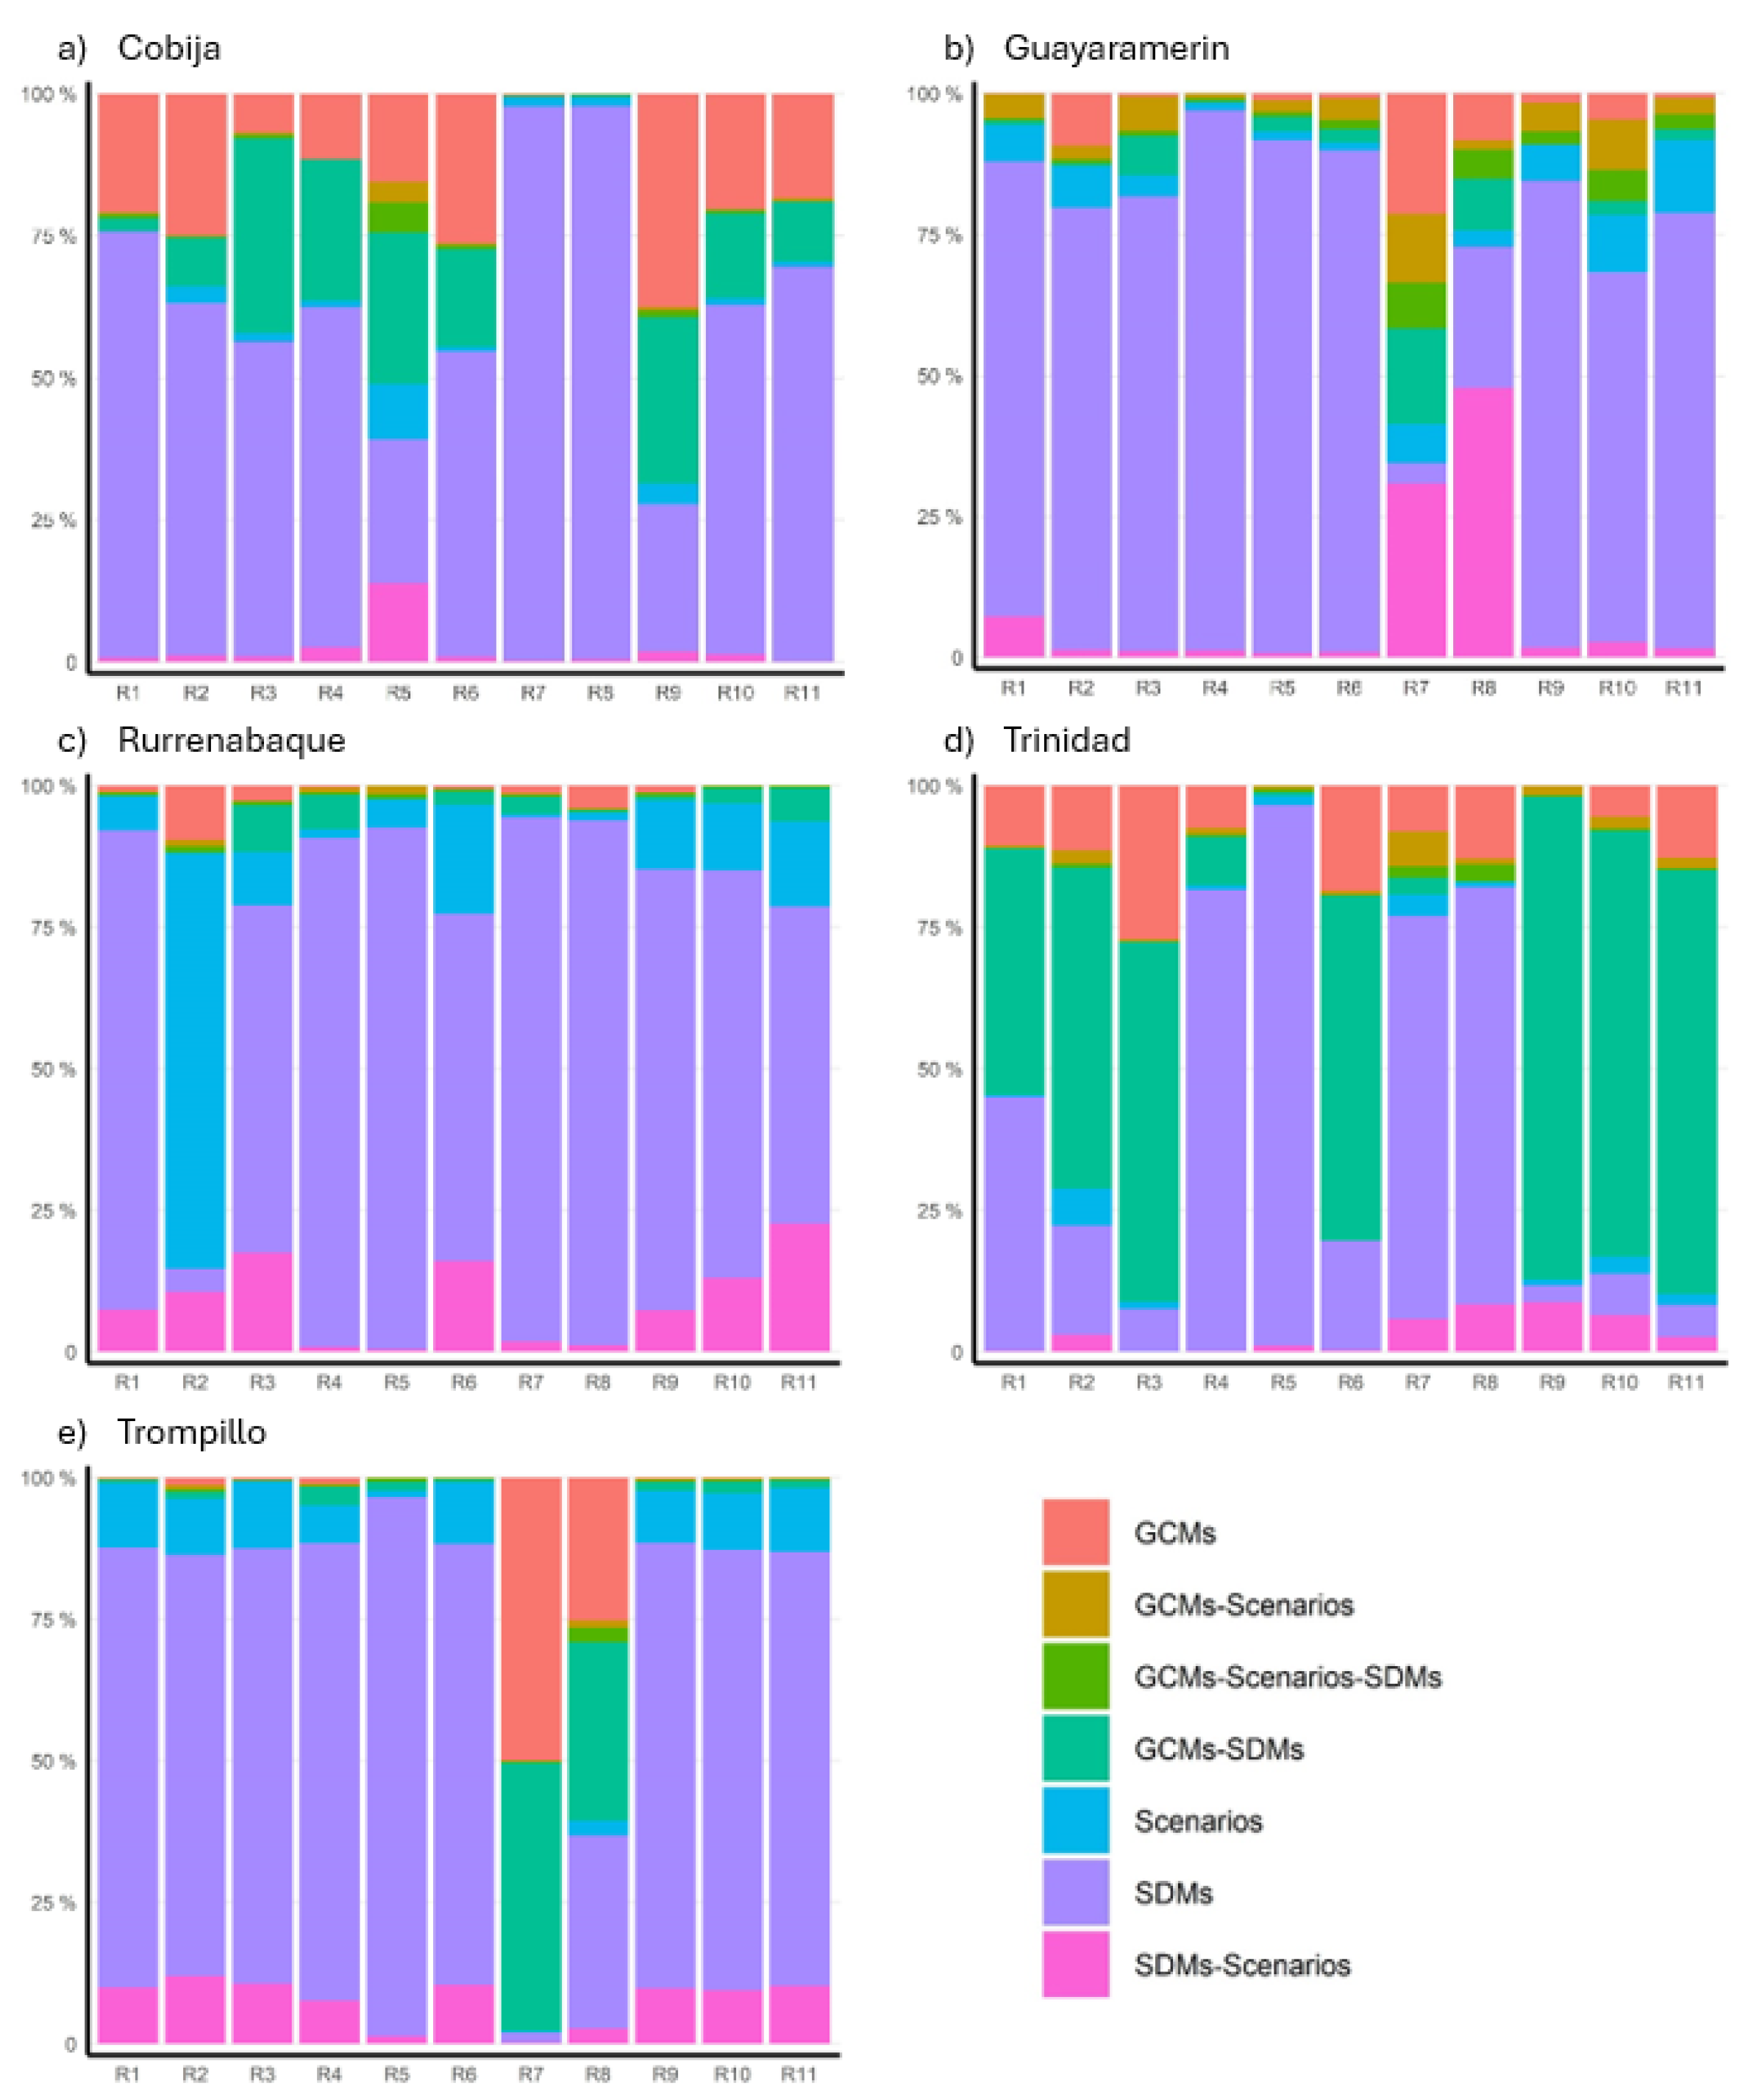
Figure 9.
Uncertainty contribution from the different sources in the Chaco lowlands. Each colour represents the individual contribution to the total variance by the GCMs, SDMs, SSPs, and the different second and third-term interactions. R1, R2, …, and R11 denote the research indicators (see Table 3).
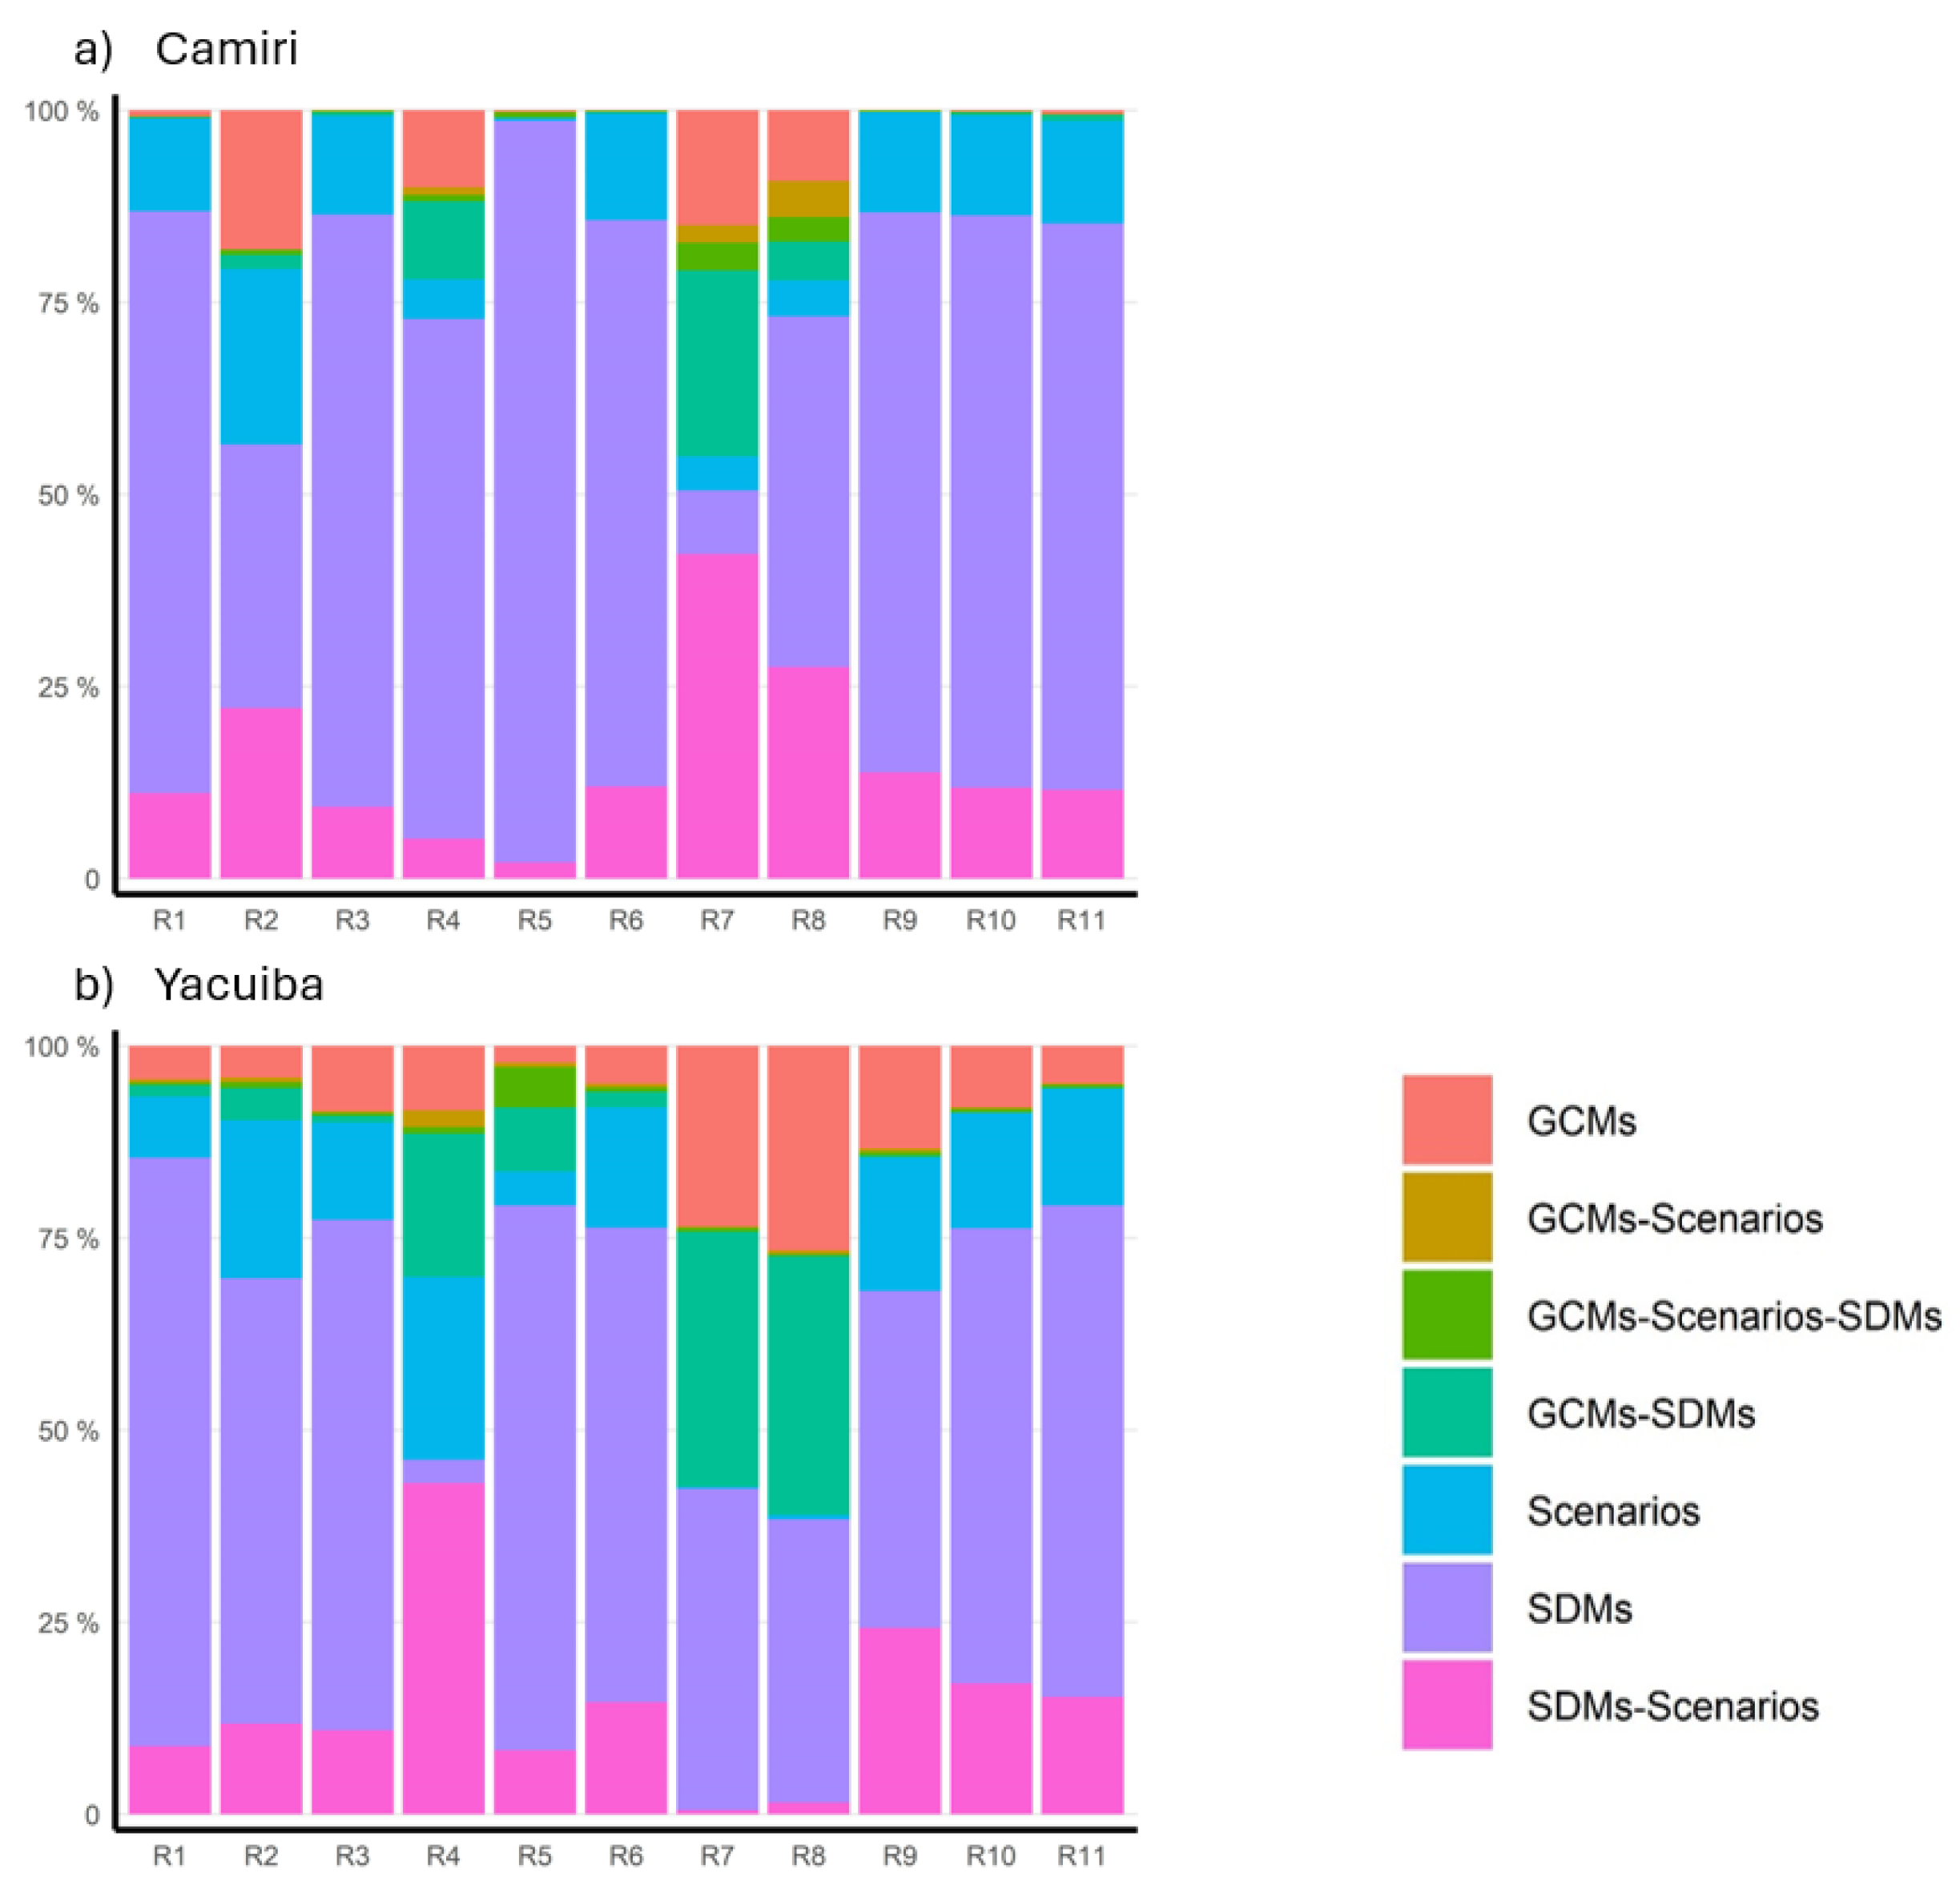

Table 1.
Stations used for this analysis.
| ID | Name | Lat. [°] | Lon. [°] | Height [MSL] | Zone |
|---|---|---|---|---|---|
| 1 | Camiri | -20.05 | -63.57 | 810 | Chaco lowlands |
| 2 | Cobija | -11.03 | -68.78 | 235 | Amazon lowlands |
| 3 | Cochabamba | -17.42 | -66.17 | 2548 | Andean slopes |
| 4 | El Alto | -16.51 | -68.2 | 4071 | Highlands |
| 5 | Guayaramerin | -10.82 | -65.37 | 130 | Amazon lowlands |
| 6 | Oruro | -17.97 | -67.12 | 3702 | Highlands |
| 7 | Potosí | -19.53 | -65.73 | 4100 | Highlands |
| 8 | Rurrenabaque | -14.43 | -67.5 | 204 | Amazon lowlands |
| 9 | Sucre | -19.01 | -65.29 | 2904 | Andean slopes |
| 10 | Tarija | -21.53 | -64.72 | 1875 | Andean slopes |
| 11 | Trinidad | -14.82 | -64.91 | 156 | Amazon lowlands |
| 12 | Trompillo | -17.75 | -63.17 | 413 | Amazon lowlands |
| 13 | Yacuiba | -22.02 | -63.7 | 580 | Chaco lowlands |
Table 2.
Global climate models and simulations used in this work.
| Nr. | Model | Resolution | Historical | SSP1-2.6 | SSP2-4.5 | SSP3-7.0 | SSP5-8.5 | Variant label |
|---|---|---|---|---|---|---|---|---|
| 1 | ACCESS-CM2 | 1.9 x 1.3 | 1 | 1 | 1 | 1 | 1 | r1i1p1f1 |
| 2 | ACCESS-ESM1-5 | 1.9 x 1.3 | 1 | 1 | 1 | 1 | 1 | r1i1p1f1 |
| 3 | CanESM5 | 2.8 x 2.8 | 25 | 1 | 1 | 1 | 1 | r1i1p1f1-r25i1p1f1 |
| 4 | CESM2-WACCM | 1.3 x 0.9 | 1 | 1 | 1 | 1 | 1 | r1i1p1f1 |
| 5 | CMCC-CM2-SR5 | 1 x 1 | 1 | 1 | 1 | 1 | 1 | r1i1p1f1 |
| 6 | EC-Earth3 | 0.7 x 0.7 | 1 | 1 | 1 | 1 | 1 | r1i1p1f1 |
| 7 | EC-Earth3-Veg | 0.7 x 0.7 | 1 | 1 | 1 | 1 | 1 | r1i1p1f1 |
| 8 | EC-Earth3-Veg-LR | 1.1 x 1.1 | 1 | 1 | 1 | 1 | 1 | r1i1p1f1 |
| 9 | FGOALS-g3 | 2 x 2 | 1 | 1 | 1 | 1 | 1 | r1i1p1f1 |
| 10 | IITM-ESM | 1.9 x 1.9 | 1 | 1 | 1 | 1 | 1 | r1i1p1f1 |
| 11 | INM-CM4-8 | 2 x 1.5 | 1 | 1 | 1 | 1 | 1 | r1i1p1f1 |
| 12 | INM-CM5-0 | 2 x 1.5 | 1 | 1 | 1 | 1 | 1 | r1i1p1f1 |
| 13 | IPSL-CM6A-LR | 2.5 x 1.3 | 1 | 1 | 1 | 1 | 1 | r1i1p1f1 |
| 14 | KACE-1-0-G | 1.9 x 1.3 | 1 | 1 | 1 | 1 | 1 | r1i1p1f1 |
| 15 | MIROC6 | 1.4 x 1.4 | 1 | 1 | 1 | 1 | 1 | r1i1p1f1 |
| 16 | MPI-ESM1-2-HR | 0.9 x 0.9 | 1 | 1 | 1 | 1 | 1 | r1i1p1f1 |
| 17 | MPI-ESM1-2-LR | 1.9 x 1.9 | 1 | 1 | 1 | 1 | 1 | r1i1p1f1 |
| 18 | MRI-ESM2-0 | 1.1 x 1.1 | 1 | 1 | 1 | 1 | 1 | r1i1p1f1 |
| 19 | NorESM2-LM | 2.5 x 1.9 | 1 | 1 | 1 | 1 | 1 | r1i1p1f1 |
| 20 | NorESM2-MM | 1.3 x 0.9 | 1 | 1 | 1 | 1 | 1 | r1i1p1f1 |
| Total number of runs | 44 | 20 | 20 | 20 | 20 |
* The resolution is in Lon [∘] × Lat [∘] format.
Table 3.
Research indicators used in this study and their link to hydrological extremes.
| Name | Description | Units | Link |
|---|---|---|---|
| R1 | Summer precipitation | mm/season | Droughts |
| R2 | Spring precipitation | mm/season | Droughts |
| R3 | Autumn precipitation | mm/season | Droughts |
| R4 | Winter precipitation | mm/season | Droughts |
| R5 | Maximum length of the dry spells | days | Droughts |
| R6 | Annual precipitation | mm/year | Droughts |
| R7 | Maximum daily precipitation of a 30-year return period | mm/day | Floods |
| R8 | Maximum daily precipitation of a 10-year return period | mm/day | Floods |
| R9 | Annual count of days with precipitation greater than 10 mm | - | Floods |
| R10 | Annual count of days with precipitation greater than 20 mm | - | Floods |
| R11 | Annual count of days with precipitation greater than 30 mm | - | Floods |
Table 4.
Change factors for the SSP1-2.6 scenario. Change factors smaller than one denote decreases while larger increases. NCCS denotes no significant change, NR non-reliable projections. The CCS shown in the table is the average of the methodologies.
Table 4.
Change factors for the SSP1-2.6 scenario. Change factors smaller than one denote decreases while larger increases. NCCS denotes no significant change, NR non-reliable projections. The CCS shown in the table is the average of the methodologies.
| Future scenario SSP1-2.6 | |||||||||||
|---|---|---|---|---|---|---|---|---|---|---|---|
| Station | R1 | R2 | R3 | R4 | R5 | R6 | R7 | R8 | R9 | R10 | R11 |
| El Alto | NCCS | NCCS | 1.25 | NR | 0.68 | 1.12 | 0.76 | NCCS | 1.06 | 1.63 | 0.74 |
| Oruro | 1.1 | 0.74 | 1.26 | NR | NCCS | 1.12 | NCCS | NCCS | NR | NR | NR |
| Potosi | 1.09 | 0.79 | NR | NR | NCCS | 1.05 | NR | NR | 1.08 | 1.33 | NR |
| Cochabamba | 1.06 | 1.33 | NR | NR | 0.63 | 1.15 | NCCS | NCCS | NR | 1.47 | 1.38 |
| Sucre | NR | 0.77 | NCCS | NR | NR | NR | NCCS | NR | NR | 1.2 | 1.25 |
| Tarija | 1.35 | NR | 1.89 | NR | NCCS | 1.51 | 0.79 | NCCS | 1.57 | 1.64 | NR |
| Cobija | 1.15 | NCCS | NCCS | NR | NR | NCCS | 0.66 | NR | NCCS | NCCS | NR |
| Guayaramerin | NCCS | NR | 1.28 | NR | NCCS | NR | 0.65 | NR | 1.14 | 1.19 | 1.3 |
| Rurrenabaque | NR | 1.18 | 0.78 | 0.74 | NR | 0.92 | 0.64 | 0.7 | NR | NR | NR |
| Trinidad | NR | 0.77 | NR | 1.54 | NCCS | 0.92 | 0.54 | 0.77 | 0.86 | 0.86 | NCCS |
| Trompillo | NR | NR | NR | 1.65 | NCCS | NR | NCCS | NCCS | NR | 1.51 | 1.82 |
| Camiri | NR | 1.31 | NR | NR | 0.78 | 1.18 | NR | NR | NR | 1.25 | 1.3 |
| Yacuiba | NR | 1.39 | 1.32 | NCCS | 0.7 | NR | NCCS | 1.19 | NR | NR | NR |
Table 5.
Change factors for the SSP5-8.5 scenario. Change factors smaller than one denote decreases while larger increases. NCCS denotes no significant change, NR non-reliable projections. The CCS shown in the table is the average of the methodologies.
Table 5.
Change factors for the SSP5-8.5 scenario. Change factors smaller than one denote decreases while larger increases. NCCS denotes no significant change, NR non-reliable projections. The CCS shown in the table is the average of the methodologies.
| Future scenario SSP5-8.5 | |||||||||||
|---|---|---|---|---|---|---|---|---|---|---|---|
| Station | R1 | R2 | R3 | R4 | R5 | R6 | R7 | R8 | R9 | R10 | R11 |
| El Alto | 1.42 | NR | 1.88 | NR | 0.68 | 1.59 | 0.76 | 0.82 | 1.47 | NR | NR |
| Oruro | 1.6 | NR | 2.07 | NR | 0.55 | 1.6 | 0.7 | NR | NR | NR | NR |
| Potosi | NR | NR | 1.25 | NR | NR | 1.08 | NR | NR | NR | 1.49 | NR |
| Cochabamba | 1.14 | 1.47 | 1.32 | NR | 0.61 | 1.31 | 0.83 | NR | 1.17 | 2.36 | NR |
| Sucre | NR | 0.84 | 1.13 | NR | NR | 1.08 | NCCS | NR | NR | 1.28 | NR |
| Tarija | NR | 1.54 | 2.1 | NR | NR | 1.5 | 0.79 | NR | 1.62 | 1.49 | NR |
| Cobija | NR | 0.82 | 1.09 | NR | NR | 0.94 | NCCS | NCCS | 0.9 | NCCS | 0.7 |
| Guayaramerin | NCCS | NR | 1.3 | NR | NCCS | NR | 0.65 | 0.77 | NR | 1.24 | 1.47 |
| Rurrenabaque | 0.65 | 0.83 | 0.53 | 0.66 | NR | 0.69 | NCCS | NCCS | 0.73 | 0.69 | 0.74 |
| Trinidad | NR | 0.72 | NR | 1.47 | NCCS | 0.86 | NCCS | 0.74 | 0.88 | 0.83 | NCCS |
| Trompillo | NR | NR | NR | NR | NCCS | NR | NCCS | NCCS | NR | 2.33 | NR |
| Camiri | 1.84 | 1.76 | 2.07 | NR | NCCS | 1.9 | NR | NR | NR | 2.17 | 2.89 |
| Yacuiba | NR | 2.45 | 1.89 | NR | 0.69 | NR | NCCS | 1.13 | NR | NR | NR |
Disclaimer/Publisher’s Note: The statements, opinions and data contained in all publications are solely those of the individual author(s) and contributor(s) and not of MDPI and/or the editor(s). MDPI and/or the editor(s) disclaim responsibility for any injury to people or property resulting from any ideas, methods, instructions or products referred to in the content. |
© 2024 by the authors. Licensee MDPI, Basel, Switzerland. This article is an open access article distributed under the terms and conditions of the Creative Commons Attribution (CC BY) license (https://creativecommons.org/licenses/by/4.0/).
Copyright: This open access article is published under a Creative Commons CC BY 4.0 license, which permit the free download, distribution, and reuse, provided that the author and preprint are cited in any reuse.


