Submitted:
15 April 2024
Posted:
16 April 2024
Read the latest preprint version here
Abstract
Lysine plays a crucial role in promoting development, enhancing immune function, and improving the function of central nervous system tissues. The two configurational isomers of amino acids have significantly different effects. Currently, methods for chiral recognition of lysine all have drawbacks such as expensive equipment and complicated detection processes, whereas fluorescence analysis boasts high sensitivity, strong selectivity, and simple operation. In this study, we synthesized four novel Binaphthyl-Amine (BINAM)-based fluorescent probes capable of specifically identifying the L-configuration of lysine among the twenty amino acids constituting human proteins. The enantiomeric fluorescence enhancement ratio (ef or ΔIL/ΔID) reached up to 15.29, demonstrating high enantioselectivity. We also evaluated the probe's recognition ability under different pH, reaction times, and metal ion conditions, as well as the Limit of Detection of the probe. Our findings indicate that this probe is a highly stable tool for detecting chiral lysine.
Keywords:
Lysine Chiral Recognition
; BINAM-based Fluorescent Probes
; Enantioselectivity
; Fluorescence Analysis
1. Introduction
The presence of chiral amino acids in living organisms is rooted in the origins of life and the natural selection of molecular synthesis. The early Earth environment likely harbored certain physical or chemical conditions that led to chiral selection, laying the foundation for the formation of life molecules. Within living organisms, the molecular synthesis process exhibits selectivity for specific chiral amino acids, with enzymes and catalysts favoring the efficient synthesis or utilization of L-configured amino acids. Throughout the evolutionary process, organisms gradually developed a preference for specific chiral amino acids, enhancing their chances of survival and reproduction.[1] This selectivity is associated with affinity for particular configurations, catalytic efficiency, and molecular stability, ultimately influencing normal biological functions and adaptation to the environment. In summary, the existence of chiral amino acids is a result of the interplay between the early Earth environment and biological evolution, providing crucial groundwork for the formation and development of life systems.[2,3]
Amino acids are the basic units that constitute the macromolecule proteins in living organisms and are also crucial components in life processes.[4] In the natural amino acids, apart from glycine, all other amino acids exist in two stereoisomeric forms, L and D. During protein synthesis, living organisms selectively utilize L-configured amino acids, highlighting the biological preference for this stereoisomer. The specific spatial arrangement of L-amino acids is essential for proper protein folding, maintaining the structural integrity critical for biological activity.[5] Enzymes, hormones, and other biomolecules often exhibit high selectivity for L-configured amino acids, influencing metabolic pathways and biological functions. Additionally, the role of amino acid chirality extends to drug design, where the preferential use of L-configured amino acids enhances the biological compatibility and efficacy of pharmaceuticals.[6] The role of D-amino acids in living organisms is relatively limited, primarily demonstrated in specific areas such as antimicrobial activity, drug design, research tools, and applications in veterinary medicine and animal feed, showcasing certain biological functions and potential utility.[7] Overall, the chiral nature of amino acids profoundly impacts the structure, function, and regulation of biological systems, reflecting the evolutionary adaptability and survival advantages associated with specific stereoisomers.
Lysine is a basic amino acid, and most higher animals cannot synthesize lysine.[8] Therefore, lysine is an essential amino acid that must be ingested in sufficient quantities from the diet to maintain protein synthesis.[9] L-lysine is considered an essential amino acid of great importance to human health, playing a significant role in enhancing immunity, promoting calcium absorption, and improving central nervous system function.[10] Abnormal metabolism of L-lysine may lead to certain cancers.[11] L-lysine has multiple functions, including enhancing immunity, promoting skeletal muscle growth, facilitating fat metabolism, and alleviating anxiety.[12,13,14,15]Additionally, it can also produce synergistic effects with other nutrients and promote their absorption, improving the utilization efficiency of various nutrients, and thereby better expressing the physiological functions of different nutrients.[16,17] A deficiency in D-lysine may lead to adverse health reactions, including uremia. There are differences in the efficiency with which D-lysine and L-lysine are absorbed and utilized by the body, with D-lysine having a lower absorption and utilization rate, while the primary biological activity is provided by L-lysine.[18] Lysine plays a crucial role in the function of proteins. Due to its widespread and reliable role as a drug target, lysine has received extensive attention.[19] Therefore, it also plays an important role in distinguishing different enantiomers.
Although there are already some methods for detecting lysines, such as the luminol chemiluminescence method,[20] gas chromatography-mass spectrometry,[21] synchrotron X-ray powder diffraction, and thermogravimetric analysis,[22] these methods come with the disadvantages of expensive equipment and cumbersome detection processes. Therefore, there is a need for a simple and efficient method for detecting lysine. Fluorescence analysis, with its advantages of high sensitivity, strong selectivity, low sample requirement, and simplicity, has attracted great interest from researchers. However, the current synthesis of many fluorescent probes is challenging, and they only exhibit limited enantioselectivity.[23] Therefore, preparing efficient fluorescent probes for the chiral recognition of lysine via a simple synthetic route remains a significant challenge.
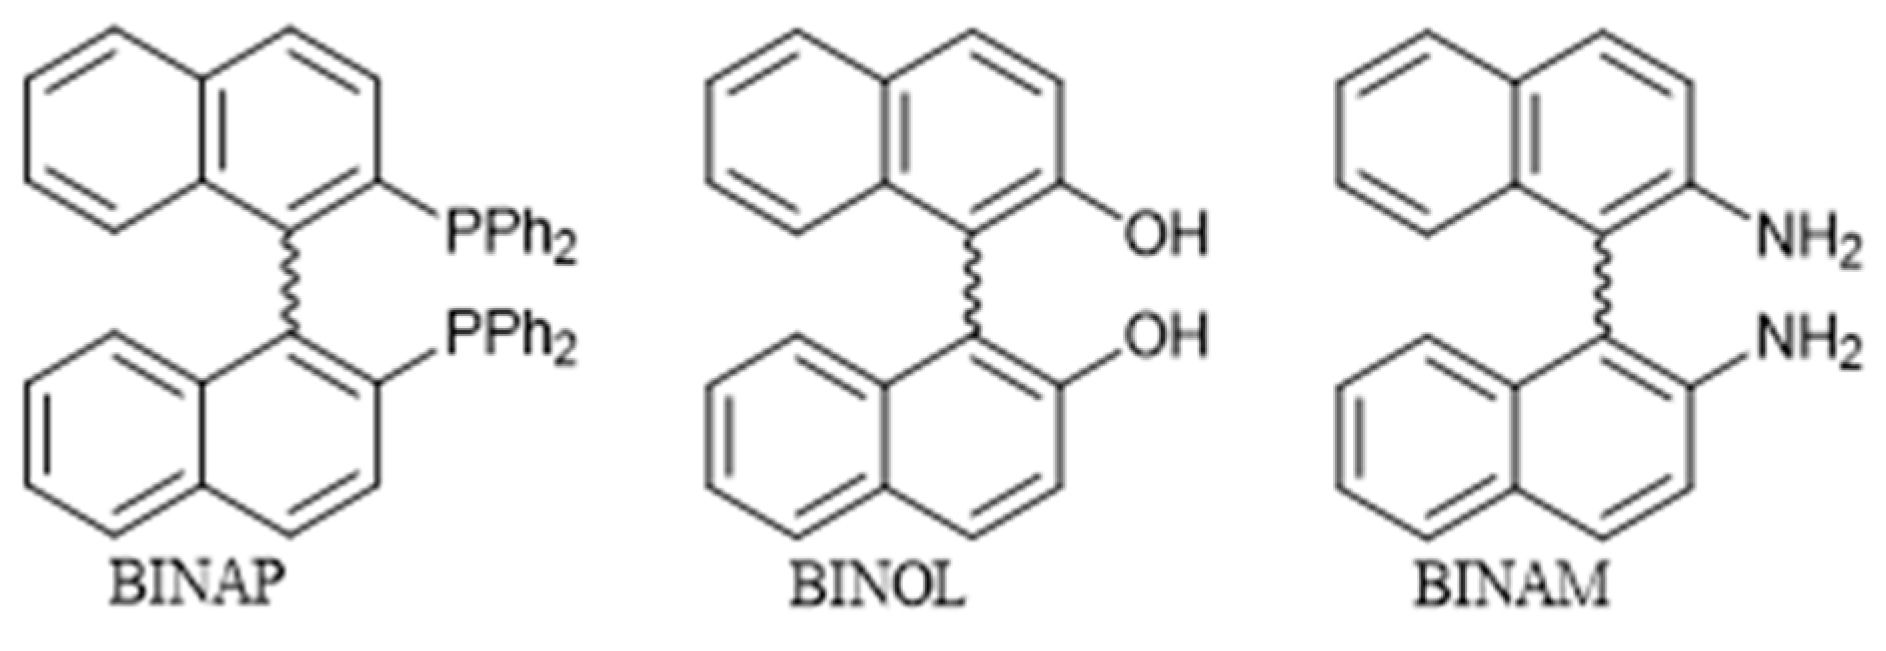
In recent years, axially chiral 1.1'-Binaphthyl-2.2'-diphemyl phosphine(BINAP), 1,1'-binaphthyl-2,2'-diol(BINOL) (Figure 1), and their derivatives have become one of the most successful chiral ligands/catalysts in asymmetric catalysis and are widely used in various enantioselective catalyzes.[24] However, 2,2'-Diamino-1,1'-binaphthalene (BINAM), which also possesses axial chirality, has seen very limited application in asymmetric synthesis, with relatively few related publications. BINAM has long been considered by researchers as a potential fluorescent detector for the efficient chiral recognition of α-phenylethylamine and tryptophan enantiomers.[25] Previous studies have shown that probes based on BINAM can highly selectively recognize lysine in aqueous solutions, but the results indicated a significant fluorescent response for both configurations, thus unable to distinguish the configuration of lysine.[26] This article has discovered and synthesized a fluorescent probe that can selectively recognize L-lysine with high selectivity in physiological conditions. The results indicate that other amino acids do not affect the recognition effect, and the probe has the advantages of being acid and alkali resistant, sensitive, and capable of recognition over a longer period. We also studied the recognition effect of the probe in the presence of certain metal ions and the substitution sites of the probe. The results are presented below.
2. Experimental
2.1. Reagents and Apparatus
1H, 13C, and 19F NMR spectra were measured using a Bruker AM600 NMR spectrometer. The chemical shifts of the NMR spectra are given in ppm relative to the internal reference TMS (1H, 0.00ppm) for protons. HRMS spectral data were recorded on a Bruker Micro-TOF-QII mass spectrometer. Fluorescence spectra were obtained at 298 K using a (F97 Pro) spectrofluorophotometer with an excitation wavelength of 365 nm. All chemicals involved in the experiments were purchased from Adamas Chemistry Co., Ltd (Shanghai, China). The chemicals were obtained from commercial suppliers and used without further purification. All solvents used in the optical spectroscopy studies were of HPLC or spectroscopic grade.
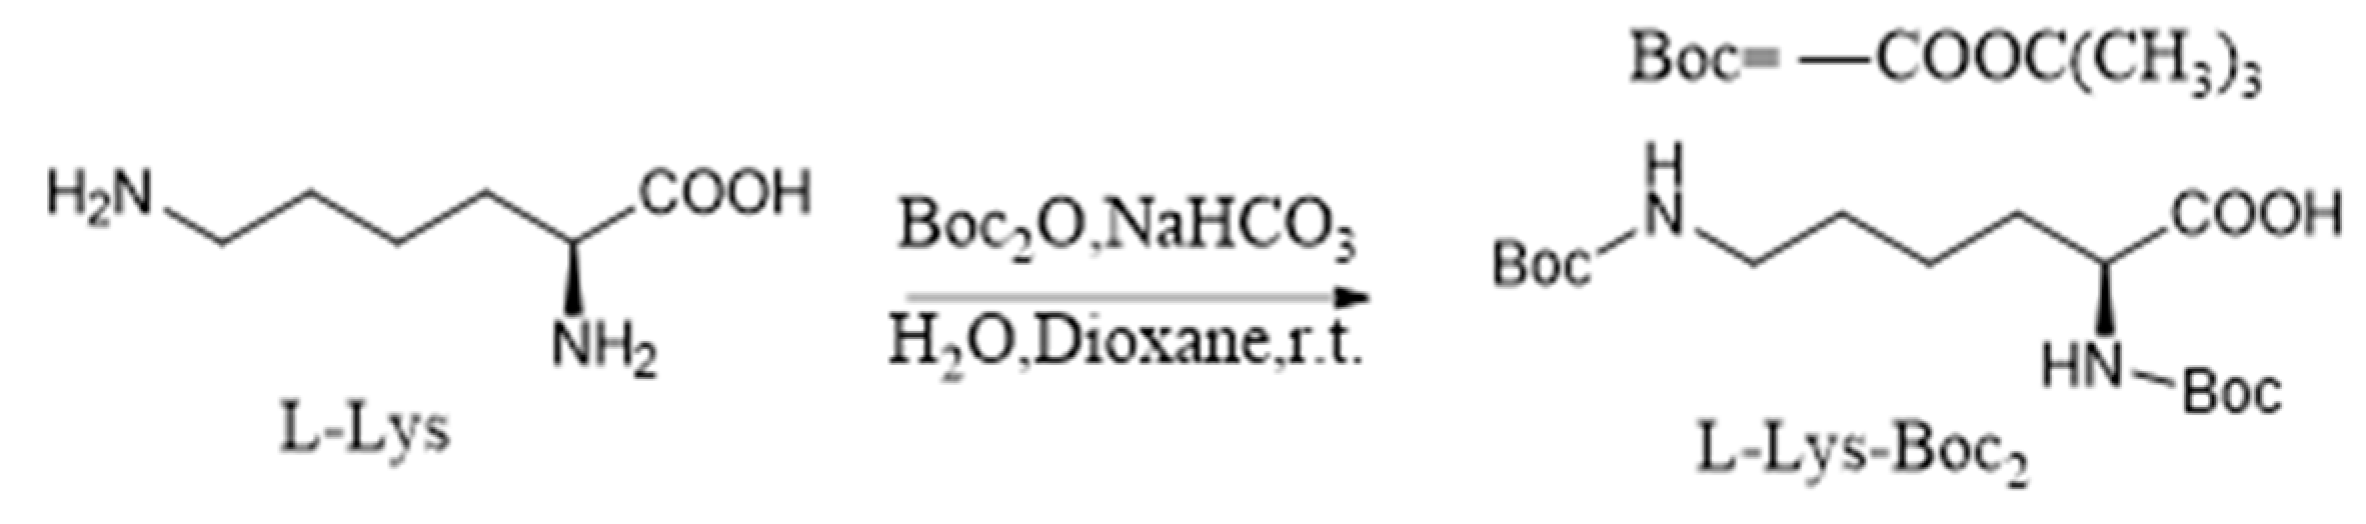
2.2. Synthesis of L-Lys-Boc2
L-Lysine (731 mg, 5 mmol) was added to 100 mL of H2O containing NaHCO3 (840 mg, 10 mmol), and, under stirring, Boc2O (1500 mg, 6.87 mmol) dissolved in 50 mL of dioxane was slowly added, followed by stirring at room temperature for 12 hours. Boc2O (1500 mg, 6.87 mmol) dissolved in 50 mL of dioxane was then added slowly again under stirring, and the reaction progress was monitored by thin-layer chromatography (TLC). After the reaction proceeded for an additional 12 hours, it was extracted three times with 50 mL of DCM and washed three times with 20 mL of H2O. The organic solvent was removed under reduced pressure, and the crude product was purified by silica gel column chromatography, eluting with DCM/MeOH (30:1) to obtain a yellow gel-like L-Lys-Boc2 with a yield of 84% (1455 mg, 4.2 mmol), as shown in Scheme 1. Similarly, a colorless gel-like D-Lys-Boc2 was obtained using the same method, with a yield of 80%.
2.3. Synthesis of (L, R)-1
To a solution of R-BINAM (284 mg, 1 mmol) in DCM (30 mL), triethylamine (200 μL, 1.5 mmol) was added. After cooling the mixture to 0°C, 2,3,4,5,6-pentafluorobenzoyl chloride (230 mg, 1 mmol) was slowly added dropwise, and the mixture was stirred at room temperature for 8 hours. The progress of the reaction was monitored by thin-layer chromatography (TLC). After the reaction was complete, the mixture was washed three times with 20 mL of H2O. The organic solvent was removed under reduced pressure, and the crude product was purified by silica gel column chromatography, eluting with DCM/PE (1:1) to obtain a pale-yellow powder R-1, with a yield of 65% (310 mg, 0.65 mmol). The same method yielded a pale-yellow powder S-1, with a yield of 59%. Next, R-1 (239 mg, 0.5 mmol) was added to a DCM solution (30 mL) and stirred at 0°C. After cooling the system to 0°C, HOBt (81 mg, 0.6 mmol) and EDCI (93 mg, 0.6 mmol) were added, and the mixture was stirred for 2 minutes before adding L-Lys-Boc2 (346 mg, 1 mmol). The system was then transferred to room temperature and stirred for 20 hours, with the progress of the reaction monitored by TLC. After the reaction was complete, the mixture was washed three times with 20 mL of H2O. In the back of removing the organic solvent under reduced pressure, the crude product was purified by silica gel column chromatography, eluting with DCM/MeOH (50:1), and following removing the organic solvent under reduced pressure, a white powder defined as (L, R)-1 was obtained, with a yield of 34% (137 mg, 0.17 mmol), as shown in Scheme 2. L/D is the configuration of Lys-Boc2 and R/S is the configuration of BINAM. The same method yielded (L, S)-1 with a yield of 32%, (D, R)-1 with a yield of 38%, and (D, S)-1 with a yield of 28%.
The four fluorescent probes were characterized by 1H NMR, 13C NMR, 19F NMR, and MS, with the spectral data provided in the supplemental Information.
2.4. Preparation of Samples for Fluorescence Analysis
Solutions of four sensors were separately prepared at a concentration of 2.0 mM in ethanol, and amino acids were prepared at a concentration of 200 mM in Deionized water as stock solutions, to be used immediately upon preparation. In the study of selectivity towards amino acids, 30 μL of the sensor/EtOH stock solution was mixed with 30 μL of the amino acid/ H2O stock solution, left to stand for 10 minutes, and then diluted with PBS buffer (pH=7.4) to 3000 μL to form the detection solution. In the study of Amino acids selectivity, 30 μL of the L-Lys stock solution was first mixed with 30 μL of the stock solution of another amino acid, left to stand for 10 minutes, followed by the addition of 30 μL of the sensor/EtOH stock solution, and then diluted with PBS buffer to 3000 μL to form the detection solution. For the study recognition in different pH, 30 μL of the sensor/EtOH stock solution was mixed with 30 μL of the Lys/ H2O stock solution, left to stand for 10 minutes, and then diluted with PBS buffer at the corresponding pH to 3000 μL to form the detection solution, adjusting the pH with dilute solutions of NaOH and HCl. In the study of the detection limit of the probes, Lys was re-prepared at a concentration of 20 mM in Deionized water as the stock solution. 30 μL of the sensor/EtOH stock solution was mixed with 3x μL of the Lys/ H2O stock solution, left to stand for 10 minutes, and then diluted with buffer to 3000 μL to form the detection solution, where x corresponds to the concentration ratio of Lys. In the study of the effect of metal ions on probe recognition, 30 μL of the sensor/EtOH stock solution was first mixed with 30 μL of a 4.0 mM solution of metal chloride, left to stand for 10 minutes, followed by the addition of 30 μL of the L-Lys stock solution, and then diluted with PBS buffer at pH 7.4 to 3000 μL to form the detection solution.
In the experiments described, the volume concentration of EtOH in the detection solution is 1%, and the concentration of the sensor is 0.02 mM. Except for the experiments determining the detection limit, the concentration of amino acids is maintained at 2 mM. All fluorescence data, except for those related to stability studies, were obtained within 3 hours. Unless specifically stated, the data were obtained at room temperature with PBS buffer (pH=7.4, EtOH/PBS =1/99, v/v) solution as the solvent. Reaction time :30 min. PMT: 650V. Error bars from three independent experiments. λexc = 365 nm. Slit: 20/10 nm.
3. Result and Discussion
3.1. Chiral Recognition of D/L-Lysine
Based on Binaphthyl Amine, we designed and synthesized four novel probes, and found that all four probes could dissolve in organic solvents, particularly ethanol solution. Subsequently, we diluted them into PBS buffer (pH=7.4) as the reaction buffer (Experimental section).
Firstly, we investigated the fluorescent response of these four probes towards 20 amino acids and their chiral forms. We discovered that all four probes exhibited significant fluorescence enhancement for L-lysine at 437nm (Figure 2. a). Then we use “I” to represent the fluorescence intensity of the probe in response to the component recognition, and “I0” denotes the initial fluorescence intensity of the probe. The values of I/I0 for L-Lys were 16.89, 21.08, 17.60 and 29.23, respectively. In contrast, His and Trp exhibited values between 3.0-5.0, while the remaining amino acids ranged between 0.8 and 1.5 (Figure 2. b). The chiral recognition efficacy, ef (ef = enantiomeric fluorescence enhancement ratio = [IL − I0]/[I − I0]=ΔIL/ΔID. I0, the fluorescence intensity of the probe. IL or ID, fluorescence intensity with L or D substrate) was calculated as follows: ef [(D, R)-1] =9.99, ef [(D, S)-1] =9.12, ef [(L, R)-1] =15.29 and ef [(L, S)-1] =10.43, This demonstrates that all four probes are capable of efficiently and specifically recognizing L-Lys within chiral amino acids.
3.2. Interference by Other Amino Acids in Probe Recognition
In living organisms, multiple amino acids are simultaneously present. It is crucial to study the recognition of chiral lysine in the presence of various amino acids for newly synthesized probes. Under physiological conditions (PBS buffer, pH=7.4), the fluorescence absorption intensity at 437nm was measured for the other 19 amino acids and their chiral forms, each at the same concentration as L-lysine. Strong intensity peaks were observed for all of them (Figure 3. a). To compare this interference, we set “IC” as the fluorescence intensity when the probe recognizes L-lysine and “I” as the fluorescence intensity when the probe recognizes L-lysine in the presence of other amino acids. Our research results indicate that all values of I/IC range between 0.9 and 1.1. Therefore, in the presence of other amino acids, the probe can effectively recognize L-lysine (Figure 3. b).
3.3. Recognition in Different pH
We anticipate that these novel probes can be utilized in multiple fields, as the stability of the probe's recognition of L-lysine across different pH levels is crucial for its widespread applicability. The results indicate that within the pH range of 3 to 12, the recognition efficiency of the probe for L-lysine is similar to its fluorescence intensity in PBS (pH 7.4). Therefore, pH does not affect the probe's ability to recognize L-lysine (Figure 4).
3.4. The Reaction Time of the Probes
We separately tested the recognition capabilities of four probes towards L-lysine at various time intervals to determine the reaction efficiency and stability of the probes. Taking (L, R)-1 as an example, the study results show that the reaction between the probe and L-Lys is very rapid, allowing for recognition and detection within 1 minute. The recognition effect of the probe at 8 hours still retains 92.2% of its initial efficiency (Figure 5).
3.5. Limit of Detection
The study examined the fluorescence spectra of probes for L-lysine at different concentrations, as shown in Figure 6. The concentration of the probe was fixed at 0.02 mM, while the concentration of L-lysine ranged from 0.02 mM (eq=1:1) to 1 mM (eq=1:50). The fluorescence intensity significantly increased with the concentration of L-Lys, and the fluorescence intensity at λ=437 nm was fitted using Origin. The emission showed a linear positive correlation, with adjusted R-squared values for (D, R)-1, (D, S)-1, (L, R)-1, (L, S)-1 being: 0.99883, 0.9994, 0.99455, 0.99536, respectively. Based on the limit of detection formula LOD=3σ/K (where σ is the standard deviation of the probe samples, and K is the slope of the fitted line), LOD for L-Lys using (D, R)-1, (D, S)-1, (L, R)-1, (L, S)-1 were calculated to be 2.12×10⁻⁶M, 9.38×10⁻⁶M, 5.98×10⁻⁶M and 5.18×10⁻⁶M.
3.6. The Effect of Metal Ions
Metal ions can indeed form complexes that may impact the recognition effect of probes. In this study, the recognition effect of the probe on L-lysine was investigated in the presence of various metal ions: Co2+, Fe2+, Fe3+, Mn2+, Pd2+, Ru3+, Zn2+, Sn2+ and Ca2+. To ensure that anions did not interfere, all metal salts were chosen in their chloride forms. Among these metal ions, Zn2+ notably enhanced the probe's recognition effect on L-Lys, showing an increase of at least 1.2 to 1.5 times compared to the control group. Sn2+ and Ca2+ also slightly enhanced the recognition effect (Figure 7). However, the presence of the remaining metal ions had a negative impact on the probe's recognition effect on L-Lys, indicating interference or inhibition. The presence of other metal ions will reduce the recognition effect of the probe on L-lysine, especially in the presence of Co2+, Pd2+, Ru3+, Fe2+ and Fe3+ ions, where the recognition efficiency of the probe for L-lysine is only about half of its original level.
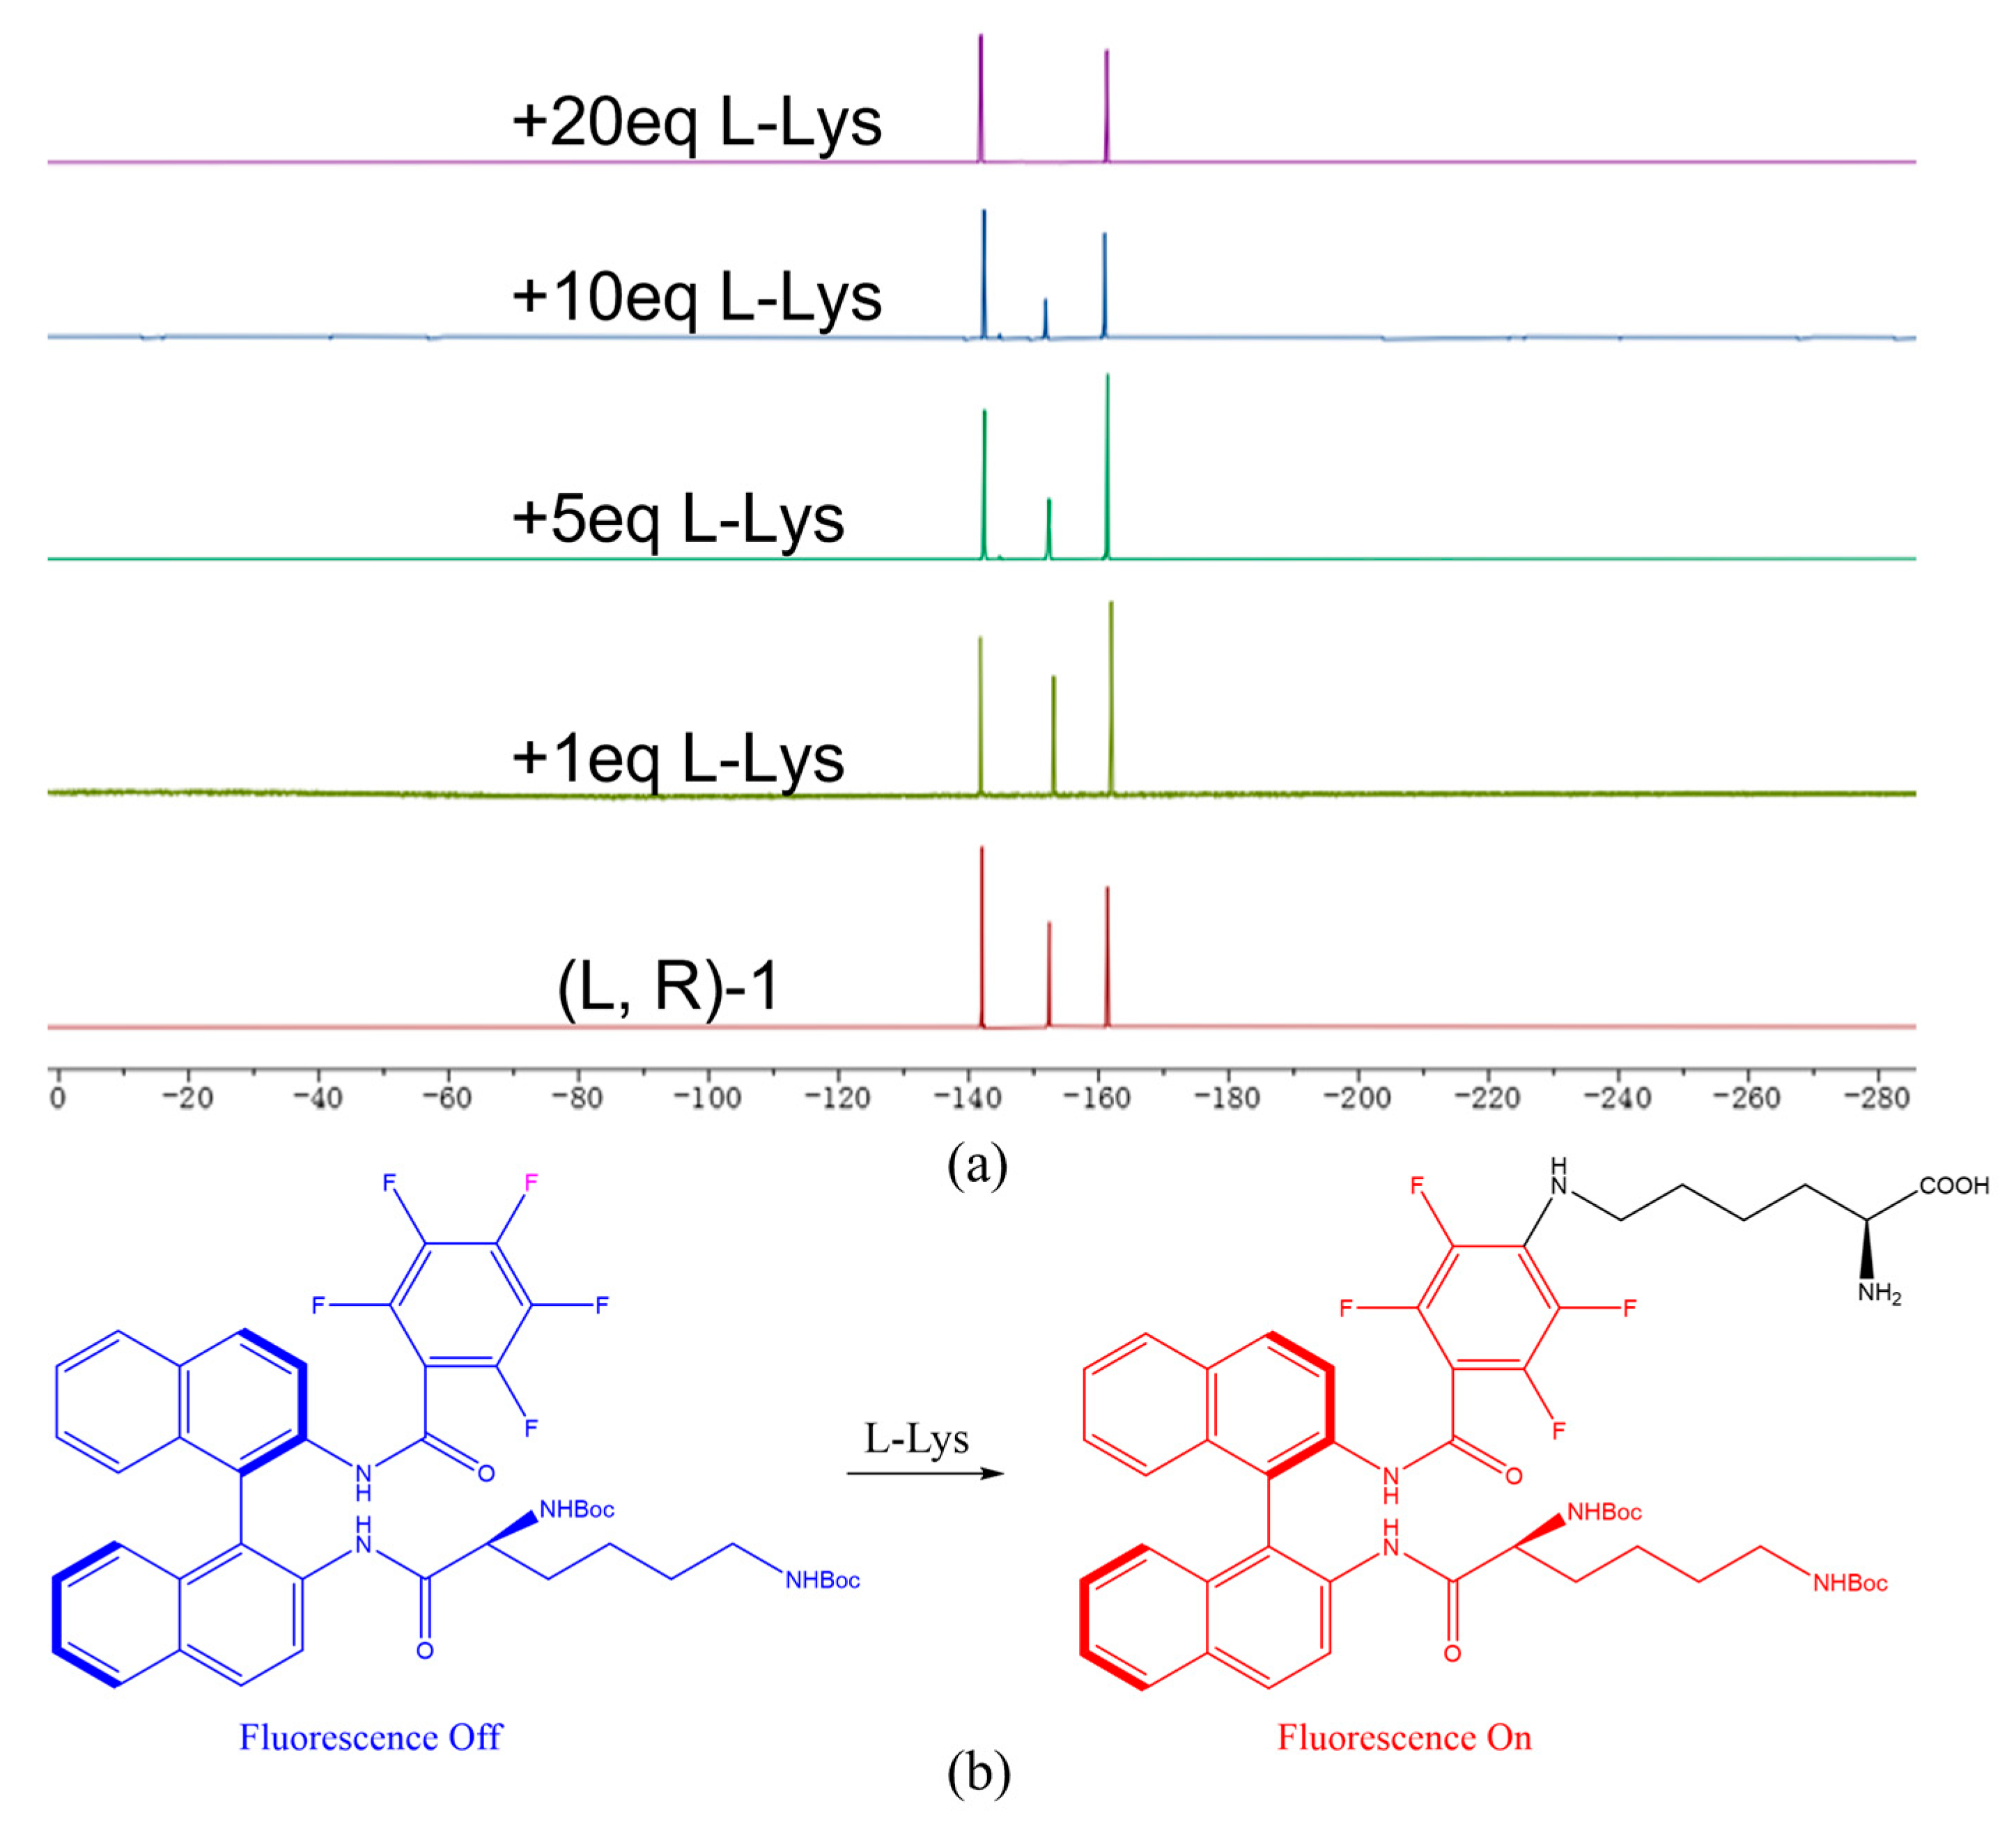
3.7. Confirm the Reaction Site by 19F NMR
The reaction between (L, R)-1 and L-Lys was investigated using 19F NMR. Figure 8(a) presents the 19F NMR spectra of (L, R)-1 treated with 0–20 equivalents of L-Lys (DMSO: D2O = 3:1). Three different fluorines on the phenyl group of (L, R)-1 exhibited peaks at δ−142.2, -152.6, and -161.4 in a 2:1:2 ratio, with the signal at δ−152.6 attributed to the para-fluorine. With the addition of L-Lys, the signal at δ-152.6 weakened, and upon increasing Lys to 20 equivalents, the signal at δ-152.6 completely disappeared. This indicates that the para-fluorine atom of (L, R)-1 is nucleophilically substituted by L-Lys, showing high regioselectivity. Figure 8(b) presents a possible binding mechanism between (L, R)-1 and L-lysine. The ε-amino group of L-lysine interacts with the para-positioned F atom of the probe. Steric hindrance and hydrogen bonding may be the reasons why D-lysine does not react well with the probe molecule.
4. Conclusions
In summary, we discovered a set of BINAM-based fluorescent probes capable of chiral recognition of L-lysine among natural amino acids. The recognition effect is not influenced by other amino acids, and the probe is stable under certain acidic and alkaline conditions, allowing for rapid identification and long-term stability. The probe is sensitive and can identify L-Lys at lower concentrations. The recognition effect of the probe is enhanced in the presence of zinc ions. We also verified through 19F NMR that the para-fluorine atom of the probe undergoes nucleophilic substitution with L-Lys. This work provides a novel, efficient, and convenient method for the chiral recognition of L-Lys.
Supplementary Materials
The following supporting information can be downloaded at the website of this paper posted on Preprints.org. Table S1: ef values for three important amino acids and explanation; Figure S1-S3: experimental data for D-lysine; Figure S4: 1H NMR spectra of R/S-1; Figure S5: 1H NMR spectra of (D/L,R/S)-1; Figure S6: 13C NMR spectra of (D/L,R/S)-1; Figure S7: 19F NMR spectra of (D/L,R/S)-1; Figure S8: MS spectra of (D/L,R/S)-1.
Author Contributions
Conceptualization, L.W. and X.L.; Validation, L.W.; Formal analysis, L.W.; Investigation, L.W.; Resources, G.Z.; Writing—original draft, L.W.; Writing—review and editing, W.C., Y.Z., X.Z. and J.Y.; Visualization, L.W.; Validation, W.C.; Supervision, G.Z.; Project administration, X.L.; Funding acquisition, G.Z. All authors have read and agreed to the published version of the manuscript.
Acknowledgments
This research was supported by Sichuan University High Level Talent Project, Sichuan Province 1,000 Talents Plan Project, Sichuan Science and Technology Program (No.2019JDRC0106). We also thank Yanping Huang from the Analysis and Testing Centre of Sichuan University for the assistance on NMR and Dr. Shiqi Zhang from Chengdu Institute of Biology, Chinese Academy of Sciences for the assistance on MS.
Conflicts of Interest
The authors declare no conflicts of interest.
References
- Ozturk, S.F. and D.D. Sasselov, On the origins of life’s homochirality: Inducing enantiomeric excess with spin-polarized electrons. Proceedings of the National Academy of Sciences 2022, 119. [CrossRef]
- BEATTY-DESANA, J.W., HOGGARD, M. J., & COOLEDGE, J. W., Letters to nature. Nature 2001, 255, 242–243.
- Copur, F., et al., Nanopaper-based photoluminescent enantioselective sensing of L-Lysine by L-Cysteine modified carbon quantum dots. Sensors and Actuators B: Chemical 2019, 279, 305–312. [CrossRef]
- Lu, W., et al., Carbon nano-dots as a fluorescent and colorimetric dual-readout probe for the detection of arginine and Cu2+and its logic gate operation. Nanoscale 2017, 9, 11545–11552. [CrossRef]
- Bonner, W.A., Parity violation and the evolution of biomolecular homochirality. Chirality 2000, 12, 114–126. [CrossRef]
- Gao, P., Z. Xie, and M. Zheng, Chiral carbon dots-based nanosensors for Sn(II) detection and lysine enantiomers recognition. Sensors and Actuators B: Chemical 2020, 319.
- Du, S., M. Wey, and D.W. Armstrong, d--Amino acids in biological systems. Chirality 2023, 35, 508–534. [CrossRef]
- Wu, G., Functional amino acids in nutrition and health. Amino Acids 2013, 45, 407–411. [CrossRef]
- Matthews, D.E., Review of Lysine Metabolism with a Focus on Humans. The Journal of Nutrition 2020, 150, 2548S–2555S. [CrossRef]
- Chang, D., et al., Ratiometric fluorescent carbon dots for enantioselective sensing of L-lysine and pH discrimination in vivo and in vitro. Sensors and Actuators B: Chemical 2022, 362.
- Song, L., et al., Plasma Free Amino Acid Profiling of Five Types of Cancer Patients and Its Application for Early Detection. PLoS ONE 2011, 6.
- Payne, A., et al., Lysine mediation of neuroendocrine food regulation in guinea fowl. Poultry Science 2016, 95, 276–286. [CrossRef] [PubMed]
- Estaras, M., et al., The lysine derivative aminoadipic acid, a biomarker of protein oxidation and diabetes-risk, induces production of reactive oxygen species and impairs trypsin secretion in mouse pancreatic acinar cells. Food and Chemical Toxicology 2020, 145.
- Jin, C.-l., et al., mTORC1-Mediated Satellite Cell Differentiation Is Required for Lysine-Induced Skeletal Muscle Growth. Journal of Agricultural and Food Chemistry 2020, 68, 4884–4892. [CrossRef] [PubMed]
- Tang, S., et al., Enantioselective Recognition of L-Lysine by ICT Effect with a Novel Binaphthyl-Based Complex. Micromachines 2023, 14.
- Loaëc, G., et al., Impact of Variety and Agronomic Factors on Crude Protein and Total Lysine in Chicory; Nε-Carboxymethyl-lysine-Forming Potential during Drying and Roasting. Journal of Agricultural and Food Chemistry 2015, 63, 10295–10302. [CrossRef] [PubMed]
- Jin, C. and J. Bao, Lysine Production by Dry Biorefining of Wheat Straw and Cofermentation of Corynebacterium glutamicum. Journal of Agricultural and Food Chemistry 2021, 69, 1900–1906. [CrossRef]
- Friedman, M. and C.E. Levin, Nutritional and medicinal aspects of d-amino acids. Amino Acids 2011, 42, 1553–1582.
- Abbasov, M.E., et al., A proteome-wide atlas of lysine-reactive chemistry. Nature Chemistry 2021, 13, 1081–1092. [CrossRef]
- Kugimiya, A., R. Fukada, and D. Funamoto, A luminol chemiluminescence method for sensing histidine and lysine using enzyme reactions. Analytical Biochemistry 2013, 443, 22–26. [CrossRef]
- Namera, A., Yashiki, M., Nishida, M., & Kojima, T., Direct extract derivatization for determination of amino acids in human urine by gas chromatography and mass spectrometry. Journal of Chromatography B 2002, 776, 49–55.
- Chen, T., et al., Differential Adsorption of l-- and d--Lysine on Achiral MFI Zeolites as Determined by Synchrotron X--Ray Powder Diffraction and Thermogravimetric Analysis. Angewandte Chemie International Edition 2019, 59, 1093–1097.
- Zhu, Y.-Y., et al., Free Amino Acid Recognition: A Bisbinaphthyl-Based Fluorescent Probe with High Enantioselectivity. Journal of the American Chemical Society 2018, 141, 175–181.
- Cheng, D.J., et al., Highly Enantioselective Kinetic Resolution of Axially Chiral BINAM Derivatives Catalyzed by a Brønsted Acid. Angewandte Chemie International Edition 2014, 53, 3684–3687. [CrossRef] [PubMed]
- Averin, A.D., et al., Pd(0)-catalyzed amination in the synthesis of chiral derivatives of BINAM and their evaluation as fluorescent enantioselective detectors. Pure and Applied Chemistry 2020, 92, 1367–1386. [CrossRef]
- Zhao, H., et al., Spectroscopic studies of a BINAM-based sensor: Highly selective fluorescent recognition of lysine in water solution through a nucleophilic substitution reaction. Tetrahedron Letters 2019, 60, 1238–1242. [CrossRef]
Figure 1.
BINAP, BINOL and BINAM.
Scheme 1.
Synthesis of L-Lys-Boc2.
Scheme 2.
Synthesis of (L, R)-1.
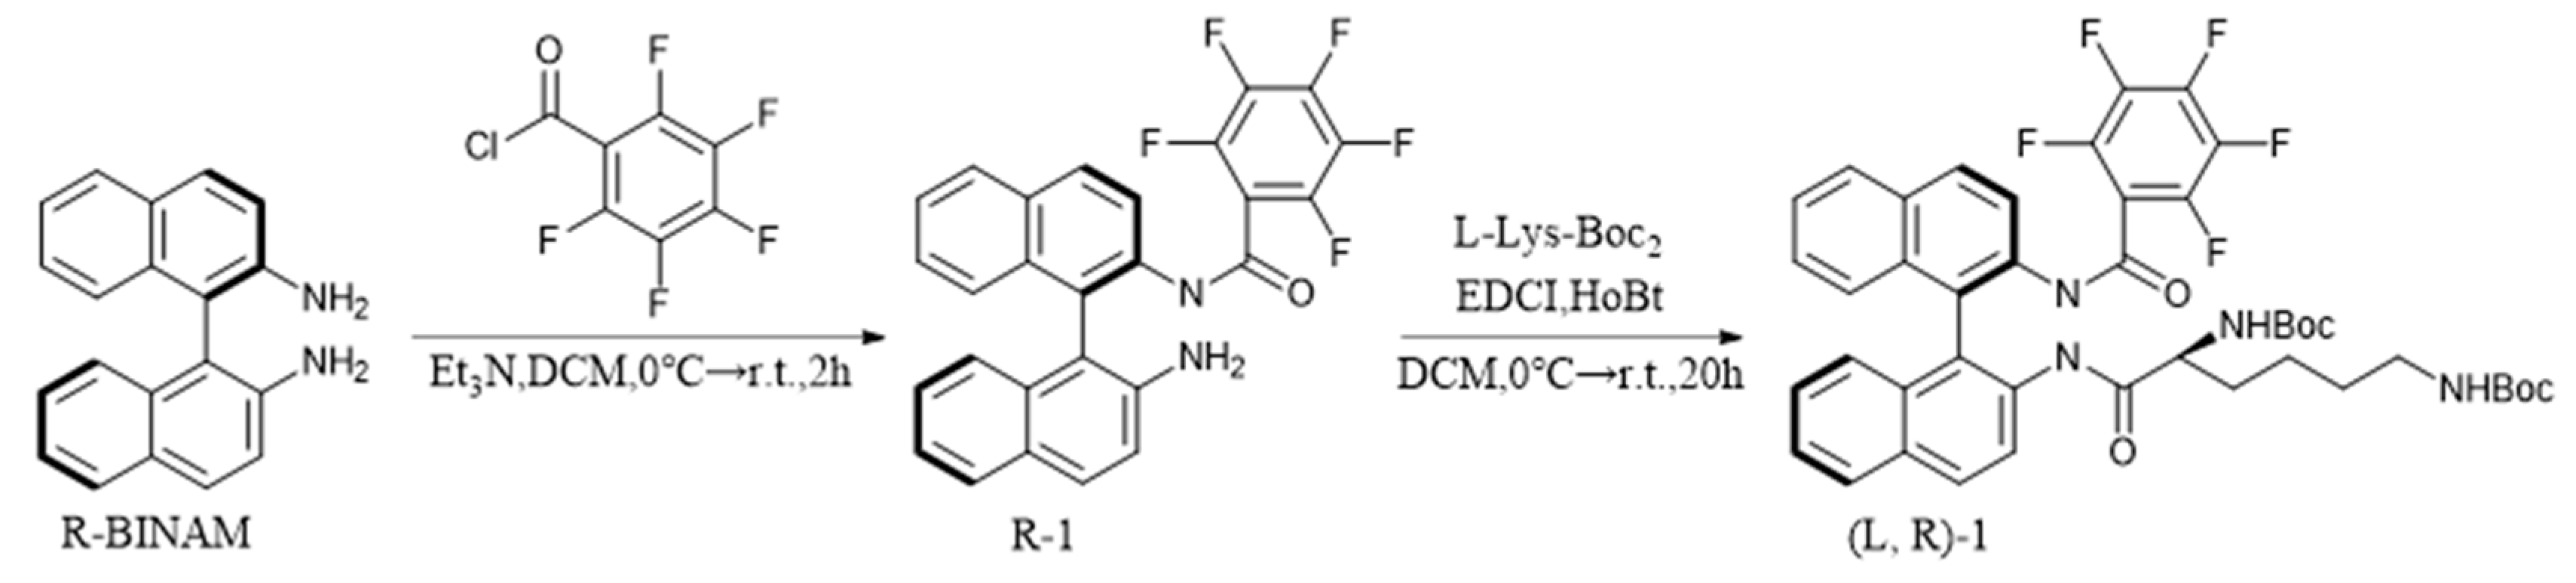
Figure 2.
(a) Fluorescence spectra of probe (0.02 mM) to various amino acids (2 mM). (b) Plot of the fluorescence enhancement I/I0 at 437 nm. (The sequence of amino acids tested includes: D/L-Ala(A), D/L-Arg(R), D/L-Asp(N), D/L-Asp(P), D/L-Cys(C), D/L-Glu(Q), D/L-Glu(E), Gly(G), D/L-His(H), D/L-Iso(I), D/L-Leu(L), D/L-Lys(K), D/L-Met(M), D/L-Phe(F), D/L-Pro(P), D/L-Ser(S), D/L-Thr(T), D/L-Trp(W), D/L-Tyr(Y) ,and D/L-Val(V).).
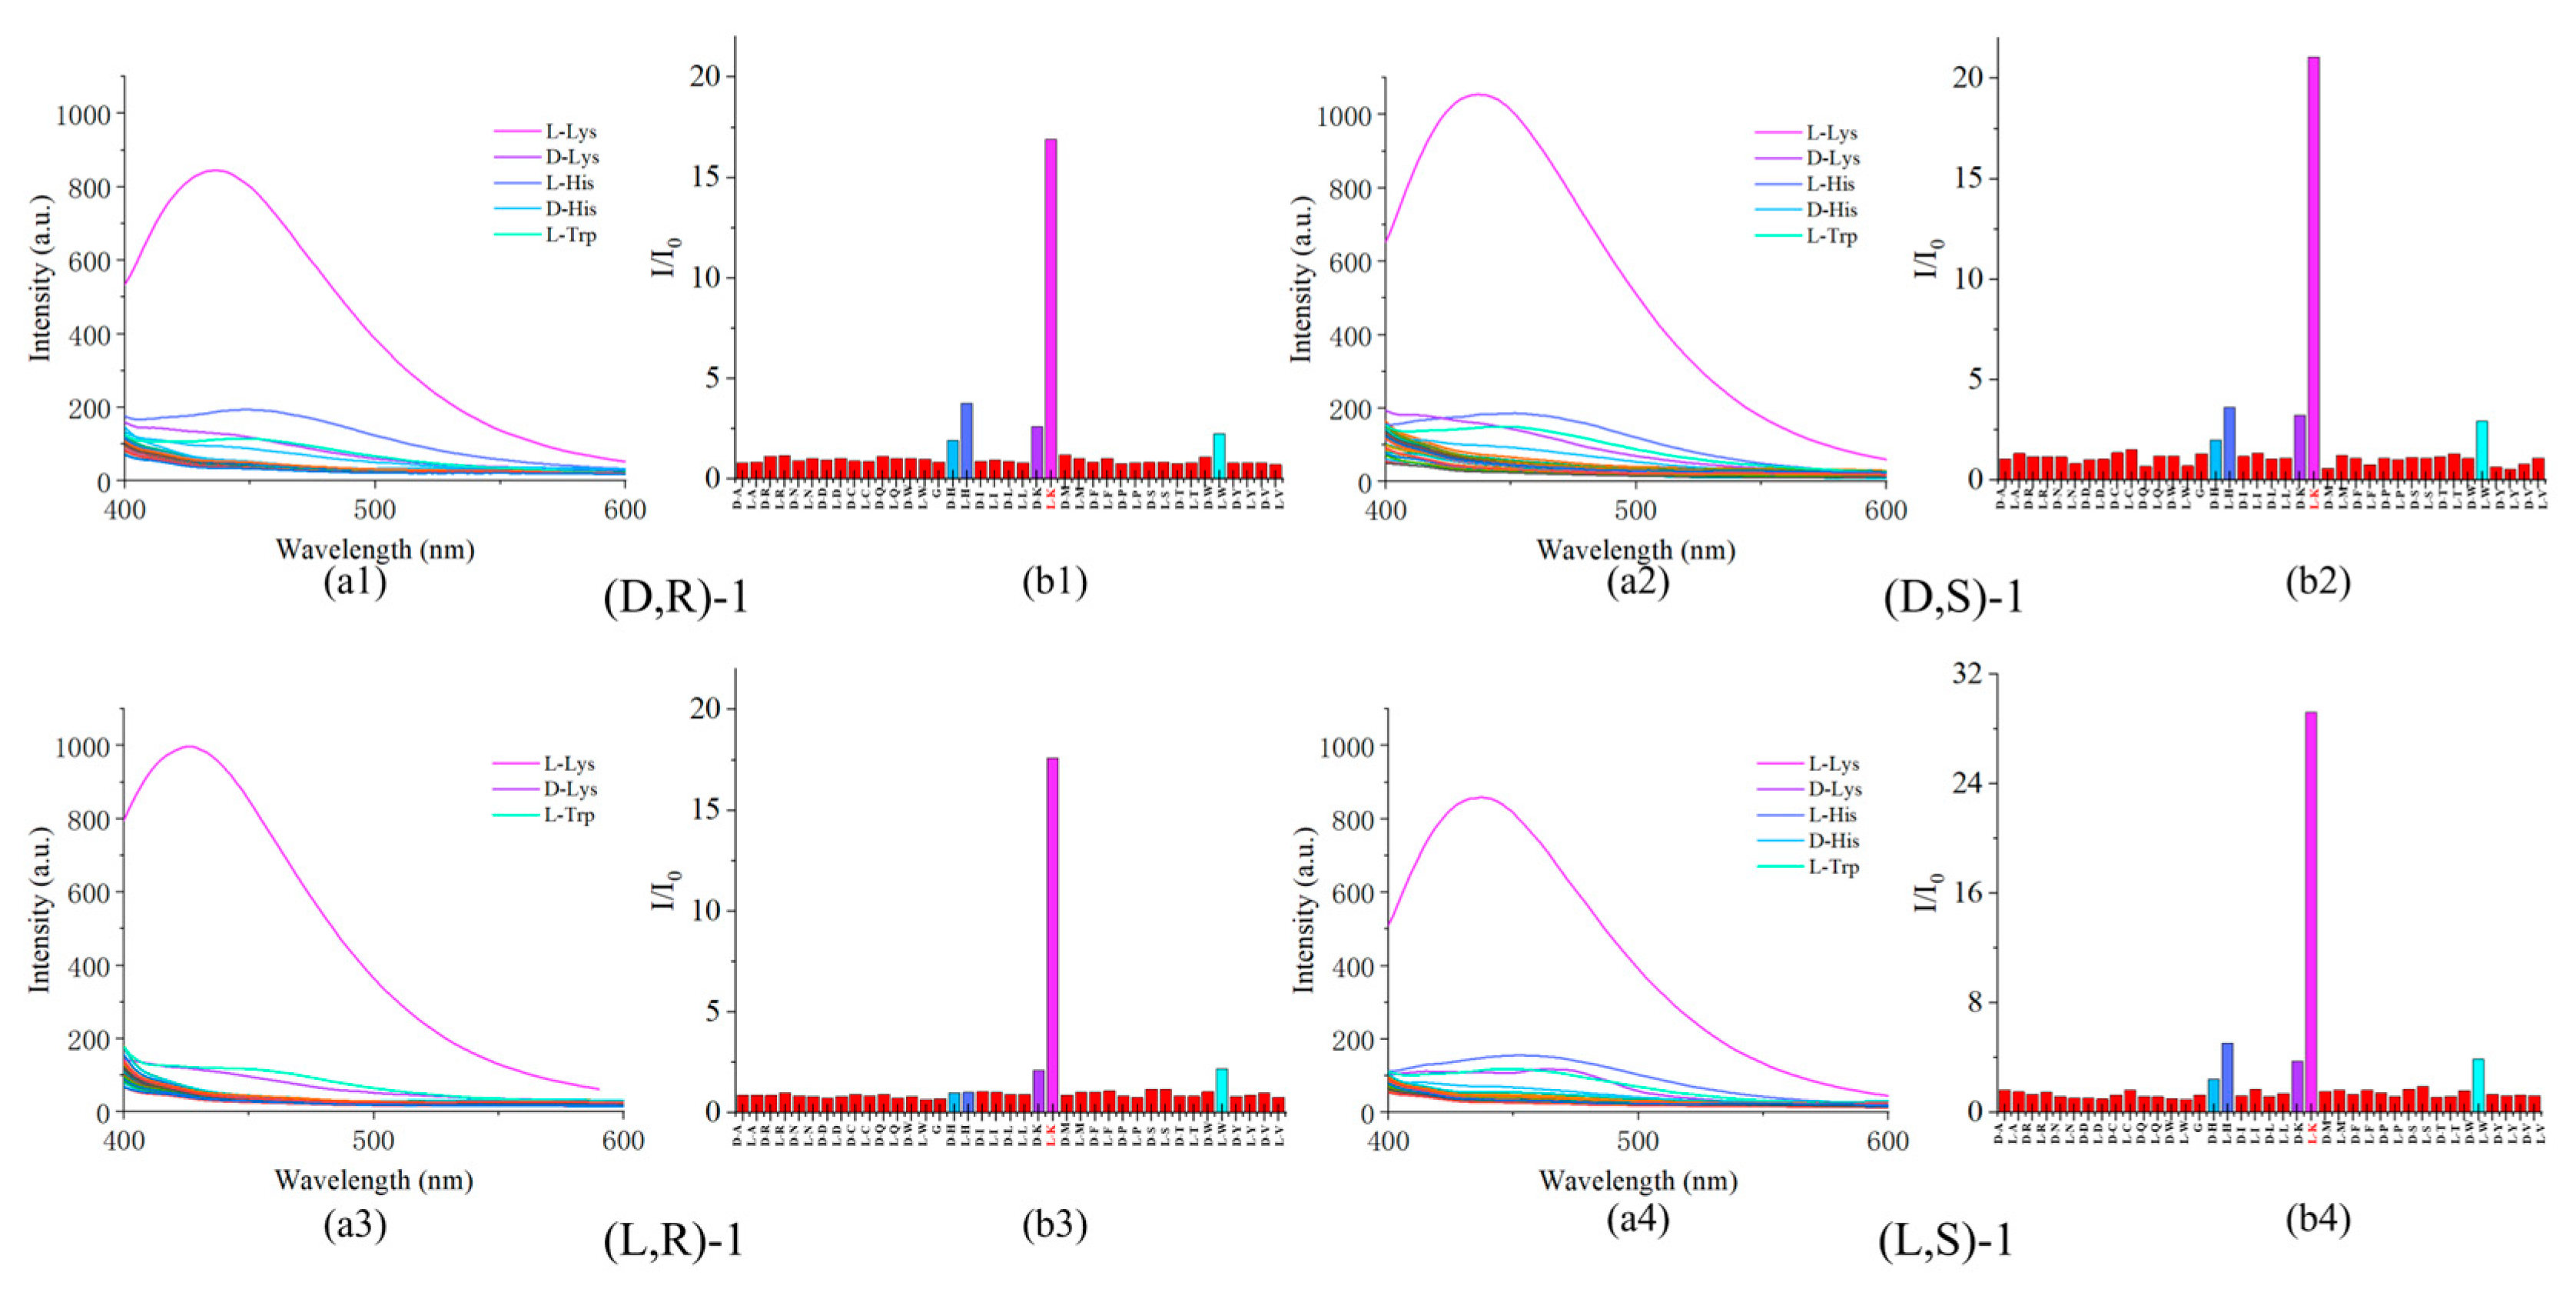
Figure 3.
(a) Fluorescence spectra of probe (0.02mM) with L-Lys (2mM) in the presence of other amino acids (2mM). (b) Plot of the fluorescence enhancement I/Ic at 437 nm. (The sequence of amino acids tested includes: Control Group(C), D/L-Ala(A), D/L-Arg(R), D/L-Asp(N), D/L-Asp(P), D/L-Cys(C), D/L-Glu(Q), D/L-Glu(E), Gly(G), D/L-His(H), D/L-Iso(I), D/L-Leu(L), D-Lys(K), D/L-Met(M), D/L-Phe(F), D/L-Pro(P), D/L-Ser(S), D/L-Thr(T), D/L-Trp(W), D/L-Tyr(Y) ,and D/L-Val(V).).
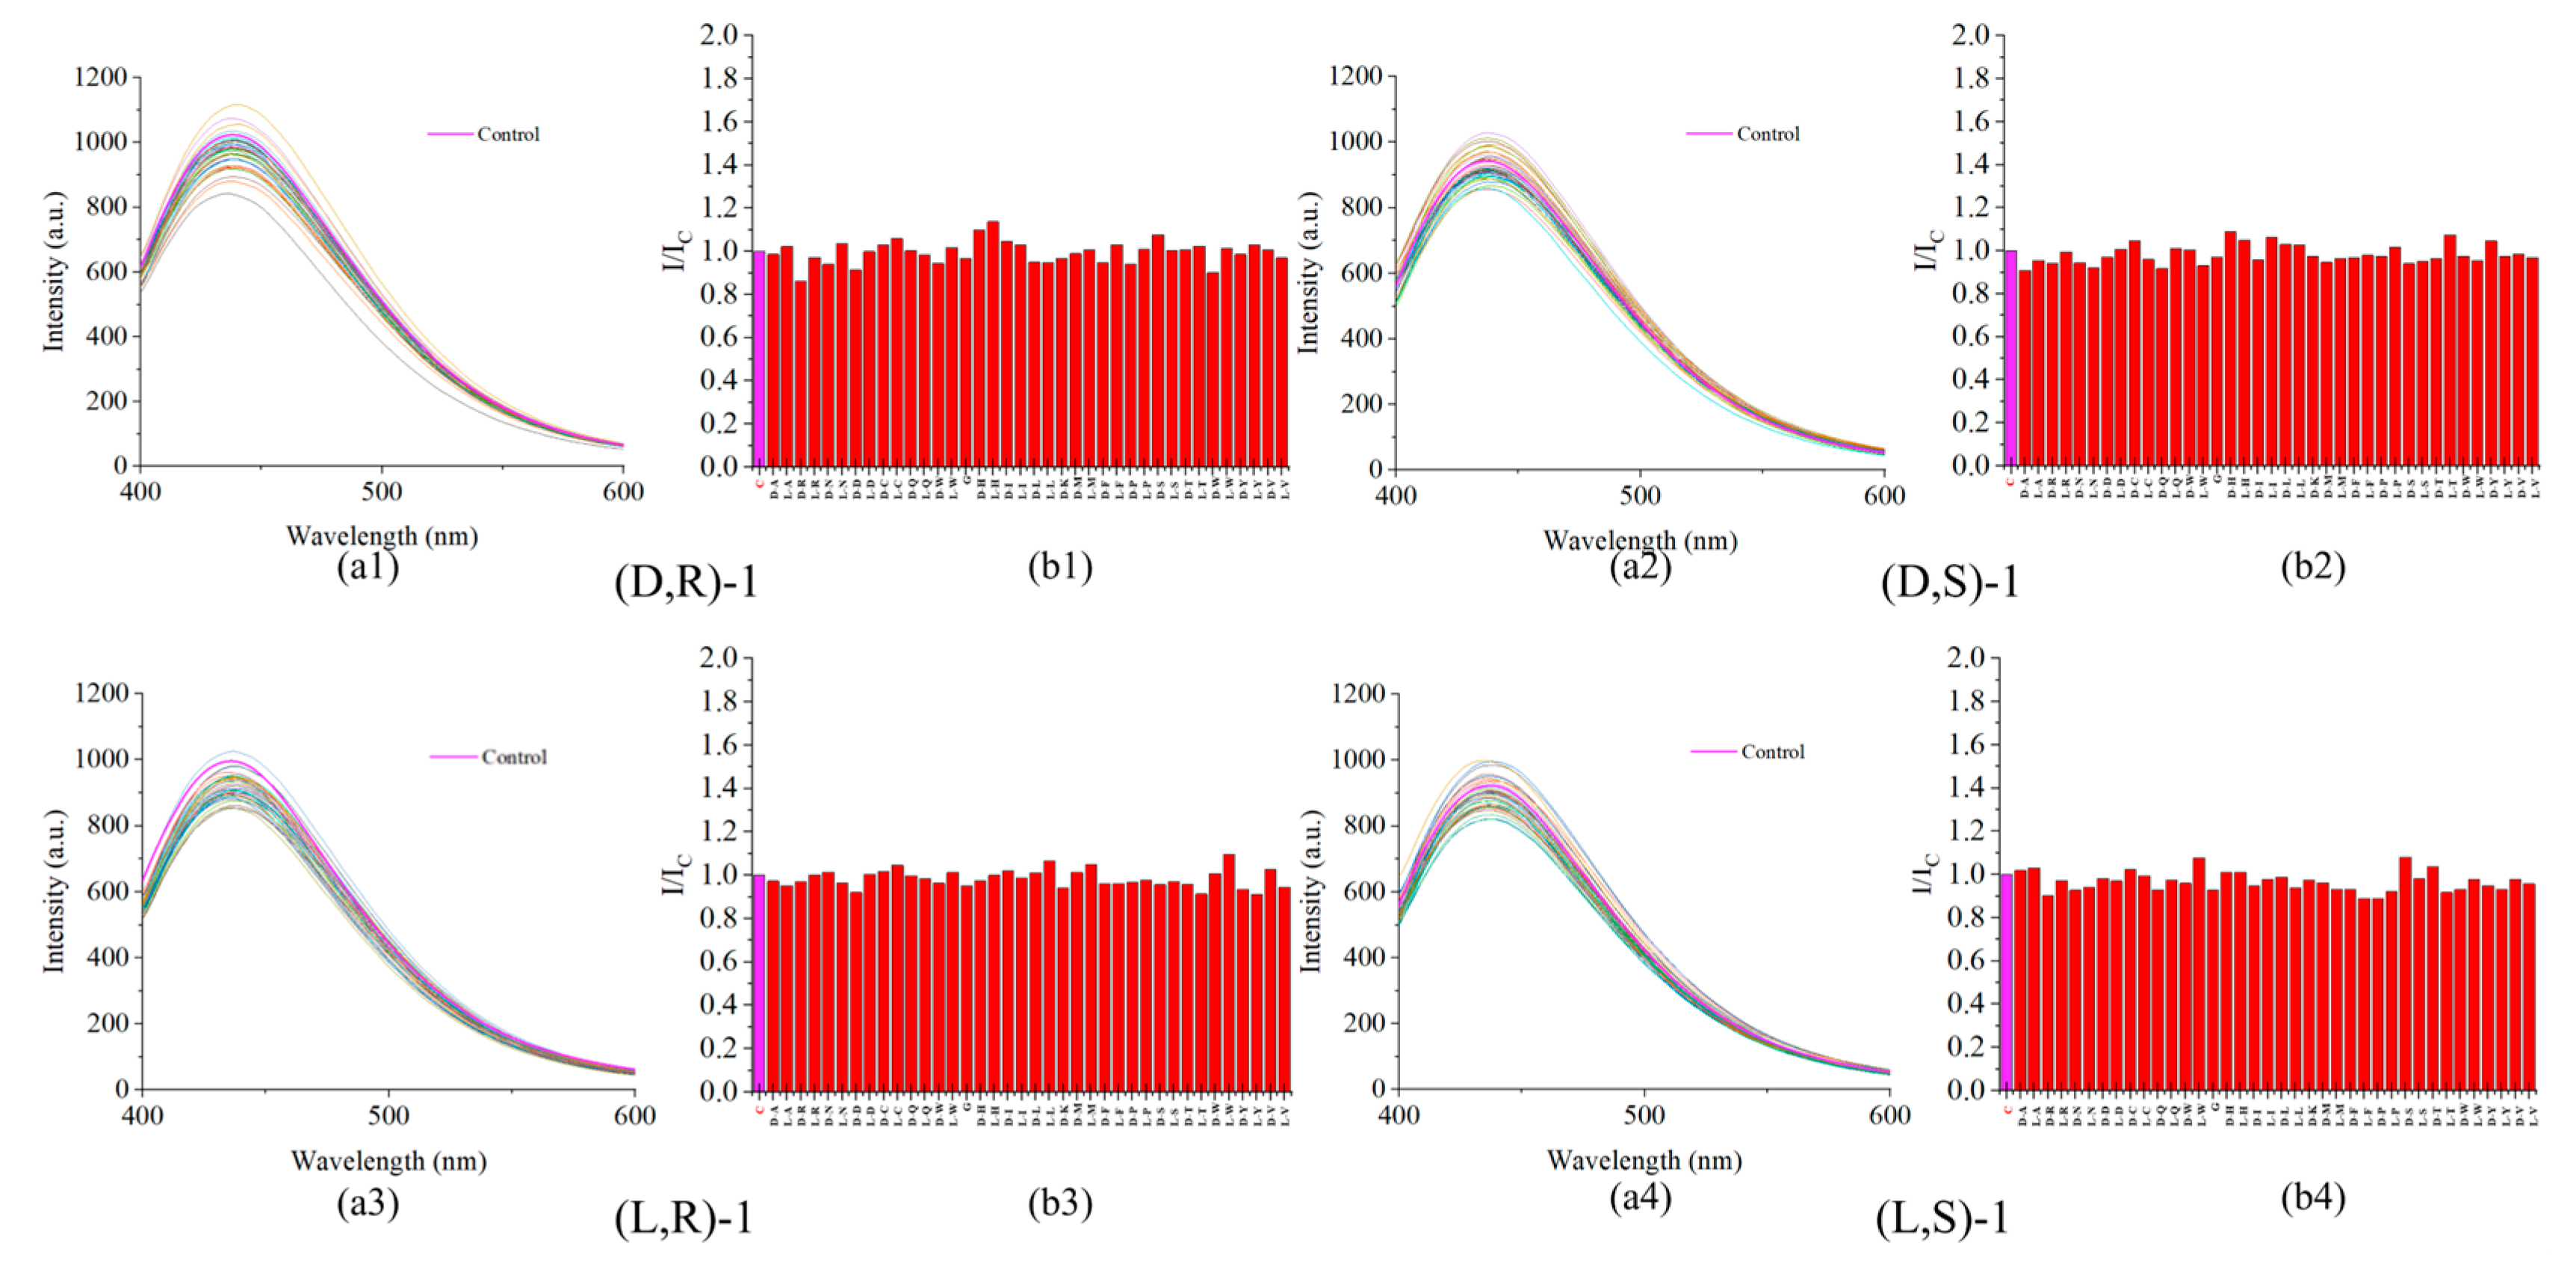
Figure 4.
(a) Fluorescence spectra of probe (0.02mM) with L-Lys (2mM) with a pH range of 3 to 12. (b) Plot of the fluorescence intensity at 437 nm.
Figure 4.
(a) Fluorescence spectra of probe (0.02mM) with L-Lys (2mM) with a pH range of 3 to 12. (b) Plot of the fluorescence intensity at 437 nm.
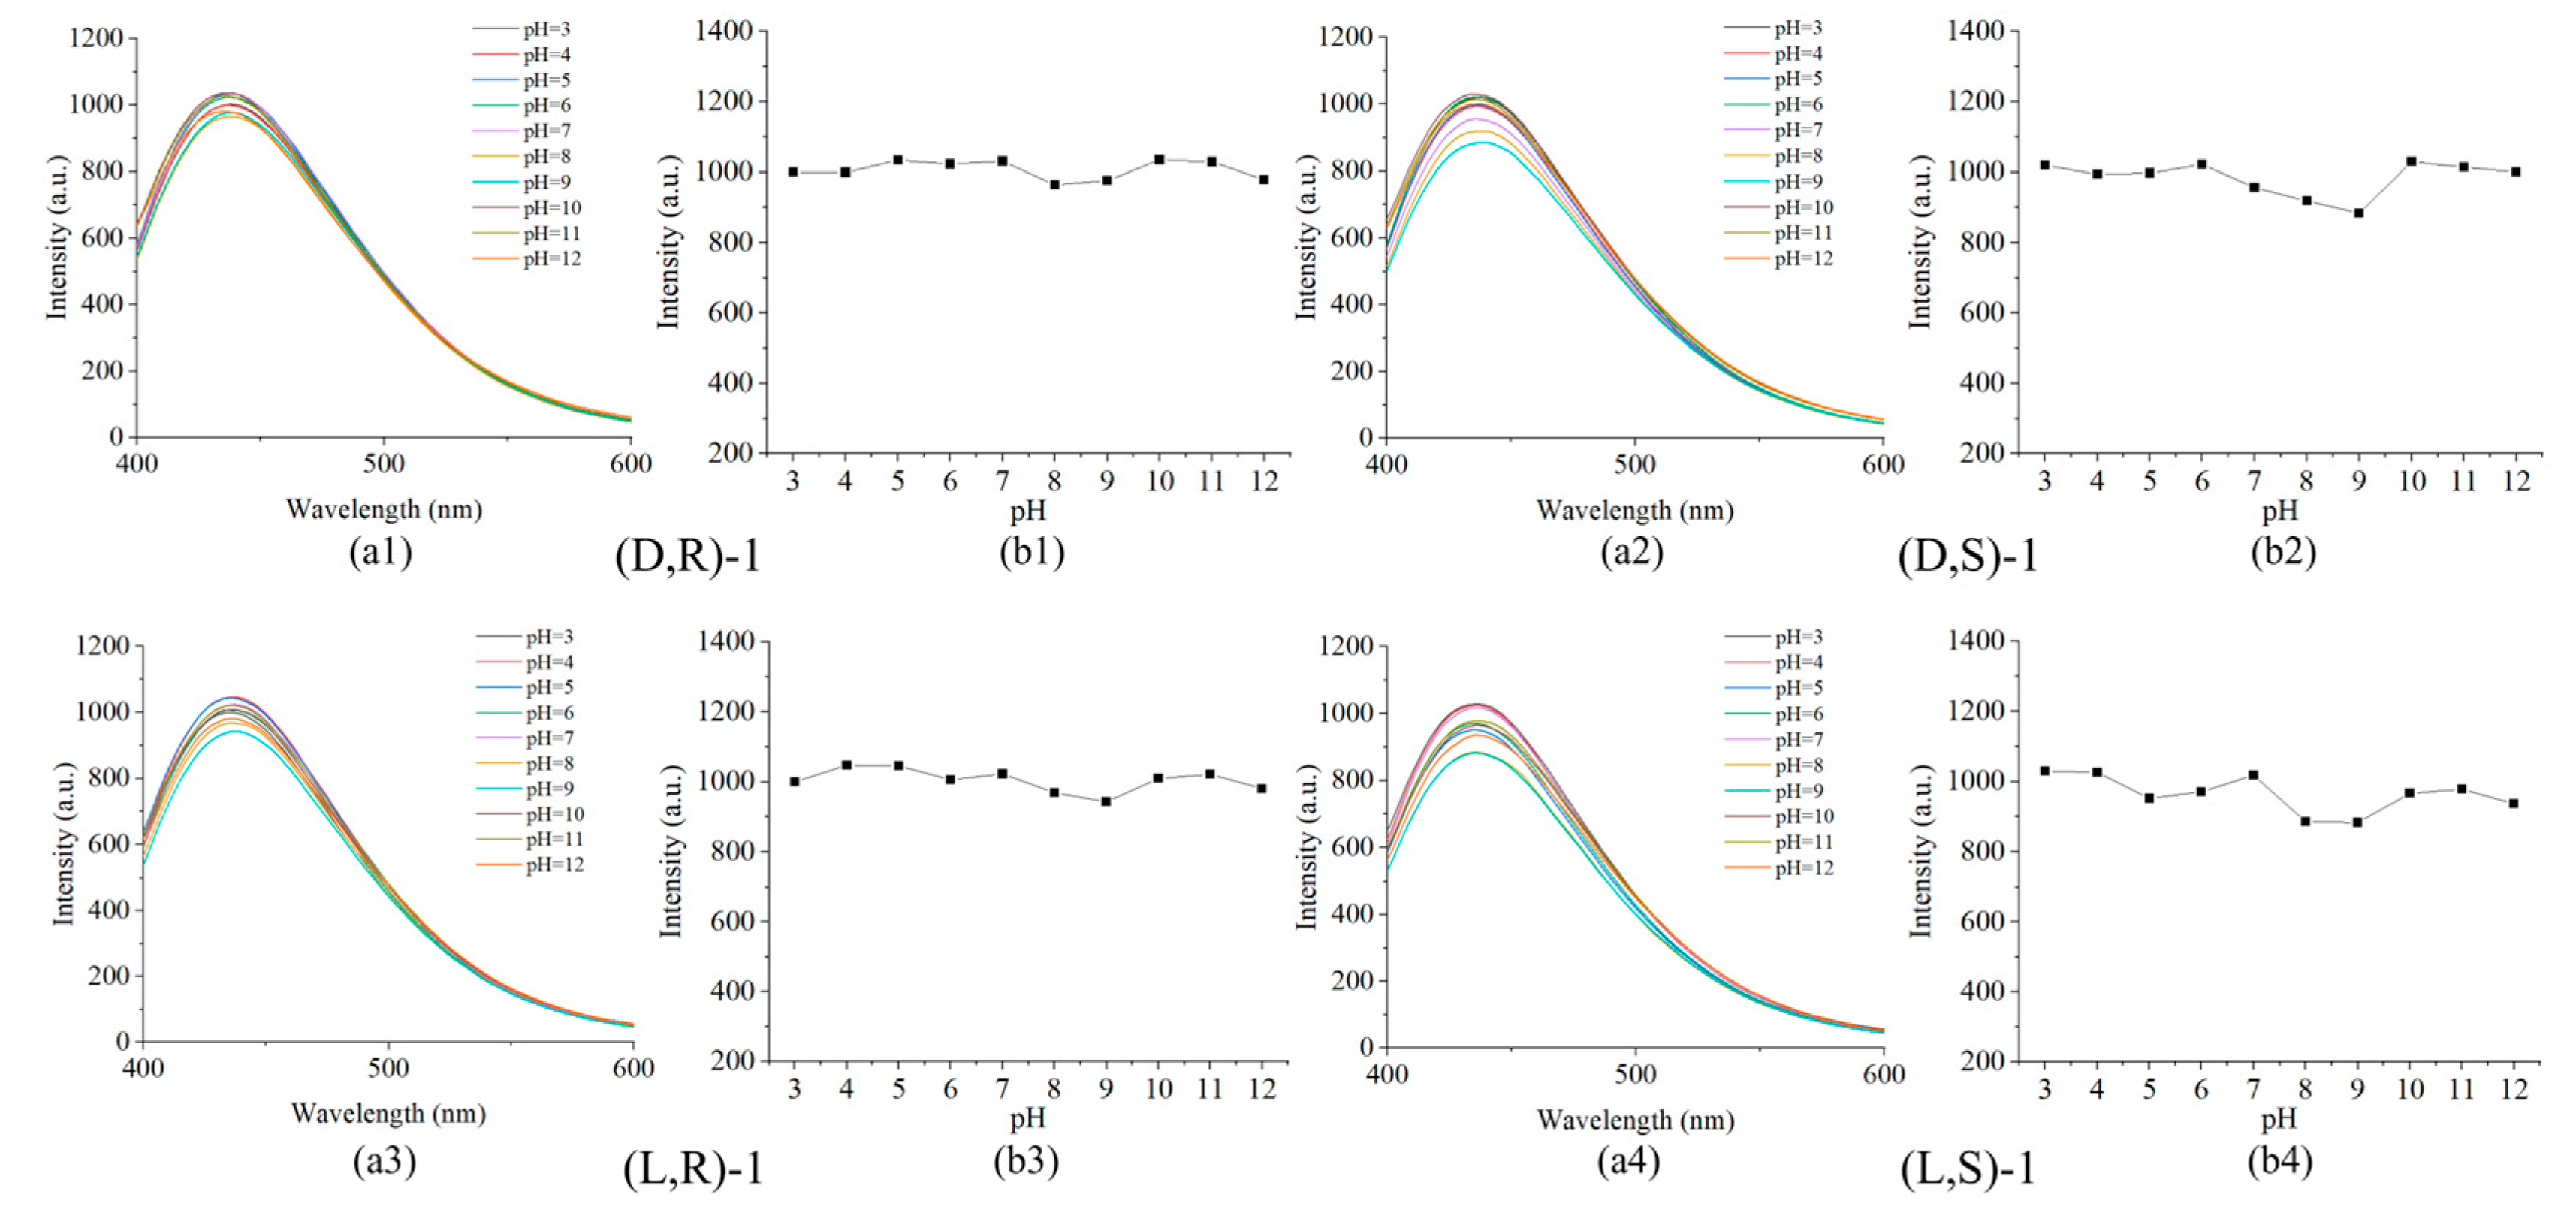
Figure 5.
(a) Fluorescence spectra of probe (0.02mM) with L-Lys (2mM) at 1 min, 5 min, 10 min, 30 min, 1 h, 2 h, 4 h, and 8 h. (b) Plot of the fluorescence intensity at 437 nm.
Figure 5.
(a) Fluorescence spectra of probe (0.02mM) with L-Lys (2mM) at 1 min, 5 min, 10 min, 30 min, 1 h, 2 h, 4 h, and 8 h. (b) Plot of the fluorescence intensity at 437 nm.
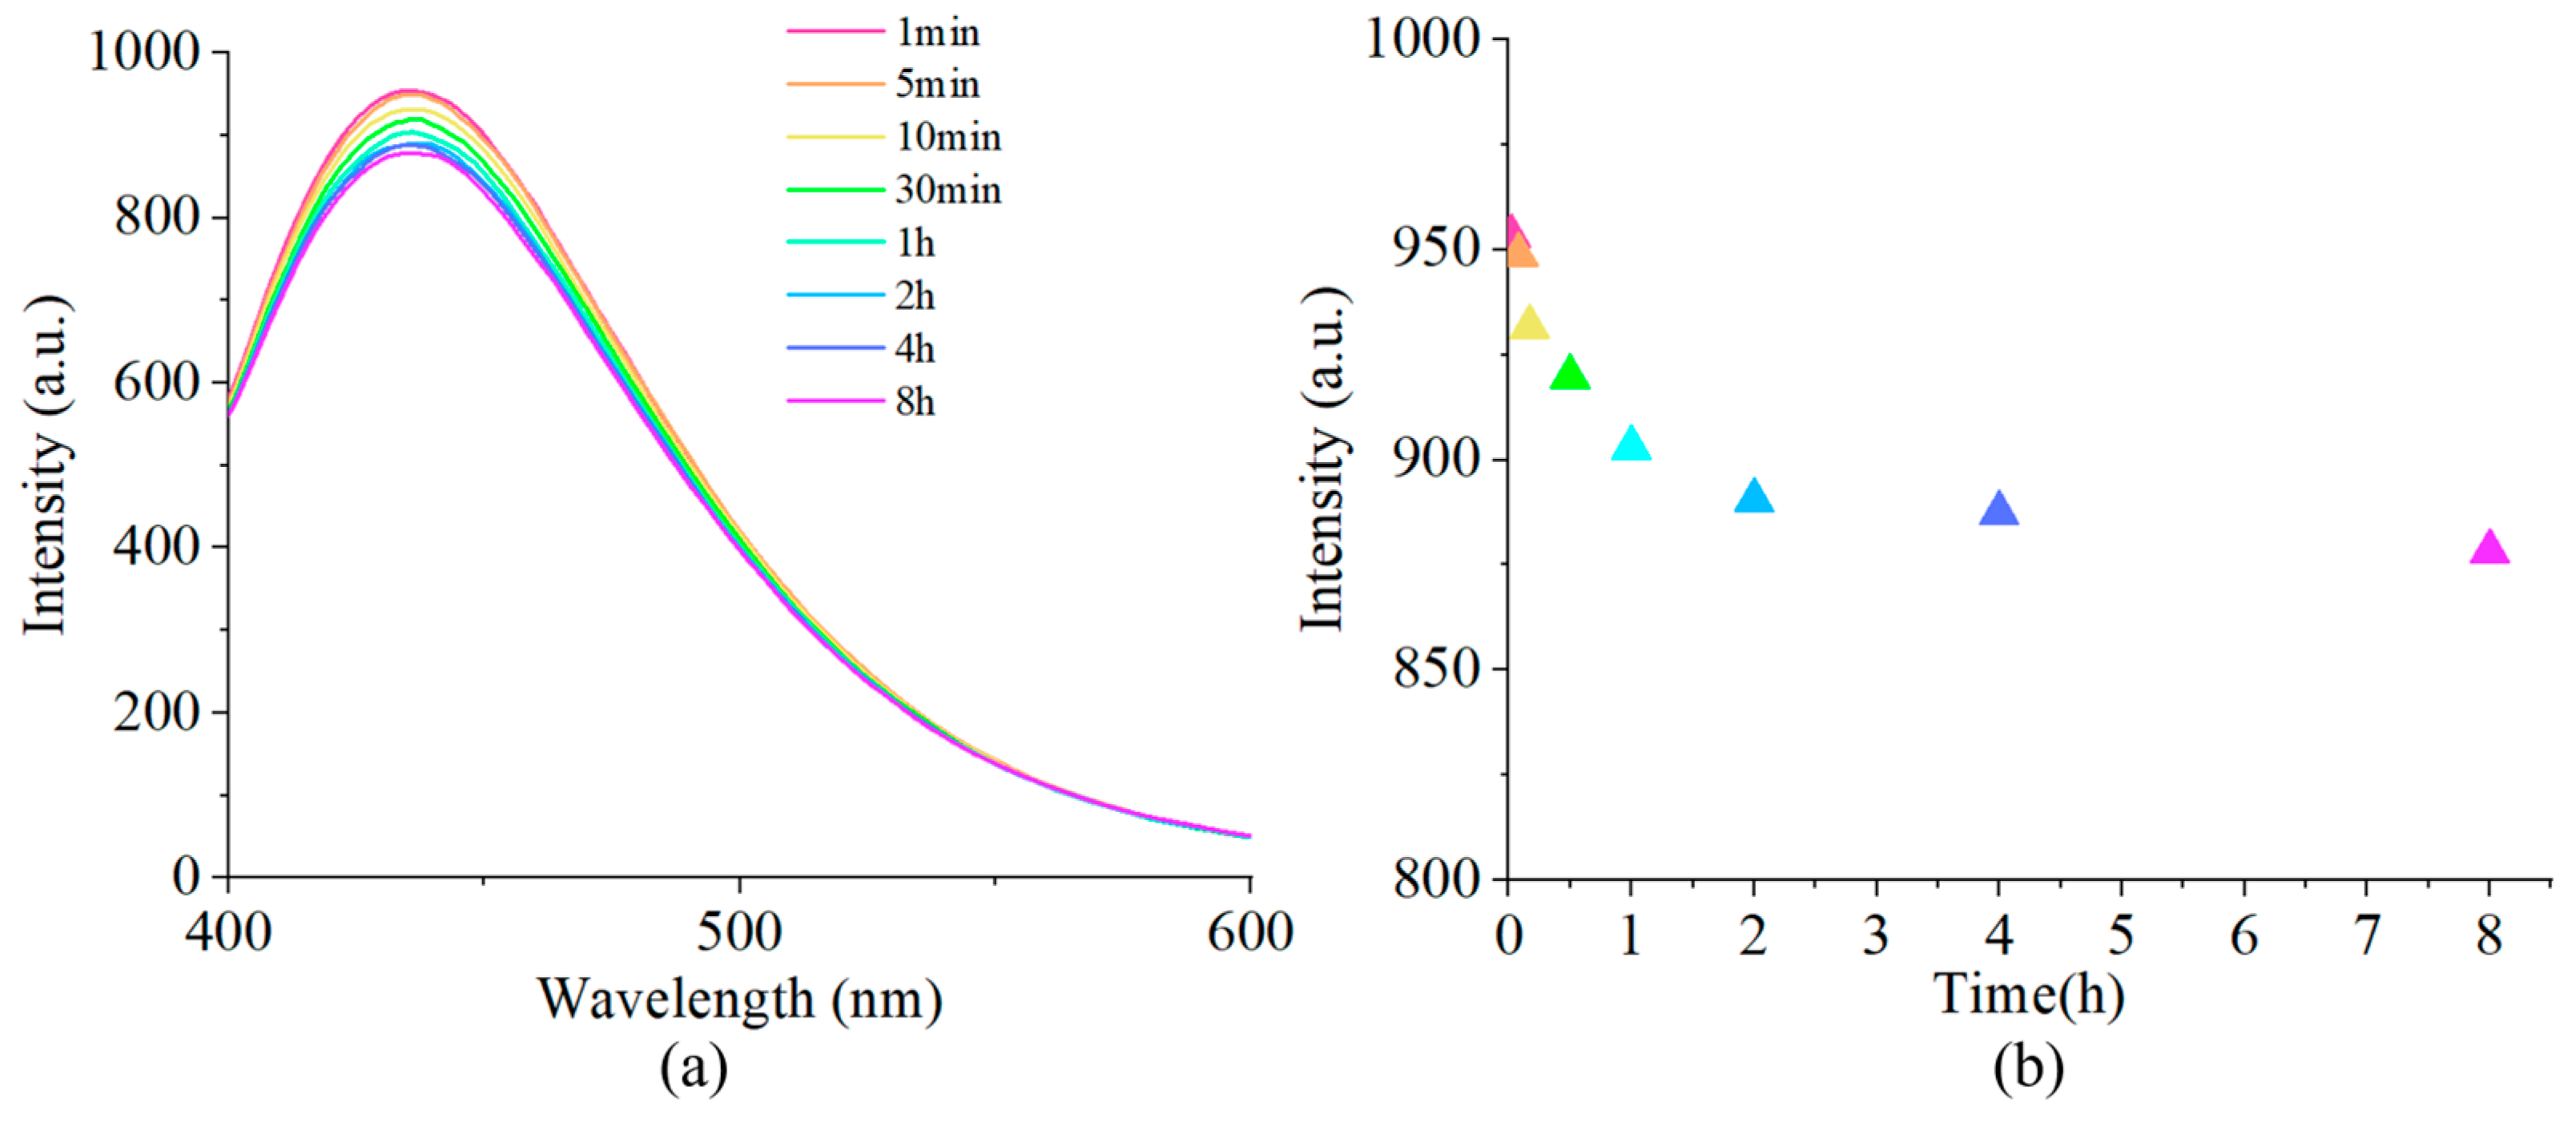
Figure 6.
(a) Fluorescence spectra for the gradient recognition of 1 to 50 equivalents of L-Lys by the probe (0.02 mM) concentration. (b) Plot of the fluorescence intensity at 437 nm.
Figure 6.
(a) Fluorescence spectra for the gradient recognition of 1 to 50 equivalents of L-Lys by the probe (0.02 mM) concentration. (b) Plot of the fluorescence intensity at 437 nm.
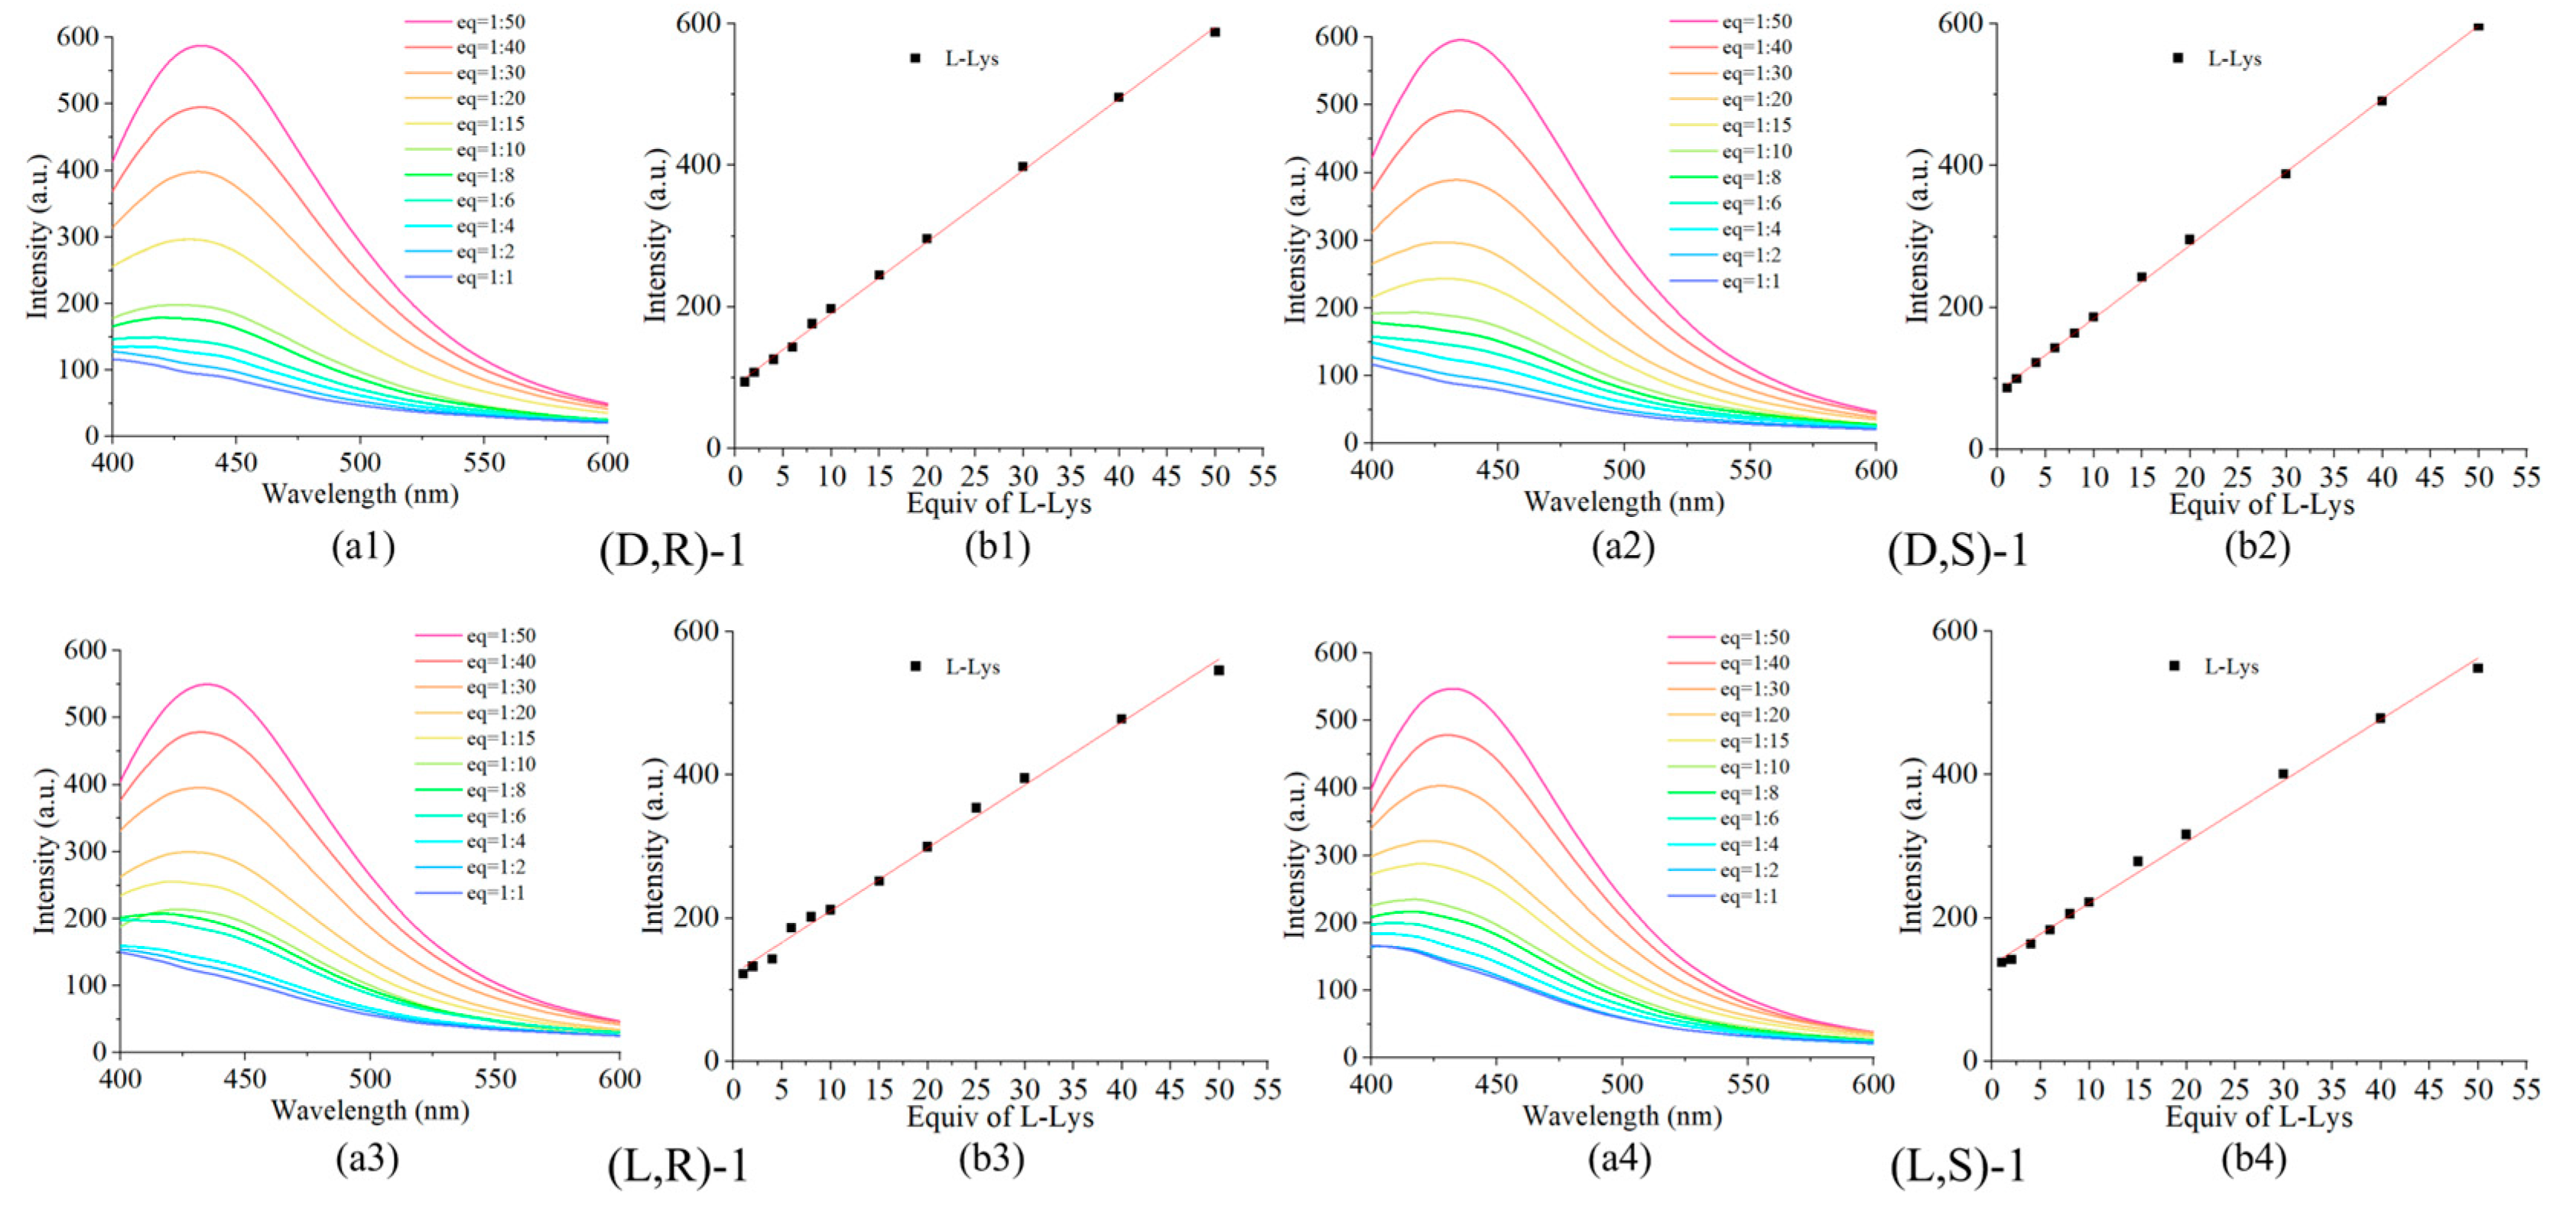
Figure 7.
(a) Fluorescence spectrum upon addition of 2 equivalents of: Co2+, Fe2+, Fe3+, Mn2+, Pd2+, Ru3+, Zn2+, Sn2+, and Ca2+ to the probe. (b) Plot of the fluorescence intensity at 437 nm.
Figure 7.
(a) Fluorescence spectrum upon addition of 2 equivalents of: Co2+, Fe2+, Fe3+, Mn2+, Pd2+, Ru3+, Zn2+, Sn2+, and Ca2+ to the probe. (b) Plot of the fluorescence intensity at 437 nm.
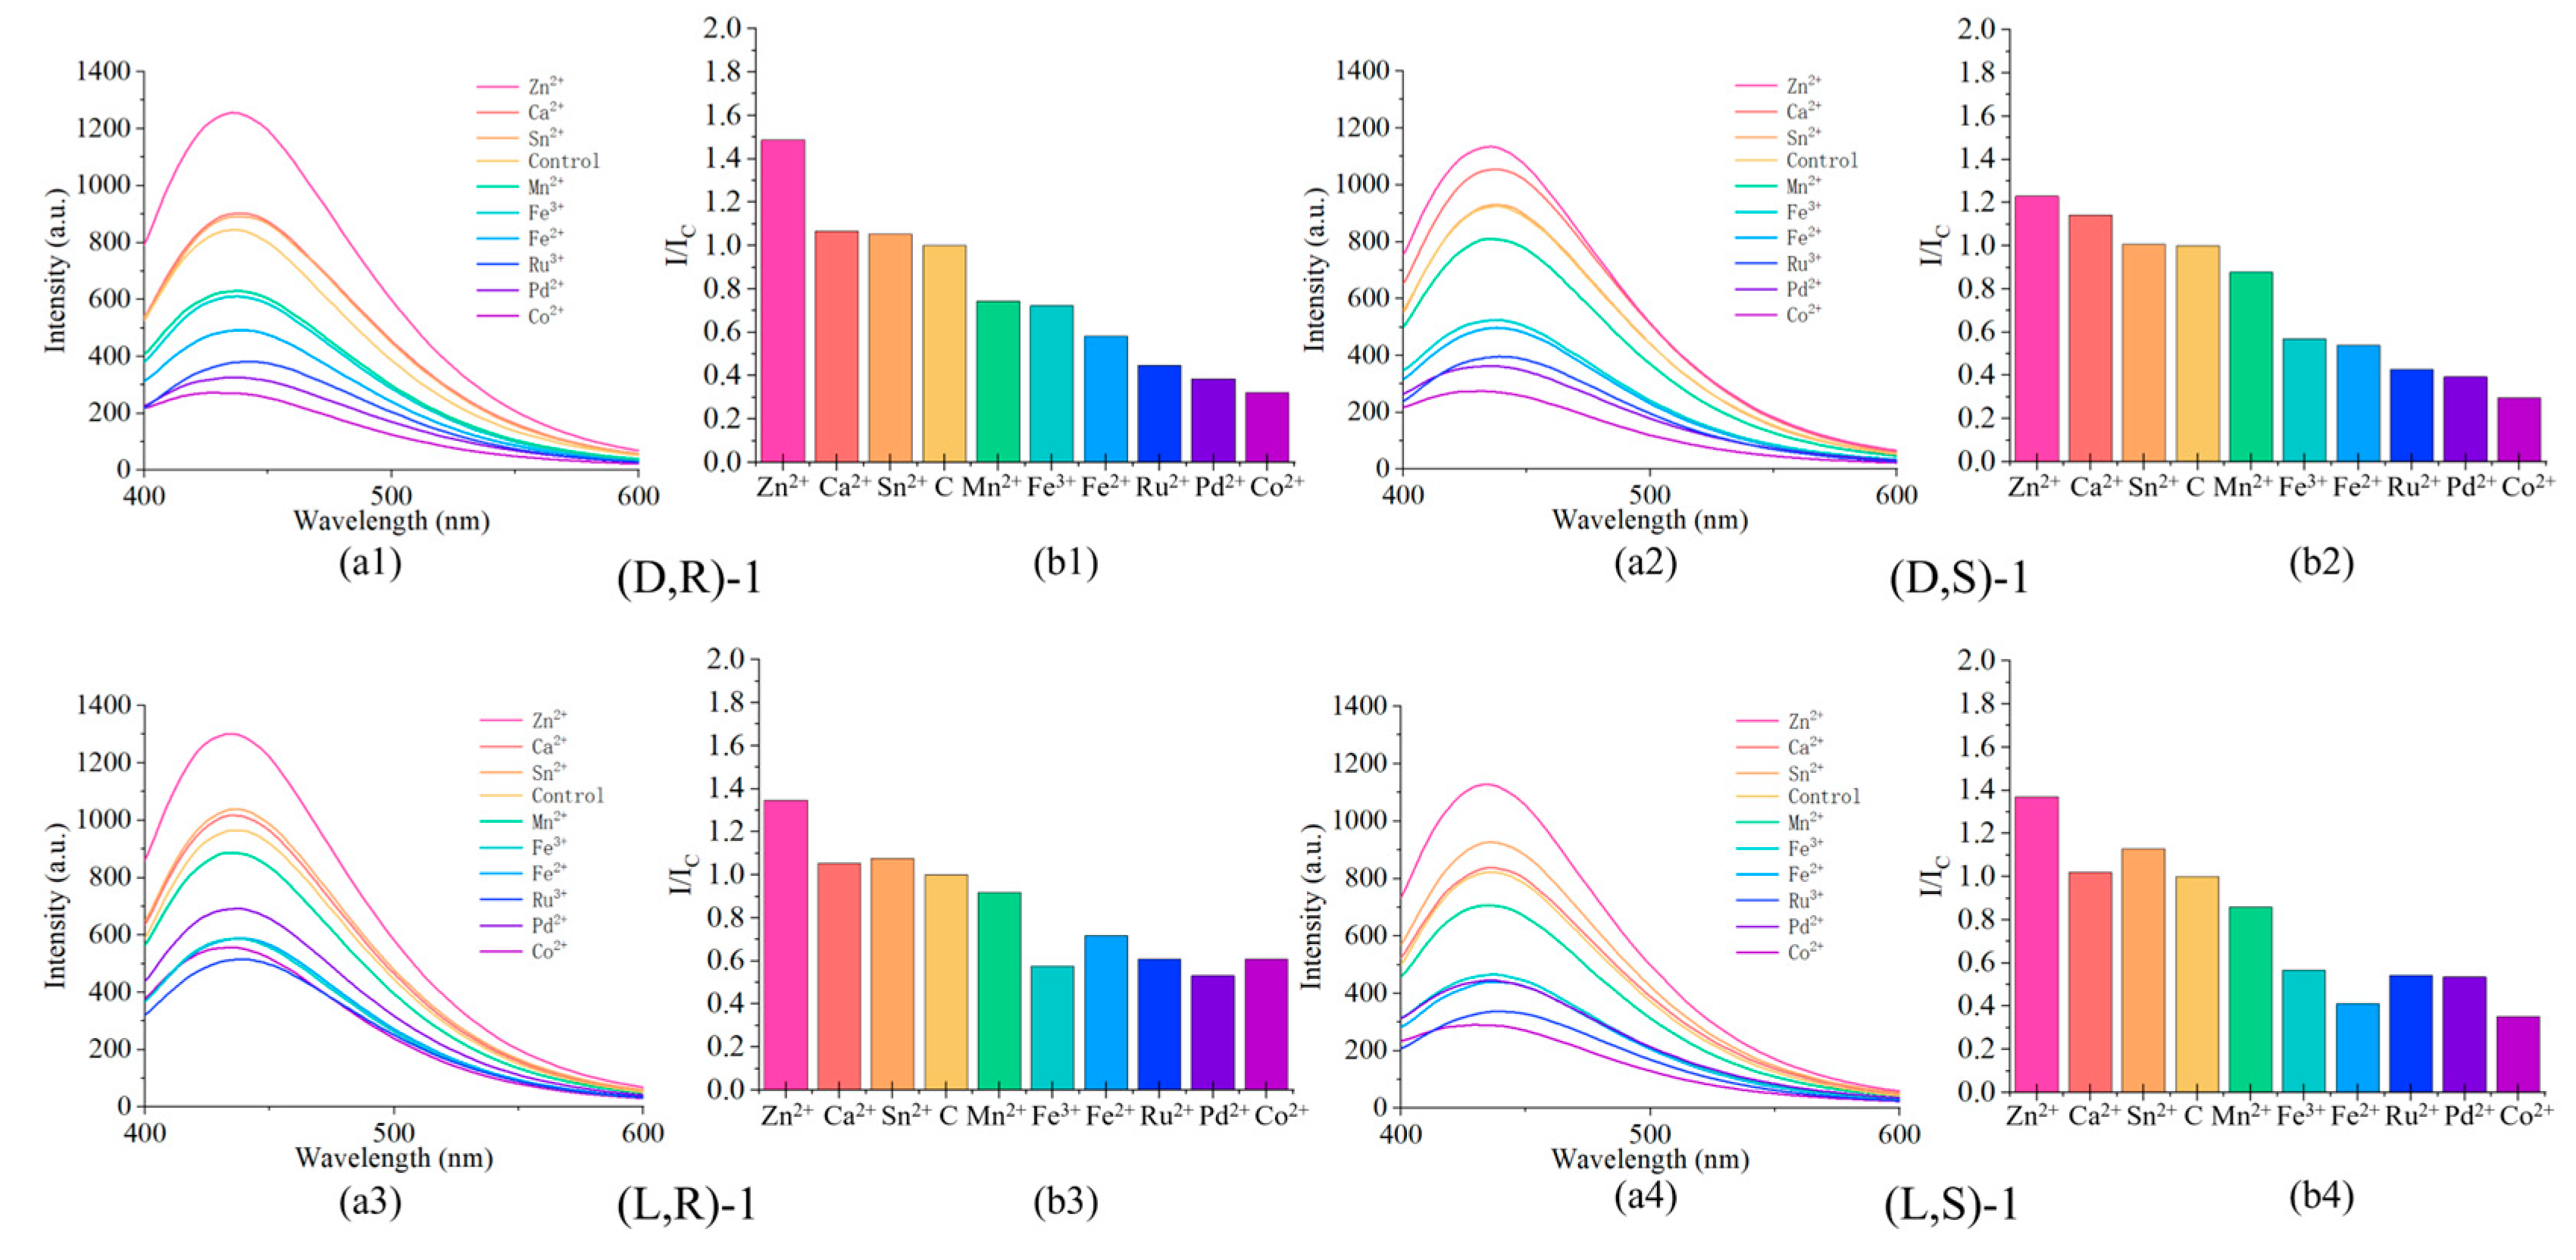
Figure 8.
(a) 19F NMR spectra of (L, R)-1 treated with 0- 20 equivalents of L-Lys. (b) (L, R)-1 showed significant fluorescence enhancement for L-Lys through nucleophilic substitution.
Figure 8.
(a) 19F NMR spectra of (L, R)-1 treated with 0- 20 equivalents of L-Lys. (b) (L, R)-1 showed significant fluorescence enhancement for L-Lys through nucleophilic substitution.
Disclaimer/Publisher’s Note: The statements, opinions and data contained in all publications are solely those of the individual author(s) and contributor(s) and not of MDPI and/or the editor(s). MDPI and/or the editor(s) disclaim responsibility for any injury to people or property resulting from any ideas, methods, instructions or products referred to in the content. |
© 2024 by the authors. Licensee MDPI, Basel, Switzerland. This article is an open access article distributed under the terms and conditions of the Creative Commons Attribution (CC BY) license (http://creativecommons.org/licenses/by/4.0/).
Copyright: This open access article is published under a Creative Commons CC BY 4.0 license, which permit the free download, distribution, and reuse, provided that the author and preprint are cited in any reuse.


